Extraction, isolation and structural determination of organic ...
217
'-"{l EXTRACTION, ISOLATION AND STRU DETERMINATION OF ORGANIC COMPOUNDS FROM S C AEV O LA SPINES CENS R. Br. A thesis submitted towards a Doctor of Philosophy SALLY FELSTEAD NOBBS BSc, BEd, DipT ADElAIDE UNIVERSITY AUSTRALIA Department of Chemistry Adelaide University, ADELAIDE, SOUTH AUSTRALIA by -q.C)l July,2001.
-
Upload
khangminh22 -
Category
Documents
-
view
0 -
download
0
Transcript of Extraction, isolation and structural determination of organic ...
'-"{l
EXTRACTION, ISOLATION AND STRU
DETERMINATION OF ORGANIC
COMPOUNDS FROM
S C AEV O LA SPINES CENS R. Br.
A thesis submitted towards a
Doctor of Philosophy
SALLY FELSTEAD NOBBS
BSc, BEd, DipT
ADElAIDEUNIVERSITYAUSTRALIA
Department of Chemistry
Adelaide University,
ADELAIDE, SOUTH AUSTRALIA
by
-q.C)l
July,2001.

CONTENTSoNPage
ABSTRACT
STATEMENTACKNOWLEÞGMENTS
CHAPTER 1
1.1
1,2
vixX
1
1.3
CHAPTER2 GENERATPROCEDURES
2.1, Collection2.2 General treatment of collected samples
2,3 Structure determination2.3.1 UV and visible spectra
2.3.2 Nuclear Magn-etie Resona-nee
2.3.3 Mass sPectra
2.3.4 II{, optical rotation and MP
CHAPTER 3
3.1
INTRODUCTIONGeneral historical use of natural products as medicines
Family Goodeniaceae, Scaeaola genera, Scaeuola spinescens
1.2.1 Botanical
L.2.2 IJse as natural medicines
1.2.3 Pharmaceutical testing
Classes of compound.s isolated from Scaeaola genera
1.3.1- Iridoicis- structures and biological aetivity
1.3.2 Alkaloids - structures and biological activify
1.3.3 Coumarins - struetures and biological activity
1.3.4 Fatty acids and hydrocarbons - structures and
biological activity1.3.5 Flavonoids - structures and biological activity
1.3.6 Triterpenes - structure and biologieal activity
CRUDEEXTRACT
Extraction, separation and purification of compounds
from 12.7 kg of Scaeoola spinescens
Analysis and write up of purified compound.s
38
47
3.2
CHAPTER 4 FRACTION 1.
4.1 Initial treabment
4.2 Compound A : Hexadecanoic acid, methyl esber
4.3 Compound B : Taraxerol acetate
52
CHAPTER 5 FRACTION 3
5.1 Initial treatment5.2 Compound E : Ursolic acid
CHAPTER6 FRACTION 4
6.1 Initial treahnenb
6.2 ComBound F : En:marin6.3 Compound G : Vanillic acid
CHAPTER 7 FRACTION 5
7.1 Initial treatment
7.2 Compound H: Daucesterol
CHAPTER 8 FRACTION 7
S.L Initial treatmen-t
8.2 Compoundl:Alidyiosioside8.3 CompoundJ : Scaevoloside
8.4 Compound K: Katecateroside
8.5 CompoundL:Loganin
4.4
4.5
CHAPTER99.1
9.2
9.3
9.4
CHAPTER 1-1-
11.1
1,1.2
Compound C: Taraxerol
Compound D : |udarrylol
Anti-bacterial testing
Antltumour testing1L.2.L Cytotoxicity tests - procedure A
70
74
90
93
L27
135
1,43
FRACTTON 8
Initial treatment
Compound M ; Luteolin-O-7-glucuronide methyl ester
Comp ound N : 2- C- (Hydro>cyme thyl) -D-rib onic acid-y-l actone
Compoun d O : L-th r e o -Guatacyl glycerol
CHAPTER 10 FRACTION 9
10.1 In-itialtreatment70.2 Compound P : Luteolin-O-7-glucoside
10.3 Compound Q : 2-Deoxy-D-chlro-inositol
BIOLOGTEAL TESTING OF EXTRACTS FROM
SCAEVOLA SPINESCENS
1l
L1.2.2 Cytotoxiciby tests - procedure B
11.2.3 Cytotoxieity tests = procedure C
I.L-ZA Cytotoxicity tests - proced.ure D
11,3 Anti.viral testing
CHAPTER 12 SUMMARY
CHAPTERÍ} EXPERIMENTAL
13.1. Generalprocedures
13,2 Plant colleetion, verifieation and extraction
13.3 Compounds from Scøeoolø spinescens
13.3.1 Initial treatment, Fraction 1
13.3.2 Hexadecanoic acid, methyl ester
13.3.3 Taraxerol acetate
13.3.4 Taraxerol
13.3.5 Judarrylol13.3.6 Initial treatment, Fraction 3
13.3.7 Ursolic acid
13.3.8 Initial treatment, fraction 413.3.9 Emmarin13.3.1û Vanillic acid
13.3.11 Initial treatment, Fraction 5
13.3,12 Daucesterol
13.3.13 Initial treatmenÇ Fraction 7
1,3.3.1"4 AlidYjosioside
13.3.15 Scaevoloside
13.3.16 Katecateroside
13.3.17 Loganin13.3.18 Initial treatment, Fraction I13.3.L9 Luteolin-7-O-glucuronide methyl ester
13.3,20 2-C-(hydroxymethy-1)-D-ribonrs acid=Y--laetofte
73.3.27 L-threo-Guaiacyl glycerol
L3322 Initial treatment, Fraction 9
13.3.23 Luteolin-7-O-glucoside
13.3.24 2-Deoxy-Þchiro-inositol
13.4 Biologicaltesting13,4.1 Anti bacterial testing
L3.?.2 Cytotoxic testing
153
766
llt

L3.4.3 Anti viral testing
REFERENCEg
APPENDIEES
AppendixA Botanicaldescriptiot'tofScaeaolø spinescens.
Appendix B Phytochemical screening of Scaeuola genera.
L95
203
¡V
ABSTRACT
The aim- of thus project was to extract, isolate and determine the structure of
organic compounds from Scøeaolø spinescens, which is found widely in the arid
to semi-arid regions of South Australia and through into most other states of
Australia.
Scaeuola spinescens is an Australian native plant that the Aboriginal people of
Hawker in South Australia have traditionally used as a natural medicine to treat
a variety of symptoms. There is much anecdotal evidence that indicates that
Scaeaola spinescens is a useful plant in traditional medicine.
Seventeen organic compounds were isolated and their structures elucidated by
spectroscopic methods. Four further compounds were isolated but have not been
completely identified.
The compounds isolated include triterpenes, iridoids, coumatins, flavonoids and
other compounds.
Four novel compounds were isolated. They were:
. judarrylol, a triterpeneo emmatin, a coumarin. alilydijosioside, an iridoid, which may be an artefact of the extraction Process. katecateroside, an iridoid
Of tþe seventeen organie compound-s isolated, four were novel, fifteen were n-evr
to ScaeaoLa spinescens and thirteen had not been reporbed from any plant from
any species of. Scaeuola,
A table of the compounds (Table 4.1) isolated and their strustures are illustrated
below
Alt crude extracts were first tested with Meyers reagent (a test for alkaloids) with
no positive results recorded.
The structures were dedueed fronr MS data as rvell as routine and 2D NMR
experiments, apart from (95) which was derived solely from GC/MS data.
V
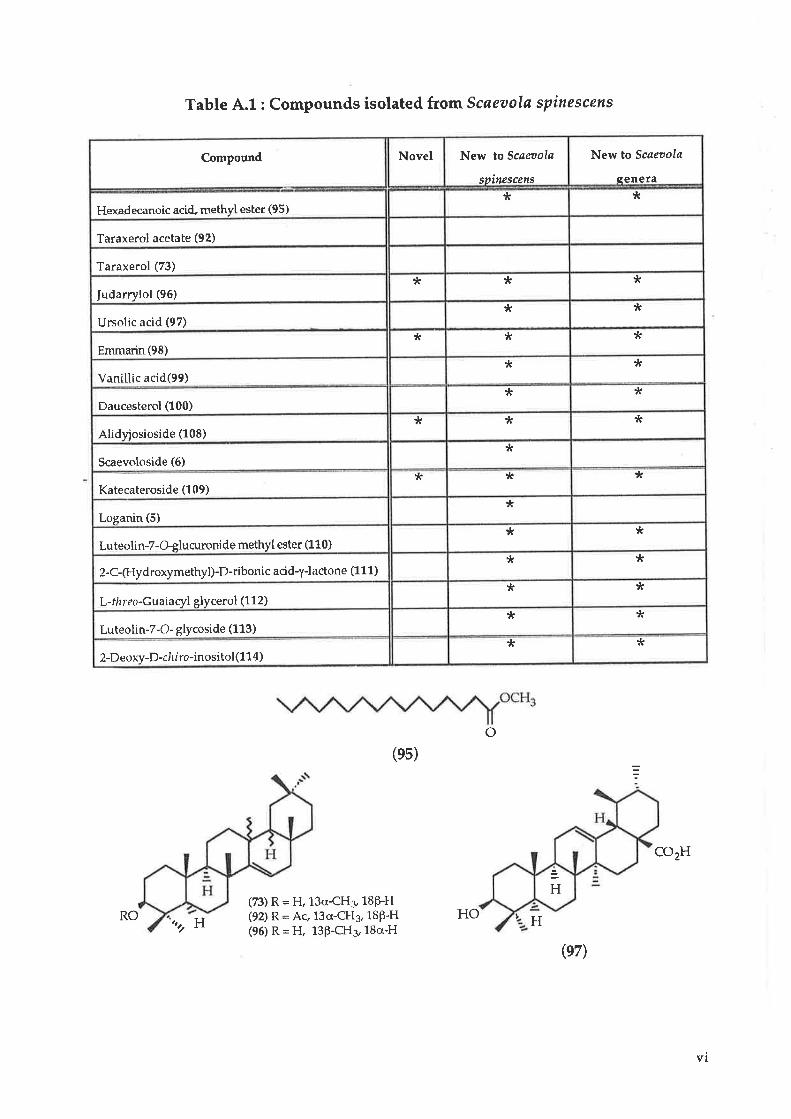
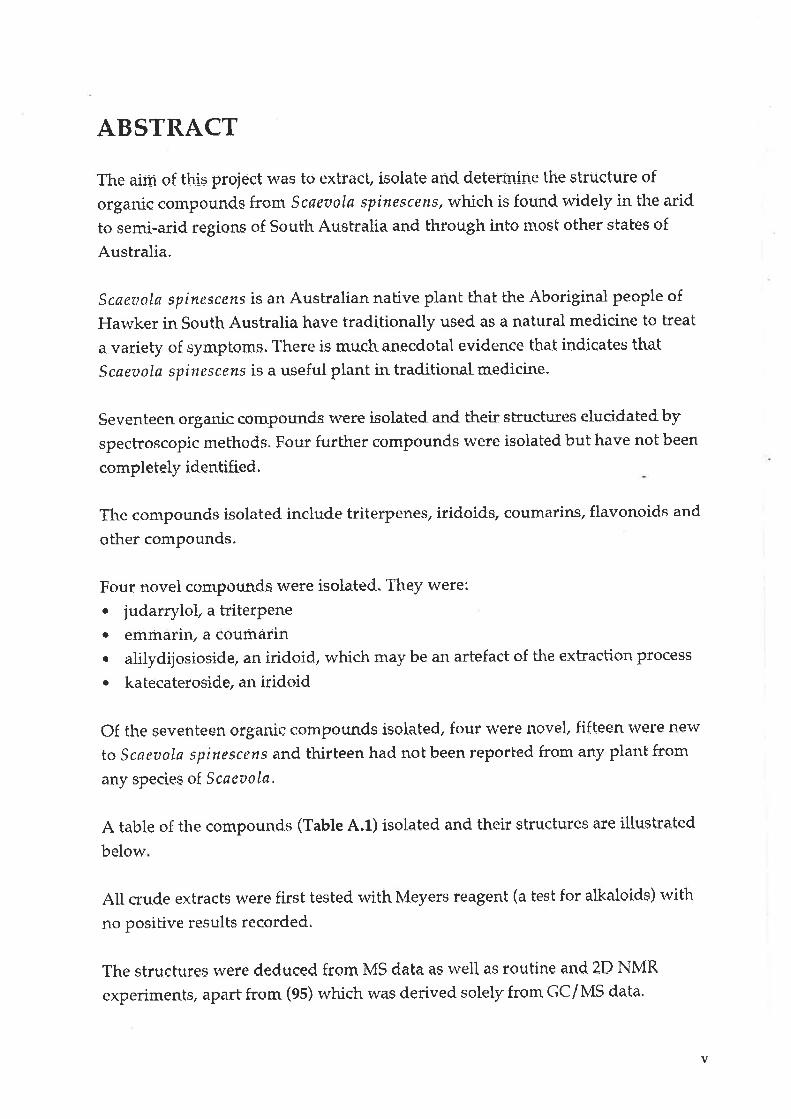
Table A.1 : Compounds isolated from Scaeaala spinescens
Compound Novel New to Scøøola
spitt¿scens
New to Scøeoola
senera
Hexadecanoic acid" methyl ester (95)* t(
Taraxerol acetate (92)
Taraxerol (73)
Iudarrylol (96)* * *
Ursolic acid (97)* *
Emmarin(98)tr * *
Vanillic acid(99)* *
Daucesterol (100)Jr *
Alidyiosioside (108)* * *
Scaevoloside (6)*
Katecateroside (109)* * *
Loganin (5)tr
Luteolin-7-Gglucuronide methyl ester (110)* *
2-C-(Hydroxymethyl)-D-riboni c acidl-lactone (1 1 1)* *
L-thr eo-Guaiacyl glycerol (1 1 2)* *
Luteolin-7-O- glycoside (113)tr *
2-Deoxy-D-ch I ro-inosi tol(114)* ?t
o(es)
ozH
(73) R = H, 13c{H3 18þH(92) R = Ac, 13cr-CH3, 18P-H(96) R = H, 138-CH3, 184-H
H
H
RO n"H HO
(e7)
VI
o
Ilq.
o(ee)
o OH
ocH3
OH
(e8)
HO
H3CO
o IT.r1:ì
H Rt- .Rr'.cH-(CHi'1
o
o
(6) Rr,Rz =Q,n=1(10E) R1=ft2 =OCH3(1(D) R1,R2 =O,n=2
tlH
cHgr{ol r
,.trtl O
(s)
OH
(110) R = COoCHs(113) R = CH2OH
a-
OH
H
OH(10o)
,l
OH
r\OHH3CO
OHo
9HOH
OH
(111)OH oHo o
vll

OH
OH(114)
A range of biological tests were canied out on both crude extracts, semi . purified
fractions and certain isolated and purified compounds, as outlined in Chapter 11.
Crude Fractions 4, 8 and 9 showed moderate anti bacterial activity.
One novel coumarin - emmarin (9S) - and vanillic acid (99) were isolated from
Fraetion -4.
The four iridoids - loganin (5), scaevoloside (6) alidyjosioside (10S) and
katecateroside (fOq) - were isolated from Fraction 8.
Luteolin-7-O-glucuronic acid nretþl ester (11-0), 2-C-(hydroxymetþl)-D-ribonic
acid-y-lactone (111) and L-Éhreo-guaiaryl glycerol (112) were isolated from Fraction
9.
These compounds need to be tested to determine whether they have anti bacterial
activity.
The initial cytotoxiciky test used - Procedure A - indicated a massive stimulatory
effect at high concentrations of the more polar extracts on three cancer cell lines,
while at lower concentratiqlns there was some inhibition of growth. Flowever
these results could not be reproduced. Other cytotoxicity tests were inconclusive.
The anti viral tests showed no activity.
OHOH:
OH
ocH3
(112)
vr ll

STATEMENT
This thesis contains no material previously submitted for a degree at any
University, and, to my knowledge and belief, contains no material previouslypublished or writtenby another person except where due reference is made in the
text.
I give my consent fur this co_py of my thesis, when deposited in the UniversityLlbrary, b"ing available for loan and photocopying.
Sally Nobbs
lx

ACKNOWTEDGMENTS
There are tnany people rvho have contributed to the completion of this thesis and
whose help and inspiration have been lnvaluable to me.
Firstly, I am truly indebted to the care and motivation of Dr. Simon Pyke. Dr Pyke
has been unfailing in his positive and professional approach to my work. His
enthusiasm, care for detail, kindness and unfailing optimism have been of
immense help, I truly could not have started" let alone completed this thesis
without Dr Pyke's support.
There are some professional colleagues whom I must thank. I am indebted to
Phil Clement, whose skill and patience in performing numerous NMR
experiments for me was invaluable. Dr Bruce May was always very supPortive
and I really appreciated his help and that he actually read my draft! To all the
fellow travellers in Lab 7, thankyou for the support and the fun.
My family has been very supportive of my efforts. My parents, Margaret and Iack
Ir{obbs have been inspirations to me. They have been positive and enthusiastic at
all times and I could not have completed this thesis withou-t their help. My
brothers John and Tony, sisters-in-law Jacqie and Sylvia and brother-in-law Ben
have ahvays encouraged me and supported me in any way they cotrld. lr{y sister
]ackie has also been a major inspiration to me and I can now empathise more
fully rvith her own experiences.
I could not have completed this thesis r.vithout the support of my place of
employment, Wilderness School. To the Principal, Mrs Carolyn Grantskalns and
to my Head of DepartmenÇ ]udy Cor; goes my ebernal gratitude for their supporh
and the inberest they have always shown. To my many colleagues from school -
both staff and students - thankyou. Thanks especially to Marian Bader for her
tireless efforts in helping type the drafts for each chapter and to Jan Lyon who also
read my first draft.
Thanks to all my friends vt'ho have helped me through the last six years of my
life - Wendy and Greg, Kirstie, fane Langrelrr,Iane Keezu Libby, Fred and Siddl
Sandy and all the other friends that have helped'
x
Lastly to my "children" - Benjamin, Andrew. Jeremy and Little fack - my
beautiful nephews - and Carly ]oanna and Emma-Louise Elsie Keech - those
beautiful girls - atl of whom I adore. They are the inspirations in my life and their
presence in my life has kept me sane.
XI

Chapter 1
CHAPTER 1. INTRODUCTION
1.1 General historical use of natural products as medicines
Plants are a major source of biologically active organic compounds and have been
used as natural medicines by most indigenous communities, including
Aboriginal clans from South Australia.
Humans have used native plant material as medicinal and therapeutic agents
throughout history. The earliest written prescriptions for medicines have been
found on Egyptian papyrus dated around 3,500 years BC. IÍt this collection, 800
medicinal prescriptions were found, many of them of plant origin that are now
known to contain bioactive organic compounds.l
By 300 BC the Hippocratic collection of scientific medical documents had been
established, while Dioscorides (surgeon to the Emperor Ne¡o) carried on the
botanical work of Theophrastus (370 - 286 BC) and wrote the "Materia Medica"- a
book outlining the preparation and uses of more than 600 plants and plant
products.2 Galen (200 AD) outlined the preparation of herbs that provided the
basis of medical treatments through until modern times.l
It has been suggested that over 75% of the r,t'odd's population today receives their
health care through the traditional use of natural medicines and many of the
drugs common throughout the developed world are based on organic
compounds isolated from plants.l The use of salicylic acid (aspirin), morphine
and atropine are just three examples of the many medicines derived from plant
sources.
More than 500 of the plant species growing wild in Australia have been and are
still being used as medicines to treat a variety of ailments.l
The Australian Aborigines did not have a r,vritten language, but there is clear
evidence in their oral history oÍ the use of plants as medicines to treat a wide
variety of symptoms. Steaming-oven stones for the steaming of aromatic plants
have been found in hearths that are at least 4000 years before the present3, and
there is much anecdotal evidence for the use of med.icinal plants that has been
passed on to anthropologists.
1

Chapter 1
The medicines were prepared and are still being prepared. in a numb€r of ways:1,3t by,using stones to bruise the plant material by pounding it, then
moistening the material and placing it on the skin as a poultice.O by burning aromatic leaves and twigs and breathing in the resultant fumes.I the leaves and twigs were heated and then doused with water to form
steam that was either breathed in or used as a steam bath.0 by extracting plant material with water and drinking the infusion. Before
the arrival of Europeans, r,vho provided drinking utensils, the Aboriginesused to put the material in water in hollowed wooden containers and thenplace heated rocks into the infusion to increase the lvater temperature.They then drank the infusion. In this way, the water temperature did notusually increase above 50oC.
A number of ceremonial and medicinal drugs were widely traded amongAboriginal clans throughout mainland Australia, with only certain clans l1avingthe knowledge concerning the correct procedures to ensure the production of a'safe' product. This knowledge was a very closely guarded secret, passed on fromgeneration to generation.4
Duboisia hopwoodii is a plant that the Aborigines called pituri. It has a highnicotine content and was used both as a recreational drug and in certainceremonies. It produced a general sense of well being, including hallucinatoryeffects and was widely traded along the numerous trade routes across Australia.a
Chemically, it is interesting to note that the preparation of pituri involved itstreatment with alkali ash, which was produced by burning a particular r.r,,irrabuslu Acacia salicinø. The effect of this alkali ash was to increase greatly thepower of the drug, by freeing the nicotine and allowing it to pass readily throughmucous membranes.4
There apPear to be various classes of organie materials tlrat have a hightherapeutic value. These were isolated from plant sources by Aborigines.l
These classes of organic materials include:Alkaloids Alkaloids are secondary metabolites, which are usualiy bitter and
Possess a definite and usually specific physiological effect and areby Íar the most well known plant medicines. They incrudecaffeine, morphine, quinine, nicotine, atropine and a host ofothers. Fifteen per cent of all higher plants contain alkaloids.
2

Tannins
Essential oils
Mucilage
Latex
Chapter 1
Tannins are used as astringents, drawing tissues together, andtherefore used for treating surfaces such as inflamed mucousmembranes. They were used to treat colds and coughs and to bathwounds.Essential oils are widely used for a variety of treatments, inparticular respiratory ailments. Eucalypts and the mint generapossess oil glands. The oil vapours can be inhaled to treat coldsand upper respiratory infections and have also been known topossess anti-microbial properties.Mucilage is the slimy drip frorn broken stems. Mucilage of somespecies has been used for the treatment of inflamed mucousmembranes.
Latex is a fluid containing enzymes that digest protein andtherefore can be used to remove small skin eruptions and cleanthe su¡faces of ulcers and wounds.
Europeans have documented the use of plants by Australian Aborigines from asearly as 1861. There are a large number of books and papers listing the diseasesand symptoms for which Australian plants have been used.
These include "wild Medicines in Australia" by Cribb and Cribb,l "Mankind" byWebb,S,0 "The records of Western Australian Plants used by Aboriginals asMedicinal Agents" by Reid and Betts,T "Australian Medicinal Plants" by Lassackand N{cCartney,s articles by Cleland and Johnson in the Transactions of the RoyalSociety of South Australiae and, most recently, "Traditional AboriginalMedicines in the Northern Territory of Australia" by Barr et al.i0
Chemically and pharmacologically, the plants of Australia began to beinvestigated in the early 1940's in a CSIRO project known as the AustralianPhytochemical survey. The alkaloids r,vere the major chemical group of interestas these were considered to be the most likely compounds to possess therapeuticactivitY.ll
The phytochemical survey was augmented by the pharmacological testing of thealkaloic{s and then investigation of specific anti tumotrr activity, using both crudeplant extracts and then pure substances.ll However, there are many species ofAustralian plants that have not been investigated, including plants from theGoodeniaceae family and species from th.e scaeaora genus.
J
Chapter 1
1,2 Family Goodeniaceae/ Scaeaola genus, Scaeaola spinescens
1.2.7 Botanical DescriptionThe family Goodeniaceae consists of eleven genera with approximately 400
species almost all of which are confined to the Southern Hemisphers.l2
Tl;.e Scaeaolø genus contains 96 species that occur throughout the tropical areasof the Indo-Pacific region as well as throughout Australia. Seventy of thesevent¡r-one Scaeaolø species that occur in Australia are endemic, one of which isScaeuola spinescens. Scøeaola tøccada is the only species that is not unique toAustralia and it occurs in many other areas of the world.lz
Scaevola, according to one reference,l2 means "little hand", while a secondreferencel3 states that it derives from the Latin'scaevus', meaning left, and thatScøeaola was named after the Roman, Gaius Mucuis.
According to legend, Gaius Mucius attempted to kill Lars Porsena, King of Clusium.However, he accidentally killed the King's secretary. On being arrested, and to show thathe was not afraid of deatþ he thrust his right hand into a fire whe¡e it was consumed. TheKing set Mucius free (l) and gave him some land, and from that time on Mucius was known asScaèvola - left hand. 13
Both'little hand' and'left hand' refer to the type of flower that all Scaeaolaspecies have. It is a flower that is shaped like an outspread hand.t3
The full botanical description of Scaeaola spinescens is attached in Appendix A.
The common names fot Scaeaola spinescens are prickly fan flower, fan busþcurrant bush, poonto614 or maroon bush,10,1s while the Aboriginal people wholive near Hawker in South Australia - the Adnyamathanha - give it the name"Yud11".16
It is a ngid, of ten tangled woody shrub, 50 cm to more than L m high rn'ith woodystems. Its leaves are very small (5-20 mm long, 2-5 mm broad), are shaped like alance or a spear and are thick and fleshy, The leaves often cluster, and are
accompanied by a rigid, sometimes forked spine. The flowers are cream-to-yellow, 10-1,6 mm long, born singly on slender stalks with 5 equal spreadingpetals on one side of an obvious fan-shaped arrangen'rent.l4
A photograph taken of a stand of Scaeaola spinescens is shor.t'n in Figure 1-.2.1..1..
4

Chapter 1
F igur e'1.2.'1..1-: Scneztokt spinesce ns (photo: SaIIy F' N obhs, 2000)
The major characteristic that distinguishes Scøer:ola spinescens from other
species oÍ. Scaeaola is their branched spines and this pattern is displayed in Figure
1..2.'l-.2.\2
5
Figure L.2.1.2: Branchlets of Scneaala spin.escens 12
Chapter 1
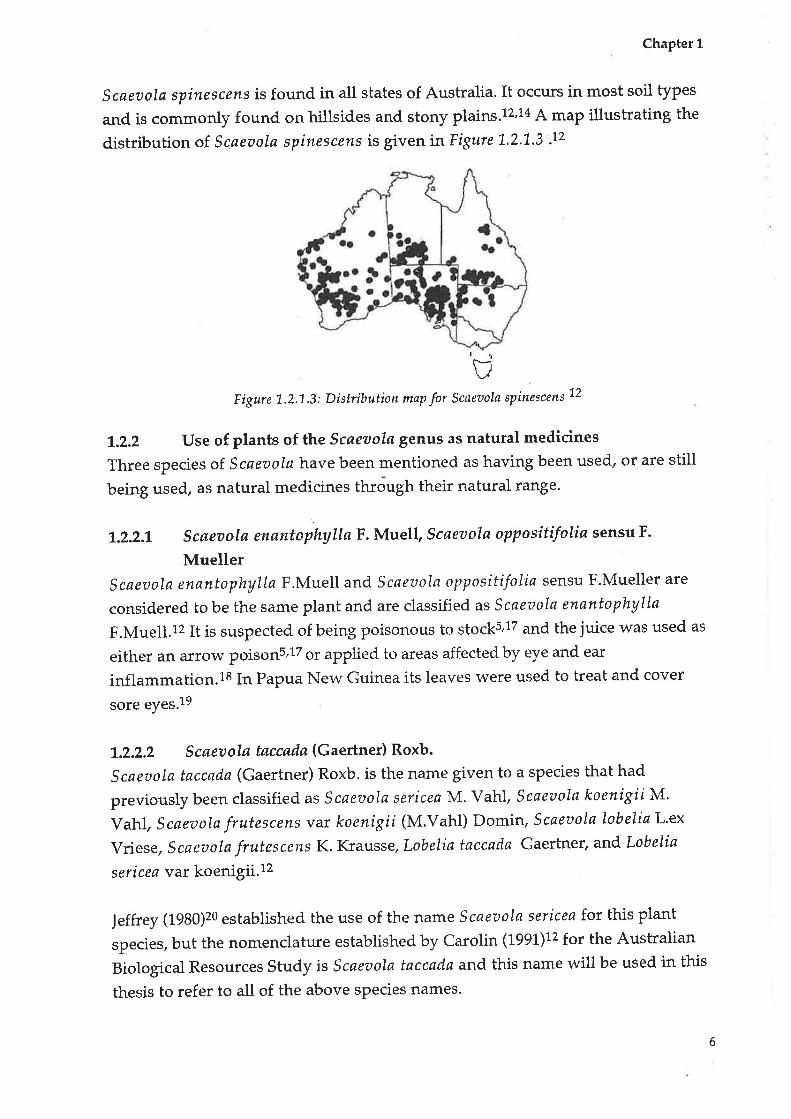
Scaeaola spinescens is found in all states of Australia. It occurs in most soil types
and is commonly found on hillsides and stony plains.12,r4 A maP illustrating the
distribution of scaeaola spinescens is given ínFigure 1-.2.L.3 .12
t!
UFigure L.2.'1-.3: Distribution map for Scaeuola spinescens 12
7.2.2 use of plants of the scaeaola genus as natural medicines
Three species of. Scaeuola havebeen mentioned as having been used, or are still
being used, as natural medicines through their natural ran8e.
1.2.2.1 Scøeoolø enonto)hyltøF.Muell, Scaeaola oppositifoliø sensu F.
MuellerScaeaola enantophytla F.Mrtell and Scaeaola oppositifoliø sensu F.Mueller are
considered to be the same plant and are classified as Scøeaolø enøntophylla
F.Mueil.r2 It is suspected of being poisonous to stock5,17 and the juice was used as
either an arrow poisons,lz or applied to areas affected by eye and ear
inflammation.is In Papua New Guinea its leaves were used to treat and cover
sore eyes.19
\.2.2.2 Scøeaolø tøccødø (Gaertner) Roxb.
scaeaola taccada (Gaertner) Roxb. is the name given to a species that had
previously been classified as Scøeaolø sericea M. Vahl, Scaeuolø koenigiiM.
Vahl, Scaeuola frutescens var koenigii (M.Vaht) Domin, Scaeaola lobeliaL.ex
Vriese, Scaeaola frutescens K. Krausse, Lobeliø taccadø Gaertner, and Lobelia
s er i ce a var koeni Bli.tz
leÍfuey (fgSO)zo established the use of the name Scaeaola sericea for this plant
species, but the nomenclature established by Carolin (1991)12 for the Australian
Biological Resources Study is Scaeaoln taccacla and this name will be used in this
thesis to refer to all of the above species names'
6

Chapter 1
Scaeaola taccada is widely distributed along the coasts of Madagascar (Africa) and
other countries of the Indian Oceary tropical Australia and through the Pacific
Ocean from Taiwan through to the Hawaiian Islands.l2
It has been and is still widely used as a natural medicine throughout its
geographical range. It is not unique to Australia and so was not considered for
study in this profect. It is the most widety documented species of. Scøeoolø used as
a natural medicine. Table 1..2.2.L (on the next page) outlines the places and uses of
Scaeaola taccada.
This inJormation is included because it supports the vierv that plants from the
Scaeuola gentls may possess active compounds of therapeutic value.
Scaeaola taccada M. Vahl is one of only two Scaeuolø species that occurs in
Southern Africa. It is reported, in Madagascal, to be used as an antidote against
the poisonous prick of 'armed' fish.13,21 Personal communications22-2s ü¡l¡þ f6u¡
botanists working in the field in Southern Africa indicate no known medical use
of Scaeaola taccada or the other species of. Scaeaolø along the coast of South
Africa and Mozambique.
7.2.2.3 Scøeuola spinescens (R.Br.)
Scaeaola spinescens has been recorded through most of the arid and semi-arid
parts of South Australia (see Figure 1.,2,L,3 - Map of the distribution of Scaeaola
spinescens). It became the plant of interest for this current project because of its
rvidespread use as a medicinal plant by South Australian Aborigines and because
of its use as a potential anti cancer treatment in Western Australia.
Scaeaola spinescens has been described as:
. an analgesic.
. a treatment for coughs and colds.
. an anti bacterial agent for treatment of wounds, sores ancl septic ulcers'
. able to be used for skin disorders such as tinea, ringworm, itches and leprosy
. able to be used for stourach disorders.
. an anti tumour agent by a wide range of independent sources.s
My initial interest in the therapeutic value of Scaeaolø spinescens was raised by
discussions between Mrs. Pearl McKenzie26 an elder of the Adnyamathanha
people of Hawker, South Australia and Mr John McEnteel6, owner of Erudina
station near Lake Frome.
7

Chapter 1
Table 1..2.2.7: MedicinøI uses o Scaeaola tøccada
Both individuals indicated that Scaeaola spinescens was a powerful natural
medicine still used in certain situations to treat pain and bleeding in the
I
ReferencesUsePlace
öwere ru on cureAustralia
ó, ró, ¿lsores
13, lðnatiG cab-fage -1he young leaves eaten as a vegetable
1,8, 19Teaves apptied to soresNelv Cuinea
I9-Lèaves used for sore eyes
27New soft leaves are chelved for coldsNerv Ireland
28-BitterFeaves used to cure indigestionMalacca
T8,ztt-feaFþoultice applied to head to treat headaches
28
-Used
to treat diarrhoeaMoluccas
IFitþices used to treat cataractsPhilippines
f,13, lð-Rõots used to treat syphilis and dysentery
13, Iðlntidote for fish poison
ló, ró, ¿ó-Root used to treat beri-beri
1, 16Toot &coction taken for stomach acheFiji
13made into a poultice
13andcold titsSamoa
16Te'aves usecf ara tonic and an aphrodisiacCaroline Is
')9T-eepiuG;catarãcts, scaly skin, p uncture lvou nd sHawaii
'19Terry jurce used to treat eyes with dim visionIndia
13@mote suppuration of boilsand tumours
Area not indicated
13, ¿ó-Decoeictn oT root used to treat beri-beri
13lvomen to
13nPe tumours
13as anto stopand treat male
stems
28on
2L,ZEjuice used on sore eyes
ZTTñttão telor-po i so no us fi sh and crabs
13ffio

Chapter 1
alimentary canal. Further personal communications by Ms Sue Semple30 withthe Aboriginal people of Oodnadatta and station owners around Lake Eyre
supported the view that Scaeuola spinescens was a powerful natural medicine.
Further research from a variety of sources inclicated the following uses of
Scøeaolø spinescens.
Colds
The whole plant was burnt and the fumes inhaled for colds.s' 21
Treatment of sores
The leaves and branches (both dry and green) were placecl in a hole in the ground
and burnt. A boy who had been recently circumcised squatted over the hole and
urinated into the hot ashes so that steam would rise around the penis.e Other
sores were treated in the same way,but using water on the ashes instead of
urine.8,9 A decoction of broken stems v¡as used to cure boils, sores and rashes
when drunk for three to four days.8
Stomach and utinary pains
The Aborigines of South Australia boiled the root of the plant and drank the
liquor for stomach ache and urinary complaints.1,8,9 Aborigines of trVestern
Australia drank an infusion of roots for pain in the alimentary cana1.6 Aborigines
in the Murchison region of lVestern Australia used the woody stems to treat
alimentary ulcers.T
Analgesic
An infusion of Scaeoola spinescens was used to alleviate the pain of cancer.lz'1s
Cancer
An infusion of the leaves and twigs of. Scøeaolø spinescens, in conjunction withCoclonocarpus cotinifolius, \^¡as reputed to cure cancer. A later investigation of
this mixture rvas inconclusive.T,s
Personal correspondence vvith Dr E. Ghisalberti3l of the University of Western
Australia indicated that the Western Australian Public Health Department had
used a decoction of Scaeaola spinescens as a rudimentary treatment for cancer
from the 1930's to the L970's, with among five to fifteen people using the
decoction. Pharmaceutical companies tested a plant extract u'ith no obvious
cytotoxic properties being noted.
9

Chapter 1
An articlels, written in1966, has only recently come to my notice, outlining the
'history' of the use of Scaeaola spinescens as an anti-cancer agent in WA.
The follorving is a precis of the article.
In January 1937 afull-blood Aboriginal received medica-l treabnent at a counblrhospital in WA.
iagnosed as a possible infection orlater, he appeared with his tongue
n treated by sr,t'allorving infusions from aal Aboriginal name for Scaeoola spinescens.
The rumour of a cancer cure then circulated around Perth and samples, prepared inaccordance with the method used by the Aborigines, were forwarded to Perth.
were
år,r,
ent with inoperable cancer.
Further ctwas notL967, 66more of
At present an extract from Scaeaola spinescens is supplied by the Chemistry
Centre of Western Australia to a limited number of patients r,t'ho have been
diagnosed with various terminal cancers.3l Flor,vever there is pressure for this to
stop.
I{hen I first started the project in January 1994,I'n'as unable to find any reference
to Scaeaola spinescens in the chemical literature. I chose Scaeuola spinescens as
the plant to be investigated because, firstly, it was only found in Australia (unlike
Scaeaola taccøda).
Secondly the literature research and personal and close communication with the
Adnyamathanha people indicated it was a very powerful natural medicine,
which was still being used.
Thirdly, I was able to collect a large amount of the plant material easily (unlike
Scaeaola taccada, which is a tropical plant frorn Northern Australia).
Fourthly, when I started the project I believed that no one had worked on
Scaeaola spinescens as there was no pubtished literature on the plant, apart from
a paper written in197132, outlining pharmacological testing of the aqueous
10
Chapter 1
extract. I proceeded to collect 12.7 kg of the aerial parts of the plant and to work on
the more polar fractions of the plant, as the Aboriginal people prePare the plant
by boiling it.
A colleague of mine attended a conference in August 1995 and learnt that a grouP
in Perth, associated with Curtin University had previously rvorked on Scaeaola
spinescens although they had not published any of their results. I arranged to go
to Perth in January L996 and met Dr E. Ghisalberti who informed me that a PhD
student supervised by Dr R. Longmore of Curtin University was currently
working on S caeaola spinescens.
Discussions with Dr Glúsalberti3l and Dr Longmore33 were very fruitful, for itappeared that they were concentrating on the non-polar fractions. Not only that,
but it was clear that their anecdotal evidence for the efficary of. Scaeuola
spinescens supported my information from the Adnyamathanha people and that
this plant has real potential as a source of therapeutically active compounds. Itwas also pointed out that there might be variation in the plants collected from
sources as r,videly separated as lVestern Australia and South Australia.
They \^,ere also able to confirm that samples of the plant had been sent to and
tested by the US National Cancer Institute, but were not forthcoming with any
results of this investigation.
I have proceeded with my investigation of the compounds isolated from
Scaeaola spinescens by investigating the polar extracts of the plant.
1.2.3 Biological testing ol Scøeaola species
There have been some investigations into the pharmacological activity of plants
from tlne Scaeaola genus.
1.2.3.1 General screening
In 1990 the CSIRO published a book - "Plants for Medicines"ll - which is a survey
of all phytocheurical and chemical investigations of plants in the Australian
region. Eleven species of scaeaola wete investigated in an alkaloid and anti
tumour screening, with the results outlined in Appendix B.
In summa ry, oÍ the eleven S cøeaola species tested, three shor,ved the presence of
alkaloids (Scaeuola aernula, Scaeaola hispida and Scaeaola denseuestita) while
six were tested for anti tumour activity (scacaola aetnula, Scaeaola albida,
11,

Chapter 1
Scaeaola angustata, Scaeaola hispida, Scaeaola tøccada artd Scaeaola
oppositifolia) but all gave a negative result.l1 Scaeaolø spinescens was not one of
the species tested.
1.2.3,2 Scaeaola taccøda
From the data given above (phytochemical screening) it would appear that
Scøeuola taccøda does not possess anti tumour activity.
Ishii et al3a in 1984 teste d Scaeuola tøccada as well as over 303 different plant
extracts f<¡r bio-antimutogens (agents that suppress cellular mutagenesis) using
the criteria of suppressing UV induced mutations in E.coli WP2 trp and the
mutator activity itt B. subtilis NIG1l25 (his met).Tlrre Scaeaola taccada extract did
not appear to have any effect.
In 1995 extracts of. Scaeoola taccada were investigated for anti viral, anti fungal
and anti bacterial activify in vitro by Locher et al.2e Their research shor,ved that
the acetonitrile fraction of Scaeoola taccada showed selective anti viral activity,
rvhile the dichloromethane fraction exhibited anti fungal activity to a lesser
extent.
1.2,3.3 Scøeaolø spinescens
The earliest investigation of the effects of aqueous extracts of the wood of
Scøeaola spinescens was published in1971,by Goss et al32 where it was reported
that this extract contaíned an antagonist of S-hydroxl' tryptamine (sHT)'
Kerr and. Longmore3s in '1.996 rcported in an abstract to a conference the isolation
of a number of known compounds and that:
"Resttlts of screening on the LIS National Cancer Institute (NCI) tumour pønel
assay, together zpith the constituents isolated andf or found to be present in the
plant, proaide euidence in support of the anecdotal reputation of the Scaeaolø
bttsh as a meclicinalty øctiae, potentiatty important cancer chemotherapeutic
agent or solLrce tnøterial."
They did not give any details of the results of this screening.
In December of 1996Kerr, Longmore and Betts36 published a Paper identifying a
number of pentacyclic triterpenoid compounds. They used the GC-MS technique
with peak matching of libraries of lvIS data, and hence were able to identify
previously isolated compounds. These compounds were isolated from non-polar
fractions.
L2

Chapter 1.
In 1998, Semple3T reported on her investigation into the anti viral activity of the
extracts of forty different Australian plants that the Aboriginal people used intheir traditional medicines. She found that the methanol fraction of. Scøeuola
spinescens was active against human cytomegalovirus (HCMV) at therapeutic
Ievels.
Kerr, tongmore and. Yench3s (1999) tested extracts o1. Scøeoola spinescens f.or their
ability to inhibit tumour formation in the potato Crown Gall Tumour (CGT)
assay and for possible anti microbial activity against Bacillus sttbtilis. Their
conclusion was that the aqueous and methanolic extracts oÍ. Scaeuola spinescens
were significantly active in the CGT assay "indicating a strong potential for
further ínaestigation for anti-cancer actiaity."
1.3 Classes of compounds previously isolated from plants of theScøeaola genus.
As has been detailed previously, the CSIRO, through its general chemical and
pharmacological screening program of indigenous Australian plants, has
indicated the presence of alkaloids in three out of eleven of the Scøeaola species
tested, r,r'hile six out of the eleven \,\'ere investigated for anti tumour activity '"vithnegative results.lt
Isolation and structure deternrination of compounds from species of. Scaeaolø
have revealed a range of organic compounds, r,r¡hich can be classified into six
different classes, iridoids, alkaloids, coumarins, f.atty acids and hydrocarbons,
flavonoids and terpenoids,
1.3.1 IridoidsIridoids are monoterpenoids that contain the ryclopentane-lc]-Pyran skeleton and.
that are natural constituents of a large number of plant families. Iridoids are
usually, but nob always, found as a glyeoside. They have been widely implieated
in the biosynhhesis of indole and isoquinoline alkaloids.3e
L.3.1.1 Iridoids isolated from Scaeaolø species
The earliest report of a chemical investigation of species of. Scneuola was by
Tammes, who as early as L909,40 reported the following:
"Orrly in the three species of the genus Scueuolu of the order Goodeniaceae, wlúch were at
tt.y dirporul,I founá after warming parts of the plants in a moist place, that a blue colouritrg
matter occurs which is doubtless dipsacotin"'
13
Chapter 1
No structural information for dipsacotin was givery and this reference should be
treated carefully.
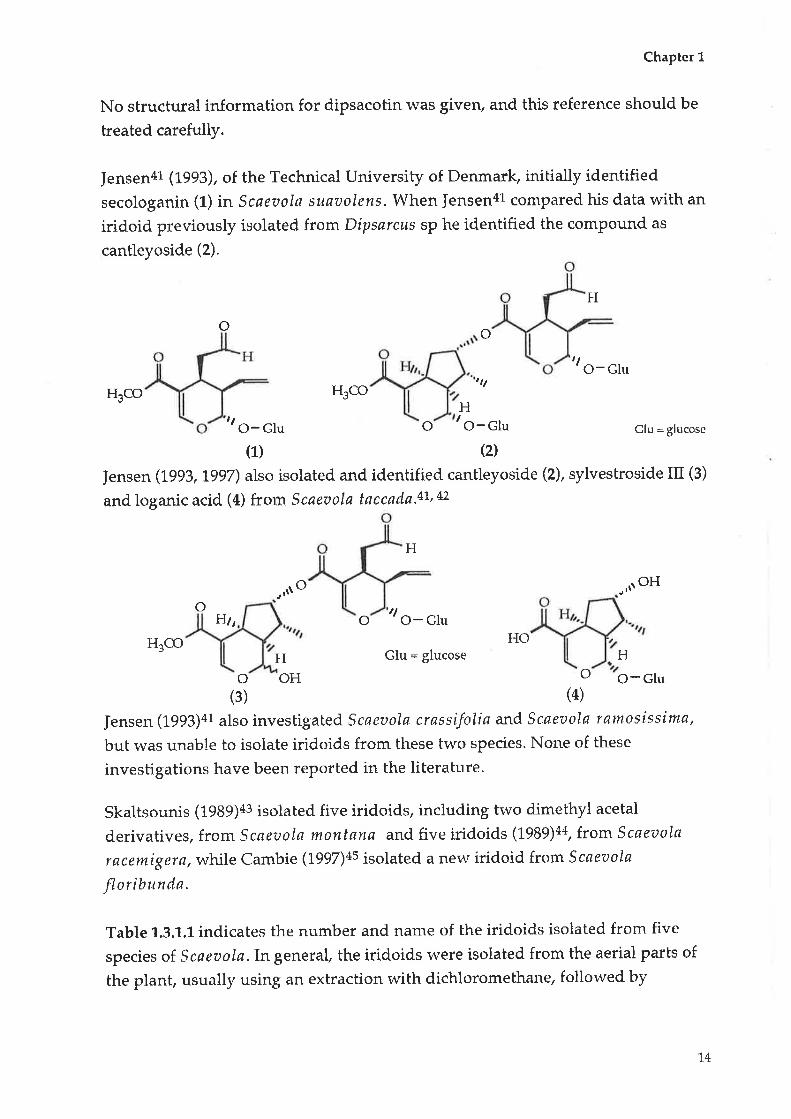
Jensen4l (1993), of the Technical University of Denmark, initially identified
secologanin (L) in Scaeoola suøaolens. When Jensen4r comparecl his data with an
iridoid previously isolated from Dipsørurs sp he identified the compound as
cantleyoside (2).
H
o
tlO- Glu
H3COttl
H¡@,l
H'o-c1.,
(2)
Jensen (1993,1997) also isolated and identified cantleyoside (2), sylvestroside III (3)
and loganic acid (4) frorn Scaeaola taccada.4l' 42
H
oa rl\
OH
o
O- Glu
(1)
o Clu = glucosc
rñ
H
oH/t ,l
o O- Glu
H3CO6[u = glucose H
o OH o O-Glu(3) (4)
]ensen (tggg)st also investigated Scae.aola crassifolia and Scaeztola ramosissima,
but was unabLe to isolate iridoids from these tr,vo species. None of these
investigations have been reported in the literature.
Skaltsounis (1l8O¡lr isolated five iridoids, including two dimethyl acetal
derivatives, from Scaeaola montana and five iricloids (L989)44, from Scaeaola
røcemigerø, while Cambie (tSOZ¡+s isolated a new iridoid from Scneaola
floribunda.
Table 1.3.1.1indicates the number and name of the iridoids isolated from five
species of. Scaeaola.Ingeneraf the iridoids were isolated from the aerial parts of
the plant, usually using an extraction with dichloromethane, followed by
HO
1,4
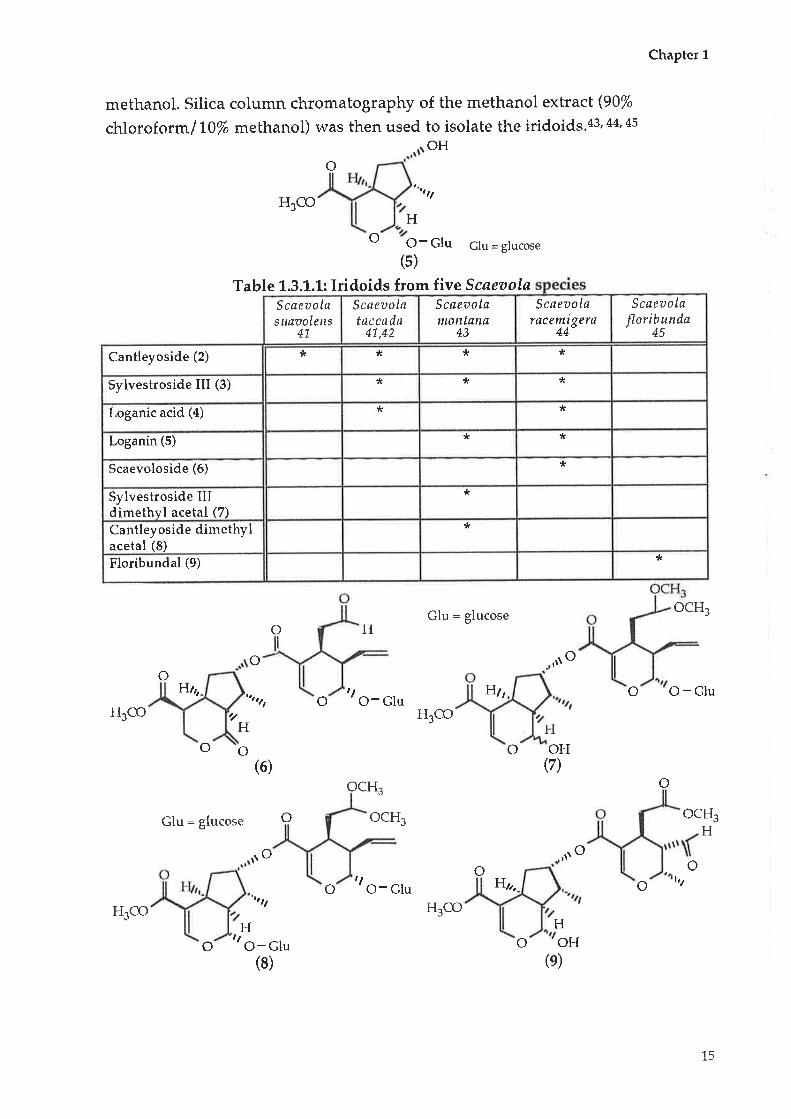
methanol. Silica column chromatography of the methanol extract (90%
chloroformlTO% methanol) was then used to isolate the iridoids.43,44, 45
OH
o
H3CO
Table L.3.1.1: Iridoids from five Scaeaola
Çlq: glucoseH
,f\ O
,l FItto O-Glu
,/ H3COH H
o o o OH(7)
Ho O-Glu Çlu = glucose
(s)
Chapter 1
o O -Glu
o
ocH3H
oo 1l
ocH3
o
o
¡ffito
H3CO
(6)
6l¡: glucose o
,ao
.tt tl
H
" o- Gl.,(s)
ocH3
,lo O-Glu
OCH3
oo
¡l\
Ho OH
(e)
H2.
H3CO H3CO
Scaeaola
Jloribunda45
Scaeaolataccada
41,42
Scaeaolanrcntana
43
Scaeuolaracemigera
44
Scøeuolasuaaolens
41.
* * *Cantleyoside (2) *
** *Sylvestroside III (3)
* *Loganic acid (4)
**Loganin (5)
*Scaevoloside (6)
*Sylvestroside IIIdimethyl acetal (7)
*Cantleyoside dimethylacetal (8)
*Floribundal (9)
o
15
Chapter L
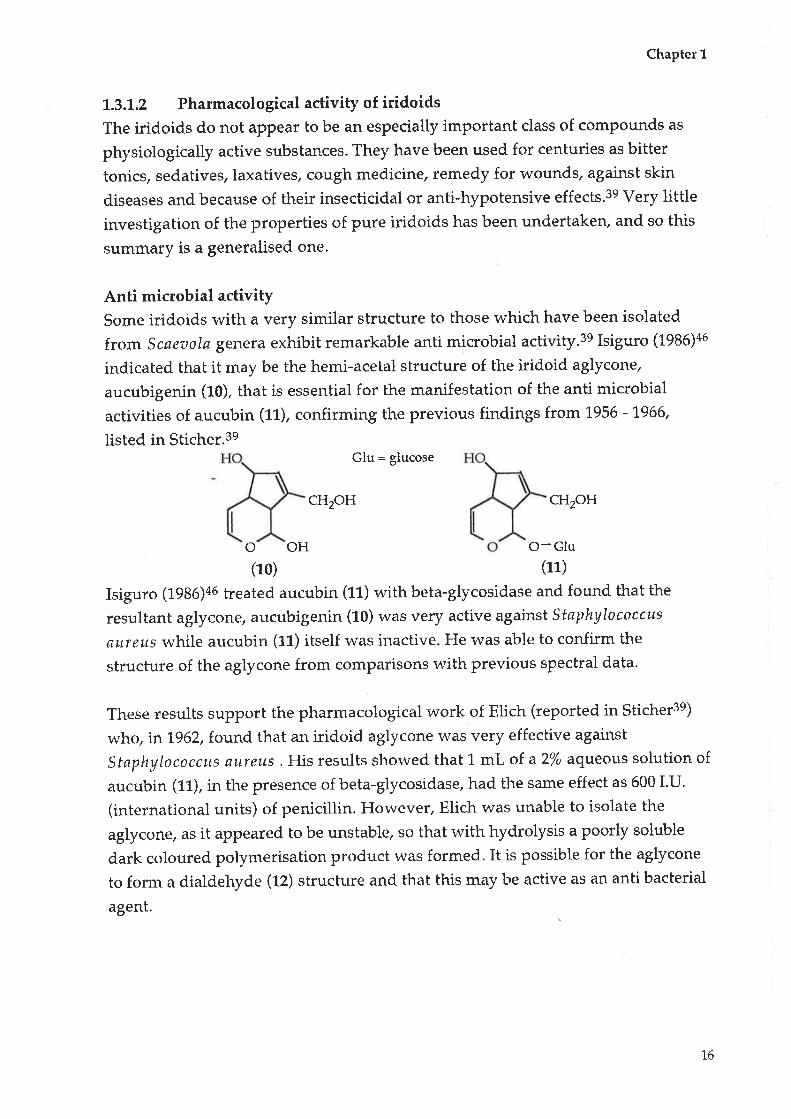
7.3.1.2 Pharmacological activity of iridoids
The iridoids do not appear to be an especially important class of compounds as
physiologically active substances. They have been used for centuries as bitter
tonics, sedatives, laxatives, cough medicine, remedy for wounds, against skin
diseases and because of their insecticiclal or anti-hypotensive effects.3e Very little
investigation of the properties of pure iridoids has been undertaken, and so this
summary is a generalised one.
Anti microbial activitySome iridoids with a very similar structure to those which have been isolated
from Scneaolø genera exhibit remarkable anti microbial activity.er Isiguro (fea6¡+s
indicated that it may be the hemi-acetal structure of the iridoid aglycone,
aucubigenin (10), that is essential for the manifestation of the anti microbial
activities of aucubin (11), confirming the previous findings from 1956 - 1966,
listed in Sticher.3eÇls: glucose
cH2oH cH2oH
o OH O- Glu
(11)
Isiguro (feS6¡40 tueated aucubin (11) with beta-glycosidase and found that the
resultant aglycone, aucubigenin (10) \Mas very active against Staphylococclls
aureus while aucubin (r1) itself r,vas inactive. He was able to confirm the
structure of the aglycone from comparisons with previous spectral data.
These results support the pharmacological r,t'ork of Elich (reported in Sticher3e)
who, tnLg62, found that an iridoid aglycone was very effective against
StaphytococcLts aureus, His results shor,ved that L mL of a2% aqueous solution of
aucubin (L1), in the presence of beta-glycosidase, had the same effect as 600 I.U.
(international units) of penicillin. However, Elich was unable to isolate the
aglycone, as it appeared to be unstable, so that with hydrolysis a poorly soluble
dark coloured polymerisation product was formed. It is possible for the aglycone
to form a dialdehyde (L2) structure and that this may be active as an. anti bacterial
agent.
(10)
T6
Chapter 1
cH20H
o(72)
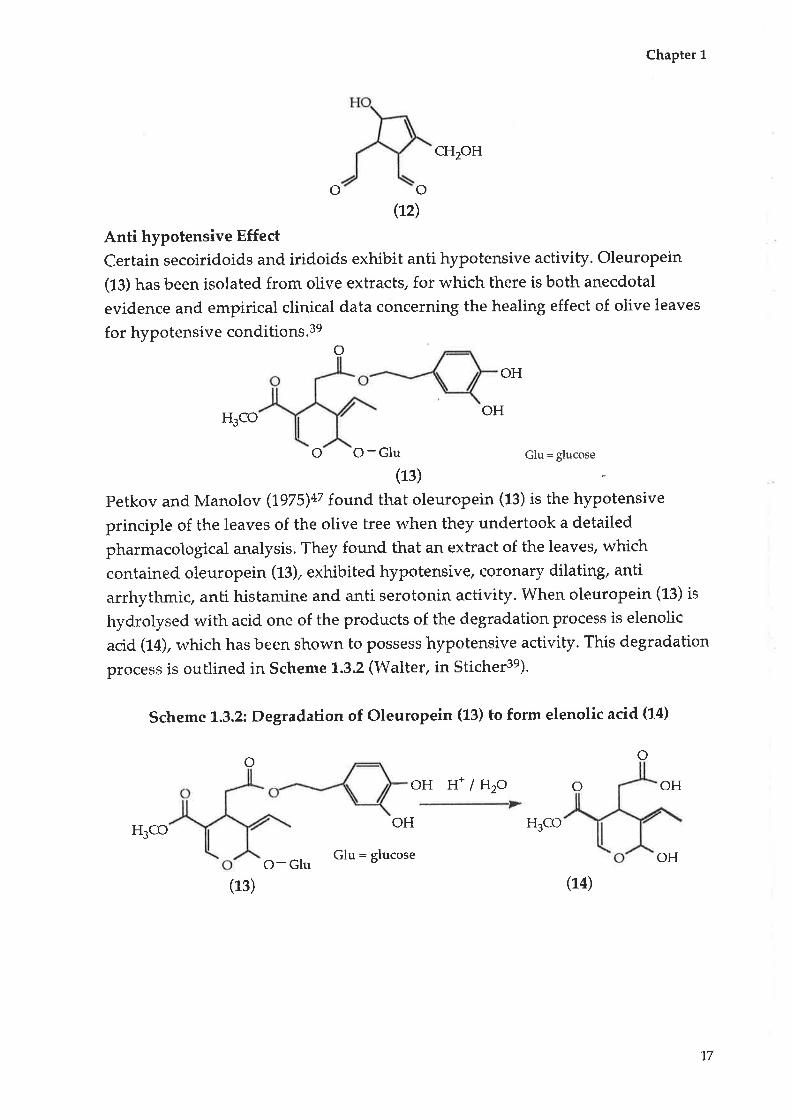
Anti hypotensive Effect
Certain secoiridoids and iridoids exhibit anti hypotensive activity. Oleuropein
(t¡) has been isolated from olive extracts, for which there is both anecdotal
evidence and empirical clinical data concerning the healing effect of olive leaves
for hypotensive conditions.3eo
H3COOH
o O-Glu Çlu = glucose
(13)
Petkov and Manolov (1975)a7 found that oleuropein (fe) is the hypotensive
principle of the leaves of the olive tree when they undertook a detailed
pharmacological analysis. They found that an extract of the leaves, which
contained oleuropein (t3), exhibited hypotensive, coronary dilating, anti
arrhythmic, anti histamine and anti serotonin activity. When oleuropein (ß) is
hydrolysed with acid. one of the products of the degradation process is elenolic
acid (14), which has been shown to possess hypotensive activity. This degradation
process is outlined in Scheme 1.3.2 (Walter, in Sticher3e)'
Scheme 1.3,2; Degradation of Oleuropein (13) to form elenolic acid (14)
o
oH H+ / H2O o OH
H3CO
O- Gluçlu: glucose
(14)
o
OH
o
OHH3CO
OH
(13)
17

Chapter 1
Analgesic properties
Harpagocide (15) was isolated from the root of Harpagophytum procumbers, a
South African plant used as a native medicine and its pharmacological activity
was investigated. It exhibited some analgesic properties.3e
.-OH
1¡Or, O- trans - Cinnamoyl
oH
O-GIu Çlu = glucose
(15)
Bitter tonicCrude extracts containing Loganin (5) are used as a bitter tonic.3e
Sedative agents
Petkov and Manolov (L975)az found a clear CNS depressive action (relaxant, anti
convulsive and hypnotic) associated rvith a crude extract from Valerianø
officinøtis that contained a mixture of "valepotriates", with the main component
being valtratum (10). This group of non-glucosidic iridoids has been developed by
pharmaceutical companies as weak sedatives, known under the collective name
"valepotriates" with the general structure of dihydrovaltratum (17). They possess
a tranquillising effect and an improved co-ordination capaclq.te' +ø
o
AcO tl tlHH
,l tloo
o o
.sOA.,-o
o
oo
(16) 07)Laxative properties
Inouye (1gZ8)qe investigated the relative purgative activities of thirteen naturally
occurring iridoid glycosides, one of which was Loganin (5). Loganin has a laxative
effect, given as ED5e = 0.54 glkg þ0% cathartic dose), with an onset of diarrhoea
after four hours.
Anti inflammatory agent
Recio et al (1993)ae evaluated twelve iridoid glycosides to determine their anti
inflammatory activity, using two models. Loganic acid (4) was the most active on
the carrageenan-induced mouse ear edema test, while loganin (5) showed the
18
Chapter 1
highest activity on the TPA induced mouse eat edema test. Recio et al also
reported on the hemodynamic (Circosta, 1984), cholenergic (Miyagashi, 1984) and
hepatoprotective (Chang, 1983) properties of certain unnamed iridoids.
Their findings suggested only a modest anti inflammatory effect by the iridoids
tested. They indicated that certain structural features associated with the iridoid
structure determined the anti inflammatory response.
Choleretic action
Takeda (lggO)so investigated the effect of iridoids on bile secretion and concluded
that the hemiacetal moiety of iridoid compounds plays an important role iu
exerting a strong choleretic activity. Atl the aglycones tested increased bile
secretions after intravenous administratiory while the effect of the glycosilated
iridoid moiety was not as marked.
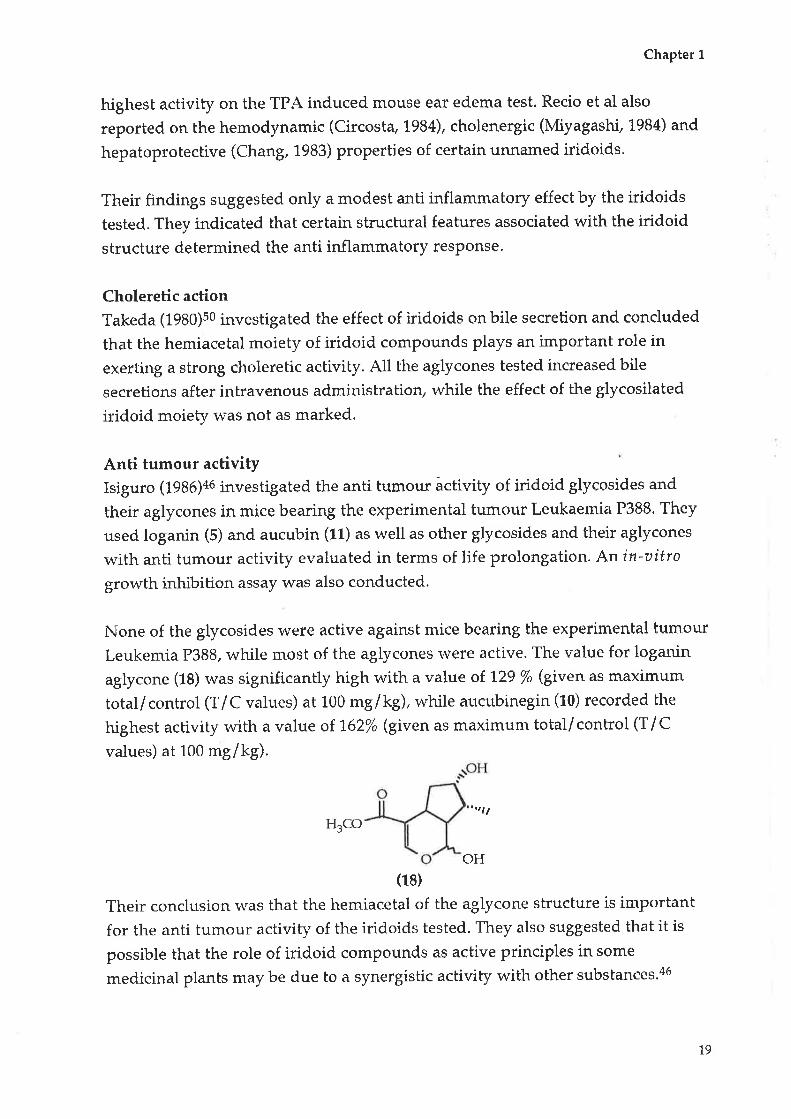
Anti tumour activityIsiguro (tggO)+o investigated the anti tumour áctivity of iridoid glycosides and
their aglycones in mice bearing the experimental tumour Leukaemia P388. They
used loganin (5) and aucubin (1L) as well as other glycosides and their aglycones
with anti tumour activity evaluated in terms of life prolongation. An in-aitro
growth inhibition assay was also conducted.
None of the glycosidee were active against mice bearing the experimenbal tumour
Leukemia P388, while most of the aglycones \,vere active. The value for loganin
aglycone (18) was significantly high with a value of.L29 /o (glen as maximum
total/control (T/C values) at 100 mg/kg), while aucttbinegin (10) recorded the
highest activity with a value of.1,6276 (given as maximum total/ control (T/ C
values) at 100 mglkg,).
,..tll
H3CO
(18)
Their conclusion was that the hemiacetal of the aglycone strucbure is important
for the anti tumour activity of the iridoids tested. Th"y also suggested that it is
possible that the role of iridoid compounds as active principles in some
medicinal plants may be due to a synergistic activity with other substances.46
OH
19

Chapter 1
1.3.2 AlkaloidsAlkaloids have been isolated from Scaeaola racemigerø (Daniker).sr,sz They are
members of the monoterpene alkaloid group of plant alkaloids, formed
biosynthetically from the iridoids loganin (5) and secologanin (1) by condensation
with ammonia. These alkaloids have been reported previously as genuine plant
metabolites.sl,s2 It is interesting to note that plants of the Scaeaolø genera Possess
both iridoids and monoterpene alkaloids.
7.3.2.7 Alkaloids from Scaeaolø røcemigerø
Nine alkaloids (19SS¡st and four dimeric alkaloids (1997)sz have been isolated
from the aerial parts of. Scaeaola racemigera (Daniker), collected from New
Caledonia, by analysing the more polar fractions of the extract aud using an
acid/base exkaction.
Initially, 4.5 kg of leaves and branches were treated with 10% amm.oniurn
hydroxide and cold extracted with dichloromethane, giving a yield of 8 g (0,18%
total plant) of alkaloid extract. A second, novel, cold extract of the same material
rvith methanol gave a further 3 g, giving a total of. L2 g (0.25% of total plant).
Successive silica column chromatography allowed the separation of the nine
alkaloids.
Hor,l'ever, ammonium hydroxide was used in the initial extraction Process so it is
not clear whether these alkaloids are plant metabolites or are a consequence of
the extraction process.
The following alkaloids (19) - (31) have been isolated from Scaeaoln racemigera
(Danike¡).st'sz
q H3CO tlHH3CO
NH
(20)
Tetrahydrocantleyine
.sOH
t¡
N
(1e)
Cantleyine
20

flht
H3CO
H
(21)
Strychnovoline
qH
NH
(23)
6- O-Nicotinoyl te trahydrocantleyine
o ott,
H3COH¡O
(2s)
Racemigerine
o N
H3CO tlH
H(28)
Scaevodimerine A
lrh,
HlCO
H3CO
(26)
6,7 - ep oxy racemigerine
H3CO
H
(22)
6-O-Nicotinoyl strychnovoline
¡lttt
Chapter 1
(24)
6-O-(5-vinyl nicotinoyl)-6-tetrahydrocantleyine
H3CO
(27)
Scaevoline
H
ooN
H
NlI4r
.lH3CO
NH
H
o
NN
,,H
o N
ol¡
L\¡,-NH
lltt,
NH
(2e)
Scaevodimerine B
21
o
Chapter 1
N
o
,rltl
H3COH3CO
NOH
(30) (31)
Scaevodimerine C Scaevodimerine D
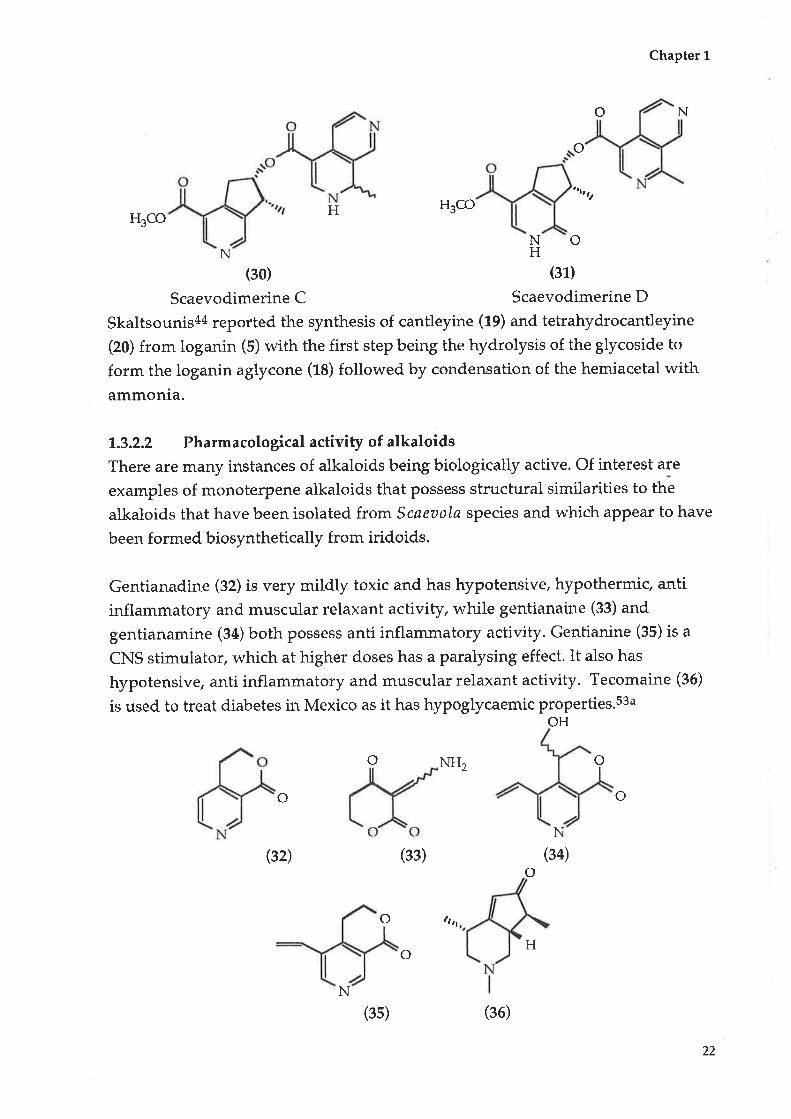
Skaltsounis44 reported the synthesis of cantleyine (19) and tetrahydrocantleyine
(20) from loganin (5) with the first step being the hydrolysis of the glycoside to
form the loganin aglycone (18) followed by condensation of the hemiacetal withammonia.
7.3.2.2 PharmacologicalactivityofalkaloidsThere are many instances of alkaloids being biologicalþ active. Of interest are
examples of monoterpene alkaloids that possess structural similarities to the
alkaloids that have been isolated from Scaeaola species and which aPpear to have
been formed biosynthetically from iridoids.
Gentianadine (32) is very mitdly toxic and has hypotensive, hypothermic, anti
inflammatory and muscular relaxant activity, while gentianaine (33) and
gentianamine (g+) both possess anti inflammatory activity. Gentianine (gS) is a
CNS stimulator, which at higher doses has a paralysing effect. It also has
hypotensive, anti inflammatory and muscular relaxant activity. Tecomaine (36)
is used to treat diabetes in Mexico as it has hypoglycaemic properties.s3uOH
NH2 o
H
N
o
o o
(32)
N
(34)(33)o
o
N(3s)
o
l, tt
(36)
H
22
Chapter 1
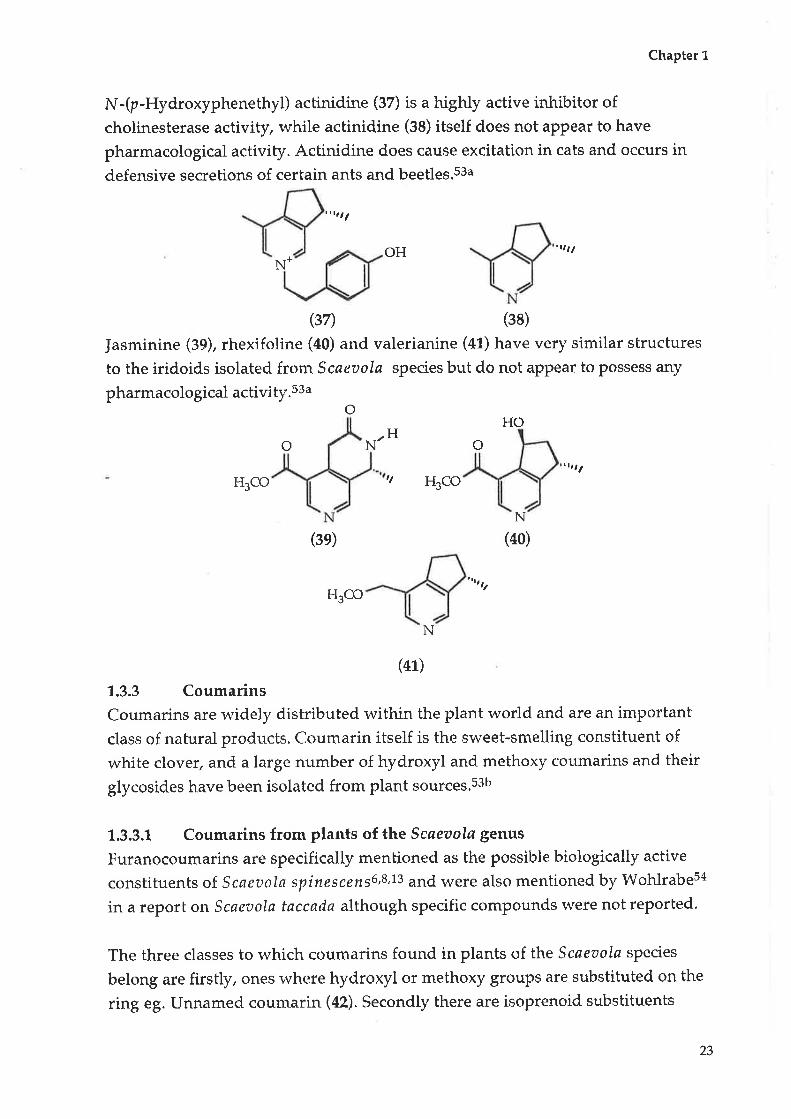
N-(p-Hydroxyphenethyl) actinidine (37) is a highly active inhibitor ofcholinesterase activity, while actinidine (3S) itself does not appear to have
pharmacological activity. Actinidine does cause excitation in cats and occurs in
defensive secretions of certain ants and beetles.s3a
'rtttl
,tttl
N*
(zz¡ (38)
Jasminine (39), rhexifoline (a0) and valerianine (a1) have very similar structures
to the iridoids isolated from Scaeztola species but do not appear to possess any
pharmacological activity.ssao
o N, o'ttt I
H3CO ,, HgCO
N(3e) (40)
H3CO
(47)
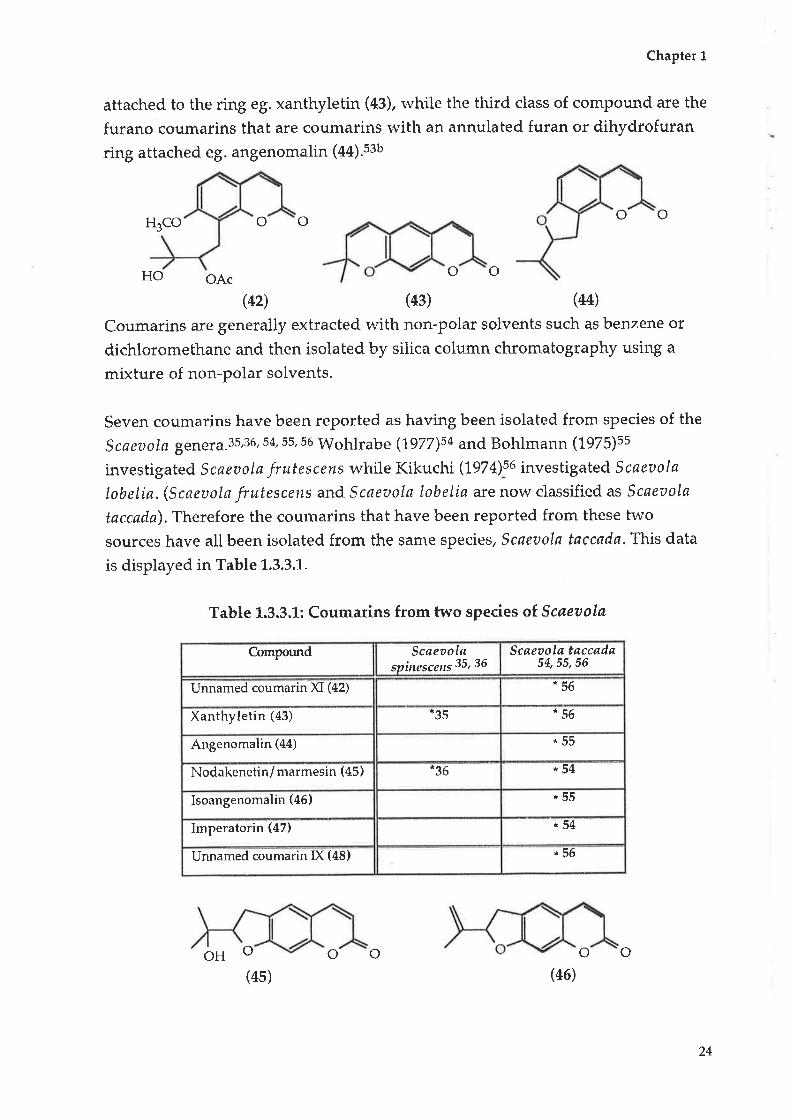
1.3.3 Coumarins
Coumarins are widely distributed within the plant world and are an important
class of natural products. Coumarin itself is the sweet-smelling constituent of
white clover, and a large number of hydroxyl and methoxy coumarins and their
glycosides have been isolated from plant sources.s3b
1.3.3.1 Coumarins from plants of the Scøevola genus
Furanocoumarins are specifically menbioned as the possible biologically active
constituents of Scae aola spinescens6,8,73 and were also mentioned by Wohlrabesa
in a report on Scaeaola taccadø although specific compounds were not reported.
The three classes to which coumarins found in plants of the Scøeaola species
belong are firstly, ones where hydroxyl or methoxy groups are substituted on the
ring eg. Unnamed coumarin (42). Secondly there are isoprenoid substituents
OH
HOH
N
23
Chapter 1
attached to the ring eg. xanthyletin (43), wlúle the third class of compound are the
furano coumarins that are coumarins rvith an annulated furan or dihydrofutan
ring attached eg. angenomalin (e+¡.seu
H3CO o o o o
HO OAco o
(42) (43) (44)
Coumarins are generally extracted with non-polar solvents such as benzene or
dichloromethane and then isolated by silica column chromatography using a
mixture of non-polar solvents.
Seven coumarins have been reported as having been isolated from species of the
Scaeaola gener¿.35,36,54, ss, s6 Wohlrabe (tgZZ)su and Bohlmann (L975)ss
investigated Scaeaolø frutescens while Kikuchi (1gZ+)s0 investigated Scaeaola
tobelia. (Scaeaola frutescens and Scaeaola lobelia are now classified as Scaeaola
taccada). Therefore the coumarins that have been reported from these two
sources have all been isolated from the same species, Scqeaola taccada. This data
is displayed in Table L.3.3.1..
Table 1.3.3.L: Coumarins from two species of Scøeaola
Compound Scaeoolsspìnescens 35, 36
Scaeaols taccada54, 55,56
Unnamed coumarin )([ (42) *56
Xanthyletin (43) *95 *56
Angenomalin (44) *55
Nodakenetin/ marmesin (45) "36 *54
Isoangenomalin (a6) i55
Imperatorin (47) *54
Unnamed coumarin D( (48) *56
o o(4s)
OH o o(46)
o
24
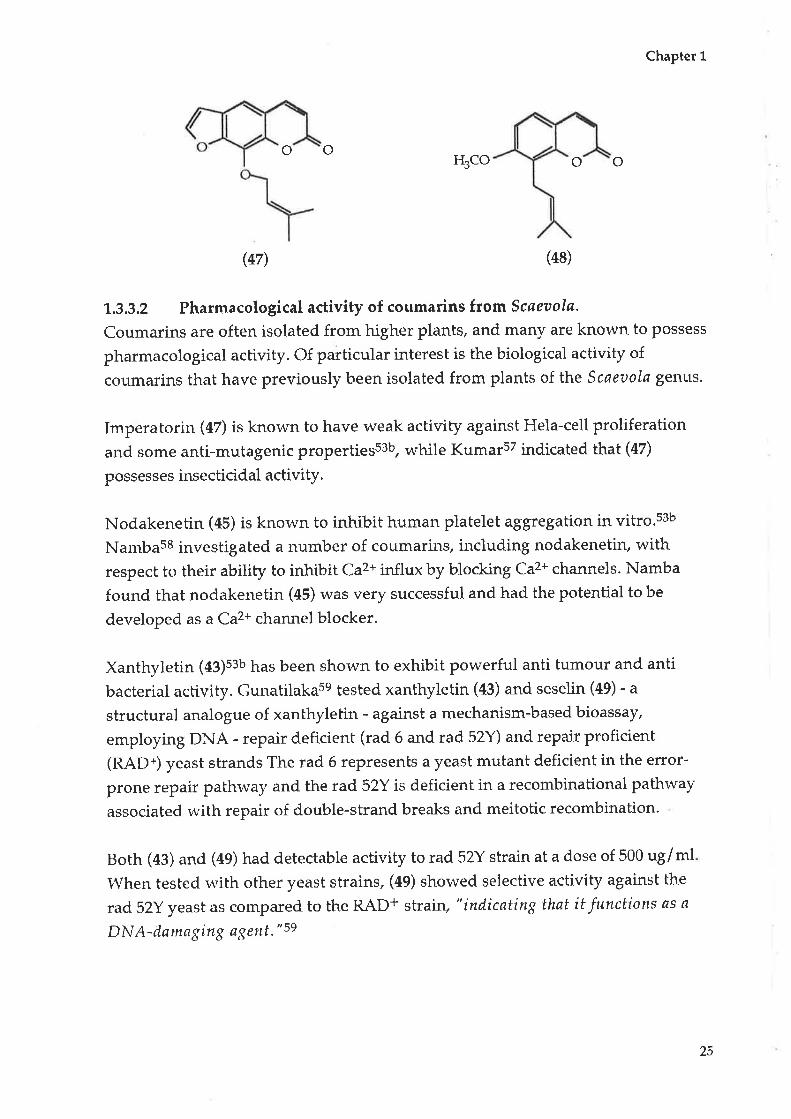
Chapter 1
o oH3CO o o
(47\ (48)
1.3.3.2 Pharmacological activity of coumarins ftom Scøevola.
Coumarins are often isolated from higher plants, and many are known to possess
pharmacological activity. Of particular interest is the biological activity of
cotrmarins that have previotrsly been isolated from plants of the Scaettola genus.
Imperatorin (a7) is known to have weak activity against Hela-cell proliferation
and some anti-mutagenic props¡¡isss3b, while KumarsT indicated that (47)
possesses insecticidal activity.
Nodakenetin (45) is known to inhibit human platelet aggtegation in vitro.s3b
Nambass investigated a number of coumarins, including nodakenetin, with
respect to their ability to inhibit Ca2+ influx by blocking Ca2+ channels. Namba
found that nodakenetin (45) was very successful and had the potential to be
developed as a Ca2+ channel blocker.
Xanthyletin (e3¡sau has been shown to exhibit powerful anti tumour and anti
bacterial acbivity. Gunatilaka-se tested xanthyletin (43) and seselin (49) - a
structural analogue of xanthyletin - against a mechanism-based bioassay,
employing DNA - repair deficient (rad 6 and rad 52Y) and repair proficient
(RAD+) yeast strands The rad 6 represents a yeast mutant deficient in the error-
prone repair pathway and the rad 52Y is deficient in a recombinational pathway
associated with repair of double-strand breaks and meitotic recombination.
Both (a3) and (4g) had detectable activity to rad 52Y strain at a dose of 500 ug/ml
When tested rn'ith other yeast strains, (49) showed selective activity against the
rad 52Y yeast as compared to the RAD+ strain, "indicating that it functions as a
DN A-dama ging agent. " 59
25

Chapter 1
o o
ìltt
(4e)
Takeuchi's investigations (1e01¡oo showed that xanthyletin (æ) exhibited a dose-
related increase in vertebral, carotid and femoral blood flow in guinea pigs, as
well as decreasing blood pressure and increasing heart rate. His results indicate
that seselin (a9) is a more effective analogue than xanthyletin (a3).
1.3.4 Fatty acids, lipids and hydrocarbons
Fatty acids, lipids and hydrocarbons are generally simple in strucbure and there
are a large number of different compounds found in the plant kingdom. Fatty
acids occur as the free acids, as esters with long alkyl chains (wàx esters) and as
glycerol esters.
They usually comprise a Clz - C2s hydrophobic tail with a carboxylic acid
functional group as the 'head', which then forms an ester with glycerol. If the
three fatty acids that bind to the glycerol are identical a'simple' triglyceride is
formed. However, if the fatty acids are different the more common'mixed'
triglyceride is formed. There are several hundred fatby acids that have been
isolated from plants, of which a few are consistently found.
i..9.4.1 Fatty acids,lipids anct hydrocarbons isolated from Scøeaolø species.
Palmitic acid- (50), oleic acid (51-) and hentriacontaine (52) have been isolated from
Scaeaola spinescens (lOO6¡20 while linoleic acid (1993¡e t (53) has been isolated
from Scaeaola taccada.
H3C-(CFIùu- COOH
(50)
H¡C-
H"C_(CH"),,H3C-(CH2)29-CH3 r ' z'a
(52)
(cHzF COOH
(s1)
(üIz)f COOH
(s3)
Bohlmann (L975)ss also reported a diene (54) from Scaeaola taccada.
H3C-(CH2)+:CHz(54)
26

Chapter 1
t.3.4.2 Pharmacological activity of fatty acids and hydrocatbons ftomplants of the Scaeoolø genus
Patmitic acid (50) is a major component of most fats and is therefore a constituent
of plant lipicts, It is a major component, for example, of palm oil. It is used as a
lubricant and as an emulsifyi.,g agenÇ but does not appear to possess any
pharmacological activity.s3c C)leic acid (51) is also widespread in vegetable fats and
oils and is used in assisting the absorption of drugs through ¡þs 51dn.s3c
Hentriacontaine (52) occurs in many plant rvaxes and is used in lipsticks and
other cosmetics, in chewing gum and as a protective coating for certain citrus
frui¡s.s3c Linoleic acid (53) occurs widely in plant lipids.
1.3.5 Flavonoids
There are a range of flavonoids that have been found widely distributed in plants
and are found as co-pigments to the anthocyanins in petals (to give the colour)
and in the leaves of higher plants.
Both the flavones and flavonols occuf as aglycones but they are often
glycosylated, with a wide range of glycosides. There are over 1.35 different
glycosylated compounds derived from quercetin- (SS).ss¿
OH
oHo(ss)
One technique used for the initial idenbification of flavonoids is that of using
their unique I-fV absorption, chromatographic mobility (TLC) and colour
reactions. These techniques are outlined in Harbourne.62
1.3.5.1 Flavonoids identified from Scøeaolø genus
Patterson (lg8+)es used the UV absorption and chromatographic characteristics of
flavonoids to investigate the adapbive radiation of seven species oÍ Scaeaola
found in the Hawaiian Islands. In most cases, adaptive radiation is investigated
using such factors as leaf size, leaf patterns, inflorescence and features of the
flower. Patterson, however, used the occurrence of secondary metabolites - in this
OH
OH
27
Chapter 1
case flavonoids - to attempt to outline the adaptive radiation of the seven species
of. Scaeaola found on different islands of Hawaii, as well as one hybrid species,
The eight species of. Scaeaolø studied are outlined in Table 1.3.5.1.1 along with the
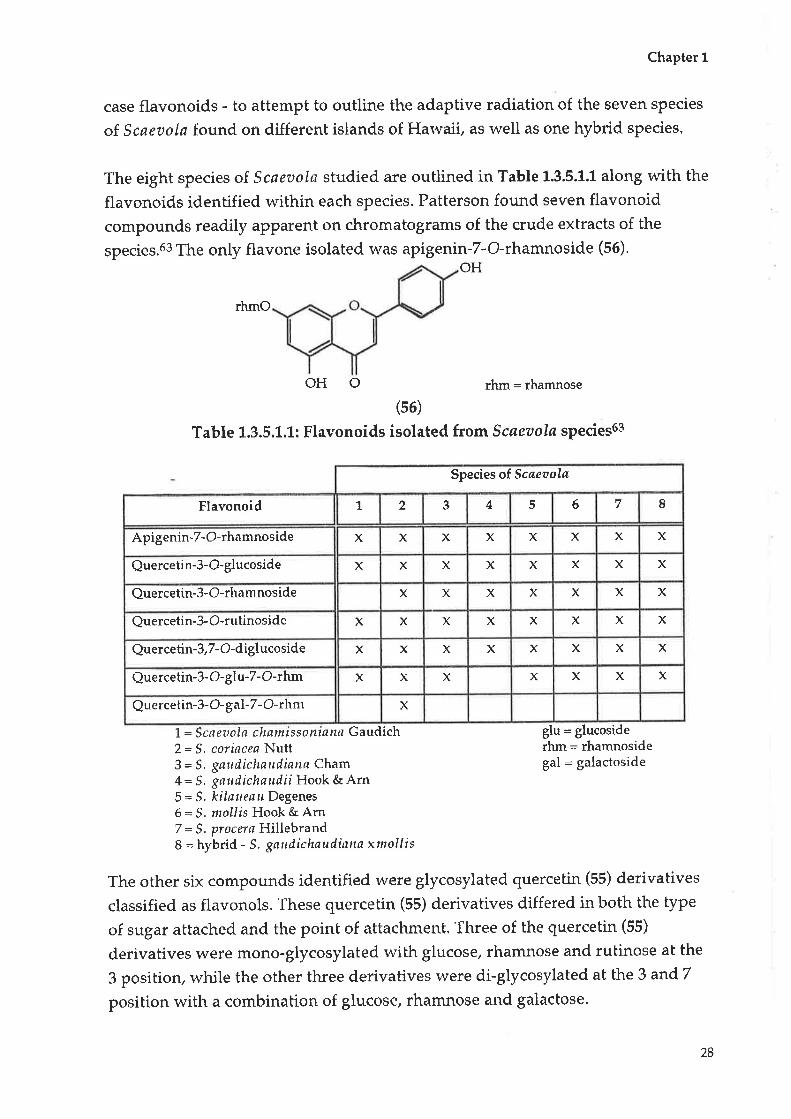
flavonoids identified within each species. Patterson found seven flavonoid
compounds readily apparent on chromatograms of the crude extracts of the
species.63 The only flavone isolated was apigenin-7-O-rhamnoside (56).
OH
rhmO
OH O rhm=rhamnose
(s6)
Table 1.3.5.1.1: Flavonoids isolated from Scaeaola species63
L=Scaeuola cha filt5so t71nt7ír Gaudich2=5, coríac¿a Nutt3 = S. gaudíchnudinna Cham4: S. gaudichaudii Hook & Arn5=5. kiløueart Degenes6: S. mollis Hook & Arn7 -- S. procerø Hillebrand8 = hybrid - S. gaudichtrudilt,ltl xrnollis
glu = glucosiderhm: rhamnosidegal: galactoside
The other six compounds identified were glycosylated quercetin (55) derivatives
classified as flavonols. These quercetin (55) derivatives differed in both the type
of sugar attached and tlì.e point of attachment. Three of the quercetin (55)
derivatives were mono-glycosylated with glucose, rhamnose and rutinose at the
3 positiory while the other three derivatives were di-glycosylated at the 3 andT
position with a combination of glucose, rhamnose and galactose.
Species of Scøeoola
Flavonoid 1 2 3 4 5 6 7 8
Apigenin-7- O-rhamnoside x x X x X x x x
Quercetin-3- O-glucoside x x X X X X x X
Quercetin-3- O-rhamnoside X x X X x X x
Quercetin-3- O-rutinoside x X X x x X X x
Quercetin-3,7- O-diglucoside x x x x x x X x
Quercetin-3- O- glu-7- O-rhm x x X X x x X
Querc e tin-3 - O - g al-7 - O - rhm X
28

Chapter 1
Patterson's data indicated that the flavonoid features are mote or less uniform for
the entire group, including the hybrid, even given a wide range of habitat
variation and morphological diversity.
1.3.5.2 Pharmacological activity of flavonoids from plants of the Scaeaola
genus
Many flavones and flavonols are biologically active in a range of ways
Apigenin (5,7,4'-trîhydroxylflavone) (57) has been shown to have anti bacterial,
anti inflammatory, diuretic and hypotensive activities. It has also been shown to
inhibit many enzymes and to promote smooth muscle relaxation. Apigenin-7,4'-
dimethyl ether (Sg) tìas both anti inflammatory and anti nuclear activities, while
in terms of glycosylated apigenin-bype flavones, apigenin-7-apiosylglucoside (59)
is an inhibitor of lens aldose reductase.s3dOH ocH3
oHo oHo(s8)
OH
OH apiglu : apiose-glucose
(se)
Quercetin (9,5,7,3' ,4'-pentahydroxyflavone) (SS) is considered to be the mosb
common flavonoid to be found in higher plants and has a range of
pharmacological properties. It is known to inhibit many enzymes, such as protein
kinase C,lipogenases,lens aldose reductase and 3', S'-cyclic adenosine
monophosphate phosphodiesterases. It is a radical scavenger and is also able to
inhibit smooth muscle contraction, It is known to be anti gonadotropic, anbi
inflammatory, anti bacterial, anti virat and shows some mutagenic activity and
allergenic properties.s3d
The glycosides of quercetin are also biologically active. Quercitrin (60) (quercetin-
$O-rhamnoside) has anti mutagenic, anti ulcer, anti viral, anti haemorrhage and
(s7)
29

Chapter 1
anti hepatotoxic activities, as well as anti bacLerial activity against Pseudomonas
rnaltophilia and Enterobacter cloacae. Quercitrin (60) is also knolvn to be a strong
inhibitor of lens aldose reductase.s3d
Rutin is the common name for quercetin-3-O-rutinoside (61) and it has a wide
variety of biological uses. It is used medicinally against capillary fragility and
varicosis. Rutin also exhibits anti viral and anti bacterial activities and it inhibits
lens aldose reductase and S-lipoxygenase.s3d
rhm: rhamnose OH rut: rutinose OH
OH
Orhm Orut
oHo oOH(60) (61)
Quercetin-3-O-galactoside (02) is also known as hyperin and has been knor¡¡n to
be a potent inhibitor of lens aldose reductase and it has anti bacterial activity
against Pseudomonas maltophilia.s3d Isoquercitrin (63) (quercetin-3-O-glucoside)
does not occur in the seven Scøeoola species tested, but is known to also inhibitlens aldose reductase as rvell as show anti bacterial activity against Pseudomonas
mattophitiaPsd Quercetin-7-O-glucoside (6a) is known as quercimeritrin and
appears to have no pharmacological properties (as reported in l{arbourne).saa
gal = galactose OH glu: glucose
OH
Ogul
oHo oHo(62) (63)
OH
OH
Oglu
30

Chapter 1
OH
OH
(64)
The types of glycosylated flavones and flavonols (in particular) which have been
found in the seven species of. Scaeaola from Hawaü indicate a range of biological
activities.
L.3.6 Terpenoids
There ate a.large number of classes of organic compounds, which are based on the
biosynthetic pathr,r.ay associated with the isoprene-repeating unit. Terpenoid
compounds are defined as a'group of natural products whose structure may be
divided into isoprene units ... (the) ... classification of the terpenes depends uponthe number of isoprene units'64 (monoterpenes - C1s, sesQuiterpenes - Crs,
diterpenes - Czo and triterpetìes - Cso).
1.3.6.1 Terpenoids isolated from species oLScøeoolø
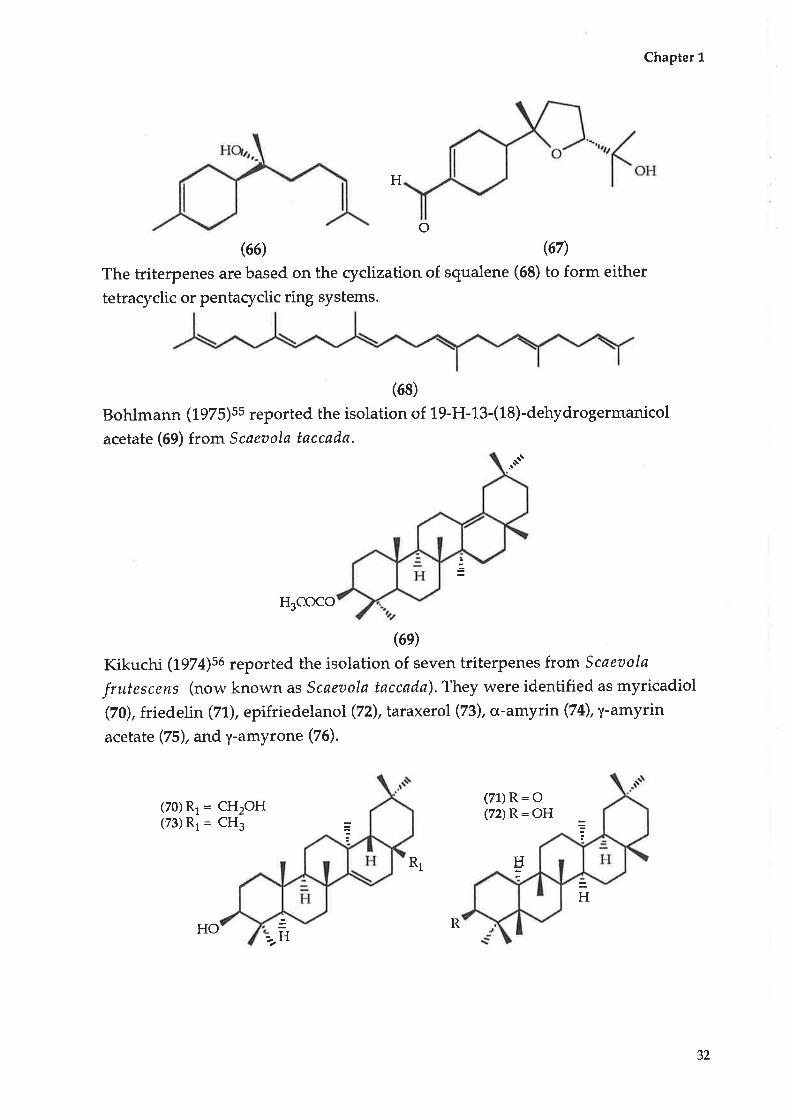
Bohlmanî,Ss in 1975, reported isolating a number of esters of the monoterpene
ferulol (65). He isolated them from Scaeaola lobelia, which has since been
systenratically named Scaeaolø taccada. However, no other infsrmation isavailable about which esters were isolated.
Kerr, Longmore and Yench (tggq):e report the isolation of two sesquiterpenes,
one of which is a novel compound, isolated from the methanol fraction of
Scøeuola spinescens. The two compounds are a-bisabolol (66) and scaevolal (67)
(7, L 0-epoxy- 1 1 -hydrobisabolol-3-en-1 S-al).o
H
OH
OH
OH
glu : glucose
(6s)
31
Chapter 1
H
o(66) ß7)
The triterpenes are based on the cyclization of squalene (68) to form either
tetraryclic or pentacyclic ring systems.
(68)
Bohlmann (1975)ss reported the isolation of 19-H-13-(18)-dehydrogermanicol
acetate (69) from Scaeaola taccada.
.at"
H3COCO
(6e)
Kikuchi (tgZ+\ss reported the isolation of seven triterpenes from Scaeaola
frutescens (now known as Scaeoola taccada). They were identified as myricadiol
(70), friedelin (71), epifriedelanol (72), taraxerol (73), a-amyin (74), y-amyrin
acetate (75), and y-amyrone (76).
(70) R1 : CH2OH(73) R1 : CHg
(71)R=O(72) R = OH
gR1
H
HHO R
32
H
Chapter 1
(74) (75) R = OAc(76)R:O
R
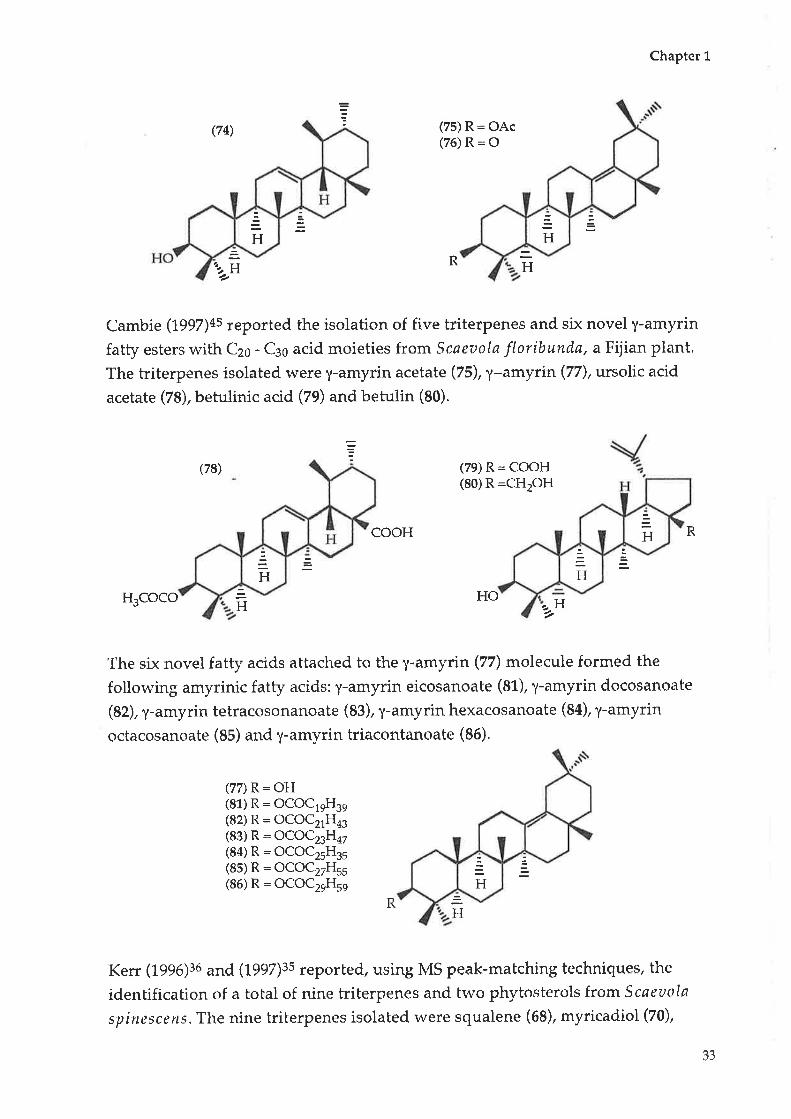
Cambie (1507¡+s reported the isolation of five triterpenes and six novel y-amyrin
fatty esters rvith Czo - Cso acid moieties from Scaeaola floribunda, aFijian plant.
The triterpenes isolated lvere y-amyrin acetate (75), y-amytin (77), ursolic acid
acetate (78), betulinic acid (79) and betulin (80).
Ha.H-¿
(7e) R: COOH(80) R:CHzOH
cooH
H3COCO H 2
The six novel fatty acids attached to the y-amyrin (77) molecule formed the
following amyrinic fatty acids: y-amyrin eicosanoate (81), y-amyrin clocosanoate
(82), y-amyrin tetracosonanoate (83), y-amyrin hexacosanoate (84), y-amyrin
octacosanoate (85) and y-amyrin triacontanoate (86).
(78)
R
HO H
(77) R = OH(81) R = OCOCleIl3e(82) R = OCOC21H43(83) R: OCOCæH47(84) R = OCOC25H35(85) R: OCOC27H55(86) R: OCOC2eHse
RH
Kerr (L996)3ó and (tggZ)ss reported, using MS peak-matching techniques, the
idenbification of a total of nine triberpenes and fwo phytosterols from Scaeaola
spittescens. The nine triterpenes isolated were squalene (68), myricadiol (70),
H
H
H
H
H
33
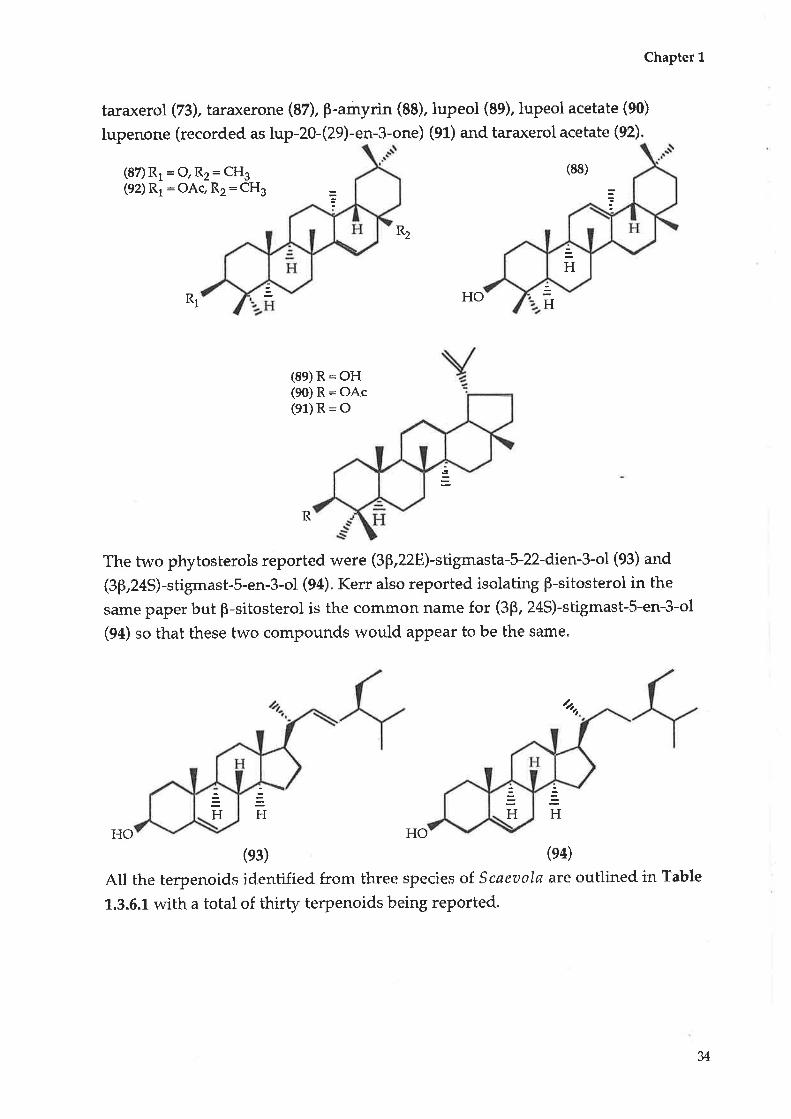
Chapter 1
taraxerol (Zg), taraxerone (82), P-amyrin (88), lupeol (89), luPeol acetate (90)
lupenone (recorded as lup-20-(29)-en-3-one) (91) and taraxerol acetate (92).
(87) R1 = O, RZ = CH3(92) R1 : OAc, Rz: CHs
(88)
R1
(89) R = OH(90) R= OAc(e1)R: O
The two phytosterols reported were (3þ,228)-shigmasta-5-22-dien-3-ol (93) and
(3p,24S)-stigmast-5-en-3-ol (94). Kerr also reported isolating p-sitosterol in the
same paper but B-sitosterol is the common name for (3p, 24S)-stigmast-5-en-3-ol
(94) so that these two compounds would aPPear to be the same.
HO HO
(e3) (e4)
Atl the terpenoids identified from three species of. Scaeaola are outlined in Table
1.3.6.1. with a total of thirty terpenoids being reported.
HHO
R2
R
4
HH
H
H H
v

Table 1.3.6.1: Terpenoids from thtee species olScaeaola
Chapter 1
Scaeuolø
taccada sPûtescerts florìlnnda
Monoterpenes Esters of Ferulol (65) *55
Sesquiterpenes a-Bisabolol (66) "38
Scaevolal (67) *38
Triterpenes: Squalene (68) *35 *36
19-H,13(18)dihydroxygermanico I acetate (69) *55
Myricadiol (70) *56 .35 *36 *38
Friedelin (7L) *56
Epifriedelanol (72) *56
Taraxerol (73) '56 *35 "36
c¿-Amyrin (74)*56
1-Amyrin acetate (75)*56 *45
y-Arnyrone (76)*56
1-Amyrin (77)*36 *45
Ursolic acid acetate (78) *45
Eetulinic acid (79) *45
Betulin (80) *45
1-Amyrin eicosanoate (81) '45
1-Amyrin docosanoate (82) "45
^¡-Amyrin tetracosanoate (83)*45
1-Amyrin hexacosanoate (84) "45
1-Amyrin octacosanoate (85)*45
1-Amyrin triacotanoate (86)*45
Taraxerone (87) *35 *36
þ-Amyrin (88) óo
Lupeol (89) *35 *38
Lupeol acetate (90) *35
Lupenone(91) *35
Taraxerol acetate (92) *35 *36
Phytosterols: Stigmasterot (93) *36
Ê-sitosterol (94) "36
*35 : reference in the literature
JJ

Chapter 1
1.3.6.2 Pharmacological activity of terpenoids isolated from species of
Scaeoolø
In December of 1996 Kerr, Longmore and Betts36 identified a number of
pentacyclic triterpenoid compounds isolated from Scaeaola spincscens. They used
the GC-MS technique with peak matching of libraries of MS dat+ and hence were
able to identify previously isolabed compounds. These compounds were isolated
from non-polar fractions.
They identified myricadiol (70) as the major component of their fractionahion
process, yielding 0.56% of the dry weight of the plant. They state that this is
considerably higher than the yield of myricadiol (70) in other species. Kerr,
Longmore and Betts therefore have postulated the use of the compound withinthe plant as a potential anti cancer drug.36
Kerr (L999)38 reported the testing of extracts from Scaevola spinescens for possible
anti microbial activily against Bøcillus subtilis and other representative micro-
organisms, as well as investigating the extracts for their ability to inhibit tumour
formation in the potato Crown Gall tumour (CGT) assay . Thís assay indicates
anti tumour activity of test compounds by their inhibition of the formation of
characteristic crown galls induced in wounded potato tissue by the organism
Agrob act erium tumefaciens.
The results of the CGT assay indicated that the mosL active fraction was a freeze-
dried aqueous extract of 68.8% (percentage inhibition of tumour formation) while
myricadiol (70) and scaevolal (67) had an inhibition of 53.2% and50.0%
respectively (concentrations of. (67) and (zo) are not given).
The results for the anti microbial tests indicated that cr,-bisabolol (66) and
scaevolal (eZ) displayed inhibitory activity against B. subtilis although the
individual results are not recorded as the sample tested. was a mixture.
Their overall conclusion was that the most significantly active comPounds in the
CGT assay included scaevolal (67), myúcadiol (70) and lupeol (89). Kerr also
reported that these three terpenoids, as well as a-bisabolol (66), were also mildly
inhibitory against Bacillus subtilis, but not in the presence of tetrazolium red (a
redox chromogenic reagent u^sed to visualise live bacterial cells and colonies).
Kerr (1996)3s also reported the isolation of the following compounds from
Scaeaola spinescen>- - sQualene (68), myricadiol (70), taraxerol (73), tarcxerone
36
Chapter 1
(87), lupeol (89), lupeol acetate (90), lupenone (91) and taraxerol acetate (92) and
that these compounds exhibited the following:"Bioactiaities, wlrcre preuionsly reported include the followittg: mineralocorticoid, bdctericidal,
immunostimulatory, øttti tunnur, anti ulcer, gastric ønti secretory, andhypotensiae actiaities"'
He also suggested that the results of screening on the US National Cancer
Institute (NCI) tumour panel assay provide evidence:
"Itt sttpport of the anecdotal reputation of Scaeuola as a medicinnlly actiue, potentially important
carTcer chemotherapeutic agent or source tmterial."
There are many reports on the biological activity of terpenoids that have been
isolated from Scaeoola species. Table t.3.6.2gives a sunmary of the types of
biological activity associated with the terpenoids isolated from Scaeaola
specie5.53e
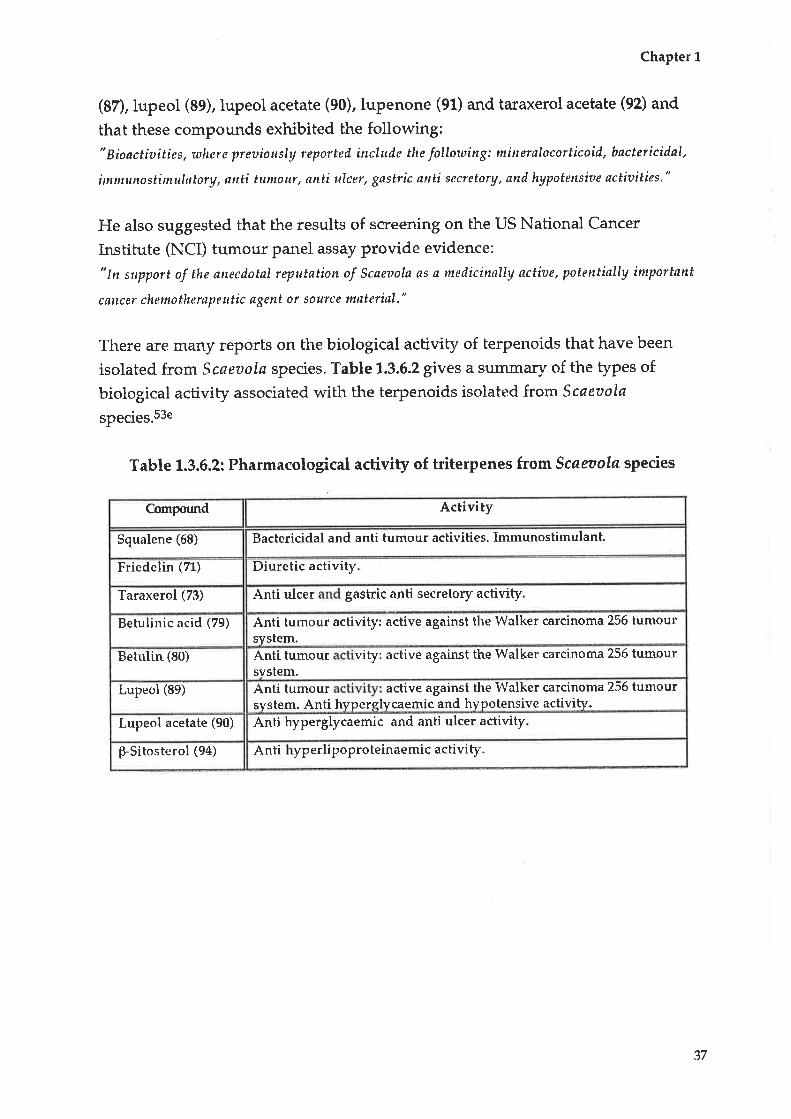
Table 1.3.6.2: Pharmacological activity of triterpenes from Scaæola species
Compomd Activity
Squalene (68) Bactericidal and anti tumour activities. Immunostimulant.
Friedelin (71) Diuretic activity
Taraxerol (73) Anti ulcer gastric anti secretory activity
Betulinic acid (79) Anti tumour activity: active against the IValker carcinoma 256 tumoursystem.
Betulin (80) Antitumour vity: active against the Walker carcinoma 256 tumoursystem.
Lupeol (89) Anti tumour active against the Walker carcinoma 256 tumou¡system. Anti hyperglycaemic and hypotensive activity.
Lupeol acetate (90) Anti hyperglycaemic and anti ulcer activity
þSitosterol (94) Anti yperlipoproteinaemic activi by.
37
Chapter 2
CHAPTER 2 GENERAT PROCEDURES
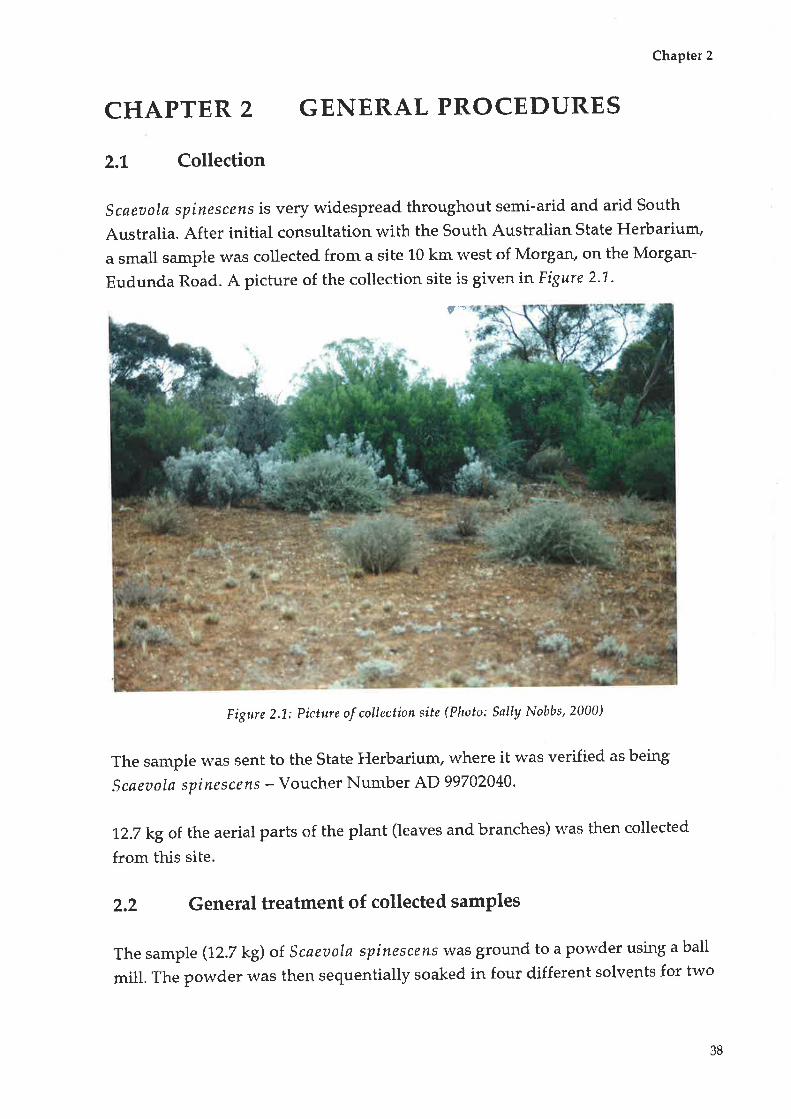
2.1 Collection
Scøeaola spinescens is very widespread throughout semi-arid and arid South
Australia. After initial consultation with the South Australian State Herbarium,
a small sample was collected from a site 1-0 km west of Morgan, on the Morgan-
Eudunda Road. A picture of the collection site is given inFigure 2.1'.
qta
Figtre 2,'L: Picture of collection site (Plrcto: Sally Nobbs,2000)
The sample was sent to the State Herbarium, where it was verified as being
Scaeaola spinescens - Voucher Number AD 99702040.
L2.7 kgof the aerial parts of the plant (leaves and branches) was then collected
from this site
2.2 General treatment of collected samples
The sample (I2.7 kg) of Scaeuola spinescens was ground to a powder using a ball
mill. The powder was then sequentially soaked in four different solvents for two
38
Chapter 2
weeks each. Initially it was soaked in hexane, then ethyl acetate, then methanol
and finally \^,'ater. The solvents lt'ere removed using a cyclone evaporator.
The methanol fraction was then subjected to separation by flash chromatography,
which is outlined in Chapter 3 in more detail.
Each fraction initially isolated was analysed to determine its purity by TLC - either
under LIV tight or by using specific reagents. A series of TLC plates were used to
follow the elution of compounds from the flash columns (using silica) as in
normal procedure.
Flash chromatography was conducted on the crude fractions, with continual
fractionation until such time as the samples appeared pure (1 dot on TLC under
at least two different solvent conditions).
It r,vas often necessary, initially, to use large scale flash chromatography (up to 150
g) and a useful reference for large-scale chromatographic techniques is to be found
in Claesonos that deals lvith samples up to 200 B. Stillea lvas also informative indetermining optimum conditions for large scale flash chromatography.
Preparative TLC plates were also used when the compounds to be separated
(a) rn'ere stable
(b) could be removed off the silica
(c) rvere UV active(d) were separated by L cm on the plate and
(e) if there was between 5 - 10 mg of sample to be separated.
If there was sufficient sample (>50 mg) recrystallization techniques were used to
purify the sample. The melting point (MP) of the crystals rvas then meastred and
purity assigned if the MP range was very sn'rall. However, if there was less than 50
mg of sample, th-is step was not attempted until a-l-l specbroscopic exPeriments had
been completed anct a final structure had been deduced.
If there was less than 50 mg of sample, or if the sample would not erystalLize,
analytical HPLC - either normal or reverse phase, depending on the compound's
polarity - was used to analyse the purity of the sample. UV detection was by fixed
lvavelength. The sample was deemed to be pure if it was one peak under at least
two different solvent conditions - not only different solvents, but also using
gradient conditions.
39

Chapter 2
Analytical and reverse phase HPLC was also used to purify mixtures, with the
aim being the development of a particular solvent protocol so that the
compounds to be separated would elute with at least a one minute gap between
each peak.
Semenova6T was very useful in determining optimum HPLC separation
conditions (reverse phase HPLC, using methanol/water gradient systems) for a
number of separations.
A chloroform/methanol/water extraction was used on a number of the more
polar extracts, as a means of removing non-polar compounds r,vith the resultant
water extract subjecked to reverse phase HPLC.
All solvents were distilled before use with drying and purification of solvents
and reagents performed using standard laboratory procedures.68'6e
2.3 Structure determination
Once a compound was isolated its purity was assessed by consideration of the
following criteria:(a) the compound having a narrow melting point range
(b) the compound being one peak on analytical HPLC (under at least tn'o different
solvent conditions) or(c) the compound being one spot on TLC (under at least two different solvent
conditions).
A range of spectroscopic experiments was then conducted, in a reasonably set
order. A major factor to consider was the amount of sample purified, as this
would determine the order in which certain functional group tests were
conducted. If over 50 mg of sample was isolated and purified, then the order of
spechoscopic analysis was not imporbant, as the fear of loss of eompound was not
as evident. Hor,vever/ many of the samples that were separated were less than 10
rng and the following order of testing was adopted:
1. UV absorption
2. All NMR experiments that were necessary
3. MS analysis
4, Optical Rotation
5.Infra Red
6. Melting point (if possible)
40
Chapter 2
2.3.1 UV and visible specttum
Some classes of compounds, such as the flavonoids, carì be identified using onlytheir UV spectrum, although this usually applies to known compounds. This is
the technique that n'as used by Patterson63 to identify the flavones and flavonols
that were present in eight species of Scaeaolø found on the Hawaiian Islancls, anc{
is based on the knorryn chromophore for a particular compound (see Chapter
1.3.5.1), Harbourne62 is used as the reference for this type of identification. The
chromophore for flavones, flavonols62 and coumarins70, Íor example, is quite
diagnostic for the general structure.
UV is a simple technique that does not use much sarnple (1 mg in 100 mL) and
the sample is recoverable. It relies upon the excitation and relaxatiou of electrons,
generally between a bonding or lone-pair orbital and an unfilled non-bonding or
anti-bonding orbital. The wavelength of absorption will be a measure of the
energy level separation of the orbitals concerned and will be unique for diffetent
natural products. The resulting chromophore can be analysed to debermine the
types of functional groups present.
The 1.,r.,... (the wavelength of ultra violet light that gave the maximum
absorbence) of a mixture and of a pure sample was routinely recorded to aid insetting the detector wavelength when doing HPLC.
UV was also used rvhen analysing TtC plates (preparative or analytical) to follow
the position of a sample if it rryas UV active.
2.3.2 Ntrclear Magnetic Resonance
The University of Adelaide has available Nuclear lvlagnetic Resonance
Instruments operating at 200 MHz,300 MHz and, most importantly for this field
of study, at 600 MFIZ. This has made the analysis of very small quantities of
material possible.
There are many different experimenbs that can be used. What is germane to this
thesis is the order and the use of different pulse sequences to tl're analysis and
structure determination of natural products. There was a set order in both
acquiring NMR data and in using the raw data to identify compounds and this is
outlined in Table 2.3.2|1. (on the next page).
41
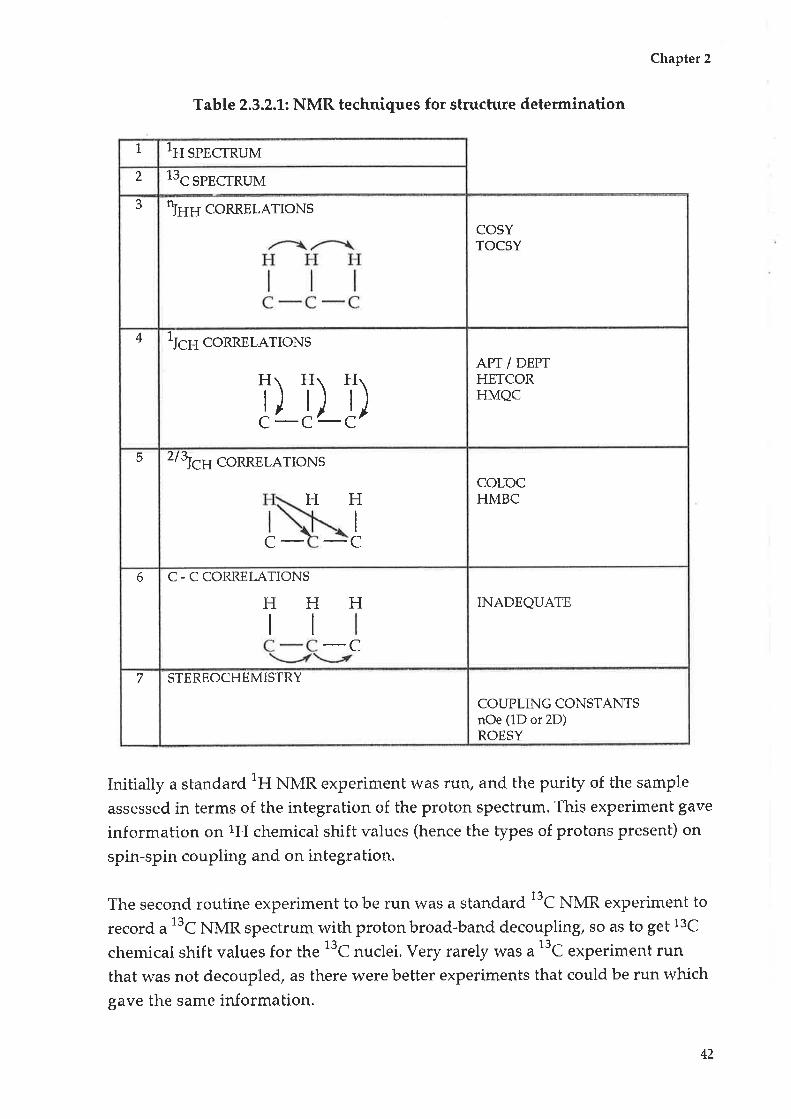
Chapter 2
Table 2.3.2.1: NMR techniques for structute determination
1 1u sPrgrRuvt2 13c spnsrnuvtJ Ïnn CORRELATIoNS
COSYTOCSY
4 1¡6s CORRELATIONS
LÏLi)APT / DEI'THETCORHMQC
5 2lTc+CORRELATIONS
HH
C-I
C
COLOCHMBC
6 C - C CORRET-ATIONS
HH H INADEQUATE
7 STEREOCHEMISTRY
COUPLING CONSTANTSnOe (1D or 2D)ROESY
Initially a sbandard tH NMR experiment was rury and the puriby of the sample
assessed in terms of the integrabion of the proton spectrum. This experinrent gave
information on 1FI chemical shift values (hence the types of protons present) on
spin-spin coupling and on integration.
The second routine experiment to be run was a standard t3C NMR experiment to
record u t3C NMR spectrum with proton broad-band decoupling, so as to get 13C
chemical shift values for the 13C nuclei. Very rarely was a t'C .*p.timent run
that was not decoupled, as there were better experiments that could be run which
gave the same information.
42
Chapter 2
The next step was to establish the nJHH correlations between the protons present inthe standard 1H spectrum. Although coupling constants and line widths gave
information concerning adjacent protons, in many cases the spin-spin coupling
inJormation was obscured by overlapping multiplets, and a COSY experiment
was usually much more informative.
The COSY (eQrrelation$pectroscopY) pulse sequence generated a 2D NMR
spectrum, so that 1H NlvtR signals were correlated against each other and cross
peaks were formed if spin - spin coupling was present. It rvas also possible to
determine long range COSY correlations by changing the normal pulse sequence
of the COSY experiment by inserting an additional fixed delay before and after the
second radio frequency pulse.
gCOSY experiments using pulse field gradients were an advantage because they
collected data in a much shorter period of time than routine COSY experiments.
Even more advanced and effective were DQF-COSY pulse sequences lDouble
Quantum Filteredl which had the added advantage of giving good solvent
suppression. The TOCSY in principle gave a total correlation of all protons of a
chain with each other,
Once 1H - 1H correlations had been establislrecL the next step was to d.etermine 1Jç¡1
correlations. If sufficient material was available then an APT or DEPT experiment
could be run to determine the multiplicity of the 13C spectrum. However, this is
time consuming, considering the inherent insensitivity of t3C .*p..iments (due
to the low natural abundance of 13C¡ and other experiments gave the same
inJormation in a quicker time.
The experinr.ents of choice were the HMQC and gHMQC. These two experiments
correlated a selected carbon with its attached proton by one bond C, H coupling.
As these experiments r,vere inverse detected techniques (that is, it is the tH
nucleus that is observed rather than the 13C nucleus), they l\,ere considerably
more sensitive than c{irectly detectecl experiments such as HETCOR. This allowed
for each protonated carbon to be assigned and therefore it was also possible,
assuming u t'C spectrum had been run, to determine quaternary carbons as well.
HMQC stands for Heteronuclear 
Chapter 2
small amount of time. It rvas also possible to use an HSQC experiment when the13C NMR spectrum w'as particularly crowded.
Once the 1Jç¡lcorrelations had been established, then it was possible to observe2¡gI{ and 3IcH correlations by the use of COLOC, HMBC ancl gHMBC pulse
sequences. To observe 2]cn or 3IcH correlations it was necessary to suppress any1¡6¡1 .orr.lations. It was possible to achieve this aim by changing the time delays
of the pulse sequence. The original experiments of this bype \,\¡ere dependenb on13C sensitivity and so needed a large amount of sample or a large amount of time
COLOC (eQrrelation spectroscopy via LQng range Coupling) incorporated the 1H
chemical shift information into the earlier signals, but still relied upon the
observed nuclid.e being 13C and. so was not very sensitive.
The HMBC (Heteronuclear Multiple Eond eorrelation) was a pulse sequence that
was able to sup¡'rress lIcr+ correlations, while being an inverse FI,X correlation
experiment in which the proton signal was used to d.etermine the 13C data, thus
being much more sensitive and therefore less time consuming. The gHMBC
experiment also gave 2Jç1 and 3¡ç¡1 .orr.lations, usually lvith better results in a
fraction of the time taken for the HMBC.
Although there are NMR experiments that give 1Jçç correlations(INADEQUATE), the inherent insensitivity of 13C spectroscopy meant that it vvas
not possible to use these experiments on samples rvith a small amount of mass.
Flowever, by establishing nJrro tJ.",2]cl-r and 3¡o-1
"o.."lations it rvas possible to
determine the strtrcture of the natural product, with the next step being the
establishment of the stereochemistry of the molecule.
Coupling constants lvithin the spin-spin relationship in the tH NIvIR spectrum
were useful, not only for establishing nJ¡¡¡¡ relationships but also in establishing
stereochemistry and eonformation if the coupling eonstant value could be
determined. The Karplus equabion was then used as a guide to debermine the
stereo relationships between adjacent protons. Not all coupling constant values
were recorded as some overlapping muttiplets macie it difficult to determine the
actual coupling constant value.
nOe (nuclear Overhauser effect) spectroscopy lvas used to determiue stereo
chemical problems that arose if there were no suitable coupling constants
M
Chapter 2
observed. nOe correlations indicate protons that are close in space but not
necessarily adjacent to or even close to each other in terms of bonding.
The NOESY is a 2 dimensional version of the nOe experiment and gave
correlation signals that were due to nuclei in a close spatial relationship, ie. they
were correlations bhrough space, not via bonds. The ROESY experiment gave
similar information. When considering the data of a ROESY experiment it was
important to realise thab the ROESY may also show tH - 1H correlations that are
visible in the COSY experiment, and that these correlations may be through
bonds, between protons that were adjacent to each other and so should be ignored
in terms of other spatial correlations.
The last NMR experiment that could be run roubinely was a D2O exchange
experiment, which removed. any exchangeable signals from the 1H spectrum.
This often mad.e the 1H spectrum easier to anaþse, but may have had the
resultant disadvautage of a large water peak appearing in the specbrum.
All these techniques and the theory of NMR spectroscopy have been covered in
many publications in greater depth. Of particular use (assuming the NMR
instrument has the capaciby to run advanced pulse sequences) were Braurç
Kalinowski, and Berger - "100 and more Basic NMR Experimertts"Tl, Derome's
"Modern NMR techniques for chemistry reseatch"TT and Sanders and Hunter's
"Modern NMR spectrosco py",7 3
"Carbon-L3 NN4R Spectroscopy"T4 by Breitmaier and Voelter was a very good.73nsummary or u spectrum, with analysis of the 13C spectrum of different classes of
natural products, including coumarins, flavonoids, triterpenes and sugars and
was an excellent reference.
2.3.3 Mass spectrometry
Once all NMR spechral data had been collected and a tentative structural
assignment hadbeen achieved, a small amount of the sample was sent to the
Central science Laboratory at the University of Tasmania for an acfllrate mass
(HRMS) measurement so that the molecular formula could be determined.
The molecular formula r,t¡as then used,, in conjunction with the 1H and t'C NMR
spectral data to determine the double bond equivalents (DBE) and therefore
whether double bonds and/or ring systems were present in the molecule.
45
Chapter 2
Other information could be determined from the mass spectrum obtained for
each sample, The mass spectrum could be compared to those of known
compounds, as there are a number of MS "libraries" and peak matching
techniques allow for the assignment and structure determination of known
compounds.
Fragmentation patterns and metastable ion formation could also be analysed, but
by far the most important information to be gained from lvIS analysis was the lvl+
and hence the molecular formula.
Usually, the acquisition of the M* was only obtained when all NMR spectroscopy
had been completed and was essentially only used bo establish the molecular
formula. The NMR data and MS data were used to determine the structure of the
natural product, with the UV spectrum being recorded mainly as a tool to help in
purification.
2.3.4 - IÇ optical rotation and MP
The IR, optical rotation and MP were then recorded where possible. IR was used
to confirm the presence of functional groups.
The UV, IR, [aþ, MS and MP values were very important when a comPound that
was isolated appeared to be a previously recorded natural product. These values
were compared to the recorded literature values.
46
Chapter 3
CHAPTER 3 CRUDE EXTRACT
3.1 Extraction, separation and purification of compounds from72.7 kgof Scøeaolø spinescefls.
I27 kg of. Scaepola spinescens tvas cut up and masticated to a powder, using a
grinder and a ball mill. The sample r,vas then placed into four large containers
and a total of 80 L of solvent, rvhich had been distilled" was added to the four
containers (20 L each container) and left to steep for two weeks. The solvents bhat
were added to the container \,vere, sequentially, hexane, ethyl acetate, methanol
and water.
For each solvent the resultant solution was drained from the four containers and
the solvent removed using a cyclone evaporator, leaving a residue. The hexane,
ethyl acetate and water residues were stored under nitrogen. The methanol
extract was then subjected to a series of sbeps to isolate orgarúc compounds.
A total of 828 g of the methanol extract was then subjected to flash
chromatography in seven separate columns. Each of the seven flash
chromatography columns used the same sequential solvent system, starting from
90% hexane 170% ethyl acetate through to 50% ethyl acetate/ 50% methanol. The
flash column used was 14 cm in diameter; 200 g of silica was used in each of the
columns. The extract was pre-loaded onto silica and 2 L of each solvenb r,vas used
for each elution (4 column volumes). Table 3.1.1 indicates the amount of the
methanol extract loaded onto each of the seven separate columns.
Table 3.1.1: Mass of methanol extract per flash column
Flash
columnMass of methanol
extract (g)
1 50
2 130
J 120
4 120
5 1.44
6 722
7 124
TOTAL 828
47

Chapter 3
Each of the seven columns underwent the same solvent elution sequence and
the equivalent fractions from each column were then combined. Inibially, 2L o1
90% hexanell.0% ethyl acetate was run through the column and a total of 5 g was
collected (after the solvent was removed). This crude fraction was labelled
Fraction L. T'he next nine fractions, the eluting solvents and the total mass of each
fraction (when all seven columns were combined) are outlined in Table 3.7.2-
Table 3.1.2: Solvent system for extraction of 828 g of the methanol fraction
Fraction Eluting solvent Mass combined (g)
1 90% hexane I 10% ethyl acetate 5
2 75% hexane 125% ethyl acetate 26
3 50% hexarte I 50% ethyl acetate LI
4 100% ethyl acetate T4
5 99% ethvl acetate/ 1 % methanol 4
6 98/, etlnyl acetate / 2% methanol 3
7 95% ethyl acetate/S% methanol L6
I 90% ethyl acetate/10% methanol 23
9 75% et]rryl acetate/25% methanol 75
L0 50% ethyl acetate/S0% methanol 2L0
This extraction process is also displayed in the following flow chart (Diagram
3.1.1),
Diagram 3.1.1: The separation pfocess of 828 g of the methanol extract.
828 g of cmde methanol extract
Flash ch¡omatography,silica, 120 g, preloaded
Sequential solvent system,90% hexane I 10% ethyl acetateto 50% ethyl acetatel 50% methanol
F.1
\o-óF,2
26eF.3
t1gF,6
3gF.7
169F,10
21.0 gF.4 F.5
749 4gF.8 F.9
239 75g
All crude fractions were tested with Meyers reagent6e to determine whether there
were any alkaloids present. All tests were negative.
48
Chapter 3
Fractions 1,3-9 were then subjected to a range of separation techniques, including
prep TLC, flash chromatography, HPLC and recrystalisation, leading to the
isolation of eighteen pure compounds.
' Fraction 1 yielded four pure compounds. They were labelled Compound A,
Compound B, Compound C and Compound D. The cliscussion of their
structure determinations are outlined in Chapter 4.
. Fraction 2 has not been anaþsed to date.
. Fraction 3 yielded one pure compound, Compound E, and this compound is
discussed in Chapter 5.
. Fraction 4 contained tlvo purified compounds (Compounds F and G) and
these compounds are discussed in Chapter 6.
e I whibe crystalline solid was isolated from Fraction 5 and labelled Compound
H. It is analysed in Chapter 7.
r Fractions 6 and 7 were combined as they had very similar TLC profiles. This
fraction was relabelled Fraction 7. Four pure compoullds (Compounds I to L)
were isolated and these are outlined in Chapter 8.
. Fraction 8 yielded three pure compounds - Compounds M to O (Chapter 9)
. Fraction 9 yielded Compounds P and Q (Chapter 10).
. Fraction L0 has not been analysed to this date.
Each of the compounds purified rvas r,vritten up in a consistent manner as
outlined in the following section, Chapter 3.2.
3.2 Anaþsis and write up of purified compounds
Initially, an explanation of the initial treatment, which restrlted in the separation
and purification, will be given, along with a flow chart to explain each step. Then
the derivation of each of the structures of the purified compounds will be
outlined.
The mass spectral data in the form o-f the M+ value - experimental (ealeulated
value, + | - difference) will be given, along with the molecular formula. The
molecular formula will then be analysed for double bond equivalents (DBE). Any
useful fragmentation patterns from the MS willbe analysed and a mass speetral
peak matching process r,vill be routinely conducted. Any IR, UV or melting point
data will be given.
The proposed structure will be given, with carbons labelled according to the
standard numbering system for the particular type of compound.
49
Chapter 3
If the structure is a known compound then a brief d.esctiption of the spectral data
will be given. \ /ith a novel compound or where stereochemical or
conformational analysis is required a more detailed analysis of the structure
determination will be presented. A summary of the occurrence of the compound
in Scaertola spinescens and in the Scaeuola genera lvill be given,
A table outlining all data - 13C chemical shift values, HMQC correlations to
respective protons, the lH chemical shift values, COSY correlations nOe
correlations and HMBC correlations - will be displayed. This method is outlined
in Table 3.2.1.
Table 3.2.1: Example of Table of NMR data#
600 MHz ( H), 150 MHz 3C) : O (ppm) from internal TMSìn CDïï,f.rr,r'rr.r"I: Integration
Any non-protonated carbons will not show up in an HMQC spectrum, but they
can be deduced by comparison with the routine 13C NMR experiment, rvhere they
do appear. Protons, which are not directly bonded to a carbon" will also be
determined by comparison of the routine 1H NMR data vrith the HMQC data.
Each individual COSY correlation ("JHn) spin system willbe outlined" where
necessary, and this will be illustrated using the following type of spin map
showing atl COSY correlations (see Eigure 3.2,1).Hru
--Hzu - H¡
| "'/ t
t ,/:, I
Hru - Hzu
Figure 3.2.1: Diagram illustrating COSY spin systems
The l]cu correlations established by the HMQC experimenbs rvill be aclded to the
COSY spin system information to form a part strucbure (see Figure 3.2.2).
H ò¡¡ I Mult. J values HMBC nOec ðc
H2H1 7.685 1, dd 2.4,8.0 cz,CzC1 125.2
ct, c3 H1114.5 H2 6.962 1 d 8.0C2
H3 7.2M 1 d 2.4 ct,czC3 112.4
50

Chapter 3
Cq: quaternary
Figure 3.2.2: Dingram of llCn correlations of COSY spin systems to giue a part structure
The part structures and any non-protonated carbons, or any protons not bonded
to a carbon, will be connected via ''tl.tcorrelations established. using either an
HMBC or gHMBC experiments.
Tlús bonding will be illustrated (where rìecessary) by using bold lines to indicate
the bond(s) connecting the proton under consideration to the carbon to which ithas a
2/3!ç¡lconelation. The proton and carbon will also be in bold. The HMBC
correlations will be outlined as shown below. In this exaûlple, Hlu has an HMBC
correlation to C3 (see Figure 3.2.3).Hru Hzu
ca
Hr¡ Hzu O\^
^ ce = quaternary
Figure 3.2.3: HMBC correløtions in bold.
Stereochemistry and eonformation will be determined by use of coupling
constants, initially, and by using nOe data established by conducting NOESY and
ROESY experiments, where required. The stereochemistry will be illustrated
using connecting lines. This is illustrated inFigure 3.2.4.In this compound, most
methyl protons can be assigned as on the same side of the ring of a pentaryclic
compound due to the extensive nC)e correlations that were observed.-*7 M"zs
4'7+
HOMez¿
Figure 3.2.4: lllustratiott of stereochemistry
The final structure of the compound will then be illustrated and a comparison
rvith previously recorded compounds made (where possible).
H3
I
c, -CçI
Meze
M"eo
51

Chapter 4.1 Initial treatment
CHAPTER 4 FRACTION 1.
4Jl, Initial treatment
Treatment of Fraction L yielded four compounds, as outlined in Diagram 4.l,pg53.
5 g of Fraction 1 was separated from the original methanol extract (828 g) using
98% hexanelL0% ethyl aeetate as the eluting sslvent.
Fraction 1 (5 g) was then subjected to flash chromatography (silic+ sequential,
1,00% hexane - 50% hexane/Sj% ethyl aeetate) to yield ten fractions.
Fraction 1..2 (5 mg) was subjected to a flash column (silica isocratic, L00% hexane)
and yielded three fractions. Fraction 1.2.3 was found to be pure when applied to
GC/MS and was labelled Compound A (less than one mg). The structgre
determination of Compound A is given in Chapter 4.2, pg 54.
Fraction 1.4 (150 mg) was subjected to flash chromatography (silica isocratic,98%
hexane/2/o ethyl acetate) to yield seven fractions. Fraction 1.4.1 (50 mg) was
subjected to flash chromatography (silica, isocratic, 98% hexanel2% ethyl acetate)
to yield Fraction 1,,4.1.4 (22 mg) rvhich was found to be a mixture with two major
peaks when analysed using GC/MS.
Fraction 7.4.7,4.t - the first major peak by GC/MS- was analysed and was labelled
Compound B - see Chapter 4.3, pg 56 for its structure determination. The identity
of the second major peak could not be established
Fraction 1.6 (150 mg) formed crystals in 100% hexane that were labelled 1.6.2 (50
mg).
The mother liquor (100 mg) was labelled 1.6.1. It was subjected to flash
clrromatography (silica, isocratic, 95% hexanelS% ethyl acetate) and was separated
ínto ten fractions. lVhen Fraction 1.6.1.8 was left standing, a white solid
crystallized out of solution(100% hexane). This solid (a2 mg) rvas then
recrystallized in 99% hexanell% methanol to give fine white crystals. It was
labelled Compound C (32 mg) (see Chapter 4.4, pg59).
52
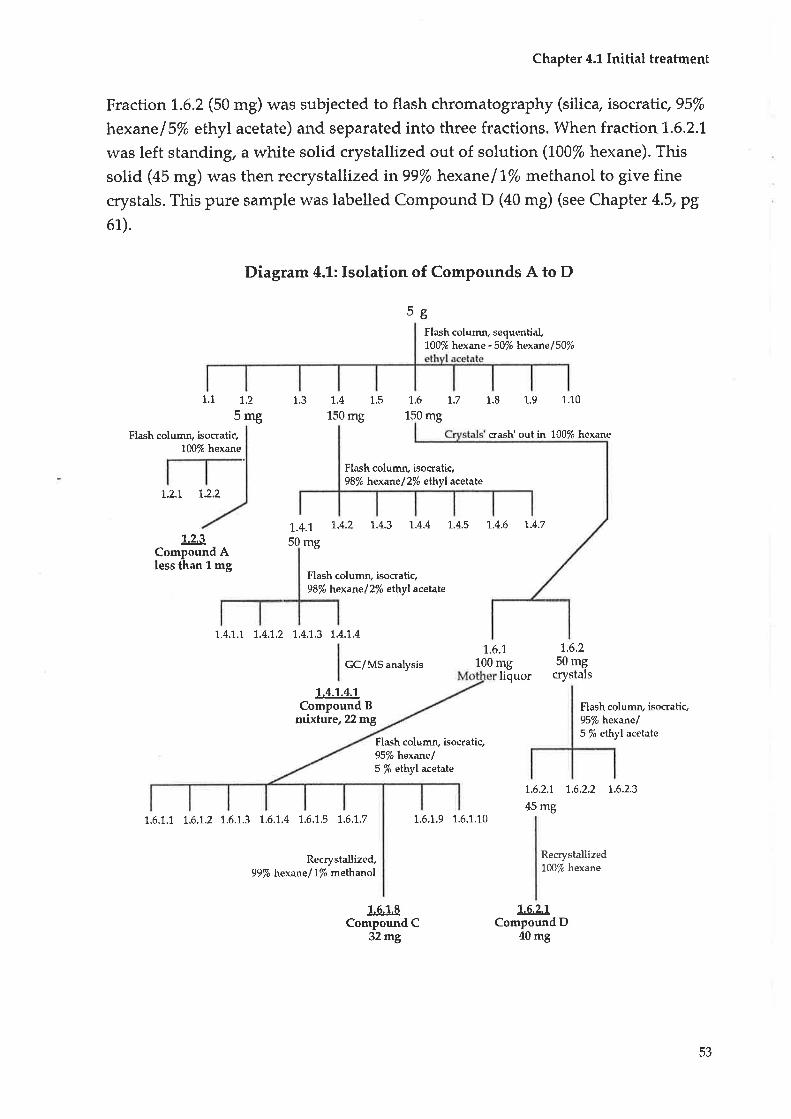
Chapter 4.1. Initial treatment
Fraction 1.6.2 (50 mg) was subjected to flash chromatography (silica ísotatic,95%
hexane/S/o ethyl acetate) and separated into three fractions. When fraction 1,.6.2.1,
rvas left standing, a white solid crystallized out of solution (L00% hexane). This
solid (a5 mg) was then recrystallized in 99% hexanell% methanol to give fine
crystals. This pure sample was labelled Compound D (a0 mg) (see Chapter 4.5, pg
61).
Diagram 4.1: Isolation of Compounds A to D
5gFlash column, sequential,100% hexane - 50% hexa¡e I 50%
1.1 t.z5mB
1.3 1.4
150 mg
7.4.7.4.7Compound B
mixfure,22mg
1.s 7.6 t.7 1.8 1.9 1.10
150 mg
Flash column, isocratic,100% hexane
1.2.t 12.2
\.2.3Compound Aless than 1mg
crash'out in 100% hexane
Flash columru isoctatic,98% hexa¡e | 2% ethyl acetate
1..4.7 r.4.2 1.4.3 t.4.4 1.4.s r.4.6 r.4.7
50 mg
Flash columrv isocratic,98% hexane | 2/o ethyl aceta te
7.4.L.1 7.4.7.2 1.4.1.3 1.4.1.4
GC/MS analysis
Flash column, isocratic,95%hexane/5 ft ethyl acetate
1.6.1,9 1.6.1.10
1.6.1,8Compound C
32 mg
Flash columrç isocratic,95% hexanel5 ft ethyl acetate
1..6.1100 mg
1.6.250 mg
crystalsliquor
t.6.1.1 1.6,r.2 1.6.r.3 1.6.1.4 1.6.1.5 r.6.r.7
Recrystallized,99%hexanelL% methanol
7,6.2.1 7.6.2.2 1.6.2.3
45 mg
Recrystallized100% hexane
7.6.2.7CompoundD
40mg
53
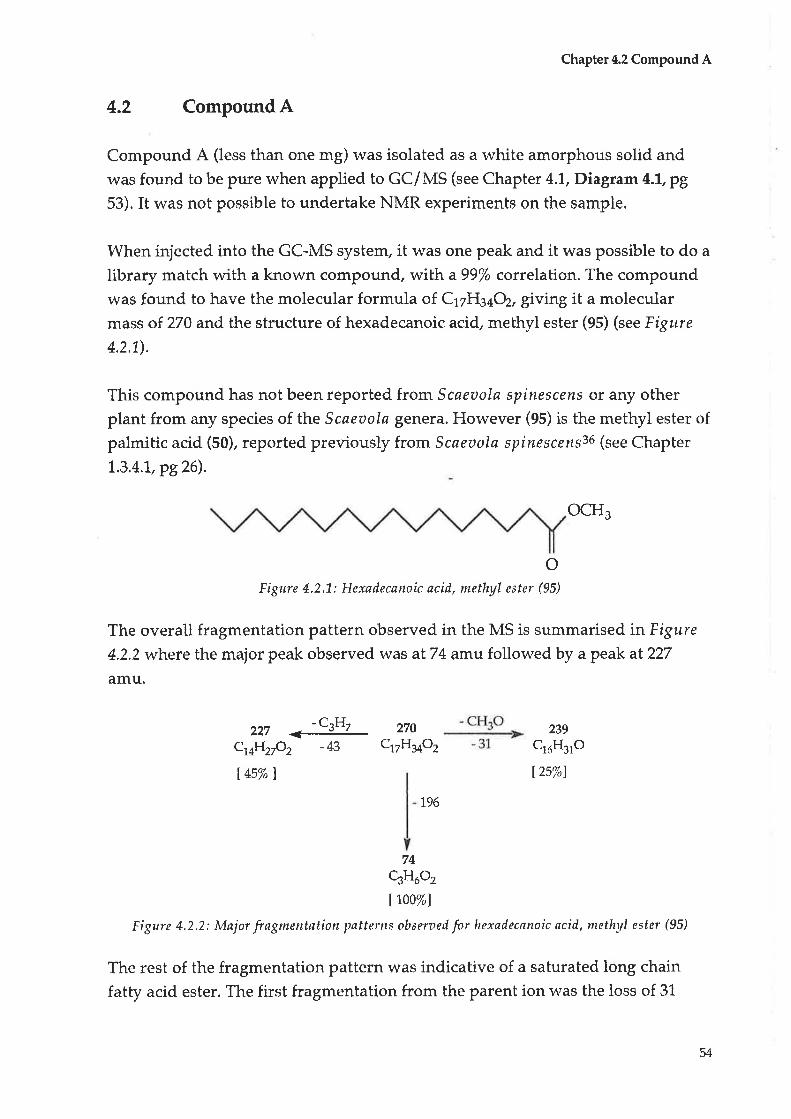
Chapter4.2 CompoundA
4.2 Compound A
Compound A (less than one mg) was isolated as a white amorphous solid and
was found to be pure when applied to GC/MS (see Chapter A.7,Diagtam4.7,pg
53). It was not possible to undertake NMR experiments on the sample.
When injected into the GC-MS system, it was one peak and it was possible to do a
library match with a known compound, with a99/o correlation. The compound
was found to have the molecular formula of Cv}Is+Oz, giving it a molecular
mass of 270 and the structure of hexadecanoic acid, methyl ester (95) (see Figure
4.2.1.).
This compound has not been reported from Scaeaola spinescens or any other
plant from any species of the Scaeaola genera. Flowever (95) is the methyl ester of
palmitic acid (50), reported previously from Scaeoolø spinescenta6' (see Chapter
L.3.4.1,p926).
ocH3
oFigure 4.2,1.: Hexadecanoic øcid, methyl ester (95)
The overall fragmentation pattern observed in the MS is summarised in Figure
4.2.2 where the major peak observed was at 74 amu followed by a peak at227
amu.
-43
74caH602
Iro0%)
Figure 4.2.2: Mnjor fragntentation patterns obseraed for hexadecnnoic acid, ntethyl ester (95)
The rest of the fragmentation pattern was indicative of a saturated long chain
fatty acid ester. The first fragmentation from the parent ion was the loss of 3L
227cr4H27o2
l.4s%l
- C"H.<g- 270cvF{:ylo2
239cl6H31o
Í25%l
961
54

Chapter4.2 CompoundA
amu (F6'¿ffe 4.2.3), which corresponds to the loss of the methoxy functionalgrouP.
flo';lr+
- ocH3c17H:y o2 o c1óH31o o
-31
Figure 4.2.3: lnitiøI fragmentation, with the loss of a methoxy functional g1'oup
The rest of the fragmentation exhibited a consistent loss of 1,4 amu (see Eigure
4.2.4), which corresponds to the loss of successive methylene groups. This is very
characteristic of long chained fatty acids and it occurs with gradually decreasing
intensitY'zsa z2z rss
ocI{3
-43 -28 o
185
oclt3v
o
171 157
2 ocFI3I
-74 -74 o143 t29
ocH3Y
-t4 o239
ocH3
- 796 o
14
14
74
Figure 4.2.4: Progressiae loss of methylene and etlryIene units
31
55
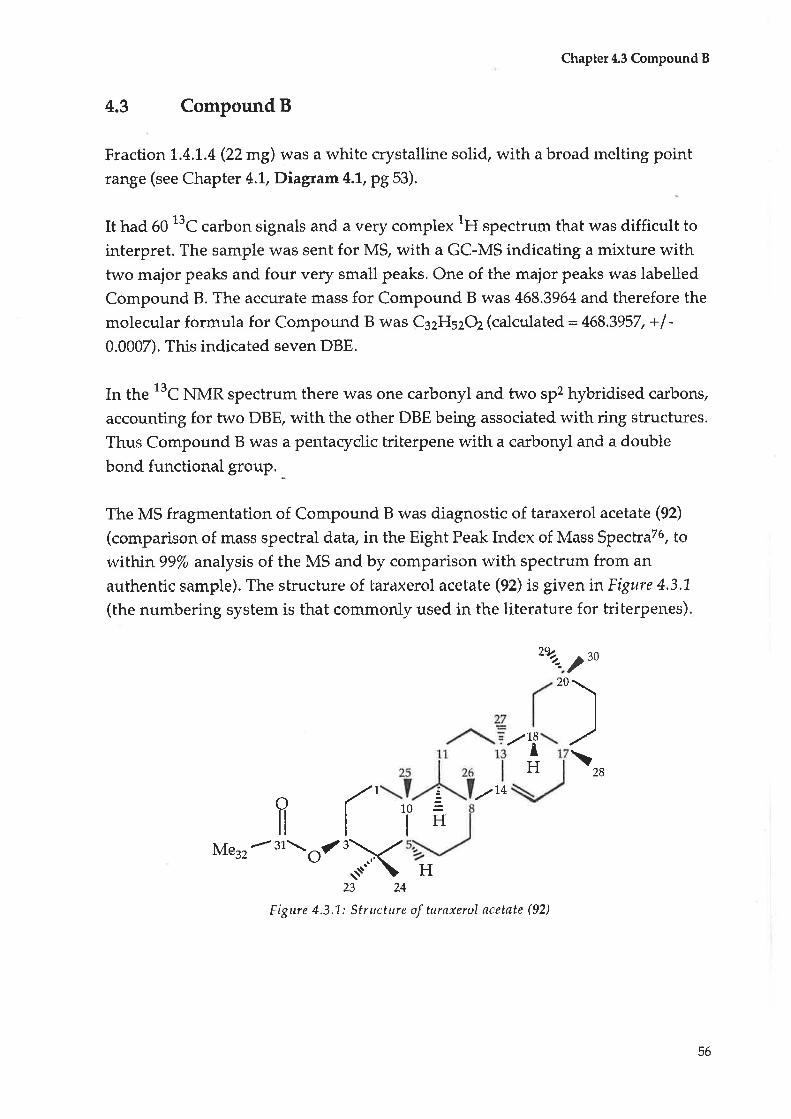
Chapter 4.3 Compound B
4.3 Compound B
Fraction L.4.7.4 (22m9) was a white crystalline solid, with a broad rnelting pointrange (see Chapter 4.1, Diagtam 4.1, pg 53).
It had 60 13C carbon signals and a very complex lH spectrum that was difficult to
interpret. The sample was sent for MS, with a GC-MS indicating a mixture withtwo major peaks and four very small peaks. One of the major peaks was labelled
Compound B. The accurate mass for Compound B was 468.3964 and therefore the
molecular formula for Compound B was CszHszQ (calculated = 468.3957, +l-0.0007). This indicated seven DBE.
In the ttc NMR spectrum there was one carbonyl and two sp2 hybridised. carbons,
accounting for two DBE, with the other DBE being associated with ring structures.
Thus Compound B was a pentacyclic triterpene with a carbonyl and a double
bond functional group,
The MS fragmentation of Compound B r,t'as diagnostic of taraxerol acetate (92)
(comparison of mass spectral data, in the Eight Peak Index of Mass SpectraT6, to
within 99/o analysis of the MS and by comparison with spectrum from an
authentic sample). The structure of taraxerol acetate (92) is given inFigure 4,3,L
(the numbering system is that commonly used in the literature for friterpenes)
Z%.r- 30
20
28
./liH
?
)\
fr( 1 ./1410
I
H
M"rrl31\o/ ,.^ì<H
23 24
Figure 4.3.L: Structure of taraxerol acetøte (92)
56
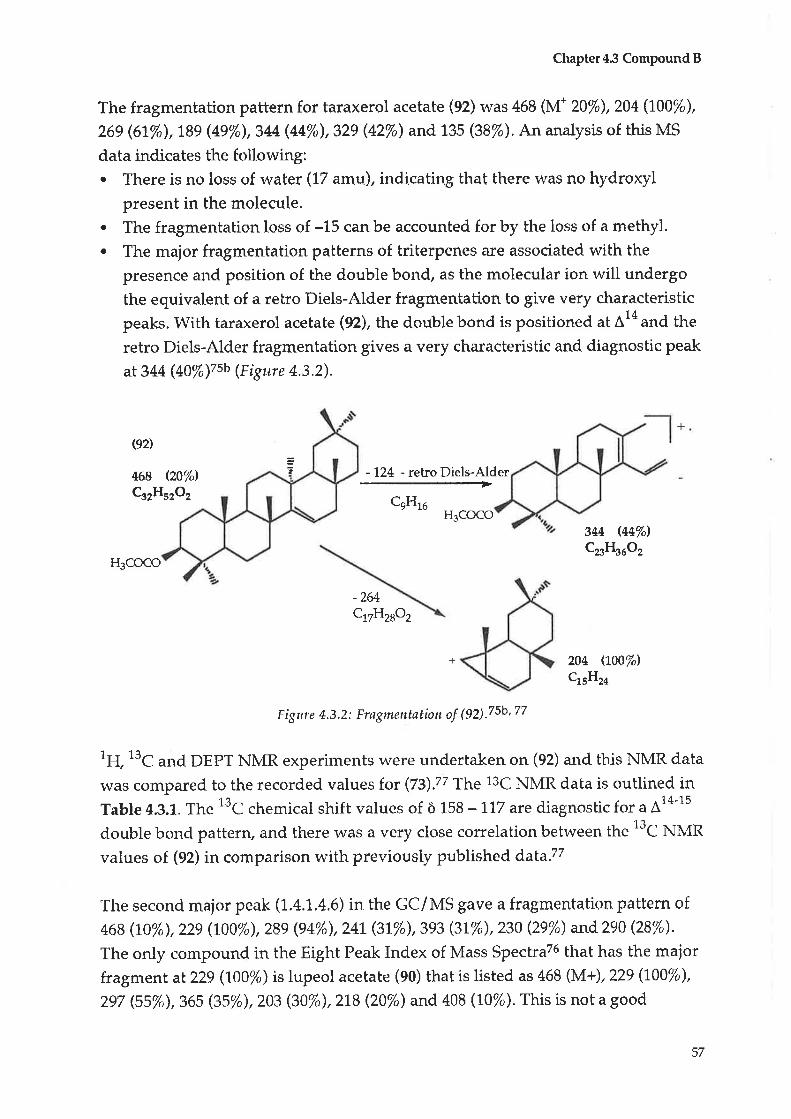
Chapter 43 Compound B
The fragmentation pattern for taraxerol acetate (92) was 468 (M* 20%),204 (100%),
269 (6t%),189 (49%),344 (44%),329 (42%) and 135 (38%). An analysis of this lvLS
data indicates the following:. There is no loss of water (17 amu), indicating that there was no hydroxyl
present in the molecule.. The fragmentation loss of -15 can be accounted for by the loss of a methyl.. The major fragmentation patterns of triterpenes are associated with the
presence and position of the double bond, as the molecular ion will undergo
the equivalent of a retro Diels-Alder fragmentation to give very characteristic
peaks. With taraxerol acetate (92), the double bond is positioned at À14 and the
retro Diels-Alder fragmentation gives a very characteristic and diagnostic peak
at344 (+07"¡zsv (Figure 4.3.2).
+
$21
- 124 - retro Diels-Alder468 QO%)cs2Hs2o2
H3COCO
csHrcH3COCO
-2&cr7H2So2
344 ø4%lc23H36o2
+ 204 í00%')QsHza
Figure 4.3.2: Fragntentatiott of (gÐ.75b,77
1H, 13C and. DEPT NMR experiments were undertaken on (92) and this NMR data
was compared to the recorded values for (rc¡.zz The 13C NN,IR data is outlined inTable 4.g.l,.The 13C chemical shift values of ò 158 - 'J,77 arc diagnostic for a A1a-1s
double bond pattern, and there was a very close correlation between the 13C NMR
values of (92) in comparison with previously published data.77
The second major peak (1,.4.1.4.6) in the GC/MS gave a fragmentation pattern of
468 (to%), 22e (t00%), 28e (e4%), 24I (3I%), 3e3 (3t%), 230 (29%) and 290 (28%).
The only compound in the Eight Peak Index of Mass SpectraT6 that has the major
fragment at229 (I00%) is lupeol acetate (90) that is listed as 468 (M+), 229 (1'00%),
297 (55%\,365 (35%),203 (30%),2L8 (20%) and 408 (10%). This is not a good
57

Chapter4.3 CompoundB
çomparison. As well as this, the 13C NMR data for 1.4.1.4.6 indicated a carbonyl at
õ 17L.6 and two st' hybridised carbons at õ 146.0 and ô 116,7. The 13C chemical
shift values reported in the literature for the equivalent carbon signals in (90) are
õ776.2, õ 150.3 and ô 110. Therefore it was not possible to positively identify1.4.t.4.6.
Table 4.3.L:13C chemical shift values for (92)# údl0glzz
c òc (92) õc0Ðzz
Cl 37.4 38.1
Cz 26.9 27.3
Cq 79.L 79.2
C¿ 38.7 39.1
Cs 56.0 55.7
c6 19.5 L9.0
Cr 35.6 3s.3
Cn 39.5 38.9
Cq 49.5 48.9
Cro 38.s 37.9
C òc (e2) õCçq77
Crr 18.3 17.7
Ctc 34.9 3s.9
Cl? 38.2 37.9
Ctt 158,3 158.1
Crs tL7.4 t77.0
Cte 38.3 36.9
Ctz 38.s 38.1
Cls 49.0 49.4
Crs 47.3 47.4
Czo 28.8 29.0
C öc (e2) õCgs¡77
Ct"t 33,9 33.9
Ctt 32.8 33.2
Ctz 29.1 28.1,
Czt 1.6.4 1s.6
Czs 1.6.3 15.6
C¡e 30.6 30.1
Ccz 25.2 26.0
Crs 30.1 30.1
Cts 34.7 33.5
Can 22.1 21,.5
C¡r 166.7
C¿¡ 23.6
#rso uHr (13c)' ö (pp^) from internal TMS in CDCI3
Comparison of 13C values between (92) and recotded value s of 12q77 is within 1-.0 ppm
QÐ72 - 25MIHZ(13C), ò (ppm) fromTMS inCDCl3
58
Chapter 4.4 Compound C
4.4 Compound C
Compound C (32 mg) was isolated as white crystals (see ChapEer 4.1, Diagram 4.L,
pg 53) with a MP of 280 - 284oC and an [oJo of + 0.69o (c 0.L, CHCI3).
Mass Spectrometry (EI) was conducted on the sample and a library search of the
spectrum gave a good match for taraxerol (73). A comparison of the
fragmentation pattern in the Eight Peak Index of Mass Spectra7' as well as
previously published data36 gave a very close correlation.
The comparison of the fragmentation pattern of the MS as well as the MP and.
[crþ valuesTs indicated that Compound C was taraxerol (73).
The high resolution MS (HRMS) of Compound C gave a molecular weight of426.3859 and hence a molecular formula of CsoH5¡O (calculated : 426,3864, + | -
0.0005). This molecular formula gave six DBE. In the initial i3C spectrumr a
carbon-carbon double bond was indicated by two 13C chemical shift values, one at
õ 159, the other at õ'1,77, which accounts for one DBE. There were no other sp2
hybridised carbons present. This suggests that there are five DBE associated withring systems and that Compound C is a pentacyclic triterpene.
A comparison of the 13C chemical shift values with the recorded valuesTT fortaraxerol (79) also indicated that Compound C is taraxerol (73). The 13C chemical
shift data of Compound C and taraxercI(73)77 are compared in Table 4.4.1, pg 60.
Comprehensive analysis of the COSY, HMQC and the HIvIBC data revealect that
Compound C has the basic structure of taraxerol (73). An analysis of the ROE data
confirmed that Compound C has the stereochemistry of taraxerol (73) at all ringjunctions.
Therefore Compound C is taraxerol (7S) and its strucbure, r,vith sbereochemisbry, is
as shown in Eigure 4.4.1. (The numbering system is that commonly used in the
literature for triterpenes). Taraxerol (73) has been reported previously from
S ca ea ola sp i ne s ce n5 . 35,36'56
59

Chapter 4.4 Compound C
l"-ï-,,
HI\,/
13
I
14
L
"'.-,rto
\
C oc (zs)# õC gs¡77
Ct 38.2 38.1
Cz 27.3 27.3
Cq 78.9 79.2
C¿ 39.8 39.1,
Cs 55.2 55.7
Cr 19.1, 19.0
C7 3s.3 35.3
Cn 38.7 38.9
Cq 48.2 48.9
Crn 37.9 37.9
c òc (73)# õc0Ð77
Crr L7.B 17.7
Ctc 3s.1 3s.9
Cts 37.0 37.9
Cr¿ 159.1 158.1
Crs 717.3 1.17.0
Cte 36.4 36.9
Ctz 38.6 38.1
Crs 50.3 49.4
Crs 41,.7 47.4
Czo 29.5 29.0
28
c ôc (ß)# õc 0g\77
Ctt 33.9 33.9
Ct,t 32.8 33.2
Ctz 27.2 28.1
Czt 1,5.2 15.6
Crs 75.2 1s.6
Ctr 29.5 30.1
Ctt 25.0 26.0
Czs 29.7 30.1
Czs 33.4 33.s
Crn 2L.7 21.5
25
1\l10
26
¡t
HOlsþ< H23 24
Figure 4.4.'L: Taraxerol (73)
Table 4.4.7213C chemical shift values for taraxerol (73)
# :13C chemical shift values recorded for Compound C (73)
*150 MI{z (13C): ô (ppm) from internal TMs in CDCI3 solution.
Comparison of 13C values between Compound C and recorded values af (n)77 is within 1.0 ppm,
QÐ77 - 25MHz (13c)' ò (ppm) fromTMS in CDCI3.
60
Chaptet4.5 CompoundD
4.5 Compound D
Compound D (40 mg) was isolated as white crystals (see Chapter 4.L, Diagram 4.1,
pg 53) with a MP of L9L - l.93oC and an [c¿Jp of + 58.6o (c 0.1, CHC13).
The high resolution MS (HRMS) of Compound D gave a molecular weight of426.3876 and hence a molecular formula of C3¡HsoO (calculated = 426.3874, +/-0.0002). This molecular formula gave six DBE. The IR spectrum revealed hydroxyl(3440 cm-1) and carbon-carbon double bond signals (1660 cm-1). Mass spectrometry
(EI) was conducted on the sample and a library search of the spectrum gave a good
match for taraxerol (73) - see Chapter 4.4, pg 59 - with some differences. When
taraxerol (73) and Compound D were co- spotted on TLC they moved to
significantly different positions on the TLC plate. The literature value for the
melting point of taraxerol (73) is282- 2830 C78 while the measured melting pointof Compound D was l-91 - 193oC.
The main MS fragmentation peaks observed for Compound D and taraxerol(73¡ts,z0 are displayed in Table 4.5,7, pg 67,1isted in order of the percentage values
of each fragmentation in decreasing order. There is a close correlation between
the two mass spectra. However, Compound D has fragmentations at 133, 135 and
l-89 amu that are not present in taraxerol (73).
Table 4.5.L Mass spectral data for Compound D and taraxerol (73lgs,zt
Compound D Taraxetol (73)3s,76
204(r00%) 204(ú00%\
1.33 (88%)
L89 (78%\
302 @0 %) 302 (33%)
287 (38%) 287 (25%)
13s (3e %)
Given the difference in melting point, the difference in their movement on silica
and the differences itr. the fragmentation ions at l-33 and L89 it would appear that
Compound D is not taraxerol (73) but is an isomer of taraxerol (73).
The 13C, 1H, HMQC, COSY and HMBC spectral data for Compound D and the 13C
literature values lor (n¡zz are given in Table 4.5.2, pg 62.
67
Chapter 4.5 Compound D
Table 5.4.2; spectral data for Compound D# - an isomer of taraxerol03\.77
600 MHz (1H), 150 MHz 1139¡' ò (ppm) from internal TMS in CDCI3
QÐ72 - 25MHz (13c)' ô (ppm) from internal TMS in CDCI3
I M I (Hz) COSY HMBC (73)c òc H òH1
1,
mm
H1B, H2çr, H2pHl<r, Hz<r,, ÉIzg
ctocro
38.1C1 37.7 H1oHrg
0.8901.531
Ht- Htp, Hzp, H3oHl .', H1 B, H2.r,H3.,
ct, C3ct, cg
27.3C2 27.1 }lzo.Hzn
7.5227.486
1
1
mm
3.125 1 dd 4.811..4 F{zo., F{2B C2,C23,C24 79.2C3 79.0 H3o39.7Ca 38.7
55.7C5 55.5 Hso 0.715 L dd 2.412.0 Hs* Hoß C1.0,C23, CZ+, CZS
C7C7
19.0C.6 18.8 cI
H5H6
7.5477.472
1
7
mm
F{5q.,H5p,F{7s,H6o
35.3C7 41.3 HroF{zs
1.9601,.271,
1
1
ddm
3.U, 12.6 HsB, HzBf{7"-
C6,Cg,C25Cs, cø
38.9Cs 38.9
48.949.2 H9.. 1..349 1 m Htto ClCsClsCl tCzsCzøCs37.9cro 38.0
cg,CtzC9,C12,C13
17.7crr 17.5 HttoHrro
1.5631.412
1
1,
mm
H9¡r, H11p, H12¡,Hl1o
35.933.7 Hl2..Hrze
1.5601.475
1
1,
mm
Hrr* HrzpH12o
Cg,Cll,Ctg,CZZC1y,C1g,C27
Ctz
37.9crs 37.5
158.1cr¿ L58.0
717.0Crs 5.464 1 dd 3.0 7.4 Hto* Htoo C6, C13, C16116.8 HrsC1aC15C17C7B,C2BCj,4, CIS, Ct7, CZB
36.9cro H16..Hre R
1.5751.841
1
1
ddm
8.415.03.0 15.0
Hts, HtopH15, Hl6o
37.7
38.1ctz 3s.749.40.902 1 m H19o C12C13C16C1.sC2oC.zBcra 48.7 H18..
Htao, HtgpH19.'
cts, CztCzo
41,.4crs 36.6 H19oHrso
0.9207.224
1
1
mm
29.0Czo 28.8
33.91,.L721,271
1
1
mm
F{ztþ,F{zz"'F{zTo
C7z,C2tJ, Czg, C3ocv, Czo
czt JJ.J Hzt.t
33.2F{zto.,F{zzpf{22."- czo,czg
czz 35.1 HzzoF{zzø
0.9521.305
L
1
mm
C3,C4,Cs,C2+ 28.1Me23.' 0.910 c sczz 28.0
Cg,C4, C5, C23 15.6Cz+ 15.4 Mez+g 0.734 J s
C1, C5, C9, Cto 15.6czs ls.4 lvfe25g 0.860 J s
C7,CB,Cg,C74 30.1Czd 25.9 Mezsa 1..022 J s
26.0C1z,C\g, Ctq, CtgCzz 29.9 Mezzg 0.841 3 S
30.1Mezeß 0.754 3 s C16, C77, Cl.g, CZZczs 29.7C1.g, C2o, C21., C3o 33.5Czg 33.1 Mezgo. 0.881 a
J s
21.5J s C1,g,Cz1, Cz1.,CZgcso 21.3 Meeog 0.841
I: Integration M = Multiplicity
62
Chapter4.S CompoundD
The numbering system used is the one commonly found in the literature fortriterpenes, with the strucfure given that of taraxerol (73) without the
stereochemistry (see Figr.rr e 4.5.1).29.
\,2 uo
(20
27
26
./18\1 13
I
1.4
25
1\l28
HO
23 24
Figure 4.5.1-: Cortpound D - isomer of taraxerol (73)
Compound D is a stereoisomer of taraxerol (73).It is a pentacyclic structure witheight methyl signals, five methine protons and ten methylene pairs that can be
assigned as either a or p to the ring structure. The structure has eight chiral
carbons. The methylene pairs of hydrogens are diastereotopic and therefore they
have different 1H chemical shift values.
The five rings are labelled from A to E and the chiral centres shown inFigtre4.5.2.
HO
Figrre 4.5.2: Labelled rings and chiral centres for the structtre Contpowtd D
The stereochemistry and conformation were investigated using both the coupling
constant data (where available) and ROE relationships determined by a ROESY
experiment. These correlations are displayed in Table 4.5.3, pg e.
The stereochemistry of the methyl protons was apparent in the ROESY
experiment, where methyl signals on the same side of the molecule strongly
interact. Ring junctions in this rigid system are either trans or cis ring junctions
and this relationship can be established according to ROE interactions between
the methine protons and the methyl protons.
63
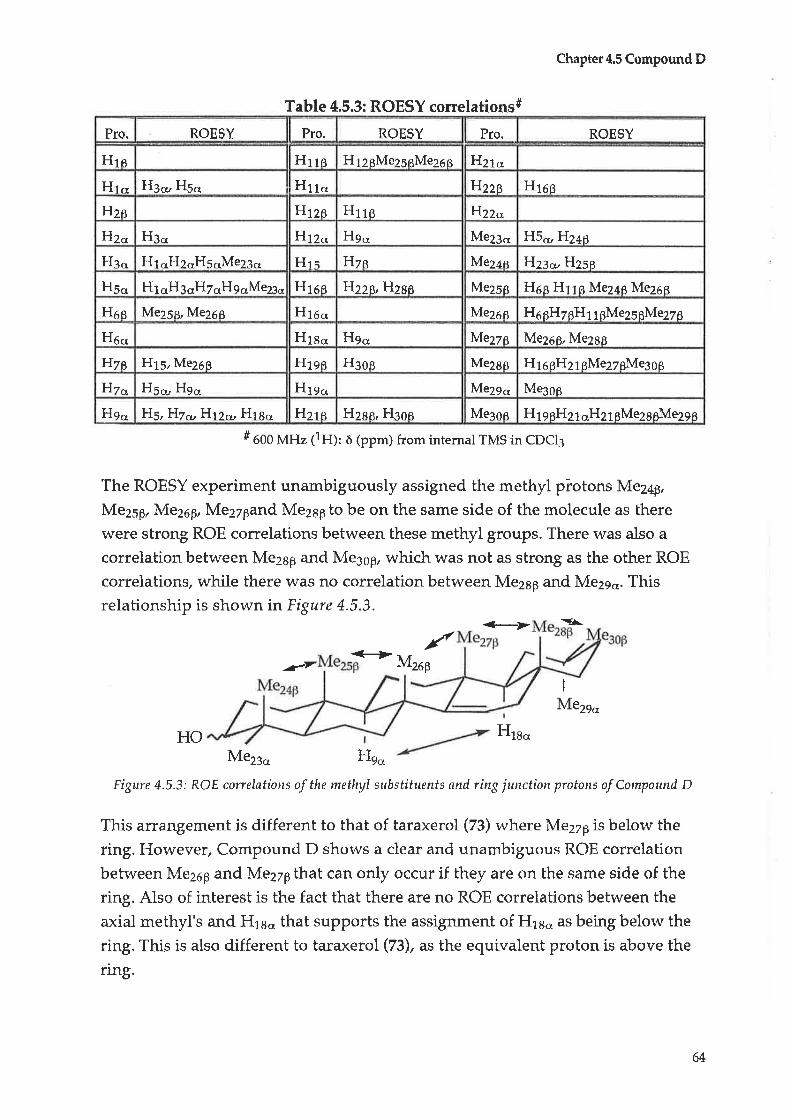
Pro. ROESY Pro. ROESY Pro. ROESY
Hre Hrrs H126Me25¡3Mezøo }{27o
Ht.t He* Hso H11o }lzzs Hroß
F{zø Hrzg Hrrg Hzzo
H2., H.1.' H12.' H9.. Me23.. H5* H246
Ha., Ht oHz.'Hs.rMe23., Hls IIze Mez¿e Hz¡* Hzsg
Hs.' Ht.'HgoHz.¡H9".Me¡", Hrss Hzza,F{zsg Mezsß Hsg Hrrg Mez¿ß Mezsß
Hes Me2Sß, MeZe g Hte o Mezøg H56H7gH11gMe256Me27g
H6.t Htgo Hgo Mezze Me26ß, Mezag
FIzø H15, Me25g Hrsß Heog Mezag H15gH21gMe27gMe3gg
FIz... Hs.. Hg., H'ls.' Mezgo. Me¡oß
Hg., F{s,H7* H12* HlB.. F{z'ta H2gB, Haog Me:oa H19 gH21 oH21 BMe2BeMe2g6
Chapter4.S Compound D
Table 4.5.3: ROESY correlations#
# eOO MHr (19): ¿ (ppm¡ fron'r internal TMS in CDCI3
The ROESY experiment unambiguously assigned the methyl piotons Mez4p,
Mezsp, Mezop, Me2Tpand Me2sÞ to be on the same side of the molecule as there
were strong ROE correlations between these methyl groups. There was also a
correlation between Me2sp and Me3¡p, which was not as strong as the other ROE
correlations, while there \ ¡as no correlation between MezsÞ and Me29o. Thisrelationship is shownin Figure 4.5.3.
+> -\.l(r<+
-¿'7 MzaÞ
I
Mezgo
HO Htt.,Mezg., Hg.,
Figrre 4.5.3: ROE correlatiotts of the methyl substituents and ring jl':rtctiotr pratons of Compound D
This arrangement is different to that of taraxerol (73) where Mezzþis below the
ring. However, Compound D shows a clear and unambiguous ROE correlation
between Mezoþ and Me27B that can only occur if they are on the same side of the
ring. Also of interest is the fact that there are no ROE correlations between the
axial methyl's and Hls., that supports the assignment of Flrao as being below the
ring. This is also different to taraxerol (73), as the equivalent proton is above the
ring.
64
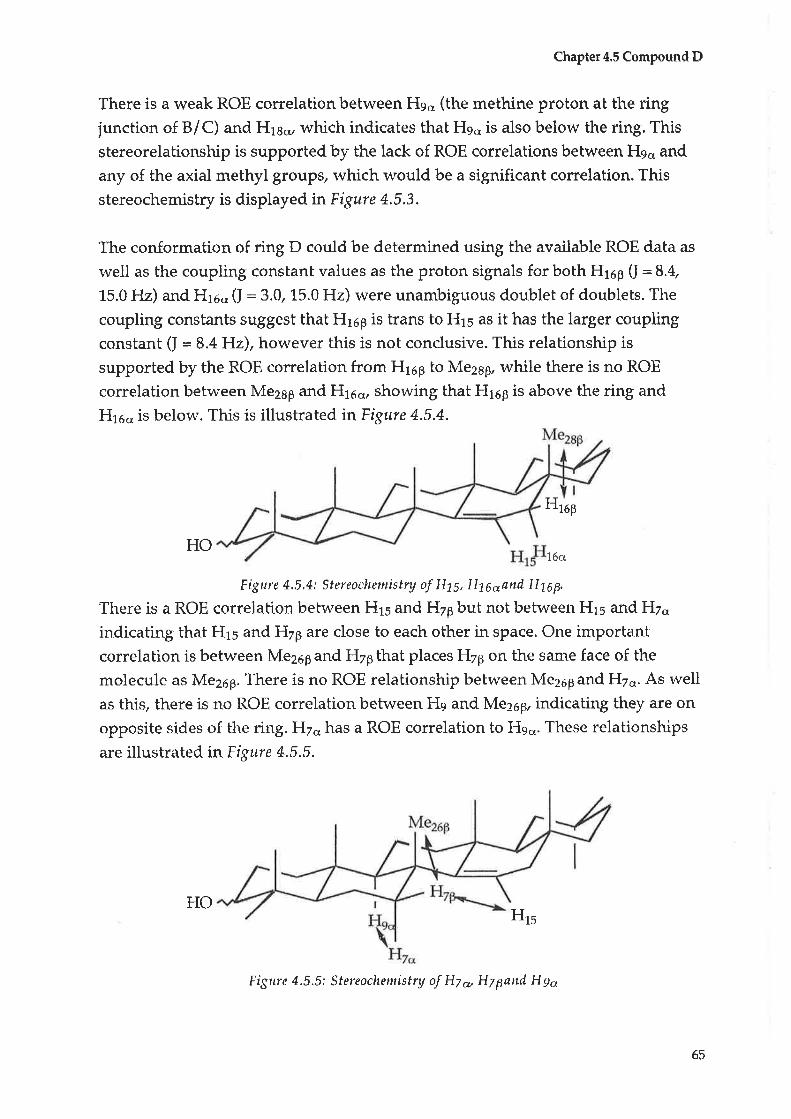
Chapter4.S Compound D
There is a weak ROE correlationbetween Hg" (the methine proton at the ringjunction of B/C) and H16* which indicates thab Hso is also below the ring. This
stereorelationship is supported by the lack of ROE correlations between Hg., and
any of the axial methyl groups/ which would be a significant correlation. This
stereochemistry is displayed in Figttre 4.5.3.
The conformation of ring D could be determined using the available ROE data as
well as the coupling constant values as the proton signals for both Hr¿p 0 :8.4,
15.0 Hz) and H15,o 0: 3.0, L5.0 Hz) were unambiguous doublet of doublets. The
coupling constants suggest that H15B is trans to Hrs as it has the larger coupling
constant (I = 8.4 Hz), however this is not condusive. This relationship is
supported by the ROE correlation from HroÊ to Me2sp, while there is no ROE
correlation between Me2Bp and FI15o, showing that H15,p is above the ring and
Hre., is below. This is illustrated inFigure 4.5.4.
H16'P
HO16cr
Figure 4.5.4: Stereochernistry of HtS, H16oønd H16p,
There is a ROE correlation between Hrs and H7B but not between H15 and Hz.,
indicating that Hrs and H7p are close to each other in space. One important
correlation is between Me25,B and H7p that placet HzÊ on the same face of the
molecule as Me26B. There is no ROE relationship between Me26p and H7o. As well
as this, there is no ROE correlation between Hç and Mezop, indicating they are on
opposite sides of the ring.Hz., l'ras a ROE correlation to He.,. These relationships
are illustrated in Figure 4,5.5.
HrsHO
Figrre 4.5.5: Stereochemistry of Hl* HTpand Hgo
65

Chapter4.S Compound D
The stereochemistry of FIóp and FIóc can be determined using the ROÞ
correlations between Me25B and H6p (not HoJ and between Me25p and FI5p,
indicating that FI6p is on the same side as Me2sp and MezeB, while FIe" is on the
opposite side (see Figure 4.5.6).
HOHoo
Figurc 4.5.6: Stercochemistry of H6"ønd H6p
There is a strong ROE correlation between the methine protons at the ringjunctions between ring A and ring B - Hs.. - andbetween ring B and ring C - Hg"(it has been established that Heo is below the ring). Neither of these two protons
have any correlations to the methyl protons above the ring. This indicates that
H5o and Heç, âr€ both below the ring. FI5o also has a ROE correlation to Hzo thathas been established to be below the ring. There is a ROE correlation between H5o
and Me23obut not between FI5o and Me2ap. These relationships ¿!.re illustrated inEigure 4,5,7.
HOHzp
Hr",
Figure 4.5.7: Stereochemistry of HSoønd Hgo
The stereochemistry of H3o can be established, using the ROE relationship
between H3q and H-s* whi-le tls.. only correlates to Mez:- not Me2ap, as illu-stra-ted
in Figure 4.5,8.
Hso
HO
Figure 4.5,8: Stereochemistry of Hgo
66
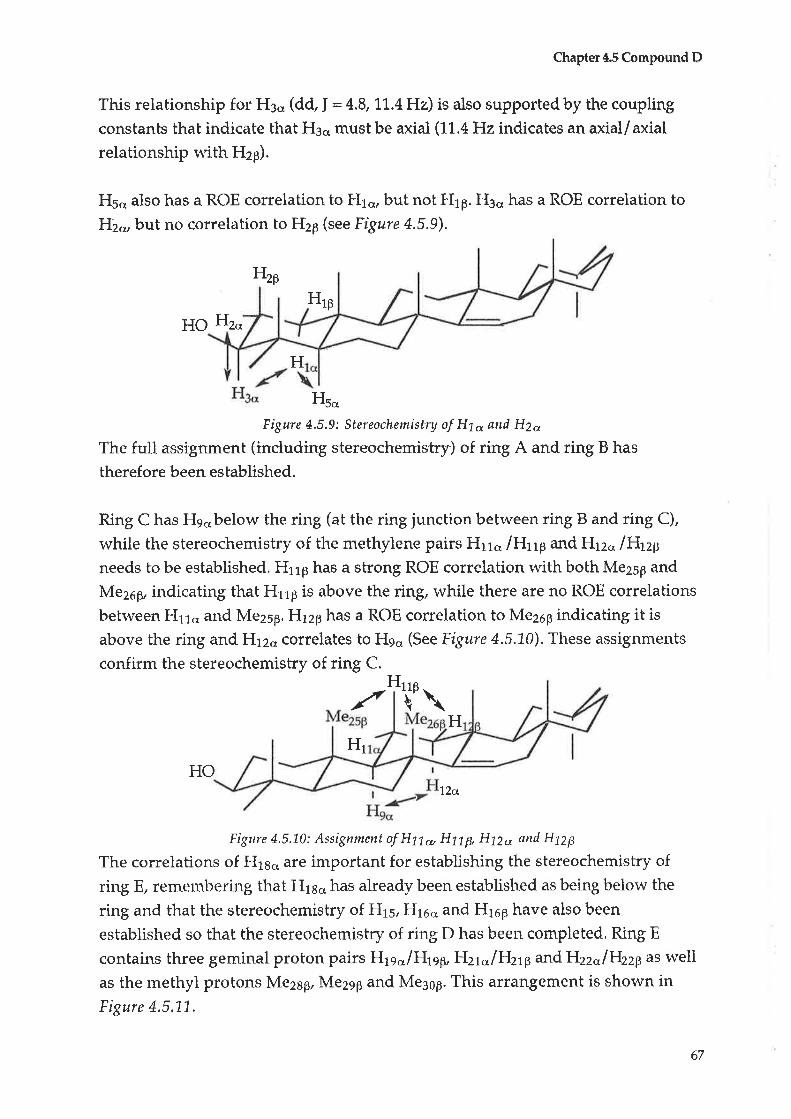
H1p
HO Hzo
H
Hs..
Figure 4.5.9: Stereochemistry of Hto and H2o
The full assignment (inc{uding stereochemistry) of ring A and ring B has
therefore been established.
Ri.g C has He*below the ring (at the ring junction between ring B and ring C),
while the stereochemistry of the methylene pairs Hrro lt{t$ and Hrz<, lHtzþneeds to be established. HrrÞ has a strong ROE correlation with both Me25p and
Mezep, indicating that H11p is above the ring, while there are no ROE correlations
between Hrro and Me25p.Htzp has a ROE correlation to Me26p indicating it isabove the ring and H12q correlates to Heo (See Frgr.ire 4.5.1.0). These assignments
confirm the stereochemistry of ring C.H11p
Chapter4.S Compound D
This relationship for H3., (dd, I :4,8,1L.4 Hz) is also supported by the coupling
constanbs that indicate that H36¡ must be axial (11,4tl2 indicates an axial/axialrelationship with FIrp).
H5o also has a ROE correlation to H1o, but not HrÊ.Heo has a ROE correlation toFI2- but no correlation to H2p (see Figure 4.5,9).
HzB
,/ If \H
H1
HOlàrl
Figure 4.5.70: Assigtunent of Hn* Hnp,Hpo and H12B
The correlations of Hlso are important for establishing the stereochemislry of
ring E, remernbering that Hrao has already been established as being below the
ring and that the stereochemistry of Hts, H16q and H16p have also been
established so that the stereochemistry of ring D has been completed, Ring E
contains three geminal proton pairs lj..ts..lH,t,)þ,HLzt.,ltlzlp and }{22oll{22p as wellas the methyl protons Mez¡p, Me2ep and Me3sB. This arrangement is shown inFigure 4.5.LL.
67
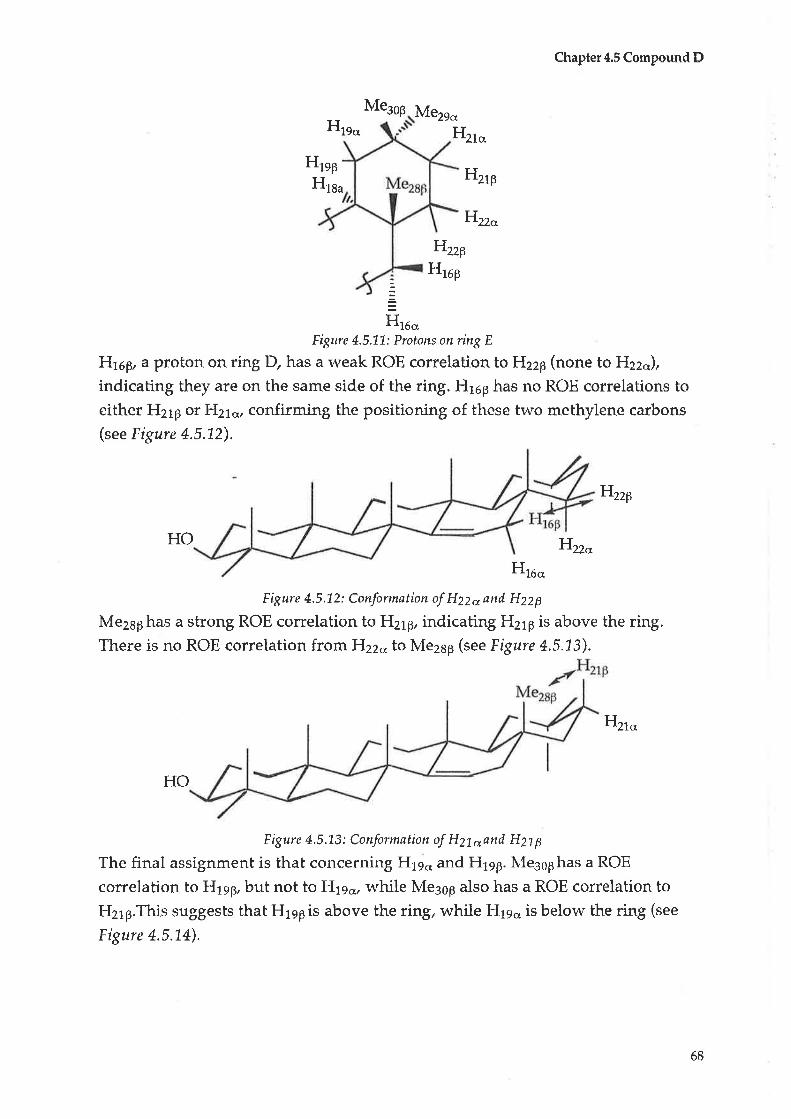
Chapter4.S Compound D
HtgoMesog Mezgo
Hzto
HrsFHzrÞ
Htau
Hzz".
FlzzlHrop
HtooFigure 4.5.1-L: Prototts on ring E
}lt6.6, a proton on ring D, has a weak ROE correlation to H22B (none to H22o),
indicating they are on the same side of the ring. H16p has no ROE correlations toeither Hrtp or ÉI21o, confirming the positioning of these two methylene carbons
(see Figure 4,5.1.2).
FInþ
HO Hzz",
Htoo
Figure 4.5.'12: Conformation of H22o and H22p
Mezaphas a strong ROE correlation to H218, indicating H21p is above the ring.There is no ROE correlation from H.zzoto Me2sp þee Figure 4.5.1-3).
Hzto
HO
Figure 4.5.'L3: Conformation of H2loand H21þ
The final assignment is that concerning Hrgo and H19p. lv{e3sphas a ROE
correlabion to Hlep but not to H1eo, while Meeop also has a ROE correlation to
H21p.This suggests that Hlepis above the ring, while Hrg., is below the ring (see
Figure 4.5.L4).
68
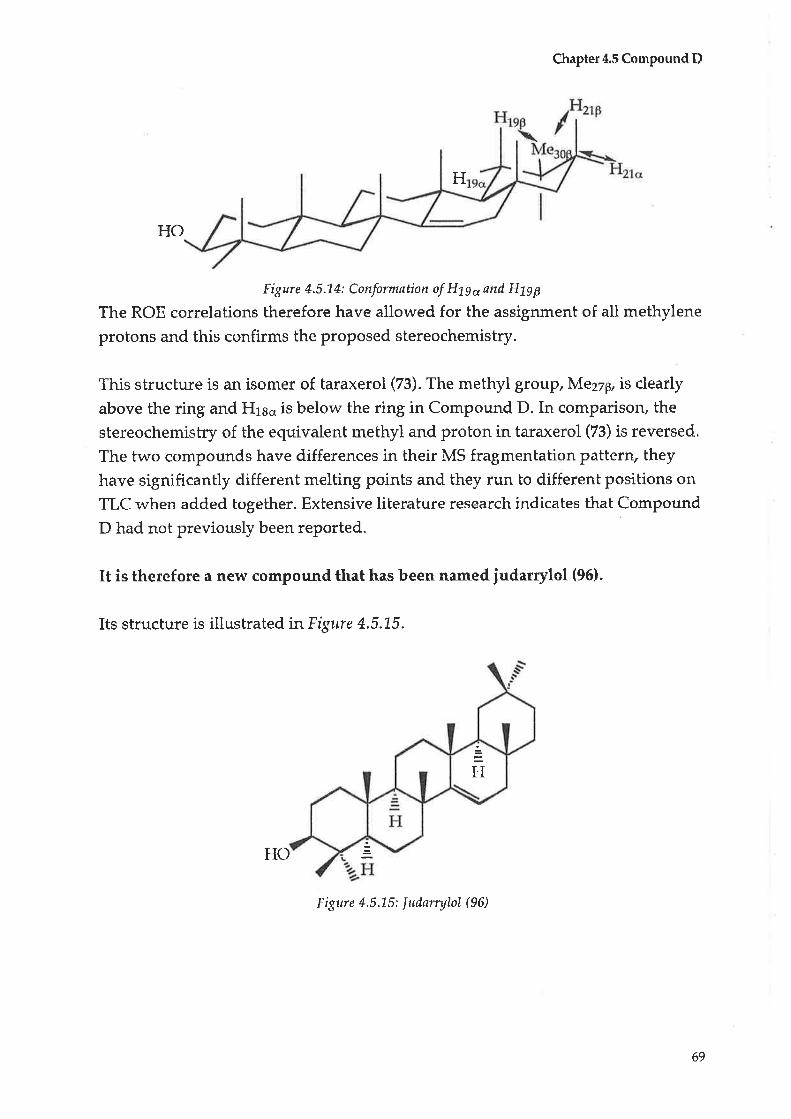
Chapter4.SCompound D
H
HO
Figure 4.5.14: Conformation of Hpq and HlgB
The ROË correlations therefore have allowed for the assignment of all methylene
protons and this confirms the proposed stereochemistry.
Tl'ris structure is an isomer of taraxerol (73). The methyl group, Me27p, is dearlyabove the ring and H16o is below the ring in Compound D. In comparison, the
stereochemistry of the equivalent methyl and proton in taraxerol (73) is reversed.
The two compounds have differences in their MS fragmentation patbern, they
have significantly different melting poinbs and they run to different positions on
TLC when added together. Extensive literabure research indicates that Compound
D had not previously been reported.
It is therefore a new compound that has been named judarrylol (96).
Its structure is illustrated inFigure 4.5.1-5.
HO
H
Fiyre 4.5.L5: ludarrylol (96)
69
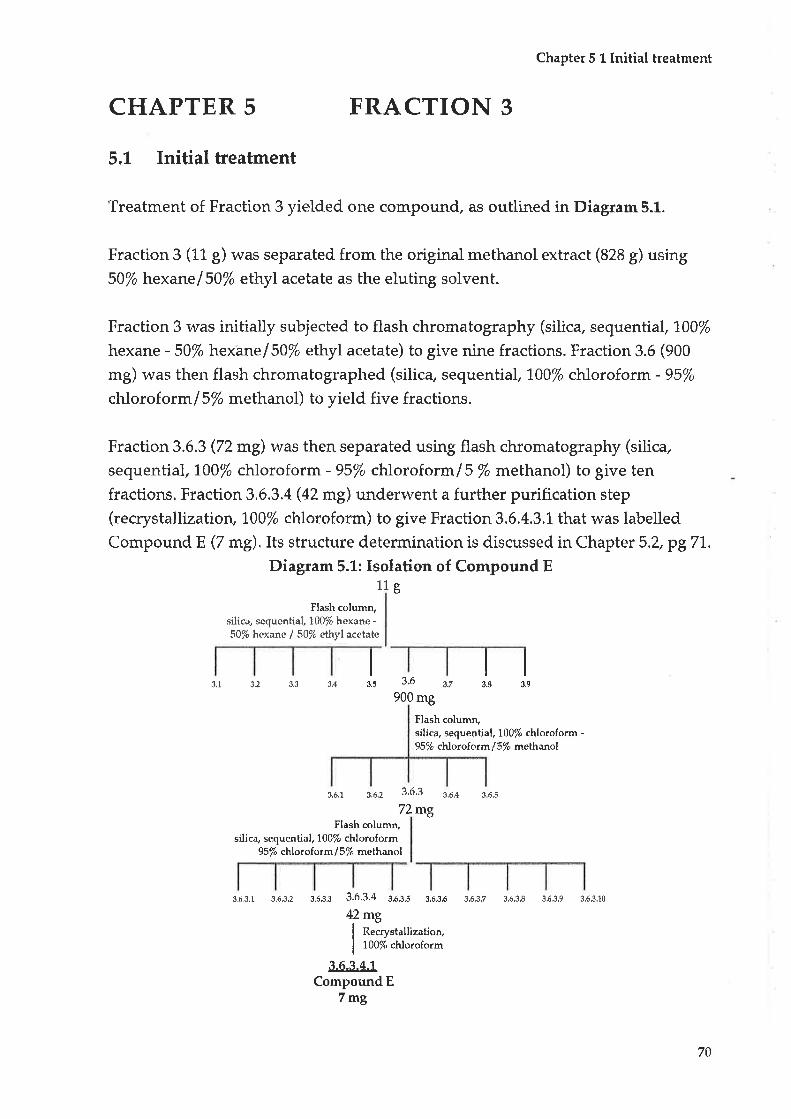
Chapter 5 1 tnitial treatment
CHAPTER 5 FRACTION 3
5.1 Initial treatrrent
Treatment of Fraction 3 yielded one compound, as outlined in Diagram 5.1.
Fraction 3 (11 g) was separated from the original methanol extract (828 g) using50/o }aexanelS0% ethyl acetate as the eluting solvent.
Fraction 3 was initially subjected to flash chromatography (silica, sequential,l00%hexane - 50% hexirne/S}/o efhyl acetate) to give nine fractions. Fraction 3.6 (900
mg) was then flash chromatographed (silica, sequential,l00% chloroform - 95%
chloroformlS% methanol) to yield five fractions.
Fraction 3.6.3 (72 mg) was then separated using flash chromatography (silic+
sequential,1.00% chloroform - 95% chloroformlS % methanol) to give ten
fractions. Fraction 3.6.3.4 (a2 mg) underwent a further purification step(recrystallizatioru 100% chloroform) to give Fraction 3.6.4.3.1 that was labelled
Compound E (7 mg). Its structure determination is discussed in Chapter 5.2, p971.Diagram 5.1: Isolation of Compound E
11 gct
Flash column,silica, sequenti al, L00% hexane -50% hexane / 50/o ethyl acetate
3.4 3.6 3.7
900 mg
Flash column,silica, sequenti al, 700% chlo¡oform -95lo chloroform /5% methanol
3.1 3.2 3.3
I
3.8
I
35I
3.9
3.6.r s.6.2 3.6,3 3.6.4 3.6.5
72 mgFlash column,
silica, sequenti al, 700/o chloroform95lo chloroform/S% methanol
3.6^3-3 3.6.3.4 3.6.3.5 s.6.36
42mgI Recrystallization.
| rconchloroform
3.6.3.4.1Compound E
7mg
3.63.1 3lj3.? 3.63:/ 3.6,38 3óJ,9 3.63.10
70
Chapter 5.2 Compound E
5.2 Compound E
ConrpoundB (7 mg) was isolated as white crystals (see Chapter 5.1-, Diagram 5.1,
pg70) with a MP of 282 -285oC and an [cJo of + 690 (c 0.1., CHCI¡).
The high resolution mass spectrum (HRMS) gave an M* of 456.3599 that gave a
molecular formula of C3¡FIasO3 (calculated : 456.3605, +/- 0.0006). The molecularformula revealed the presence of seven DBE. The IR indicated the presence of a
carbonyl (L720 cm-l), and a carbon-carbon double bond (1660 cm-1) which accounts
for two DBE,leaving five DBE to be associated with rings. This indicated that
Compound E was a pentacyclic compound. There was also a broad peak at 3450
cm-1 that indicated the presence of hydroxyl gtoups.
The presence and position of a double bond in a triterpene are very diagnostic, as
the inolecular ion formed undergoes a relro Diels-Alder fragmentation to give a
very characteristic peak in the mass spectrum.Tsb The MS of Compound E
indicated the very characteristic fragmentation pattern associated with an ^12
ene
position. The fragmentations observed in the mass spectrum vvere 248 (100%), 4I0(60%),203 (60%), 438 (38%) with an M* of 456. These are identical to those
observed for ursolic acid (gZ)ze and are outlined inFigure 5.2,1,.
A series of NMR experim-ents - 1F{, COSY, ROESY, 13C, HMQC and HMBC - were
used to confirm that Compound E was ursolic acid (97). This data is given inTable 5.2.T, p973. The numbering system is that commonly used in the literaturefor triterpenes and is illustrated in Figure 5.2.2.
A ROESY experiment was used to establish the stereochemishry of the ringjunctions to be that of ursolic acid (97), with Mez¿p, MezsB, MezóÊ and lv{e2eB being
above the ring, Mezso and Me3¡o were below the ring. The ring protons H5s and
He.. w€re belolv the ring, rvhile Hrsþ was above the ring. The conformation of the
methylene protons could not be determined.
77
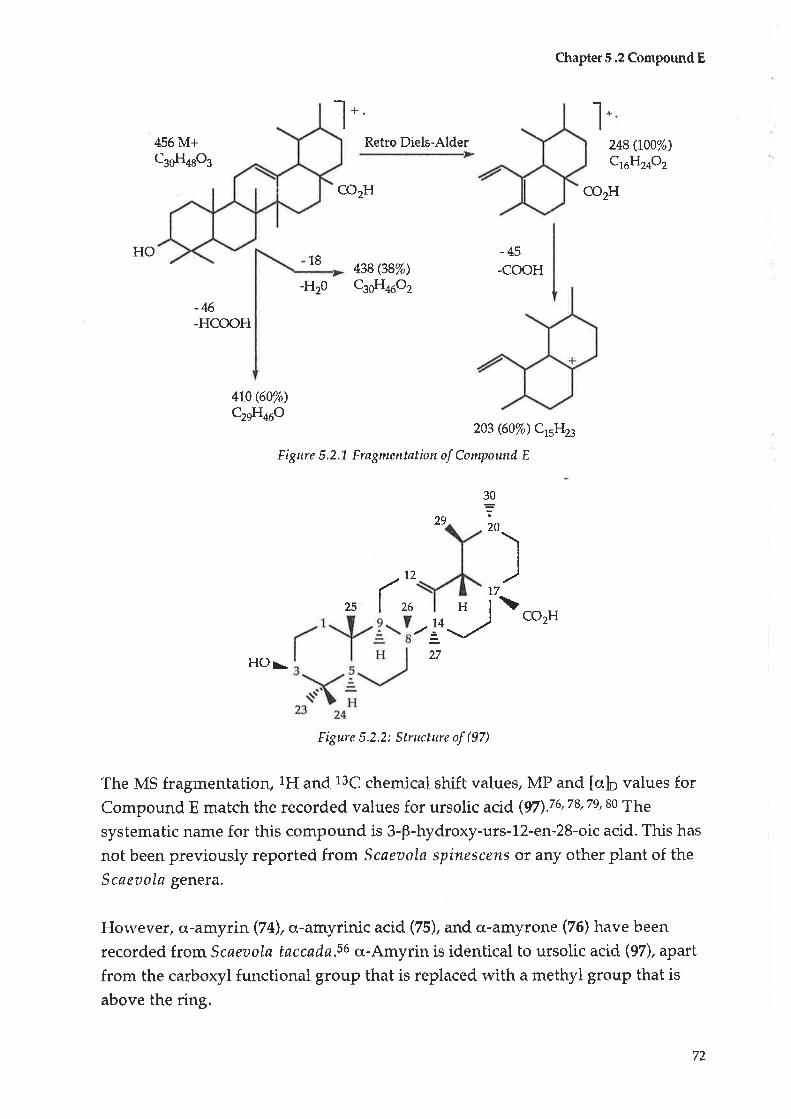
Chapter 5.2 Compound E
IRetro Diels-Alder
co2H
438 (38%)csñIøoz
-45-COOH
-Hzo
203 (60%) CrsHzg
Figrre 5.2.1- Fragnentation of Conryound E
29
+ I +
456 M+csot{+eos
248 (L00%)cßH24o2
co2H
HO18
-46-HCOOH
470 (60%)
QsHøo
l2
26(
25
30
:20
)7
\1
co2H
Figure 5.2.2: Structure of (97)
The MS fragmentation, 1H and 13C chemical shift values/ MP ancl lalo values forCompound E match the recorded values for ursolic acid (97).76,78,7e,80 The
systematic name for this compound is 3-p-hydroxy-urs-72-en-28-oic acid. This has
not been previously reported from Scøeaola spinescens or any other plant of the
Scaeaola genera.
However, o-amyrin (74), a-amyrinic acid (75), and cr-amyrone (76) have been
recorded from Scaeaola taccada.s6 a-Amyrin is identical to ursolic acid (97), apart
from the carboxyl functional group that is replaced with a methyl group that is
above the ríng.
-'laHo:, 27
U
72
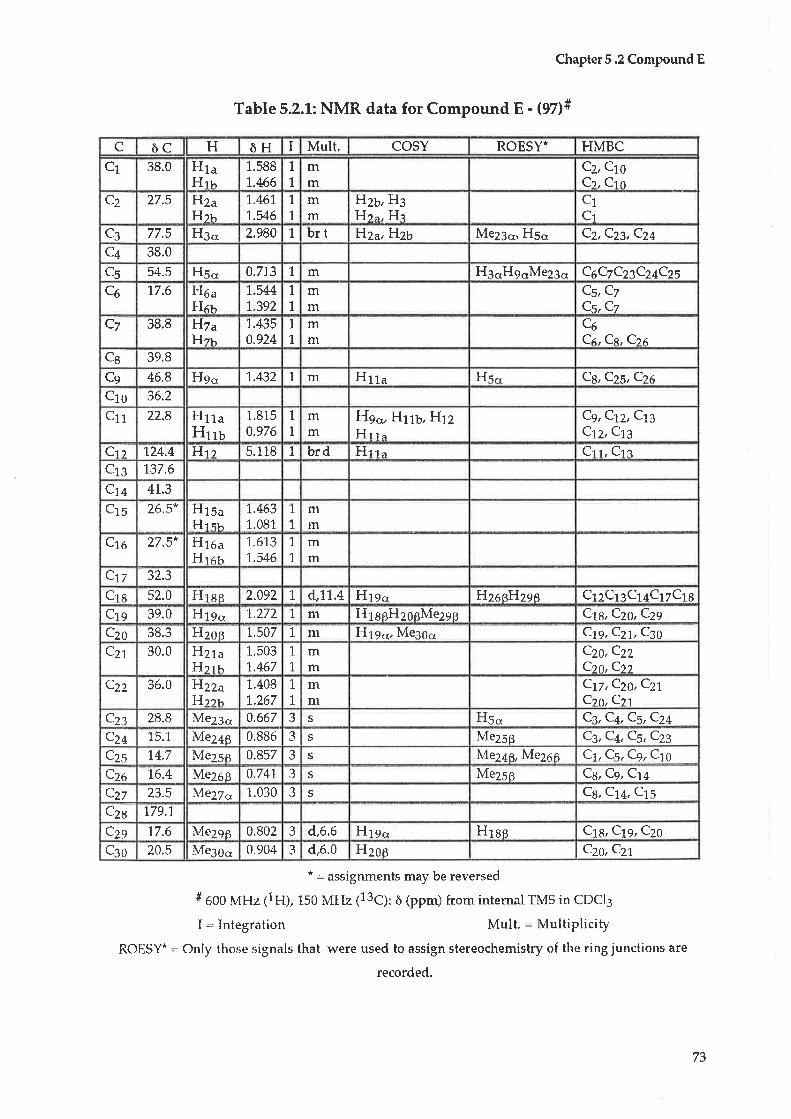
C òC H òH I Mult, COSY ROESY* HMBCC1 38.0 Hta
Hr¡.L.5881.466
1
1,
mm
C2, c1oC¡,Ctn
C.2 27.5 H2aH 2h
1,.461,
1.5461,
1
mm
Hzb,H3F{t".Hz
C1
ClC3 77.5 H3.. 2,980 1 brt F{zu,}{zb Me23o, H56, C2,C23,C24Ca 38.0
C5 54.5 Hs.' 0.773 1, m H3.'H9.'Me23.' CeCzCztCz+Czs
C5 17.6 H6uHr¡
1 541 392
I1
mm
Cs, C7C5, C7
C7 38.E ffzaHz¡
1.4350.924
1
1
mm
C5
Ce.Cs,CceC6 39.8
Ce 46.8 H9o 1,.432 1 m H11u H5.t Cg,C2s,C26cro 36.2
ctr 22.8 HttaHrr¡
1.8150.976
1
1
mm
H9* H116, H12Hrr^
C9,C12,C19Ctz,ct3
Ctt 1.24.4 I{t¡ 5.118 1 brd Hlt" Cr r, CraCrs 137.6
Cr¿ 4L.3
crs 26.5* HtsaHl rr
1,.4631.081
7
T
mln
cro 27.5" Hte uHret
1.6731,.546
1,
1,
mm
ctz 32.3
crs 52.0 Hrss 2.092 1 d,11.4 Hls., IlzagHzss CrzClaCl¿CvCtBCrs 39.0 Hig., 'r.272 1 111 H16sH26sMe29s C1g,C2g,C2g
czo 38.3 }{zos 7.507 1 m HIgo., Me30o C1g,C21,C3g
czt 30.0 Hzl.uHrl¡
1.5031.467
1
1
mm
C2Cz
0r
o,
czzCzz
czz 36.0 }{zzuF{c¡¡
1.4081.267
L
1
mm
C17,C2¡,C21Czo,Cz't
Czz 28.8 Me23o 4.667 J s H5., Cz,C4,Cs,C24Cz+ 15.1 Mez+B 0.886 J s Me25ß C3,C4, CS, CZg
czs 14.7 Mezse 0.857 3 s Me24ß. Mezoe CLC5, Cs, CtO
cza 16.4 Mezos 0.747 3 s Mezso Cg, C9, C14
czz 23.5 N4e27,u. 1.030 J s Cg, C14, C15
czc 179.1
czs 77.6 lMezge 0.802 J d,6,6 H1s' Hrse C1g, C19, C2¡
cgo 20.5 Me3o". 0.904 .'t d,6.0 Hzoo c,zo,czl
Chapter 5.2 Compound E
Table 5.2.1:NMR data for Compound E - (97)#
*: assignments may be reversed
# 6oo MH" (1 u), tso MFIz 113ç¡' ö (ppm) from intemal rMS in cDC[3
I: Integration Mult. : Multiplicity
ROËSY. : Only those signals that were used to assign stereochemistry of the ring junctions are
recorded.
73
Chapter 6.1 Initial treatment
CHAPTER 6 FRACTION 4
6.1 Initial treafinent
Treatment of Fraction 4 yielded three compounds, as outlined in Diagram 6.1.1
and Diagram 6.1.2.
Fraction 4 (1,4 B) was separated from the original methanol extract (828 g) using
t00% ethyl acetate as the eluting solvent,
Initiatly L g of Fraction 4 was partitioned between hexane (100 ml) and a
methanol (90 ml) f water (10 ml) mixture The methanol/water fraction was then
freeze-dried and redissolved in methanol. This was then partitioned withchloroform (100 mL), methanol (90 mL) and water (10 mL) and the chloroformextract labelled a.E (45 mg).
A TLC of Fraction 4.E (a5 mS) revealed two blue spots under W light. It was
subjected to flash chromatography (silica, isocratic, 99% ehloroformlt%methanol) to give nine fractions.
Fraction 4.8.6 (22m9) gave two clear peaks under normal phase analytical HPLC(isocratic, 50% hexanel 50% ethyl acetate, 330 nm, 1 ml/min., 30 min.). These
peaks were then collected using normal phase analytical HPLC under the same
conditions and labelled 4.8.6.1, (1 mg) and 4.8.6.5 (2 mg). When both these
fractions were reinjected under the same HPLC conditions as previously, they
appeared as single peaks at the expected retention time.
It '',vas decided that the rest of Fraction a (13 g) would be subjected to an identical
partition process to isolate more of these compounds. The chloroform exbract ofthis second partition process was labelled 4.C (200 mg),
4.C was then subjected to flash chromatography (silica, isocratic, 99% chloroform
11,% methanol) to give nine fractions.
Fraction 4.C.3 (100 mg) contained a blue spot at the same R¡ as 4.E.6.5 and rvas
then flash chromatographed (silica, isocratic, 99% chloroform/ L% methanol) a
second time to give nine fractions.
74

Chapter 6.1 Initial treatment
Fraction 4.C.3.3 (ó3 mg) was then subjected to normal phase preparative HPLC(isocratic, 50% hexanelS0% ethyl acetate, 330 nm, 5 mL/min, 30 min,) to give
three fractions.
Fraction 4.C.3.3.2 had the sarne retention time as 4.E.6.5. Fraction 4.C.3.3.2 was
labelled Compound F (25 mg). The structure determination of Compound F is
discussed in Chapter 6.2, p977.
Fraction 4.C.6 (27 mg) was also subjected to normal phase analytical HPLC(isocratic, 50 % hexane/SO /o ethyl acetate, 256 nm, 1 ml/min, 30 min.) where 4
mg of 4.C.6.1, was isolated. This fraction was labelled Compound G (4 mg) (see
Chapter 6.3, pg 88).
There was insufficient material to make a definitive determination of the
structure of Fraction 4.E.6.1 (1 mg). This is still being pursued.
Diagram 6.L.L: Separation of Compound FFraction 4
1g
Pa¡tition, hexane (100 mL) /methanol (90
mL) /water (10mL)
4 Hexane 4 Methanol
Partition, chloroform (100 mL)/methanol(90 ml)/water (10 mL)
4¡45mg
4 Aqueous
Flash chromatography, silìca, isocratic,99% chloroform /1% methanol
t-T4 E I 4F.2 4.E3 48.4 4 E5 4.8.6 4F,7 4 E I 48.9
mg
Normal phase analytical HPLC, isocratic,50% hexane/S0% ethyl acetate,
330 nm, 1 ml/min., 30 min.
4.8.6.2 4.8.ó.3 4.8.6.4 4.E.65 4.8.6.7 4.E.ó.8 4.8.6.9
4.8.6.1Structure under revision
1mg
4.E.6.5Compound F
2mg
7s
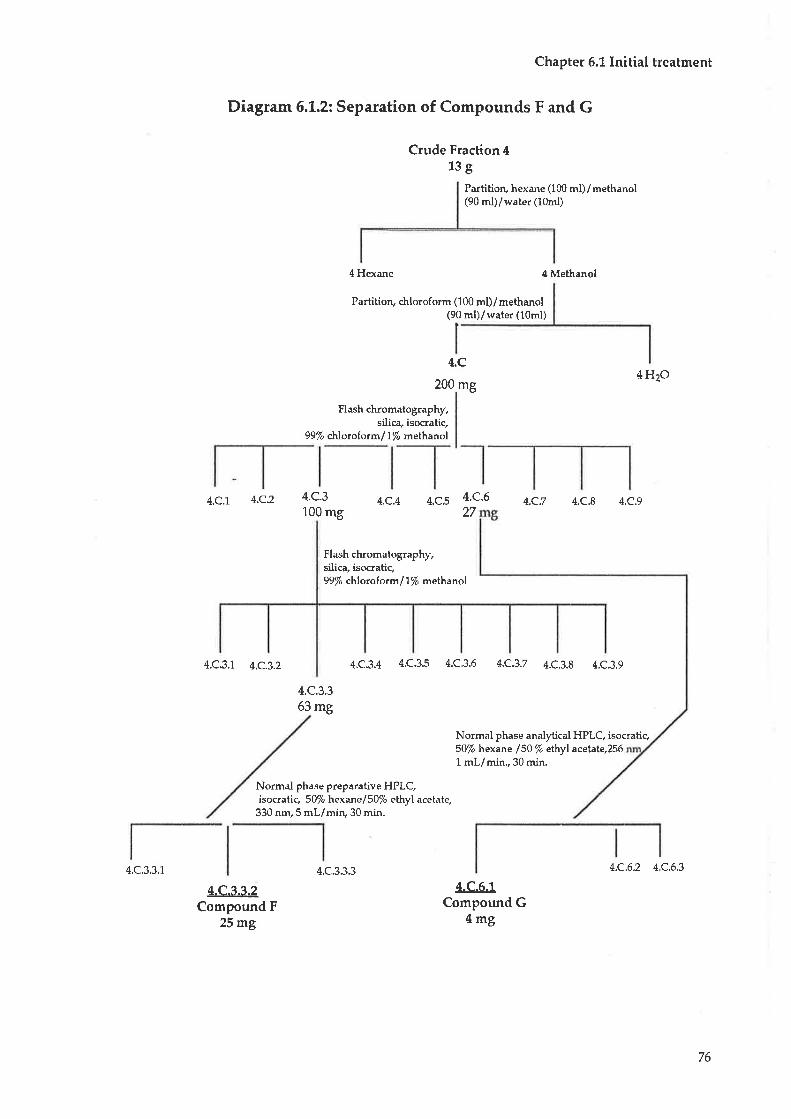
Chapter 6.1 Initial treatment
Diagram 6|1,.2: Separation of Compounds F and G
Crude Fraction 413g
Pa¡titioo hexane (100 ml) / methanol(90 ml)/water (10m1)
4 Methanol4 Hexane
Partition, chloroform (100 ml)/methanol(90 ml)/water (10m1)
4.C
200 mg4t{2O
Flash ch¡omatography,silica, isocratic,
99% cNo¡oform l7% ¡nethanol
4,C.33.1
4.C.1 4'C2 4'C'3 4.c.4 4.c.s 4'C.6 4.c.2 4.c.E A.c.s100 mg 27
Flash cfuomatography,silic¿" isocratic,99% ctú.oroÍotm/ 1/o methanol
4.C3.1 4.C.3.2 4,C.3.4 4.C.3.s 4.C.3.ó 4.C.3.7 4C,3,8 4,C3,9
4.C.3.3
63 mg
Normal phase analy.tical HPLC, isocratic,50% hexane 150% ethyl acetate,256L ml/min.,30 min.
Normal phase preparative HPLÇisocratic, 501/o hexane/50/o elhyl acetate,330 nm,5 ml/min,30 min.
4.C.33.3 4.C.6.2 4.C.6.3
4.C.6.1Compound G
4mg
4.C.3.3.2Compound F
25mg
76
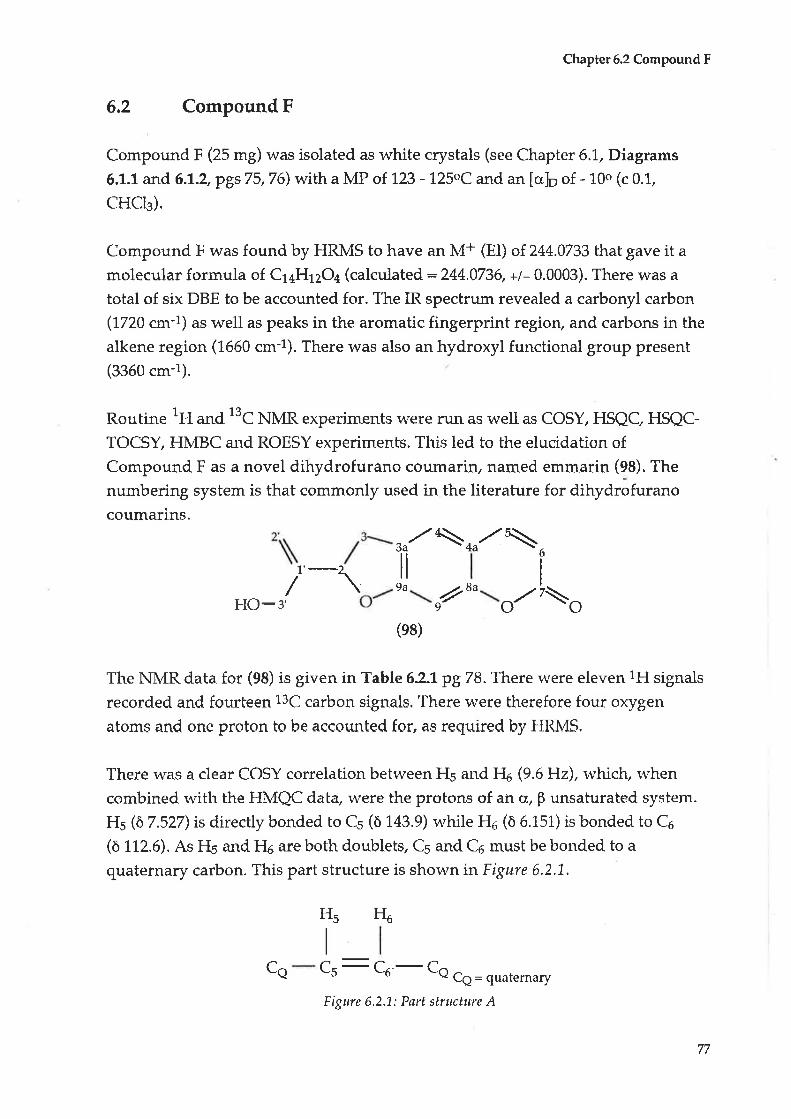
Chapter6.2 Compound F
6,2 Compound F
Compound F (25 mg) was isolated as white crystals (see Chapter 6.L, Diagrarns
6.1.1 and 6.7.2,p9s75,76)witha MP oÍ123 - 125oC and an [eJo of - 10o (c 0.L,
CHCIg).
Compound F r,vas found by HRMS to have an lr4+ (EI) of 244.0733 that gave it amolecular formula of C1aH12Oa (calculated:244.0736, +/- 0.0003). There was a
total of six DBE to be accounted for. The IR spectrum revealed a carbonyl carbon(7720 crn-1) as well as peaks in the aromatic fingerprint region, and carbons in the
alkene region (1660 cm-l). There was also an hydroxyl functional group present(3360 cm-l).
Routine 1H urLd.13C NMR experi:rr.ents were run as well as COSY, HSQC, HSQC-
TOCSY, HMBC and ROESY experiments. This led to the elucidation of
Compound F as a novel dihydrofurano coumarirL named emmarin (9S). The
numbering system is that commonly used in the literature for dihydrofuranocoumarins.
eu/\*/\
i-\ r'9
8ail
9a
(e8)
6
o/t\HO-e' o
The NIVIR data for (9S) is given in Table 62J-pg 78. There rvere eleven 1H signals
recorded and fourteen 13C carbon signals. There were therefore four oxygen
atoms and one proton to be accounted for, as required by HRMS.
There was a clear COSY correlation between H5 and H6 e.6 Hz), vvhich, when
combined with the HMQC dala, were the protons of an a, p unsaturated system.
Hs (ò 7.527) is directly bonded to Cs (ò 143.9) while Ho (ô 6.151) is bonded to Co
(ò 112.6). As FIs and He are both doublets, Cs and Co nust be bonded to a
quaternary carbon. This part structure is shown ínFígure 6.2.L.
:co-coCç = quaternary
H6Hs
I
csca
Eigure 6.2.1: Part structure A
77
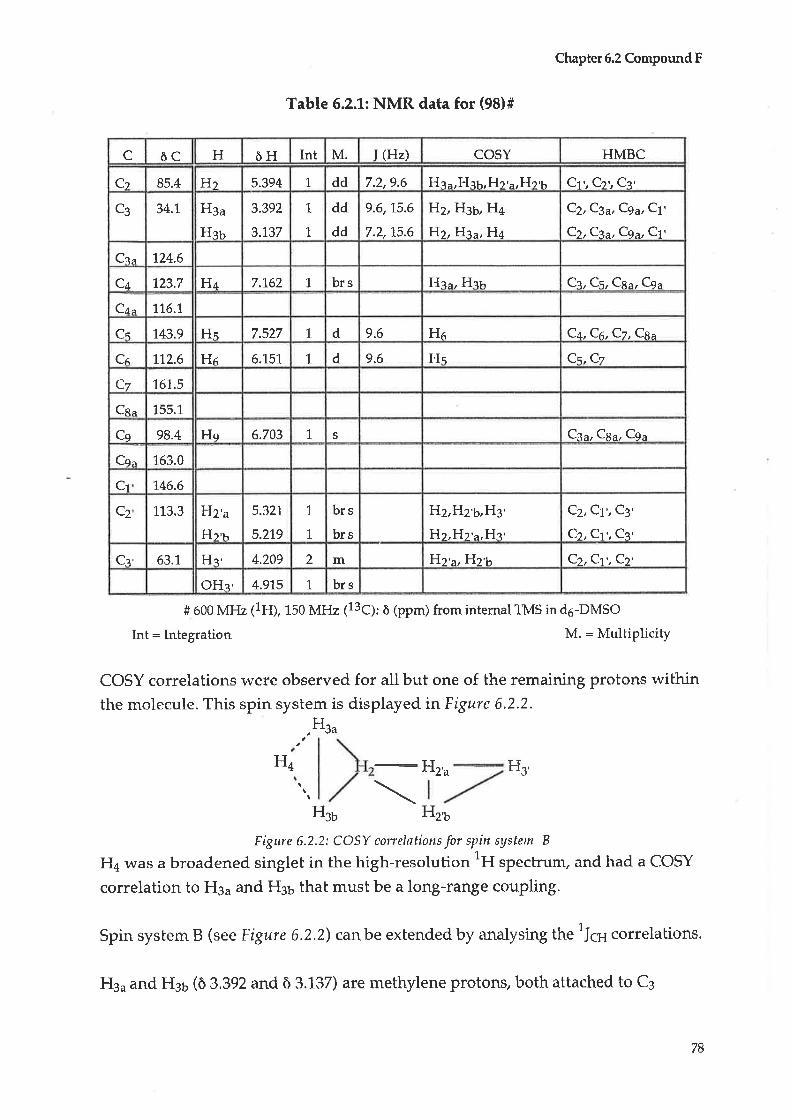
Chapter 6.2 Compound F
Table 6.2.1: NMR data for (98)#
C òC H òH Int M. I (Hz) COSY HMBC
C¡ 85.4 H¡ 5.394 1, dd 7.2,9.6 H.1a,H31r,H2'a,FI2,h C1 ', C2', C3'
C3 34.1 Haa
Hg¡
3.392
3.137
L
1,
dd
dd
9.6,15.6
7.7,15.6
FJ.2,fJ-.36,H4
FI2,}{36, H4
Cz,C3u, C9u, C1'
C2,Cg^,C9a,Cl
Ca, r24.6
C¿ 123.7 H¿ 7.162 1 brs H.q", Hab C3, Cs, Cg¿, C9¡
C¿,^ 116.t
Cs 743.9 Hs 7.527 1 d 9.6 Hr C4,C6,Cj,CB^
Cr 112.6 Hr 6.151 L d 9.6 Hs Cc,Cz
Cz 161.5
C8u 155. 1
Cq 98.4 Hq 6.703 1 s C3¿, Cg¿, C9¿
Cq^ 163.0
Cl 146.6
C2 113.3 Hz'u
Hlr'5.321
5.219
1
1,
brs
brs
H2,H2'6,H3'
}{t,Ht'a,Hz'
C2, C1', C3'
C2, Ct', C3'
Cq' 63.7 Ha' 4.209 2 m Fl2'^,}I21' C2,C'1',C2
OHa' 4.975 L brs
# 600 MHz (1H), 150 MHz 113ç¡' ò (ppm) from internal TlvtS in d5-DMSO
lnt: lntegration M. : MultiplicitY
COSY correlations were observed for all but one of the remaining protons withinthe molecule. This spin system is displayed inFigure 6.2.2.
Hgu
H4 Hz'u H3'
H¡u F{zv
Figtre 6.2.2: COSY correlations for spin system B
H4 was a broadened singlet in the high-resolution 1H spectrum, and had a COSY
correlation to H3u and H36 that must be a long-range couPling.
Spin system B (see Eigtrre 6.2.2) canbe extend.ed by analysing the t¡o .o.t"lations.
H3¿ and Hsu (ô 3.392 and õ 3.137) are methylene protons, both attached to C3
78
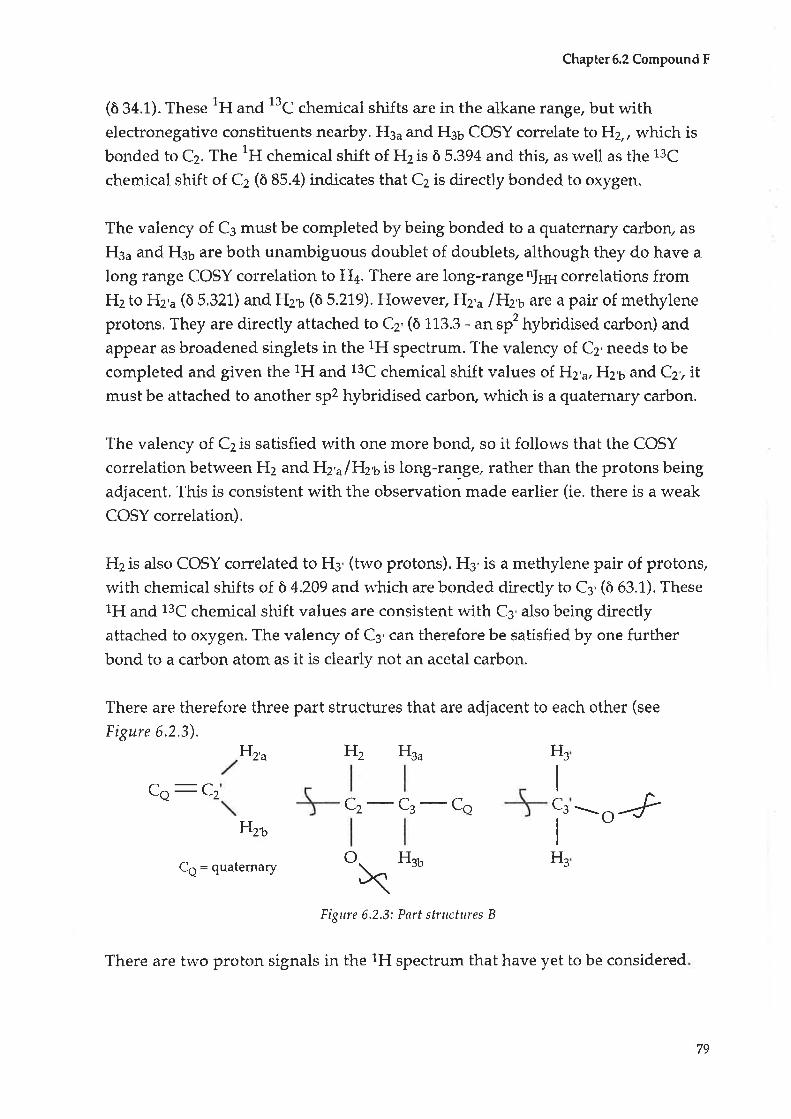
Chapter 6.2 Compound F
(ò 34.1). These 1H and t'C "h"*ical
shifts are in the alkane range, but withelectronegative constituents nearby. H3¿ and H36 COSY correlate to H2,, which isbonded, to Cz. The lH chemical shjft of H2 is ò 5.394 and this, as well as the 13C
chemical shift of Cz (ô 85.4) indicates that C2 is directly bonded to oxygen.
The valency of C3 must be completed by being bonded to a quaternary carbory as
H3¿ and H36 are both unambiguous doublet of doublets, although they do have a
long range COSY correlation to Ha. There are long-range n]¡¡1 correlations fromHz to Hz'u (ò 5.321) and Hz'u (ò 5.219). However, Hz'u /Hz'¡ are a paír of methyleneprotons, They are directþ attached to C2'(ò 113.3 - un rp'hybridised carbon) and
appear as broadened singlets in the 1H spectrum. The valency of. C2' needs to be
completed and given the lH and 13C chemical shift valu€s of Hz'a, Hz,¡ and Cz', itmust be attached to another sp2 hybridised carbory which is a quaternary carbon.
The valency of C2 is satisfiecl with one more bond, so it follows that the COSY
correlation between H2 and F{z,alÍhvis long-range, rather than the protons being
adjacent. This is consistent with the observation made earlier (ie. there is a weakCOSY correlation).
H2 is also COSY correlated to H3' (two protons). H3' is a methylene pair of protons,
with chemical shifts of ò 4.209 and which are bonded directly to C3' (ò 63.1). These1H and 13C chemical shift values are consistent with C3'also being directþattached to oxygen. The valency of C3'can therefore be satisfied by one furtherbond to a carbon atom as it is clearly not an acetal carbon.
There are therefore three part structures that are adjacent to each other (see
Figure 6.2.3).Hz'u
cz- Ce -
cc -o -?Hzt
Ce = quaternary
\
H3
I
c3
I
H3
HsuH2
H¡uo
c2ca
Figløe 6.2.3: Pnrt structures B
There are two proton signals in the lH spectrum that have yet to be considered
79

Chapter6.2 Compound F
H¿- a proton directly attached to C+ - has un tFI chemical shift of õ7.762 and is a
broadened singlet. There is a very weak COSY correlation betrveen Ha to both H3¿
and H36, which must be due to long-range coupling.
The only other proton not mentioned so far is He, a singlet with a chemical shiftvalue of ò 6.703, attached to Ce (ò 98.4). These 1H and t3C .h.*ical shift values are
consistent with an aromatic proton attached to a carbon adjacent to bwo carbon
atoms, each with an oxygen attached.
Czu,CEu,Cz,Ctu, Ce¿ and C1'are all quaternary carbons that are not involved inany of the part structures established so far. The HMBC correlations listed inTable 6.2.L, pg78 were then used to establish connectivity.
Part Structure AThe pair of doublets, H5 and FI6, have ¿ 2/3J6scorrelation into C7 (ô 161.5). C7 is a
quaternary carbon within the range of the carbonyl carbon of an ester functionalgroup. The 13C chemical shift value for Co - ò 112.6 - indicates that it is adjacent to
a carbon that is directly attached to oxygen while the valency of C5 is completed by
being attached to a quaternary sp2 hybridised carbon (see Figure 6,2.4).
H5
\(
Xca vca
l( c7\ l(
o Ce =quaternary
Figure 6.2.4: HMBC correlntiotts for H5 and H6
Cau is a quaternary carbon with a i3C chemical shift value within the range of a
phenolic carbon (ò 155.1). H5 has an HMBC correlation into Csu. This indicates
thab Cs¿ is bond.ed to the oxygen of the esEer, in a position where Ffu can have a3JqH correlation to Cs¿ (Figure 6.2,5\
H6
ooo
l(
ar\
80

ì(
Hs
o
Chapter 6.2 Compound F
cs
.x OCO quaternary
Figure 6.2.5: HMBC correlations ftort H5 to Cgs
Although there are no HMBC correlations to the other quaternary carbon in the
position as shown in the diagram above, this arrangement accounts for one more
DBE as it results in the formation of a ring.
H5 also has an HMBC correlation into C4(õ L23,7) - an sp2 hybridised carbon -
whichis directþ attached to FI¿.FI4 (ò 7.L62) is a singlet and so C4 is also bonded totwo quaternary carbons. FIa has a2/slqtcorrelation into Cs and Caa. This confirms
the positioning of Ha adjacent to H5. The other carbonbonded to Ca is not onlyquaternary, but also must be sp2 hybridised. Also, given the 13C chemical shiftvalue of õ 123.7, Ca is adjacent to carbons that a¡e not directly bonded to oxygen.
The positioning of CEIFI+ is shown in Figure 6.2.6.
ca
IICau
Hs H4
C"*ì
CO: quaternary
FIza
x /coca
+ IICt"Xo o o
Figure 6.2.6: HMBC correlations from H5 to C4; H4 to C5 ilnd C6a
Part structure BThere are three part structures that have to be adjacent for their allylic coupling
to be observed.
o
H3HsuH2Hzo
He¡
c2co + -tscz- cs -
Cq
o
C3'---{-o
\CO: quaternary
Figure 6.2.3: Part structures B
H3
81
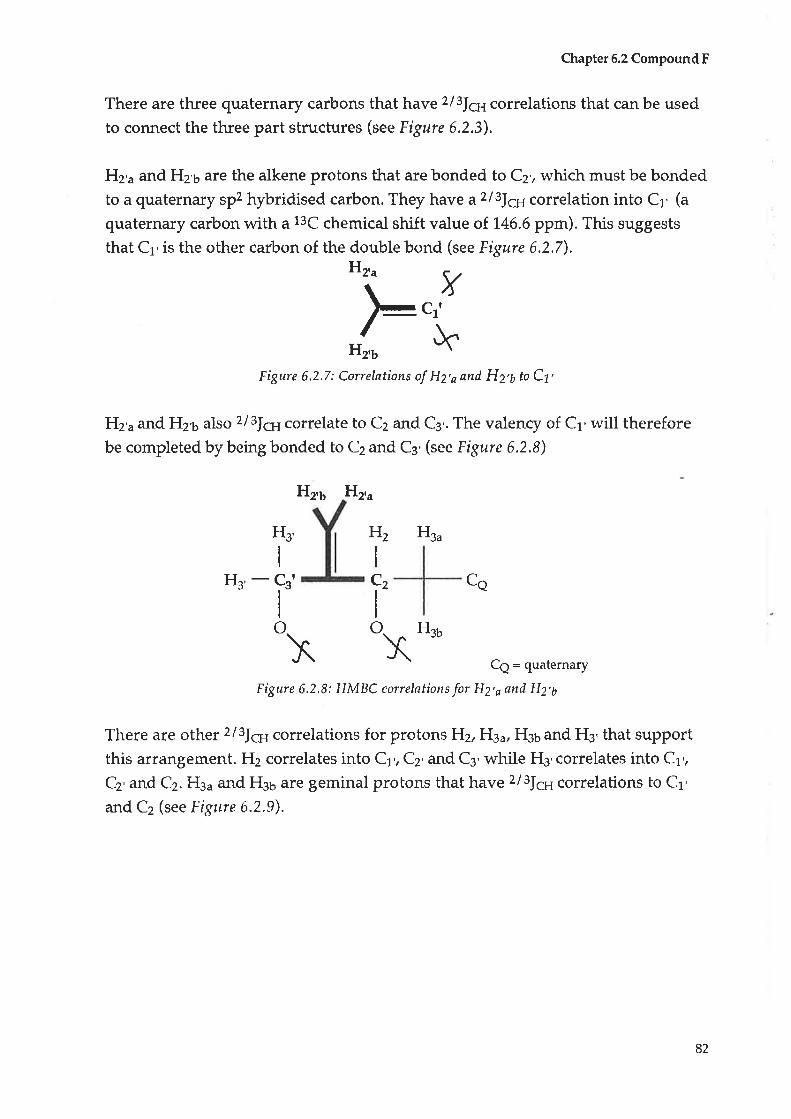
Chapter 6.2 Compound F
There are three quaternary carbons that have zl3|qrcorrelations that can be used
to connect the three part structures (see Flgare 6.2.3).
H2'¿ and H2'6 are the alkene protons that are bonded to C2,, which must be bondedto a quaternary spz hybridised carbon. They have azl3|eicorrelation into Cr, (a
quaternary carbon with a 13C chemical shift value of. t46.6 ppm). This suggests
that Cr,is the other carbon of the double bond (see Figure 6,2,7),H2'"
YCrt
Hz'b
Figare 6,2.7: Correlations of HZ,o ønd H2'6 to C7,
H2'¿ and H25 also 2lslça¡correlate to C2 and C3,. The valency of C1' will therefore
be completed by being bonded to C2 and C3' þee Figtre 6.2.8)
Hz'b H2,n
Hgu
co
3b
Ce: quaternary
Figure 6.2.8: HMBC correlations for H2,q ønd H2'6
There are other 213lc:t correlations for protons Fl2,Fl3v, H¡u and H3, that support
this arrangement. H2 correlates into Ct,, Cz,and C3' while H3'correlates into C1',
Cz' and Cz. Hgu and H36 are geminal probons tha[ have 213Jucorrelations to C1'
and C2 $ee Figure 6.2,9).
Þ ,}C
H
H2
I
c2
I
o
H3
I
Hs - Cs'
I
oXX
82
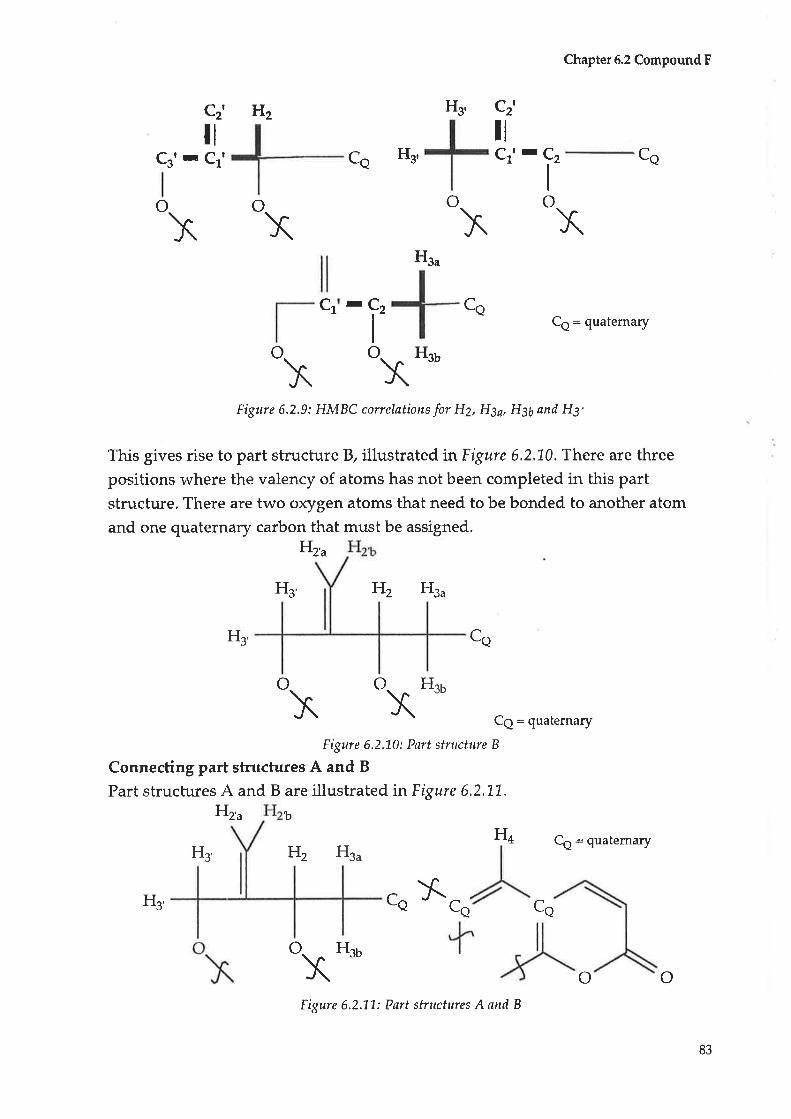
cz,
ilCgt - Ctt
o
H3,
H2
o
Hz,u b
ca H3'
Hgu
oXX
Cz'
IICr' - Çz Ca
I
oX
Chapter 6.2 Compound F
Ce: quaternary
Ce: quaternary
FI, Ce = quaternary
Hg'
o
Hsu
X
coc1 -CzI
XFigure 6.2.9: HMBC conelations for H2, HSa, HSb and H3'
This gives rise to part structure B, illustrated inFigure 6.2,1-0. There are three
positions where the valency of atoms has not been completed in this partstructure. There are two oxygen atoms that need to be bonded to another atom
and one quaternary carbon that must be assigned.Hz'u
H3' H2 Hgu
H3' ca
o o 3b
o¡""
XFigure 6.2.10: Part structure B
Connecting part structures A and B
Part structures A and B are illustrated inFigure 6,2.1-L,
XH
xH2
ca ca
Xo Hs¡
o
H3
Eigure 6,2.1L: Part structures A and B
ca
o
83
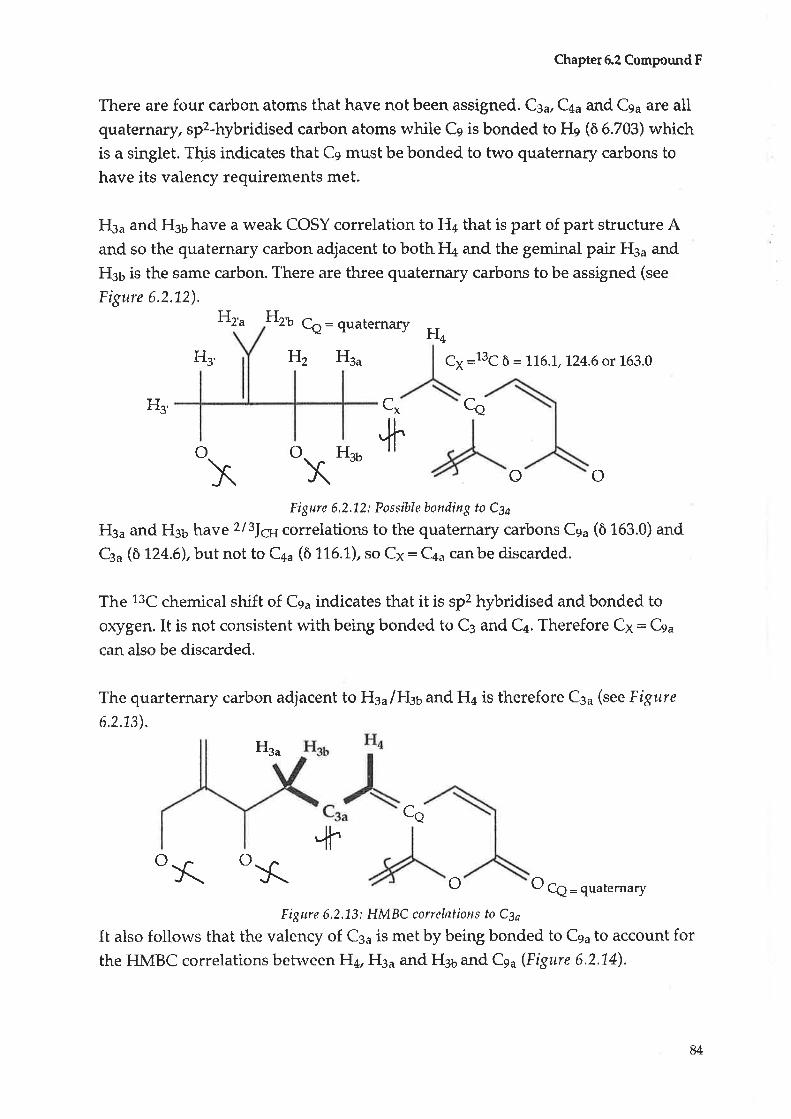
Chapter6.2 ComponndF
There are four carbon atoms that have not been assigned. Csu, C+u and Cga are allquaternary, sf-hybridised carbon atoms while Cq is bonded to Hs (ô 6.703) whichis a singlet. Tbis indicates that Cs must be bonded to two quaternary carbons to
have its valency requirements met.
H3a and H36 have a weak COSY correlation to Ha that is part of part structure Aand so the quaternary carbon adjacent to both ÉI+ and the geminal pair H3¿ and
H36 is the same carbon. There are three quaternary carbons to be assigned (see
Figure 6.2.1-2).
Hz'u Hzt Ce: quaternaryFI,
H3' H2 Hau Cx :13c ô : 116.1, 724.6 or 163.0
H3' ca
o
cx
.,11"oxt'o
+
X oFigure 6.2.1,2: Possible bonding to Cga
H3¿ and Hgu have zl3|atcorrelations to the quaternary carbons Ceu (ô 163.0) and
Ceu (ò L24.6),but not to C4¿ (ô 1-1-6.1), so C¡: C4a canbe discarded.
The 13C chemical shift of Cqa indicates that it is sp2 hybridised and bonded to
oxygen. It is not consistent with being bonded to C3 and C¿. Therefore Cx = Csu
can also be discarded.
The quarternary carbon adjacent to Heu/FIou and H+ is therefore Cgu (see Figure
6.2.13).
Hso
ca
o o
o
)( ì( o o Cç = quaternary
Figure 6.2.13: HMBC correlations to Cgs
It also follows that the valency of Csa is met by being bonded to Ce¿ to account forthe HMBC correlations betweeîH+, H3¿ and H36 and Csn (Figure 6.2.1-4).
u

Chapter6.2 CompoundF
Hsn Hsu H4
ca
o oo o Cç= quaternary
Fígure 6.2.'L4: HMIBC con:elations to Cga
There is only one more quaternary carbon, Cau (ò 116.1) which does not have any
HMBC correlations. Therefore C4u is at the ring junction (see Figure 6.2.L5).
C¿o
o o
Çs":(fx)(
$-- l( o oFigure 6.2.L5: Position of Cu
He is a singlet (ò 6.703), bonded to Ce (ô 98.4), indicating that Ce is bonded to [wo
quaternary carbons to complete its valency. He has HMBC correlations to C3u, Csu
and Ce¡. It follows that Cg is bonded to C6¡ and Cga. This will complete a second
ring and accounts for anotherDBE (see Figare 6.2.16).
o Cs"
Cgn
ICsnf of oo Y o
He
Figure 6.2.16: HMBC correlations for Hg
Given the 13C chemical shift value of Cqa (ò 163), it has to have its valency
requirements met by being bonded to an oxygen atom.
This structure accounts for alt the carbon signals. However it does not account for
one hydroxyl proton and, as drawry it contains one too many oxygen atoms.
Therefore, one of the oxygen atoms must be involved in the formation of a ring.
There are three possible structures that can accommodate this. In these structures
+
85

Chapter 6.2 Compound F
the multiplicity of the carbon to which the hydroxyl functional group is attached
is different. The three possibilities involve a quaternary (phenolic) carbon
(formation of a four membered ring), a methylene carbon (five membered ring)or a methine carbon (seven membered ring) - see Fþr.rre 6.2.1.7 and 18.
RR: rest of molecule
R
o R
HO R OH
Figure 6.2.L7: Possible structures A and B
o R
Figtre 6.2,L8: Possible structure C
All three structures account for the molecular formula C1aH12Oa and all DBE.
A 1H NMR spectrum was run in dry d6-DMSO. The hydroxyl proton was
observed as a triplet, indicating that the hydroxyl functional group was attached
to a methylene carbon (Structure B).
Therefore Compound F has the structure (98).
oOH
(e8)
There have been coumarins reported from plants of the Scaeaola genera that bear
a close relationship to emmarin (98). Angelomanin (44), nodakenetin /marmesin(45) and isoangelomanin (4e) have all been isolated previously from plants of the
S ca ev ola gener¿,35, 5+, ss
o
HOR
86
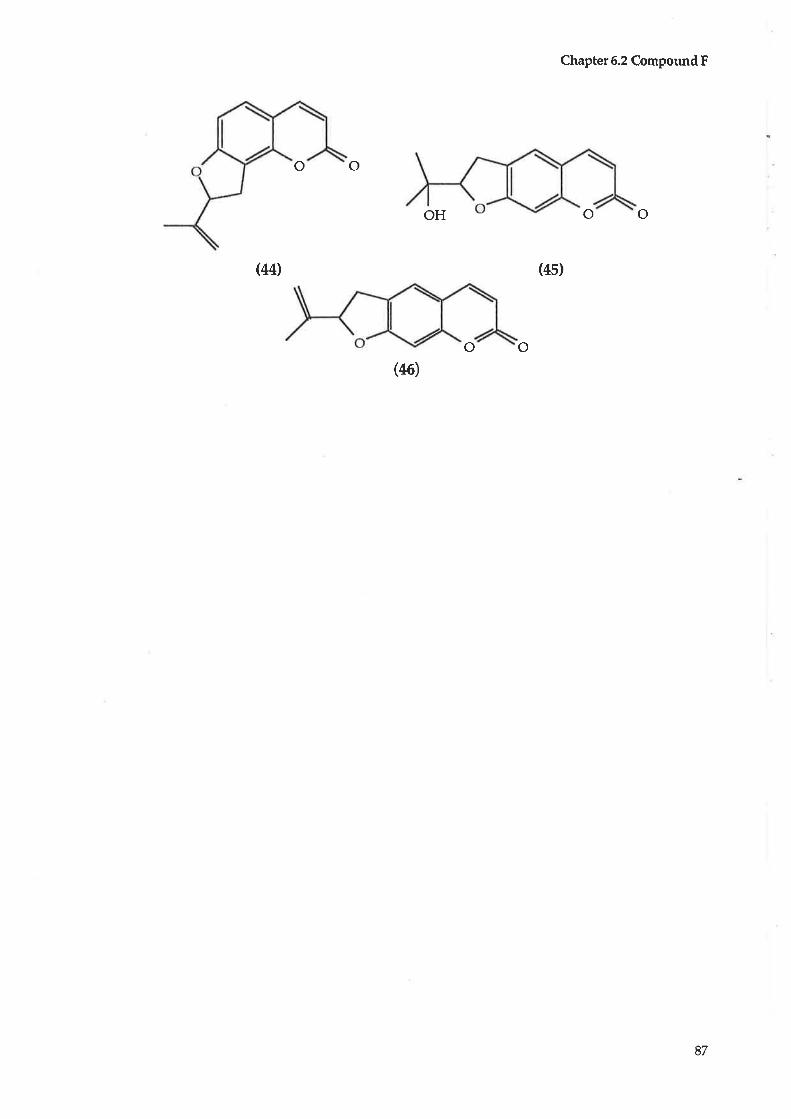
o o
Chapter 6.2 Compound F
o oOH
(44) (4s)
o o(46)
87
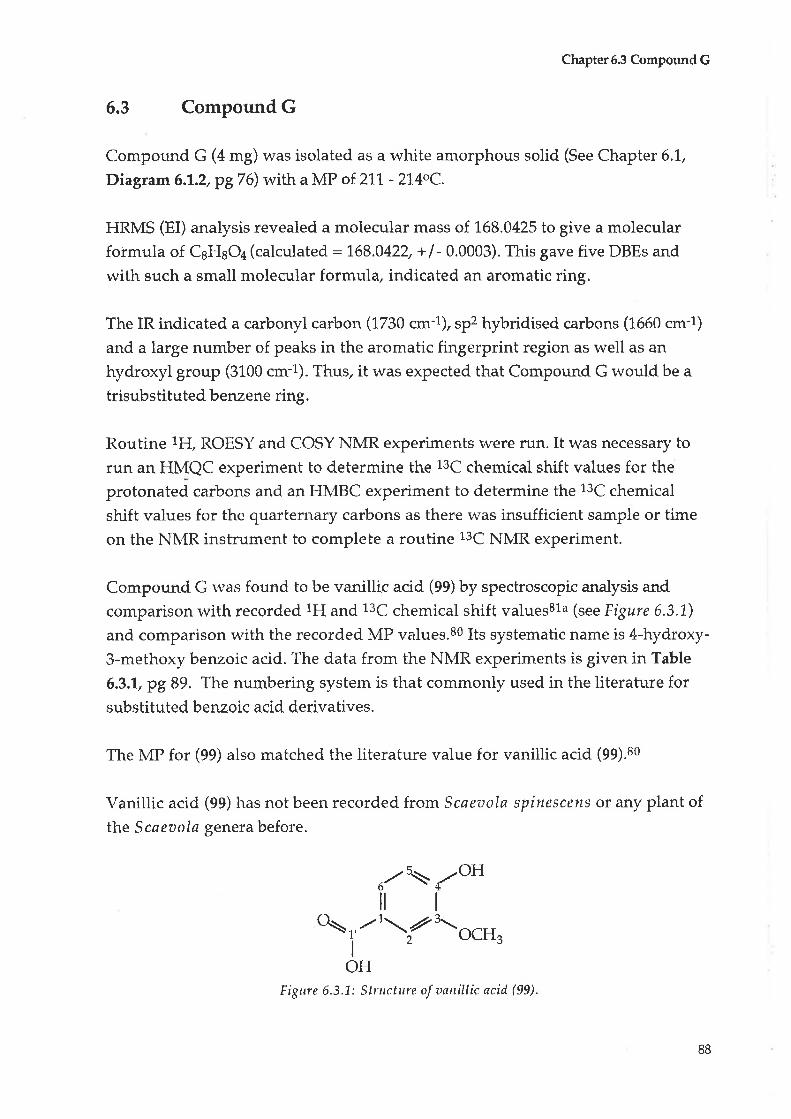
Chapter6.3 Compound G
6.3 Compound G
Compound G (4 mg) was isolated as a white amorphous solid (See Chapter 6.1.,
Diagram 6.7.2, pg76) r,vith a MP of 211 - 214oC.
HRIV{S (EI) analysis revealed a molecular mass of 1.68.0425 to give a molecular
formula of CgHsOa (calculated : 168.0422, + I - 0.0003). This gave five DBEs and
r,vith such a small molecular formula, indicated an aromatic ring.
The IR indicated a carbonyl carbon (1730 cm-l), spz hybridised carbons (L660 cm-1)
and a large number of peaks in the aromatic fingerprint region as well as an
hydroxyl group (3100 cm-l). Thus, it was expected that Compound G rvould be a
trisubs tituted benzene ring.
Routine 1H, ROESY and COSY NMR experiments were run. It was necessary to
run an HMQC experiment to determine the 13C chemical shift values for the
protonated carbons and an HMBC experiment to determine the 13C chemical
shift values for the quarternary carbons as there was insufficient sample or time
on the NMR instrument to complete a routine 13C NMR experimenb.
Compound. G rvas found to be vanillic acid (99) by spectroscopic analysis and.
comparison with recorded 1H and 13C chemical shift v4luqs81a (see Figure 6.3.1.)
and comparison w-ith the recorded MP values.80 Its systematic name is 4-hydroxy-
3-methoxy benzoic acid. The data from the NMR experiments is given in Table
6.3.1, pg 89. The numbering system is that commonly used in the literature forsubstitu.ted benzoic acid derivatives.
The MP for (99) also matched the literature value for vanillic acid (gq).ao
Vanillic acid (99) has not been recorded from Scaeaola spinescens or any plant of
tlte S caeuola genera before.
,/\ lo'ilt\t'/r\/'-oarr,
I
OHFigure 6.3.1: Stntcture of unnillic øcid (99)
88

C ôC H ôH Int. Mult. I (Hz) COSY ROESY HMBC
C1 721..5
C¡ LTz.O Ht 7.507 1 d L.2 Hr OCHe Cl, Cc, C¿
C¡ 146.3
C¿ 157.2
Cs 1.1.4.6 Hs 6.905 7 d 8.4 Hr 4-OH C3, C4, C6
Ce 125.2 Hn 7.638 1. dd 1.2,8.4 Hr. Hs Cz,C¿,,Ct'
Cr. 170.5
Ce 56.0 OCH¡ 3.893 3 S H¡ Ca
4-OH 5.986 1 S Hs
Chaper6S CompoundG
Table 6.3.1: NMR data for (99)
# 600 MFIZ (1H), 150 MHz 1r3ç¡' ò (ppm) frominternalTMs inCDC[3
Int. : Integration Mult. : Multiplicity
89

Chapter 7.2 Compound H
CHAPTER 7 FRACTION 5
T.L lnit:.al treatment
Treatment of Fraction 5 yielded one compound, as outlined in Diagram 7.1.
Fraction 5 (a g) and Fraction 6 (3 g) were separated from the original methanolextract (828 g) using 99/o ethyl acetate I 1,% rnethanol and 98/o ethyl acetatel2%
methanol as the eluting solvent, respectively. When run on TtC, these twofractions appeared very similar and so they were combined,labelled Fraction 5 (7
g) and then dissolved in 98/o ethyl acetate/2% methanol.
A white crystalline solid (250 mg) precipitated from Fraction 5 (98% ethylacetate/ 2% methanol). It was then recrystallized in 100% ethyl acetate. These
crystals were collected and labelled 5.1 (100 mg). The rest of the fraction was
labelled 5.2.
Fraction 5.L was then subjected to flash chromabography (silica, isocratic, 700 %
ethyl acetate) with three fractions being separated. The third fraction - 5.1.3 (52
mg) - was then recrystallized in 1,00% ethyl acetate and the crystals collected and
labelled 5,1.3.2. This fraction was one spot on TLC, and was labelled Compound H(26rr.g) (the structure determination is in Chapter 5.2, pg 91).
Diagram 7.1: Isolation of Compound HFraction 5
Recrystallizatiorç98/o elhyl acetate | 2/o methanol
Recrystallizatiorfr0o% åcetate
5.1
mg
øb
250 mg
s.1.3
52 mg
7
5'2Flash chromatography,
silica, isocratic,L00%
5 1.2
5.1.3.2Compound H
26mg
s.1.1
5.1.3.1
90
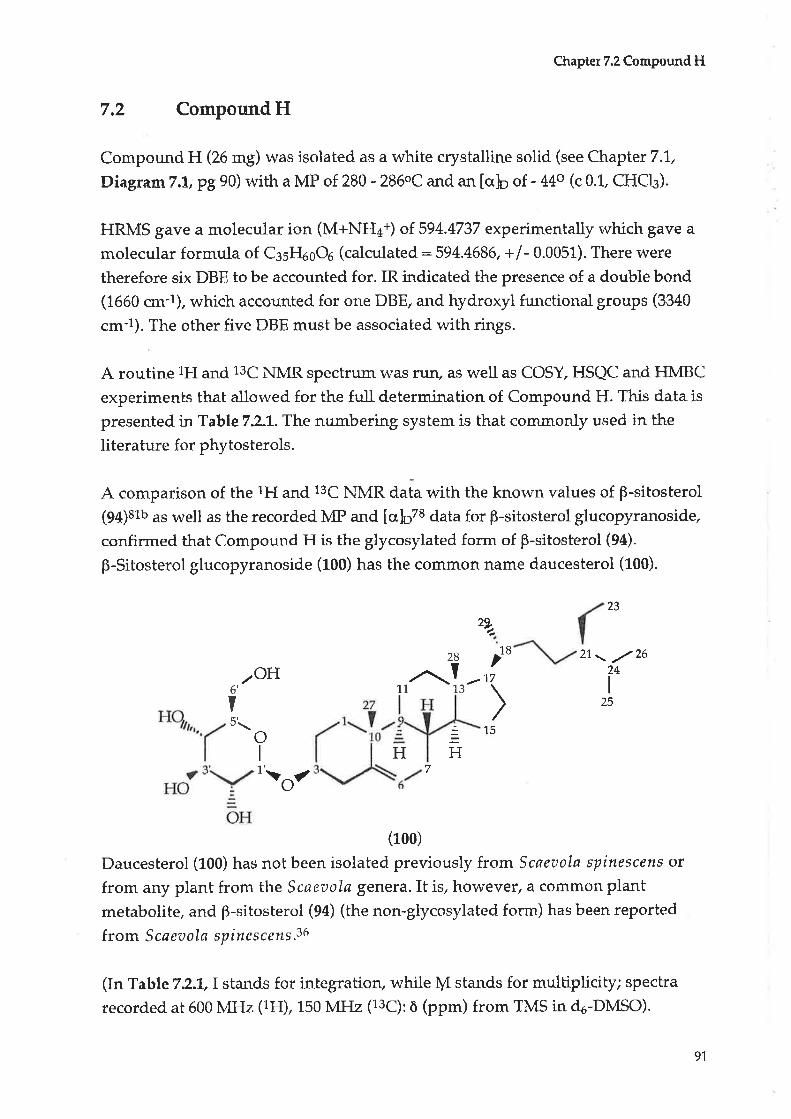
Chaptet 7.2 CompoundH
7.2 Compound H
Compound H (26 mg) was isolated as a white crystalline solid (see Chapter7.l,
Diagram 7.1, pg 90) with a MP of 280 - 286oC and an loh¡ of - 44o (c 0.1, CHCI¡).
HRN,{S gave a molecular ion (M+NH¿+) of 594.4737 experimentally which gave a
molecular formula of CssFIooOo (calculated: 594.4686, +/- 0.0051). There were
therefore six DBE to be accounted for. IR indicated the presence of a double bond
(1660 cm-1), which accounted for one DBE, and hydroxyl functional groups (3340
cm-l). The other five DBE must be associated with rings.
A routine 1H and 13C NMR spectrum was ruru as well as COSY, HSQC and HMBC
experirrrents that allowed for the full determination of Compound H. This data is
presented in Table 7.LL. The numbering system is that commonly used in the
literature for phytosterols.
A comparison of the 1H and 13C NMR data with the known values of p-sitosterol
(ee¡atu as rvell as the recorded MP and [aþzs data for B-sitosterol glucopyranoside,
confirmed that Compound H is the glycosylated form of p-sitosterol (9a).
þ-Sitosterol glucopyranoside (100) has the common name daucesterol (100).
23
toH28
H
| --'t13
1
ì7
)
(100)
Daucesterol (100) has not been isolated previously from Scaeaola spinescens or
from any plant from tlne Scaeaola genera. It is, however, a common plant
metabolite, and B-sitosterol (9a) (the non-glycosylated form) has been reported
from Scaeaola spinescens.36
(In Table 7.2.L,I stands for integration, v"hile IlI stands for multiplicity; spectra
recorded at 600 MHz (tH), tSO l\tËIz (13C): ò (ppm) from TMS in c16-DMSO).
zg.-
15
I 2l\ /,/2624
I
2516',
V5\
oIt'-ot
1
H7
91
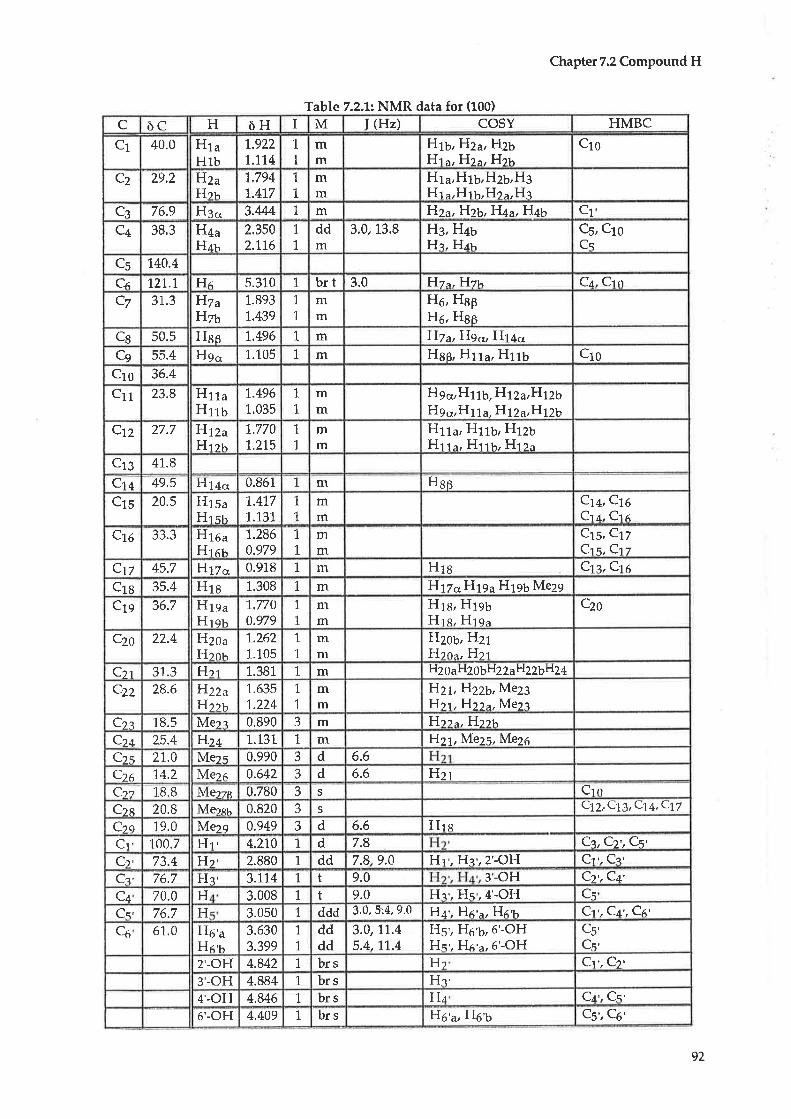
C òc H òH I M I (Hz) COSY HMBC
C1 40.0 HtaH1b
L.9221,.7'1,4
1
1
mm
HH
7b,ât
H2Hz
àt
ãt
Hz¡Hz¡1
Cro
C2 29.2 HzuHru
1..7941.417
1
L
mm
H1u,H1b,Hzb,HgH1a,H1b,H2a,H3
C3 76.9 HB.,' 3.M4 1 m H2¿H2b,}{Au,}J4b C1
Ca 38.3 H+aH¿r
2,3502.116
1
1
ddm
3.O 13,8 Hg, H¿bHq, H¿r
Cs, CtoCs
C5 1,40.4
CÁ rzL.1, H¿ 5.310 T brt 3.0 Hz",F{zt C¿, ClrlC7 31.3 H7u
H761.
1.
893439
1'1,
mm
Ho, HspHo, Hgß
Cg 50.5 Hso 'J..+96 1 m FI7a,Hg¡r,H"14ç,
Ce 55.4 H9* 1.105 1 m Hg6, H11¿, H116 crocro 36.4
H11uHrru
crr 23.8 1.4961.035
1
L
mm
Hg*Hrtb, Ht2a,H12bH9o,H11a, I{TZo,F{lZb
ctz 27.7 }{tzuHrrn
1.7701.215
1
1
mm
H11u, Httb, HrzUHl r
", Hr 1b, H1 2.
cr¡ 41.8
cr+ +9.5 H14.. 0.861 1 m Hsscrs 20.5 Htsu
Hrst1..477
L.1311
1,
mm
ct+,ctoCt ¿,, Cte
Crs 33.3 Hte uHren
1.2860.979
1,
L
mm
cts,ClzCts, Crz
Cu 45.7 Hryo 0.918 1 m Hrs Ctg,Cr6Crs 35.4 Hra 1.308 1 m HrTc, H19u H196 Me29
crg 36.7 H19uHrc¡
1,.770
0.9791
1.
mm
Hta, HtgbHrR, Hrq,
czo
czo 22.4 É{zo^Hrn¡
1..262
1.1051
1
mm
Hzob,F{ztF{to",H;t
C¡'t 31.3 F{tt 1.381 1 m H2g¿H2¡6H2ZaHZZ5HZ4
c-zz 28.6 F{zzuHzzt,
1.6351.224
1.
1
mm
H21,F{226,l|i4e23H¡t,F{zze,Mez.a,
Czz 18.5 Met?, 0.890 J m F{tt^,FItznCz+ 25.4 É{.z+ 1-.131 1 m H21, Me25, Me25
Cr.s 21.0 Mez.ç 0.990 J d 6.6
Czs 14.2 Mere 0.642 3 d 6.6 HzrCtz 1B,B Merzn 0,780 3 S Cro
Czs 20.8 Mern¡, 0.820 J S C12,C19,C74,CL7
Ctq 19.0 Mezs 0.949 3 d 6.6 HlsCl 100.7 Hl 4.710 1 d 7.8 Cz,Cz',Cs'Ct, 73.4 Hr, 2.880 t. dd 7.8,9.0 Hr', Ha', 2'-OH Cr', C?'
Cl 76.7 Ha' 3.174 1 t 9.0 30H Cl',Ca'Ca 70.0 H
H3.008 1, t 9.0 Hq', Hs',4'-OH Cs
Cs' 76.7 3.050 7 ddd 3.0, s4,9.0 F{¿',Hca,H,6in Cr', C¿', G'C6 61.0 H6'a
Hr'¡3.6303.399
1
1
dddd
3.0,77.45.4,71.4
HSi Ho'b,6'-OHHs', Hr'',6'-OH
C5'Cs'
2'-oH 4.842 1 brs Hz Cr', Cr'3',-oH 4.884 1 brs H?'4'-oH 4.U6 1 brs H¿ C¿', Cs'
6'-oH 4.409 1 brs H6'a, Hó'b cs', Co'
Table 7.21: NMR data for (100)
Chapter 7.2 Compound H
92
Chapter 8.1 tnitial treatment
CHAPTER 8 FRACTION 7
8.1 Initial treatrrent
Treatment of Fraction 7 yielded four compounds, as outlined. in Diag¡am 8.1.
Fraction 7 (16 B) was separated from the original methanol extract (828 g) using
95o/o ethyl acetate/5 % methanol as the eluting solvent. Fraction 7 was then
subjected to flash chromatography (silic+ isocratic, 9Q% chloroform/ L0%
methanol) to yield ten fractions, which were analysed by TLC.
Fraction 7.3 and 7.4 appeared to contain the same compounds and were added
together (10.75 B) and labelled 7.(3). This fraction was analysed by analytical
reverse phase HPLC (gradient, I00% water - 100% methanol 254 nm, 1mL/min.,30 min.) that indicated the presence of four compounds. Fraction 7.(3) (10.75 S)
was then subjected to flash chromatography (silica, isocratic, 90/o chloroform
I \0% methanol) to give six fractions, of which Fraction 7.(3).5 (192 mg) appeared
to contain the four compounds identified by reverse phase HPLC.
Fraction 7.(3).5 was then subjected to flash chromatography (silica, isocratic, 90%
chloroformlt0% methanol) to give eight fractions.
Fraction 7.(3).5.4 vvas analysed by reverse phase analytical I{PLC (gradient, L00%
water to 1.00% methanol,254 nm,1 ml/min., 30 min.) and u.'as found to be pure.
It was labelled Compoundl (26 mg). The structure determination of Compound Iis discussed in Chapter 8.2, pg 95.
Fraction 7.(3).5.5 (60 mg) was subjected to flash chromatography (silica, isocratic,
90% chloroform/ L0% methanol) to give ten fractions.
Fraction 7.(3).5.5.5 appeared to be pure and was reqystallized using9}/o
clrloroformll,0% methanol to give Compound I (10 mg). The structure
determination of Compound J is discussed in Chapter 8.3, pg 118.
Fraction 7.(3).5.5.6 was pure by analytical reverse phase HPLC (gradient, L00%
water - L00% methanol,254nm,1 mL/min.,30 min.) to yield Compound K (12
mg) (see Chapter 8.4, pg L22 for structure determination).
93

Chapter 8.1 Initial treatment
Fractions 7.(3).5.5.8 and 7.(3).5.5.9 were combined to give 7.(3).5.5.9.2b (15 mg)
which was then purified by analytical reverse phase HPLC (gradient, 100% water -100% methanol,254nm,1 mL/min.,30 min.) to yield Compound L (10 mg). The
structure determination of Compound L is discussed in Chapter 8.5, pg L25.
The purity of these compounds was analysed by analytical reverse phase HPLCunder two gradient systems and an isocratic system. The first gradient system was
tO}% water to I00% methanol (254 nm, 1 ml/min., 30 min.). The second gradientsystem was 70% water/ 30 /o methanol to 30% water/ 70 % methanol (254 nm, L
mL/min.,30 min,). The isocratic system was 50% water/50% methanol (254 nm,1 ml/min., 30 min.). The compounds all appeared as one peak under all three
systems.
Diagram 8.1: Isolation of four compounds from Fraction 7
Crude Fraction 776g
Flash chromatography,silica, isocratic,90% chlorof orm/ 10% methanol
7.(3)
1.0.75 g7.3
- -7.4Flash chromatography,silica, isocratic,90lo chlorofotm/ 10% methanot
7.(3).s
192mgFlash ch¡omatography,silic+ isocrabrc,90'lo chlorof or m/ 10% methanol
7.(3).s.4Compound I
26mg
7.(3).s.s
60 mgFlash cfuomatography,silica" isocratic,90% ch-loroform/ L0% methanol
Recrystallization,907á chloroform/109á methanol -t-l
7.(31.5.5.5
CompounclJ10 mg
7.(31.5.5,6Compound K
12mg
15
Combine, analytical reversephase HPLÇ gradient, J.00ft
rvater to 100% methanol,254 nar, 1ml/min,30 mi¡-
7.r3).5.5.8 7.(3\.s.5.9
7.(3).s.5.9.2bCompound L
1.0 mg
94

Chapter 8.2 Compound I
8,2 Compound I
Compoundl (26 mg) was isolated as a white amorphous solid (see Chapter 8.L,
Diagram 8.1, pg 94) with a MP of 94- 96oC and an [ct]p of - 64o (c 0.1, MeOH).
Compound I r,vas found to have a molecular ion of 653 (LSIM$ M+Na+) and 648 (CI,
M+NHa+) giving Compound I an overall mass of 630. HRMS gave a molecular mass
of M+Na+ of 653.2364 and therefore a molecular formtrla of C2eHa2Q5l.Ja (calculated
:653.2424, + I - 0.0060). This indicated nine DBE.
Standard lH and 13C NMR spectra indicated the presence of three carbonyl carbons
and two alkene doublebonds (seven sp2 hybridised carbons) accounting for five
DBE, leaving four to be associated with ring systems. In additiotU three methoxy
signals (one ester and two ether) as well as carbon and proton signals consistent witha sugar unit were observed.
An analysis of all NMR data 1tg, COSY, ROESY, 13C, DEPT, HIvIQC and HMBC)
allowed for the assignment of Compound I as a novel iridoid that was named
alydijosioside (108) (the numbering system is the one used for other iridoids in the
literature) (see Table 8.2.1, pg 96).
Mer
=o9
il
J
!Hs
__-tt 11'
ooll
7av /6"'qU
O/tt7'.
3'\O/t^.'tq O/
1"\O/ 5"\ ./oH6
(1os)
The standard lH spectrum gave most spin-spin coupling constants, and a COSY
experiment revealed three distinct and independent spin systems. The protons were
then assigned to their respective directly bonded carbon atom using, initially, aDEPT
experiment bo establish the carbon multiplicily, followed by an HMQC experiment to
unambiguously assign 1J6¡¡ correlations.
3
9
I5
4a
Mea
OH
I
The three nj¡r¡¡ spin systems have been independently analysed.
95

C òC H òH I. M. I GIz) COSY HMBC
Cl r73.3
C3 68.0 H3p
H3.,
4.46
4.30
1
1
dd
dd
3.6,11,.4
9.6,11.4
Hgo, H+
H:oH¿
C1,C4,CEarCg
Cr. C¿, Cq
C¿, M.5 FI4 2.55 1 td 3.6,9.6 H3s H3g H4¿ Cr,C4, C4", C9
C¿o 37.0 FI¿" 3.04 1 dddd 7.8.9.6.9.6.71.4 FI¿"FG.,F{ssFIz" Cr, C¿, Cs, Cz^, Cs
C5 38.5 rbB
FIso
1.62
2.20
1
1
ddd
dd
3.6,11..4,L3.8
7.8,73.8
FIqr Hs* Fk
FI¿r, F{ss
c4,claCs,Cz,Cza
Cr 78.2 FK 5.25 1 dd 3.6,7.2 FIS- HZ CL, CL^, Cz, Cll
Cz 43.7 w 2.48 1 ddq 7.2,7.2,7L.4 Fk, FI7a, MeB Cr
Cz^ 47.5 ÍIz" 2.n 'I dd 9.6,1L.4 H4aÍIT Cr C¿C¿"Cs CeCz
Cn ls.2 Mes 7.27 J d 7,2 rv Ce,Ct,Cz"
Cc) 17I.4
Ctn 53.8 Mero 3.75 J S Cq
Crr 1,66.3
Cr 97.6 Hl 5.36 1 d 5.4 FK Ce', Cs', Cr Cl"
Cq' 154.9 Ha' 7.v 1 s Ctl, Cl',C¿',C.q'
C¿, 110.8
Cs, 29.6 Hs, 2.90 1 ddd 5.4,6.6,7.2 Hs',H:q,e,H9r1 Cr rCICtC¿'CcCz'Cq'
Cr M.5 rk 2.7 r 1 dt 5.4,5.4,14.4 Hl; Hs', Hz' Cr', Cs', Cz'
Cz, 1æ.9 f{7' 5.68 1 m FIe; Fh' Cr', Cn'
Cn, 120.6 Hß' 5.32-.29 2 m F{z' Cs',Ct'
C9' 32.2 H9'u
Hsr"
2.04
1,.67
1
1
ddd
ddd
6.6,7.2,13.8
4.8,7.2,73.8
H5i H96, H1g'
Hs,, Hq'a, Hlo'
cs', Cto'
Cc', Crn'
Crn' 103.7 Hro' 4.49 1 dd 4.8,7.2 Hg'r, Hg'b cll',C12'
Cll 52.28 Mer' 3.292 J s Cln'
Ctz' 52,29 Merz, 3.298 J s Clo,
Cr" 98.6 Hr" 4.72 1 d 7.2 rb Cr; Cs"
Ct,, 72.9 Ht,, 3.39 1 dd 7.2,9.0 Hr", Ha" Cr; Cs"
Ca', 76.7 Ha 3.58 1 t 9.0 Í{7",f{a" C¡ C¿,
C¿" 70.5 H4 3,63 1. t 9.0 H.r", Hs" Cr", Cs"
Cs" 75.9 Hs 3.43 1 cldd 3.0,8.4,9.0 H¿"Fk"u Fk'r, Cr C¿
C6 62.5 Fk""
Fk"t'
3.93
3.86
1
1
dd
dd
3.0, 11.4
8.4,1.1.4
Hs,HobHc I{e^
C5"
Cs',
Chapter 8.2 Compound I
Table 8.2.1: NMR data for (108)#
#600 MHz (1H), 150 MFIz 1t3ç¡' ò (ppm) from internalTN'IS in CDCI3
I. : Integration M. : MultiPlicity
96

Chapter 8.2 Compound I
Spin system AThe entry point for spin system A was by protons Haoand H3p as their tH signals are
clear of other signals. They are coupled to each ottrer and eadl is also coupled to one
other proton, Ha. The rest of the COSY correlations are outlined in Figure 8.2.7.
-/Hr\Hi" Mea
H¿u
Hg',
Figure 8.2.1: COSY correlations þr spin system A
Protons H3o and H3B are geminal protons attached to C3. The lH and 13C chemical
shift values (1FI, õ 4.46, ò 4.30 ÍIz:73C, ò 68.1) are indicative of a carbon attached to
oxygen and bwo proton^s. Hs., and FIep are also coupled to H¿ that is directly attached
to Ca þee Figure 8.2,2).
H¡fi
Figltre 8.2.2: COSY correlations for H 3oand H3pto Ha
Ha also shows COSY correlations to Hau that is a methine signal. There must be one
other carbon-carbon bond for Ca to complete its valencl¡ âs its 1.3C dremical shift
value of õ 46.5 precludes being directly attached to oxygen. The last carbon-carbon
bond to C¿ must therefore be to a quaternary carborç as Ha orúy correlates with Hs*H3p and þu. This is illustrated in Figure 8.2.3.
Cq = quaternary
Figtre 8.2.3: Furtlrcr COSY conelatiotts
c4
I
co
97

Chapter 8.2 Compound I
Ha¿ is directly attached to C¿a (ö 37.0) and is a dddd, extensively coupled to H4, H5-H5B and H7¿. All 1H and 13C chemical shifts are in the range of alkanes. H5oand H5B
are geminal protons attached to C5. It follows that the valenry of Cauis filled by being
bonded to FI¿, C¿, Cs and C7¿. This is shov¿n inFigure 8.2.4.
Hz"
Ce: quaternary
8.2.4: COSY conelations þr H4a
H5B shows COSY corelations to H5 as well as to FIau. Ho (ò 5.24) is directly bonded to
Co (ò 78.2) with lH and 13C chemical shifts values consistent with a carbon attached
to oxygen. Hor.vever the proton H5" (geminal to H5p) has no COSY correlation to H6.
One possíble explanation for this is that H5., and FIó are approximately orthogonal to
each other and so a coupling would not occur. The n]¡1¡¡ coruelation between Fb* Hsp
and FI¿ is illustrated in Figure 8.2,5.
Cs-Ce-o
ca
Cç: quaternary
Figule, 8.2.5: COSY coneløtions for pørt struchne A
Hs is also coupled to Hz (ô 2.48) which is directly bonded to Cz (O ¿g.Z). Hz is coupled
to Mes (ô 1.21) that is a doublet with an integration of three. The probons of Mes are
bonded to a carbon with the 13C chemical shift value of ò 15.2.
H7 is coupled toHT¿, which has already been shown to be coupled to Ha¿. C7u is
directly bonded to Hza, which is coupled to Ha¿ and Hz.This indicates that C¿u is
T-
ca
ïT'"
HsF
98
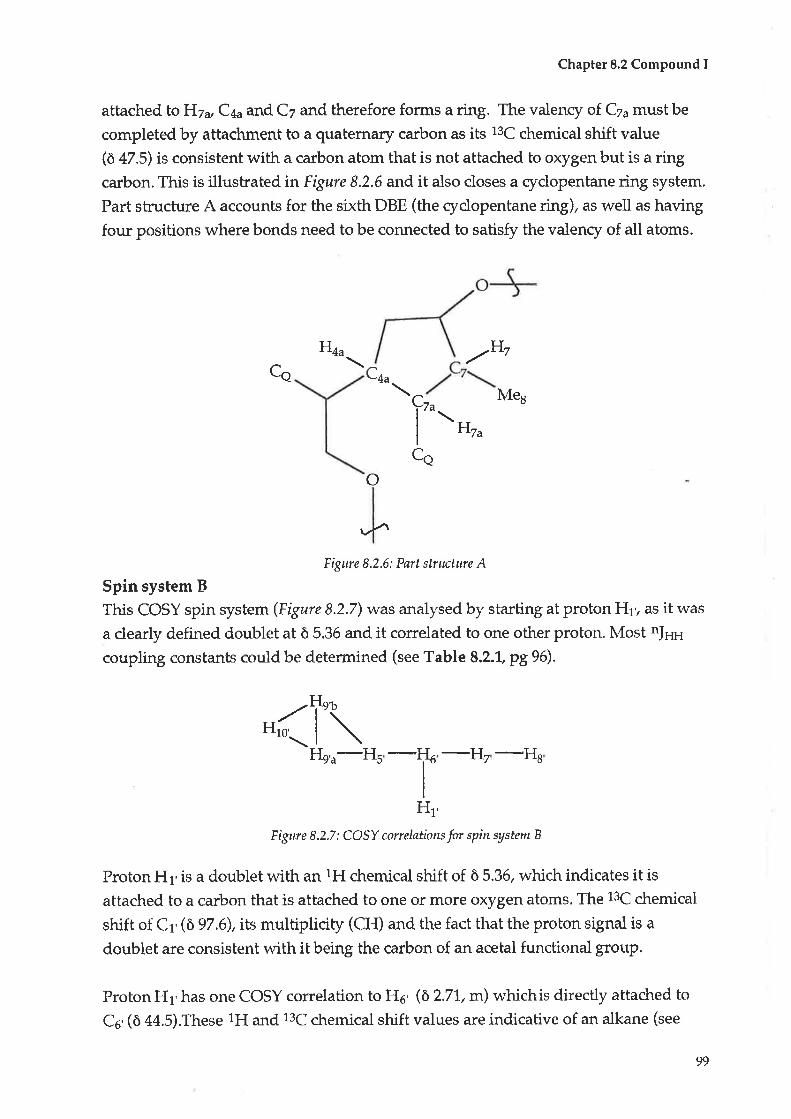
Chapter 8.2 Compound I
attached toHzu C¿a and Cz and therefore forms a ring. The valency of. Czamust be
completed by attachment to a quaternary carbon as its 13C chemical shift value
(ö 47.5) is consistent with a carbon atom that is not attached to oxygen but is a ring
carbon. This is illustrated inFigure 8,2.6 andit also closes a cydopentane ring system.
Part structure A accounts for the sixth DBE (the cydopentane ring), as well as having
four positions where bonds need to be connected to satisfy the valengz of all atoms.
H7
MesC¿u
H¿u
ca
Hzui"ca
(Ï\FL,u-Hs
-T -Flz -He
)(
Figtre 8.2.6: Part stnrctwe A
Spin system B
This COSY spin system (Figure 8.2.7) was analysed by starting at proton FI1,, âs it was
a dearly defined doublet at ô 5.36 and it correlated to one other proton. Most nJs¡¡
coupling constants could be determined (see Table 8.2.1, pE96).
H
H1'
Figure 8.2,7: COSY correlations þr spitr systern B
Proton Hl is a doublet with an 1H chemical shift of ò 5.36, which indicates it is
attached to a carbon that is attached to one or more oxygen atoms. The 13C chemical
shift of Cr'(ô 97.6), its multiplicity (CH) and the fact that the probon signal is a
doublet are consistent with it being the carbon of an acetal functional group.
Proton H1' has one COSY correlation to H5' (õ 231, m) which is directly attached to
Cs'(ò 44.5).These lH and 13C chemical shift values are indicative of an alkane (see
99

Chapter 8.2 Compound I
Figure 8,2,8).
'-FIl'
Eigure 8.2,8: COSY correlations for part structure B
FIo,is also COSY correlated to two other protons. FIo'correlates to H7that is a signal
that does not overlap with any other proton signal. H7.has an integration of L, a 1H
chemical shift of ô 5.68 and is directly attached to C5' (ò 133.9). This data indicates an
alkene. Ha'COSY correlates to H6'that are two protons with a 1H chemical shift of
behrueen ò 5,32 - 5.29 and which are clearly terminal methylene protons attached to
Cs'(õ 120.6). Due to the complexity of the multiplet the coupling constants for H7orHs' could not be determined (see Eígwe 8.2.9).
t_f- t\,7
Hs,
Figure 8,2.9: COSY correlntions for pnrt stntcture B
H6'has a COSY correlation to H5'that is a proton with a 1H dremical shift of õ 2.90.
H5'is directly attached to Cs,. H5'is also COSY correlated to He'u and þ5' that are
geminal protons attached to Ce'(ò 32.2). Cs.is directly bonded to H5', Cs'and Cg' .
There are Ro other COSY correlations for Hs'. This suggests that the valency for Cs'
will be completed by it being attached to a quaternary carbon (see Figure 8.2.1-0).
100

Chapter 8.2 Compound I'-.4
Hs'u
"(
ca
,xCq: quaternary
Figure 8.2.1.0: COSY conelations for part stt'ucture B
He,¿ and Éfu5 correlate to each other and to Hro'. Hro, is a proton with a chentical shiftof ô 4.46 directly attached to Cro' (ô 103.7). This indicates that C1s' is an acetal carbon.
This is illustrated inFigure 8,2.1,L.
Hto\
Cq: quaternary
Figrc 8.2.'L'1: COSY correlntions þr part structute B
This part structure accounts for one DBE associated with the double bond and has
five positions lvhere the valency of individual atoms needs to be completed. It also
accounts for four oxygen atoms.
Spin system C
Spin system C (Frgr.rre 8.2.L2) was entered via proton F{1", as this was a clearly
defined doublet correlated to one other proton. It was possible to determine all the
coupling constants for this spin system (see Table 5.2.1+pg96). The 1H and 13C
chemical shift values, the COSY correlations and the lJ¿¡1 assignments are all
tto-..
ì(
101
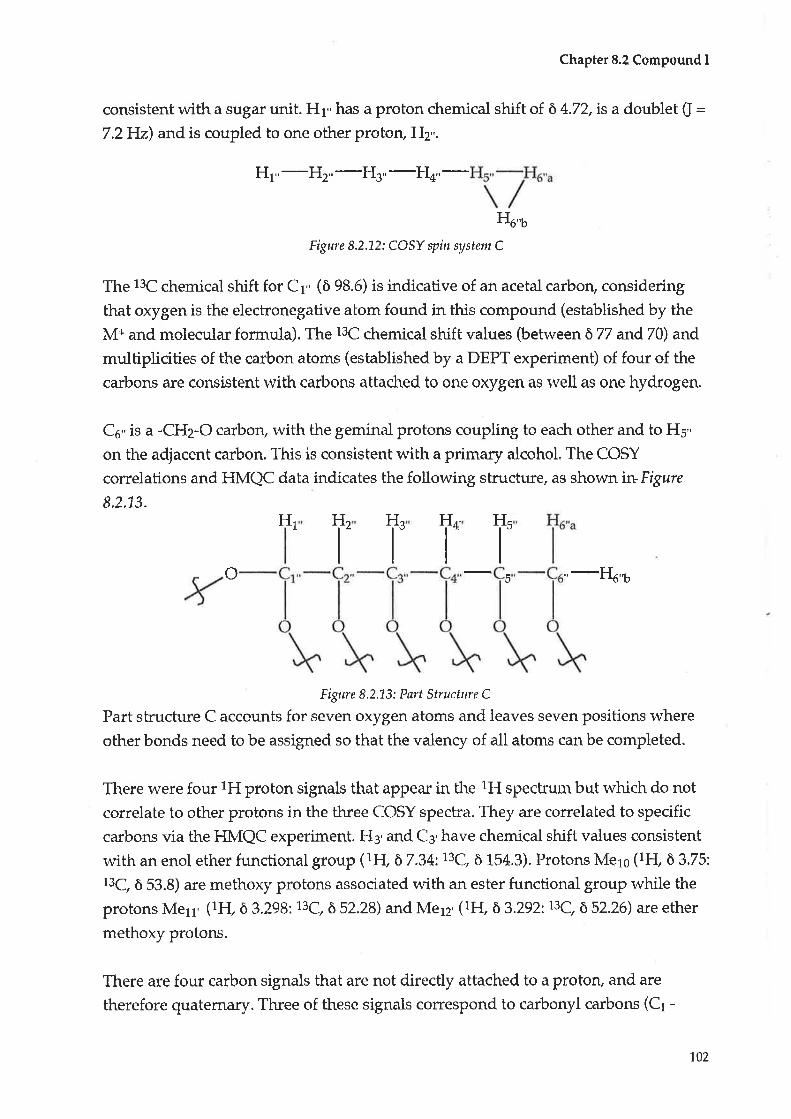
Chapter 8.2 Compound I
consistent with a sugar unit. H1" has a proton chemical shift of õ 4.72, is a doublet (J =7.2FJ2) and is coupled to one other proton, H2,,.
Hr"-Hz"-H¡"-H¿"-
Ho't
Figure 8.2.L2: COSY spin system C
The 13C chemical shift for Cr,' (ô 98.6) is indicative of an acetal carbon, considering
that oxygen is the electronegative atom found in this compound (established by the
M+ and molecular formula). The 13C chemical shift values þetween ò 77 and 70) and
multiplicities of the carbon atoms (established by a DEPT experiment) of four of the
carbons are consistent with carbons attached to one oxygen as rvell as one hydrogen.
C5,'is a -CI{2-O carborç with the geminal protons coupling to each other and to H5',
on the adjacent carbon. This is consistent with a primary alcohol. The COSY
correlations and HMQC data indicates the following strucbure, as shown i*Figure8.2.73.
H1
o 5 "-F1'tT'T'T,
H,
I
Figre 8.2.L3: Pørt Structure L
Part structure C accounts for seven oxygen atoms and leaves seven positions where
other bonds need to be assigned so that the valenry of all atoms can be completed.
There were four 1H proton signals that appear in the 1H spectrum but which do not
correlate to other protons in the three COSY spectra. Thuy are correlated to specific
carbons via the HMQC experiment. Hs'and C3'have chemical shift values consistent
with an enol ether functional group (1H, ò 7.34:73C, ò 154.3). Protons Mero (1H, ò 3,75:
13C, ô 53.8) are methoxy protons associated with an ester functional group while the
protons Merr' (1F1ô 3.298:13C, ò 52.28) and l\4ep' (tH' ¡ 3.292:13C, ò 52.26) are ether
methoxy protons.
There are four carbon signals that are not directly attached to a proton, and are
therefore quaternary. Three of these signals correspond to carbonyl carbons (Cr -
1,02

Chapter 8.2 Compound I
ö173.3,Cg-ò771.4,Crr-ò166.3)whilethefourthisalsospzhybridised(C+-ô110.8)(see Table 8.2.1, pg 96).
ConnectivityAn HMBC experiment was conducted to determine 2/3JcH correlations so that the
three part structures and the non-COSY protons and non-protonated carbons could
be connected to each other. This data is displayed in Table 8.2.Lp996.
Part skucture A has four position^s where connectivity needs to occur (Points A, B, C
and D) as shown below inFigure 8.2,1,4,
ìÊD
Ce: quaternary
co\./4u
A
4
CHe
Cca
Figne 8.2.L4: Points þr connectiott in Part Stt'ucture A
Mero protons are ester methoxy protons bonded to Cro and there is a 2/3Jclr
correlation from Mero to Cq, a carbonyl signal atõ 17'J,.4. There are HMBC
correlations between H3* H¡p H+ and FIau to Cq. C+ has one position where it has to
be bonded to a quaternary carbon. Thus the valency of Ca is completed by being
bonded to Cg (see Figure 8,2.75).D
--H4a
o
ilca
o
ilceM"r\o/
ì cH3H3CO
HsÊ
o
B
Figure 8.2.15: Connectiaity of Cg
co
co: quaternary
103
Chapter 8.2 Compound I
There are HMBC coffelations between Hs* Hsp H4¿ and Hzu to C1, another carbonyl
carbon. H3qand H3p are directly bonded to a carbo& Cg, with a 13C chemical shift of
ò 68.0, indicating that C3 is bonded to an oxygen atom. Carbon C7¿has to be bonded
to a quaternary carbon for its valency to be complete. Thus, the valency of the oxygen
at position B is completed by being bonded to C1 and the valenry oL Cza at position C
is also completed by being bonded to Cr (see Figure 8.2.16).
Part structure A is complete except for the oxygen at positionD. Ho is bonded to the
carbon bonded to the oxygen at position D and has a zl3[ç¡r correlation to a carbonyl,
Crr. Therefore the oxygen at position D is bonded to Crr. This gives rise to the
following part stmcture (Figure 8.2.16) and accounts for the seventh DBE. The
valency of C11 still has to be completed.
H3COOC
H¿"
/fa\
cH3
Hz^
,/"\oHgo
Figttre 8.2.L6: Connectiaity of Cl and C11
Part structure B has five positions where connectivity has to be established as shown
inFigure 8.2.1-7.A
<-
.--_+
E
Ce = quaternary
B
C
D
Eigure 8.2J17: Connections þr Part structure B
704
Chapter 8.2 Compound I
Merl and Me12' are methoxy protons with 1I-I chemical shift values consistent withthose of an ether functional group. These protons both have azl3|qt correlation to
C1s'that has the 13C chemical shift value of an acetal. As well as this, H1¡' þonded to
Cro,) shows HMBC correlations to C11,and C12'. This is consistent with a dimethylacetal functional group attadred to Cro, (see Figure 8.2.18).
aMetl'
/Me12'
o
E
C
D...-->l( ><--Cç: quaternary
Figw e 8.2.'1 8 : HMBC con elations for Me y and Me p,
There is an HMBC correlation from H3, to C¿'. H¡' is the hydrogen of an enol ether
and Ca' (ò 110.8) is the only sp2 hybridised carbon that has not yet been assigned so
must be bonded to C3' (ò 154.9). This is consistent with that of an alkene carbon
adjacent to an enol ether proton (Figure 8.2,1,9).
Y-.'t
H3'
Figre 8.2.L9: HMIBC correlations from H g' to C4'
The enol ether functional group can be placed in Part sffucbure B because of the
HMBC correlations from H5,to C3' and C¿,. and the correlations from H3,to Cs'. Cs'
has to be bonded to a quaternary carbon to complete its valency and Ca' is the last
quaternary carbon to be positioned in the molectrle (Figure 8.2.20).
105

ocI-I3
Chapter 8.2 Compound I
OCH 3
ocH3
l( 5
c4
ltca \o
l^
\ oKo/ç1':,.oHg'
ñ oNox,..
Figre 8.2.20: HMBC corelatiotrs for H 3' and Hy
A dihydropyran ring can be established" as there are HMBC correlations between H3'
and C1, (the carbon of an acebal functional group) and behveen H1' and C3'. This
structtrre is also supported by the 2/slçal correlations between FIs'to C1 as well as the
conelations between Hr,to C5' (Figure 8.2.21-).
ocH3 OCH3
ocH3Hs'
cs'
Cg'
Figure 8.2.2L: Cloure of a diltydropyranring
This is the third ring formed and accounts for the eighth DBE (The two double bonds
that are part of the skucture have already been accounted for).
Part structure A and B are joined by Crr (the carbonyl in Part structure A) bonding to
C¿' (the sp2 hybridised carbon in Part structure B) because of an HMBC correlation
between the protons Ffu'and Ffu'with C11, (see Figure 8,2.22). This part structure
accounts for all non-protonated carbons, all protons and the respective carbons that
ocH3
xoH1'
1,06
Chapter 8.2 Compound I
are not involved in COSY correlations and both pafi sh:uctures A and B. There is onlyone position for connectivity to part structure Ç the sugar unit.
ocH3
o o OCFI3
ll H'Crr
o
H3' o oEigure 8.2.22: Connecting fino part struc'tures uia C11
The sugar unit is illushated inFigure 8.2.L3 below.
T'ïïT'ïïFL't
o
Y
Figure 8.2.1"3: Part Structure C
There are HMBC correlations between H1" and C5', and between H5" and C1,' so that a
ring is formed. The sugar unit is a pyranose ring and accounts for the last DBE. C1"is
an acetal carbon, while C5,' is attached to a single oxygen atom (see Figure 8.2.23).
tt'\./ox ç too/c'ç
Hilo?
Figure 8.2.23: Formntion of the nryur ring
Hs"
ox
107

Chapter 8.2 Compound I
The sugar unit and the rest of the molecule are connected by an oxygenbridgebetween Cr" - the anomeric carbon of the sugar unit - and Cr' - the acetal carbon of the
dihydropyr¿rnose ring. This is established by the HMBC correlation between H1" and
C1 and between H1'and C1,'(Figure 8.2.24\.
cFI3
3
x
'\o\o oH1' H1"
Figre 8.2.24: Connectiott of the sugar unit
There is abroad singlet in the 1H spectrum that are hydroxyl protons as the peak
decreased in intensþ when DzO rvas added to the sample tube. The molecular
formula indicates that there are four hydroxyl protons.
The final structure (without stereochemi.try) is illustratedinFigure 8.2.25.This
structure accounts for the molecu,Lar formula C2eHa2O15, and for the nine DBE (four
ring$, three carbonyls and two carbon - carbon double bonds).
ocH3
OH
CH¡
oFigure 8.2.25: FulI stntctrre of Compowrd I without stereochenistty
Stereochemistry and conf ormation
NOESY and ROESY experiments and coupling constants (where applicable) were
used to establish the stereochemistry of each part of the molecule. All stereochemical
o
108
ChapterS.2 Compoundl
data - including coupling constants/ ROESY correlation.s and NOESY coruelations
for Compound I are given in Table 8.2.2.
Table 8.2.2; stereochemical and conformational data for Compound I#
M, : Multiplicity
H ôH Int M. I (Hz) COSY ROESY NOESY
H3p
H3.,
4.46
4.30
1
1
dd
dd
3.6,ll,4
9.6, LL.4
H3o, H4
Hae, H¿
}{s*HzF{¿,^,tiIz^
Hso, HZ
Ilt^,Ht^H¿ 2.55 t rd 3.6,9.6 H3¡r,H3g,H4¿ F{sr,, Hz F{s*Hz
H,¿,^ 3.04 L dddd 7.8.9.6.9.6.17.4 H4çrH5¿H5gH7¡ Hss H36, Me6
FtsÊ
Hso
1.62
2.20
1,
1
ddd
dd
3.6,1I-..4,13.8
7.8, 13.8
H4¿, H5o, H6
H4a, HsB
H6
H3ç1,l{4,H7
H6
F{3o'F{4,H7
Hs 5.25
2.48
L dd 3.6,7.2 Hsß, Hz H5.,, H7, CH3 H5*, Meg
Hz 1 ddq 7.2,7.2, Ll.4 Hr, Hz", Men H3.,, Hs.' H3.,, Hso
t{z^ 2.77 1 dd 9.6, r7.4 F{¿,",H1 H3g, CH3 H3g, Meg
Mes 1.21 J d 7.2 Hz H.s,Hz
Mero 3.75 J s
Hl' 5.36 1 d 5.4 Hr Hz', Hq'", Hq'l" Hq'Hz'Hq'"Hs'h
Hs 7.34 1 s
Hs' 2.90 1 ddd 5.4,6.6,7.2 Hr',Hq'',Hq'b Hl', Hz', Hro' Hr', Hz', Hro
Hr 2.71, 1 dt 5.4,5.4,74.4 Hr', Hs', Hz' HR', Hro' Hg', H9'6, H1 6,
Hz, 5.68 1 m Hr'. Hs HlHc'Hq'hHrn' HlHc'Hq'¡Hr n'
Hs 5.32-5.29 2 m }{z, Hr', Hln' Hs', Hr', Hrn'
Hg'a
Hq,s
2.04
1,67
L
1
ddd
ddd
6.6,7.2,73.8
4,8,7,2,13,8
H5', H95, H1¡'
Hs', Hq'^, Hrn'
H1'
Hr', Hz'
F{1',H¡t',H7'
}{l',Hd',Hz'
Htn' 4.49 1 dd 4.8,7.2 Hs'", Hs'¡ H.s'He'Hz'Hn' Hs'HcHz'Hs'
Merl 3.292 3 s all except H6' all except H¿'
Merl 3.298 J S all except Hr, all except Hc
Hr', 4.72 1 d 7.2 Ht,, Hq,', Hs" Hc", Hs"
Hz' 3.39 1 dd 7.2,9.0 Ht ", Ha" H¿" H+"
Ht 3.58 1. t 9.0 Flc",F{t' Hr", Hs" Hr Hs
Ht 3.63 1 t 9.0 H:", Hs" H:" Hz',
Hs" 3.43 1 cldd 3.0, 8.4, 9.0 H¿" Hr"a Ha"¡ Hr", H.r" Hr", Hc"
H6"u
H¿"¡
3.93
3.86
1
1
dd
dd
3.0, 11.4
8.4,1.1.4
Hs", He"u
Hq". Hr""
Int : Integration
#600 vfu (1H): o (pprn) from internal TMS in CDCI3
109

Chapter 8.2 Compound I
Sugar unitThe pyranose sugar could be positively identified as a B-glucoside from its
coupling constants in the 1H spectrum, with all nJmr values being between 7.8 - 9.0
Hz, indicating axial - axial coupling. The ROESY experiment confirmed this
stereochemistry, as there was H1" - H3" - FIs" ROE correlations for protons on one
side of the ring (l,3-diaxial interachions) and Hz" - FI¿" correlations for protons on
the other side of the ring.
There are also ROE correlations between Hr,'- Hs', - H5" and protons on the
dihydropyranose ring, such as Hri FIs' and FI5'. This indicates that the glucose ringis fixed in a position underneath the dihydropyranose ring. There are no ROE
correlations between protons H2" and FI¿" and protons on the dfüydropyranose
ring.
Part structtrre APart structure A with all protons labelled is displayed in Figure 8,2,26.
H3COOCCH¡
Hzu
Hgo
Figttre 8.2.26: Position of the labelled protons in Part stntcture A
It is necessary to consider that the coupling constant data is an average of the
conformers possible, while the ROE correlations are a reflection of the relaxation
time scale and so it is possible that different conformers are observable in the
ROESY data. (The absence of a ROE correlation does not mean that the correlation
is not present, as changing the mixing time on the experiment might produce a
correlation which wasn' t obs erved previously) .
It rvas possible to determine the stereochemistry of the ring junction using ROE
correlations. Of particular interest were the ROE correlations of H3o to H4u and
FI7¿, rvhile there were no ROE correlations betrveett Hefi and FI¿" orETv (FI+" and
H7¿ COSY correlate to each other). This indicates that Hso is on the same side of
the molecule as the two protons (Ha¿ and H7") that are at the ring junction. These
Hs.,
H4â
o
110
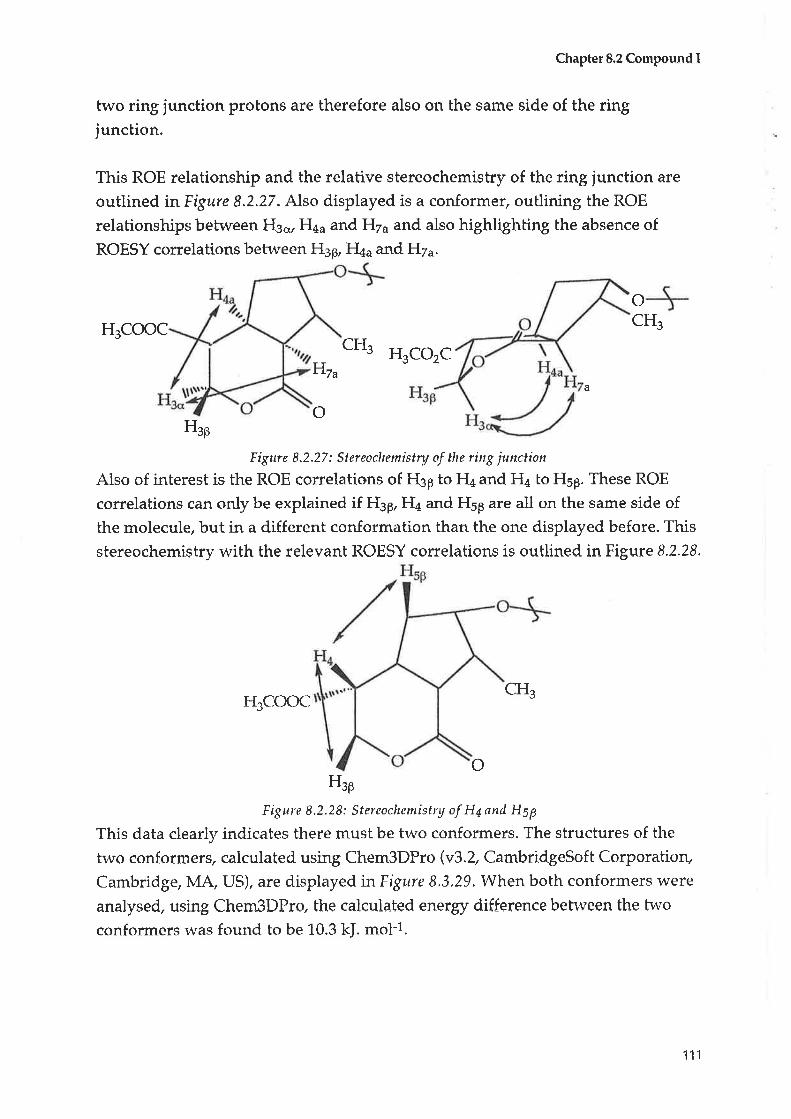
Chapter 8.2 Compound I
two ring junction protons are therefore also on the same side of the ringjuncbion.
This ROE relationship and the relative stereochemistry of the ring junction are
outlined inFigure 8.2.27. Also displayed is a conformer/ outlining the ROE
relationships betweefl H3.,, FIau and H7¿ and also highlighhing the absence of
ROESY correlations between I{¡p, ÉIa¿ and H7¿.
oH3COOC
CHs
HzuH3CO2C
Hsg
Figure 8.2.27: Stereoclrcmistry of tlrc ring junction
Also of interest is the ROE correlations of H3p to FI¿ and Ha to H5p. These ROE
correlations can only be explained if H3p, H¿ and Hsp are all on the same side of
the molecule, but in a different conformation than the one displayed before. This
stereochemistry with the relevant ROESY correlations is outlined in Figure 8,2,28.
H3COOCcH3
oHsÊ
Figure 8.2.28: Stercochemistry of H4and Hgp
This data clearly indicates there must be two conformers. The structures of the
two conformers, calculated, using Chem3DPro (v3.2, CambridgeSoft Corporatiorç
Cambridge, MA, US), are displayed inFigure 8,3,29. When both conformers were
analysed, using Chem3DPro, the calculated energy difference behveen the two
conformers was found to be 10.3 kJ. mol-l.
CHs
a
o
111
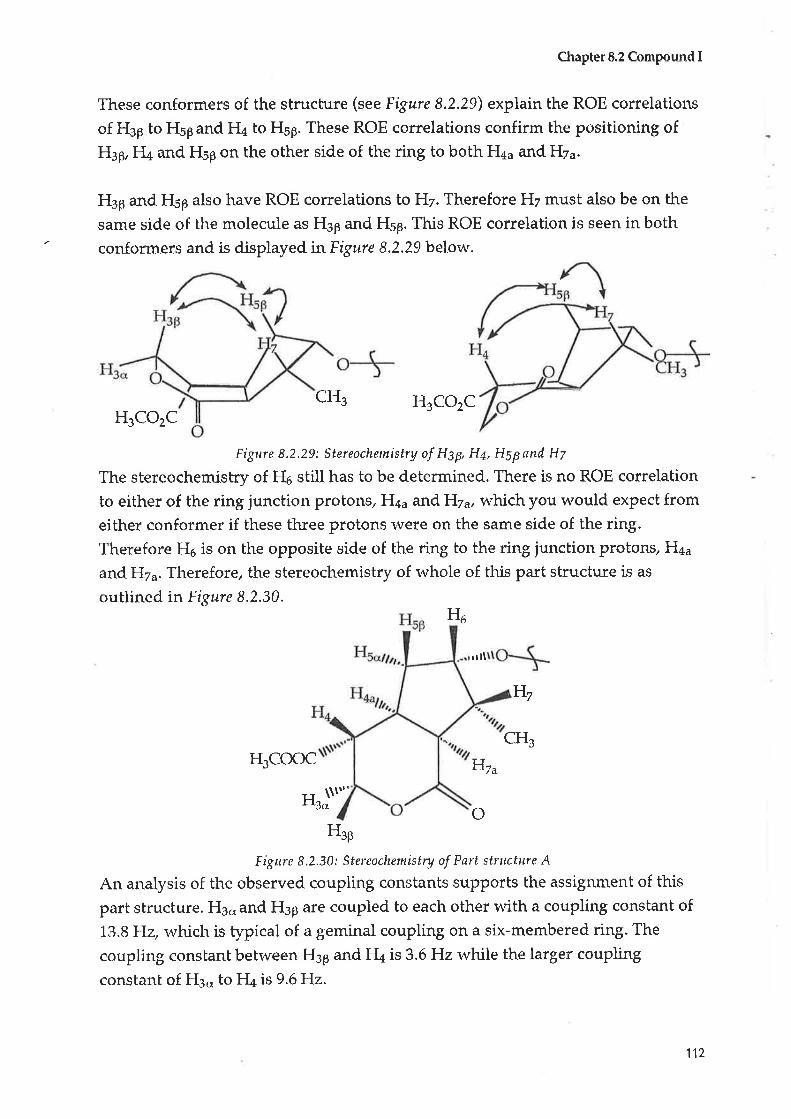
Chapter 8.2 Compound I
These conformers of the stmcture (seeFigure 8.2.29) explain the ROE correlations
of H3p to H5p and FI¿ to H5B. These ROE correlations confirm the positioning ofH¡p, FI+ and Ffup on the other side of the ring to both FI¿a and Hza.
H3p and FIsB also have ROE correlations to H7. Therefore H7 must also be on the
same side of the molecule as H3p and Hsp. This ROE correlation is seen in both
conformers and is displayed in Eigure 8.2.29 below.
CHe H3CO2CH3CO2C
Figure 8.2,29: Stereochemistry of Hgp, H+, HSpand H7
The stereochemistry of FI6 still has to be determined. There is no ROE correlation
to either of the ring junction protons, H4u and Hzu, which you r,t'ould expect from
either conformer if these three protons r^'ere on the same side of the dng.
Therefore Ho is on the opposite side of the ring to the ring junction protons, H4u
and H7u. Therefore, the stereochemistry of whole of this part structure is as
outlined in Figure 8.2.30.H6
rtll
CH¡H3COOC Hzu
H3o\\lrt'
oH¡g
Figure 8.2.30: Stereochemistry of Part structure A
An analysis of the observed coupling constants supports the assignment of this
part structure. H3., and H3p are coupled to each other with a coupling constant of
L3.8 Hz, which is hypical of a geminal coupling on a slx-membered ring. The
coupling constant belween H3p and FI¿ is 3.6Hl2 while the larger coupling
constant of H3* to FI+ rs9.6Hz.
H7
112

Chapter 8.2 Compound I
This supports the assignment of H3p on the same side of the ring to FI+ and withH3ç¡ orì the opposite side. Ha¡ and H7a couple with a9,6Hz value that is
consistent with tlvo ring protons being on the same side of the ring junction. The
coupling constants of the fused cyclopentane ring are not as useful in confirmingthe stereochemistry that has been determined using ROE correlations. Therefore
part structure A has the sbereochemistry as illustrahed in Eigure 8.2.30.
Skaltsounis44 reporbed the isolation and structure determinabion of an iridoid,scaevoloside (6), in 1989 that bears a shiking resemblance to part sbructure A.
o oH
,,t tltlO-Glu Çlq: glucose
(6)
The relevant part of scaevoloside (e) and part structure A are outlined in Figure
8.2.31. Most stereochemical centres in the two structures are id.entical but there
was a difference in the stereochemical assignment of the carboxymethyl group.
..\oJi-
H3CO2C ù,,,.,
Hour, ,'rrrtlÇf{, H+utr, .-,rrrtlìÇf{3
1tû
H3CO2C
o oPart structure A Scaevolosid"nn (6)
Figu'e 8,2.31-: Comparison of Pnrt structtre A and scaeuoloside
It was therefore necessary to review the method by which the original assignment
of the stereochemistry of the carboxymethyl of scaevoloside (6) lt'as determined.
The 1H chemical shift value for the relevant proton (H+u) in scaevoloside (6) as
reported by Skaltsounis is ð 2.55 (triplet of doublets,I = 4.0 and 10.0 Hz: 1H NMR,
CDC13, Tlvts¡.++ FI+, in part structure A, is the equivalent proton and has a 1H
chemical shift value of ò 2.55 (triplet of doublets, J :3.6 and 9.6H2:lH NMR,
H+fi,
Hz^Hzu
113
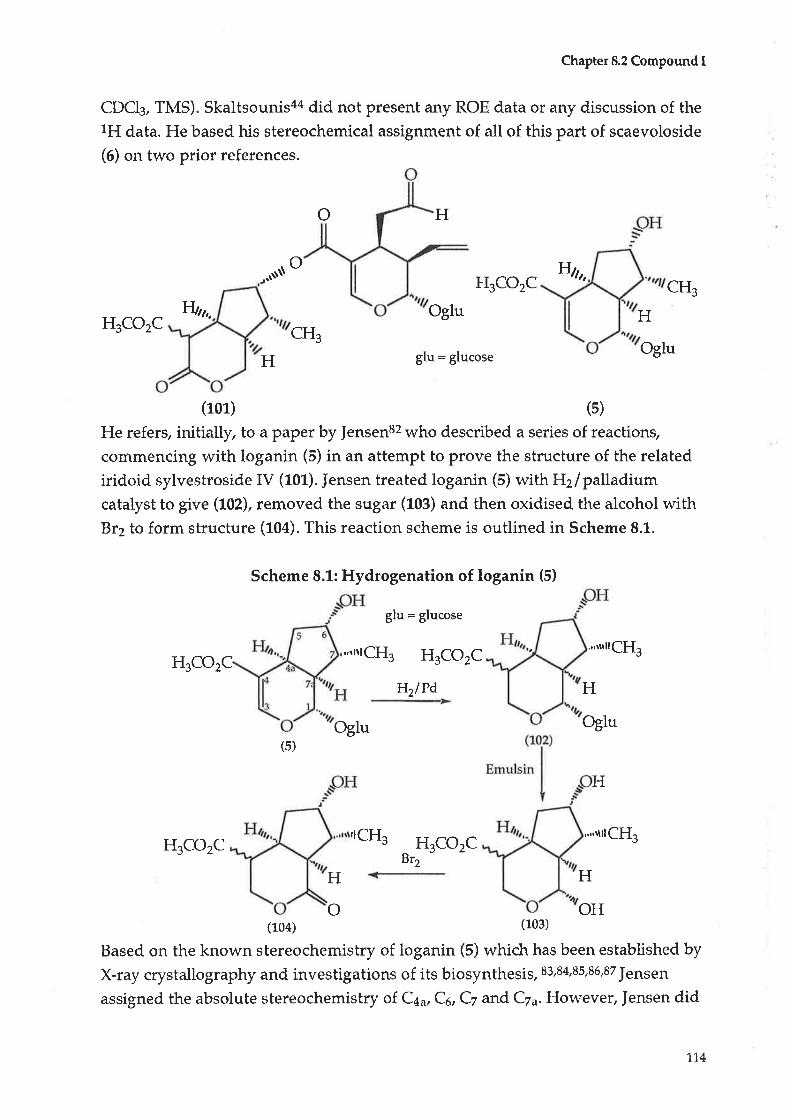
Chapter 8.2 Compound I
CDCI3, TMS). Skaltsounis44 did not present any ROE data or any discussion of the1H data. He based his stereochemical assignment of all of this part of scaevoloside
(6) on two prior references.
o H
o Hh,,H3CO2C CHe
H3CO2COglu
cHsglu: glucose
(101) (s)
He refers, initially, to a paper by ]ensen82 who described a series of reactions,
commencing with loganin (5) in an attempt to prove the structure of the related
iridoid sylvestroside IV (101). ]ensen treated loganin (5) with H2/palladiumcatalyst to give (102), removed the sugar (103) and then oxidised the alcohol withBr2 to form structure (104). This reaction scheme is outlined in Scheme 8.1.
Scheme 8.1: Hydrogenation of loganin (5)
H3CO2C ',r lr I
glu = glucose
CHs H3CO2C
}{zlPd
.,,,ìrlrcH3
Oglu
H
Oglu
FI3CO2C 'lCHs H3CO2CBrz
,.,,,tt1ffi,
H
(104) (103)
Based on the known stereochemistry of loganin (5) which has been established by
X-ray crystallography and investigations of its biosynthesis, 83,84,8s,86,87 ]ens€ilassigned the absolute stereochemistry of. Cqu, Co, Cz and C7a. However, fensen did
H
Oglu
,'Ñt$
H
W,,,,
(s)
H
H
OHo
1.1,4
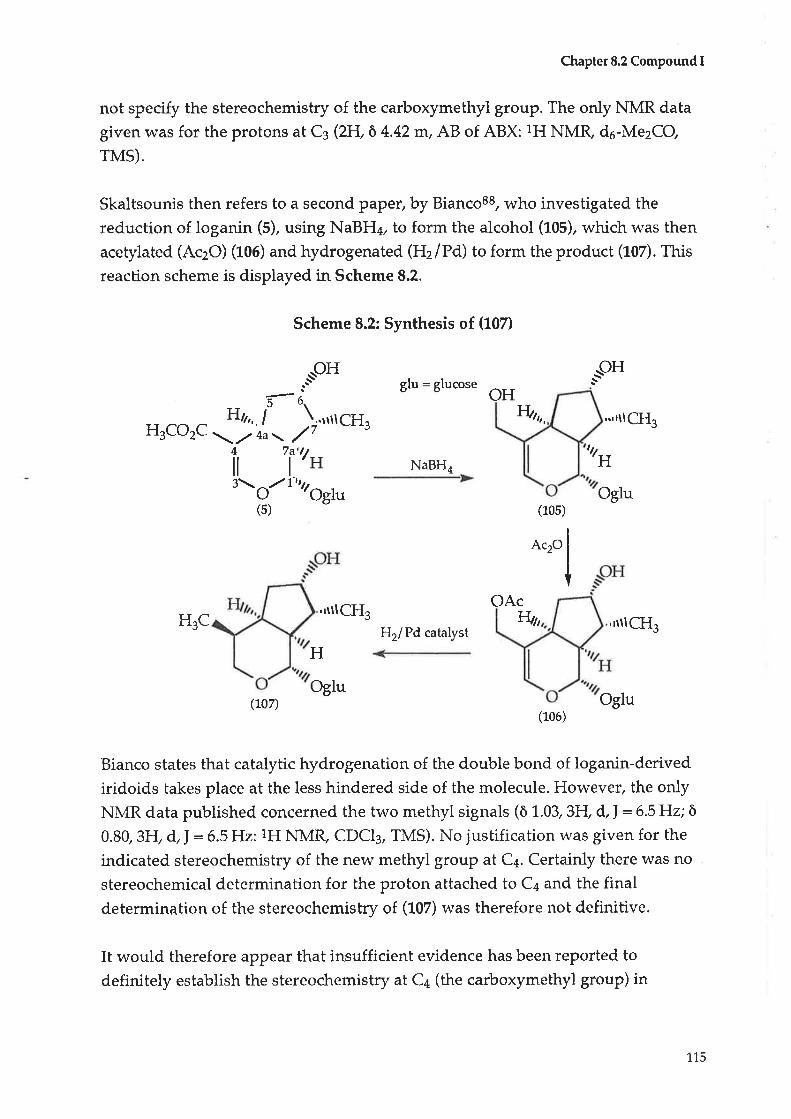
Chapter 8.2 Compound I
not specify the stereochemistry of the carboxymethyl group. The only NMR data
givenwas for the protons at C3 (2H, ò 4.42m, AB of ABX: 1H NMR, do-MezCO
rMS).
Skaltsounis then refers to a second paper, by Bianco88, who investigated the
reduction of loganin (5), using NaBHE, to form the alcohol (105), which was then
acetylated (AczO) (L06) and hydrogenated (HzlPd) to form the product (L07). This
reaction scheme is displayed in Scheme 8.2.
Scheme 8.2: Synthesis of (107)
-t-oH_f6r
H3co2c :i l^_ )",'rcH,4 7a'ltll l'H3\O./L'ttqOglu
(5)
."-t"glu : glucose
NaBH,
ftrt,,, ,.,rtlCHg
H
(1.0s)
OH
,t/
Oglu
Ac20
,rtllÇfl3 OAcHsC
F{2lPd catalystÍùt, ,rrllffi,
(707)(106)
Bianco states that catalytic hydrogenation of the double bond of loganin-derived
iridoids takes place at the less hindered side of the molecule. However, the only
NMR data published concerned the two methyl signals (ò L.03, 3H, d, J = 6.5 FIz; õ
0.80,3H, d,I = 6.5H2:1H NM& CDCI3, TMS). No justification was given for the
indicated stereochemistry of the new methyl group at C+. Certainly there was no
stereochemical determination for the proton attached to Ca and the finaldetermination of the stereochemishry of (107) was therefore not definitive.
It would therefore appear that insufficient evidence has been reported to
definitely establish the stereochemistry at Ca (the carboxymethyl group) in
H
OgluOglu
11s
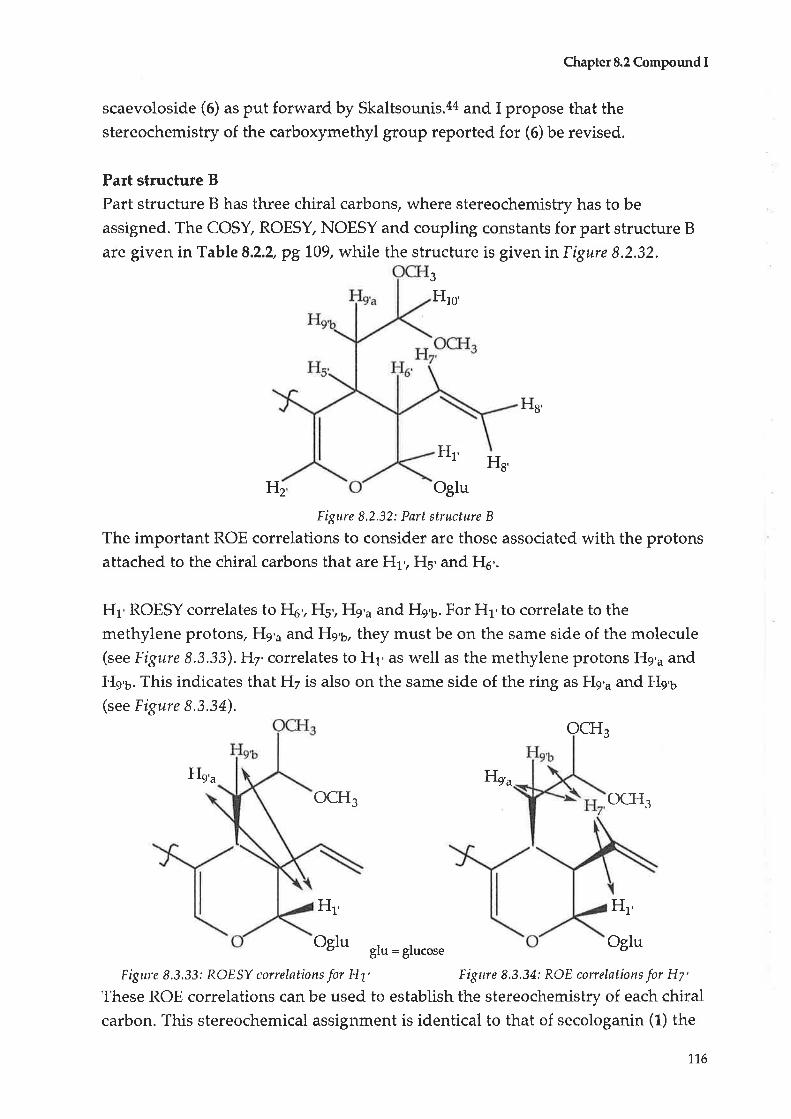
Chapter 8.2 Compound I
scaevoloside (6) as put forward by Skaltsounis.aa and I propose that the
stereochemistry of the carboxymethyl group reported for (6) be revised.
Part structure BPart structure B has three chiral carbons, where stereochemistry has to be
assigned. The COSY, ROESY, NOESY and coupling constants for part structure Bare given in Table 8.2.2, pg t09, while the structure is given inFigure 8.2.32.
Hro'
H8'
H1'H8'
H2 Oglu
Figure 8,2.32: Part structure B
The important ROE correlations to consider are those associated with the protonsattached to the chiral carbons that are Hr', Hs'and H5'.
Hl'ROESY correlates to H5', Hs', FIg'u and He'6. For H1'to correlate to the
methylene protons,He'a and Hg'u, they must be on the same side of the molecule(see Figure 8.3.33). H7' correlates to H1, as well as the methylene protons He'u and
He'6. This indicates that Hz is also on the same side of the ring as He'u and He'6
(see Figure 8.3.34).
3
OCTI J
Hs'u Hg'u
OCFI3 ocH3
H1'
oglu gtu: glucose
Figure 8.3,33; ROESY correlations for H1' Figure 8.3,34; ROE correlations for H7'
These ROE corelations can be used to establish the stereochemistry of each chiralcarbon. This stereochemical assignment is identical to that of secologanin (1) the
H1'
Oglu
11.6
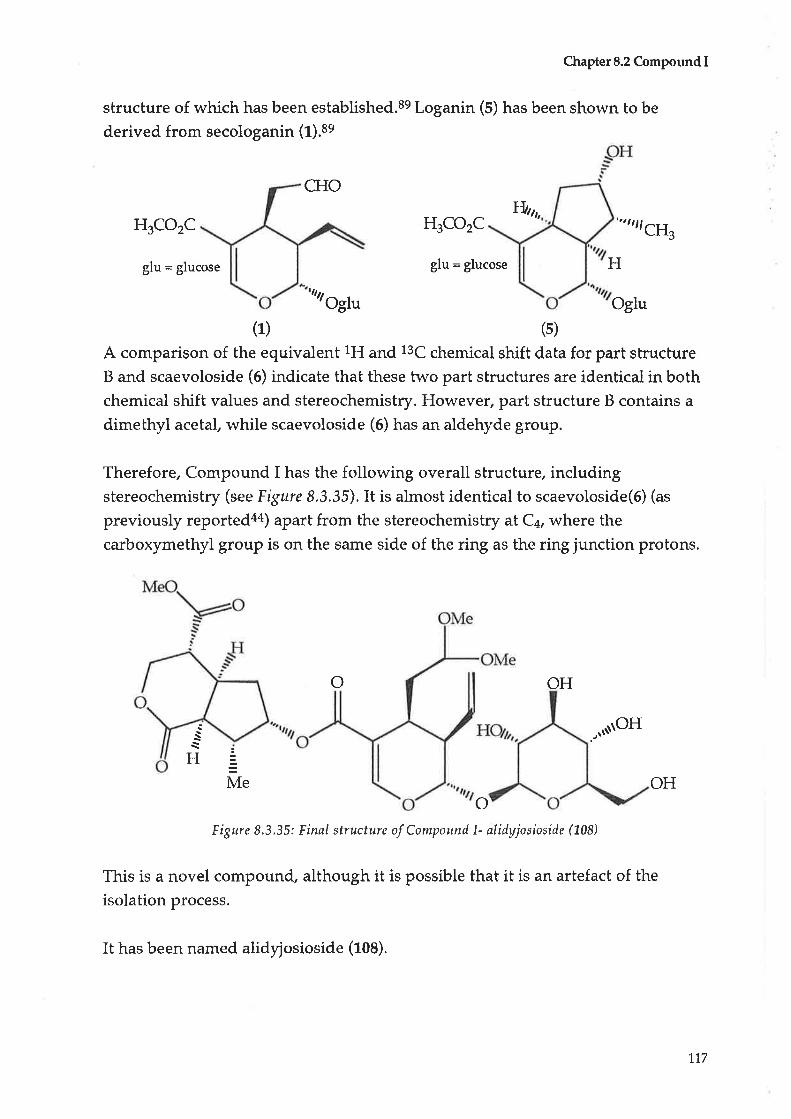
Chapter 8.2 Compound I
structure of which has been established.se Loganin (5) has been shown to be
derived from secologanin (r¡.ar
CHO
H3CO2C H3CO2CÍfhh, ,.rttll
CHs
glu = glucose glu: glucose H
'rqOglu Oglu
(1) (s)
A comparison of the equivalent 1H and 13C chemical shift data for part structtlreB and scaevoloside (6) indicate that these two part structures are identical in bothchemical shift values and stereochemistry. However, paft structure B contains a
dimethyl acetal, while scaevoloside (6) has an aldehyde group.
Therefore, Compound I has the following overall structure, includingstereochemistry (see Figure 8.3.35).It is almost identical to scaevoloside(6) (as
previously reported44) apart from the stereochemistry atCa, where the
carboxymethyl group is on the same side of the ring as the ring junction protons.
o OH
,,ñoH
OHo
Figure 8,3,35: Final stnrcture of Compound l- alidyjosioside (708)
This is a novel compound" although it is possible that it is an artefact of the
isolation process.
Me
\H
It has been named alidyjosioside (fOa).
1,17
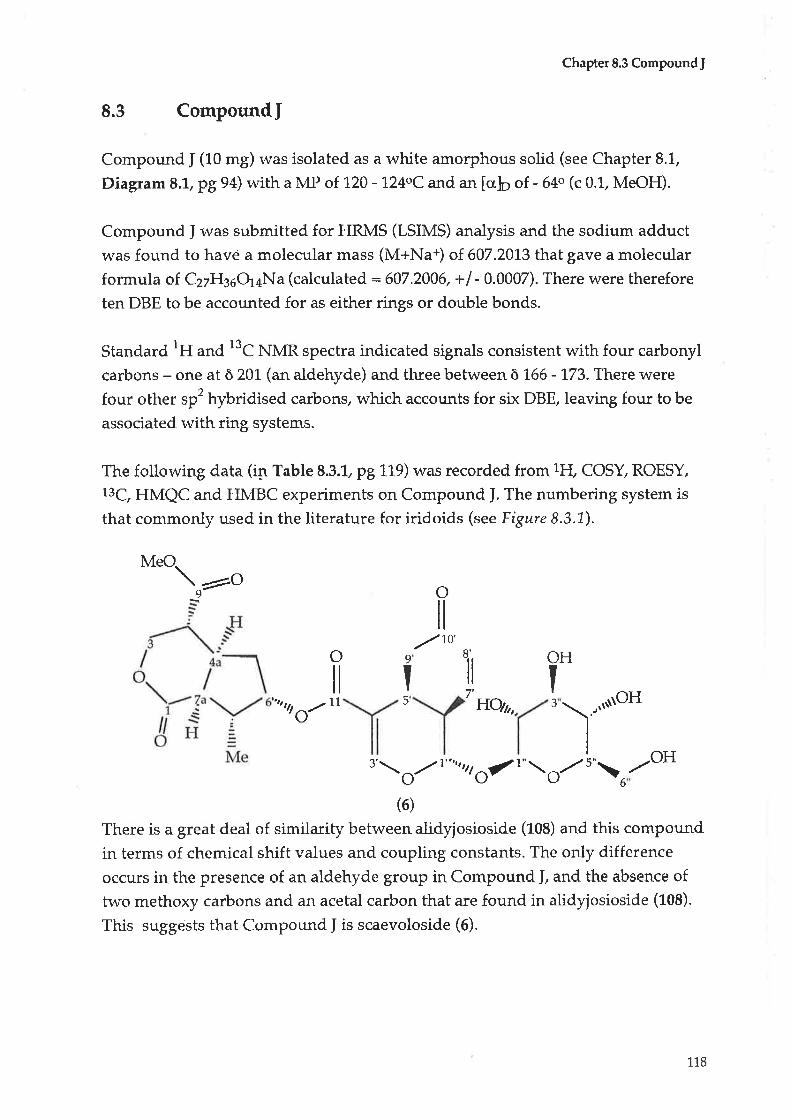
ChapterS.3 CompoundJ
8.3 CompoundJ
Compound I (10 mg) was isolated as a white amorphous solid (see Chapter 8.1,
Diagram 8.1, pg 94) with a MP of 120 -124oC and an [crþ of - ó4o (c 0.1, MeOH).
Compound J r,vas submitted for HRMS (LSIMS) analysis and the sodium adduct
was found to havê a molecular mass (M+Na+) of 607.20L3 that gave a molecular
formula o1. C27IJ35Q+Na (calculated:607.2006, +l - 0.0007). There rvere therefore
ten DBE to be accounted for as either rings or double bonds.
Standard 1H and t3C NMR spectra ind.icated signals consistent with four carbonyl
carbons - one at ò 20L (an aldehyde) and three between ò 166 - I73. There were
four othe. rpt hybridised carbons, which accounts for six DBE, leaving four to be
associated with ring systems.
The following data (il Table 8.3.L pg 119) was recorded from 1FI, COSY, ROESY,13C, HMQC and HIvIBC experiments on Compound J. The numbering system is
that commonly used in the literature for iridoids (see Figure 8.3.1).
9
o
Meoa40 o
il
OH
I8'
il7',
9
I5
0'1
lt1L Hoû,, 3I .,'ÑOHo/
,'- O/
1"',, te g/ t" \ O/ s"\6 ./oH
(6)
There is a great deal of similarity between alidyjosioside (1-0S) and this compound
in terms of chemical shift values and coupling constants. The only difference
occurs in the presence of an aldehyde group in Compound J, and the absence of
two methoxy carbons and an acetal carbon that are found in alidyjosioside (108).
This suggests that Compound I is scaevoloside (6).
U¡
118

c ôC H ôH Int COSY ROESY HMBC
Cr 173.6
C3 67.0 H3p
H3.,
4.34
4.27
1
1
H3.r, H4
Hgg, H¿
Hsp, Hz
F{¿,^,}lz^
C1. C9
Cr, Cq
C¿ 44.0 H¿ 2.53 1 H3-H3gH4¿ F{sB,H7 Cs
C¿,^ 39.7 }{¿,^ 3.00 1 H3, Hs6¿, Hs* H8u H3o Cr, Cs
C5 40.1 Hsp
Hso
1.54
2.24
1
1
H4¿, H5¡r, H5
H+a, Hsß
H5,
F{3*}J'4,H7
C¿ 76.3 Hr 5.2r 7 Hso, H7 H5B, H7, Meg Crt
Cz 45.6 Hz 2.44 1" Hr, Hz", Hn Hgg, Hsg Cl
Cz^ 46.0 FIz^ 2.7L 1. F{¿",H2 H3o, Meg
Cn 76.0 Men 7.76 J Ht Hr
Ce 172.4
Cro 52.5 Mero 3.72 J C4
Crr 1.66.7
Cr 96.2 Hl' 5.31 1 Hr Hz', Hc'", Hq'¡ C:' Cs'G'Cr"
Ce 154.6 Hq, 7.42 L Crr, C'l', Cr,'
C¿ 110.0
Cs, 29.3 Hs' 3.39 1 Hr,', Hq'", Hq'h Hr', Hz', Hrn' Crl, Cr', C¿'
C6 47.8 Hr 2.78 1 Hr', Hs', Hz' Hs', Hln' Cl
Cz' 135.7 Hz 5.53 1 Hr', Hs Hl Hs'H.lb Hl o'
Cn 1,22.7 H*, 5.27-5 2 F{t' He', Hro'
C9 44.8 Hg'u
Hs'¡
2.96
2.47
L
1
H5', H9,6, H1g'
H5', H9'¿, H1 ¡'
H1'
FIl',}lz'Ca
Cr n' 201,.2 Hrn' 9.77 1 Hq'", Hq'h Hs',}{e', Hz', Hs
Cl" 98.7 Hl" 4.69 1 F{t,' Hl', He", Hs" Cl', Cs
Cz" 75,6 Hr" 3.42 1 Hr ", He" H¿
Cq.' 76.3 Hc' 3.56 1 Ht", I{¿' Hr ", Hs"
Cy 70.0 H¿ 3.61. 1 Hs", H.ç" Hy,
Cs,' 73.8 Hs" 3.39 1 H¿',He.".Hr'q Hl Hr Ct"
C6 62.0 H6"u
Ha"t'
3.86
3.83
1
1
Hs", He"¡
Hs", Hn""
Table 8.3.1: NMR data for scaevoloside (6)
#600 MHz (1H), 150 MHz (13C): ô (ppm) from internal TMS in CDCI3
Int = Integration
ChapterS.3 CompoundJ
1L9

Chapter 8.3 CompoundJ
This lH and 13C NMR data are identical to that in the literature for scaevoloside
ß)!+ There are three COSY spin systems, two of which are identical to the spinsystems analysed in alidyjosioside (L08) and whiclU rvhen the HMQC data was
examined/ supported the determination of the overall structure of Compound ]being scaevoloside (0) (without analysis of the stereochemistry).
The ffust spin system was identical to that of the cyclopentane ring found in (1-0S).
The second was idenhified as a sugar unit that was p-glucose. The third spinsystem had the 1H chemical shift values and COSY correlations identical to the
protons and carbons in alidyjosioside (L0S) except that an aldehyde functionalgroup was directly attached to Ce, (instead of two methoxy functional groupsbeing attached to an acetal carbon, Cro').
The stereochemical analysis of Compound I was identical to that of (108). This
has lead to a proposed revision of the stereochemistry of the carbomethoxy groupattached at C¿ of the cyclopentane-fused dihydropyran rir1g.
The ROE correlations that were observed and used to determine the
stereochemisky were those from H3p to H5p and Hz as well as the one's from H¿
to H5p and H7. These are illustrated in Figure 8.3.2, along with the two proposed
conformers of this part of the molecule.
H5 p
p
J
H3CO2CCHs H3C02C
oFigure 8.3.2: Tttto c:onformers illustrnting the proposed stereochemistry of (6)
There were also ROE correlations from H3o to the ring junction protons, Haa and
H7¿, so that these three protons are on the same side of the ring. This relationship
is only observed in one of the conformers/ as illustrated inFigure 8,3.3.
120

ChapterS.3 CompoundJ
H3CO2
a
H
Figure 8.3,3: Cottþrnrct illustrating the stereochemisfu of the ring junctionprotons
This stereochemistry is identical for that established for alidyjosioside (t08)
(discussed in Chaptet 8.2, pgs L08 - t17) but is different at the position of the
carboxymethyi group as reported by Skaltsounis4 for scaevoloside (6). The
stereochemistry of the rest of the molecule (as shorvn inFigure 8.3.1) is identicalin both (108) and (6). This structure is almost identical to the reported data forscaevoloside (0), as previously reported, 4 except for the stereochemistry of the
carbon bearing the carboxymethyl group.
On the basis of the arguments presenbed in Chapber 8.2, pgs 108 -'1,t7, a revision ofthe stereochemistry of scaevoloside (6) is proposed.
Scaevoloside (6) has been isolated previously from Scaeaola røcernigerøaa but not
from Scaevola spinescens.
121
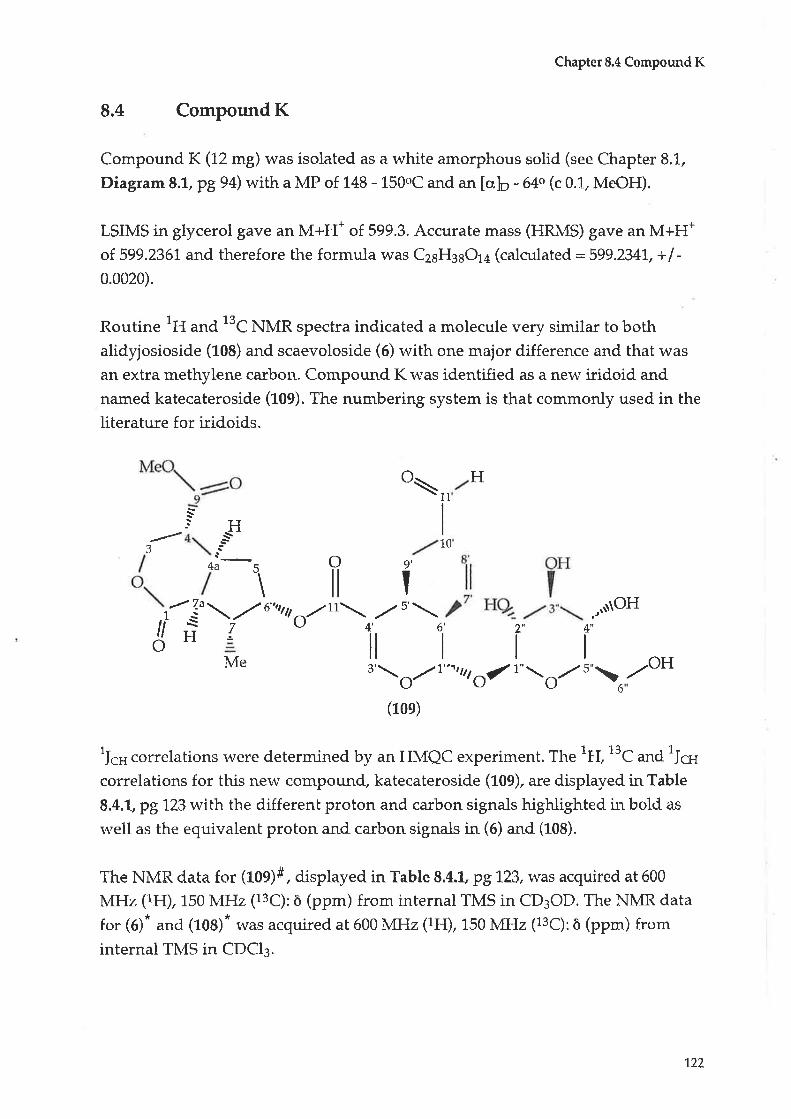
ChapterS.A Compoun-dK
8.4 Compound K
Compound K (12 mg) was isolated as a white amorphous solid (see Chapter 8.L,
Diagram 8.1, pg 94) with a MP of 148 - 150oC and an [.r]p - 640 (c 0.1., MeOH).
LSIMS in glycerol gave an M+H* of 599.3. Accurate mass (HRMS) gave an M+H*of 599.2361 and therefore the formula was C2sH3sO1a (calculated:599.234L, + | -
0.0020).
Routine lH and t'C NMR spectra indicated a molecule very similar to bothalidyjosioside (L08) and scaevoloside (6) with one major difference and that was
an extra methylene carbon. Compound K r,t'as identified as a new iridoid and
named katecateroside (109). The numbering system is that commonly used in the
literature for iridoids.
\o
.Oy\ilr
1
\./s'\4', 6'ilt
H1
:-
J
H\\i
Me
1
tto
10
-*1" -rr, 6''tu ¡, or,r
t7
H! ?',4tt
4a
,,nùOH
,'\O/t''.,teO/ t"-O/ s"a ./oH6
(1oe)
lJqH correlations were d.etermined by an HMQC experiment. The 1H, 13C and 1¡ç¡1
correlations for this new compound* katecateroside (L09), are displayed in Table
8.4.1, pgl23 with the differenb proton and carbon signals highlighted in bold as
vvell as the equivalent proton and carbon signals in (6) and (108).
The NMR data for (tog)#, displayed in Table 8.4.L pg L23, r,vas acquired at 600
MHz (1H), 150 NIfIz (13C): ò (ppm) from internal TMS in CD3OD. The NMR data
for (6). ancl (L08). was acquired at 600 MHz (1H), 150 MHz (13C):ò (pp*) frominternal TMS in CDCI3.
122
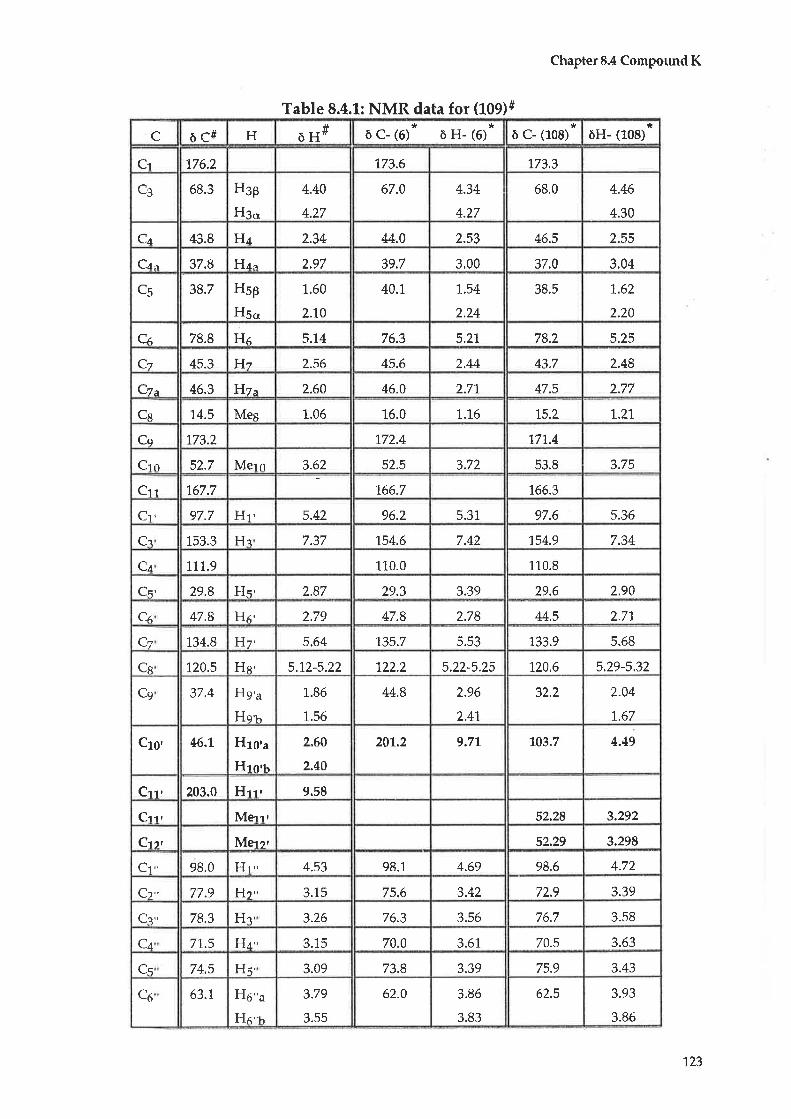
c òc# H #òH* *
ô c- (6) ô H- (6)*
ô c- (108)*
òH- (L08)
Cl 176.2 173.6 L73.3
C3 68.3 H3p
H3o
4.40
4.27
67.0 4.34
4.27
68.0 4.44
4.30
C¿ 43.8 H¿ 2.34 44.0 2.53 4ó.5 2.55
C¿^ 37.8 H¿^ 2.97 39.7 3.00 37.0 3,04
C5 38.7 Hsp
Hs..
1.60
2.'1.0
40.1 1.54
2.24
38.5 1,.62
2.20
C6 78.8 He 5.14 76.3 5.21 78.2 5.25
C.z 45.3 Hz 2.56 45.6 2.44 43.7 2.48
Cz^ 46.3 F{7n 2.60 46.0 2.71, 47.5 2.77
Cs L4.5 Mes 1.06 16.0 1.76 75.7 1,.2L
Cq 173.2 172.4 771.4
Crn 52.7 Mero 3.62 52.5 3.72 53.8 3.75
Crr 167.7 166.7 166.3
Cl, 97.7 Hl' 5.42 96.2 5.31 97.6 5.36
Cq 153.3 Hc 7.37 154.6 7.42 154.9 7.34
C¿ 1.1.',t.9 110.0 110.8
29.6Cs' 29.8 Hs' 2.87 29.3 3.39 2.90
C6 47.8 Hc 2.79 47.8 2.78 44.5 2.71
Cz 134.8 F{7, 5.64 135.7 5.53 133.9 5.68
Cs 120,5 Hn, 5.12-5.22 122.2 5.22-5.25 120.6 5.29-5.32
Ce 37.4 H9'a
Hs'¡
1.86
1.56
44.8 2.96
2,4L
32.2 2.04
LÛ-/
c1o' 46.1 H1o'"
Htottt
2.60
2.40
201.2 9.71 1-03.7 4.49
C11' 203.0 Hrl 9.58
Crl Metrt 52.28 3.292
Cry Merl 52.29 3.298
Cl,' 98.0 Hr,' 4.s3 98.1 4.69 98.6 4.72
Cr" 77.9 Hr" 3.15 75,6 3.42 72.9 3.39
Cq,, 78.3 Hg' 3.26 76.3 3.56 76.7 3.s8
C¿ 71.5 Hr 3.15 70.0 3.61, 70.5 J,OJ
Cs 74.5 Hs' 3.09 73.8 3.39 75.9 3.43
C6 63.7 Ho"a
Hr"h
3.79
3.55
62.0 3.86
3.83
62.5 3.93
3.86
Table 8.4.1: NMR data for (109)#
ChapterS.4 CompoundK
123
o
o
ChapterS.4 CompoundK
As can be observed:
Both (109) and scaevoloside (6) have an aldehyde group u'hereas
alidlosioside (108) does not.
(109) has a 13C methylene signal at ò 46.L and two methylene protons -Flro'u and Hro'u - which do not appear in either of the other twocompounds.
Alidyjosioside (108) has an acetal carbon at Cro' and a proton at ò 4.49 whichis not present in the other two compounds.
Alidyjosioside (10S) has two ether methoxy signals (Merl and Me12') whichare not present in either of the other two compounds.
The COSY experiment confirmed the positioning of the extra methylene
protons alpha to the aldehyde in (109) and the overall structure of a pyranring.
The other two spin systems were identical to those of alidlosioside (108)
and scaevoloside (6), establishing a cyclopentane ring fused to a
dihydropyran ring and a sugar unit.
a
a
a
o
a The sugar unit in (6), (108) and (1Og) was identified as p-glucose.
There vvas an electron withdrawing effect of the carbonyl functional group on the
adjacent carbon 13C chemical shift values, making the carbon deshielded and
therefore downfield (see 139 chemical shifts of Cs', Cq'and Cro', Table 8.4.1,p9123).
The protons (H5', Hs'u, FIg'b, Hro'u and Hto'u) are also downfield, ranging from ò
2.96 - 2.41..
The stereochemistry of (109) at all chiral carbons was determined via couplingconstant values and ROESY data and was found to be identical to that of (6) and
(L08) In particular (fOg) exhibited the same stereochemistry for the carboxymethyl
group at CE.
This compouncl is novel. It has been named katecateroside (109). It is an iridoid,based on scaevoloside (6) but with an extra methylene group.
124

ChapterS.5 Compound L
8.5 Compound L
Compound L (10 mg) was isolated as a white amorphous solid (see Chapter 8.L,
Diagram 8.1, pg 94) with a MP oÍ221, -223oC and an [oJp - 80o (c 0.1, MeOH).
Compound L r,vas found to have an M+H+ of 391.1614 (LSIMS) giving a formulaof C17H26Oro (calculated = 391..L604, +/- 0.0010). This indicated there were fiveDBE to be accounted for, as either rings or double bonds,
The IR spectrum indicated one double bond (1660 cm-1), a carbonyl (l722cm-1)
and hydroxyl functional groups (3430 cm-l).This accounts for two DBE.
The 1H and 13C spectra of Compound L were run und.er normal conditions andunder D2O exchange conditions. COSY, HMQC and HMBC experimeo¡* u¡s¡s also
completed.
The 1lI, 13C and stereochemical data for Compound L are identical to that ofloganin (5).aa,sa,as,86 This NMR data is displayed in Table 8.5.1, pg 126. The
numbering system is that commonly used in the literature for iridoids.
The MP78,80 and [aþao also matches the literature values for loganin (5).
oll
OH
I.,rñMe
'1""",
Hht,
Hg *'NOHJMeO
o/1"""' o/ 1'\o/(s)
5'\ ./oH(t'
Loganin (S) has been isolated from Scaeaola montana43 and Scaeaola
racemigeraaa but not from Scaeaola spinescens.
Personnel communication with Dr jensen42, Technical lJniversity of Denmark,
revealed that loganic acid (a) has been isolated from Scaeaola taccada.
125

,.'NOHHO2C
,,.rrrltlffi3
ChapterS.S Compound L
OHo(4)
Table 8.5.1: NMR data for (5)#
#o0o I'vlH, (1H), 150 MHz (13ç¡' ô (ppm) from internal TMS in d6-DMSo
Int: Integration Mult. : Multiplicity
C ôc H ôH Int Mult. I (Hz) COSY HMBC
Cl 96.7 Hl 5.11 1 d 4.8 }{t^ C?,CL^Cz Ct,
Cq 150.5 He 7.35 1 d 7.2 }l¿.^ Cr, Cq, C¿. Cq
C¿ 111.9
C¿' 30.8 H¿^ 2.96 1, dddd '1..2,7.8,9.6,71,.4 H3,H5-H5B,H7a Ca, C¿, Cq
C5 42.0 Hsp
Hs.'
1.43
2.05
1,
1
ddd
dd
3.6,11.4,13.8
7.8,13.8
H41, H56r, H6
H4", Hsß
C+a,ct
Cd",Ce
CÁ 72.1, Hr 3.86 1 dd 3.6,1'1..4 H56,6-OH,H7 Cs,Ct
6-OH 4.54 1 brt Hd Cd
Cz 39.8 Hz 1.70 1 ddd 6.6,9,6, t].4 H(,,F{7a,lll4eg Cr G Cz" Cto
Cz^ 44.7 }{7^ 1.83 1 ddd 4.9,9.6,9.6 }{1,FI42,H7 C1,C4¿,C7
Cn 13.5 Mes 0.97 3 d 6.6 Ht Ce,Cz,C,7"
Cs 1,67.7
Cro 50.7 Mero 3.61. 3 S Cq
Cr 98.5 Hl 4.46 1 d 7.8 }{z' Cl, C.s'
Cz 73.1 }{t, 2.93 1 dd 7.8,9.0 Hr', Ha, Cr', Cl2'-oH 5.04 7 br cl Hl Ct
Ca 76.7 He 3.13 1 dd 9.0,9.6 F{t,,FIc Ct',C2,
Ct 70.L H¿ 3.20 1 dd 9.0,9.6 Ha', Hs' Cg', C.s'
Cs' 77.3 Hs 3.10 7 ddd 3.6,5.4,9.0 F{4',H(,a',H6l.t Cl',C4',C6
C6 61.1 Ho'u
Hrr3.64
3.41,
1,
1
dd
dd
3.6,11.,4
5.4,1,1,.4
Hsi H¿t'
Hs', Hr"'C5
Cs
OH 1.22 2 brs
OH 4.40 1 brd
126
Chapter 9.1 Initial treatm-ent
CHAPTER 9 FRACTION 8
9,1 Initial treatment
Treatment of Fraction 9 yielded three compounds, as outlined in Diagram 9.1.
23 g of Fraction 8 was separated from the original methanol extract (828 g) using90/o ethyl acetafe/ 1,0% methanol as the eluting solvent.
5 g of Fraction 8 was subjected to flash chromatography (silica, isocratic, 90/" ethylacetalelT0% rnethanol) with twelve fractions being separated. Fractions 8.3 and
8.4 were combined and labelled 8.(3).
Fraction 8.(3) (1.44 B) was dissolved irr 100 mL chloroform/ 100 mL water and the
fwo layers separated. The water layer was labellect 8.(3).H1 (250 mg). The r,vater
was removed (Éreeze dried) and the residue rvas then placed in two vials and
labelled S.(3).H1.MV.[X] (100 mg) and 8.(3).Hr.MV (150 mg).
Fraction S.(3).H1.MV.[X] was subjected to flash chromatography (silicø isocratic,
90% chloroform/10% methanol) with two fractions being collected.
Fraction 8.(3).Hr.lvtV.txl.2 v¡as then analysed by analytical normal phase FIPLC
(gradient, 1.00% ethyl acetate to90% ethyl acetate/L0% methanol,254nm,2mL/min., 30 min.) where two clearly defined, IfV active components could be
observed. The sample r,vas then subjected to analytical normal phase HPLC(gradienf I00% ethyl acetate to90% ethyl acetate/10% methanol, 254nm,2
mL/min., 30 min.) rvhere tr,vo fractions were collected and shown to be pure,
Fraction 8.(3).Hr.MV.[X].2b was labelled Compound M (26 mg) and its puritydetermined using normal phase FIPLC (Rr = 6.75 min., gradient, 100% ethylacetate to90% ethyt acetate/1.0% methanol,254nm,2 ml./min.,30 min.) The
structure determination of Compound M occurs in Chapter 9.2, pg 129.
Fraction 8.(3).H1.MV.[X].2c was labelled Compound N (5 mg) and its puritydetermined by nonnal phase HPLC (Rr: 8.56 min., gradient, L00% ethyl acetate to
90/o ethyl acetate/ t0% methanol, 254 nm,2 mL/min., 30 min.). Its structure
determination can be found in Chapter 9.3, pg 131.
127
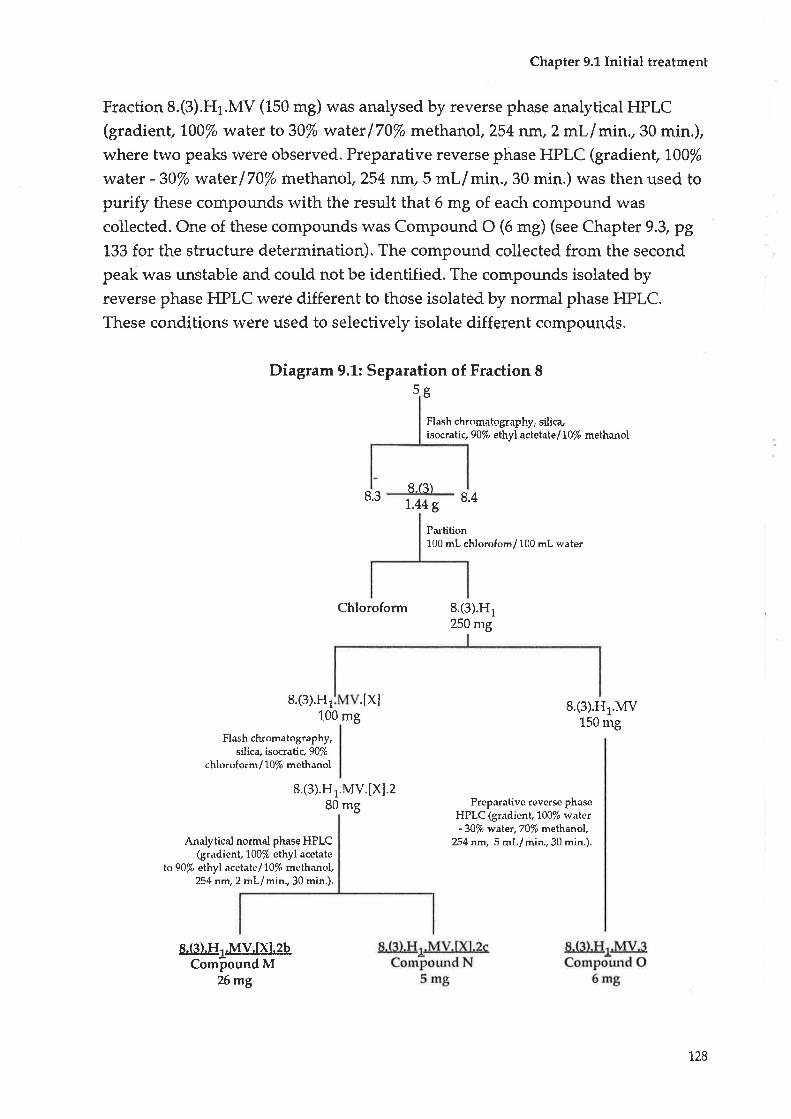
Chapter 9.L Initial treatment
Fraction 8.(3).H1.tvtv (150 mg) was analysed by reverse phase analytical HPLC(gradient, 100% r,vater to 30% water/70% methanol, 254 nm, 2 ml/min., 30 min.),where two peaks were observed. Preparative reverse phase HPLC (gradient, t00%
water - 30% water 170% methanol,254 nm, 5 mL/ min., 30 min.) rvas then used to
purify these compounds with the result that 6 mg of each compound was
collected. One of these compounds was Compound O (6 mg) (see Chapter 9.3, pg
133 for the structure determination). The compound collected from the second
peak was u¡stable and could not be identified. The compounds isolated byreverse phase FIPLC were different to those isolated by normal phase HPLC.
These conditions were used to selectively isolate different compounds,
Diagram 9.L: Separation of Fraction I5 ùö
Flash ch¡omatography, silir+isocratic, 90/" ethyl actetate/ t0% methanol
8.(3)7.M g
b
Partition100 mL chlorofom/ 100 mL water
Chloroform 8.(3).H1250 mg
8.(3).H1 .txl 8.(3).H1.MV150 mg100 mg
Flash cfuomatogaphy,si-lic+ isocratic,90%
chlo¡of o¡m/ 1.0% methanol
8.48.3
8.(3).H1.MV.[X].280 mg Preparative reverse phase
HPLC (gradient 100% water- 30% w al.et, 70lo me thanol,
254 nlrt, 5 ml/min.,30 min.).Analytical normal phase HPLC(gradient, 100% ethyl acetate
lo 90/' elhyl acetate/ 10% methanol,254 nm, 2 mL / min., 30 min.).
8.(3).H..MV.fxl.2bComþound M
%mg
128
Chapter9.2 CompoundM
9,2 Compound M
Compound M (26 mg) was isolated as yellow crystals (see Chapter 9.L, Diagram9.7, p9128) with a MP oÍ278 - 280oC and an [a]o of + L.3o (c 0.L, MeOH).
HRMS of the sample gave a M+Ht of 477.101.6 and therefore a molecularformula of C22H2sOrz (calculated = 477.1032, +l- 0.00L6). This gave thírteen DBE
to be associated with sp2 hybridised carbons and ring systems. IR indicated the
presence of carbonyls (1720 cm'1), other spz hybridised carbons (1660 .*'1) and
hydroxyl functional groups (3400 cm-l).
Routine 1I{, COSY and ROESY NMR experiments were run. An HSQC
experiment was used to determine all ljçs correlations and an HMBCexperiment was used to establish the connectivity of the compound.
The protonated carhon signaLs account for twelve carbons and fourteen protons,
indicating there are six protons associated with hydroryl signals and ten
quaternary carbons (as indicated by the molecular formula).
There were two carbonyl carbons and eight quaternary carbons that have 13C
chemical shjft values that indicate they are spz hybridised wihh some also directlyattached to oxygen. The COSY spectrum indicated three separate spin systems,
one of vu'hich was clearly p-glucuronic acid (coupling constants: 7.8, 9.0,9.0,9.6
Hz). The second COSY spin system involved a catechol þpe a¡omatic ring, whilethe third involved long range correlations in an aromatic ring.
The 1H, 13C, COSY, ROESY, HMQC and HMBC (see Table 9.2|1,, p9130)
experiments confirmed Compound M to be luteolin-7-O-glucuronide methylester (ftO).so The numbering system is that used in the literature for flavonoids.It was not possible to find any MP or [aþ literature values.
One articleel discussed the isolation of methyl esters of flavone glycosides inDigitalis lønata that v¡ere methanol free extracted. The compounds were extracted
with water, acetone and ethyl acetate. This supports the isolation of (110) as a true
metabolite of. S caeu ola spinescens.
Luteolin-7-O-glucuronide methyl ester (110) has never been reported fromScøeaolø spinescens before or from any plants of the Scøeuola genus.
129

o
H3CO ,,¿o:..
Chapter9.2 CompoundM
OH
10 OH
lv{. : Multiplicity
8a
I
4a
OH
OHOHO(110)
Table 9.Z.LzNMR data fot (110)#
#oo0 MHr (1H), 150 MHz 113ç¡' ô (ppm) from internalTMs in d6-DMSo lDzoROESY*: ROESY correlations not in the COSY spectrum
3
I
c öC H òH I. lvf, I fiz) COSY ROESY HMBC
C¡ 764.7
Ca 103.2 Ha 6.72 1 S Hrn, Hr¿ C,¡, Ct, C¿", Cq
C¿ 181.4
Ct^ 105.9
CE 161.8
Cr, 99.7 He 6.45 1 d 2.4 Hs H1 ', FI2', Hs' C4a,Cs,C7
Cz 162..2
Cn 94.2 Hn 6.80 1 ct 2.4 Hr Hr', Hr', Hc' C¿,",Cr,,Cl,Cg"
CB" 156.0
Cc) 127.6
Cln 1L3.2 Hro 7.39 1 d 1,.2 Hr¿ Hs C¡.Cq. Crr, Cr¿
Crr 145.5
Ctz ï49.3
Crs 115.5 Hra 6.87 1. d 8.4 F{tt Cs, Cl t, Ctz, C1 4
Ct¿ 779.2 Hl¿ 7.42 1 dd 7.2,8.4 Hrn, Hrc Ha Cz, Cl0, C12, C1z
C1' 98.6 Hr. 5.31 L d 7.8 Ilt, Hn, Hs Cz,Cz',Cs'
C,I 73.4 F{t' 3.26 1, dd 7.8,9.0 Hr', H: Hr, FIs cr i cc'
Ca 74.7 H¡' 3.37 1 t 9.0 }lz',H+' Cr', C¿', Cs,
Ca 77.9 H¿ 3.40 t dd 9.0,9.6 Hr'. Hq' Cr', Cs', Cn'
Cs 75.2 Hs 4.23 1 d 9.6 Ht H6, HB, OCH3 Cl', Cr'
G 169.6
Cz, 52.4 OCHq 3.59 J s Hs' C6
I. : Intergration
1.30
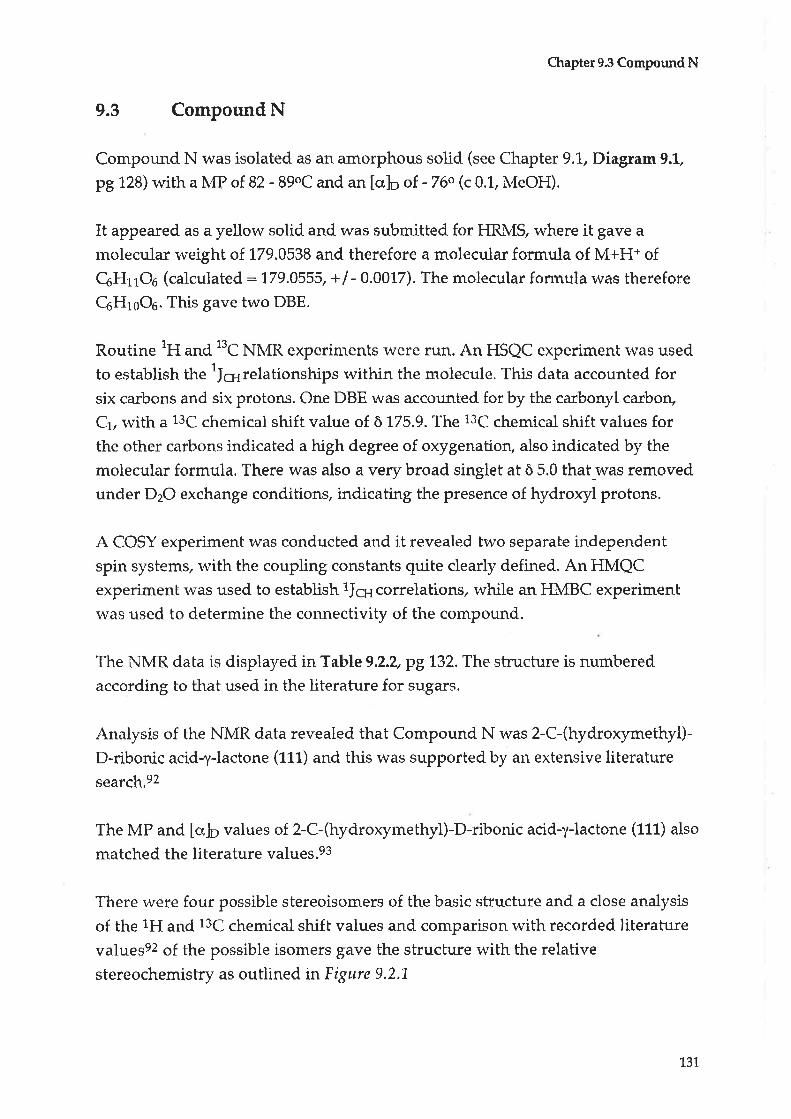
Chapter 9.3 Compound N
9.3 Compound N
Conrpound N was isolated as an amorphous solid (see Chapter 9.L, Diagram 9.1,
pg 128) with a MP of 82 - 89oC and an lcrJo of -76o (c0.1, MeOH).
It appeared as a yellow solid and was submitted for HRM$ where it gave a
molecular weight of L79.0538 and therefore a molecular formula of M+H+ of
QHrrOo (calculated: t79.0555, + I - 0.0017). The molecular formula was therefore
QHroQl. This gave two DBE.
Routine 1H and. t'C NTvIR experiments were run. An HSQC experiment was used.
to establish the lJqlrelationships within the molecule. This data accounted forsix carbons and six protons. One DBE was accounted for by the carbonyl carbon,
Cr, with a 13C chemical shift value of ò L75.9. The 13C chemical shift values forthe other carbons indicated a high degree of oxygenatiorç also indicated by the
molecular formula. There was also a very broad singlet at ò 5.0 that-was removedunder D2O exchange conditions, indicating the presence of hydroxyl protons.
A COSY experiment was conducted and it revealed two separate independent
spin systems, with the coupling constants quite clearly defined. AnHMQCexperiment was used to establish iJcrr correlations, while an HMBC experimenE
was used to determine the connectivity of the compound.
The NMR data is displayed in Table 9.2.4pgt32. The structure is numbered
according to that used in the literafure for sugars.
Analysis of the NMR data revealed that Compound N was 2-C-(hydroxymetþ1)-D-ribonic acid-y-lactone (111) and this was supported by an extensive literaturesearch,92
The MP and [clb values of 2-C-(hydroxymethyl)-D-ribonic acid-y-lactone (111) also
matched the literature values.e3
There were four possible stereoisomers of the basic structute and a close analysis
of the 1H and 13C chemical shifh values and comparison with recorded literaturevaluese2 of the possible isomers gave the strucbure with the relative
stereochemistry as outline d in F igure 9.2.1,
131
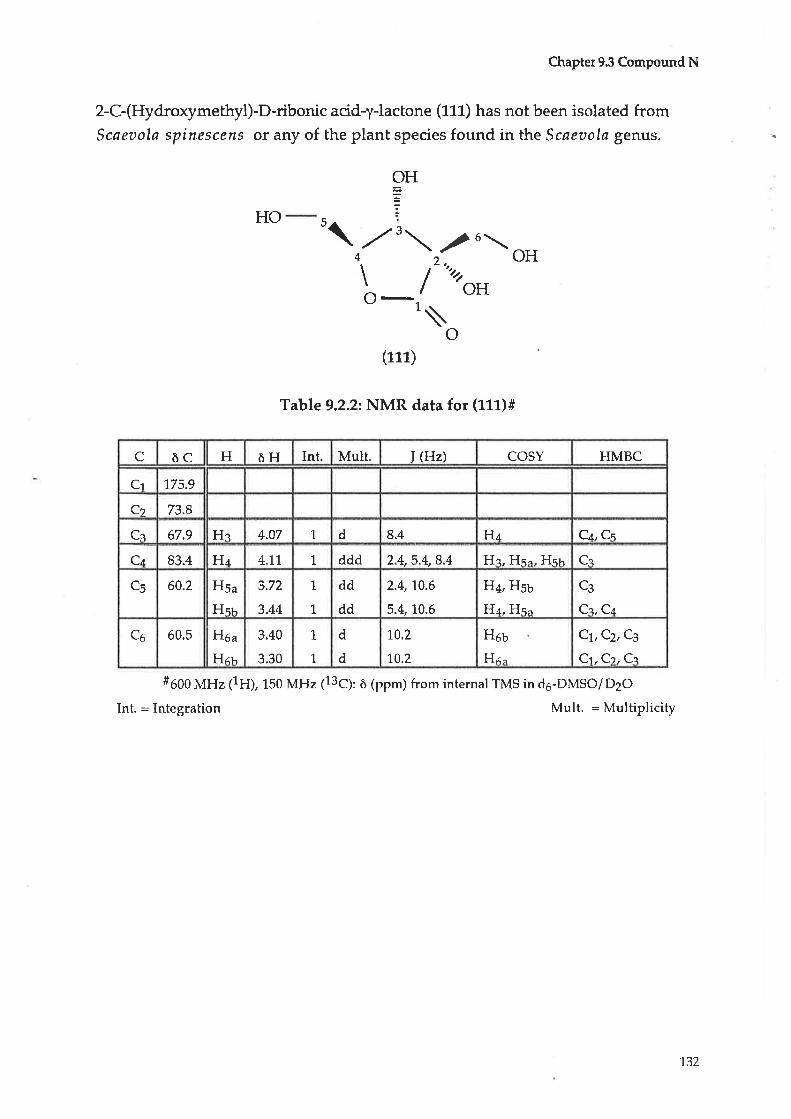
Chapter9.3 CompoundN
Z-C-(Hyd¡oxymethyl)-D-ribonic acid-y-lactone (11,L) has not been isolated fromScaeaola spinescens or any of the plant species found in the Scaeuola genus.
HO
OH
OH
5\,,2r\ .2
t\o
6
4 2
/,n?
OH\o-
(111)
Table 9.2.22 NMR data for (11L)#
C ôC H òH Int Mult I (Hz) COSY HMBC
Cl 175.9
Ct 73.8
Cr 67.9 H: 4.07 1. d 8.4 H¿ C¿, Cc
C¿ 83.4 H¿ 4.17 1 ddd 2.4,5.4,9.4 Hq, Hs", Hqh Cg
C5 60.2 Hsu
Hsn
3,72
3.44
1
1.
dd
dd
2,4, 10,6
s.410.6
H¿, Hsb
H¿, Hs'C3
Ca, C¿
C5 60.5 Hoa
Hnr
3.40
3.30
1
1
d
d
10.2
r0.2
Hou
F{d^
C1,C2,Cg
Cr, Cr, Ca
#ooo tr¿H" (1H), 150 MHz (13ç¡' ô (ppm) from internal TMS in d6-DMSO lDzO
Int. : Integration lv{ult. : Multiplicity
132

Chapterg.4 Compound O
9.4 Compound Q
Compound Q (6,mg) was isolated as a white amorphous solid (see Chaptet 9.L,
Diagram 9.l,pg 12B) with a MP of L31 - 134oC and an [alo + 20.00 (c 0.L, MeOH).
The molecular weight was determined by HRTVÍS to be 214.0080 giving amolecular formula of C1¡H1aO5 (calculated = 2L4.0084,+/- 0.0004). This molecular
formula reveals four DBE associated with either sp2 hybridised carbons or a ring.The IR spectrum indicated hydroxyl functional groups (3450 cm-l), as well as
carbon-carbon bonds (1660 cm-l).
A routine 1H experiment was run and this revealed nine proton signals. The
proton signals were assigned to their respective carbonby * HMQC experimenE.
There was one proton signal that did not have a lIcH correlation, OHr, rvith a 1H
chemical shift value of ò 8.503. This signal disappeared under D2O exchange
conditions. It was therefore identified as a phenolic proton.
There \A,ere two clear COSY spin systems observed in the COSY experiment. One
r,vas indicative oÍ. a1,,2,4 trisubstifuted benzene ring, while the second was
identified as a 1,2,3 propantriol subs bituent.
An HNIQC experiment was completed to determine the 13C chemical shift values
of the protonated carbons and an HMBC experiment was used to establish the
connectivity between COSY spin systems as well as to establish the 13C chemical
shift values for the non-protonated carbons. This was necessary as there was
insufficient material to condu-ct a routine 13C experiment. This data is displayedin Table 9.4|1., pg 134.
A ROESY experiment rvas also used to confirm the connectility of Compound Q.
Analysis of the NMR data (Table9.4.7, pg 13a) revealed the structure to be
L-t h r e o -guaiacyl glycerol (112).
9" î"/\1 1'\ .zS'
ocH3(113)
I3
Z'
OHHO
133
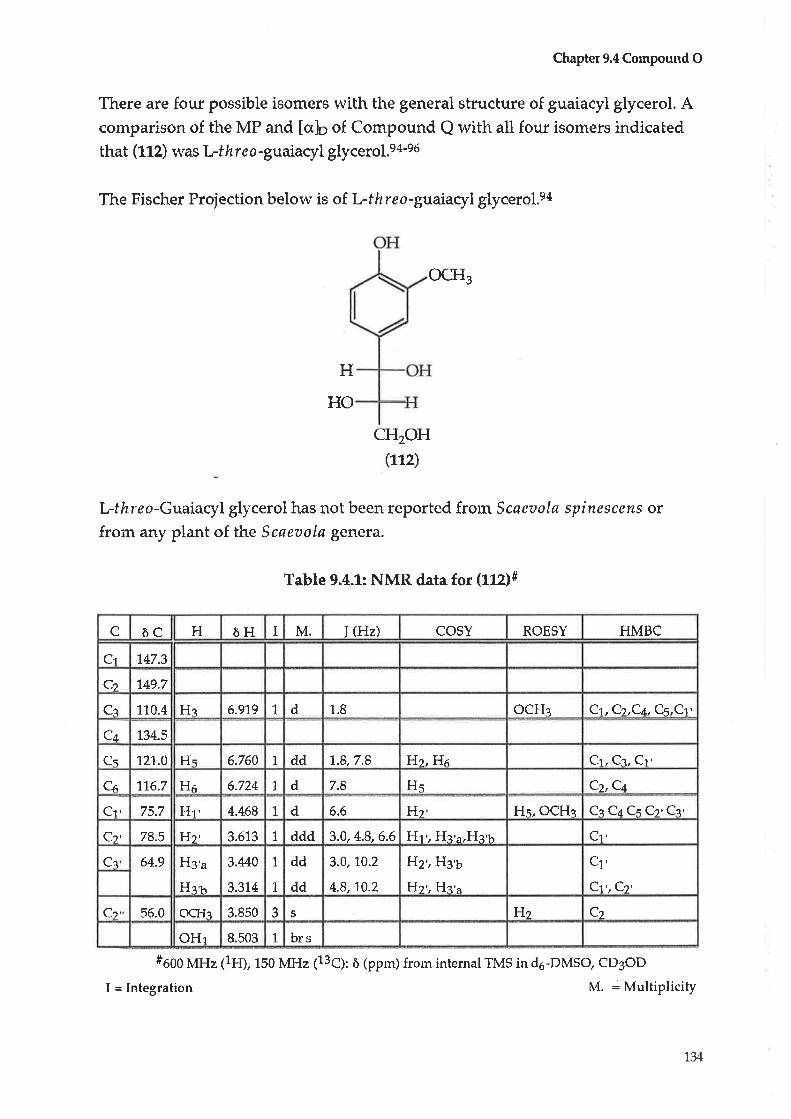
Chapter 9.4 Compound O
There are four possible isomers with the general structure of guaiacyl glycerol. Acomparison of the MP and [oJcr of Compound Q with all four isomers indicatedthat (112) was L-fhre o-guaiacyl glycerol.s+-e0
The Fischer Projection below is of L-f h reo-guaiaryl glycerol.ea
H
HO
cH2oH
L-threo-Guaiacyl glycerol has not been reported from Scaevolø spinescens orfrom any plant of the Scaeoola genera.
Table 9.4.1-: NMR data for (112)#
#oo0lr¿H" (1H), 150 MHz 1139¡' ô (pprn) from internal TMS in d6-DMSo, CD3OD
I: Integration M. : Multiplicity
ocH3
(112)
c ôc H ôH I M. I (Hz) COSY ROESY HMBC
Cl 1,47.3
C.t 749.7
Ce 110.4 Hg 6.979 1 d 1.8 OCHg Ct,Ct,C¿., Cs,Cl
C+ 134^5
Cs 12't.0 Hq 6.760 1 dd 1".8,7.8 Ht, Ha Cr, C:, Cr'
C6 776.7 Hr 6.724 7 d 7.8 Hs Cz,Cr
Cr. 75.7 Hl' 4.468 1 d 6,6 Hz Hc, OCHg Ca C¿ Cq Cl Ca'
Cl 78.5 Hr, 3.61,3 1, ddd 3.0,4.8,6.6 H1 ', H3'a,H3b Cl'
Ca 64.9 H3'u
Hg'b
3.4140
3.3L4
1
1,
dd
dd
3.0, 10.2
4.8,1,0.2
Hz',Hg'b
Hr', Hq'"
C1'
Ct',Cc'
Cz' 56.0 QCFIa 3.850 ó s Ht Ct
OHr 8.503 1 brs
734
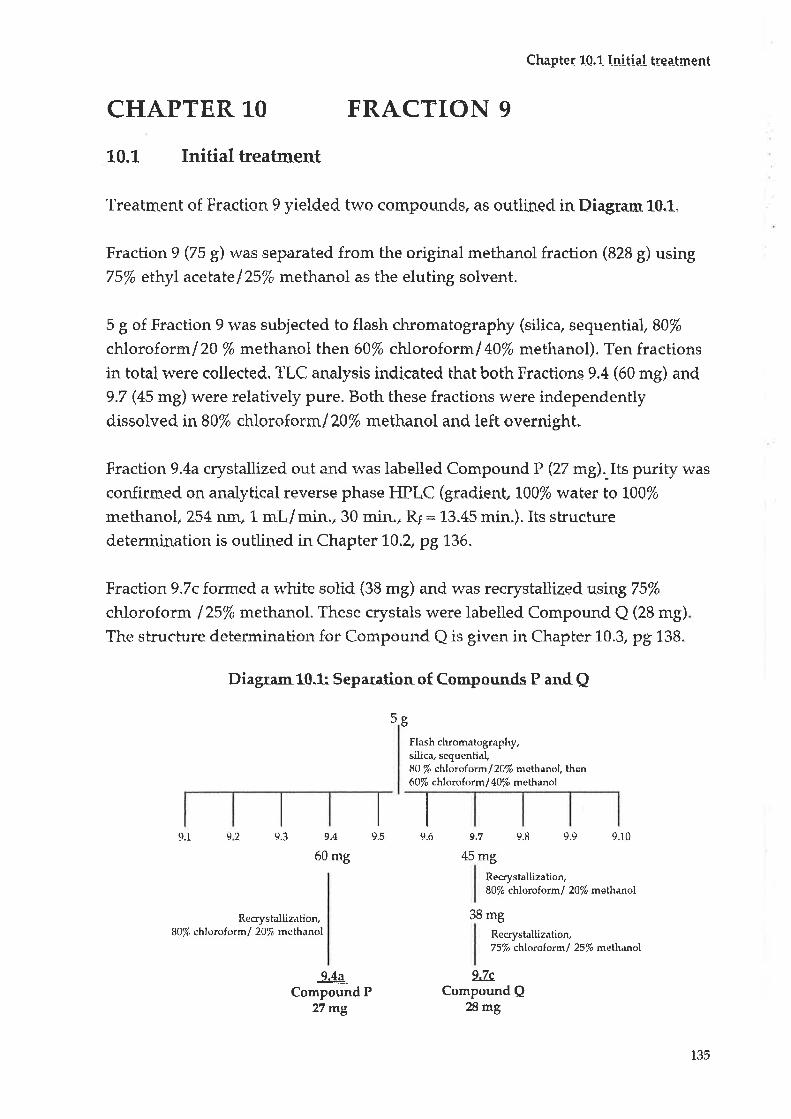
Chapte r 10. 1 l-n-itial_ tre a_trn_en_t
CHAPTER 1-O FRACTTON 9
10.L Initial treatment
Treatment of Fraction 9 yielded two compounds, âs outlined in Diagra-m 10.1..
Fraction 9 (75 g,) was separated from the original methanol fraction (828 g) using75/o ethyl acetatel2S% methanol as the eluting solvent.
5 g of Fraction 9 was subjected to flash chromatography (silica, sequential, S0%
chloroforml20 /o methanol then 60% chloroform/ 40% methanol). Ten fractionsin total rsere collected. TLC analysis indieated that both Fractions 9.4 (60 mg) and9.7 (45 mg) were relatively pure. Both these fractions were independently
dissolved in80% chloroÉorml70% methanol and left overnight.
Fraction 9.4a cÐrs¡allized out and was labelled Compound P (27 rr,g)._Its purity was
confirured. on analytical reverse phase HPLC (gradient, t00% water to L00%
methanol 254 nm" 1- mL/mirr, 30 mirl, Rr: 13.45 miru).Its structuredetermination is outlined in Chapter L0.2" pg 136.
Fracbion 9.7c formed a vrhite solid (38 mg) and was recrystallized using 75%
chloroform 125% methanol. These crystals were labelled Compound Q (28 mg)
The structure determination for Compound Q is given in Chapter 10.3, pg 138.
Diagram 10.11 Separation of Compou-nds P and Q
5 ùö
Flash chromatography,silica, sequential.80 % ctrlo¡oform/20% meth¡¡ol, thenó0lo chloroform/ 40% methanol
I
9.3929.1
I
9.5
I
9.6
Recrystallization,80/c chloroform/ 20/o methanol
9.4
60 mg
9.49Compound P
27 mg
9.7
45 mg
9.7cCompound Q
2tl mg
9.8 9.9 9.10
Recrystallization,80/o chloroform/ 20% methanol
38 mgRecrystallization,75% ciloroform / 25% melh:anol
135
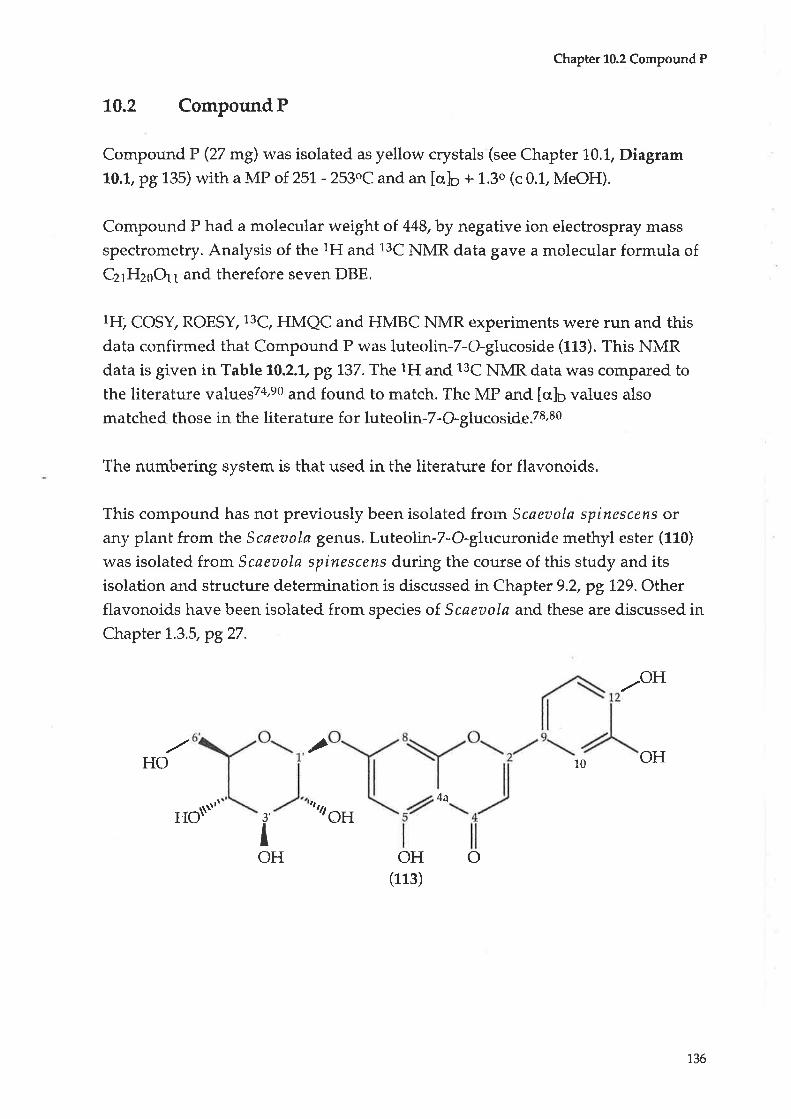
Chapter 10.2 Compound P
10.2 Compound P
CompoundP (27 mg) was isolated as yellor.v crystals (see Chapter 10.L, Diagram10.1, pg 135) with a MP of 251, - 253oC and an [oJo + 1.3o (c 0.L, MeOH).
Compound P had a molecular weight of 448, by negative ion electrospray mass
spectrometry. Analysis of the lH and 13C NMR data gave a molecular formula ofCzrHzoQl and therefore seven DBE.
tH; COSY, ROESY, 13C, HMQC and HMBC NMR experiments were run and thisdata confirmed that Compound P was luteolin-7-Gglucoside (1L3). This NMRdata is given in Table t0.L1+ pg I37 . The 1H and 13C NMR data was compared to
the literature valuesT4'el and found to match. The MP and lalo values also
matched those in the literature for luteolin-7-O-gLrtcoside.78,80
The numtrering system is that used in the literature for flavonoids.
This compound has not previously been isolated from Scaeaola spinescens orany plant from t}i.e Scaeaola genus. Luteolin-7-O-glucuronide methyl ester (110)
was isolated from Scaeaola spinescens during the course of this study and itsisolation and. structure deternnination is discussed in Chaptet 9.2, pg t29. Otherflavonoids have been isolated from species of. Scaeaolø and these are discussed inChapter L.3.5,p927.
./oH
HO/
OH10
4a
Hottt''ttt4
OH3'
tOH oHo
(113)
136
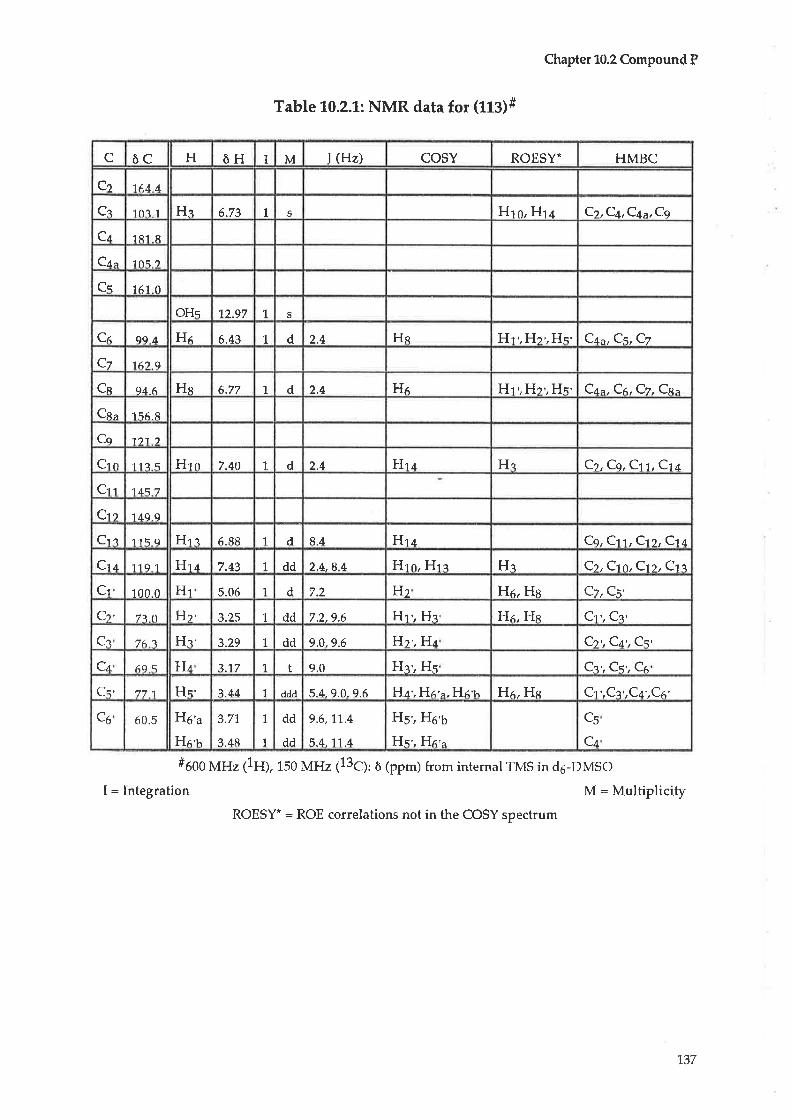
C òc H ôH I M l(Hz) COSY ROESY* HMBC
Cr 'l(.! 4
C¡ 103 1 He 6.73 1 S Hto, Hr¿ C2,C4,C4^,Cg
C¿ 181 I
Cl,^ 1n5 ?
Cc 161.0
OHs 72.97 1 S
Cr ssL Hr 6.43 1 d 2.4 Hn Hr'.Hr'.Hq' C¿,a, Cs, Cz
Cz 16) S
Cs 94.6 Hs 6.77 1 d 2.4 He Hl,,Hr',Hs' C¿",Ce,Cz,Cn"
CBu 156.8
Cq '12't )
Crn 11? 5 Hrn 7.4{t 1 d 2.4 Hl¿ Hq C2, Cg, Cl t, Ct ¿
Clr 145 7
Crr 149.9
Crr 115 q Hrq 6.88 1 d 8.4 F{tt Cq, Clt, Ctt, Ct¿
Ct ¿, 11q 1 Hl¿ 7.43 1 dd 2.4.8.4 Hrn, Hra H.q C2, C1o, Clz, Clz
Cr 100.0 Hl 5.06 1 d 7.2 Hz Hr, Hg Cz,Cs'
Ct, 72 tl Hl 3.25 1 dd 7.2.9.6 Hr', Hq, Hr, Hn Cr', Cc'
Cg 76,i Hg' 3.29 L dd 9.0,9.6 F{t',H¿ Ct',C¿',Cl
C¿ 695 H¿ 3.17 1 t 9.0 H¡', H.s C¡', Cs', GCc' 77 "l Hç' 3.44 1 ddd 5.4- 9.0.9_6 H¿',Hr'",Hrr. HT, H¡¡ Cr',Ca',C¿',Cc
C5 60.5 H6'a
Hr'¡3.71
3.48
1
1
dd
dd
9.6, L7.4
5.4, 't1.4
Hs; HotHs', Hr'"
C5
Ca
Chaptert0.2 CompoundP
Table 10.2.L: NMR data for (LL3)#
#ooo vtg" (1F{), 1so MHz ç13ç¡. ô (ppm) from internal TMS in d6-DMSo
I = Integration M: Muttiplicity
ROESY*: ROE correlations not in the COSY spectrum
137
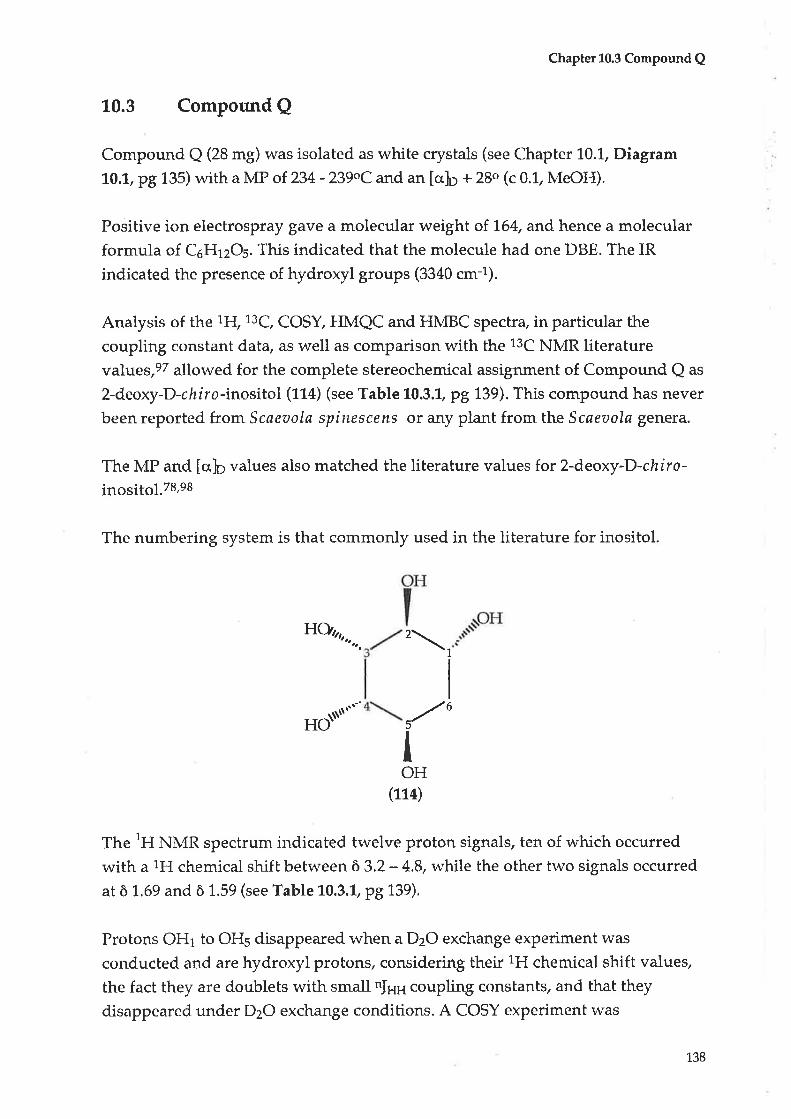
Chapter10.3 Compound Q
10.3 Compound Q
Compound Q (28 mg) was isolated as white crystals (see Chapter 10.L, Diagram
70.7,p9135) with a MP o1234 -239oC and an [oJp + 28o (c 0.1, MeOH).
Positive ion electrospray gave a molecular weight o1'J,64, and hence a molecular
formula of C5H12O5. This indicated that the molecule had one DBE. The IR
indicated the presence of hydroxyl groups (3340 cm-l).
Analysis of the 1H, 13C, COSY, HMQC and HMBC spectra, in particular the
coupling constant data, as well as comparison with the 13C NMR literaturevalues,ez allowed for the complete stereochemical assignment of Compound Q as
2-deoxy-D-chiro-inositol (114) (see Table 10.3.1" pg 139). This compound has never
been reported from Scneuola spinescens or any plant from l}i.:e Scaeoola genera.
The MP and [qb values also matched the literature values for 2-deoxv-D-chiro-
i¡esifsl.78,98
The numbering system is that commonly used in the literature for inositol
Hùr,,,,...
1
6
5
IHO.ttn
OH(114)
The 1H NMR spectrum indicated tr,velve proton signals, ten of which occurred
r,r¡ith a lH chemical shift between ò 3.2 - 4.8, while the other two signals occurred
at ò 1.69 and ô 1.59 (see Table 10.3.7, pg 139),
Protons OFII to OI{5 disappeared when a D2O exchange experiment was
conducted and are hydroxyl probons, considering their 1H chemical shift values,
the fact they are doublets with small n|11¡1collpling constants, and that they
disappeared under D2O exchange conditions. A COSY experiment was
138
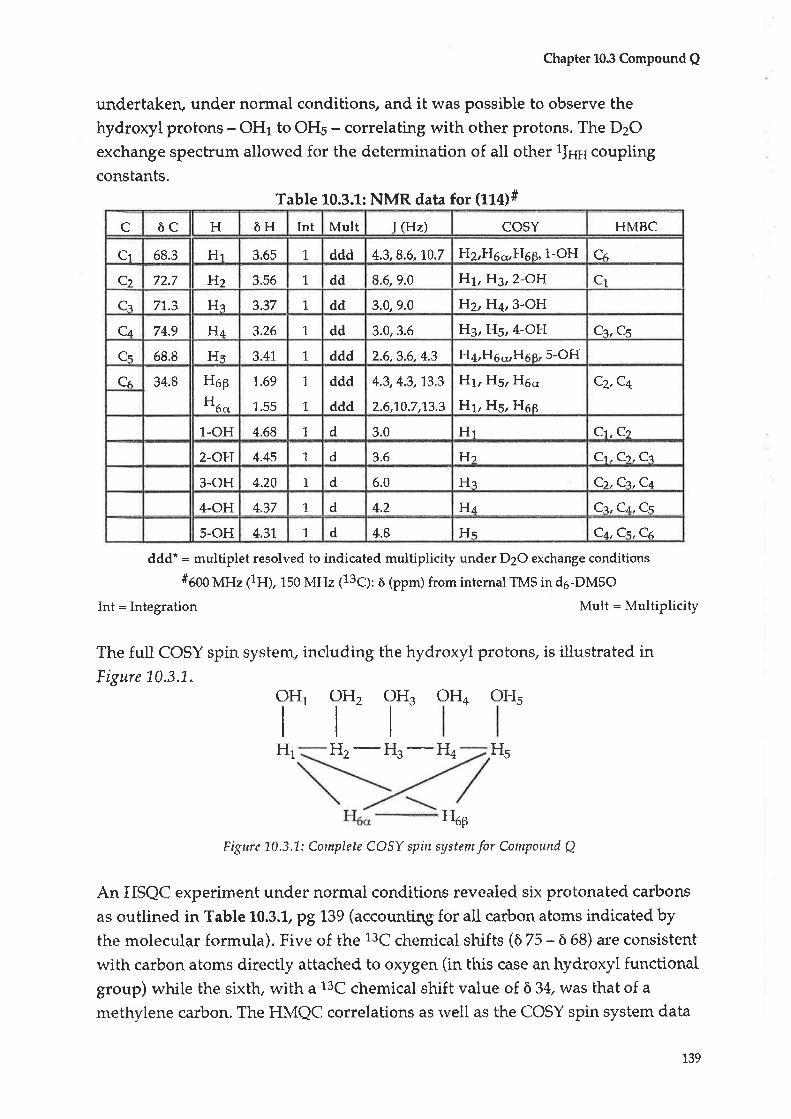
Chapter10.3 CompoundQ
undertakerL under normal conditions, and it was possible to observe the
hydroxyl protons - OHr to OH5 - correlating with other protons. The DzO
exchange spectrum allowed for the determination of all other 1J¡r¡l coupling
constants.Table 10.3.1: NMR data for (114)#
c ôc H ôH Int Mult T (Hz) COSY HMBC
Cr ó8.3 Hl 3.ó5 1 ddd 4.3,8.6,10.7 fÌ2rH.56,FI5e,1-OH Cá
Cz 72.7 H2 3.56 1 dd 8.6,9.0 H1, H3, z-OH C1
Ce 77.3 H¡ 3.37 1 dd 3.0,9.0 HZ, H.4,3-OH
C¿ 74.9 H¿ 3.26 1. dd 3.0,3.6 H3, FIsr 4-OH Ca, Cs
C-s 68.8 H.s 3.41 1 ddd 2.6,3,6, 4.3 H4,H6-,H6g,5-OH
Cr, 34.8 HH
6p
6cr
1,.69
1.55
1
1
ddd
ddd
4.3,4.3, L3,3
2.6,10.7,13.3
H1, H5, H5o
Ht, Hs, Heg
cz,c+
1-OH 4.68 1 d 3.0 Hl Ct,Ct
2-OH 4.45 1 d 3.6 Hr Cr. Cr, Cr
3-OH 4.ZA 1 d 6.0 Hq Cr, Ce, C¿
4-OH 4.37 1 d 4.2 H¿ Cc, C¿, Cs
s-oH 4.37 1 d 4.8 Hs C¿'Cs,Cs
ddd* : multiplet resolved to indicated multiplicity under D2O exchange conditions
#600 MH" (1H), L50 Mnz 1rsçr' ö (ppm) from internal TMS in do-DMSo
Int = Integration Mult: Multiplicity
The full COSY spin system, including the hydroxyl protons, is illustrated inFigure L0.3.1,.
H1 Hz -He -H¿
Hs
FIep
Figtre'1,0,3,1: Complete COSY spitt system þr Compound Q
An HSQC experitnent under normal conditions revealed six protonabed carbons
as outlined in Table 10.3.1" pg 139 (accounting for all carboR atoms indicated by
the molecular formula). Five of the 13C chemical shifts (ô 75 - ð 68) are consistent
rvith carbon atoms directly attached to oxygen (in tlús case an lrydroxyl functionalgroup) while the sixth, with a 13C chemical shift value of ò 34, was that of a
methylene carbon. The HMQC correlations as well as the COSY spin system data
oHr oHz oH"tll oHsoH+
139

Chaptet 10.3 Compound Q
indicate the structure of an inositol (Figure 10,3,2), without the stereochemistry
being assigned.
This accounts for the molecular formula of CoHtzOs, a molecular mass of 164, as
well as the one DBE indicated by the molecular formula, associated with a ring.
An HMBC experiment was conducted and these correlations, displayed in Table
10.3.1, pg L39 confirm the general strucbure of (114) as shown inFigure L0.3.2.
Figure 10.3.3 illustrate the HMBC correlations that confirm the connectivity of allprotons to their adjacent carbon atoms.
OH\/ H1
c3OH
ËL..c4
cs
Hs OH
Figtre 10.3.2: GenerßI stnrchn'e of flla)
H2 oHz
,oHz HsO
c2 oHr Hso
H6p
H2
HO
Hr.,,,-
H+ -r
HO
c2
c1
I
c6
füB
\c1
oHzI
c3H"
H¿o
Hso H1
c4
H4
H¿Ê H¿o
oHs
Figure L0.3.3: HMBC correlatiotts
c5
IH40
,
oHs Hsoc6
140

Chapter 10.3 Compound Q
StereochemistryThe coupling consËan[s for the protons of (tt¿) can be used to determine the
relative stereochemistry.
Under normal conditions the multiplicities of the non-hydroxyl protons weredifficult to determine. However, when run under D2O exchange conditions and
with the removal of the coupling between the hydroxyl protons and theiradjacent protons, the multiplicities could be determined. They are given in Table
10.3.1, pg739 and illustrated inFigure 10.3,4.
8.6 9.0 3.0 3.6
2.6
H1 H2 H3 H4 Hs
4.3r0.7 4.3
Ho".Hop13.3
rhe starrins point ro, uffi:iä;;';'ü:îif'i'"1ÍÍl couplins constant
between H¡;o and FIøp of t3.3Hz for this pair of geminal protons. It was then
necessary to distinguish any axial-axial relationshipr.
H1 has aL0.7 Hz coupling constant to FIoo while Hr has one of 4.3 Hz to FIoB.
Therefore H5o is trans diaxial to Hl arrd FIóp must therefore be equatorial(Figure
70.3.5).It then follows that H1 is trans diaxial rvith H2 (8.6 ÉIz) rvhìIe Hz is trans
diaxial with H3 (9.0 Hz), as they possess large coupling constants (Eigure 10.3.6).
H1
r0.79.0 8.6
4.3 H3
13,3
Figtre 10.3.5: Coupling for H6oand H6B Figtre L0.3.6: Coupling for Hz HAand H4
H3 has a coupling constant of 3.0 Hz to H¿, indicating they are cis to each other(Figure 1,0,3,7). FIs is the last proton to be assigned, either axial or equatorial. Ffu
has a coupling of 2.6 Hz to FI¿o and a coupling of 4.3 FIz to FIrp. This indicates that
H5 and FI5o are in an axial - equatorial relationship (the smaller of the two
I
H2
141,
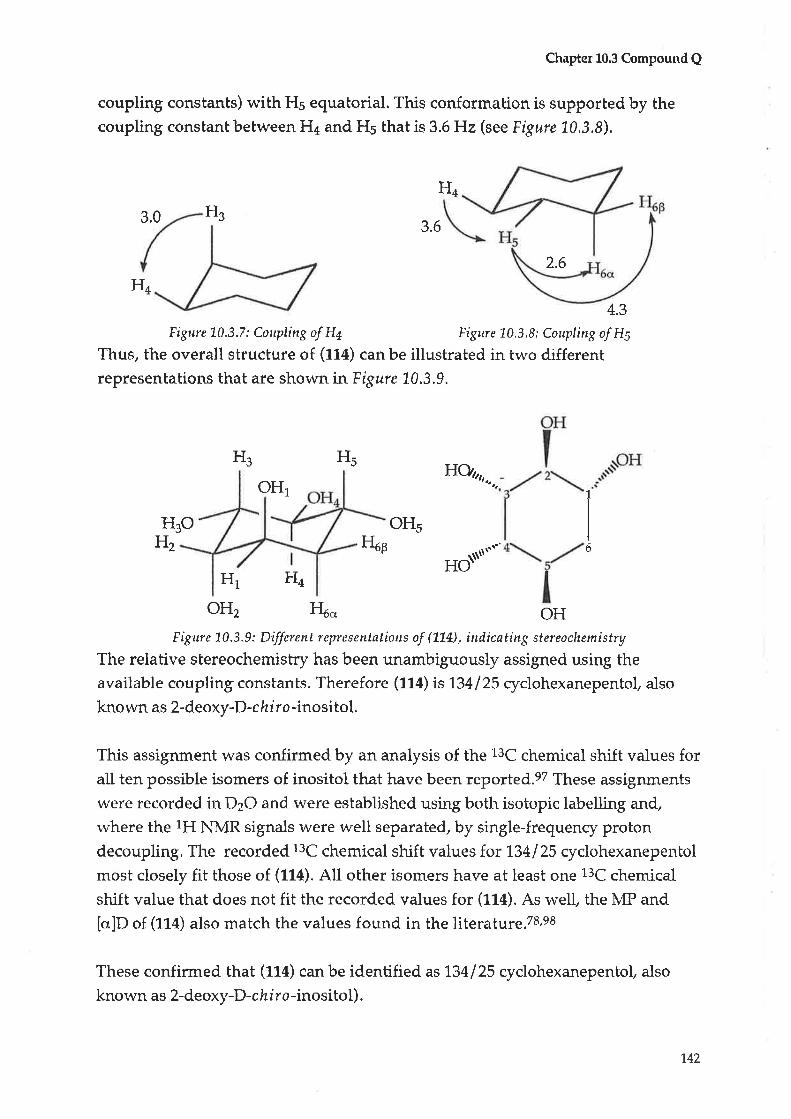
Chapter 10.3 Compound Q
coupling constants) with H5 equatorial. This conformation is supported by the
coupling constant between Ha and H5 that is 3.6 Hz (see Figure 10,3.8).
H4
3.0 H33.6
4.3
Figure L0.3.7: Cotryling of H4 Figure 10.3,8: Coupling of H5
Thus, the overall structure of (L1a) can be illustrated in two differentrepresentations that are shown tnFigure 10.3.9.
H3 Hs
2.6
H4
oHr,Ottt,..
oHs
HO\"*H1 H4
oHz FI6' OHFigure L0.3-9: Different representations of (774), ittdicating stereochemistry
The relative stereochemislry has been unambiguously assigned using theavailable coupling constants. Therefore (11a) is1,34125 cyclohexanepentol, also
known as 2-deoxy -D - chir o-inositol.
This assignment was confirmed by an analysis of the 13C chemical shift values forall ten possible isomers of inositol that have been reported.eT These assignments
were recorded in D2O and were established using both isotopic labelling and,
r,vhere the lH NMR signals were well separated, by single-frequency protondecoupling, The recorded 13C chemical shift values Íor 134125 cyclohexanepentol
most closely fit those of (114). All other isomers have at leask one 13C chemical
shift value that does not fit the record.ed values for (ff+). As well, the N{P and
[cr]D of (1-14) also match the values found in the [i¡s¡¿¡u¡s.78,e8
These confirmed that (11a) can be identified as L34125 cyclohexanepentol, also
known as 2-deoxy-D-chir o-inositol).
FIeB
H3oH2
1
6
142

Chapter 11 Biological testing
CHAPTER 1.1. BIOLOGICAL TESTING OFSCAEVOLA SPINESCENS
A range of biological tests were conducted on crude extracts of Scaeaola
spínescens as well as on semi purified and purified compounds. These tests
included anti bacterial, cytotoxic and anti viral testing. The experimenbal
methods used are outlined. in more detail in ChapEer l-3 - Experimental.
1L,L Anti bacterial testing
Anti bacterial testing was conducted on all crude fractions of Scaeaola spinescens.
The crude fractions lvere tested against the follor,ving bacterial strains -
Staphylo co ccLts ßur eus (5. aur), S taphylo co ccLts epi didemtts (5. epí), Escheríchía
coli (8, coll) and Candida ølbicøns (C. alb), all of which rvere supplied by the
School of Pharmacy, University of South Australia.
The methanol extract (828 g) was initially separated into ten fractions (see Chapter
3, Diagram 3.1.1). These crude fractions rvere labelled Fraction 1. to Fraction 10.
60 mg of Fraction l- was dissolved in 1 mL of hexane. 15 UL of the solution was
then pipetted separately onto fwenby prepared filter discs and the solvent allowed
to evaporate, The four baeterial çtrain.s lvere inoculated onto four separate plates
and five of the prepared filter discs placed on the agar plate, as u'ell as one disc
that had been inoculated with water. The plates were incubated for two days and
then analysed- Bacterial cullures grcw on all plates, and the control discs had no
inhibiting effect.
This procedure was repeated for all of the crude extracts, from Fraction L to
Fraction 1.0, with the only difference being the type of solvent used to prepare the
inilial concentrations. 60 mg of Fraction 2 and Fraction 3 rvere dissolved in90%
hexane/ 10% ethylacebate. 60 mg of Fractions 4 and 5 were dissolved ingQ%
chloroforml 1,0% methanol while Fractions 6 to 10 \l¡ere dissolved in methanol.
Only on the discs inoculated with Fractions 4, 8 and 9 were zones of inhibitionobserved and an ai'erage zone debermirr-ed, None of the other fraetions exhibited
any inhibitory effect on the four bacterial strains. The above experiments for
143
(}
Chapter 11 Biological testing
Fractions 4, 8 and 9 were conducted in duplicate, with very similar results each
time.
Fraction 4 had an average zone of inhibition of 13 mm against S. aur, L3 mm
against S. epi and L6 mm against C, ølb.
Fraction B also inhibited the growth of S. aur (with a zone of inhibition of 10
mm) as well as S. epi (7 mm).
Fraction 9 was effective against all bacterial cultures. The zone*q of inhibitionwere 7 mm (5. øur), L2 mm (S. epi), L0 mm (8. coli) and 6 mm (C. alb).
Fractions 4, 8 and 9 were subjected to a range of separation techniques (partition,
flash chromatography, crystallization and HPLC as outlined in Chapters 6, 9 and
10).
Two compounds lvere isolated from Fraction 4 - a novel coumarin, emmarin (98)
as r,vell as vanillic acid (99) (discussed in Chapter 6.2-6.3). The purifiedcompounds would need to be tested to see íf the anti bacterial activity isassociated with these compounds. Coumarins were discussed in Chapter 1.3.3 and
a number of coumarins previously reported from Scaeaola species have shown
anti bacterial activity, such as xanthyletin (e3¡.sau
o ocH3
(e8) (ee)
o
(43)
Four iridoids - loganin (5), scaevoloside (6), alidyjosioside (108) and katecateroside
(L09) were isolated from Fraction 8 (this is discussed in Chapter 8,2 - 8.5). The
iridoid family was discussed in detail in Chapter 1.3.I.2. Some iridoids, such as
aucubin (11) do exhibit remarkable anti bacterial activities, associated with the
hemi-acetal structure of the iridoid aglycone. Isiguro (tgg0)¿0 treated aucubin (11)
with beta-glycosidase and found that the resultant aglycone \^'as very active
a
a
OH
oo
TM

Chapter 11 Biological testing
against S. aur. Elich (1902)zs also found aucubin (11) to be very effective against S
øur
ofur, ..$CH3 H
H3Cn
o¡u
ot/
OGlu
(6)
o o oH ocH3 H
o to o,t l
t/ tlOGluo OGlu
(108) (1oe)
cH20H
o O-Glu Çl¡: glucose
(11)
At this time of lvriting/ the purified compounds from Fraction I have not been
tested. It may also be worthwhile to test the iridoid aglycones.
Fraction 9 was separated by flash chromatography, into ten Fractions, labelled 9.L -
9.10, and these were tested. Fraction 9.2 was very active against S. aur (zone ofinhibition of 10 mm) and slightly active against S, epi (zone of inhibition of 2
mm). Fraction 9.3 and 9.L0 were slightly active against S. aur (zone of inhibitionof 2 mm).
Fraction 9.4, fuom which luteolin-7-O-glucoside (113) crystallised out (See Chapter
9.2), had a zone of inhibition of tl mm against S. epi, Luteolin (ffS) has been
reported as having anti inflammatory and anti bacterial activities, although the
o
H
OGlu
o
H
(s)
HH
145
Chapter 11. Biological testing
glycoside (113) does not appear to be active, except as a feeding attractant to
þsstlss.s3b
It was planned that all compounds that were purified and their structuredetermined would be individually tested using this technique/ but that has notoccurred to date.
6lu: glucose
GluO oOH
oHo OH
(113) (1ls)
OH
OH
71,2 Anti tumour activity
Four separate anti tumour testing procedures were conducted on various crude
extracts ol Scaeaola spinescens with the assistance of Dr Robert Forvler and DrSue Semple of the School of Pharmacy and Medical Sciences, University of South
Australia. The methods used are outlined in Chapter 13.
11.2.1 Cytotoxicity tests - Procedrue AThe aim of this experiment was to provide a preliminary screen of the effect of a
numþer of erude an-d partia-lly punfied exkaets against three different eaneer eell
lines, supplied through the Pharmary DeparLmenb, University of South
Australia.
The three tumour cell lines were:
A An adherent human melanoma cell line - MM4L8E, which secretes
melanin (obtained from the Department of Pharmacy, University ofSouth Australia).
B An adherent human bladder carcinoma cell line - 5637 (obtained fromDr D Rathjen, Department of Immunology, Women's & Children'sHospital, Adelaide).
C An adherent human breast adenocarcinoma cell line - MDA MB 231
(obtained from the Department of Pharmacy, University of South
Australia).
14Á
Chapter L1 Biological testing
AII cell lines were incubated at 37oC andí% COz. Cell lines A and B were keptgrowing in RMP1 1ó40 medium supplemented with \0o/o heat inactivated foetal
calf serum,2 mM/L-glutamine,50 mg/ml penicillin/streptomyocin and 10-s M2-mercaptoethanol. Cell line C was kept growing in DMEM medium,
supplemented r,l'ith all of the above plus 50 mg/ml insulin.
All extracts were solubilised in either water, ethanol methanol or DMSO, then
the solvent removed and the material left was then weighed so as to produce an
initial concentration of L00 mg/mL. This initial concentration then underwent
serial dilution to determine the presence of any potential cytotoxicity.
Extracts I -7 werc the crude extracts from the partition of lJire L2.7 kg of plant
matter into hexane, ethyl acetate, methanol and water (see Chapter 3). Methanol
extracts - Fractions 7 - L0 were obtained from the flash chromatography of 828 g of
the methanol extract. The exkacts tested were:
Extract L
Extract 2
Extract 3
Extract 4
Extract 5
Extract 6
Extract 7
Extract 2.4
Extract 2.8
Extract 2.9
Extract 2.10
Crude HzO extract
Methanol extract
Water extract
Crude ethyl acetate extract
Crude Ffexane exbact
Water extract (after partition with cirloroform)
ChloroformMethanol extract - Fraction 7
Methanol extract - Fraction 8
Methanol extract - Fraction 9
Methanol extract - Fraction L0
Controls for methanol, ethanol and DMSO were included to ensure any
cytotoxicity was not due to the presence of these solvents.
Methods for preparation of cells, the cytotoxiciby assay and plate preparation are
outlined in Chapter 13.
Originally, three cell lines were to be investigated, but due to the slow growth of
the MDA cells only limited results were available for that cellline.
Instead of the desired inhibitory/cytotoxic effect of the extracts, there lvas a
massive stimulatory effect at higher dilutions (1/ 100 - 112700) for most of the
r47
Chapter 11 Biological testing
extracts against the 5637 bladder carcinoma cell line. This stimulation at highconcenbrabion was quite consistent throughout the initial seven extracts and so
indicates that more than one compound is responsible. Holvever, it is also
possible that the stimulatory effect at high concentrations may be due to the
fractions acting as nutrients.
This high stimulation of growth would appear to be masking any cytotoxic
effects, especially as the more purified extracts (Fractions 7 to 10) show both
cytotoxicity at low concentrations and stimulahion at high concentrations.
There was a clear sbimulatory effect on MM418E (the melanoma cell line) whichr,vas only apparent in the aqueous extracbs (exfracts L and 6) and so any
compounds that are causing the stimulation are only present in the polarfractions.
There was a stimulatory effect for the breast adenocarcinoma cell line (MDA lvIB
231) in extract 1 (the aqueous extract) and cytotoxicity associated with extract 2 -
the methanol fraction, Horvever, there was limited data for this cell line.
These results are difficult to explain and subsequent re-testing, using similarprocedures, 'vvas not able to replicate these results.
71.2.2 Cytotoxicity tests - Proeedure B
Trn'o cell lines were obtained:
A Primary adherent bladder carcinoma cell line 5637 (ATCC HTB 9)
(obtained from Dr D. Rathjen, Department of Immunology, Women's
ànd Children's Hospital, Adelaide).
B Diploid human fibroblast cell line, human embryonic lung (HEL) cells
(obtained from CSL, Parkville, Victoria). The HEL cells are normal,
non-cancerous cells and are used as a control, to determine whether
the extracts are cytotoxic to normal cells.
The cell lines were routinely cultured at 37oC., in\% COz. Cell line 5637 was
grown on RPMI L640 medium supplemented r,r'ith FCS, HEPES buffer (20 mM),
L-glutamine (2 mM),2-mercaptoethanol (10-sM), gentamicin (16 ¡ig/mL) and
penicillin (12 yglmL), while the HEL cells were grown in Dulbecco's modified
eagle buffer (DMEM) supplemented with sodium bicarbonate (3.7 glL); glucose
Ø.5 glL); FIEPES buffer (15 mÌvl, CSL, Parkville, Victoria, Australia); FCS (10%
vlv); glutamine (2 mM); gentamicin (16 uelmL) and penieillin (12 pglmL).
148

Chapter L1 Biological testing
Three extracts were tested against the two tumour cell lines, the crude lvater
extract and Fraction 4 and 9, due to their strong stimulatory effecb, as indicated by
the results of procedure A. A positive result in a cytotoxicity test would be
indicated by death of cells at low concentratiorL not just at high concentrations. Itis also necessary for the grtotoxicity to be associated with the cåncerous cell line,
not normal cells.
No clear cytotoxic effect could be observed at relevant concenhrations of the crude
extracts, nor was the stimttlatory effect seen in Procedure A observed. The crude
water fraction gave vveak proliferation (131,.9% at a concentration oÍ 1372 pglmL)
of the 5637 cells. Crude Fraction 4 gave weak proliferation (721%, concentration of
4.776 pglmL\ against the FIEL cells but otherwise the cytotoxicity of these fractions
appeared to be small.
11.2.3 Cytotoxicity tests - Procedure C
The crude h.exane, crude ethyl acetate extracts and Fractions 8, 9, 10 and LL were
retested against two cell lines:
A HEL cells - human embryonic lung cells, obtained from CSL (Parkville,
Victoria).B Caco-Z cells - colon cancer cell line (obtained through the Department
of Pharmacy, University of South Australia).
There was no visible cytotoxic effect in any of the extracts tested.
3.2.4 Cytotoxicity tests - Procedure D
One of the referencesl to the use of Scaeaola spinescens indicated that it r¡'as used
in conjunction with Codonocarpus cotinifolir.rs, although no proportion of each
plant was given.
200 g of each plant was collected. Scaeaola spinescens was collected from a site L0
km west of lvlorgan on the Morgan-Eudunda road. A sample was sent to the SA
State Herbarium and verified. CodonocarpLls contifoli u.s was collected from 58
km north of N4annahill, on Weekeroo Station. A sample was sent to the SA
Herbarium and verified.
10 g of Scaeoola spinescens was boiled for 10 minutes in distilled water. The
aqueous extract was then freeze dried, r.veighed and lyophilised. A second
aqueous extract was prepared from 9 g of Scaeaola spinescensll"gCodonocarpr.ts
cotinifolius, with further extracts prepared according to the Table 7-L.2.4.L pg 150.
't49
Chapter 11 Biological testing
The water was removed and then the extracts were dissolved in cell culturemedia to give an extract concentration of 1 mg/mL. Serial L: 2 dilutions of each
extract were prepared in a volume of L00 pl/rvell in a 96 - well microtiter plate.
100 pL of a cell suspension containing Hel cell lines were added to each well, togive a final volume of 200 pL/well. This procedure was repeated for Caco-2 cells,
in separate plates. These plates were then incubated at 37aC for seven days, then
cytotoxicity was assessed using the neutral red rytotoxicity assay.
Table \7.2.4.1: Extracts prepared from proportions of Scaeaolø spinescens and
C o d o no carp us co tinifoliu s
Extract ç Saacznla snincs¿ct¡s ø ( o ilonoaa¡øus aotinifolius
1 10 0
2 9 1
J 8 2
4 7 J
5 6 4
6 5 5
7 4 6
I 3 7
9 2 I10 1 9
11 0 10
The two cell lines that were used to measure cytotoxicity were:
A HEL - low passage human embryonic lung (FIEL) cells (obtained form
CSL, Parkville, Victoria).B Caco-2 - ATCC, FITB37 (obtained from the Pharmacy Departmenb of the
University of South Australia).
The HEL cells are normal, non-cancerous cells and are used as a control. The cell
línes were grown in DMEM (Gibco) containing HEPES (20 mM), gentamicin (L6
uglml,), penicillin (L2 pg,lmL), glutamine (2 mlvÍ) and 10% heat inactivated FCS,
All extracts followed the same general trend, with inhibition decreasing as the
concentration of the samples decreased. There was very little difference between
the HEL and Caco-2 result.
150
Chapter 11 Biological testing
Overall, these cytotoxicity tests were inconclusive. Procedure A appeared to
indicate that the cmde aqueous extracts had a stimulatory effect on the gro\.\.th ofcancerous cells at high concentrations and inhibition at lower concentrations, butthese results could not be repeated.
The purified compounds isolated from Scaeaola spinescens will be tested forcytotoxicity in the futu¡e.
11.3 Anti viral testing
Six purified compounds were submitted for anti viral testing with the assistance
of Dr Robert Fowler and Dr Sue Semple of the School of Pharmacy and Medical
Sciences, University of South Australia. These compounds were:
Compound C
Compound E
Compound F
Compound ICompound J
Compound L
Taraxerol
Ursolic acid
EmmarinAlidyjosiosideScaevoloside
Loganin
A maximum eoReeRtratron of 50 uglL of Compounds C,E,E,I andf was
prepared. Compound L (due to the small quantity isolated) was tested at a
maximum concentration of 25 UglL.
The compounds were tested for anti viral activity against three viruses,
representing three different virus families:
A Herpes simplex type L (HSVI, Herpesviridae).
B Ross River virus strain T48 (RRV, Togaviridae).
C Poliovirus rype 2 (Pieornaviridae).
All viruses were obtained from the Infectious Diseases Laboratory,Institute of
Medical and Veterinary Sciences, Adelaide.
HSV1 and RRV were grown in Vero cells (African green monkey kidney) and
poliovirus was grown in BGM (Buffalo green monkey kidney) cells. The anti
viral assays are otrtlined in Chapter 13.
151

Chapter 1L Biological testing
None of the compounds exhibited activify against any of the three viruses, at
non-cytotoxic concenfrations, The compounds were tested at a maximumconcentration of 50 pglL in cell culture media in the anti viral assays (except forCompound L).
152

Chapter 12 Summ¡ry
CHAPTER 1-2 SUMMARY
The following fourteen species o1 Scaeaola have previously been investigated
Scaeaola spinescens
Scøeaola suaaolens
Scaeuola taccad.ø *
Scaeaola montana
Scaeaola floribunøScaeaola racemigera
S ca ea oI a ch a ¡n is s onia n a
Scaeaola coriacea
S ca eu ol a g øudichaudiøna
S cø ea olø g ø lrdichøtrdiiScaeoola kilaueau
Scaeaola mollisScaeaolø procera
Scaeaolø gøudichøudianø x mollis
36, 38
42
42,54,55, 56, 61
43
45
57,52
6,3
63
63
63
63
63
63
63
(* Scaeaola taccad,a is the preferred namel2 lor Scaeaola plttmie¡i42, $caeuola
frutescens s4,s6 and Scaeaola lobeliass).
A total of ten iridoids, thirteen alkaloids, eight coumarins, thirty terpenoids, fiveessential oils and seven flavonoids have been previously isolated from these
species. They have been identified by a range of spectroscopic techniques, ranging
from lv{S Peak matching, identífication by UV absorbance, to full structuredetermination by NMR experiments. The compounds that have been isolated
previously \.vere discussed in Chapter 1.
In this study, seventeen compounds have been isolated, purified and theirstructure determined by a number of spectroscopic methods.
Of these seventeen compounds four are novel and fifteen have never been
reported from Scaet,ola spinescens. As well as this, thirteen compounds have
never been reported from any species of Scaeaolø.
The occurrence of these compounds in Scaeaolø spinescens and in the familyGoodeniaeae is outlined in Table L2,!,pgl54.
153
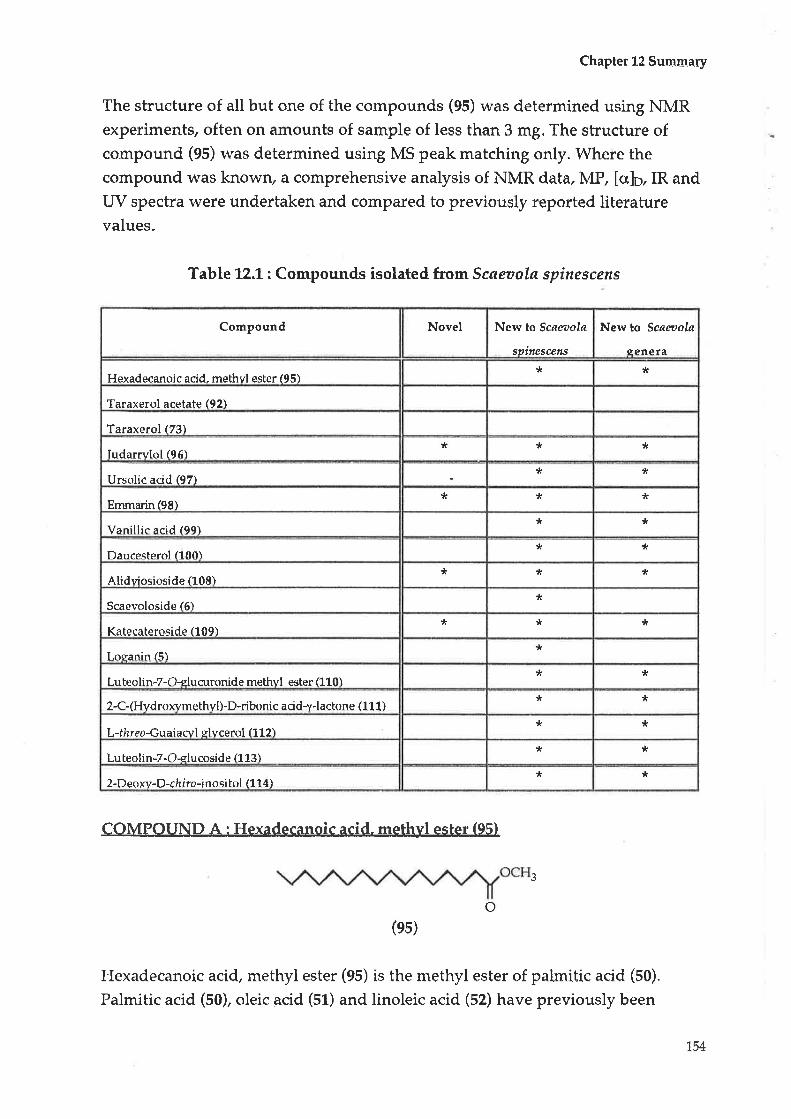
Chapter 12 Summary
The structure of all but one of the compounds (95) was determined using NMRexperiments, often on amounts of sample of less than 3 mg. The structure ofcompound (95) was determined using MS peak matching only. Where the
compound was known" a comprehensive analysis of NMR data,ItdP, [qh¡,IR and
UV spectra were undertaken and compared to previously reported literaturevalues.
Table t2.L: Compounds isolated from Scaeoola spinescens
COMPOUIN,Ð-A : Hexadecanoic acid, methyl ester (95)
3
o(es)
Hexadecanoic acid, metþl ester (95) is the methyl ester of palmitic acid (50),
Palmitic acid (50), oleic acid (51) and linoleic acid (52) have previously been
Compound Novel New to Scøeoolø
søinescens
New to Scaeuola
qeneta
Hexadecanoic acid, methyl ester (95)* *
Taraxerol acetate (92)
Taraxerol 173)
Iudarrvlol (96)* * *
Ursolic acid (97)* *
Emmarin(98)* * *
Vanillic acid 199)* *
Daucesterol f100)* *
Alidviosioside 1108)* * *
Scaevoloside (6)*
Katecateroside (109)* * *
Loganin 15)*
Lu teo lin-7-O-slu curonide methvl ester (1101* *
2-C-(Hvdroxvmethvl)-D-ribonic acid-y-lactone (1 1 1)* *
L-thr eo-Guaiacvl slvcerol (112)* *
Lu teolin-7-O-elucoside (1 13)* *
2-Deoxv-D-cft lro-inosi hol (1 14)* *
154
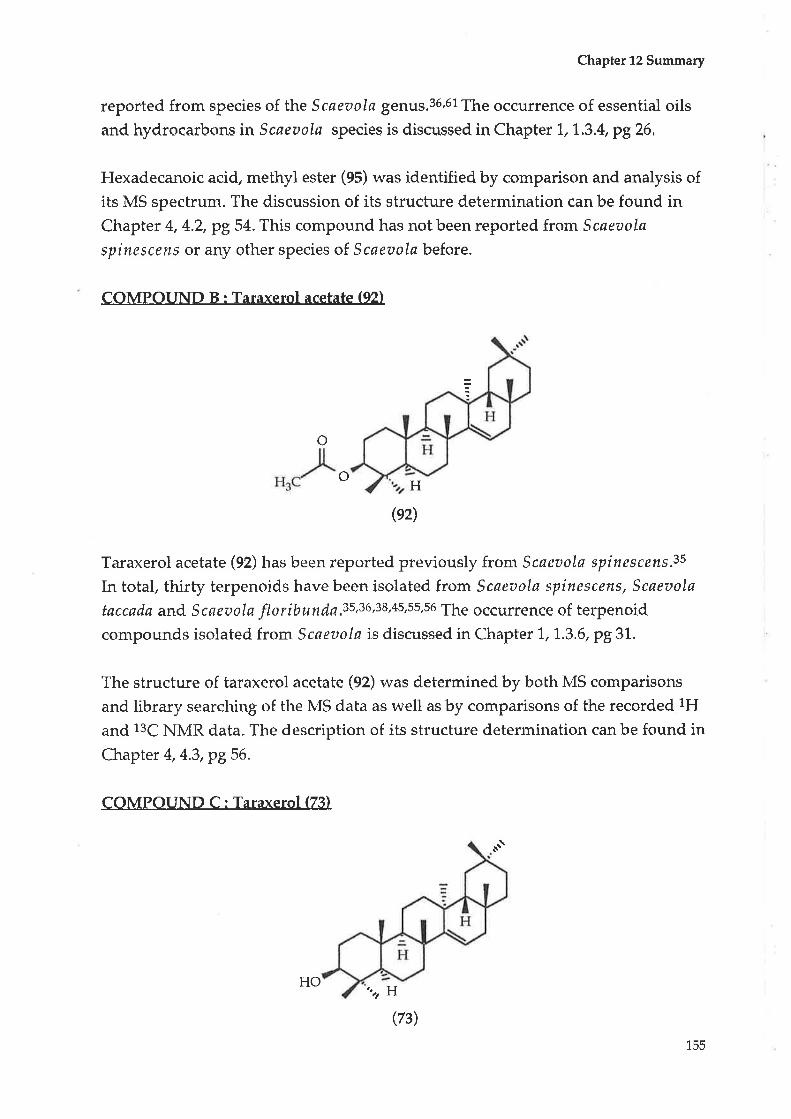
Chapter 12 Summary
reported from species of the Scaeaola genus.36,61The occurrence of essential oils
ancl hydrocarbens in Scaeuolø species is discussed in Chapter L, 1,3.4,p926,
Hexadecanoic acid, methyl ester (95) was identified by comparison and analysis of
its MS spectrum, The discussion of its structure determination can be found inChapter 4, 4.2, pg 54. This compound has not been reported from Scaeaola
spinescerus or any other species of Scaeaolø before.
COMPOUND B: Taraxerol acetate (92)
o
H
(e2)
Taraxerol acetate (92) has been reported previously from Scaeoolø spinescens.3s
In total, thirty terpenoids have been isolated from Scaeaola spinescens, Scaeaolø
taccadø and Scaeoola floríbunfiq.35,36,38,4s,s5,s6 The occurrence of terpenoid
compounds isolated from Scaeaola is discussed in Chapter 1, 1.3.6, pg 31.
The structure of taraxerol acetate (92) was determined by both MS comparisons
and library searching of the MS data as rvell as by comparisons of the recorded lH
and 13C NMR data. The description of its structure determination can be found inChapter 4,4.3,p956.
COMPOUND C : Taraxerol (73)
H
o
.at\
HOat
(73)
155
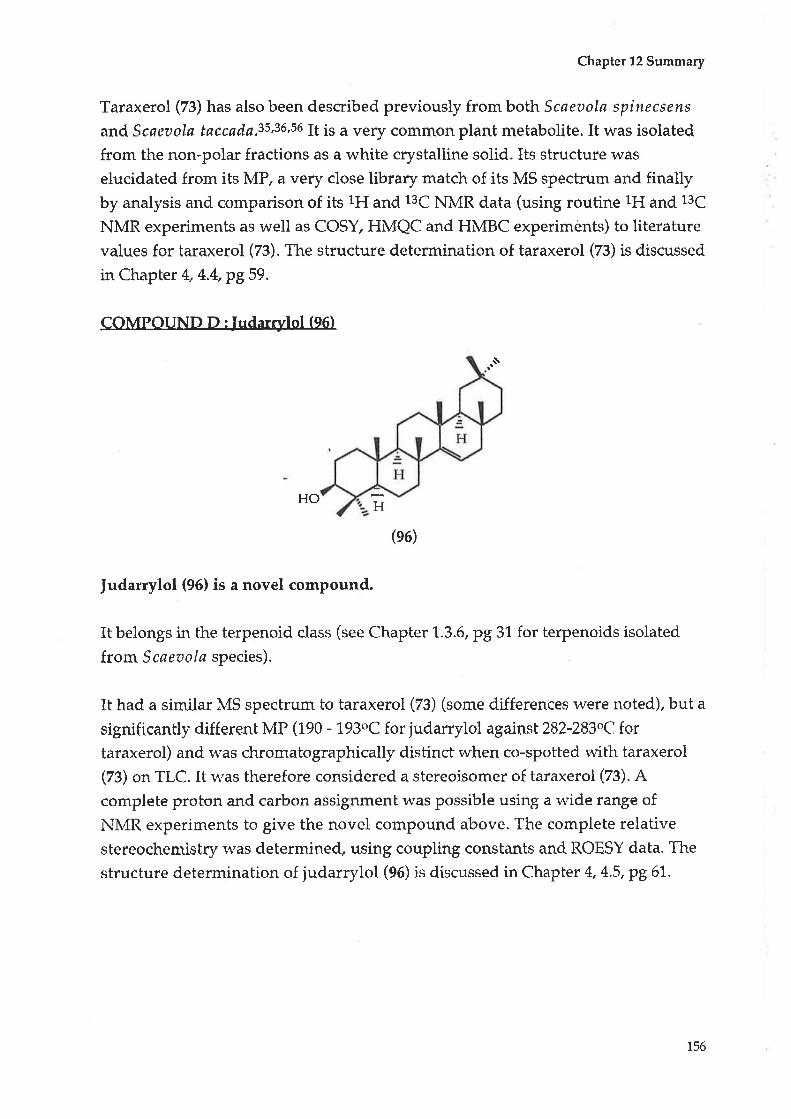
Chapter 12 Summary
Taraxerol (73) has also been described previously from both Scaeoola spínecsens
and Scaeu olø tøccøc16,35,36,56It is a very common plant metabolite. It was isolated
from the non-po1ar fractions as a white crystalline solid. Its structure was
elucidated from its lr4P, a very close library match of its MS spectrum and finallyby analysis and comparison of its 1H and 13C NMR data (using routine lH and 13C
NMR experiments as well as COSY, HMQC and HMBC experiments) to literature
values for taraxerol (73). The structure determination of taraxerol (73) is discussed
in Chapter 4,4.4, pg 59.
COMPOUND rr : Iudarrylol (o6)
HO
(e6)
judarrylol (96) is a novel compound.
It belongs in the terpenoid dass (see Chapter 1.3.6, pg 31 for terpenoids isolated
from S cø er¿ olø species).
It had a similar MS speclrum to taraxerol (73) (some differences were noted), but a
signifieantly different MP (tgO - l,93oc for judarrylol against 282-283oC fortaraxerol) and was chromatographically distinct when co-spotted with taraxerol
(73) on TLC. It was therefore considered a stereoisomer of taraxerol (73). Acomplete proton and carbon assignment was possible using a wide range of
NN,{R experiments to give the novel compound above. The complete relative
stereochemistry r.vas deternúned, using coupling constants and ROESY data. The
structure determination of judarrylol (96) is discussed in Chapter 4,4.5, pg6t.
r\
H
1.56
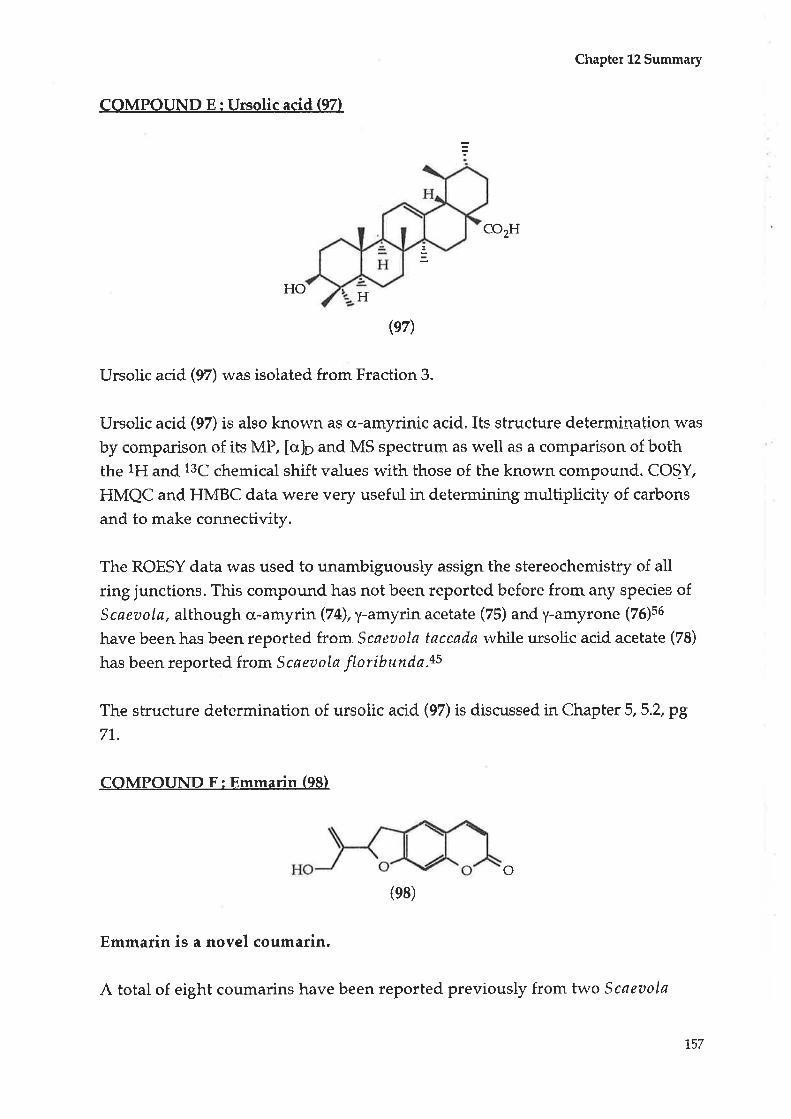
Chapter L2 Summary
COMPOUND E: Ursolic acid (97)
co2H
H
(e7)
Ursolic acid (97) was isolated from Fraction 3.
Ursolic acid (97) is also known as q-amyrinic acid. Its structure determination was
by comparison of its MP, [crJn and MS spectrum as well as a comparison of boththe 1H and 13C chemical shift values with those of the known compound. COS_Y,
HMQC and HMBC data 1,'ere very useful in determining multiplicity of carbons
and to make connectivity.
The ROESY data was used to unambiguously assign the stereochemistry of all
ring junctions. This compound has not been reported before from any species of
Scaeaolø, although a-amyrin (74),y-amyrin acetate (ZS) and y-amyrone (76)s6
have been has been reported from Scaeaola taccada rvhile ursolic acid acetate (78)
has been reported from Scaeaola floribu.nda.+5
The structtrre cletermination of ursolic acid (97) is discussed in Chapter 5, 5.2,p9
71,.
COMPOUND F: Emmarin (98)
o(ra¡
Emmarin is a novel coumarin.
HO
A total of eight coumarins have been reported previously from two Scaeaola
LÒ/

Chapter 12 Su-m_m-ary
species (Scaeaolø taccada and Scaeaola spinescens),36,38,54,55,56 The coumarins thathave been isolaterd previouely are diseussed in Chapter 1, L,3.3, pg 23.
The structure of emmarin (98) vvas elucidated using routine lH and 13C NN,IR
experirnents as well as COSY, HMQC and HMBC experiments, One interestingproblem was that initially it was possible from the data to formulate either a
three, five or seven rlembered ring. A routine 1H NMR experiment in dryd6-DIvlSO gave the hydroxyl proton as a trþlet. Therefore the hydroxyl functionalgroup was abbached to a mebhylene carbon. This enabled the construc[ion of the
dihydrofuran nng observed in- the above sfrqetute,
The data and discussion for the assignment of emmarin (98) can be found inChapter 6,6.2, p877. The strucLure o.f emmarin is very similar bo
furanocoumarins previously isolated from species of the Scaeaal.a genera.
ocH3
(ee)
The common name for this compound is vanillic acid (gg) and its systematic
name is 3-methoxy-4-hyd roxybenzoic acid.
This compound was isolated by normal phase ÉIPLC. Its struchre was
determined using standard NMR techniques. Although a simple compound, itwas difficult to fully characterise. The substitution pattern was established by a
combination of analysis of the MS spectrum and nOe daba. This compound has
not been reported from either Scaeaola spinescens or any other species of
Scaeuola before. The structure determination of this compound is discussed inChapter 6,6.3, pg 88.
158
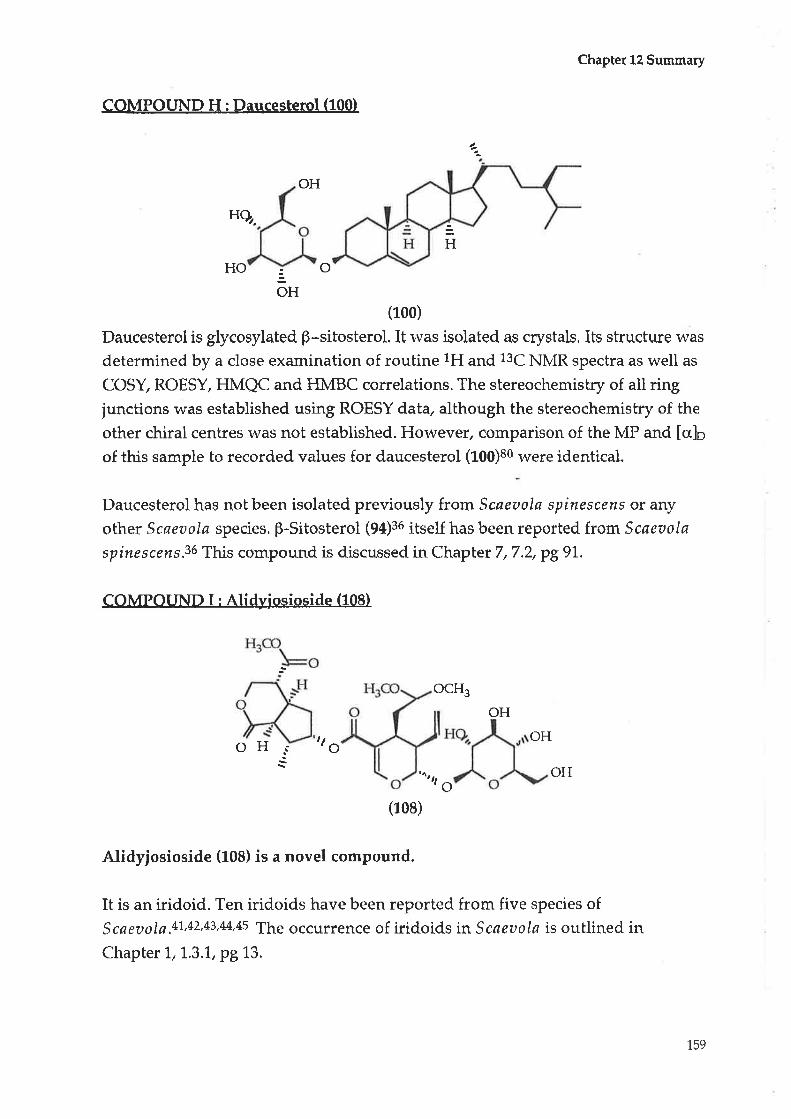
Chapter L2 Summary
COMPOUND H: Daucesterol (100)
OH
HO oOH
(10o)
Daucesterol is glycosylated p-sitosterol. It rvas isolated as crystals. Its strucfure was
determined by a close examination of routine lH and 13C NMR spectra as lvell as
COSY, ROESY, HMQC and HMBC correlations. The stereochemistry of all ringjunctions was established using ROESY data, although the stereochemistry of the
other chiral centres r,vas not established. However, comparison of the MP and [uJo
of this sample to recorded values for daucesterol (fOO)so were identical.
Daucesterol has not been isolated previously from Scaeaola spinescens or any
other Scøeaolø species. B-Sitosterol (94)36 itself has been reported from Scøeaola
spinescens.36 This compound is discussed in Chapter 7,7.2, pg9I.
COMPOUND I: Alidyiosioside (108ì
te
Il9?.
H
,lOH o
ocH3
OH
OH
'ctl O
OH
(108)
Alidyjosioside (108) is a novel compound.
It is an iridoid. Ten iridoids have been reported from five species of
Scaeuola.41,42'43,44,4s The occurrence of iridoids in Scaeuola is outlined inChapter L, 1.3.1, pg 13.
159

Chapter t2 Sum_ur-ary
It was isolated from the more polar fractions by extensive chromatography,including flash chromatography, normal phase HFLC and rever,qe phase HPtC.The full structure was determined using 1H and 13C experiments (including
DEPÐ. 4 COSY experiment established three independent spin systems. UsHcorrelations were established using an HMQC experiment and three partstructures wefc established- A 2/3JgH experiment was used to establish
connectivity between the tfuee part structures.
Stereochemishry was established usingboth NOESY and ROESY experiments.
This data and arguments fcr the stereochen:ieal a=qsignmen[s put forward are
presented in Chapter 8, 8.2, pg 95.
Two confoffRers of the ring to which the carboxymethyl group is atbached were
observed irr the ROESY and NOESY experiments.
This comBound ie very simihr to scaevoloside (6), reported previously fromScaeoolø racemigerø.44 There are two differences. Firstly, the aldehyde present inscaevoloside (6) is here presented as the dimethyl acetal. Secondly, the
stereochemislry around one chiral carbon (the attachment of the carboxymethyl
group) is different to that reported.aa
It is possible that alidyjosioside (10S) is an artefact of the extraction process. It is a
novel eam-pouRd, nsnetlr-eless. '- - ---l-
COMPOUND I: Scaevoloside (61
H
OH
OH
o tlt o(6)
Scaevoloside (6) is an iridoid (see Chapter L, 1.3.1, pg 13).It has been isolated fronr
Scaevola racemigeraaabut not from Scaeaola spinescens.
*Ho o
OH
OH
Hg
o
oI
160

Chapter 12 Su_m-m-a_ry
The structure of scaevoloside (6) was established using a range of NMRspectroscopic techniques as well as by comparison with the reported data.aa Thestereochemistry of all chiral carbons was assigned using noe and ROESY
correlations from ROESY and NOESY experiments. The data for scaevoloside (6)
is presented in Chapter 8.3, pg 118,
Analysis of the ROESY data has lead to a revision of the stereochemistry ofscaevoloside (6) as proposed by Skaltsounisaa with the carboxymethyl group onthe same side of the ring as the ring junction protons. The discussion of therevision of the stereochemistry is found in Chapter 8.2, pg' 108 - 1,IT.
COMPOUND K: Katecateroside (109)
OH
OH tlo
,^rtl
o o(1oe)
Katecateroside is a novel compound.
It is an iridoid that is very similar to alidyjosioside (10S) and scaevoloside (6) (as
outlined in Chaptet 8, 8.2 and 8.3, pgs 95, LL8). The routine 1H and 13C NMRexperiments gave data thaË was almosE identical to thaE of (fOg) and (6), Themolecular formula indicated that it had one extra methylene group.
It had an aldehyde and only one mekhoxy functional group. The imporkanh COSYcorrelations established the extra methylene group adjacent to the aldehydefunctional group. This positioning was supported by the data obtained by aROESY experiment. The stereochemistry, established by ROE data, was identicalto both alidyjosioside (1.08) and the revised scaevoloside (6).
Therefore this compound is novel, and has been named katecateroside (109).Its
structure determination is outlined in Chapter 8,8.4,122.
oOHHq
OH
767

Chapter L2 Sum-m_a_ry
COMPOUND L: Loeanin (5)
OHH3CO
H,rrlll OFI
o(s)
Loganin is an iridoid that has been found in many differenb species of planbs and
has been reported from Scaeoola montana43 and Scaeaola racemigeraaa. Loganic
acid (4), the demethylated fonn of loganin (5) has been reported by personal
communication42 as having been isolated from Scaeaola tøccada although thisdata has not been published.
The structure was determined by t1¡, 13C, HSQC and HMBC NMR experiments
and the data obtained closely matched the established lH arxl l3C chemical shiftvalues. The stereochemistry was determined using NOESY and ROESY
experiments as well as observed coupling constants and u'as found to be identicalto the recorded stereoehemistty of loga-nirr- (5).
The discussion of the isolatior! purification and structure determination ofloganin (5) is given in Chapter 8, 8.5, pg 125.
COMPOUND M: Luteolin-7-&glucuronide methyl ester (110ì
oo o
H3CO OH
HO\t' OH
(11-0)
Luteolin-7-O-glucuronide methyl ester (110) was isolated from the more polarexkacts and its structure determined using NMR experinrents.
Seven flavonoids have previously been reported from eight species of Scaeoola
found on tlìe ¡!-awaiian islands, These -flavonoide were identified by theirclraracteris bic UV chromophore (see Chap ber "1., "1..3.5, pg 27)
o
oOHOH
762
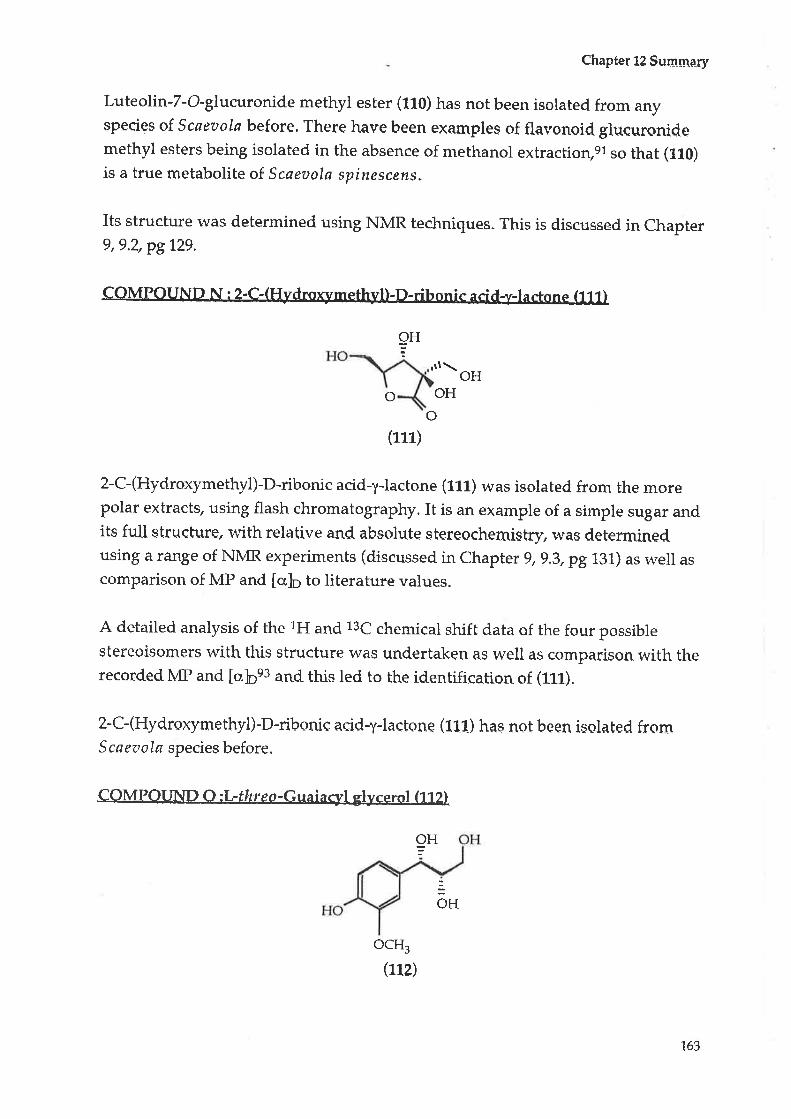
Chapter 12 Su-m-ma-ry
Luteolin-7-O'gltcuronide methyl ester (110) has not been isolated from anyspecies çf, Scaer¡ola before. There have been examples of flavonoid glucuronidemethyl esters being isolated in the absence of methanol extractioryel so that (110)
is a true metabolite of Scaeaola spinescens-
Its structure was determined using NMR techniques- This is discussed in Chapter9,9.2,pg729.
COMPOUND N : 2-C-(H}'dror,vmethyl)-D-nbonic aci4t-lactone (:t tlÌ
OH
o OH
o(111)
2-C-(Hydroxymethyl)-D-ribonic acid-y-lactone (ttt) was isolated from the morepolar extracts, using flash chromatography. It is an example of a sirnple sugar andits full structure, r,r'ith relative anrd absolute stereochemistr¡', rvas determinedusing a range of NMR experiments (discussed in Chapter g, g.z, pg 131) as well as
comparison of MP and [ct]p to literature values.
A detailed analysis of the 1H and 13C chemical shift data of the four possiblestereoisqmers with this structure was undertaken as well as comparison with therecorded MP and [oþe: and this led to the identification of (111).
2-C-(Hydroxymethyl)-D-ri1¡onie acrd-y-lactone (111) has not been isolated fromS ca ea ola species before.
COMPOUND O :Lfhreo-Guaiacyl glycerol (112)
ocH3
(112)
9H
OH=
OH
163
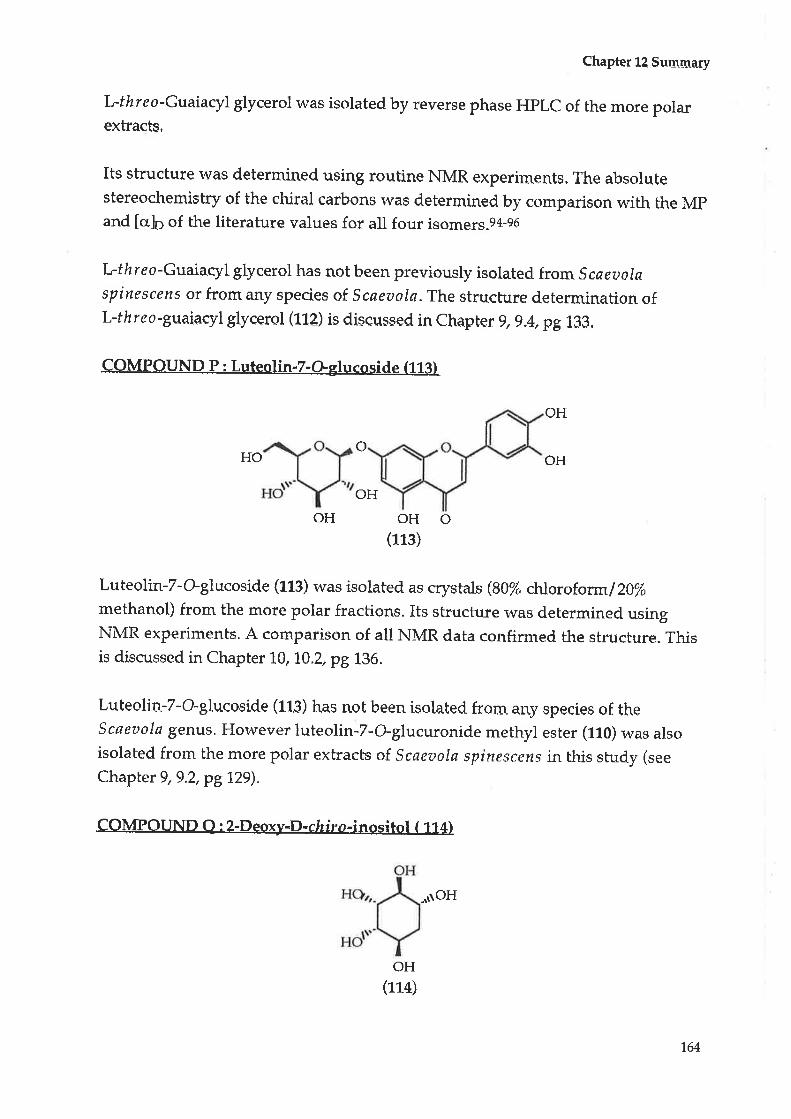
Chapter 12 Suunmary
L'threo-Guaiacyl glycerol was isolated by reverse phase HPLC of the more polarextrads.
Its structure was determined using routine NtvIR experiments. The absolutestereochemistry of the chiral carbons was determined by comparison with the Mpand [crþ of the literature values for all four isomers.g4-96
L-threo-Guaiacyl glycerol has not been previously isolated. from Scaeaolaspinescens or from any species of scaeuola. The strucbure rdetermination ofL-threo-guaiacyl glycerol (1L2) is discussed in chapter 9,9.4,pg 133.
COMPOUND P : Luteolin-T,Gglucoside (1131
oHO
OH
oHo(113)
Luteolin-7-Gglacoside (113) was isolated as cr)¡stals (80% ctrloroform/Z}%methanol) from the more polar fractions. Its structure was d,etermined usingNMR experiments. A comparison of all NMR data confirmed the structure. Thisis discussed in Chapter 10, 10.¿ pg 136.
Luteolin-7-O-glucoside (1.13) has not been isolated, from any species of theScaeaola genus. However luteolin-7-Gglucuronide methyl ester (110) was alsoisolated from the more polar extracts of. Scaeaola spinescens inthis study (see
Chapter 9,9.2,p9L29).
COMPOUND Q : 2-Deoxy-D-cfiiro-inositol ( 114)
-rñOH
OH
OH
OH
OH
(1L4)
1,64
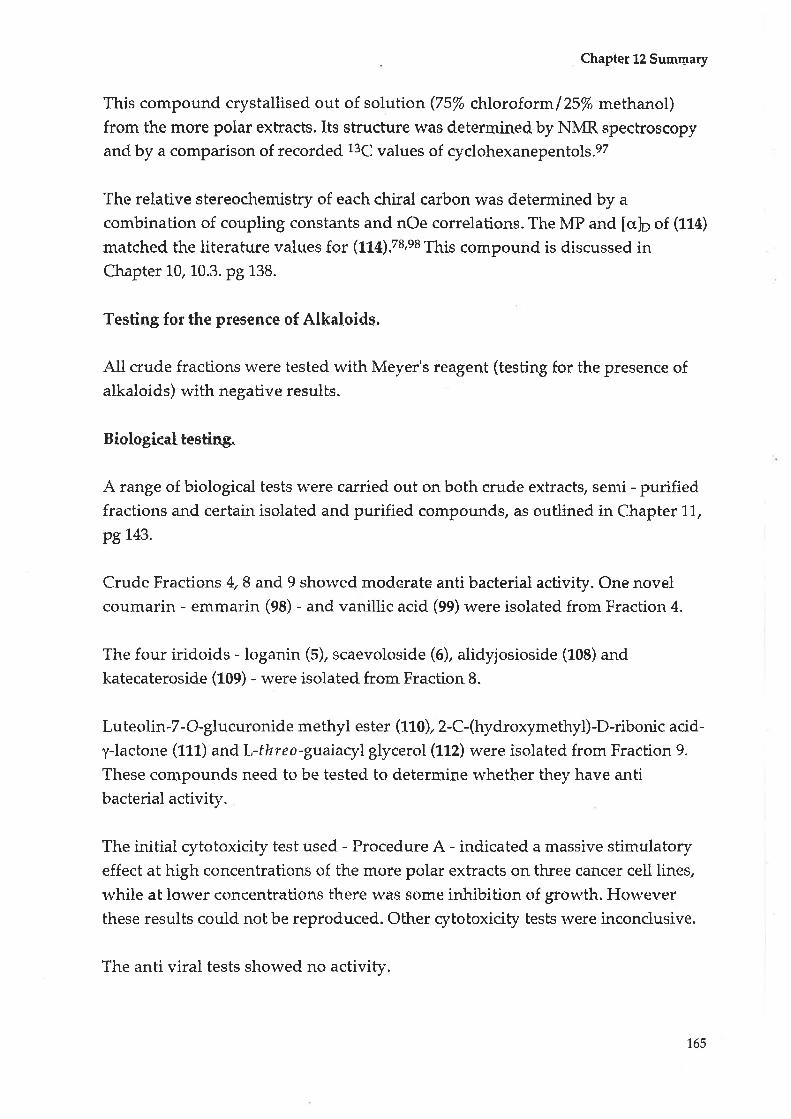
Chapter 12 Summary
This compound crystallised out of solution (75% chloroforml25% methanol)from the more polar extratr. Its structure was determined by NMR spectroscopyand by a comparison of recorded 13C values of cyclohexanepentols.eT
The relative stereochemistry of each chiral carbon was determined by acombination of coupling constants and nOe correlations. The MP and [ctþ of (11a)
matched the literature values for (114).78,e8 This compound is discussed inChapter 10, 1-0.3. pg 1-38.
Testing for the presence of Alkaloids.
All crude fractions were tested with Meyer's reagent (testing for the presence ofalkaloids) with negative results.
Biologieal testing.
A range of biological tests ì ¡ere carried out on both crude extracts, semi - purifiedfractions and certain isolated and purified compounds, as outlined in Chapter 1L,
pgI43.
Crude Fractions 4. I and 9 showed moderate anti bacterial activity. One novelcoumarin - emmarin (98) - and vanillic acid (99) were isolated from Fraction 4.
The four iridoids - loganin (5), scaevoloside (6), alidyjosioside (fOg) and
katecateroside (109) - were isolated from Fraction 8.
Luteolin-7-O-glucuronide methyl ester (110),2-C-(hydroxymethyl)-D-ribonic acid-
y-lactone (111) and L-threo-guaiacyl glycerol (1t2) were isolated from Fraction 9.
These compounds need to be tested to determine whether they have antibacterial activity.
The inibial rytoboxicity test used - Procedure A - indicated a massive stimulabory
effect at high concentrations of the more polar extracts on three cancer cell lines,
while at lower concentrations there was some inhibition of growth. Howeverthese results could not be reproduced. Other cytotoxicity tests weÍe inconclusive.
The anti viral tests showed no activity.
765

Chapter 13 Experimental
CHAPTER 1-3 EXPERIMENTAL
13.L General procedures
Analytical TLC was performed using Merck Kieselgel60 F254 silica onaluminium backing. Preparative TLC was performed using 20 cm X 20 cm MerckKieselgel 60 F254 silica on glass (1 mn thickness), while preparativechromatography was performed using positive pressure flash and squat
chromatography with Merck Kieselgel60 (230-400 mesh ASTM).
HPLC was carried out using a Waters 60004 solvent ptunp, a Waters U6KInjector, a Waters model44L absorbance detector operating at differentwavelengths, in conjunction with an ICI DP-700 database.
Analytical HPLC was performed using a Waters Nova-Pak HR Silica column (100
x 8 mm, 10 p+) or a lVaters Nova-Pak HR Cl-8 column (L00 x 8 mm, 10 ¡rm) r,r'ith
either isocratic or gradient conditions. All solvents were analytical grade and pre
filtered twice.
Preparative HPLC r,vas perfonned using Waters Nova-Pak HR Silica columrr- (100
x 25 mm, 10 pm) or a Waters Nova-Pak HR C1.8 column (100 x 25 mm, 10 ¡rm)with either isocratic or gradient conditions using a range of solvents.
NMR spectra rryere recorded on either a Bruker ACP (300 MHz 1H), "
Varian
Gemini 2000 (300 }l4l{z 1H) or a Varian II{OVA (600 MHz rH) spectrometer. Anumber of different pulse sequences were used, including routine lH, 13C and
DEPT sequences, COSY, HMQC, LISQC, HMBC, HSQC-TOCSY, NOESY and
ROESY sequences. 2D Spectra acquired at higher field (600 MFIZ) used gradientcoherence selection for COSY, HMQC, HSQC, HSQC-TOCSY and HMBC.
Specka were recorded in either CDCI3 (TlvlS-internal standard), do-DMSq d4-
methanol or D2O (for D2O exchange experiments).
Chemical shift values were recorded as parts per million (ppm) downfield fromthe internal standard. Multiplicities are abbreviated as s, sirrgleÇ d, doublet; t,triplet; q, quartet; m, multiplet; bç broad; dd, doubtet of doublets, etc.
166

Chapter 13 Experimental
Mass spectral analysis lvas conducted at the Central Science Laboratory Tasmani4
rvhere MS and HRMS were recorded using a range of experiments (EI, LSIMS, CLESr).
IR spectra were recorded on an ATI Mattson, Genesis series FTIR instrument. UVspectra were recorded on a PYE UNICAM SP8-100 ultraviolet spectrometer.
MP were determined on a Kofler hot-stage apparatus equipped with a Reichart
microscope and are uncorected.
Optical rotations were recorded on a POLA AR 21 polarimeter set at 589 nm,using a 0.15 dm cell.
,A.ll solvents were distilled before use, with drying and purification of solvents
and reagents perfornred using standard laboratory procedures.68,6e
Visualisation of TLC plates was aehieved by use of UV light in addiiion to the use
of ammonium molybdate, vanilliry Meyers reagent or 12 vapour.
1.3,2 Plant collection, verification and extraction
127 kg of Scaeoolø spinescen s was collected from a site L0 km west of Morgan, inSouth Australia, on the Morgan-Eudunda Road. A sample was sent to the SouthAustralian State Herbarium and verified as Scaeaola spinescens (Voucher No.AD 99702040).
The 1,2.7 kg rvas ground into a powder using a ball mill and then soaked in 40 L ofsolvent for 2 weeks. The solvents used were hexane, ethyl acetate, methanol and
distilled water. The solvents were then removed, using a cyclone evaporator and
the hexane, ethyl acetate and aqueous fractions stored under nitrogen.
A total of 828 g of the methanol exbract was then subjected to flash
chromatography (silica, sequential, g0% hexane/ L0lo ethyl acetate through to 50%
ethyl acetate/ 50% methanol). The flash column used was 1,4 em in diameter,' 200
g of silica was used in each of the columns. The extract was pre-loaded onto silica
and? L of each solvent was uSed for each elution (4 column volunr-es). Table
3.1.1, Chapter 3.1, pg 47, indicates the amount of the methanol exkact loaded
onto each of the seven separate columns.
167
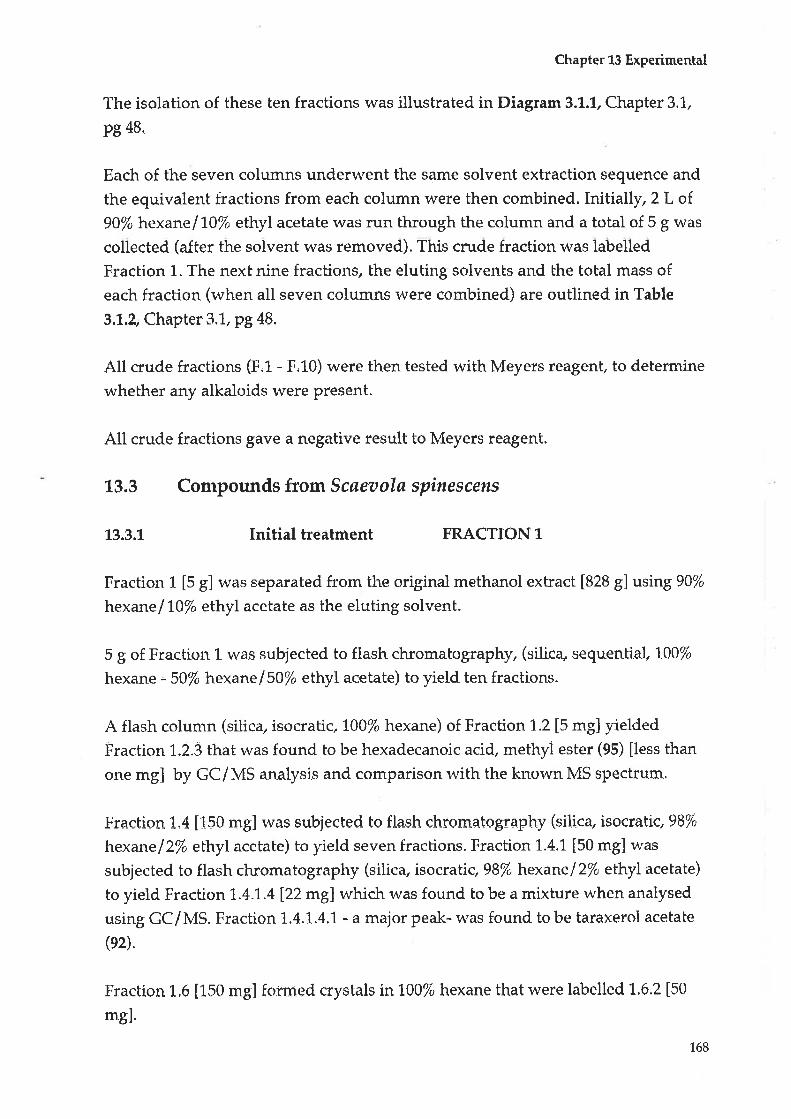
Chapter 13 Experimental
The isolation of these ten fractions was illustrated in Diagram 3.1.1, Chapter 3.1.,
pg 48.
Each of the seven columns underwent the same solvent extraction sequence and
the equivalent fractions from each column were then combined. Initially, 2 L ot
90%hexanel1,0% ethyl acetate was run through the column and a total of 5 g was
collected (after the solvent was removed). This crude fraction was labelled
Fracbion L. The next nine fractions, hhe eluting solvents and bhe total mass ofeach fraction (when all seven columns were combined) are outlined in Table
3.1.2, Chapter 3.L, pg 48.
All crude fractions (F.f - F,L0) were then tested with Meyers reagent, to determine
whether any alkaloids were present.
All crude fractions gave a negative result to Meyers reagent.
13.3 Compounds from Scøutolø spinescens
13.3.1 Initial treatment FRACTTON T.
Fraction 1 [5 g] was separated from the original methanol extract [828 g] using9}/o
hexane/ 10lo ethyl acetate as the eluting solvent.
5 g of Fraction l- was subjected to flash chromatography, (silica sequentiat L00%
hexane . 50% hexane/S}/o ethyl acetate) to yield ten fractions.
A flash column (silica, isocratic, ßA% hexane) of Fraction1..2 [5 mSJ yielded
Fraction L.2.3 that was found to be hexadecanoic acid, methyl ester (95) fiess than
one mgl by GC/MS analysis and comparison with the known MS spectrum.
Fraetion 1.4 [150 mgì was subjecled to flash chromatography (silrea, isoeratie, 98%
lrexane/2/o ethyl acetate) to yield seven fractions. Fraction 1.4.1 [50 mg] was
subjected to flash chromabography (silica, isocratic, 98% hexanel2% ethyl acetate)
to yield Fraction 1,.4.1.4122mg1which was found to be a mixture when analysed
using GC/MS. Fraction 1.4.I.4.7 - a major peak- was found to be taraxerol aceta[e
(ez¡.
Fraction 1,6 [150 mgl formed crystals in 100% hexane that were labelled 1.6.2 [50
mgl'
168

Chapter 13 Experimentat
Fraction 1.6.2 [50 mgì was subjected to flash chromatography (silica, isocratic, 95lo
hexane/S% ethyl acetate) and separated into three fractions. When fraction t.6.2.L
was left standing, a white solid crystallized out of solution (700% hexane). This
solid [a5 mg] was then recrystallized in 99%hexanell% methanol to give finecrystals of judarrylol (96) [a0mg].
The mother liquor was labelled 1.6.L [100 mg]. It underwent flashchromatography (silic+ isocratiq, 95% litexane lS% ethyl acetate) and was separabed
into ten fractions. When Fraction 1.6.L.8 was left standing, a white solidcrystallized out of solution QAI% hexane). This solid [a2 mg] was thenrecrystallized in 99% hexanel 1% methanol to give fine white crystals. Fraction1.6.L.8 [32 mg] was pure and was identified as taraxerol (73) [32 mg].
This procedure is outlined in Diagram 4.1, Chapter 4.1, pg 53.
13.3.2 Hexadecanoic acid, methyl estet
(es)
Less than one mg of (95) was isolated as a white amorphous solid. Identified byMS peak matching to known compoun d; CvF{sEOz; m I z (EI):270 (M* 50%), 239
(25),227 (4s), 143 (40),129 (39),74 (100), 86 (90).
13.3.3 Taraxerol acetate
79
ó
30I,o\
2y.-
27
I
22
28
I
218:. /t\I
\ .¿16-152oil
¿3I32 -o
25
tx.f -10rlt73\ ..2\ -,27
r.'' 4\ 6
23 24
(oz¡
!69

Chapter 13 Experimental
22mg of a mixture with (92) present was isolated as a white crystalline solid.Identified by MS peak matching and comparison of 1H and 13C data with recorded
data of taraxerol acetate; C32H52O2; exact mass caÌculated for C32H52O2:468.3957,
found 468.3964, (+/- O.OOO7);MV8:304 - 305oC; [ct]p78: a 9o (CHCle); FTIR (nujol):
7720 (C:O), 1650 (C:C);1H NMR (600 MFIz/CDCls); selected data, ôH: 0,809 (3H, s),
0.849 (3H, s), 0.867 (3H, s),0.906 (3H, s),0.920 (3FI, s), 0.934 (3H, s), 1.049 (3H, s),
1.081 (3H, s), 236 (I}I^,II, Hrou), 4,47 (3IH, s, Hgz),5.55 (1H, dù3.6,8.6, Hrs);13C
NMR (150 MFIZ /COCtr¡; òC: L6.3 (Czs), L6.4(Czù,1-8.3 (Crr), L9.5 (Co), 22.L(Csù,23.6 (Csz\,25.2 (Czù,26.9 (Cù,28.8 (Czo), 29.1 (Czs),30.1 (Czs), 30.6 (Cze ), 32.8 (Czz),
33.9 (Czr),34.1 (Czg), 349 (Ctz),35.6 (Cz), 37.4 (C.ù,38.2 (Crg), 38.3 (Cro),38.5 (Cro),
38.5 (Crz),38.7 (C¿),39.5 (Cs),41.3 (Crg),49.0 (Cra),49.5 (Cs),56.0 (Cs),79.1 (Cs), 117.4
(Crs), L58.3 (Cr¿), 1.66.7 (Cer); rnlz (EI\:468 (M+ 20%),344(44),329 (42),269 (6I),204(1oo), 789 (49), 13s (38).
13.3.4 Taraxerol
2y¿--
19
I
tt\
21.
I
22
28ï\
27=/72\1 /11 -13
30ì
20
t\
tn\ .¡7615
23 24
(73)
32 mg of (73) was isolated as n'hite crystals. Identified by MS peak matching and
comparison of 13C chemical shift values with known values; CsoHsoO; exact mass
calculated for C3sH5eO: 426.3864, found 426.3859 (+/- 0.0005); MP:280 - 284oC
(lit.zs, 282 -283oC); [c:,]p: + 0.690 (c 0.1, CHCI3), (lit.za, + 0.72o (c0.974, CHCI3)); FTIR(nujol): 3420 (OH) ,1660 (C:C); 13C NMR (150 MHe CDCIs); öC: 15.2 (Cz+), L5.2
(Czs ), 17 .8 (Cn), 19 .L (C o), 2r.7 (Czù, 25.0 (Czù, 27 .2 (Czs), 27 .3 (Cù, 29 .5 (C201, 29 .5
(Czo),29.7 (Czù,32.8 (Czù,33.4 (Czù,33.9 (Czr), 35.1 (Crz), 35.3 (Cz), 36.4 (Ctò,37 .0
(Cro), 37.9 (Cto),38.2 (C1),38.6 (Crz),38.7 (CB),39.8 (C4), 41..7 (Ctù,48.2 (Cg), 50.3
(Crs), 55.2 (Cs), 78.9 (Cg), 1.17.3 (Crs), 159.1 (Cr+); ru I z (EI): 426 (M* 15%),302 (40),
287 (38),204 (Loo),135 (39).
25
V10
I
6\ì-
z
I3
I7€
HO
t70
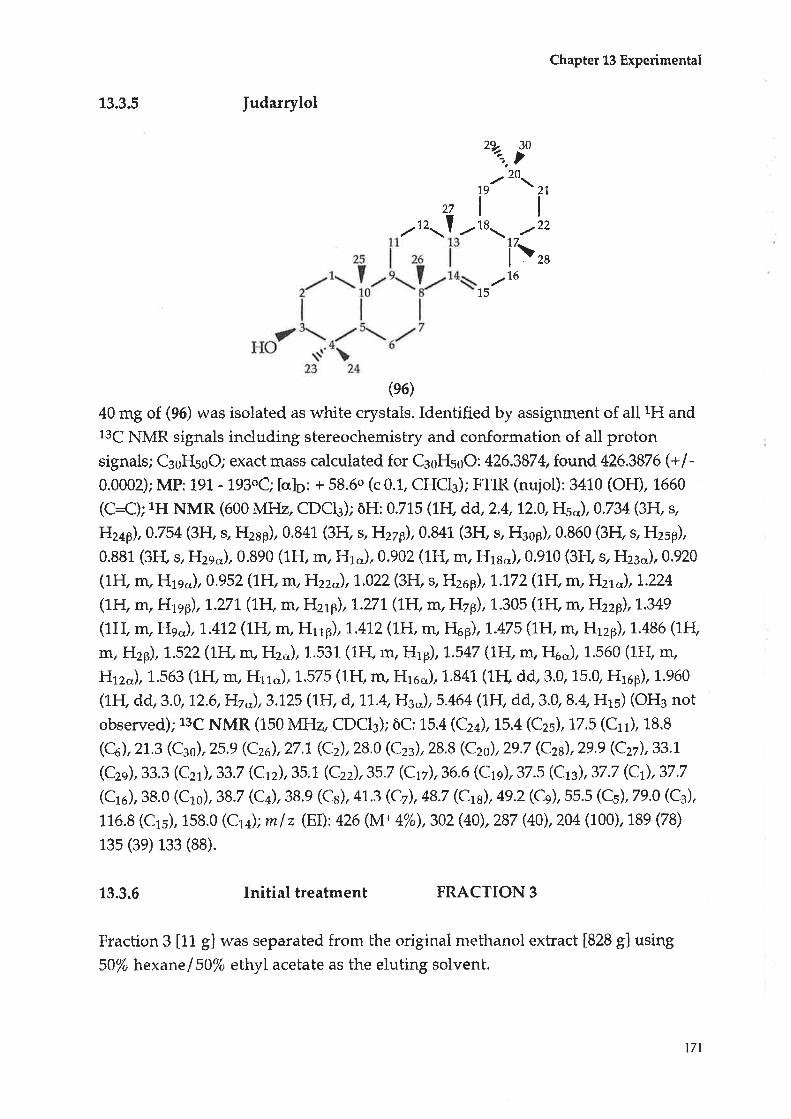
Chapter 13 Experimental
13.3.5 judarrylol
'ot=, fo
,- to\
8-. 7)
I\,,76
15
(e6)
40 n'rg of (96) was isolated as white crystals. Identified by assignment of all lH and13C NMR signals including stereochemistry and conformation of all protonsignals; CaoFIsoO; exact mass calculated for CsoFGoO: 426.3874, found U0,3576 (+l-0.0002); MP; 1"91 - 193oC; [cr]o: + 58.60 (c 0.L, CHCIg); FTIR (nujol): 3410 (OH), L660
(C{);1H NMR (600 MHz, CDCIg); òH: 0.715 (1H, dd, 2.4, t2.0, Hso), 0.734 (3H, s,
Hz+ø),0.754 (3I{, s, Hzap) 0.841 (3H, s, Hzzþ\,0.841 (3I{, s, Heop} 0.860 (3H, s, Hzsp)
0.881 (3F{, s, Hzso),0.890 (1t{, m, HrJ,0.902 (lFI, m" Hrs.,),0.910 (3FL s, ÊIz¡o),0.920
(1II, m, Hrso), 0.952 (1H, m, }llzz".),1,Î22 (3H, s, }Jzoþ),I.172 (1H, m, Hzro), 7.224
(1I{, m, Hrsp), 1.271(1H, m,IùrB), L.T|I (1H, m, Hzp), 1.305 (1H, m, HzzB), 1.349
(1H, m, HgJ, 1.4I2(1H, m, Hrrp), 7.412(1H, m, FIrp), t.475 (1H, m, HrzÊ), 1.486 (1Fl
m, E{zp), I.522(1I{, m, ÉI2"} 1.531(1É1m, Htp), I.547 (1H, nç Ék,,), 1.560 (1ÉL m,
Hrz.,), 1-.563 (lFI, m, Hrr..), 1..575 (1FI, m, Hroo), 1.84L (1FI, dd,3.0, 15.0, Hrep), 1-.960
(lFI, cld,3.0,12.6,Il2."),3.L25 (1H, d,'J.L.4,If,l."),5.464 (1.H, dd,3.0,8.4, Hrs) (OHs not
observed);13C NMR (150 MFIz, CDCIg); òC: 15.4 (Cz+), L5.4 (Czs), 17.5 (Crr), 18.8
(Cà,273 (Ceo), 25.9 (Czò,27.1(Cz),28.0 (C23),28.8 (Czo), 29.7 (Czù,29.9 (Czù,33'L
(Czs),33.3 (Czr),337 (Ctù,35.1 (Czz),35.7 (C.tz\,36.6(Ctù,37.5 (Crg),37.7 (Ct),37.7
(Cro),38.0 (Cro), 38.7 (Cù,38.9 (C8), 4L.3 (Cù,48.7 (Crs), 49.2(Cs),55.5 (Cs),79.0 (Cù,
116.8 (Crs), 153.0 (Cr+); mlz (EI):426 (M* 4%),302(40),287 (40),204 (100), 189 (78)
13s (3e) 133 (88).
13.3.6 Initial treatment FRACTION 3
Fraction g [11 g] was separated from lhe original methanol extract t828 gl using
50/o hexanelS0% ethyl acebate as the eluting solvent.
1
I
1
27
I27
,-n.-l -
17t
Chapter 13 Experimental
11 g of Fraction 3 was initially subjected to flash chromatography (silico
sequential, 100% hexane - 50% hexane/ 50/, ethyl acetate) to give nine fractions.
Fraction 3.6 [900 mgl was then further fractionated by flash chromatography(sitic+ sequentiaf 100% chloroform - 95% chloroforml 5 % methanol) to yieldfive fractions.
Fraction 3.6.3 Í72 mgl was then separated using flash chromatography (silica
sequential,l00% chloroform - 95% chloroformlS % methanol) to give ten
fractions.
Fraction 3.6.3.4 [a2 mg] underwent a further purification step (recrystalli zalion,
700% chloroform) to give ursolic acid (97\ Í7 mgl. This sqraration process is
outlined in Diagram5.1, Chapter 5.1,pg70.
t3.3.7 Ursolic acid
t\30,
=20
91
I
2l
I
22
/-O
OH
,r- t\
rr'tt-, t\
14i-28
\
23 24
(e7)
7 ^g oL (97) was isolated as white crystals. Identified by assignment of 1H and 13C
chemical shift data and comparison rvith recorded literature values for ursolic
acid; CsoFIasO3j exact mass calculated for C3sFIasO3: 456.3605; found, 456.3599 (+/-0.0006); M.P:282- 285oC (lit.ao, 285 - 2B8oC); [c[h¡: + 690 (c 0.L, CHC13) (lit.ao, + 67.5o
(c L ethanoL NaOH)); FTIR (nujol):3410 (OH), 3000 (COOH), 1730 (C=O), L660
(C:C);lH NMR (600 MFIZ, CDCte); õIJ:0.667 (3F{, s, I{zs..),0.713 (1H, m, F{s"),0.741
(3H, s, IJ25¡),0.802 (3I1 d, 6.6,H2sp),0.857 (3H, s, Hzsp) 0.886 (3H, s, Hz¿p), 0.904
(3H, d, 6.O H¡0.,), 0.924 (LH, m, Hzø),0.976 (LH, m, Hrr¡), 1.030 (3F{, s, F{zzj.,1.081
(1H, m, Hrsu), t.267 (1H, m, ÍJ¡¿zv\,1.272 (1F{, m, Hrs.,), 1..392 (LH, m, FIou), 1.408
(lFI, m, fl.zz),1..432 (1FI, m, Hs.'), 1.435 (1Fl m, HL7,J,I.46t (1F{, m, I{z),1.463 (1H,
rn, Hrs"), 1,.467 (1H, m, Hzru), 1.466 (1Fl m, Hru), L.503 (1H, m, Hzru), L.507 (1H, m,
16
15tt\o/t\
r*''\€
HO
I
7
6
172

Chapter 13 Experimentat
Hzop), L.544 (1H, m, FLu), 1.546 (1H, m,I{zu} L,546 (lFL m, Hrsu), 1.558 (llt m,
Hru), 1.613 (1H, m, Hrou), 1.815 (1H, m, Hrru), 2,092 (1H, d, 1.1,4, Hrap),2980 (1H, brt, H¡o),5.118 (lFL br d" Hrz) (OFù, COOH not observed); 13C NMR (150 MHäCDCIa); òC: 14.7 (Czs), 15.1 (Cz¿), 1.6.4 (Czò,17.6 (Czù,17.6 (Cs\,20.5 (Ceo), 22.8 (Ctù,23.5 (Czù,26.5 (Crs), 27.5 (C),T7.5 (Ctò,28.8 (Cze),30.0 (Czr), 32.3 (Ctù,36.0 (Czz),
36.2 (C10),38.0 (Cr),38.0 (C+),38.3 (Czo),38.8 (Cz),39.0 (Crs),39.8 (CB),41.3 (Cr+),46.8
(Cg), 52.0 (Crs), 54.5 (Cs), 77.5 (Cù,I24^4(Ctz\,L37.6 (Crs), I79.1(Czs); mlz (EI):456
(Nr+ 25%),438 (32), 410 (56), 248 (100), 203 (60), 133 (53).
13.3.8 Initial treatment FRACTION 4
Fraction aúa gl was separated from the original methanol extract [828 g] using
100% ethyl acetate as the eluting solvent.
Initially 1 g of Fraction 4 was partitioned between hexane (100 ml) and a
methanol (90 ml)/water (10 ml) mixture. The methanoUwater extract was freeze-
äried, redissolved in methanol and then repartitioned using chloroform (L00
ml), methanol (90 ml) and water (10 mI). The chloroform fracbion was kept and
labelled 4.E [45 mg], 4.E was subjected to flash chromatography (silica, isocratic,
99% chToroform/ 1% methanol) to yield nine fractions.
Fraction 4.8.6lzzmgl was then subjected to normal phase analytical HPLC(isocratic, 50?á hexanelS0% ethyl acetate, 330 nm, 1 mL/min,, 30 min.) and
emmarin (9S) t2 mgl was collected and idenhified.
The rest of Fraction 4 [L3 gJ was subjected to the same partition process as outlined
above. The chloroform fraction was labelled 4.C [200 mg] and bhen subjected to
flash chromatography (silica, isocratic, 99% chloroform/ 1. % methanol) to give
nine fractions.
4.C.3 [100 mgJ was then subjected to flash chromatography (siliea, ßoctafte,99%
chloroform 11,% methanol) to yield 4.C.3.3 [63 mg] . This fraction was then
subjected to normal phase preparative HPLC (isocratic, 50% hexanelS0% ethyl
acetate, 330 nm, 5 ml/min, 30 min.) to yield more of (9S) [25 mg].
Fraction 4.C.6127 rrrgl was subjected to normal phase analytical HPLC (isocratic,
50 /o hexane/50 /o el1nyl acetate, 256 nm, 1 ml/min., 30 min.) to isolate vanillic
acid (99) [4 mg]. This separation system is outlined in Diagrams 6.1.1 and 6.1.2,
Chapter 6.1,, pgs 75, 7 6.
L73
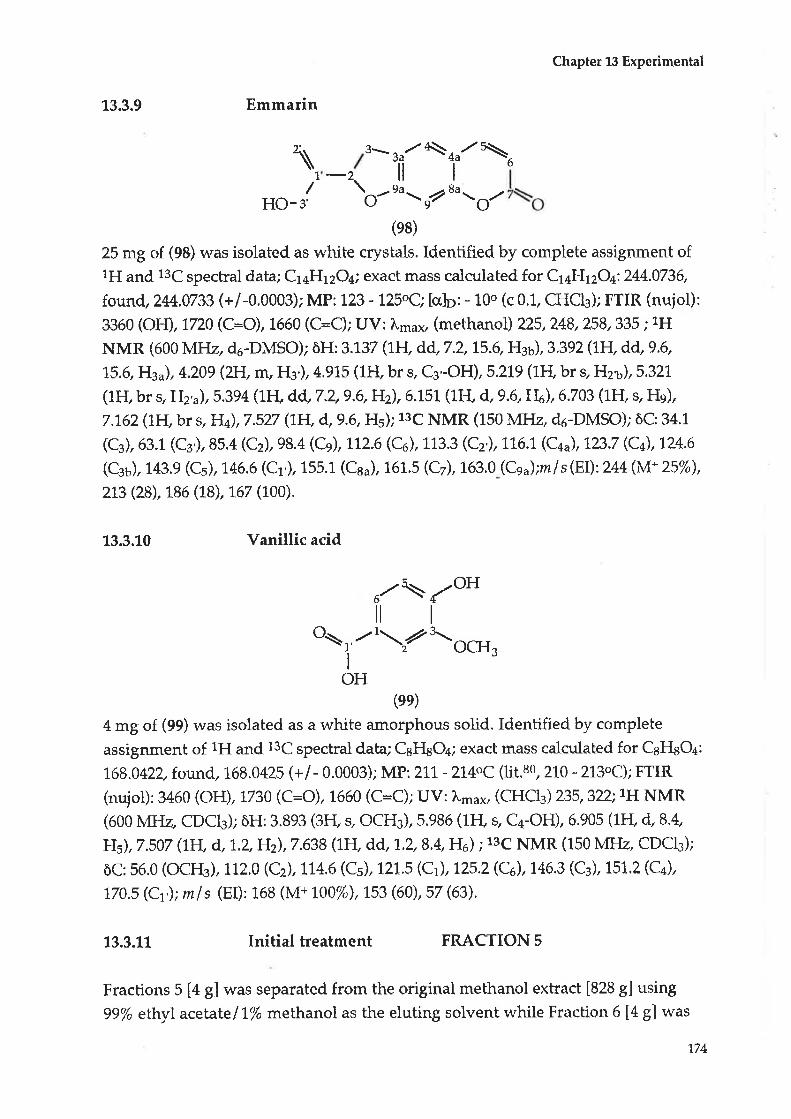
Chapter 13 Experimental
13.3.9 Emmarin
\I
/HO-s'
\6
Ituto,
\nulI
zu/il
9u\
3-*
(es)
25 mg of (9S) was isolated as white crystals. Identified by complete assignment of1H and 13C spectral data; C1aH12Oa; exact mass calculated for C1aH12Oa:244.0736,
found, 244.0733 (+/-O.OOOS); MP: 123 - 125oÇ [cr]p: - 10o (c 0.1, CHC13); FTIR (nujol):
æ60 (OfÐ , I72Q (C:O), 1660 (C:C); UV: ?'-u*, (methanol\ 225, 248, 258, 335 ; r¡¡
NMR (600 MHz, d6-DMSO); òH: 3.L37 (1lt dd, 7.2, 15.6, Hst), 3.392 (1F{, dd,9.6,
15.6, Hsu), 4,209 (2H, m, Hsl, 4.915 (1H, br s, Cg'-OH) ,5.219 (lFl br s, Hzt), 5,321,
(1H, br s, EI2'"), 5.394 (1ËI, dd, 7.2"9.6, Hz), 6.L5L (1F[ d,9.6, Fk), 6.703 (lFI, s, Hs)'
7.762 (1H, br s, H+), 7.527 (1H, d, 9.6, Hù;13C NMR (150 MHz, d5-DMSO); ôC: 34.1
(Cg),63.1 (Cs') 85.4 (Cz),98.4 (Cg), lLL6 (q),113.3 (Cz'), 116.1 (C.ru), 1?3.7 (C+),124.6
(Csu), 743.9 (Cs), 146.6 (Cr') 155.1 (Cau), 161.5 (Cz), 163.0 (Cg")'¡nls(EI):24a (M+ 25%),
2L3 (28),186 (18), 167 (1oo).
13.3.10 Vanillic acid
u/\ {oiltoor,/'Y*o*,I
OH(ee)
4 mg of (99) was isolated as a white amorphous solid. Identified by complete
assignment of 1H and 13C spectral data; CeFIsO+; exact mass calculaEed for CeFfuO¿:
168.042L found" 168.0425 (+/- 0.0003); MP: zll -2l4oc (1it.80, 2\0 - 213oC); FTIR
(rrujol): 3460 (OH) ,1730 (C:O), 1-660 (C=C); UV: I-o*, (CHC13) 235,322;1H NMR(600 MHz, CDCb); õH:3.893 (3t{, s, OCFL),5.986 (1Fl s, C+ÐH), 6.905 (1FI, d,8.4,
}Jù,7.507 (1H, d, 1..2,H2),7.638 (1H, dd, '1.2,8.4, He ) ;13C NMR (150 MI{z, CDCI¡);
ôC:56.0 (OCFL), 112,0 (Cz),114.6 (Cs),121.5 (Cr),125.2 (Ce), 146'3 (C3), 151.2 (Ca),
770.s (Cr'); mls (EI):168 (iv1+ 100%),153 (60), 57 (63).
13.3.11 Initial treatment FRACTION 5
Fractions 5 [4 g] was separated from the original methanol exkact [828 gl using
99/" ethylacetate/ L% methanol as the eluting solvent while Fraction 6 [4 g] was
174

Chapter 13 Experimental
separated from the original methanol exhact [828 g] using 98% ethyl acetatel2%
methanol as the eluting solvent,
Fractions 5 [4 g] and 6 [3 g] were very similar by TLC and so were combined. The
combined total [7 g] was dissolved in98% ethyl acetate/2% methanol. 250 mg of a
white crystalline solid precipitated out and on reorystallization (L00% ethyl
acetate) 100 mg of a white crystalline solid was collected and labelled 5.1.
Fraction 5.1- was then subjected to flash chromatography (silica isocratic, t00%
ethyl acetate) and 3 fractions were collected.
Fraction 5.1.3 [52 mgJ was then reorystallized inL00% ethyl acetate and the crystals
collected to give daucesterol (100) [26 mg]. This separation system is outlined inDiagram 7.1, ChapterT.\, pg 90.
13.3.12 Daucesterol
(23
.oH
to"--
15
--77
)
2l\ /,/2624
I
25
oIt'-ot
6'
V5\
11
I H
HH( (7ç
HO
OH(1oo)
26 mg of (100) was isolated as a white crystalline solid. Identified by complete
assignment of lH and 13C speckal data; CssFI6oOo; exact mass calculated for
M+NH4+, C35H6aNOe:594.4686. found, 594.4737 (+/- 0.0051); MP: 280 -286oC (lit.zs,
283 - 286oC); [c¿]o: - 44o (c 0.1., CHCb) (lit.z*, - 41.5o (c 0.4 Py))FTIR (nujol): 32L0
(OH), L660 (C:C); rH UptR (600 MHz, d6-DMSO); òH: 0.642 (3FI, d, 6.6,Me2),0.780
(3It s, Mezzþ),0.820 (3H, s, Mezep), 0.861 (1H, m, Ht¿.,),0.890 (3H, m, Mezs),0.918
(1H, m, lF.tz..),0.949 (3H, d, 6.6, Me2e) ,0.979 (1H, m, Hrsu), 0.979 (1H, m, Hreu),
0.990 (3H, d, 6.6, Mezs), 1.035 (1H, m, Hrr¡), 1.105 (1H,m, Hzou), 1.105 (1-H, m, HsJ,
L.13t (1H, m, t]'zù,1.131" (lFL r& Hrsu), !.LL (1H, m, Hru), 1.2L5 (1H, m, Htzv),
7.224 (1t{, m, Hzzu),1,.262 (1H, m, Hzoo), 7.286 (lFL m, Hteo), 1.308 (1H, m, Hts),
1.381 (1H, m, Hzr), 1,.417 (1H, m, Hrsu), 1'.417 (1H, m, }J'u), 1.439 (1H, m, I{m),I.496
6
'175
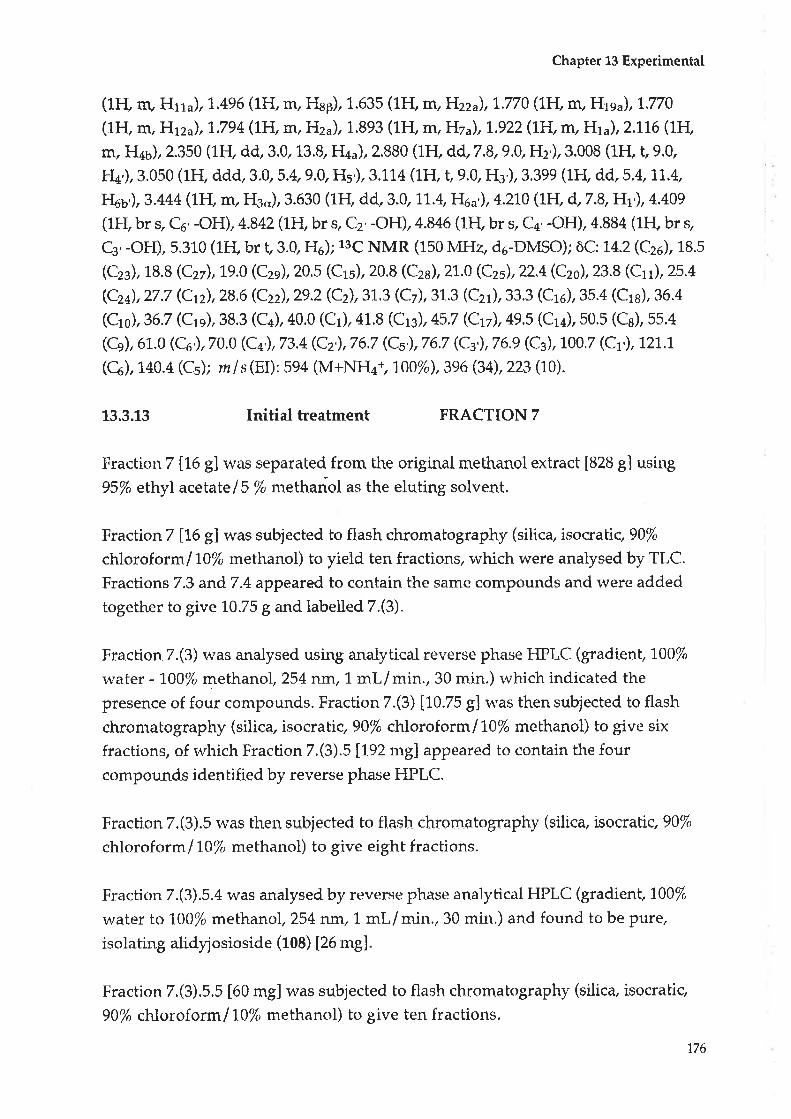
Chapter 13 Expetimental
(lIt m, Hrru), 1,.496 (1H, m, FIrp), 1.635 (1F{, m, Hzzu), L170 (1FI m, Hrsu), 1.770
(1H, m, Htzu),1..794 (1FI, m, Hzu),1.893 (1H, m, Hzu),1922 (1H, m, Hru), 2.116 (1H,
rrr, H+u),2.350 (lFL dd" 3.0, 13.B, H4a), 2.880 (lFL dd" 7.8,9.0, Hz'),3.008 (1FL t,9.O
H¿),3.050 (1H, ddd, 3.0,5.4,9.0, Hs'),3.114 (LH, t,9.0, H¡') 3.399 (1II, dd, 5.4,\1..4,
lleu,), 3.M4 (1I{, m, Hso),3.630 (1I{, dd, 3.0,1L.4, Fko'), 4.210 (1It d,7.8, Hr'), 4.409
(1H, br s, Ce '-OH), 4.842 (lFI, br s, Cz' -OH), 4.846 (1H, br s, C¿'-OH),4.884 (1FI, br s,
Cs, -OH), 5.310 (1FI, br t,3.0, ÉI¿); 13C NMR (150 MHz, d6,-DMSO); õC: 14.2 (Czo), 18.5
(Cze), 18.8 (Czz), 19.0 (Czg),20.5 (Crs),20.8 (Cza),21-.0 (C2s), 22.4(Czù,23.8 (Crr),25.4
(Czù, 27 .7 (Cn), 28,6 (Czù, 29.2 (Cù, 31.3 (Cz), 3L.3 (Czr ), 33.3 (Crs), 35.4 (Cl 8), 36.4
(Cro) 36.7 (Ctg),38.3 (C¿),40.0 (Cr),41.8 (Crg), 45.7 (C.v),49,5 (Cr+),50.5 (Cs), 55.4
(C-e),61.0 (Co'),70.0 (C+,),73,4(Cz'),76.7 (Cs'),76] (Cz'),76.9 (Cz),1007 (Cr'), 121.1
(Cà, 140.4 (Cù ; m I s (EI) : 59a (M+NHa+, L00%\, 396 (34\, 223 (10).
13.3.13 Initial treatment FRACTION 7
Fraction 7 Í16 gl was separated from the original methanol extract [828 g] using
95/" ethylacetate/5 % methanol as the eluting solvent,
Fraction 7lL6 g,l was subjected to flash chromatography (silica, isocratiç 90%
chloroformll0% methanol) to yield ten fractions, which were anälysed by TLC.
Fractions 7.3 and7.4 appeared to contain the same compounds and were added
together to give L0.75 g and labelled 7.(3)-
Fraction 7.(3) was analysed using analytical reverse phase F{PLC (gtadient, 100%
water - 100% methanol , 254 nm, L mL / min., 30 min. ) which indicated the
presence of four compounds. Fraction 7.(3) [10.75 g] vvas then subjected to flash
chronratography (silica, isocrabig g0% chloroform/10% methanol) to give six
fractions, of rvhich Fraction 7.(3).5 [192 rng] appeared to contain the fourcompounds identified. by reverse phase HPLC.
Fraelion 7.(3).5 was then su$jecbed to flash chromabog-raphy (silie+ isocratic, 90%
chloroform 110% methanol) to give eight fractions.
Fraction 7.(3).5.4 was analysed by reverse phase analytical HPLC (gradient, 7007('
rvater to 1,00% methanol, 254 nm, 1 ml/min., 30 min.) and found to be Pure/isolating alidyj osioside (108) 126 mg).
Fraction 7.(3).5.5 [60 mg] was subjected to flash chromatography (silica, isocratic,
90% chl,oroform/ 10% methanol) to give ten fractions.
t76
Chapter 13 Experimental
Fraction 7.(3).5.5.5 appeared to be pure and was recystallized using 90/o
chloroform lt0% methanol to give scaevoloside (6) [10 mg].
Fraction 7.(3).5.5.6 was pure by analytical reverse phase HPLC (gradienÇ 100%
waber - 700% methanol, 254 nm, L ml/min., 30 min.) to yield katecateroside (109)
[12me].
Fractions 7.(3).5.5.8 and 7.(3).5.5.9 were combined to grve 7.(3).5.5.9.2b [15 mg]
which was then purified by analytical reverse phase HPLC (gradient, 100% water -
700% methanol,254 nm, 1 ml/min., 30 min.) to yield loganin (5) [10 mS].
The purity of these compounds was analysed by analytical reverse phase HPLC
under two gradient systems and an isocratic system. The first gradient system was
L00% water to 100?á methanol (254 nm, 1ml/min., 30 min.). The second gradient
system was70% water/3O % methanolto 30% water/70 % methanol (254 nr$ 1
ml/nrin,, 30 rnin.). The isocratic system was 50% water/50% methanol (254 nm, L
mL/min., 30 min.). (5), (6), (10S) and (109) all appeared as one peak under all three
systems. This isolation procedure is outlined in Diagram 8.L, Chapter 8.1.,pg94.
13.3.14 Alidyjosioside
1"\
,./10 ,
98
,-!'-,r'l' Hgt
1".o
2
I
1
46iltr lr
3:, O,zt'uUO/
OHt,,
r,'t\OH4
II
5\ ,, .,OHo/(108)
26 mg of (108) was isolated as a white amorphotts solid. Identified by complete
assignment of tH and 13C spectral data; Czsl{azOr5i eXact mass calculated forM+Na+, CzgFIazONa:653.2424, found" 653.2364 (+/- 0.0060); MP: 94 - 96oC; [ah¡:
- 640 (c 0.1, lvIeOH); FTIR (nujol): 3400 (OH),1735 (C=O), 1680 (C=C); 1H NMR (600
MHz, CDCI3); òH: 1.21 (3H, d, 7.2,Me6),7.62 (1H, ddd, 3.6, 7!.4, 13.8, Hsp), 7.67 (IFI'
ddd,4.8,7.2,79,8,Hs'u),2.04 (1H, ddd,6.6,7.2,t3.8,Hs'u),2.20 (1FI, dd,7.8,13.8, FIs"),
2.48 (lFI, ddq 7 .2, 7 .Z I1.4, F{ù, 2.55 (lFt td, 3.6, 9.6, ÍIù, 2.7 t (lFI, dt, 5.4, 5.4, t4.L
6
In

Chapter 13 Experimental
Ha'\,2.77 (lFI, dd, 9.6, tt.4,Hzu\,2.90 (lI{, ddd, 5.4, 6.6,7.2, H5), 3.04 (1H, dddd" 7.8,
9.6,9.6,71.4,F{4,J,3,292 (3H, s, Merr'), 3.298 (3I{, s, Merz'),3.39 (1I+ dd,7.2,9,0,H2,'),
3.43 (1FI, ddd,3.0, 8.4,9.0,Hs"),3.58 (1H, t,9.0,H¡"),3.63 (1H, t,9.0, H¿"),3.75 (3H, s,
Mero), 3.86 (1ft dd, 8.4 11.4 He"u) ,3.93 (1II, dd, 3.Q,71..4, FIo"u) 4.30 (1H, dd,9.6,
1 i..4, H3 j, 4.46 (1F{, d4 3.6, 1L.4, HsÊ), 4.49 (Lfl. dd, 4.8, 7 .2, FIto'), 4.72 (1H" d, 7 .2,
Hr,,),5.25 (1H, dd,3.6,7.2,F{6),5.32-5.29 (2H,m, HB'),5.36 (1H, d,5.4, H1'),5.68 (1H,
m, Hz'),7 .U (l+ ù L.2, Ha') (OÉ{2,,, OÉL", OÉI4,,, 0É16" not observed); 13C NMR (150
MfLz, CDCIg); òC: 15.2 (Cù,29.6 (Cs'),32.2 (Cs'),37.0 (C+u), 38.5 (Cs), 43.7 (Cù,44.5
(Co'), 46.5 (C+), 47.5 (Ct),52.29 (Crz'), 52.28 (Crr'), 53.8 (Cro), 62.5 (Cs"),68.0 (C3), 70.5
(C¿,'),729 (Cz,'),75.9 (Cs',),76Ï (Cs"),78.2(Cò,97.6 (Ct'),98.6 (Cr"), 1,03.7 (Cro,) 110,8
(C+'),720.6 (Ce'), 133.9 (Cz'),154.9 (Cs'), 766.3 (Crr), \71..4(Cg),173.3 (Cù;¡nlz (LRp +
LSIMS):653 (M+ Na*,23%),599 (100),507 (6),388 (12)
13.3.15 Scaevoloside
cio
-se
:oo
3
1
n\ il,,/104a OH
HQ',r-,,,--l\ ,,,ùoH
^./111 ,/5\ ,lLJ46 rll3\o'l1
Ooll i I
7/l5
I6'tr(
II
o7a
,7
8
z
t,,
4Ii\,,,oH
6\,,o/ 1\o'l
(6)
L0 mg of (6) was isolated as a white amorphous solid. Identified by complete
assignment of 1H and 13C spectral data. Strtrcttrre determination via 1H and 13C
analysis and comparison with known data; CzzFlsoOra,: €xâct mass calzulated forlvf +Na+, C27H36O1aNa: 607.2006, found,607.2073 (+1- 0.0007);NlP:120 - 1240Çlu.h:
- 64" (c 0.1, IvIeOH) (1it.44, - 6Lo (c 0.2, MeOH)); FTIR (nujol): 3400 (OH),1735 (C=O),
1680 (C:);lH NMR (600 MFIz, CDCI3); õH: 1.1ó (3H, d, 7.Z,}llee),1.54 (1H, m, HsF),
2.24 (IJJ, m, Ffu..), 2.47 (lH, m, Hst), LM (1H,m,Hz),2.53 (1H, m, FIa), 2.7L (7H,m,
Hzu),2.78 (LH,m,Ha'),2.96 (LtI,n':.,Hs,u),3.00 (1H, rn,H4u),3.39 (LF{, m, Hs'),3.39
(1H, nr, Ff5,'), 3.42(LH,m, FI2"),3.56 (1FL t,9.0, Hg"),3.61- (1F1, t,9.0, FI4"),3.72(3F]',s,
Mero), 3.83 (1H, m, FIo"u), 3.86 (1H, m, H6"u), 4.27 (1F{, dd,9.6,1.1.4,Hsu), 4.34 (LI{,
dd, 3.6, 11.4, H¡B), 4,69 (lH, d,7.8,I-Ir"), 5.21 (1H, m, FIo), 5.22- 5,25 (2H, m, Hs'), 5.31
(1F1, d, 3.6, Hr,), 5.53 (1F{, m,Hz'),7.42(LFl, d,1.2,H3'),9.71(1FI, s, Hro') (OHz", OHg",
OFI4,', OFk not observed); 13C NMR (150 MFIZ, CDCIg); òC: 16.0 (Cù,29.3 (Cs')'39'7
(C¿o), 40.1 (Cs), 44.0 (C4),44.8 (Cq'), 45.6 (Cù,46.0 (C7),47,8 (Co'),52.5 (Ctù' 62.0
178

Chapter 13 Experimental
(Có"), 67.0 (Cs),70.0 (C¿"), 73.8 (Cs"), 75.6 (Cz"\,76.3 (Cs"),76.3 (Cø),96.2 (Ct'),98.1'
(C1"), 110.0 (C+'), 122,2 (Cs'), L357 (Cz'\,154.6 (Cs'),166,7 (Crr), 172.4(Cg)'L73.6 (Ct)'
20L.2(Cro'); mls(EI\: 607 (M+Na+,700%),585 (26), 423 (68),391(24),369 (20).
11.3.L6 Katecateroside
4.\3
1
11
./70 OHV,,
I HOhn,, ,r/3\ ,rt
ùoH
,?o
I
8ll
t7
o\
/
//o
,4a\/s-7a
I
\ -¿1..,,,.,7 'O
-sI
oil11:.
9
V5
6
I,\o'l1"?o
(10e)
12mg of (L09) was isolated as a white amorphous solid. Identified by complete
assignment of 1H and 13C spectral data; C2sH3sO14j exact mass calculated forM+Ff*, C25H3eO1a:599.234L,fo:und,599.236L (+/- 0.0020); MP: 148 - 1500Ç [alp:
- 64o (c 0.1, MeOH); FTIR (nujol): 3400 (OH), L730 (C=O), 1660 (C:C)' 1H NMR (600
NftIz, CD¡OD); òH: 1..06 (3H, d, 6.Ç Mes), L.56 (1H, m, Hst), 1.60 (1.H, m, H5B), L.86
(1H, m, Hs'"), 2.10 (1-É1 ûr, FIsJ, 2.34(L}I, m, FIa), 2.40 (LH, m, Hro'u), 2.56 (LH"n,
H),2.60 (1H, m, Hzu), 2.60 (1H, rfl, FIro'a), L79 (1H, dd,10.7, LL.4,H6'),2-87 (7H, m,
Hs'),2.97 (1H, m, FI¿J, 3.09 (1F{, m, I{s"), 3.L5 (1H, m, FI4"), 3.15 (1H, m, Hz" ),3.26(llt dd, 8.4,9.0, Hs"), 3.55 (1H, m, Hø't), 3.62 (3H, s, Me16), 3.79 (1H, dd,3.6,'J.L.4,
FL,'J, 4.27 (l}i^, dd,9.6,11.4, Fl3'),4.40 (1FL dd, 3.6,1L.4,FI.p) 4.53 (1FI, d,7.8, Hr"),
5,72 - 5.22 (2H" ût FIs,), 5.14 (1H, m, FI6), 5.42 (1H, d, 3.0, Hr'), 5.64 (1H, m, Hz'),7 '37
(1H, d, 7.2,ry3'),9,58 (1H, br t, Hrr') (OHz", OÉb", OIù", OfL" not observed); raç
NMR (L50 MHz, CD¡OD); ôC: 14.5 (Ca ), 29.8 (C.s'),37 .4 (Cg'),37.8 (C.+u),38.7 (Cs), 43.8
( C¿), 45.3 (Cz),46.1 (C10') , 46.3 (Cz), 47.8 (Ca'),52.7 (Crc),63.1 (C6"), 68.3 (Cg), 71.5
(Q"), 74.5 (Cs"),77.9 (Cz"),78.3 (Cs"), 78.8 (Co), 97.7 (Ct'),98.0 (Ci"), 1,1'1'-9 (C+'), 120.5
(Cs), 134.8 (CÐ,153.3 (Cs'), 167'7 (Crr), 173.2(Cg),176.2(Cr),203.0 (Ctt');mls(LSIMS)
: 599 (M+H+, 40%),2LL (L00), L95 (73), L66 (32), LSL (42),107 (30).
4lt
J
2
I
1 .,OH\It
o/4
I
5tl""' t
6
179

Chapter 13 Experimental
73.3.\7 Loganin
1o-'o'z\oll
5
I
n/nu /7',rt7a
8
il I
./1.'rrrl.¡oH
o gz
OH(s)
10 mg of (5) was isolated as a white amorphous solid.Idenhified by complete
assignment of 1H and 13C spectral data; C17H25O1sj €xact mass calculated for
M+H+, Ctz}JzzOto:39"J..L604, found, 391..161.4 (+/- 0.0010); MP: 222-225oC (lit.za, so,
223,C); [cJo: - 80o (c 0.1, MeOH) (lit.eo, - 82.].o (HzO)); FTIR: 3430 (OH),1722 (C:O),
L660 (C:C); 1H NMR (600 MHz, do-DMSO); ôH: 0.97 (3H, d, 6.6,lvles), L.22 (ZFl,br s,
OH), 1.43 (1H, ddd, 3.O "1.1.4,73.8, Hsp), 1.70 (1H, ddd,6.6,9.6,17.4, Hz), 1.83 (lFI,
ddd, 4.8, 9.6, 9.6, Hz ^\,
2.05 (l}t dd, 7 .8, 13.8, Hs"), 2.93 (lFL dd, 7 .8, 9.0, H2'), 2.96
(1FI, dddd ,'1.2,7 .8,9.6, 11.4, H+u), 3.10 (ltt ddd, 3.6, 5.4,9.0, Hs'), 3.L3 (1F dd, 9.0,
9.6,Hs'),3.20 (1H, dd" 9.0, 9.6,H4'),3,41 (1FL dd, 5.4, 11.a, FI¡t),3.6I (3F{, s, Meto),
3.64 (LJJ, dd, 3.6, LL.4, Hó'), 3.86 (1It dd, 3.6, LL.4, Ík), 4.40 (L}i,'t:r- d, OH), 4.46 (LW
d,7.8, Hr'), 4.54 (1FL br t, OFI6), 5.04 (1FI, br d, OHz'), 5.11 (1H, d, 4.8, Hr), 7.35 (11I, d,
1.2,Hs);13C NMR (150 MHz, de-DMSO); ôC: 13,5 (C¡), 30.8 (C¿") 39.8 (Cù,42.0 (Cs),
447 (Cz),50.7 (Cro) 61.1 (Co'), 70.1 (C4'), 72.L (Cò,73.L (Cz'),76.7 (Cs'\'77.3 (Cs'),96.1
(Cr), 98.5 (Cr') 11L.9 (C+), L50.5 (Cs),L67.1(Cg)ruls (LRP +LSIMS): 413 (M+Na+,
73%),391 (N{+H+,5),304(70),282(20),242 (100),242(100),205 (8), t79 (37),142 (18).
13.3.18 Initial treatment FRACTION 8
23 g of Fraction 8 was separated from the original methanol extract [828 g] using
90/o ethylacetate/L0% methanol as the eluting solvent.
5 g of Fraction I was subjected to flash chromatography (silic4 isocratic, 90/t ethyl
acetate/ 10% methanol) with twelve fractions being separated. Fractions 8.3 and
8.4 were combined to form 8.(3) [1.aa g].
313'
I
6\
5
I
L80
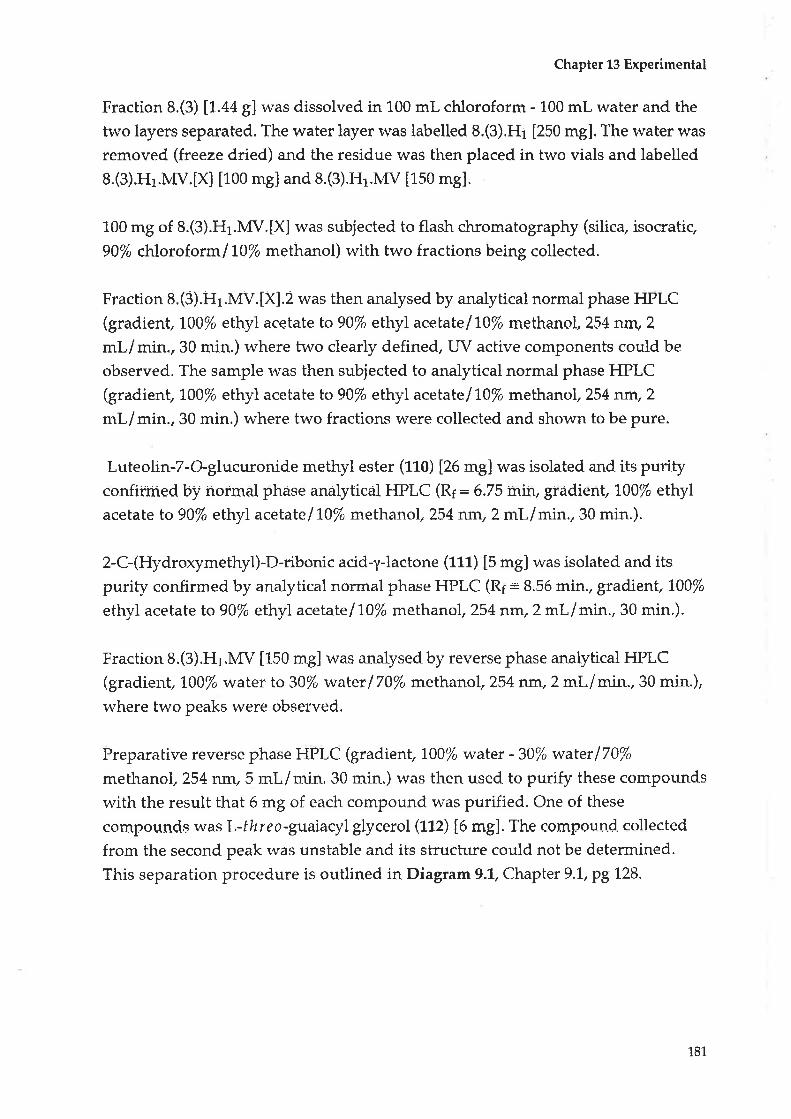
Chapter 13 Experimental
Fraction 8.(3) [1.44 g] was dissolved in 100 mL chloroform - L00 mL water and the
two layers separated. The water layer was labelled 8.(3).H1 [250 mg]. The water was
removed (freeze dried) and the residue was then placed in two vials and labelled
8.(3).H1.MV.tXl [100 mg] and 8.(3).H1.MV [150 mg].
100 mg of 8.(3).H1.MV.lXl was subjected to flash dnromatography (silica, isocratic,
90% cltloroform/ 10% methanol) with two fractions being collected.
Fraction 8.(3).H1.MV.lXl.2 was then analysed by analytical normal phase HPLC(gradient, 100% ethyl acetate to 90% ethyl acetate/ 10% methanol, 254 nm,2ml/min., 30 min.) where bwo clearly defined, UV active components could be
observed. The sample was then subjected to analytical normal phase HPLC(gradient, L00% ethyl acetate to 90% ethyl acetate/ 1.0% methanol, 254 nm,2mL/min., 30 min.) where two fractions were collected and shown to be pure.
Luteolin-7-Gglucuronide methyl ester (LL0) [26 mg] was isolated and its purityconfirmed by normal phase analyticâl HPLC (Rr: 6.75 min, gradient, 100% ethylacetate to90% ethyl acetate/10% methanol, 254nm,2 ml/min.,30 min.).
2-C-(Hydroxymethyl)-D-ribonic acid-y-lactone (111) [5 mg] was isolated and its
purity confirmed by analytical normal phase HPLC (Itr = 8.56 min., gradient, 100%
etlryl acetate to 90% ethyl acetate/ L0% methanol, 254 nm,2 ml/min., 30 min.).
Fraction 8.(3).Hr.MV [1-50 mg] was analysed by reverse phase analytical HPLC(gradient, t00% water to 30% water/ 70% rrret]nanol 254 nm, 2 mL/ min., 30 min.),
where two peaks were observed.
Preparative reverse phase HPLC (gradient, 1.00% water -30% waterlT0%
methanol, 254 nm, 5 ml/min. 30 min.) was then used to ptuify these compounds
with the result that 6 mg of each compound was purified. One of these
compouncts was L-threo-guaiaeyl glycero-l (112) t6 mgl, The compound eolleeted
from the second peak was unstable and its structure could not be determined.
This separation procedure is outlined in Diagram 9.1, Chaptet 9.t, pg I28.
181.

13.3.19 Luteolin-7-Gglucuroníde methyl ester
o\ ll
Chapter 13 Experimental
74
t\ ,oH
,/t\ ?10 OH
il3
1
72oI
1
H3CO 8a
I
4a
)1'
I
2,.,ttf
/6\s/I
o\
OH
o-r-\il
on'\/I
3
Á ltoOH
(110)
26 ntg of (ff0) was isolated as yellow crystals. Identified by complete assignment
of lH and 13C spectral data; C22H26O12i exact mass calculated M+FI+, C22H21Oi2:
477.1032, found, 477.701,6 (+/- 0.0016); MP: 278-280oC; [o]p: + 1.3o (c 0,1, MeOH);
uv: Lr¡a¡, (methanol) 254, 267 , 346 (lit.st, 25+ 268,348); FTIR 3400 (OH) , 1730
(C=O), 1660 (C=C); tH t',ll,tR (600 MHz, d6-DMSO lDzO); õH: 3.26 (1H, dd,7.8,9.0,
Hz,),3.37 (LH',t,9.0, F{g'), 3.40 (1H, dd, 9.0, 9.6,H4'),3.59 (3H, s, OCH¡), 4.23 (LH' d,
9.6,Hs,),5.31 (lFI, d,7.8, Hr'), 6.45 (1H, d, 2.4,Hò,6.72(l}I, s, Hg), 6.80 (1F{, d,2.4,
IJsl, 6.87 (1H, d, 8.4, H13), 7.39 (1H, d, I.2, Hro), 7.42 (7H, dd,7.2,8.4, Hr+) (OHs'
OHrr, OHtz,OHz,,OH3', OFI4'not observed); raç NMR (150lvlHz, d6-DVISO lDzO);
ôC: 52.4 (Cz'),7I.9 (Cq'),73.4 (Cz'), 74.7 (Ca'),75.2 (Cs'),94.2 (Ca), 98.6 (Cr'), 99.7 (Co)'
103.2 (Ce), 105.9 (C+u), 113.2 (Cro), 115.5 (Crs), 119.2 (Cr¿) L21..6 (Cg), L45.5 (Crr), 149.3
(Crz), 156.0 (Cau), 161.8 (Cò,t62.2(Cz\,t64.7 (Cz\,t69.6 (C6'), 181.4 (C+);m/s (LSIMS
in glycerol):477.1, (M+H+, 50%),287 (100),239 (15).
13.3.20 2-C-(HydroxymethyD-D-ribonic acid-t-lactone
OH
nO_s\ ã\/._OuA -/'oott\-/ 1\'o
(111)
5 mg of (1L1) was isolated as a yellow amorphous solid. Identified by complete
assignment of 1H and 13C spectral data; CoHroOs, exact mass calculated for M+H+,
GHrrOs: 179,0555, found, L79.0538 (+/- O.OOt7);lvtP:82 - 89oC (lilse, 88 - 89oC);
lalp: - 76" (c 0.1, MeOH) (lit.se, -74" (c2.l,Hz}); FTIR (nujol): 3440 (OH); 1H wprR(600 MHz, do-DMSO lDzO); òH:3.30 (1Ét d, l0.2,Hsr),3.40 (1H, d,10.2,H6a),3.44
(lFI, dd, 5.4,\2.6, Hs¡), 312(LH, dd,2.4,12.6,}{.5q\,4,O7 (1H, d,8.4, H3), 4.11 (1H,
ddd,2.4,5.4,8.4, H¿) (OHz, OHs, OHs, OFI6, not observed); 13C NMR (150 MHz, dó-
182
Chapter 13 Experimental
DNASO/DzO); òC:60.2 (Cs),60.5 (Co), 67.9 (Cs),73.8 (Cz\,83.4 (C¿), 175.9 (Ct);mlz(LRp +LSMTS): 179 (ivr+H+,100%),149 (50), 723 (70).
73.3.27 L-thr e o -Guaiacyl glycerol
OH OHI
,/\./t'\-. .¿s'642'il]:
,o-'Yi oH
I
ocH3(112)
6 mg of (112) was isolated as a white amorphous solid. Identified by complete
assignment of lH and 13C specbal data; C1eH1aO5; exact mass calculated forC1¡H1aO5'.2L4.0084,found, 2L4.0080 (+/- O.OOO4); MP: L3L - 1.34oC (1it.e4,es,132- 133
oC); [cr]p: + 20o (c 0.1, MeOH) (lit,v+.s, + 23o (c 0,6, ethanol); FTIR (nujol): 3450 (OH),
1660 (c=c); uv: Àrr,"x, (cHCb) 235,327 (lit.ss, 235,322);1H NMR (600 MHz, d6-
DMSO, CD¡OD); òH: 3.850 (3H, s, OCH3), 3.314 (1H., dd, 4.8,70.2, Hat), 3.440 (l}J.,
dd,3.0, 10.2, FIs'u), 3.613 (1F{, ddd,3.0,4.8, 6.6,th'),4.M8 (1Il d, 6.6,F].t'),6.760 (1H,
dd, 1.& 7.8, Hs), 6.724 (1H, d, 7.8,Hò,6.9t9 (1H, d, 1.8, Ffu) (OHr, OHt', OII2', OHs'
not observed); 1sC NMR (150 MHz da-DMSO, CD3OD); ôC: 56.0 (OCH3), 64.9 (Cs'),
75.7 (C1'),78.5 (Cz'),110.4(Cù,11.6.7 (Cò,121.0 (Cs), L34.5 (Cù,1.47.3 (Cù,1'49.7 (Cù;
rnls (LSIMS):237 (M+Na+, t00%).
73.3.22 Initial treatment FRACTION 9
Fraction 9175 gl was separated from the original methanol extract [828 g] using
75/o ethyl acetate/2S% methanol as the eluting solvent.
5 g of Fraction 9 was subjected to flash chromatography (silic+ sequentiaf 80/o
chloroform/ZO % methanol then 6Q% chLoroform/40% methanol), Ten fractions
in total were collected.
TLC analysis indicated that both Fractions 9.4160 mgl and 9.7 145 mgl were
relatively pure. Both these fractions were independently dissolved in80%
chloroforml20% methanol and left overnight.
L83

Chapter 13 Experimental
Fraction 9.4a crystallized out to form yellow needles and was identified as
luteolin-7-O-glucoside (113) Í27 mg}Its purity was confirmed on analytical
reverse phase HPLC (gradient, 100% water to 100% methanol ,254 nm, 1.
mL/min., 30 min., Rr: 13.45 min.).
9.7c |ormed a white solid [38 mg] and was recrystallized using 75% chloroform
IZSY methanol and the crystals were removed. These crystals were found to be
2-deoxy-D-chiro-inositol (114) [28 mg]. This separation system is outlined inDiagram 10.1, Chapter L0.1-, pg L35.
73.3.23 Luteolin - 7-Gglucoside
t\ -OH14
il
12
1I
1
HOo\
OH
,u-O\rln",Illo
6\
HO\\"
,102./5
I
¿O:./\iirZ!,,ttoHu-lI
OHI
3
3'lOH
(113)
27 mg of (1L3) was isolated as yellow crystals. Identified by complete assignment
of 1H and 13C spectral data; CzrHzoQr; MP: 25L - 253oC (1it.24,80,256-58oC); [a]o: +
1,3o (c 0.1, MeOH) (lit,zs, + 2o (HzO/MezCO); UV: À,,¡¿*, (methanoL) 254,268, MB;lH NMR (600 MHz, do-DMSO); ôH: 3.L7 (IIJ, t,9.0, FI4'), 3.25 (1F{, dd, 7.2,9.6,T{q'),
3.29 (LJJ, dd" 9.0, 9.6,H3'),3.44(LIJ., ddd,5.4, 9.0,9.6, Hs'),3.48 (lFl dd, 5.4,1.L.4,
Ho'u) 3.71 (1H, dd,9.6,11.4, FI6'"), 5.06 (1H, d, 7.2,H.t'), 6.43 (7H' d,2,4,Í1à,6.73 (7I¡l,
s, FI.r), 6.n íW d"2.4" FIB),6.88 (lFL d,8.4, Hrs),7.40 (1FI, d"2.+ Hro),7.43 (1H' d42.4,8.4,H't+),12.97 (LH, s, Cs-OFIs); (OHrt, OHrz, OHz', OFL', OFI4', OFIo' not
observed); 13C NMR (150 MHz, fu-DMSO); òC:60.5 (q,'), 69.5 (C¿'), 73.0 (Cz'),76.3
(Cs'),77.1. (Cs,),94.6 (Ca),99.4(Cò,100.0 (Cl'), 103.1 (Cg), L05.2 (Cqo), 113.5 (Cro), 115'9
(Cre), 119.1 (Cr+), LZL.Z(Cs),145.7 (Crr), 149.9 (Crz), 156.8 (Csu) 161.0 (Cò,162.9 (Cù,
I64.4(C2), L81-.8 (C+);mIs (ESI): 448(T00%).
184
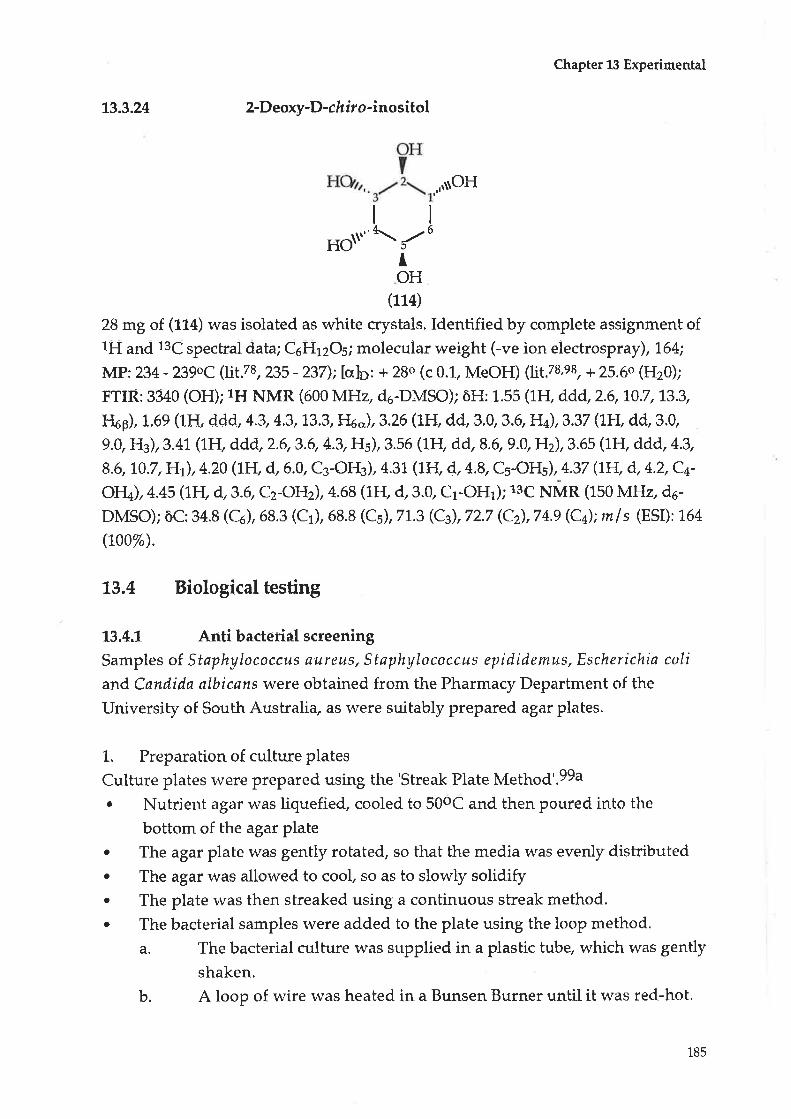
Chapter 13 Experimental
73.3.24 2-Deory-D-cft dro-in ositol
,,'ñOH
I6
lOH
(114)
28 mg of (11a) was isolated as white crystals. Identified by complete assignment of1H and 13C spectral data; C5H12O5; molecular weight (-ve ion electrospray),164;
Mp:234 _ 239oC (lit.zs, Z3S _ZZT); [ahr: + 2Bo (c 0.1, MeOH) (lit.za,sa, + 25.6o (HzO);
FTIR: 3340 (OH); 1H NMR (600 MHz, d6-DMSO); òH: L.55 (1H, ddd,2.6, 70.7,73.3,
FLp), 1,69 (1I{, ddd,4.3,4.3, 13.3, Hoo),3.26 (1I{, dd, 3,0, 3,6,H+),3,37 (1H, dd,3.O9.0, H3),3.41 (lFI, ddd,2.6,3.6,4.3, Hs),3.56 (1tI, dd, 8.6,9.0, Hz),3.65 (1H, ddd,4.3,
8.6, t0.7 , }{ù, 4.20 (1H, d, 6.O Cs-OHg)' 4.31(1F d, 4.8, Cs-OHs), 4.37 (1H, d, 4.2, C+-
OFI4), 4.45 (7H, d,3.6, C2-OH),4.68 (1H, d, 3.0, Cr-OHr); 13C NMR (L50 MHz, do-
DMSO); òC:34.8 (q),68.3 (Cr),68.8 (Cù,77.3 (Cs),72] (Cz),74.9 (C+);mls (ESI): 16a
(7oo%).
13.4 Biological testing
13.4.1 Anti bacterial screening
Samples oÍ Staphylococcus ßureLtsî Staphylococcus epididemus,Escherichia coli
and Candida albicarxs were obtained from the Pharmacy Department of the
University of South AustraliE as were suitably prepared agar plates.
1. Preparation of culture plates
Culture plates were prepared using the'Streak Plate ¡v1s¡¡s¿'.99ao Nutrient agar was liquefied, cooled to 50oC and then poured into the
bottom of the agar plate. The agar plate was gently rotated, so that bhe media was evenly disfributed. The agar was allowed to cool, so as to slowly solidify. The plate r,vas then streaked using a continuous streak method.. The bacterial samples were added to the plate using the loop method.
a. The bacterial culture was supplied in a plastic tube, which was gently
shaken.
b. A loop of wire was heabed in a Bunsen Burner unbil it was red-hot.
I
HO\\"\¡
185
a
Chapter 13 Experimental
c. The cap of the tube was removed and the neck of the tube was flared
with the flame.d. When the loop was cooled (five seconds), the loop was dipped in the
tube full of organisms, avoiding touching the sides of the tube,
e. Starting at the edge of the plate, with a loopful of organisms, the
organisms \l/ere spread in a single continuous movement.
f. The plate was then rotated 180'. Without flaring the loop, the
streaking of the other half of the plate was conhinued.
The agar plates were left in an incubator unbil needed.
2. Preparation of extracts
All samples of crude extracts and semi - pure or pure samples were prepared inthe same waY.99b
. The samples were weighed accurately and then dissolved in a suitable
solvent, ranging from hexane to methanol/water. The concentration of the
sample was then determined¡ Filter discs were then dipped half way into the sample, rerhoved and then
allowed to dry.. The filter discs were then placed on the prepared agar plate, and incubated
for twenty four to forty eight hours, when the plates were checked to
determine if any inhibition of bacterial gror,vth had occurred.
13.4.2 Cytotoxicity test
Procedure A
1. Preparation of plant extracts. The plant extracts wcrc weighed and solubilised in either water, ethanol,
methanol or DMSO to form an initial concentration of L00 mg/ml.. Stock solutions of each extract were prepared at 100 mg/ml and stored at
- 200c.. Three-fold dilutions were inihially used to clebermine the presence of any
potential cytotoxicity.o Controls for methanol, ethanol and DMSO were also ineluded to enstlre
that any cytotoxicity was not due to the solvents, but to the extract.
Cell lines
Three cell lines were used.
MM418E is an adherent human melanoma cell line.
2.
a
186

Chapter 13 Experimental
. 5637 is an adherent human bladder carcinoma cell line,
. MM4L8E and 5637 were kept growing in RMPI L640 medium, supplemented
rvith 10% heatinactivated foetal calf serum (FCS), 2 mM L-glutamine, 50
pglmL penicillin /streptomyocin and 10-s M 2-mercaptoethanol.. MDA MB æ1 is an adherent humanbreast adenocarcinoma cell line.. MDA MB 231 was kept growing in DMEM medium, supplemented with
l0% li'Leat inactivated FCS, 2 mM L-glutamine, 50 ¡rg/mlpenicillin/streptomycin, 10-s M 2-mercaptoethanol and 50 pg/mL insulin.
. All cell lines were incubated at37oC and 5 % COz.
3. Bringing up frozen cells. The cryotube containing frozen cells was taken out of - 70oC storage.
. The cryotube was then held in the hand until warmo It was then placed in a 37oC water bath until completely thawed.. The contents of the cryotube was added to 8-9 mL of culture medium.. This suspension was then mixed and then centrifuged at 1000 rpm for 1,0
minutes.. The supernatant was removed and new cullure media was added. The pellet was then resuspended and mixed by inverting several times to
wash cells.
. This suspension was then centrifuged again for a further L0 minutes at 1000
rpm'. The supernatant was removed and the pellet resuspended in 3-4 mL of
culture media¡ This solution rvas then transferred to a 25 mL flask, rvith the cryotube
repeatedly r,r'ashed to ensure all cells \l'ere transferred.. Culture medium was added to a final volume of 10 mL,. The cells rvere allorved to culture at 37oC.
Subctrlture of cells.
MM418E and 5637 cell lines.
Cells were observed for confluence.
If confluent, adhering cells were scraped with a sterile, disposable cell
scraPer.
The volume of the cell suspension was distributed equally between two or
three flasks.
The flasks were then returned to the incubator.
4
a
?
o
o
'187
a
Chapter 13 Experimental
MDA MB 231 cell lineThis cell line showed little adherence and hence splitting was accomplished
by simply distributing the volume of cell suspension between tr,vo flasks.
5. Freezing down cells. The cell suspension r,r¡as centrifuged at L000 rpm for ten minuteso The supernatant was removed and the cells resuspended in 10 mL culture
media.. The haemocytometer was loaded and then the cells counted using 40x
magnification.o The suspension was then centrifuged at L000 rpm again,
o The suspension was then diluted with freezing medium (90% foetal calf
serum, 10% DMSO) to produce a final concentration of L x 107 cells/ml.. The pellet was then resuspended and one mL aliquot's added to each
cryotube (properly labelled with cell type, date, concentration and initials).. These cryotubes were then placed in the fridge for 30 minutes, then at - 20oC
for a further 30 minutes and finally stored at - 70oC. (They were stored under
nitrogen for longer storage).
Cytotoxicity assay.
For two day incubations the cells were plated at L x 10a ce[s/well, while forfive day incubations, the cells were plated at?x LOa celis/well.
Cell viability was determined using aR "aqueous, RoR-radioactive cell
proliferation assay kit", supplied by Promega, category no. G5430. This
colorimetric assay uses the addition of MTS (3-(4,5-dimethylthiazol-2-yl)-5-
(3-carboxymethoxyphenyl)-2-(4-sulfophenyl)-2H-tetrazolium, inner salt) at a
concentratiorr of 333 ¡rg/mt and 25 ¡rM phenazine methosulfate (PlvIS).
MTS is converted to formazinby the dehydrogenase enzyms found inmetabolicaþ active cells. The quantity of formazin (as measured by the UV
absorbance at 490 nm) prodttced is directly proportional to the number of
living eells in the eulture.
7. Plate preparation.. The plates used for this experiment were 96-well, flat-bottomed plates.
. The outer 36 wells were plated with 250 ¡rL of sterile water to avoid
evaporation effects, while the inner 60 wells wele used.
. Colunu'r two of each plate was used as a negative control and contained 100
prl, of serum - free culture medium and 100 prt of cells suspended inT%serum to produce a final concentration of L % serum.
6.
a
a
1.88

a
I
a
Chapter 13 Experimentat
Column three of each plate was used as a positive control.22:6 (a
polyunsaturated fatty acid) proved to be the best positive conkol as itsholved the most cytotoxicity against the cell lines.
Columns four to eleven contained serial dilutions of the extract stock(initial concentration of 100 mg/mT-).
150 ¡rL of the first dilution was plated to column four and 50 prI- was then
removed and added to column five that contained 100 ¡rL of serum free
medium.
Procedure B
1. Cell lines. Two cell lines were used.
t 5637 is a primary adherent bladder carcinoma cell line.. 5637 was kept growing in RMPI L640 medium, supplemented with L0% heat
inactivated foetal calf serum (FCS), 2 mI\{ L-glutamine, L2 prg/mt penicilliru
20 mM HEPiîS buffer, L6 pglmL gentamicin, L2 ¡tglmL penicitlin and 10-s M
2-mercaptoethanol.. HEL is a diploid human fibroblast, human embryonic lung ceIl line.. HEL was kept grorving in Dulbecco's modified eagle medium (DMEM) with
3.7 g,lL sodíum bicarbonate, 4.5 g/L glucose, 1.5 ¡rM HEPES buffer, 1.0 % v lvFCS, 2 mM L-glutamine, 16 pg/ml gentamicin and 12 gglmL penicillin.
. All cell lines were incubated at 37oC and 5 % CO2.
2. Preparation of plant extracts. The plant extraets were a crtrde water extract and crude fractions 4 and 9.
These fractions had been found to have cell proliferation activity when
tested previously.. These extracts \,vere weighed and dissolved in cell culture media containing
7% v I v FCS to form an initial concentration of 4 mg/ mL,. In a96 - mierotiter plate, 1/3 dilutions of tl'ris stock were produced to cover
the concenbration range of 0.914 to 2000 pg/ml- in a volume of 100 ¡r.L/well.o Six replicates w¡ere performed for each dilution.
' Cell culture medium was added to six wells of each plate to aet as controls.
o To each well, L00 ¡rL of a cell suspension containing L x 10s cells/ml (either
5637 or HEL cells) was added, to give ahnalvolume of 200 pl/well.. The final concentration of the extract covered tl-re range 0.457 to L000 pg/mL.. Plates were ineulated at 37oC in a humidified atmosphere of 5 % COz in air
for two to five days.
189

Chapter 13 Experimentat
After the incubation period cytotoxiciby was assessed using the neutral red or
MTT cytotoxicity assay.
3. MTT âssaYloo' ror
i. Preparation of the stock solution of MTT. MTT (3,(4,S-dimetþlthiazol-2-yl)-2,5-diphenoltetrazolium bromide lvas
dissolved at a concentration of 5 mg/ml in sterile PBS, then sterilised byfilkahion through at.Llprm sherile filter.
. The solution was stored for up to one monhh at 4oC, protected from lightii. Preparationofsoluþilioationsolutionl0l. SDS was dissolved at a concentration of 20 % w lv in a solution of 50% DMF
(N,N-dimethyl formamide), in purified water.. The SDS was dissolved in the DMF solution at 37oC with gentle agitation.. Once the SDS had dissolved, 2.5% of an80% acetic acid solution was added.. The pH of the solution was then adjusted to 4.7 by the drop wise addition of
1M HCl. The solution was stored at room temperature.
iii. Preparation of MTT/media. Immediately prior to use, MTT was mixed with the appropriate media for
the cell line to be tested.o { concentration of 1.0 mg/mL was used for FIEL and 5637 cells (ie. 2 mL of
MTT stock mixed with 8 mL of HEL media).
iv. Cytotoxicity assay
. Cells were incuþated in 96-well plates for the appropriate tinTe period rviththe cytotoxic substa¡ce ot media.
o After the given incubation period the media was flicked out of the 96=we11
plate under sterile conditions.. To each well (except the first row, which serve as a blank and contain no
cells) was added 100 ¡rL of the appropriate MTT/media for the cell line used.
. To each of the blank wells, L00 pL of media only was added.
. The plate was then incubated in a humidified atmosphere of 5 % COz at
37oC for four hsurs.. After the four hour incubation period, the plate was removed from the
incubator and 100 pl/wetl of the solubiliser/stop solution was added to all
wells, ineluding the blanks.. The plate was shaken at medium speed (Ratek Instruments Plate Shaker) for
twenty minutes at room temperatute.. The absorbance (blanked against the first row), was measured at 570 nm
(Multiscan ELISA reader).
190
Chapter 13 Experimentat
4. Neutral Red Assa/ method.loz
i. Preparation of Neutral Red stock solutiono [ 0-4% neuffal red solution was prepared by dissolving 40 mg of neutral red
in purified r,r'ater (Milli-Q), to 10 mL.. The solution was then filtered througll a0,22 prm filter to sterilise it.ii. Preparation of cell fixativeo [ 10% calcium chloride solution was prepared by adding 13.23 g of CaCl2 to
L00 mL of Milli-Q water and stored at 4oC.
. 1.25 mL of a 40a/o formaldehyde solution was added to L0 mL of the 1.0 %
calcium chloride solution and then made up to 100 mL using milli-Q water.. The solution was stored at room temperature.
iii. Preparation of solubilisation solutiono I mL of glacial acetic acid was added to 50 mL of ethanol and 49 mL of Milli-
Q water and stored at room temperature.
iv. Preparation of neutral red/media (day before testing).r Neutral red was added to complete media at a final concentration of 40
pB/mL (ie 0.20 mL of At/o neuúal red to 19.80 mL media).. The media was then incubated overnight at 37oC to precipitate any dye
crystals.. The neutral red/media was then centrifuged at 2000 rpm (Clements 2000
centrifuge) for 10 minutes to remove the precipitated dye.
v. Cytotoxicity assay
. After the incubabion period of cells with extract, the media was flicked out of
the 96-well plate under sterile conditions.. To each rvell (except the first rorv which will serve as a bla¡k and contained
no cells) was added 200 ¡r.L of neutral red/media,. The plate was then incubated in a humidified box for th¡ee hours at37oC,
gassedwith5%COz.. After the three hour inctrbatiory the neutral red/media solution was flicked
out of the plate.. To each w'ell -100 pL of eell fixative was added, except for the eontrol wells
and left for 90 seconds.
o The fixative solution was removed by flicking the plate and tapping it on a
dry absorbent eloth.. Solubilisation solution (200 frl./well) was then added to each well including
the blank wells.. The plate r.vas shaken at medium speed (Ratek Instruments Plate Shaker) for
ten minutes at room temperature.
191
a
Chapter 13 Experimental
The absorbance (blanked against the first row of cells) was measured at 540
nm (Multi,qcan ELISA reader).
Procedure C
7. Cell lines. Two cell lines were used, HEL cells and Caco-2.
. HEL and Caco-2 rvere kept growing inDulbecco's modified eagle medium(DMEM) with 3.7 g/ L sodium bicarbonate, 20 mM HEPES buffer, 1,0 % FCS,Z
mM L-glutamine, 16 pglml gentamicin and 12 pg/ml penicillin,o All cell lines were incubated at37oC and 5 % COz.
2. Preparation of plant extracbs
o The crude hexang crude ethyl acetate extracts and fractions 8, 9, 10 and LL
were retested against tlvo cell lines.. These extracts were dissolved in cell culture to give an extract concentration
of 1 mglmt and sterilised by filtration through a 0.22 pm filter (Sartorius).
o Serial L:2 dilutions of the extracts in media were prepared in a volume ofL00 ¡rm/well in a 96-well microtiter plate (three replicates per
concentration).. Controls of media only (100 pL/well) r\¡erc performed in triplicate.. 100 pL of a cell suspension containing I x LOa cells/ml was added to each
w.ell, includin-g the contrsls, to give a final volume of 200 plt/well.. The final concentration of each extract ranged from l-5.6 to 500 ¡rg/ml.. The plates were incubated at 37oC, in a hu-midified atmosphere of 5 % CO2
in air for seven days when cells in the control cells had grown to form a
confluent monolayer.. Cytotoxicily was assessed using the neutral red cytotoxicity assay.
3. Neutral Red Assay method - see previous outline of method, P 190.toz
Procedure D
1. Cell lines. Two cell lines were used, HEL cells and Caco-2.
. HEL and Caco-2 was kept growing in Dulbecco's modified eagle medium
(DMEM) with 3.7 g/ L sodium bicarbonate, 20 mM HEPES buffer, 1'0 % FCS,2
mM L-glutamine, L6 pelml gentamicin and 12 ptg/mL penicillin.. All cell lines were incubated at 37oC and 5 % COl
192
Chapter 13 Experimental
2. Preparation of plant extractso Eleven boiled aqueous exhacts of various combinations of Scaepola
spinescens wit\t Codonocarpus cotinifolius were prepared and lyophilised.r These extracts were stored at. 60oC and then thar,r'ed to room temperature
when needed.o Extracts were dissolved in cell culture to give an extract concentration of 1
mg/ml and sterilised by filtration through a0.22 ¡.rm filter (Sartorius).
. Serial 1:2 dilutions of the extracts in media were prepared in a volume ofL00 ¡"tm/wetl in a 96-well microtiter plate (three replicates per
concentration).o Controls of media only (100 pl/well) were performed in friplicate.. 100 ¡rL of a cell suspension containing 8 x 10a cells/ml was added to each
well, including the controls, to give a final volume of 200 pl/well.o The final concentration of each extract ranged from 15.6 to 500 ¡rg/ml.. Tlre plates were incubated at37oC, in a hunúdified atmosphere of.5 % COZ
in air for seven days when cells in the control cells had grown to form aconfluent monolayer.
. Cytotoxicity was assessed using the neutral red cytotoxicity assay.
3. Neutral Red Assay method - see previous outline of method, P 190.toz
13.4.3 Anti viral testing
L. Preparation of plant extracts. Six compounds were tested for anti viral activity.. They were tested at a concenkation of 50 prg/mL in cell culture media in anti
viral assays.
. To aid solubilisation in cell culture media, the compounds were pre
dissolved in either ethanol, methanol or DMSO.o The final concentrations of these solvents did not exceed 7 % v lv. At this
concentration, none of the solvents had antivira-l aetivity against the three
viruses tested.
2.
a
Viruses
Three viruses, representing three different viral families werc chosen,
herpes simplex type 1- (HSVl), Ross River virus strain T48 (RRV), and
poliovirus type 2.
HSV1 and RRV were grown in Vero cells (Afrícan green monkey kidney)
and poliovirus was grown in BGM (Buffalo green monkey kidney) cells.
a
193
a
Chapter 13 Experimental
Cells were grown with Dulbecco's modified eagle medium (DMEM) with3J g,lL sodium bicarbonate, 4,5 g/L glucose, 15 mM HEPES buffer, lQ % ECS,
2 mM L-glutamine, L6 FB/mL gentamicin,l2 FB/mL penicillin and heat
inactivated FCS (5 % v lv).All cell lines were grown in a humidified atmosphere of 5 % COz, in air.o
3. Anti viral and cytotoxicity assays.
¡ To test the exkacts for anti-FISV, anti-RRV and anti-polio ac[ivity,
inhibition of virus-induced cytopathic effect was measured.. Vero (HSV and RRV assay) or BGM cells (polio as.qay) tvere seeded into a 96-
well microtiter plate at an initial concentration of I x 103 cells/lvell.. Cells were incubated for four to six hours at37oC in a humidified COz
atmosphere.. One series of triplicate wells was then infected with virus at a multiplicity of
infection (MOI) of approximately 0.02 TCIDso units/cell.. The second series of wells was mock infected with media only.. Two-fold sefial dilutions of the compounds were then added in the two
series of triplicate wells to allow simultaneous determination of anti viraland cytotoxic effects.
. Controls of mock infected cells without extract treatment and untreated cells
with virus lt'erc included in triplicate on each plate.
' Cultures were incubated until the wells containing untreated cells infected
It'ith virus showed complete (100 %) cytopathic effect ( ¿O - 48 hours for
polio; 50 hours for RRV and 96 hours for HSVI-) and cells in mock-infected"
untreated cells had grown to form a near confluent monolayer.o Mock-infected cells treated r,r'ith the serial dilutions of the extract were
examined microscopically for cytotoxic effects.
o Microtiter plates were then washed with PBS to renlove any detached cells
and cell debris, fixed and stained with crystal violet, 0.5 % in water : ethanol :
formaldehyde: sodium chloride (400 : 1.90 :7 :7).. Cell vialility was quantified usin-g erystal violet eytotoxieity assay ms¡hed.103
194
Referen_ceo
REFERENCES
Cribb, A.B. and Cribb, J.W., 'Wild Medicines in Australia', (Collins Pty Ltd: Sydney, L9Bt). p.46.
Singer, C., 'Medicine and. its Masters'in'The New UniversalEncydopedia', (Stowell" C. Ed., The AmalgamatedPress: Londorç L977)
Vol L0, p.26L3.
3. Flood,I., personal communication, (1996).
McBryde,I., 'Goods from Another Country', in'Australians : A Historical
Library', (Mulvaney, D.I. and White,I.P,, Ed., Fairfax, Syme and Weldon
Assoc : 1987), p. 253 - T/3.
Webb, L.J., CSIRO Bulletin No. 23ã L947 - Æ,60.
\,\rebþ L.1., Mankind,, 1969, 7, 137,
Reid, E.I. and: Betts, T.1,, Planta Medíca.,1979,36, L64.
Lassak, E,V. and McCarthy, T., 'Australian lr{edicinal Plants', (Methuen:
Ausüalia, 1983), pp 138,144,185.
9. Cleland, I.B. and fohnston, T., Trans, Proc. Royal Soc, S'A,,1939, 63,172.
10. Barr, 4., ChapmarL J., Smitlr. Ir{., WightmarL G., Knight, T., Mills, L.,
Andrews, M. and Alexande4 V., 'Tradifional Aboriginal Medicines in the
Northern Territory of Aushralia', (Government Prinber of the Northern
Terri[ory: Danvin, 19 3), p.526-529'
Collins, D.J., Culvenor, C.C.I., Lamberto& I.4., Loder,I.W. and Price,I.R.,
'Plants for Medicines', (CSIRO Publications : Victoria, 1990), p- 42-43.
'Flora of Australia', Voluute 35, (Australian Governntent Publishing
Service: Canþerra., L992), p, 97'99.
I
2.
4
5.
6.
7,
8.
11.
t2.
13. Steinmeba 8.F., Quart. l. Crude Drug R¿s., 1968,8,1249
195
L4,
References
Cunningham, G.M., Mulham, W.8., Milthorpe, P.L. and Leigh,I.H.,'Plants of Western New South Wales', (N.S.W. Government PrintingOffice : Sydney, L981), p- 638-
Snow, D., 'Cancer Medication', in 'The progress of public health', (Public
Health Department : Perth, Western Australia,1987), p.129-136.
McEntee, L personal communication, ( L993).
Everiçt, S,L,, 'Poiçonou$ Plants of Australia', (Angas and Roþertson :
Hong Kong, 197 4), p. 294.
Perry, L.M. and Metzger, ]., 'Medicinal Planbs of East and Southeast Asia :
Attributed Properties and lJses', (The MIT Press : Massachusetts, 1980),
p. 160 - t62.
19. I-Ioldsworth, D., lttt, I, Crude Drug Re.ç., L989, 27(2), 101.
20. feffrey, C,, Kew Bulletin,1979,34(3), 537.
Bodkin, F., 'Encyclopaedia Botanica', (Angus and Robertson Publishers :
Australia, L986), p-912- 913.
B r aun* K.P., p e rs o nal co mmunieatio n, ( 1-9 93 ).
Hutchings, 4,, personal communication, (1994).
Scott, G., personal communication, (1994)
Cunninghatr, T., personal communication ( t 994 ).
McKenzie, P., personal communicabiory $994).
Holdsworth, D., Pilikos, B. and Lambers, P.,lnt. l. Crude Drug Res., L983,
21(4), L61.
Burkill, I.H., in'A Dictionary of the Economic Products of the Malay
Peninsula', (Government of Malaysia and Singapore Publishing Service;
t966), p.2004-2005.
15.
16.
t7.
18.
21.
2?..
23.
24.
25.
26.
27.
28.
L96
29
References
Locher, C.P., Burch, M.T., Mower, H.F., BeresteckI,I., Davis, H.,
Van Poel, 8., Lasure, 4., Vanden Berghe, D.A. and Vlietinek, A,I, IEthn oph a r m acol* 1-995, 49, 23,
Semple, S., personal communication, (1,997').
Ghis alberti, Ë., personal communication, ( 1 996).
Goss, 4.R., Retallack, R.W. and Lockett, M.F., Pharmacol. Res.
C o m m un ., 1971, 3(3), 261.
Longmore, R. B.,personal communications, ( 1 996).
Ishii, R,, Yoshikawa, K., Minakata, FI., Komura, H. and Kado, T., Agric
Biol. Chem., 1984,48 (10), 2587.
Kert P,G. and Longmore, R.8,, AusL l, Hosp, Phørrn.,1996,26 (6 -il.
Kerr, P.G., Longmore, R.B. and Betts, T.1., P lanta Medica, 1996, 62, 519.
Semple, S.J., Reynolds, G.D., O'Leary, M.C. and Flower, R.L.P.,
l. Ethnopharmacol., 1998,60, 163.
Kerr, P.G., Longmore,R.B. and Yendr, R.,
http : / / www. csu.edu.au/ f aculty / health/ biomed/ MHR/ maroon htm
Sticher, O., in 'New Natural Products and Plant Drugs withPharmacological, Biological or Therapeutical Activity', (Wagner, H., and
Wolfl P., Ed., Springer-Verlag : Berlirr" t977), pp L37 - 176.
Taml'leles, T., proe . Koninkl, Akad. Wetenschap., Amsterdar-n-, L989,LL'
509.
Jensery S.R., personal communication (1993).
] e ns en, S. R., p ers onal conrmunication, (L997 ) .
Skaltsounls, 4.L., Sbahr, S., Demetzos, C. and Pusset,I,, Ann, Pharm.
Fran,, 1989, 47(q,249.
30.
31.
32.
33.
34.
35.
36.
37.
38.
39.
40.
41,.
42.
43.
197
44.
45.
46.
47.
48.
49.
50.
51.
52.
53.
References
Skaltsounis,4.L., Tillequin, F., Koch, M. and Pusset,I., Planta Medica.,
1989,55,191.
Cambie, R.C., Rutledge, P.S. and WellingtorL K.D., I. Nat. Prld.,1997, 60,
1303.
Isiguro, K., Yamakl M., Takagl S., Ikedo Y., Kawakami, K., Ito, K. and
Nose, K, Chem. Pharm. 8u11.,t986,34,2376.
Petkov, V. and Manoloç P., Agressologie,L975,16B,25
Inouye, H., Takeda,Y,, Uobe, K., Yamauchi K., Nabuuchi, N. and
Kuwano, 5., Planta Medica, 197 4, 25, 285.
Recio, M.D.C., Ginet, R.M., Manez, S., andRios, l.L.,Planta Medica,1994,
60,232,
Takeda S., Yuasa, K., Endo, T. and Aburada, M.,l.Pharmacobiodioersity,
1980, 3/10,485.
Skaltsounis, 4.L., Michel, S., Tillequin, F. and Kocþ M., Hela. Chim. Acta.,
1985, 69,"1.679.
Skaltsounis, 4.L., Tillequin, F. and Kodr. M., Heterocycles,T987,26,599.
Harbourne,I.B.and Baxter, H., in'Phytochemical Dictionary : a Handbook
of Bioactive Compounds from Plants' (Taylor and Francis : Londorr,1993)
a. Chapter 23,p.229 -235
b. Chapter 35, F. 351 - 366
c. Chapter 6, p.34 - 40
d. Chapter 37, p,388 - 414
e. Chapters 56 and 59,p.712-721 ,739 -744
Wohlrabe, K. and Hansel, R., Arch. Pharm. (Weinheim),1977,310,972.
Bohlman-q F., ]acob. J. and Grenz, M, Cltern. Com¡nun. Ber.,1975,108,433.
Kikuchi, T,, Yokoi, T,, l.fmemoto, K, and Shingu, T,,Yakugaku Zasslti,
L974,94(12',1, L6L6.
54.
55.
56.
L98
References
Kumar, V., Bulumulla, H.N.K., Wimalasiri, W.R. and Reisch, ].,P hy to chemistry, 1994, 36 @\, 879.
Namba, T., Morita, O., Huang, S.L., Goshima, K., Hattori, M. and
Kakiuchi, N., Planta Medica, 1988, 277.
Gunatilaka, A.A.L., Kingstorç D.G.I., Wijeratne, E.M.K., Bandara, B.M.R.,
Hofmanrç G.A. andlohnson, R.K, /. Naf. Prod.,1994,57 (4),518.
Takeuchi, N., Kasama, T., Aida, Y., Oki, J., Maruyama, I., Watanabe, K. and
Tobinaga, 5., Chem. Pharm. Br't|\.,1991,39 (6), 1415.
Sotheeswaran¡ S., Sharif, M.R, Moreau, R.A. and Piazza, C.1., Food Chem.,
7993,49 (X), 11.
Harborne, I.8,'The Flavonoids : Advances in research since L986',
(Chapman and Hill: London, 1994).
Pattersoru R., Sy s t em a t i c B o t a ny, t984, 9ß\, 263.
Newmann, 'A'.4., 'Chemistry of Terpenes and Terpenoids' (Academic
Press: London, 1972).
Claesoru P., Tuchinda, P. and Reutrakul V., /. Sc¿. Soc. Thailand,T993,L9,
73.
Still, W.C., Kahn. lvl. and Mitra, A.,1. Org. Chem.,1978,43,2923-
Semenova, O.P., Timerbaev, A.R. and Bonn, G.K., I' Chrom, A,, L994,667,
327.
Perrin, D.D., Armarego, W.L.F. and Perriry D.R., 'Purificatiou of Laborabory
Chemicals'2nd Ed. (Pergammon: Oxford 1980).
Vogel,A.L.,'A Textbook of Practicat Organic Chemistry including
Quantitative Organic Analysis'3rd Ed. (Longman: Oxford, 1977).
Murray, R.D.H,, Mendez, I. and Brown, S.A. 'The Natural Coumarins',
flohn Wiley and Sons : Chichester, 1982), Chapter 3, p. 2L-53.
t99
71.
72.
7s.
74.
75.
References
Braun, S., Kalinowski, H.O. and Berger, S., 'L00 and more Basic NMR
Experiments' (VCH : Weinheim, 1996).
Derome, 4.8.,'Modern NMR Techniques for Chemistry Research'
(Pergamon Books Ltd : Singapore/ 1989).
Sanders,l.K.Ivl, and Hunter, 8.K., 'Modern NMR Spectroscopy' (Oxford
University Press : Oxford, 1993).
Breitmaier, E, and Voelter, W., 'Carbon -13 NMR SpectroscoPy; (VCH :
Weinheim , 7989).
Budzikiewicz,H., Qerassi, C. and lVilliams, D.H., 'Structure Elucidation of
|.Tatural Products by Mass Spectrometry, Volume LL : Steroids, terpenoids,
sugars and nriscellaneous classes' (Holden-Day, Inc : San Francisco, t964\.
a. Chapter 25,p.L65 -172
b. châpter 23,p,12L -132
Mass Spectrometry Data Centre, 'Eight Peak Index of Mass Spectta; Fourth
Editioru Volume 1., Parts L and 2', (The Royal Society of Chemistry:
Cambridge, 1991).
Sakurai, N., Yaguchf Y. and Inoue, T,, Phy tochemistry, 1987, 26, 2L7,
Dictionary of Organic Compounds,sth Edition" (Chapman and Hill:Londoru 1987).
Knight,S. A., Org, Magn. Reson.,1974,6,603
The lvlerck Index, 9th Edition, (Mercyk and Co.: New Jersey, USA).
The Aldrich Library of 13C and lH FT NIvIR Spectra., 7993, USA,
a. Edition 1, Volume 2, LL\SC
b. Edition 1, Volume 3,5694,
fenserç S.R., Lyse-Petersen, S.E. and Nielsen, B.l. Pltytochetnistry,I9T9, L8,
273
76
'7',7
78.
79.
80.
81.
82.
83. Lentz, P.I. and Rossman,M.G., I, Chem. Soc. D,,1969,t269.
200
84.
85.
86.
87.
88.
89.
90.
91,.
92.
93.
94.
95.
96.
97.
98.
References
Battersby, A.R., Kapil, R.S. and Southgate,R.,I.Chem. Soc. D.,1968,131,.
Battersby,4.R., Hall, E.S. and Southgate, P.-,1. Chent Soc. (C).,L969,72L.
Loew, P. and Arigoni, D,,l.Chem. Soc. D.,1968,137.
Inouye, H., Yoshida, T., Tobit+ S. and Okþawa, M.,Tetrahedron,7970,26,
3905.
Bianco, 4., Passacantilli, P, and Righi, G., /. Naf. Prod.,1983,315.
Iwasaki, S. and Nozog S., in'Natural Products Chemistry' (Nakanishi, K.,
Goto, T., Ito, S., Natori, S. and Nozoe, S., Eds, Kodansha Ltd: Tokyo,1.974\,
Vol 1, p 53.
Agrawal, P.K., 'Carbon-l-3 NMR of Flavonoids', (Elsevier Science
Publishefs B.V.: New York, 1989), p. 320,
Hiermann, A., Planta Medica,t982,45 (1),59
Beck, E., Scheibe, R. and Reiner. R,l. Plant Physiology,1989,90,13.
Ferrier, R,!,, I, Chem, S o c, P erkin T r øns. 1., 1962, 3544,
tshimaru, K., Nonaka, G.I. and Nishioka,l., Phy to chetn istr y ; L987, 26, TL47 .
DellaGrecâ,M-, Fiorentino,A., Monaco,P. and Previtera,L -, Sy ntheti c
C o mm u ni cat i o n s, 1.998, 28, 3693.
Lundgren,L.N., Popoff,T. and Theander,O., Act a Ch e tn i ca S candinaa ia,
1982,836,695.
Angyal, S.J. and Odier, L., Carbohydr. Res., t982,100, 43.
Chastrette, M. and Martin, J.C., Can.l . Che m,, 1981, 59, 907 .
20L

e
References
99 Bensory H.j.,'Microbiological Applications', (Wm. C. Brown Publishers:
usA, 1990):
a. p.78
b. p.134
100. Mosmann,T., I. lmmunol. Methods,1983, 65, 55
101. Hanserç M.8., Neilsen, S.E. and Berg, K., /. Immunol. Methods, L98% 119,
203-210.
102. Babich, H. and Borenfreund, E., l. Phar. 5ci,1990,79,592.
103. Matthews, N. and Neale, M.L., 'Cytotoxicity assays for Lumour necrosis
factor and lymphotoxins'in'Lymphokines and Interferons, a practical
approach', (Clements, M.I, Morris, A.G. and Ghearing, 4.I., Ed., HIRL
Press: Oxford, L987>, p22L-?25,
zQZ

Appendices
APPENDICES
AppendixA Botanical description of Scaeoolø spinescens.
From: 'Flora of Australia', Volume 35, (Australian Governrrtent
Publishing Service : Canberrtu 1992), p. 97 -99.t2
Scaeaola spinescens R.Br., Prodr. 586 (1810)
Crossototnø spinescens (R.Br.) Vriese , Natuurk, Verh. Holl. Maøtsch. Wetensch.
Haarlem ser. 2, 10: 36 (185a); Lobelia spineseens (R.Br.) Kuntze, Revis. Gen, Pl.2:
378 (1891). T: near the shores of Fowler Bay, [S.4.], R.Brorm; lecto: B};,{', fideR,C.Carolin, T elop ea 3: 49L (1990); isolecto; K,
S. oleoides DC., Prodr. 7(2): 512(1eeg); Crossotoma oleoides (DC.) Vriese,
Natuttrk. Verh. HoII. Maatsch. Wetensch, Haarletn ser.2, t0:37 (1854). T:
interior of N.S.W., A.Cunningham; holo: G-DC; iso: BM?,K.
S. lycoides DC., Prodr,T(2):512 (1839); Crossotoma lycoides (DC.) Vriese, Natuurk,Verh. Holl. Maatsch. Wetensch. IIaarlem ser. 2, 10: 38 (1854), T: Dampier
Archipelago, [W.4.], A.Cunningham; holo: G-DC; iso: K.
S. spinescens var-rufa E.Pritzel in F.L.E. Diels and E.Pritzel, Bof. lahrb. Sysf.35:
568 (1905). T: near Kaþoorlie, W.4., Nov. 1900, L.Diels 1'685; holo: ?B
(destroyed).
Illustrationsr K. Krause, Pflønzenr.54:137, fig.261F.-L (19f2); È.R.Rotherham et al.,
FL PL NeaT So¿¿fh Wales I S. Queensland 150, fig. 488 (1975); G.M.Cunningham
et al., Pl. W. Nezt South Wales 638 (1981).
Rigid, divaricate shrub to 2 m tall, glabrous or with substellate scurfy hairs,
greyish when youngi dwarf branchlets often spinescent. Leaves often clustered on
branchlets, sessile, obovate to linear, en[re, thick; lamina 9-36 mm long, 1-6 mm
wide. Flowers solitary in axils; peduncle slender, 5-20 mm long; bracteoles linear,
2-5 mm lor1g, +/- equal to ovary. Sepals rim-like, to L rnm long. Corolla 9-16 mm
long, scurfy or glabrous outside, densely bearded inside, white or yellowish,
occasionally with purple veins; barbulae broad, prominent, simple; wings to L
mm wide, laciniate.Indusium to 2 mm wide, with scattered hairs above. Fruit
203

Appendices
ovoid, 5-8 mm long, glabrous, black or purplish. n :8, W.j.Peacocþ Ptoc. Linn.
Soc. New South Wøles 88: I (1963). Currant Bush, Maroon Bush. Figs 40E, 53.
Occurs throughout the drier parts of all mainland States; grows on hillsides and
on stony plains. Flowers most of the year.
WA: c. 14.5 km N of Learmouttu A,S.George 1.278 (PERTH). N.T.: 3 km S of
Yuendumu, T .S.Henshall 2896 (DNA). S.A.: Dalhousie Springs, D.E.Symon 9324
(AD). Qld: Whynot Stn, c. 38 km WSW of Quilpie, l-5 Nov. 1954, L.S.Smith
(BRÐ. N.S.W.: Mt Oxley near Bourke, L3 luly 1958, C,K,lngrarn (NSW)' Vic':
Barneys Track, Hattah Lakes Natl Park, G.W,Anderson 16 (lvIEL).
A very variable species. The dwarf branchlets distinguish it from all other
shrubby species except S. tomentosa but that species has markedly stellate hairs
Used by Aborigines for various medicinal purposes including, in W.4., an
infusion from the form on the Eastern Goldfields for alleviating the pain of
eâncer (E,Reid, Rec, W, Austrø\, Pl, Used by Aboriginals as Medicinal Agents,
Western Ausfralian Institute of Technology, L977; E.V. Lassak and T.McCarthy,
Austral. Medicinal Pl. 138, 1983).
204
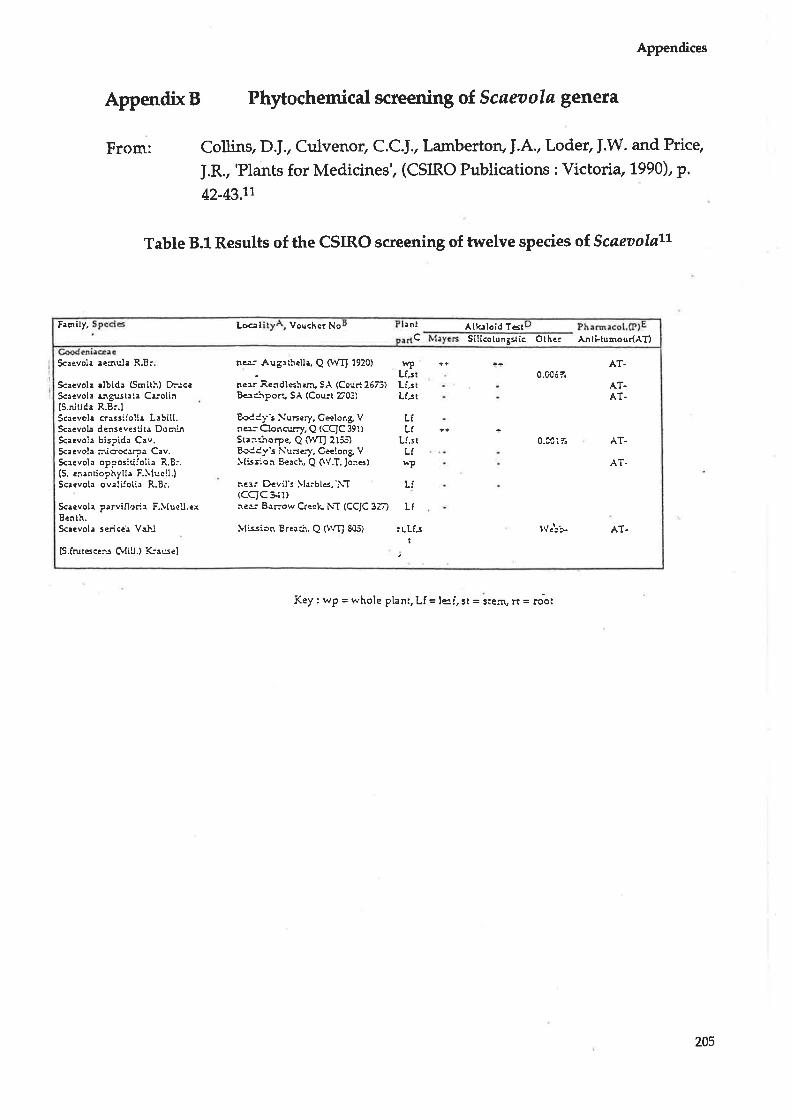
From:
Appendices
Appendix B Phytochemical screening of Scaeaola genera
Collins, D.f., Culvenor, C.C.I., Lalrtberton,I.A., Loder,I.W. and Price,
J.R., 'Plants for Medicines', (CSIRO Publications : Victona,1990),p.
42-43.11
Table 8.1 Results of the CSIRO screening of twelve species of. Scaeooløar
Key : wp = whole plant, Lf = le=f, s¡ = steh, rr = loot
Silicotunggic Othcr Ånli-tumour{AT)
Fenily, to<¡i Vouchcr No Alk¡loid Tet¿nt
c
S<¡evol¿ ¡lbid¡ (Smitl:) h¡ceSc¡evola ilB.Jst¡:å Cl-olin(S.nitiCa R.Br.lSc¡evola cr¡ss:l'olia L¿5ill.S<¡evoh denseves'ita DomhSc¡evola bispida Cav,Sca ¿vola r:rioo<¡¡:¡ C¡v-S<¡evola op=o:itilolia R.B:.(S. rnantioghyll¡ F.\fuell.lSc¡evola ovelifoli¡ R.Br.
EoC{y's Nur:ery, Cælong Vna- C,onc.lrry, Q (CgC 391)
Star-ùoçe, Q OY|J 213ÐB-tCv's Nureiy, Geelong V\fis:=.on Berch, Q GV.T. Jons)
n¿¡-- Devil's !f r.-b les,'i\T(cqc}{r)n¿- B¡now CreelÇ ¡\T (CCJC 32Ð
lfission Breacr, Q û\.fJ 605)
v{PLf.stLí,s tLf¡t
0.C/0ón
S<aevol¡ parvi[ì,rir F.]f ucll.¿x
l\t êlr'F AT.
AT.
Lf
Lf
S<¡evoia ae¿rula R,Er
(S,frutece:.s C\,fill.) Kausel
AT.
AT.
AT.AT.
na: Augrthella, Q GfIt 1920)
ne¡r R.erdlesharu SÅ (Cour.t 26ã)Be:ir¡>or., SA (Cou:t 203)
rt.Lf¡t
Bcnth.Sc¡evola seice'¡ Vall
LfLI
Lf,sl,LIhP
205