Determination of estrogenic potential in waste water without sample extraction
7
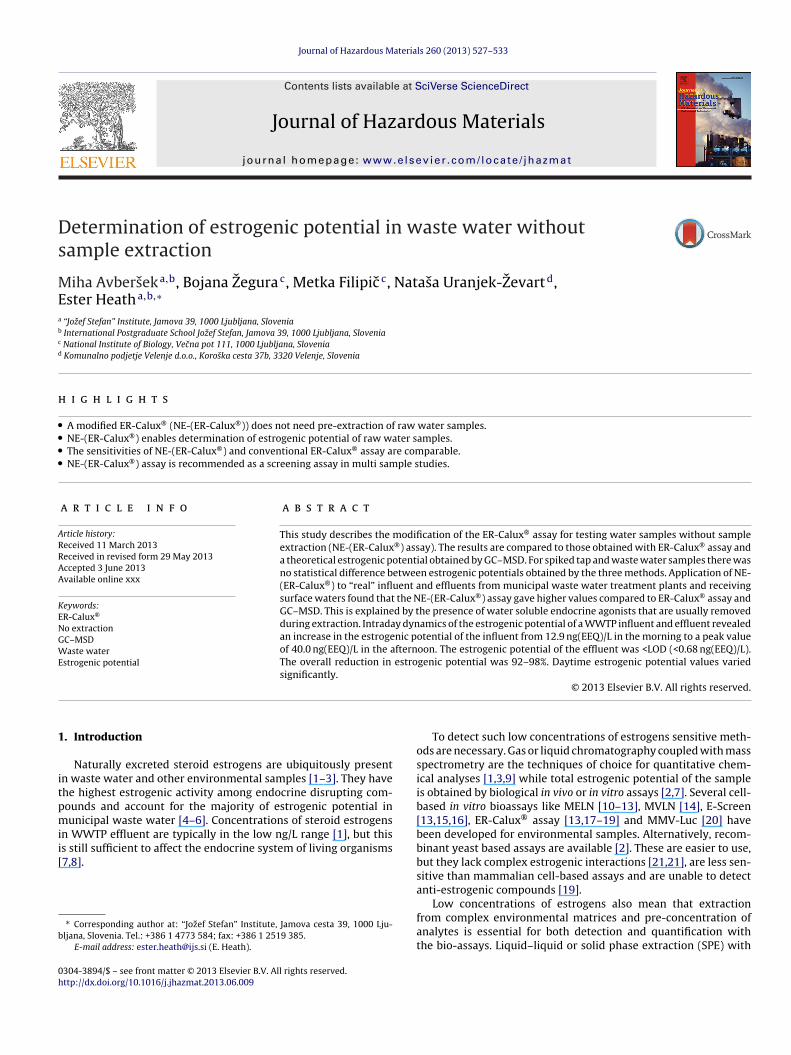
Journal of Hazardous Materials 260 (2013) 527–533 Contents lists available at SciVerse ScienceDirect Journal of Hazardous Materials jou rn al hom epage: www.elsevier.com/locate/jhazmat Determination of estrogenic potential in waste water without sample extraction Miha Avberˇ sek a,b , Bojana ˇ Zegura c , Metka Filipiˇ c c , Nataˇ sa Uranjek- ˇ Zevart d , Ester Heath a,b,∗ a “Joˇ zef Stefan” Institute, Jamova 39, 1000 Ljubljana, Slovenia b International Postgraduate School Joˇ zef Stefan, Jamova 39, 1000 Ljubljana, Slovenia c National Institute of Biology, Veˇ cna pot 111, 1000 Ljubljana, Slovenia d Komunalno podjetje Velenje d.o.o., Koroˇ ska cesta 37b, 3320 Velenje, Slovenia h i g h l i g h t s • A modified ER-Calux ® (NE-(ER-Calux ® )) does not need pre-extraction of raw water samples. • NE-(ER-Calux ® ) enables determination of estrogenic potential of raw water samples. • The sensitivities of NE-(ER-Calux ® ) and conventional ER-Calux ® assay are comparable. • NE-(ER-Calux ® ) assay is recommended as a screening assay in multi sample studies. a r t i c l e i n f o Article history: Received 11 March 2013 Received in revised form 29 May 2013 Accepted 3 June 2013 Available online xxx Keywords: ER-Calux ® No extraction GC–MSD Waste water Estrogenic potential a b s t r a c t This study describes the modification of the ER-Calux ® assay for testing water samples without sample extraction (NE-(ER-Calux ® ) assay). The results are compared to those obtained with ER-Calux ® assay and a theoretical estrogenic potential obtained by GC–MSD. For spiked tap and waste water samples there was no statistical difference between estrogenic potentials obtained by the three methods. Application of NE- (ER-Calux ® ) to “real” influent and effluents from municipal waste water treatment plants and receiving surface waters found that the NE-(ER-Calux ® ) assay gave higher values compared to ER-Calux ® assay and GC–MSD. This is explained by the presence of water soluble endocrine agonists that are usually removed during extraction. Intraday dynamics of the estrogenic potential of a WWTP influent and effluent revealed an increase in the estrogenic potential of the influent from 12.9 ng(EEQ)/L in the morning to a peak value of 40.0 ng(EEQ)/L in the afternoon. The estrogenic potential of the effluent was <LOD (<0.68 ng(EEQ)/L). The overall reduction in estrogenic potential was 92–98%. Daytime estrogenic potential values varied significantly. © 2013 Elsevier B.V. All rights reserved. 1. Introduction Naturally excreted steroid estrogens are ubiquitously present in waste water and other environmental samples [1–3]. They have the highest estrogenic activity among endocrine disrupting com- pounds and account for the majority of estrogenic potential in municipal waste water [4–6]. Concentrations of steroid estrogens in WWTP effluent are typically in the low ng/L range [1], but this is still sufficient to affect the endocrine system of living organisms [7,8]. ∗ Corresponding author at: “Joˇ zef Stefan” Institute, Jamova cesta 39, 1000 Lju- bljana, Slovenia. Tel.: +386 1 4773 584; fax: +386 1 2519 385. E-mail address: [email protected] (E. Heath). To detect such low concentrations of estrogens sensitive meth- ods are necessary. Gas or liquid chromatography coupled with mass spectrometry are the techniques of choice for quantitative chem- ical analyses [1,3,9] while total estrogenic potential of the sample is obtained by biological in vivo or in vitro assays [2,7]. Several cell- based in vitro bioassays like MELN [10–13], MVLN [14], E-Screen [13,15,16], ER-Calux ® assay [13,17–19] and MMV-Luc [20] have been developed for environmental samples. Alternatively, recom- binant yeast based assays are available [2]. These are easier to use, but they lack complex estrogenic interactions [21,21], are less sen- sitive than mammalian cell-based assays and are unable to detect anti-estrogenic compounds [19]. Low concentrations of estrogens also mean that extraction from complex environmental matrices and pre-concentration of analytes is essential for both detection and quantification with the bio-assays. Liquid–liquid or solid phase extraction (SPE) with 0304-3894/$ – see front matter © 2013 Elsevier B.V. All rights reserved. http://dx.doi.org/10.1016/j.jhazmat.2013.06.009
-
Upload
independent -
Category
Documents
-
view
0 -
download
0
Transcript of Determination of estrogenic potential in waste water without sample extraction
Ds
MEa
b
c
d
h
••••
ARRAA
KENGWE
1
itpmii[
b
0h
Journal of Hazardous Materials 260 (2013) 527– 533
Contents lists available at SciVerse ScienceDirect
Journal of Hazardous Materials
jou rn al hom epage: www.elsev ier .com/ locate / jhazmat
etermination of estrogenic potential in waste water withoutample extraction
iha Avberseka,b, Bojana Zegurac, Metka Filipic c, Natasa Uranjek-Zevartd,ster Heatha,b,∗
“Jozef Stefan” Institute, Jamova 39, 1000 Ljubljana, SloveniaInternational Postgraduate School Jozef Stefan, Jamova 39, 1000 Ljubljana, SloveniaNational Institute of Biology, Vecna pot 111, 1000 Ljubljana, SloveniaKomunalno podjetje Velenje d.o.o., Koroska cesta 37b, 3320 Velenje, Slovenia
i g h l i g h t s
A modified ER-Calux® (NE-(ER-Calux®)) does not need pre-extraction of raw water samples.NE-(ER-Calux®) enables determination of estrogenic potential of raw water samples.The sensitivities of NE-(ER-Calux®) and conventional ER-Calux® assay are comparable.NE-(ER-Calux®) assay is recommended as a screening assay in multi sample studies.
a r t i c l e i n f o
rticle history:eceived 11 March 2013eceived in revised form 29 May 2013ccepted 3 June 2013vailable online xxx
eywords:
a b s t r a c t
This study describes the modification of the ER-Calux® assay for testing water samples without sampleextraction (NE-(ER-Calux®) assay). The results are compared to those obtained with ER-Calux® assay anda theoretical estrogenic potential obtained by GC–MSD. For spiked tap and waste water samples there wasno statistical difference between estrogenic potentials obtained by the three methods. Application of NE-(ER-Calux®) to “real” influent and effluents from municipal waste water treatment plants and receivingsurface waters found that the NE-(ER-Calux®) assay gave higher values compared to ER-Calux® assay and
R-Calux®
o extractionC–MSDaste water
strogenic potential
GC–MSD. This is explained by the presence of water soluble endocrine agonists that are usually removedduring extraction. Intraday dynamics of the estrogenic potential of a WWTP influent and effluent revealedan increase in the estrogenic potential of the influent from 12.9 ng(EEQ)/L in the morning to a peak valueof 40.0 ng(EEQ)/L in the afternoon. The estrogenic potential of the effluent was <LOD (<0.68 ng(EEQ)/L).The overall reduction in estrogenic potential was 92–98%. Daytime estrogenic potential values variedsignificantly.
. Introduction
Naturally excreted steroid estrogens are ubiquitously presentn waste water and other environmental samples [1–3]. They havehe highest estrogenic activity among endocrine disrupting com-ounds and account for the majority of estrogenic potential inunicipal waste water [4–6]. Concentrations of steroid estrogens
n WWTP effluent are typically in the low ng/L range [1], but this
s still sufficient to affect the endocrine system of living organisms7,8].∗ Corresponding author at: “Jozef Stefan” Institute, Jamova cesta 39, 1000 Lju-ljana, Slovenia. Tel.: +386 1 4773 584; fax: +386 1 2519 385.
E-mail address: [email protected] (E. Heath).
304-3894/$ – see front matter © 2013 Elsevier B.V. All rights reserved.ttp://dx.doi.org/10.1016/j.jhazmat.2013.06.009
© 2013 Elsevier B.V. All rights reserved.
To detect such low concentrations of estrogens sensitive meth-ods are necessary. Gas or liquid chromatography coupled with massspectrometry are the techniques of choice for quantitative chem-ical analyses [1,3,9] while total estrogenic potential of the sampleis obtained by biological in vivo or in vitro assays [2,7]. Several cell-based in vitro bioassays like MELN [10–13], MVLN [14], E-Screen[13,15,16], ER-Calux® assay [13,17–19] and MMV-Luc [20] havebeen developed for environmental samples. Alternatively, recom-binant yeast based assays are available [2]. These are easier to use,but they lack complex estrogenic interactions [21,21], are less sen-sitive than mammalian cell-based assays and are unable to detectanti-estrogenic compounds [19].
Low concentrations of estrogens also mean that extractionfrom complex environmental matrices and pre-concentration ofanalytes is essential for both detection and quantification withthe bio-assays. Liquid–liquid or solid phase extraction (SPE) with
5 ardou
abdpbc
defitcsTgis
2
2
1dppa
wdGtf
Ggsew
TM
28 M. Avbersek et al. / Journal of Haz
dditional clean-up is generally applied for chemical analysis andioassays [2,22] and only a few published studies describe theetermination of estrogenic potential without extensive samplereparation and extraction. Of these the majority employ a recom-inant yeast assay [6,22,23] and just one applies a mammalianell-based assay (MELN cells) without presenting any results [10].
The aim of this study was to modify the ER-Calux® assay for theetermination of estrogenic potential of water samples withoutxtensive sample handling and extraction of analytes. The modi-ed method that we named NE-(ER-Calux®) assay, was tested withap and waste water samples spiked with steroid estrogens, andompared to conventional ER-Calux® assay and chemical analy-is with gas chromatography–mass selective detection (GC–MSD).he modified method was then applied for investigating estro-enic potential of “real” environmental samples and for studyingntraday dynamics of estrogenic potential in influent and effluentamples of WWTP.
. Materials and methods
.1. Standards, chemicals, growth media
Standards estrone (E1; min 99%), 17�-estradiol (E2; min 98%),7�-ethinylestradiol (EE2; min 98% (HPLC)), estriol (E3; min 99%), aeuterated internal standard (bisphenol A)-d16 (98 atom% D) wereurchased from Sigma (Steinheim, Germany). Standards were pre-ared freshly in ethyl acetate, for ER-Calux® assay calibration curvend in methanol for spiking water samples used for analyses.
Methanol, ethyl acetate “Baker ultra resi-analysed®” gradeere purchased from J.T. Baker (Deventer, the Netherlands). Pyri-ine (max 0.01% H2O) was purchased from Merck (Darmstadt,ermany). The derivatising agent N-methyl-N-(trimethylsilyl)-
rifluoroacetamide (MSTFA; derivatisation grade), was purchasedrom Sigma.
For ER-Calux® assay, media Gibco® D-MEM/F-12 withlutaMAXTM (with phenol red), Gibco® D-MEM/F-12 with l-
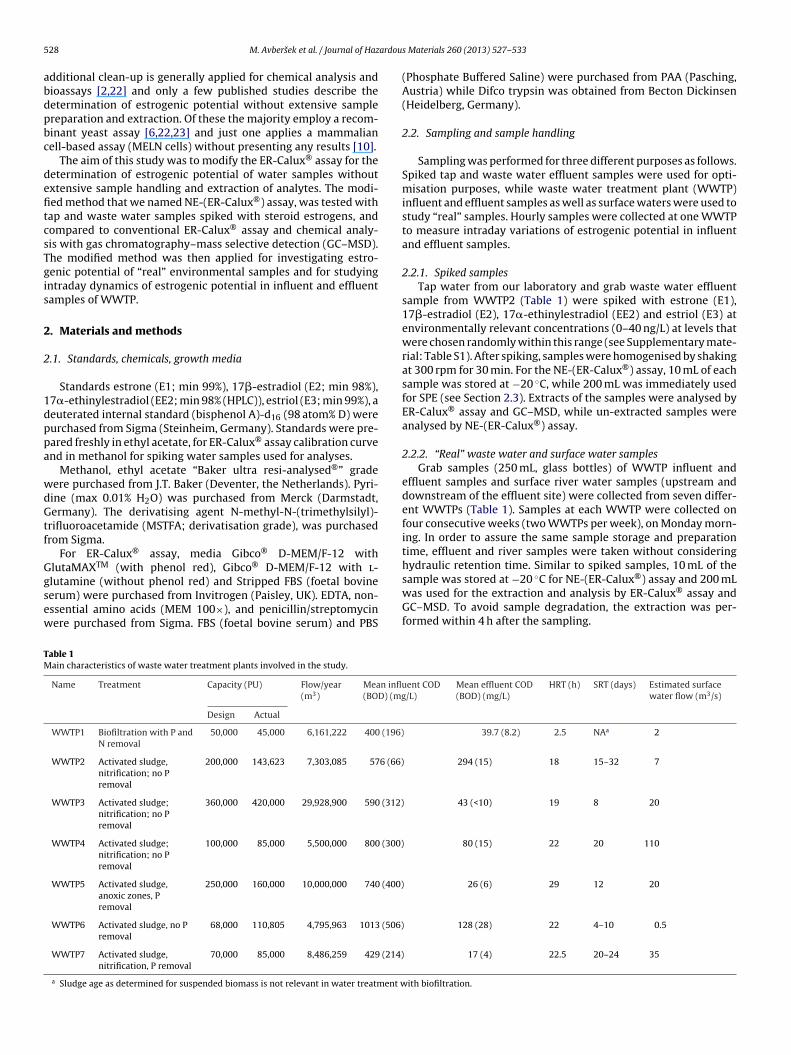
lutamine (without phenol red) and Stripped FBS (foetal bovineerum) were purchased from Invitrogen (Paisley, UK). EDTA, non-ssential amino acids (MEM 100×), and penicillin/streptomycinere purchased from Sigma. FBS (foetal bovine serum) and PBSable 1ain characteristics of waste water treatment plants involved in the study.
Name Treatment Capacity (PU) Flow/year(m3)
Mean influ(BOD) (mg
Design Actual
WWTP1 Biofiltration with P andN removal
50,000 45,000 6,161,222 400 (196)
WWTP2 Activated sludge,nitrification; no Premoval
200,000 143,623 7,303,085 576 (66)
WWTP3 Activated sludge;nitrification; no Premoval
360,000 420,000 29,928,900 590 (312)
WWTP4 Activated sludge;nitrification; no Premoval
100,000 85,000 5,500,000 800 (300)
WWTP5 Activated sludge,anoxic zones, Premoval
250,000 160,000 10,000,000 740 (400)
WWTP6 Activated sludge, no Premoval
68,000 110,805 4,795,963 1013 (506)
WWTP7 Activated sludge,nitrification, P removal
70,000 85,000 8,486,259 429 (214)
a Sludge age as determined for suspended biomass is not relevant in water treatment w
s Materials 260 (2013) 527– 533
(Phosphate Buffered Saline) were purchased from PAA (Pasching,Austria) while Difco trypsin was obtained from Becton Dickinsen(Heidelberg, Germany).
2.2. Sampling and sample handling
Sampling was performed for three different purposes as follows.Spiked tap and waste water effluent samples were used for opti-misation purposes, while waste water treatment plant (WWTP)influent and effluent samples as well as surface waters were used tostudy “real” samples. Hourly samples were collected at one WWTPto measure intraday variations of estrogenic potential in influentand effluent samples.
2.2.1. Spiked samplesTap water from our laboratory and grab waste water effluent
sample from WWTP2 (Table 1) were spiked with estrone (E1),17�-estradiol (E2), 17�-ethinylestradiol (EE2) and estriol (E3) atenvironmentally relevant concentrations (0–40 ng/L) at levels thatwere chosen randomly within this range (see Supplementary mate-rial: Table S1). After spiking, samples were homogenised by shakingat 300 rpm for 30 min. For the NE-(ER-Calux®) assay, 10 mL of eachsample was stored at −20 ◦C, while 200 mL was immediately usedfor SPE (see Section 2.3). Extracts of the samples were analysed byER-Calux® assay and GC–MSD, while un-extracted samples wereanalysed by NE-(ER-Calux®) assay.
2.2.2. “Real” waste water and surface water samplesGrab samples (250 mL, glass bottles) of WWTP influent and
effluent samples and surface river water samples (upstream anddownstream of the effluent site) were collected from seven differ-ent WWTPs (Table 1). Samples at each WWTP were collected onfour consecutive weeks (two WWTPs per week), on Monday morn-ing. In order to assure the same sample storage and preparationtime, effluent and river samples were taken without consideringhydraulic retention time. Similar to spiked samples, 10 mL of the
sample was stored at −20 ◦C for NE-(ER-Calux®) assay and 200 mLwas used for the extraction and analysis by ER-Calux® assay andGC–MSD. To avoid sample degradation, the extraction was per-formed within 4 h after the sampling.ent COD/L)
Mean effluent COD(BOD) (mg/L)
HRT (h) SRT (days) Estimated surfacewater flow (m3/s)
39.7 (8.2) 2.5 NAa 2
294 (15) 18 15–32 7
43 (<10) 19 8 20
80 (15) 22 20 110
26 (6) 29 12 20
128 (28) 22 4–10 0.5
17 (4) 22.5 20–24 35
ith biofiltration.
ardou
2
sa72awuaSi(
pd(nt
2
daw(((
2
EG[uwbu
2
eatm7cmgac9b“wwomawnar
M. Avbersek et al. / Journal of Haz
.2.3. Intraday waste water samples from WWTP1In this part of the study, samples were taken at WWTP1. Hourly
amples and time proportional samples were collected at influentnd effluent site. Grab influent samples were taken every hour from:00 to 19:00. Appropriate effluent samples were taken within a.5 h shift (9:30–21:30) according to the hydraulic retention timet WWTP1 (Table 1). Hourly waste water samples were analysedith NE-(ER-Calux®) assay only and therefore, 10 mL of sample vol-me was sampled in polypropylene flasks. Samples were storedt −20 ◦C and were analysed the next morning as described inection 2.6. Time proportional samples for the whole samplingnterval (sampling every 15 min) were collected from the influent7:00–19:00) and effluent (9:30–21:30) and analysed as well.
To check the stability of water treatment system the followingarameters were monitored: temperature, pH, chemical oxygenemand – COD (sensor name: UVAS), dissolved oxygen – O2LDO), ammonium – NH4 (AMTAX), phosphates – PO4 (PHOSPHAX),itrates – NO3 (NITRAX) were measured with HACH LANGE con-roller system (Düsseldorf, Germany).
.3. Sample extraction
Sample extraction for ER-Calux® and GC–MSD was performed asescribed by Avbersek et al. [24,25]. Samples (200 mL) were filterednd afterwards extracted with SPE (Waters, Oasis HLB) and elutedith ethyl acetate. Extracts were cleaned-up on silica-gel cartridges
Biotage, Isolute SI), dried, reconstituted in ethyl acetate and used10%) for ER-Calux® assay. The remainder of the sample extract90%) was derivatised and used for GC–MSD analysis.
.4. GC–MSD
All spiked and “real” sample extracts (90%) that remain afterR-Calux® assay were derivatised with MSTFA and analysed withC–MSD (HP 6890 Series, Hewlet-Packard, Waldbron, Germany)
24]. Separation was achieved on a HP5-MS column. SIM mode wassed for quantification of E1, E2, EE2 and E3. Estrogenic potentialas calculated from concentrations of each compound as described
y Avbersek et al. [25]. Validation of the method was performedsing tap and waste water as a matrix [24,25].
.5. Determination of estrogenic potential with ER-Calux® assay
The ER-Calux® assay was performed as described by Avbersekt al. [25]. Briefly, T47D-EREtata-Luc cells were used (providednd licenced by BioDetection Systems (BDS) b.v. Amsterdam,he Netherlands) and maintained at 37 ◦C; 5% CO2 in “Growth
edium” (D-MEM/F12; GlutaMAXTM; phenol red as pH indicator;.5% FBS, 1% nonessential amino acids (MEM) and a 0.2% peni-illin/streptomycin solution). For the assay purposes the “Growthedium” was replaced with the “Test medium” (D-MEM/F12; l-
lutamine; without phenol red; 5% stripped FBS, 1% nonessentialmino acids (MEM) and 0.2% penicillin/streptomycin solution). Theells in the “Test medium” were seeded (10,000 cells/well) into6-well white microtiter plates (Nunc, Roskilde, Denmark), incu-ated for 24 h (37 ◦C), then the medium was replaced with freshTest medium” and incubated for additional 24 h. The mediumas then replaced with 100 �L of “Test medium”, supplementedith 0.1% sample extracts corresponding to 1 �L of sample extract
r its dilution (1:1, 1:3, 1:10, 1:30 and 1:100) in 1 mL of “Testedium”. E2 (0.6–30 pM/well) was used the calibration standard
nd 0.1 vol% ethyl acetate as the solvent control. All the samples
ere tested in triplicate wells. After 24 h incubation, the lumi-escence kit “Steadylite plusTM” (Perkin Elmer, Shelton, USA) wasdded (100 �L) to the medium and gently shaken for 15 min atoom temperature. Luminescence was measured using a TECANs Materials 260 (2013) 527– 533 529
luminometer (top reading plate reader) with a set integrationtime of 4000 ms and a gain of 200 (Tecan Genios, Maennedorf,Switzerland).
Results expressed in relative luminescent units (RLU) wereprocessed using a sigmoidal calibration curve constructed witha MS Excel template (provided by BDS) together with an add-in“Solver”. The E2 equivalents (EEQ) were calculated as described byAvbersek et al. [25].
LOD (0.136 ng(EEQ)/L (=0.5 pM)) and LOQ (0.409 ng(EEQ)/L(=1.5 pM)) of ER-Calux® assay was determined by manufacturer ofthe assay (BDS, b.v.) on the basis of their long term experience withthe assay. However, LODs and LOQs were also determined fromcalibration curve each time the assay was performed. These valueswere only used to test the performance of the bioassay. There-fore, together with concentration factor of SPE–ER Calux® (0.2×),limits of detection (LOD) and quantification (LOQ) assay were0.68 ng(EEQ)/L and 2.05 ng(EEQ)/L, respectively. Recovery (97 %),and repeatability (4%) were determined with tap water (n = 5),spiked with E2 (c = 4.09 ng/L (=15 pM)) [25].
2.5.1. NE-(ER-Calux®) assayThe standard ER-Calux® assay has been adapted for testing the
water samples without prior extraction and we named it NE-(ER-Calux®) assay. The frozen samples (10 mL) were thawed, sterilisedby filtration (Whatman, ANOTOP25, pore size 0.2 �m) and diluted1:1, 1:3, 1:10, 1:30 and 1:100 with PBS. For the cell treatment20 vol% of diluted samples were mixed with “Test medium”. Forthe control “Test medium” was mixed with 20 vol% PBS and for thecalibration E2 was added (final concentrations 0.3, 0.6, 1, 3, 6, 10,and 30 pM/well). Further steps of the assay were the same as in theconventional ER-Calux® assay.
In comparison to ER-Calux®, no significant difference wasobserved in LODs and LOQs determined from standard calibra-tion curve performed on each test plate. For that reason, wekeep the same LOD and LOQ for NE-(ER-Calux®) as well. Togetherwith concentration factor (0.2×), limit of detection (LOD) andquantification (LOQ) of NE-(ER-Calux®) assay were 0.68 ng(EEQ)/Land 2.05 ng(EEQ)/L, respectively. Recovery (92%), and repeatabil-ity (5%) were determined with tap water (n = 5), spiked with E2(c = 4.09 ng/L (=15 pM)).
2.6. Toxicity testing
MTT assay was used for toxicity testing of all waste watersamples. MTT assay was performed on ER-Calux® cells accord-ing to Mosmann [26] with minor modifications [27]. ER-Calux®
cells were exposed to the samples in the same way as inER-Calux® or NE-(ER-Calux®) assays. However, instead of theluminescence kit, MTT reagent was added after 24 h exposure.After 3 h incubation, the difference in optical density at 570 and690 nm wavelength was measured (Tecan Genios, Maennedorf,Switzerland). The results were compared to control sample(20% PBS).
3. Results and discussion
3.1. LOD and LOQ
LOD and LOQ of methods with and without extraction are thesame, since the same bioassay, same concentration factor and assaydilutions are used. We have shown that in case of testing the wastewaters, both assays are appropriate to use. However, in surface and
tap water expected concentrations of steroid estrogens are muchlower than in waste water influent and effluent (< 0.5 ng/L) andtherefore the improvement of LOD is necessary. Despite time con-suming, SPE concentration factor can be raised to 1000× or 10,000×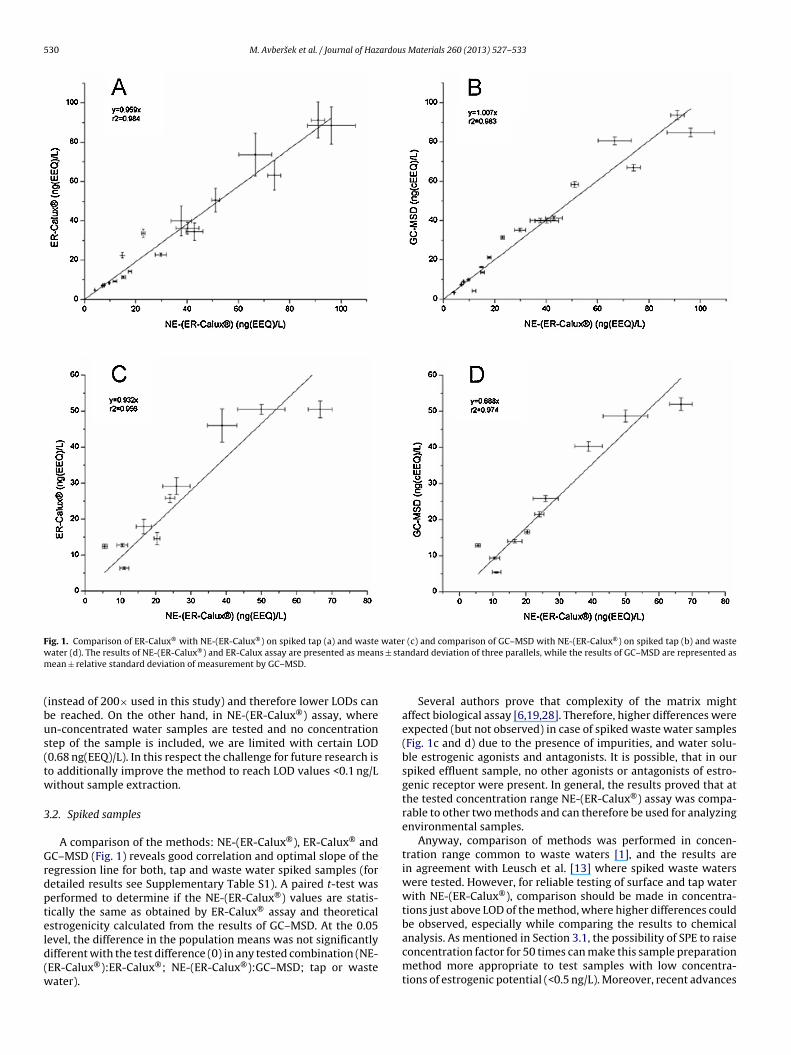
530 M. Avbersek et al. / Journal of Hazardous Materials 260 (2013) 527– 533
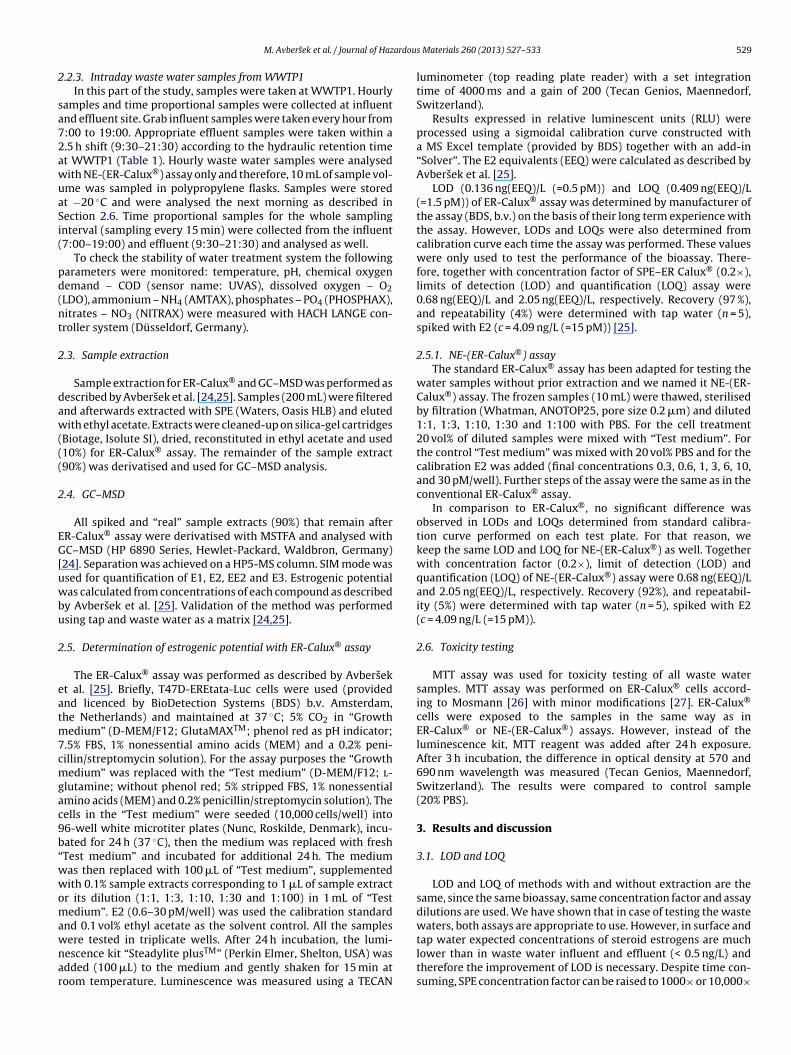
Fig. 1. Comparison of ER-Calux® with NE-(ER-Calux®) on spiked tap (a) and waste water (c) and comparison of GC–MSD with NE-(ER-Calux®) on spiked tap (b) and wastew s ± stam
(bus(tw
3
Grdpteld(w
ater (d). The results of NE-(ER-Calux®) and ER-Calux assay are presented as meanean ± relative standard deviation of measurement by GC–MSD.
instead of 200× used in this study) and therefore lower LODs cane reached. On the other hand, in NE-(ER-Calux®) assay, wheren-concentrated water samples are tested and no concentrationtep of the sample is included, we are limited with certain LOD0.68 ng(EEQ)/L). In this respect the challenge for future research iso additionally improve the method to reach LOD values <0.1 ng/Lithout sample extraction.
.2. Spiked samples
A comparison of the methods: NE-(ER-Calux®), ER-Calux® andC–MSD (Fig. 1) reveals good correlation and optimal slope of the
egression line for both, tap and waste water spiked samples (foretailed results see Supplementary Table S1). A paired t-test waserformed to determine if the NE-(ER-Calux®) values are statis-ically the same as obtained by ER-Calux® assay and theoreticalstrogenicity calculated from the results of GC–MSD. At the 0.05
evel, the difference in the population means was not significantlyifferent with the test difference (0) in any tested combination (NE-ER-Calux®):ER-Calux®; NE-(ER-Calux®):GC–MSD; tap or wasteater).ndard deviation of three parallels, while the results of GC–MSD are represented as
Several authors prove that complexity of the matrix mightaffect biological assay [6,19,28]. Therefore, higher differences wereexpected (but not observed) in case of spiked waste water samples(Fig. 1c and d) due to the presence of impurities, and water solu-ble estrogenic agonists and antagonists. It is possible, that in ourspiked effluent sample, no other agonists or antagonists of estro-genic receptor were present. In general, the results proved that atthe tested concentration range NE-(ER-Calux®) assay was compa-rable to other two methods and can therefore be used for analyzingenvironmental samples.
Anyway, comparison of methods was performed in concen-tration range common to waste waters [1], and the results arein agreement with Leusch et al. [13] where spiked waste waterswere tested. However, for reliable testing of surface and tap waterwith NE-(ER-Calux®), comparison should be made in concentra-tions just above LOD of the method, where higher differences couldbe observed, especially while comparing the results to chemical
analysis. As mentioned in Section 3.1, the possibility of SPE to raiseconcentration factor for 50 times can make this sample preparationmethod more appropriate to test samples with low concentra-tions of estrogenic potential (<0.5 ng/L). Moreover, recent advances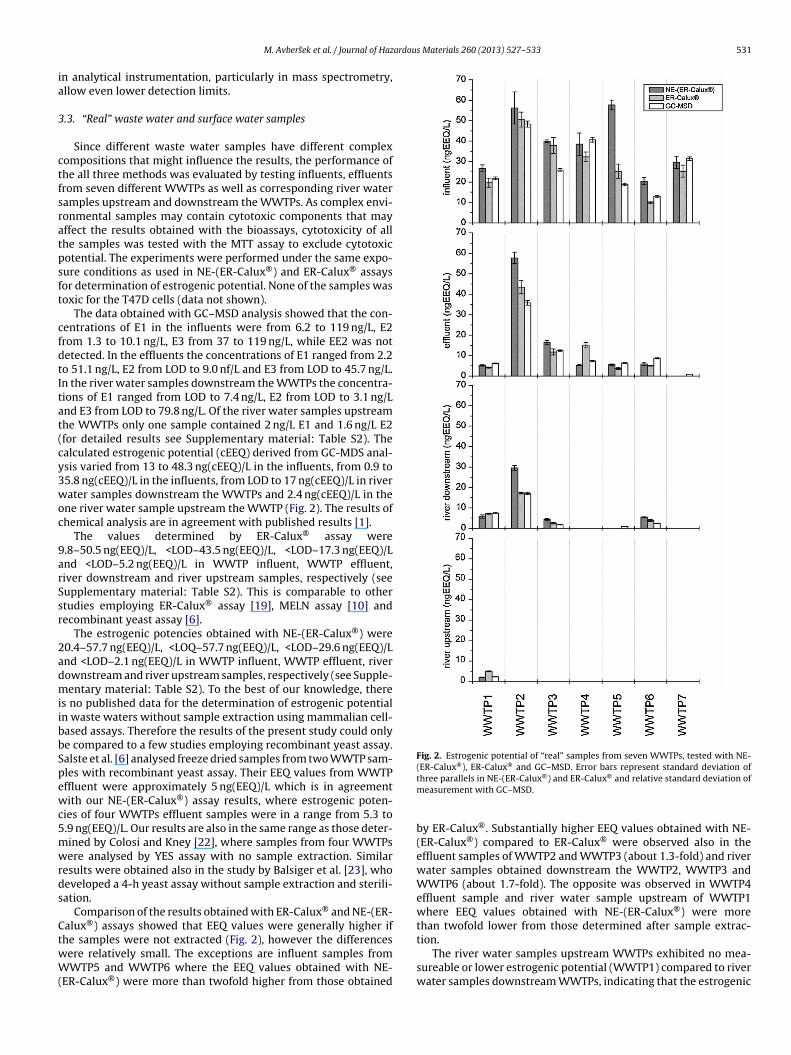
ardous Materials 260 (2013) 527– 533 531
ia
3
ctfsratpsft
cfdtItat(cy3woc
9arSsr
2admiibbSpewc5mwrds
CtwW(
Fig. 2. Estrogenic potential of “real” samples from seven WWTPs, tested with NE-(ER-Calux®), ER-Calux® and GC–MSD. Error bars represent standard deviation of
M. Avbersek et al. / Journal of Haz
n analytical instrumentation, particularly in mass spectrometry,llow even lower detection limits.
.3. “Real” waste water and surface water samples
Since different waste water samples have different complexompositions that might influence the results, the performance ofhe all three methods was evaluated by testing influents, effluentsrom seven different WWTPs as well as corresponding river wateramples upstream and downstream the WWTPs. As complex envi-onmental samples may contain cytotoxic components that mayffect the results obtained with the bioassays, cytotoxicity of allhe samples was tested with the MTT assay to exclude cytotoxicotential. The experiments were performed under the same expo-ure conditions as used in NE-(ER-Calux®) and ER-Calux® assaysor determination of estrogenic potential. None of the samples wasoxic for the T47D cells (data not shown).
The data obtained with GC–MSD analysis showed that the con-entrations of E1 in the influents were from 6.2 to 119 ng/L, E2rom 1.3 to 10.1 ng/L, E3 from 37 to 119 ng/L, while EE2 was notetected. In the effluents the concentrations of E1 ranged from 2.2o 51.1 ng/L, E2 from LOD to 9.0 nf/L and E3 from LOD to 45.7 ng/L.n the river water samples downstream the WWTPs the concentra-ions of E1 ranged from LOD to 7.4 ng/L, E2 from LOD to 3.1 ng/Lnd E3 from LOD to 79.8 ng/L. Of the river water samples upstreamhe WWTPs only one sample contained 2 ng/L E1 and 1.6 ng/L E2for detailed results see Supplementary material: Table S2). Thealculated estrogenic potential (cEEQ) derived from GC-MDS anal-sis varied from 13 to 48.3 ng(cEEQ)/L in the influents, from 0.9 to5.8 ng(cEEQ)/L in the influents, from LOD to 17 ng(cEEQ)/L in riverater samples downstream the WWTPs and 2.4 ng(cEEQ)/L in the
ne river water sample upstream the WWTP (Fig. 2). The results ofhemical analysis are in agreement with published results [1].
The values determined by ER-Calux® assay were.8–50.5 ng(EEQ)/L, <LOD–43.5 ng(EEQ)/L, <LOD–17.3 ng(EEQ)/Lnd <LOD–5.2 ng(EEQ)/L in WWTP influent, WWTP effluent,iver downstream and river upstream samples, respectively (seeupplementary material: Table S2). This is comparable to othertudies employing ER-Calux® assay [19], MELN assay [10] andecombinant yeast assay [6].
The estrogenic potencies obtained with NE-(ER-Calux®) were0.4–57.7 ng(EEQ)/L, <LOQ–57.7 ng(EEQ)/L, <LOD–29.6 ng(EEQ)/Lnd <LOD–2.1 ng(EEQ)/L in WWTP influent, WWTP effluent, riverownstream and river upstream samples, respectively (see Supple-entary material: Table S2). To the best of our knowledge, there
s no published data for the determination of estrogenic potentialn waste waters without sample extraction using mammalian cell-ased assays. Therefore the results of the present study could onlye compared to a few studies employing recombinant yeast assay.alste et al. [6] analysed freeze dried samples from two WWTP sam-les with recombinant yeast assay. Their EEQ values from WWTPffluent were approximately 5 ng(EEQ)/L which is in agreementith our NE-(ER-Calux®) assay results, where estrogenic poten-
ies of four WWTPs effluent samples were in a range from 5.3 to.9 ng(EEQ)/L. Our results are also in the same range as those deter-ined by Colosi and Kney [22], where samples from four WWTPsere analysed by YES assay with no sample extraction. Similar
esults were obtained also in the study by Balsiger et al. [23], whoeveloped a 4-h yeast assay without sample extraction and sterili-ation.
Comparison of the results obtained with ER-Calux® and NE-(ER-alux®) assays showed that EEQ values were generally higher if
he samples were not extracted (Fig. 2), however the differencesere relatively small. The exceptions are influent samples fromWTP5 and WWTP6 where the EEQ values obtained with NE-ER-Calux®) were more than twofold higher from those obtained
three parallels in NE-(ER-Calux®) and ER-Calux® and relative standard deviation ofmeasurement with GC–MSD.
by ER-Calux®. Substantially higher EEQ values obtained with NE-(ER-Calux®) compared to ER-Calux® were observed also in theeffluent samples of WWTP2 and WWTP3 (about 1.3-fold) and riverwater samples obtained downstream the WWTP2, WWTP3 andWWTP6 (about 1.7-fold). The opposite was observed in WWTP4effluent sample and river water sample upstream of WWTP1where EEQ values obtained with NE-(ER-Calux®) were morethan twofold lower from those determined after sample extrac-tion.
The river water samples upstream WWTPs exhibited no mea-sureable or lower estrogenic potential (WWTP1) compared to riverwater samples downstream WWTPs, indicating that the estrogenic
5 ardou
pweTei
(seememoilawAwisaapsa
3s
eewiesp2ao<
32 M. Avbersek et al. / Journal of Haz
otential was most likely a result of components present in wasteater effluent. This was especially observed in the cases where
ffluent is discharged to smaller surface waters (WWTP 1, 2 and 6).he estrogenic potential in these river water downstream samplesxceed 50% of the estrogenic potential detected in the correspond-ng effluent sample.
Similar values of estimated estrogenic activity by GC–MSDcEEQ) and the results of NE-(ER-Calux®) and ER-Calux® assaysuggest that the estrogenic potential in our samples can bexplained by the four most ubiquitous and naturally presentstrogenic compounds (E1, E2, EE2 and E3). This is in agree-ent with other studies [4,6,12]. However, in case of WWTP6
ffluent sample, theoretical estrogenic potential was higher thaneasured in both bioassays, possibly due to the presence of antag-
nists in the sample. On the other hand, in WWTP3 and WWTP5nfluent and WWTP2 effluent samples the GC–MSD result wasower than the EEQ values of NE-(ER-Calux®) and ER-Calux®
ssays. This might be due to the possible presence of agonists inaste water sample that were not detected with the GC–MSD.lso the observed differences between the EEQ values obtainedith extracted and non-extracted samples of WWTP5 and WWTP6
nfluents, WWTP2 and WWTP4 effluents, river water sample down-tream WWTP2 and river water sample upstream suggest that inddition to steroid estrogens unidentified water soluble agonistss well as antagonist may be present in samples. Such com-ounds cannot be efficiently extracted with SPE, together withteroid estrogens, and are therefore undetectable with ER-Calux®
ssay.
.4. Intraday variability of estrogenic potential of waste wateramples
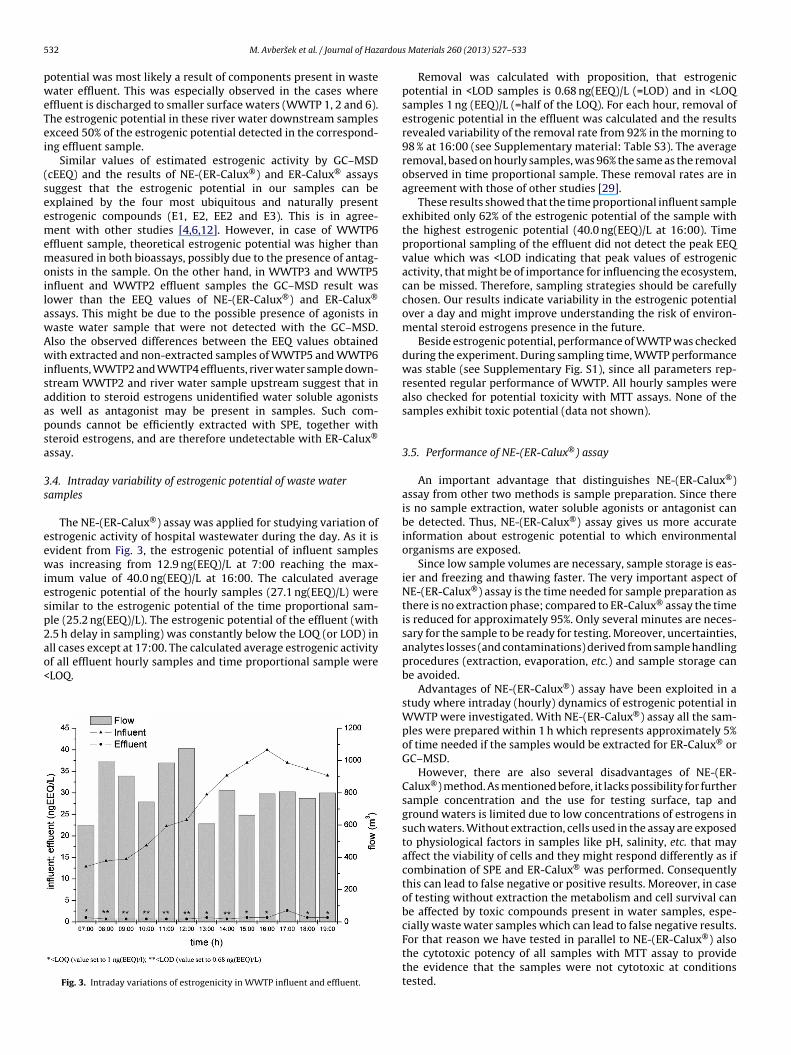
The NE-(ER-Calux®) assay was applied for studying variation ofstrogenic activity of hospital wastewater during the day. As it isvident from Fig. 3, the estrogenic potential of influent samplesas increasing from 12.9 ng(EEQ)/L at 7:00 reaching the max-
mum value of 40.0 ng(EEQ)/L at 16:00. The calculated averagestrogenic potential of the hourly samples (27.1 ng(EEQ)/L) wereimilar to the estrogenic potential of the time proportional sam-le (25.2 ng(EEQ)/L). The estrogenic potential of the effluent (with
.5 h delay in sampling) was constantly below the LOQ (or LOD) inll cases except at 17:00. The calculated average estrogenic activityf all effluent hourly samples and time proportional sample wereLOQ.Fig. 3. Intraday variations of estrogenicity in WWTP influent and effluent.
s Materials 260 (2013) 527– 533
Removal was calculated with proposition, that estrogenicpotential in <LOD samples is 0.68 ng(EEQ)/L (=LOD) and in <LOQsamples 1 ng (EEQ)/L (=half of the LOQ). For each hour, removal ofestrogenic potential in the effluent was calculated and the resultsrevealed variability of the removal rate from 92% in the morning to98 % at 16:00 (see Supplementary material: Table S3). The averageremoval, based on hourly samples, was 96% the same as the removalobserved in time proportional sample. These removal rates are inagreement with those of other studies [29].
These results showed that the time proportional influent sampleexhibited only 62% of the estrogenic potential of the sample withthe highest estrogenic potential (40.0 ng(EEQ)/L at 16:00). Timeproportional sampling of the effluent did not detect the peak EEQvalue which was <LOD indicating that peak values of estrogenicactivity, that might be of importance for influencing the ecosystem,can be missed. Therefore, sampling strategies should be carefullychosen. Our results indicate variability in the estrogenic potentialover a day and might improve understanding the risk of environ-mental steroid estrogens presence in the future.
Beside estrogenic potential, performance of WWTP was checkedduring the experiment. During sampling time, WWTP performancewas stable (see Supplementary Fig. S1), since all parameters rep-resented regular performance of WWTP. All hourly samples werealso checked for potential toxicity with MTT assays. None of thesamples exhibit toxic potential (data not shown).
3.5. Performance of NE-(ER-Calux®) assay
An important advantage that distinguishes NE-(ER-Calux®)assay from other two methods is sample preparation. Since thereis no sample extraction, water soluble agonists or antagonist canbe detected. Thus, NE-(ER-Calux®) assay gives us more accurateinformation about estrogenic potential to which environmentalorganisms are exposed.
Since low sample volumes are necessary, sample storage is eas-ier and freezing and thawing faster. The very important aspect ofNE-(ER-Calux®) assay is the time needed for sample preparation asthere is no extraction phase; compared to ER-Calux® assay the timeis reduced for approximately 95%. Only several minutes are neces-sary for the sample to be ready for testing. Moreover, uncertainties,analytes losses (and contaminations) derived from sample handlingprocedures (extraction, evaporation, etc.) and sample storage canbe avoided.
Advantages of NE-(ER-Calux®) assay have been exploited in astudy where intraday (hourly) dynamics of estrogenic potential inWWTP were investigated. With NE-(ER-Calux®) assay all the sam-ples were prepared within 1 h which represents approximately 5%of time needed if the samples would be extracted for ER-Calux® orGC–MSD.
However, there are also several disadvantages of NE-(ER-Calux®) method. As mentioned before, it lacks possibility for furthersample concentration and the use for testing surface, tap andground waters is limited due to low concentrations of estrogens insuch waters. Without extraction, cells used in the assay are exposedto physiological factors in samples like pH, salinity, etc. that mayaffect the viability of cells and they might respond differently as ifcombination of SPE and ER-Calux® was performed. Consequentlythis can lead to false negative or positive results. Moreover, in caseof testing without extraction the metabolism and cell survival canbe affected by toxic compounds present in water samples, espe-cially waste water samples which can lead to false negative results.
For that reason we have tested in parallel to NE-(ER-Calux®) alsothe cytotoxic potency of all samples with MTT assay to providethe evidence that the samples were not cytotoxic at conditionstested.
ardou
4
esaaegCbssm
A
g0gs
A
i2
R
[
[
[
[
[
[
[
[
[
[
[
[
[
[
[
[
[
[
[
M. Avbersek et al. / Journal of Haz
. Conclusions
One of the difficulties in environmental monitoring for the pres-nce of endocrine disruptors are expensive and time consumingample preparation methods required for chemical analysis as wells for biological testing. In this study we modified the ER-Calux®
ssay to enable direct determination of estrogenic potential of rawnvironmental samples. We confirmed that NE-(ER-Calux®) assayives results comparable to those obtained with conventional ER-alux® assay and theoretical estrogenic potential (cEEQ) obtainedy chemical analysis with GC–MSD. As NE-(ER-Calux®) assay isimple, fast and gives reliable results it can be recommended ascreening assay in multi sample studies and for environmentalonitoring, especially for testing waste waters.
cknowledgements
The authors would like to acknowledge the financial supportiven by Slovenian Research Agency (Program groups P1-0143, P1-245, Projects J1-0005 and L1 5457 as well as young researcherrant to Miha Avbersek). We would also like to thank all the repre-entatives from WWTPs for their support.
ppendix A. Supplementary data
Supplementary data associated with this article can be found,n the online version, at http://dx.doi.org/10.1016/j.jhazmat.013.06.009.
eferences
[1] C. Miège, J.M. Choubert, L. Ribeiro, M. Eusèbe, M. Coquery, Fate of pharmaceut-icals and personal care products in wastewater treatment plants – conceptionof a database and first results, Environ. Pollut. 157 (2009) 1721–1726.
[2] G. Streck, Chemical and biological analysis of estrogenic, progestagenic andandrogenic steroids in the environment, TrAC – Trends Anal. Chem. 28 (2009)635–652.
[3] G. Sándor, Advances in the analysis of steroid hormone drugs in pharma-ceuticals and environmental samples (2004–2010), J. Pharm. Biomed. Anal. 55(2011) 728–743.
[4] H.-R. Aerni, B. Kobler, B. Rutishauser, F. Wettstein, R. Fischer, W. Giger, A.Hungerbühler, M.D. Marazuela, A. Peter, R. Schönenberger, A.C. Vögeli, M.F.Suter, R.L. Eggen, Combined biological and chemical assessment of estrogenicactivities in wastewater treatment plant effluents, Anal. Bioanal. Chem. 378(2004) 688–696.
[5] T. Furuichi, K. Kannan, J.P. Giesy, S. Masunaga, Contribution of known endocrinedisrupting substances to the estrogenic activity in Tama River water samplesfrom Japan using instrumental analysis and in vitro reporter gene assay, WaterRes. 38 (2004) 4491–4501.
[6] L. Salste, P. Leskinen, M. Virta, L. Kronberg, Determination of estrogens andestrogenic activity in wastewater effluent by chemical analysis and the biolu-minescent yeast assay, Sci. Total Environ. 378 (2007) 343–351.
[7] C.G. Campbell, S.E. Borglin, F.B. Green, A. Grayson, E. Wozei, W.T. Stringfellow,Biologically directed environmental monitoring, fate, and transport of estro-
genic endocrine disrupting compounds in water: a review, Chemosphere 65(2006) 1265–1280.[8] E.J. Routledge, D. Sheahan, C. Desbrow, G.C. Brighty, M. Waldock, J.P. Sumpter,Identification of estrogenic chemicals in STW effluent. 2. In vivo responses introut and roach, Environ. Sci. Technol. 32 (1998) 1559–1565.
[
s Materials 260 (2013) 527– 533 533
[9] V. Gabet, C. Miège, P. Bados, M. Coquery, Analysis of estrogens in environmentalmatrices, TrAC – Trends Anal. Chem. 26 (2007) 1113–1131.
10] M. Cargouët, D. Perdiz, A. Mouatassim-Souali, S. Tamisier-Karolak, Y. Levi,Assessment of river contamination by estrogenic compounds in Paris area(France), Sci. Total Environ. 324 (2004) 55–66.
11] M.L. Jugan, L. Oziol, M. Bimbot, V. Huteau, S. Tamisier-Karolak, J.P. Blondeau,Y. Lévi, In vitro assessment of thyroid and estrogenic endocrine disruptors inwastewater treatment plants, rivers and drinking water supplies in the greaterParis area (France), Sci. Total Environ. 407 (2009) 3579–3587.
12] C. Miège, V. Gabet, M. Coquery, S. Karolak, M.L. Jugan, L. Oziol, Y. Levi, M.Chevreuil, Evaluation of estrogenic disrupting potency in aquatic environmentsand urban wastewaters by combining chemical and biological analysis, TrAC –Trends Anal. Chem. 28 (2009) 186–195.
13] F.D.L. Leusch, C. de Jager, Y. Levi, R. Lim, L. Puijker, F. Sacher, L.A. Tremblay,V.S. Wilson, H.F. Chapman, Comparison of five in vitro bioassays to measureestrogenic activity in environmental waters, Environ. Sci. Technol. 44 (2010)3853–3860.
14] J.H. Shen, B. Gutendorf, H.H. Vahl, L. Shen, J. Westendorf, Toxicological pro-file of pollutants in surface water from an area in Taihu Lake, Yangtze Delta,Toxicology 166 (2001) 71–78.
15] C. Bicchi, T. Schilirò, C. Pignata, E. Fea, C. Cordero, F. Canale, G. Gilli, Analysis ofenvironmental endocrine disrupting chemicals using the E-screen method andstir bar sorptive extraction in wastewater treatment plant effluents, Sci. TotalEnviron. 407 (2009) 1842–1851.
16] J.B. Gadd, L.A. Tremblay, G.L. Northcott, Steroid estrogens, conjugated estrogensand estrogenic activity in farm dairy shed effluents, Environ. Pollut. 158 (2010)730–736.
17] C.J. Houtman, P.E.G. Leonards, W. Kapiteijn, J.F. Bakker, A. Brouwer, M.H. Lam-oree, J. Legler, H.J.C. Klamer, Sample preparation method for the ER-CALUXbioassay screening of (xeno-)estrogenic activity in sediment extracts, Sci. TotalEnviron. 386 (2007) 134–144.
18] J. Legler, M. Dennekamp, A.D. Vethaak, A. Brouwer, J.H. Koeman, B. van der Burg,A.J. Murk, Detection of estrogenic activity in sediment-associated compoundsusing in vitro reporter gene assays, Sci. Total Environ. 293 (2002) 69–83.
19] A.J. Murk, J. Legler, M.M.H.v. Lipzig, J.H.N. Meerman, A.C. Belfroid, A. Spenkelink,B.v.d. Burg, G.B.J. Rijs, D. Vethaak, Detection of estrogenic potency in wastewa-ter and surface water with three in vitro bioassays, Environ. Toxicol. Chem. 21(2002) 16–23.
20] K. Cai, C.T. Elliott, D.H. Phillips, M.L. Scippo, M. Muller, L. Connolly, Treatment ofestrogens and androgens in dairy wastewater by a constructed wetland system,Water Res. 46 (2012) 2333–2343.
21] E.J. Routledge, J.P. Sumpter, Estrogenic activity of surfactants and some of theirdegradation products assessed using a recombinant yeast screen, Environ. Tox-icol. Chem. 15 (1996) 241–248.
22] J.C. Colosi, A.D. Kney, A yeast estrogen screen without extraction provides fast,reliable measures of estrogenic activity, Environ. Toxicol. Chem. 30 (2011)2261–2269.
23] H.A. Balsiger, R. de la Torre, W.-Y. Lee, M.B. Cox, A four-hour yeast bioassay forthe direct measure of estrogenic activity in wastewater without sample extrac-tion, concentration, or sterilization, Sci. Total Environ. 408 (2010) 1422–1429.
24] M. Avbersek, J. Somen, E. Heath, Dynamics of steroid estrogen daily concentra-tions in hospital effluent and connected waste water treatment plant, J. Environ.Monit. 13 (2011) 2221–2226.
25] M. Avbersek, B. Zegura, M. Filipic, E. Heath, Integration of GC–MSD and ER-Calux® assay into a single protocol for determining steroid estrogens inenvironmental samples, Sci. Total Environ. 409 (2011) 5069–5075.
26] T. Mosmann, Rapid colorimetric assay for cellular growth and survival: appli-cation to proliferation and cytotoxicity assays, J. Immunol. Methods 65 (1983)55–63.
27] B. Zegura, E. Heath, A. Cernosa, M. Filipic, Combination of in vitro bioassays forthe determination of cytotoxic and genotoxic potential of wastewater, surfacewater and drinking water samples, Chemosphere 75 (2009) 1453–1460.
28] L. Viganò, E. Benfenati, A.v. Cauwenberge, J.K. Eidem, C. Erratico, A. Goksøyr, W.
Kloas, S. Maggioni, A. Mandich, R. Urbatzka, Estrogenicity profile and estrogeniccompounds determined in river sediments by chemical analysis, ELISA andyeast assays, Chemosphere 73 (2008) 1078–1089.29] S. Teske, R. Arnold, Removal of natural and xeno-estrogens during conventionalwastewater treatment, Rev. Environ. Sci. Biotechnol. 7 (2008) 107–124.