Extracellular vesicle in vivo biodistribution is determined by cell source, route of administration...
13
ORIGINAL RESEARCH ARTICLE Extracellular vesicle in vivo biodistribution is determined by cell source, route of administration and targeting Oscar P. B. Wiklander 1$ , Joel Z. Nordin 1$ , Aisling O’Loughlin 2 , Ylva Gustafsson 3 , Giulia Corso 1 , Imre Ma ¨ ger 2,4 , Pieter Vader 2 , Yi Lee 2 , Helena Sork 1 , Yiqi Seow 5 , Nina Heldring 1 , Lydia Alvarez-Erviti 6 , CI Edvard Smith 1 , Katarina Le Blanc 1,7 , Paolo Macchiarini 3 , Philipp Jungebluth 3,8 , Matthew J. A. Wood 2 and Samir EL Andaloussi 1,2 * 1 Department of Laboratory Medicine, Karolinska Institutet, Stockholm, Sweden; 2 Department of Physiology, Anatomy and Genetics, University of Oxford, Oxford, United Kingdom; 3 Advanced Centre for Translational Regenerative Medicine, Department for Clinical Science, Intervention and Technology, Karolinska Institutet, Stockholm, Sweden; 4 Institute of Technology, University of Tartu, Tartu, Estonia; 5 Molecular Engineering Laboratory, Agency for Science, Technology and Research (A*STAR), Singapore; 6 Department of Clinical Neuroscience, Institute of Neurology, University College London, London, United Kingdom; 7 Haematology Centre, Karolinska University Hospital, Stockholm, Sweden; 8 Department of Thoracic Surgery, Thoraxklinik, Heidelberg University, Heidelberg, Germany Extracellular vesicles (EVs) have emerged as important mediators of intercellular communication in a diverse range of biological processes. For future therapeutic applications and for EV biology research in general, understanding the in vivo fate of EVs is of utmost importance. Here we studied biodistribution of EVs in mice after systemic delivery. EVswere isolated from 3 different mouse cell sources, including dendritic cells (DCs) derived from bone marrow, and labelled with a near-infrared lipophilic dye. Xenotransplantation of EVs was further carried out for cross-species comparison. The reliability of the labelling technique was confirmed by sucrose gradient fractionation, organ perfusion and further supported by immunohistochemical staining using CD63-EGFP probed vesicles. While vesicles accumulated mainly in liver, spleen, gastrointestinal tract and lungs, differences related to EV cell origin were detected. EVs accumulated in the tumour tissue of tumour- bearing mice and, after introduction of the rabies virus glycoprotein-targeting moiety, they were found more readily in acetylcholine-receptor-rich organs. In addition, the route of administration and the dose of injected EVs influenced the biodistribution pattern. This is the first extensive biodistribution investigation of EVs comparing the impact of several different variables, the results of which have implications for the design and feasibility of therapeutic studies using EVs. Keywords: biodistribution; drug delivery; exosomes; extracellular vesicles; microvesicles; nanotechnology; tissue targeting Responsible Editor: Andrew Hill, University of Melbourne, Australia. *Correspondence to: Samir EL Andaloussi, Department of Laboratory Medicine, Karolinska Institutet, 141 57 Huddinge, Sweden, Email: [email protected] To access the supplementary material to this article, please see Supplementary files under ‘Article Tools’. Received: 14 October 2014; Revised: 17 March 2015; Accepted: 19 March 2015; Published: 20 April 2015 I nterest in the field of extracellular vesicles (EVs) has increased tremendously in the past decade. After being identified initially as secreted debris of platelets, EVs from many cell sources have now been recognized as im- portant messengers in intercellular communication via horizontal transfer of proteins, RNA and bioactive lipids (15). EVs are found in all body fluids, including plasma, saliva, cerebrospinal fluid and urine (610). EVs are generally divided into 3 subgroups depend- ing on their biogenesis; (a) exosomes, with a diameter of 40150 nm, which are released into the extracellular milieu when multi-vesicular bodies fuse with the cell membrane, (b) microvesicles, with a diameter of 1501,000 nm, originating from direct budding of the plasma membrane and finally (c) apoptotic bodies, which display a broad size distribution (502,000 nm) (1). Of these vesicles, exosomes $ These authors contributed equally to the manuscript. æ Journal of Extracellular Vesicles 2015. # 2015 Oscar P. B. Wiklander et al. This is an Open Access article distributed under the terms of the Creative Commons Attribution-NonCommercial 4.0 International License (http://creativecommons.org/licenses/by-nc/4.0/), permitting all non-commercial use, distribution, and reproduction in any medium, provided the original work is properly cited. 1 Citation: Journal of Extracellular Vesicles 2015, 4: 26316 - http://dx.doi.org/10.3402/jev.v4.26316 (page number not for citation purpose)
-
Upload
umcutrecht -
Category
Documents
-
view
0 -
download
0
Transcript of Extracellular vesicle in vivo biodistribution is determined by cell source, route of administration...

ORIGINAL RESEARCH ARTICLE
Extracellular vesicle in vivo biodistribution is determinedby cell source, route of administration and targeting
Oscar P. B. Wiklander1$, Joel Z. Nordin1$, Aisling O’Loughlin2,Ylva Gustafsson3, Giulia Corso1, Imre Mager2,4, Pieter Vader2, Yi Lee2,Helena Sork1, Yiqi Seow5, Nina Heldring1, Lydia Alvarez-Erviti6, CI EdvardSmith1, Katarina Le Blanc1,7, Paolo Macchiarini3, Philipp Jungebluth3,8,Matthew J. A. Wood2 and Samir EL Andaloussi1,2*
1Department of Laboratory Medicine, Karolinska Institutet, Stockholm, Sweden; 2Department of Physiology,Anatomy and Genetics, University of Oxford, Oxford, United Kingdom; 3Advanced Centre for TranslationalRegenerative Medicine, Department for Clinical Science, Intervention and Technology, Karolinska Institutet,Stockholm, Sweden; 4Institute of Technology, University of Tartu, Tartu, Estonia; 5Molecular EngineeringLaboratory, Agency for Science, Technology and Research (A*STAR), Singapore; 6Department of ClinicalNeuroscience, Institute of Neurology, University College London, London, United Kingdom; 7HaematologyCentre, Karolinska University Hospital, Stockholm, Sweden; 8Department of Thoracic Surgery, Thoraxklinik,Heidelberg University, Heidelberg, Germany
Extracellular vesicles (EVs) have emerged as important mediators of intercellular communication in a diverse
range of biological processes. For future therapeutic applications and for EV biology research in general,
understanding the in vivo fate of EVs is of utmost importance. Here we studied biodistribution of EVs in mice
after systemic delivery. EVs were isolated from 3 different mouse cell sources, including dendritic cells (DCs)
derived from bone marrow, and labelled with a near-infrared lipophilic dye. Xenotransplantation of EVs was
further carried out for cross-species comparison. The reliability of the labelling technique was confirmed by
sucrose gradient fractionation, organ perfusion and further supported by immunohistochemical staining using
CD63-EGFP probed vesicles. While vesicles accumulated mainly in liver, spleen, gastrointestinal tract and
lungs, differences related to EV cell origin were detected. EVs accumulated in the tumour tissue of tumour-
bearing mice and, after introduction of the rabies virus glycoprotein-targeting moiety, they were found more
readily in acetylcholine-receptor-rich organs. In addition, the route of administration and the dose of injected
EVs influenced the biodistribution pattern. This is the first extensive biodistribution investigation of EVs
comparing the impact of several different variables, the results of which have implications for the design and
feasibility of therapeutic studies using EVs.
Keywords: biodistribution; drug delivery; exosomes; extracellular vesicles; microvesicles; nanotechnology; tissue targeting
Responsible Editor: Andrew Hill, University of Melbourne, Australia.
*Correspondence to: Samir EL Andaloussi, Department of Laboratory Medicine, Karolinska Institutet,
141 57 Huddinge, Sweden, Email: [email protected]
To access the supplementary material to this article, please see Supplementary files under ‘Article Tools’.
Received: 14 October 2014; Revised: 17 March 2015; Accepted: 19 March 2015; Published: 20 April 2015
Interest in the field of extracellular vesicles (EVs) has
increased tremendously in the past decade. After being
identified initially as secreted debris of platelets, EVs
from many cell sources have now been recognized as im-
portant messengers in intercellular communication via
horizontal transfer of proteins, RNA and bioactive lipids
(1�5). EVs are found in all body fluids, including plasma,
saliva, cerebrospinal fluid and urine (6�10).
EVs are generally divided into 3 subgroups depend-
ing on their biogenesis; (a) exosomes, with a diameter of
40�150 nm, which are released into the extracellular milieu
when multi-vesicular bodies fuse with the cell membrane,
(b) microvesicles, with a diameter of 150�1,000 nm,
originating from direct budding of the plasma membrane
and finally (c) apoptotic bodies, which display a broad size
distribution (50�2,000 nm) (1). Of these vesicles, exosomes
$These authors contributed equally to the manuscript.
�
Journal of Extracellular Vesicles 2015. # 2015 Oscar P. B. Wiklander et al. This is an Open Access article distributed under the terms of the CreativeCommons Attribution-NonCommercial 4.0 International License (http://creativecommons.org/licenses/by-nc/4.0/), permitting all non-commercial use,distribution, and reproduction in any medium, provided the original work is properly cited.
1
Citation: Journal of Extracellular Vesicles 2015, 4: 26316 - http://dx.doi.org/10.3402/jev.v4.26316(page number not for citation purpose)

have received the most attention and have been implicated
in physiological functions, such as maintenance of stem
cell niches and immune responses (1,2), as well as in
pathological conditions, such as malignancies, metastasis,
viral spread and neurological disorders (3,11,12).
Since various proteins and RNA associate with EVs,
reflecting some of the contents and functions of their
source cells, it has been investigated whether EVs could be
employed as diagnostic or therapeutic agents. In addition
to harnessing their innate therapeutic features, engineered
EVs have been exploited as well (13�17). For example,
dendritic cell (DC) exosomes are currently under assess-
ment in clinical trials (e.g. NCT01159288) for cancer
treatment and there have been several reports regarding
enhanced tissue regeneration after treatment regimens
with exosomes generated from mesenchymal stromal cells
(MSCs) (13�15, 18). Furthermore, Kordelas et al. recently
reported successful treatment using MSC-derived EVs of a
patient suffering from therapy-refractory graft-versus-
host disease (18). Hence, increasing evidence suggests
that EVs can be applied to treat a range of different
diseases, both in animal models and in patients.
Despite intense research in the field, only few studies
(19�26) have analysed EV biodistribution and thus little
is known about their in vivo trafficking. Herein, we aimed
to assess the biodistribution profile of EVs smaller than
200 nm from a broad range of different cell types,
including primary mouse DCs and human MSCs, using
a previously described labelling method with a near-
infrared dye. Furthermore, dose titration, time-lapse
studies and different injections routes were examined.
Material and methods
CellsDendritic cells (DCs): Bone marrow was flushed from the
bone cavity of tibias and femurs of 8- to 10-week-old male
C57BL/6 mice using a G27 syringe into DMEM Gluta-
MAX (Life Technologies, Carlsbad, CA, USA). Clumps
were dissociated by re-suspension and samples were
centrifuged for 10 minutes at 280g. The supernatant was
removed and the pellet resuspended in red blood cell lysing
buffer (Sigma-Aldrich, St Louis, MO, USA). Following a
5-minute incubation, the suspension was neutralized with
DMEM and spun at 280g for 10 minutes. Cells were then
plated at a concentration of 1�106 cells/ml in DMEM,
10% foetal bovine serum (FBS) and antibiotics (Penicillin
and Streptomycin 5 mg/ml) and supplementedwith 10 ng/ml
murine granulocyte macrophage colony stimulating fac-
tor (GM-CSF) (Sigma-Aldrich). DCs were cultured for
4 days. On day 4, DCs were transfected with plasmids
containing a Lamp2b construct fused to Rabies virus
glycoprotein (RVG) [as described in (17)] or mock
transfected using TransIT LT1 transfection reagent (Mirus
Bio, Madison, WI, USA) according to manufacturer’s
instructions. DCs were then cultured for a further 3 days
before the medium was replaced with medium containing
FBS, which had been spun at 120,000g for 70 minutes prior
to medium preparation. Twenty four hours later the cul-
ture medium was collected, spun at 1,000g for 15 minutes
and passed through a 0.22 mm filter. Thereafter, EVs were
purified and labelled with DiR as described below.
MSCs were isolated from bone marrow aspirates of 2
healthy human volunteers as described previously (27,28).
MSC donors gave informed consent and the study was
approved by the Regional Ethics Review Board. Mono-
nuclear cells separated by density centrifugation were
cultured in DMEM (Life Technologies) supplemented
with 10% heat-inactivated FBS. Purity was confirmed by
flow cytometry (CD73�, CD105�, CD90�, HLA-I�,
CD45�, CD34�, CD14�, HLA-DR�). Before EV
isolation, MSCs (at passage 4) were cultured in OptiMEM
(Life Technologies) for 48 hours. Thereafter, the EV
labelling and isolation were performed as described below.
Cell lines: HEK293T, C2C12, B16-F10 and OLN-93
cells were grown in DMEM supplemented with 10%
(HEK293T, B16-F10 and OLN-93) or 20% (C2C12) FBS.
Twenty four hours after cells were plated, the growth
media was changed to OptiMEM or DMEM supplemen-
ted with 10% FBS depleted of serum EVs. Forty eight
hours later, cells had reached 90% confluence. The super-
natant was then collected for purification and labelling
of EVs as described below.
EV purification with differential ultracentrifugationConditioned media (CM) was harvested and spun first at
300g for 5 minutes to remove cells, followed by 1,500g
for 10 minutes to remove cell debris and thereafter filtrated
through a 0.22-mm filter to remove any larger particles. The
CM was then ultracentrifuged at 110,000g for 70 minutes
to pellet the EVs. A second washing step was performed
by resuspending the EV pellet in 25 ml of phosphate buffer
saline (PBS) and ultracentrifuged at 110,000g for another
70 minutes. The pellet was then resuspended in PBS. All
ultracentrifugation (UC) steps were performed using the
Beckman Coulter (Brea, CA, USA) Type 70 Ti rotor at 48C.
EGFP-positive EVsTo generate EGFP-positive EVs, HEK293T cells were
transfected with CD63-EGFP plasmid using polyethyle-
nimine (PEI) at a 1:4 (DNA/PEI) ratio. Four hours post-
transfection, the cells were washed with PBS and the
media changed to OptiMEM. The EVs were isolated
48 hours after media change, as described above.
DiR-labelled EVsThe filtered CM was incubated with 1 mM fluorescent
lipophilic tracer DiR (1,1-dioctadecyl-3,3,3,3-tetramethy-
lindotricarbocyanine iodide) (D12731, Invitrogen, Life
Technologies) at room temperature (RT) for 15 minutes
prior to EV isolation by the UC method as described above.
Oscar P. B. Wiklander et al.
2(page number not for citation purpose)
Citation: Journal of Extracellular Vesicles 2015, 4: 26316 - http://dx.doi.org/10.3402/jev.v4.26316
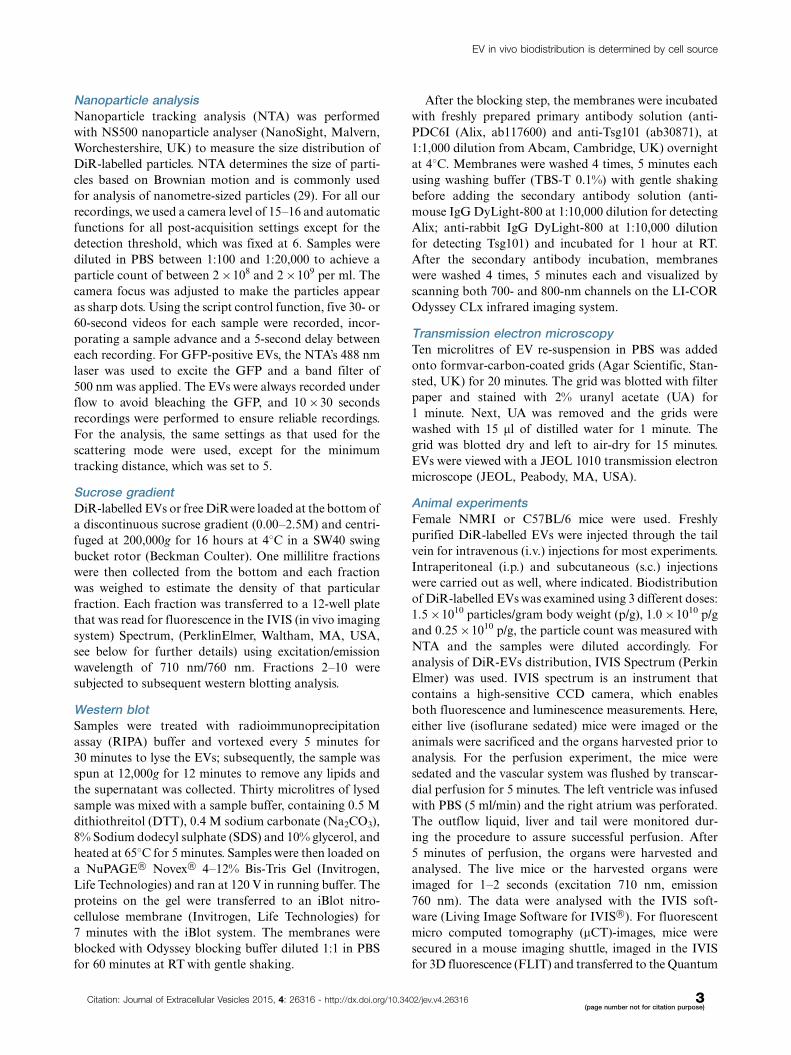
Nanoparticle analysisNanoparticle tracking analysis (NTA) was performed
with NS500 nanoparticle analyser (NanoSight, Malvern,
Worchestershire, UK) to measure the size distribution of
DiR-labelled particles. NTA determines the size of parti-
cles based on Brownian motion and is commonly used
for analysis of nanometre-sized particles (29). For all our
recordings, we used a camera level of 15�16 and automatic
functions for all post-acquisition settings except for the
detection threshold, which was fixed at 6. Samples were
diluted in PBS between 1:100 and 1:20,000 to achieve a
particle count of between 2�108 and 2�109 per ml. The
camera focus was adjusted to make the particles appear
as sharp dots. Using the script control function, five 30- or
60-second videos for each sample were recorded, incor-
porating a sample advance and a 5-second delay between
each recording. For GFP-positive EVs, the NTA’s 488 nm
laser was used to excite the GFP and a band filter of
500 nm was applied. The EVs were always recorded under
flow to avoid bleaching the GFP, and 10�30 seconds
recordings were performed to ensure reliable recordings.
For the analysis, the same settings as that used for the
scattering mode were used, except for the minimum
tracking distance, which was set to 5.
Sucrose gradientDiR-labelled EVs or free DiRwere loaded at the bottom of
a discontinuous sucrose gradient (0.00�2.5M) and centri-
fuged at 200,000g for 16 hours at 48C in a SW40 swing
bucket rotor (Beckman Coulter). One millilitre fractions
were then collected from the bottom and each fraction
was weighed to estimate the density of that particular
fraction. Each fraction was transferred to a 12-well plate
that was read for fluorescence in the IVIS (in vivo imaging
system) Spectrum, (PerklinElmer, Waltham, MA, USA,
see below for further details) using excitation/emission
wavelength of 710 nm/760 nm. Fractions 2�10 were
subjected to subsequent western blotting analysis.
Western blotSamples were treated with radioimmunoprecipitation
assay (RIPA) buffer and vortexed every 5 minutes for
30 minutes to lyse the EVs; subsequently, the sample was
spun at 12,000g for 12 minutes to remove any lipids and
the supernatant was collected. Thirty microlitres of lysed
sample was mixed with a sample buffer, containing 0.5 M
dithiothreitol (DTT), 0.4 M sodium carbonate (Na2CO3),
8% Sodium dodecyl sulphate (SDS) and 10% glycerol, and
heated at 658C for 5 minutes. Samples were then loaded on
a NuPAGE† Novex† 4�12% Bis-Tris Gel (Invitrogen,
Life Technologies) and ran at 120 V in running buffer. The
proteins on the gel were transferred to an iBlot nitro-
cellulose membrane (Invitrogen, Life Technologies) for
7 minutes with the iBlot system. The membranes were
blocked with Odyssey blocking buffer diluted 1:1 in PBS
for 60 minutes at RT with gentle shaking.
After the blocking step, the membranes were incubated
with freshly prepared primary antibody solution (anti-
PDC6I (Alix, ab117600) and anti-Tsg101 (ab30871), at
1:1,000 dilution from Abcam, Cambridge, UK) overnight
at 48C. Membranes were washed 4 times, 5 minutes each
using washing buffer (TBS-T 0.1%) with gentle shaking
before adding the secondary antibody solution (anti-
mouse IgG DyLight-800 at 1:10,000 dilution for detecting
Alix; anti-rabbit IgG DyLight-800 at 1:10,000 dilution
for detecting Tsg101) and incubated for 1 hour at RT.
After the secondary antibody incubation, membranes
were washed 4 times, 5 minutes each and visualized by
scanning both 700- and 800-nm channels on the LI-COR
Odyssey CLx infrared imaging system.
Transmission electron microscopyTen microlitres of EV re-suspension in PBS was added
onto formvar-carbon-coated grids (Agar Scientific, Stan-
sted, UK) for 20 minutes. The grid was blotted with filter
paper and stained with 2% uranyl acetate (UA) for
1 minute. Next, UA was removed and the grids were
washed with 15 ml of distilled water for 1 minute. The
grid was blotted dry and left to air-dry for 15 minutes.
EVs were viewed with a JEOL 1010 transmission electron
microscope (JEOL, Peabody, MA, USA).
Animal experimentsFemale NMRI or C57BL/6 mice were used. Freshly
purified DiR-labelled EVs were injected through the tail
vein for intravenous (i.v.) injections for most experiments.
Intraperitoneal (i.p.) and subcutaneous (s.c.) injections
were carried out as well, where indicated. Biodistribution
of DiR-labelled EVs was examined using 3 different doses:
1.5�1010 particles/gram body weight (p/g), 1.0�1010 p/g
and 0.25�1010 p/g, the particle count was measured with
NTA and the samples were diluted accordingly. For
analysis of DiR-EVs distribution, IVIS Spectrum (Perkin
Elmer) was used. IVIS spectrum is an instrument that
contains a high-sensitive CCD camera, which enables
both fluorescence and luminescence measurements. Here,
either live (isoflurane sedated) mice were imaged or the
animals were sacrificed and the organs harvested prior to
analysis. For the perfusion experiment, the mice were
sedated and the vascular system was flushed by transcar-
dial perfusion for 5 minutes. The left ventricle was infused
with PBS (5 ml/min) and the right atrium was perforated.
The outflow liquid, liver and tail were monitored dur-
ing the procedure to assure successful perfusion. After
5 minutes of perfusion, the organs were harvested and
analysed. The live mice or the harvested organs were
imaged for 1�2 seconds (excitation 710 nm, emission
760 nm). The data were analysed with the IVIS soft-
ware (Living Image Software for IVIS†). For fluorescent
micro computed tomography (mCT)-images, mice were
secured in a mouse imaging shuttle, imaged in the IVIS
for 3D fluorescence (FLIT) and transferred to the Quantum
EV in vivo biodistribution is determined by cell source
Citation: Journal of Extracellular Vesicles 2015, 4: 26316 - http://dx.doi.org/10.3402/jev.v4.26316 3(page number not for citation purpose)
FX micro CT Imaging System (PerklinElmer, MA, USA)
for CT-imaging. Co-registration of FLIT with the CT-
scan was generated using Living Image software (30,31).
Adobe Photoshop CS4 and Adobe Illustrator were used
to crop out and align the organ images.
Injection of CD63-EGFP EVs: CD63-EGFP EVs
were generated, isolated and characterized by NanoSight
as described above. Twenty four hours post-injections
(2.9�1010 p/g), the organs were harvested and prepared
as described below. The animal experiments were ap-
proved by the British and the Swedish local boards for
laboratory animals.
ImmunohistochemistryTissue preparationFollowing euthanasia using cervical dislocation, the or-
gans were explanted, embedded in optimal cutting tem-
perature compounds (Histolab, Gothenburg, Sweden) and
snap frozen immediately. The frozen blocks were then
sectioned to 8 mm thickness and mounted on Superfrost
glass slides (Gerhard Menzel, Braunschweig, Germany).
Staining and imagingThe sections were fixed for 10 minutes in 4% formaldehyde
(Histolab, Sweden), washed 3 times for 5 minutes each in
PBS and then blocked using PBS with 5% goat serum (Life
Technologies, Sweden) and 0.3% Triton X100 (Sigma-
Aldrich, Sweden) for 1 hour. The primary antibody (GFP,
Ab13970, Abcam) was diluted 1:1,000 in an antibody
dilution buffer consisting of PBS with 0.1% Triton X100
being added to each sample and incubated overnight
at 48C. The sections were then washed as described pre-
viously, and the secondary antibody (Alexa 594 anti-rabbit
IgG, Life technologies) diluted at 1:500 in antibody
dilution buffer was added and incubated for 1 hour.
The sections were again washed, mounted with coverslips
using Slowfade Gold Anitfade with 4?,6-diamidino-2-
phenylindole (DAPI) (Life Technologies) and imaged
using an inverted fluorescent microscope (Olympus X70,
Olympus, Tokyo, Japan).
Statistical analysisStatistical analyses of the data were performed using
Prism 6.0 (GraphPad Software Inc.) by using the non-
parametric Kruskal�Wallis test followed by the Sidak
post-test for all p-values. All results are expressed as mean
�SEM. All graphs were made in Prism 6.0 (GraphPad
Software Inc., La Jolla, CA, USA).
Results and discussion
Assessing DiR as an EV labelling tool forbiodistribution studiesIn order to assess the distribution of EVs systemically
delivered in mice, the near-infrared (NIR) dye DiR used in
earlier studies (24,25) was used for general EV labelling.
DiR is a lipophilic dye that only fluoresces intensely when
inserted into a lipid-membrane. NIR dyes are ideal for
in vivo applications owing to their high tissue penetrance
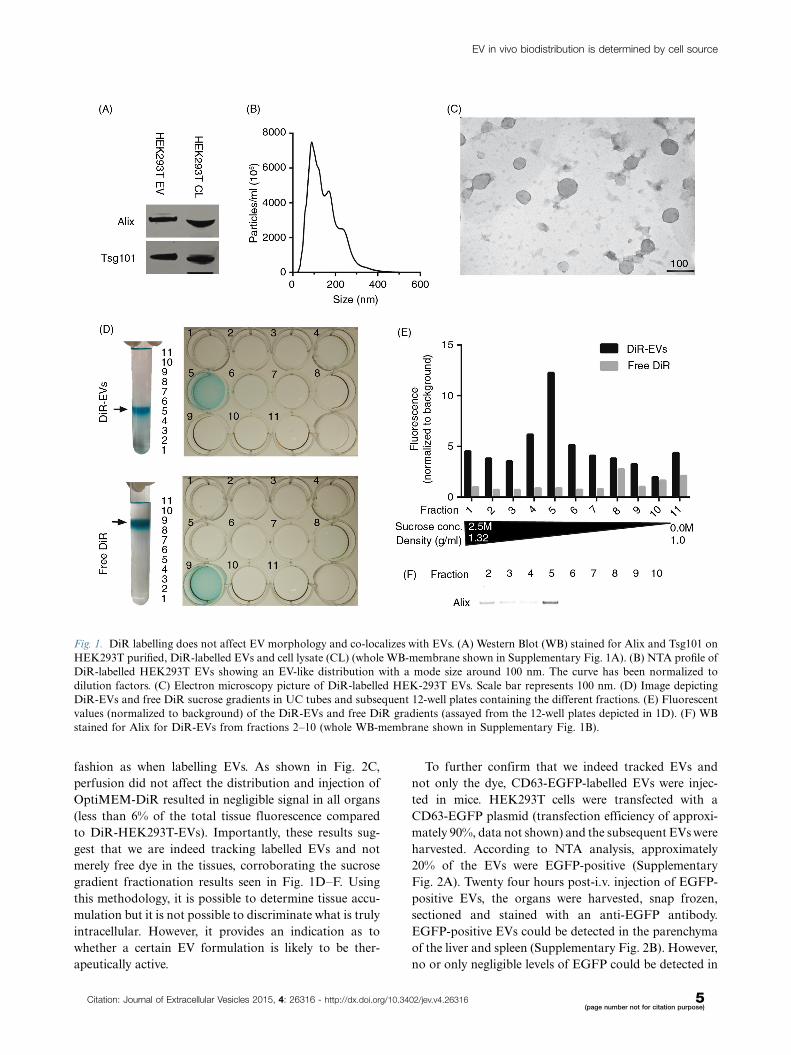
and low autofluorescence (32�36). HEK293T EVs labelled
with DiR were analysed by western blot (WB) following
differential UC, and the common EV markers (37) Alix
and Tsg101 were both present (Fig. 1A and Supplemen-
tary Fig. 1A). To further confirm that the purified material
indeed consisted of EVs, NTA and EM analyses were
performed. The NTA data showed a typical EV-like
shaped curve with a mode size of around 100 nm in dia-
meter (Fig. 1B) and the EM analysis revealed vesicles with
a diameter of approximately 100 nm (Fig. 1C). Further-
more, the EM shows predominantly intact vesicles with
classical EV morphology; hence, the DiR labelling seems
to have no effect on the vesicle morphology.
Similar to any dye-based system, there is a risk that the
signal originates from free dye rather than the labelled
construct itself, and since free dye, when injected, might
bind serum proteins, circulating cells and blood vessels,
several control experiments were performed to exclude
that. Sucrose gradient fractionation of DiR-labelled
EVs reveals that the dye, when bound to EVs, is visible
(Fig. 1D) and fluoresces (Fig. 1E) at the expected density
of exosomes (1.11�1.21 g/ml) (5), which also correlates
with the presence of Alix (Fig. 1F and Supplementary
Fig. 1B). On the contrary, and as expected, free DiR
without EVs had a much lower buoyant density (Fig. 1D),
and since the free DiR sample is absent for any form of
lipid membranes, the fluorescent values are, as expected,
much lower compared to the DiR-EV sample (Fig. 1E).
This indicates that the DiR-EV samples after UC puri-
fication contains DiR bound to EVs and minuscule
amounts of free DiR, since DiR is only found in the
same fraction as the EVs and in no other fraction.
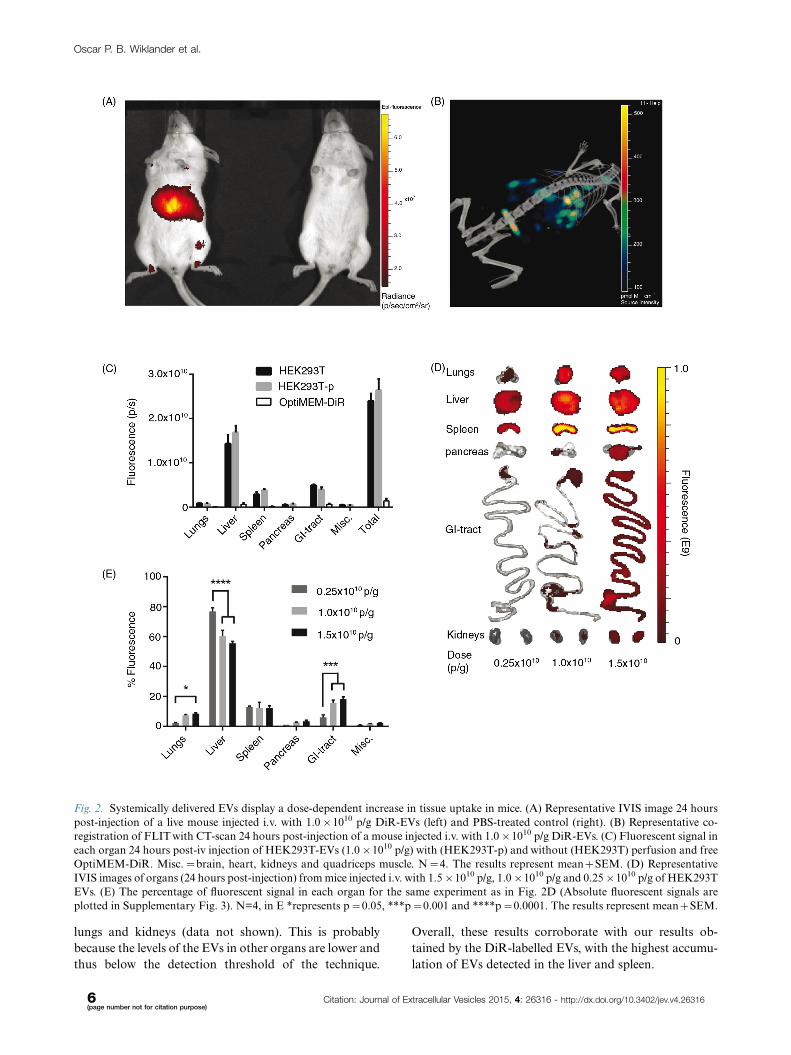
DiR-labelled HEK293T EVs were subsequently in-
jected via the tail vein of NMRI mice. To assess the
biodistribution, live mice were imaged 24 hours after
injection using an in vivo imaging system (IVIS) (Fig. 2A)
and subsequent mCT (Fig. 2B). From these representa-
tive images, the levels of detail from fluorescent whole
mouse imaging did not allow for enough accuracy to
conclude from which tissue the signal originates. Thus,
to elucidate from which organ the fluorescent signal (i.e.
the EVs) originated and to minimize signal interference,
the organs were harvested and imaged ex vivo for the
succeeding experiments. As mentioned above, a possible
downside with the in vivo tracking of EVs is the risk of
signal originating from the blood in the organs and from
free dye per se. To affirm that we were in fact analys-
ing DiR-labelled EVs in the organs, mice were treated
with HEK293T-EVs with and without perfusion prior to
organ harvest. In addition, to rule out the possibility of
monitoring free dye, EV-free medium (OptiMEM) was
incubated with DiR and subjected to UC in the same
Oscar P. B. Wiklander et al.
4(page number not for citation purpose)
Citation: Journal of Extracellular Vesicles 2015, 4: 26316 - http://dx.doi.org/10.3402/jev.v4.26316
fashion as when labelling EVs. As shown in Fig. 2C,
perfusion did not affect the distribution and injection of
OptiMEM-DiR resulted in negligible signal in all organs
(less than 6% of the total tissue fluorescence compared
to DiR-HEK293T-EVs). Importantly, these results sug-
gest that we are indeed tracking labelled EVs and not
merely free dye in the tissues, corroborating the sucrose
gradient fractionation results seen in Fig. 1D�F. Using
this methodology, it is possible to determine tissue accu-
mulation but it is not possible to discriminate what is truly
intracellular. However, it provides an indication as to
whether a certain EV formulation is likely to be ther-
apeutically active.
To further confirm that we indeed tracked EVs and
not only the dye, CD63-EGFP-labelled EVs were injec-
ted in mice. HEK293T cells were transfected with a
CD63-EGFP plasmid (transfection efficiency of approxi-
mately 90%, data not shown) and the subsequent EVs were
harvested. According to NTA analysis, approximately
20% of the EVs were EGFP-positive (Supplementary
Fig. 2A). Twenty four hours post-i.v. injection of EGFP-
positive EVs, the organs were harvested, snap frozen,
sectioned and stained with an anti-EGFP antibody.
EGFP-positive EVs could be detected in the parenchyma
of the liver and spleen (Supplementary Fig. 2B). However,
no or only negligible levels of EGFP could be detected in
Fig. 1. DiR labelling does not affect EV morphology and co-localizes with EVs. (A) Western Blot (WB) stained for Alix and Tsg101 on
HEK293T purified, DiR-labelled EVs and cell lysate (CL) (whole WB-membrane shown in Supplementary Fig. 1A). (B) NTA profile of
DiR-labelled HEK293T EVs showing an EV-like distribution with a mode size around 100 nm. The curve has been normalized to
dilution factors. (C) Electron microscopy picture of DiR-labelled HEK-293T EVs. Scale bar represents 100 nm. (D) Image depicting
DiR-EVs and free DiR sucrose gradients in UC tubes and subsequent 12-well plates containing the different fractions. (E) Fluorescent
values (normalized to background) of the DiR-EVs and free DiR gradients (assayed from the 12-well plates depicted in 1D). (F) WB
stained for Alix for DiR-EVs from fractions 2�10 (whole WB-membrane shown in Supplementary Fig. 1B).
EV in vivo biodistribution is determined by cell source
Citation: Journal of Extracellular Vesicles 2015, 4: 26316 - http://dx.doi.org/10.3402/jev.v4.26316 5(page number not for citation purpose)
lungs and kidneys (data not shown). This is probably
because the levels of the EVs in other organs are lower and
thus below the detection threshold of the technique.
Overall, these results corroborate with our results ob-
tained by the DiR-labelled EVs, with the highest accumu-
lation of EVs detected in the liver and spleen.
Fig. 2. Systemically delivered EVs display a dose-dependent increase in tissue uptake in mice. (A) Representative IVIS image 24 hours
post-injection of a live mouse injected i.v. with 1.0�1010 p/g DiR-EVs (left) and PBS-treated control (right). (B) Representative co-
registration of FLIT with CT-scan 24 hours post-injection of a mouse injected i.v. with 1.0�1010 p/g DiR-EVs. (C) Fluorescent signal in
each organ 24 hours post-iv injection of HEK293T-EVs (1.0�1010 p/g) with (HEK293T-p) and without (HEK293T) perfusion and free
OptiMEM-DiR. Misc.�brain, heart, kidneys and quadriceps muscle. N�4. The results represent mean�SEM. (D) Representative
IVIS images of organs (24 hours post-injection) from mice injected i.v. with 1.5�1010 p/g, 1.0�1010 p/g and 0.25�1010 p/g of HEK293T
EVs. (E) The percentage of fluorescent signal in each organ for the same experiment as in Fig. 2D (Absolute fluorescent signals are
plotted in Supplementary Fig. 3). N=4, in E *represents p�0.05, ***p�0.001 and ****p�0.0001. The results represent mean�SEM.
Oscar P. B. Wiklander et al.
6(page number not for citation purpose)
Citation: Journal of Extracellular Vesicles 2015, 4: 26316 - http://dx.doi.org/10.3402/jev.v4.26316
Dose titration of DiR-labelled EVsTo investigate whether the dose of EVs injected may affect
the biodistribution, a dose-titration study was carried
out. All injection doses were determined by using a fixed
number of EVs (measured by NTA) per gram body weight
of the mice, hence particles/gram body weight (p/g).
A positive dose-dependent response of the total tissue
fluorescence was observed following i.v. injection of
3 different doses: 0.25�1010, 1.0�1010 and 1.5�1010 p/g
of DiR-labelled HEK293T EVs. EVs accumulated
mainly in liver, spleen, gastrointestinal tract (GI)-tract
and lungs. However, even though an increase in dose
resulted in an increased fluorescent signal in the analysed
organs (Fig. 2D and E and Supplementary Fig. 3), the
relative distribution among the organs shifted. Relative
liver accumulation decreased from 77%92.4 to 60%93.9
(pB0.0001) to 56%91.3 (pB0.0001) when treated with
0.25�1010 p/g, 1.0�1010 p/g and 1.5�1010 p/g, respec-
tively. This might be due to a low signal (close to the
detection limit) observed in all organs except liver and
spleen analysed for the lowest dose. The relative dose-
dependent decrease in liver signal may also result from
a saturation of the mononuclear phagocyte system (also
known as the reticuloendothelial system, RES) resulting
in more effective bypass of the liver at higher doses.
The intermediate dose (1�1010 p/g) was determined to be
sufficient for detection in all organs analysed with mini-
mal saturation and thus this dose was used in subsequent
experiments.
In line with earlier findings on the biodistribution of
synthetic liposomes, which are similar to EVs in size and
also contain a lipophilic outer layer (38�41), we found that
EVs generally distribute to organs of the mononuclear
phagocyte system with highest accumulation in the liver,
followed by spleen, GI-tract and lungs. Many compounds,
when injected i.v., will be taken up by patrolling macro-
phages in the RES organs, for example, by Kupffer cells
in liver or splenic macrophages (42�44). However, seve-
ral nanoparticle studies have indicated that the size of
the particles affects the distribution and clearance. For
instance, small nanoparticles (5100 nm) are less prone to
opsonisation and penetrate the fenestrations in the hepatic
sinusoidal endothelium, thus increasing the hepatocyte
uptake of the total hepatic accumulation. Similarly,
in spleen, small particles avoid the filtration process at
the interendothelial slits and extravasation occurs due to
the discontinuous endothelium, allowing entry into the
red pulp (42�44).
EV distribution kineticsA potential pitfall when using lipophilic dyes to track EVs
is that the dye itself has a much longer half-life compared
to the EVs. Hence, there is a possibility that, at longer time
points, the distribution of remaining dye is being analysed
and not the EVs per se. Therefore, EV distribution at
different time points was examined following i.v. injection
of DiR-labelled HEK293T EVs. The overall EV biodis-
tribution profile remained largely unchanged during the
first 24 hours, whereas greater changes were detected at
the 48-hour time point (Fig. 3A and Supplementary Fig. 4).
The distribution pattern amongst the analysed organs
is in line with previous reports (19�22,24,25). However,
in these articles, the authors assess the biodistribution at
earlier time points as well as at 24 hours. Nonetheless, our
results indicate a similar distribution pattern at 24 hours
compared to the earlier time points. At 48 hours, the
fluorescent signal started to decline in heart, GI-tract and
kidneys (heart and kidneys included in the Misc. group
in Fig. 3A and Supplementary Fig. 4) and the signal
increased dramatically in pancreas. These findings may be
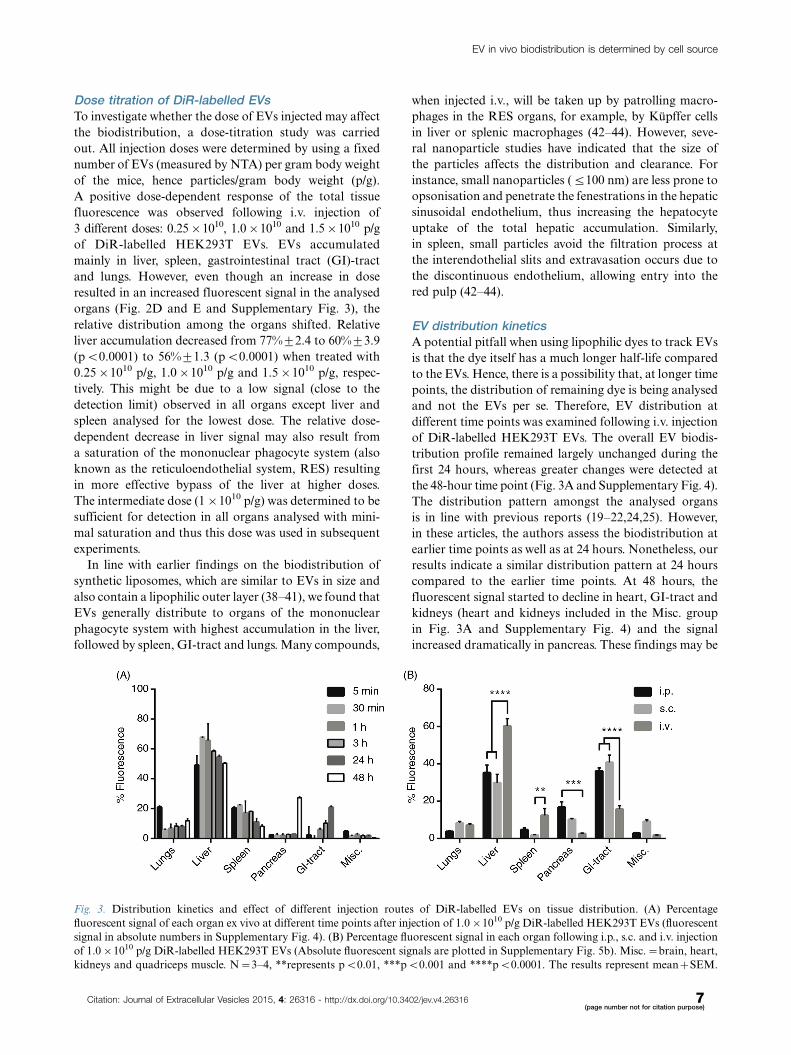
Fig. 3. Distribution kinetics and effect of different injection routes of DiR-labelled EVs on tissue distribution. (A) Percentage
fluorescent signal of each organ ex vivo at different time points after injection of 1.0�1010 p/g DiR-labelled HEK293T EVs (fluorescent
signal in absolute numbers in Supplementary Fig. 4). (B) Percentage fluorescent signal in each organ following i.p., s.c. and i.v. injection
of 1.0�1010 p/g DiR-labelled HEK293T EVs (Absolute fluorescent signals are plotted in Supplementary Fig. 5b). Misc.�brain, heart,
kidneys and quadriceps muscle. N�3�4, **represents pB0.01, ***pB0.001 and ****pB0.0001. The results represent mean�SEM.
EV in vivo biodistribution is determined by cell source
Citation: Journal of Extracellular Vesicles 2015, 4: 26316 - http://dx.doi.org/10.3402/jev.v4.26316 7(page number not for citation purpose)
explained by possible re-distribution of the EVs, a late
phase uptake of remaining EVs or artefacts due to the
long half-life of the dye. Due to the change in distribu-
tion pattern at 48 hours, the potential risk of unspecific
staining and possible tissue accumulation of the dye, the
organs were harvested at 24 hours post-i.v. injection in
the succeeding experiments.
Different delivery routes alter EV distribution patternTo assess whether the route of injection influences the
distribution pattern, mice were given the same amount
of HEK293T-DiR-EVs (1.0�1010 p/g) using 3 different
systemic delivery routes, i.v., i.p. and s.c. (Fig. 3B). The
different injection routes rendered different distribution
patterns. In contrast to i.v. injections, i.p. and s.c. injections
resulted in significantly (pB0.0001) lower EV accumula-
tion in liver (i.v.: 60%93.9; i.p.: 35%94.2; s.c.: 30%94.5)
and spleen (i.v.: 12%93.6; i.p.: 5%91.0; s.c.: 2%90.3;
pB0.01 for i.v. vs. s.c.) whereas increased accumulation
was observed in pancreas (i.v.: 2.6%90.3; i.p.: 17%9
2.9; s.c.: 10%90.5; pB0.001 for i.v. vs. i.p) and GI (i.v.:
16%91.8; i.p.: 36%91.7; s.c.: 41%93.9; pB0.0001).
Furthermore, i.p. injections displayed slightly higher total
tissue fluorescence compared to i.v. injections, whereas s.c.
injections resulted in much lower signals (i.v.: 2.0�1010 p/s;
i.p.: 3.0�1010 p/s; s.c.: 0.5�1010 p/s; Supplementary
Fig. 5A and B). These results indicate that the route
of injection influences tissue distribution of infused
EVs and the site of injection alternations may thus be
used to increase the EV distribution to a potential tissue
target.
Cell source influences the biodistribution of EVsCells of different origin are known to home in on varying
locations in vivo, for example immunological cells pre-
ferentially target sites with immunological activity, such
as the spleen, to a greater extent than control cells (45).
EVs from different cell sources could potentially also show
different innate homing capabilities in vivo. To compare
intrinsic tropisms, a comparison of the biodistribution
of EVs derived from 3 different mouse cell sources � a
muscle cell line; C2C12, a melanoma cell line; B16F10
and primary immature bone marrow-derived DCs � was
undertaken. Furthermore, xenotransplantation of EVs
from rat cells (oligodendrocytes; OLN-93) and from cells
of human origin (HEK293T and primary human MSCs)
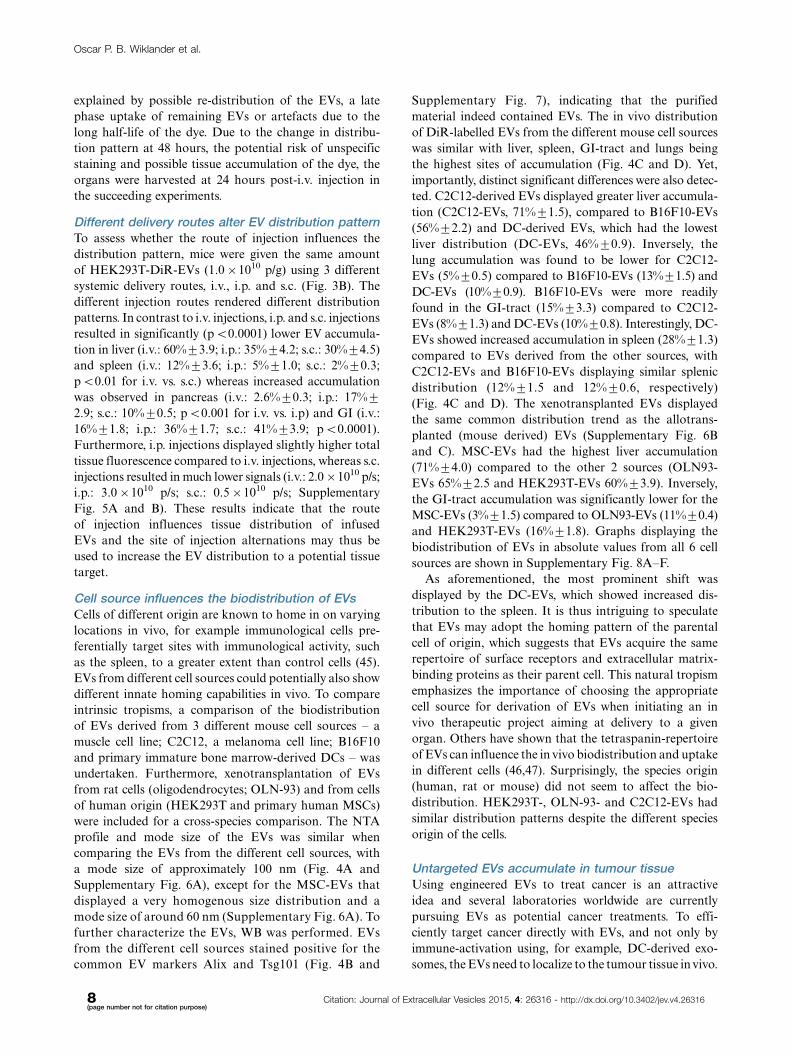
were included for a cross-species comparison. The NTA
profile and mode size of the EVs was similar when
comparing the EVs from the different cell sources, with
a mode size of approximately 100 nm (Fig. 4A and
Supplementary Fig. 6A), except for the MSC-EVs that
displayed a very homogenous size distribution and a
mode size of around 60 nm (Supplementary Fig. 6A). To
further characterize the EVs, WB was performed. EVs
from the different cell sources stained positive for the
common EV markers Alix and Tsg101 (Fig. 4B and
Supplementary Fig. 7), indicating that the purified
material indeed contained EVs. The in vivo distribution
of DiR-labelled EVs from the different mouse cell sources
was similar with liver, spleen, GI-tract and lungs being
the highest sites of accumulation (Fig. 4C and D). Yet,
importantly, distinct significant differences were also detec-
ted. C2C12-derived EVs displayed greater liver accumula-
tion (C2C12-EVs, 71%91.5), compared to B16F10-EVs
(56%92.2) and DC-derived EVs, which had the lowest
liver distribution (DC-EVs, 46%90.9). Inversely, the
lung accumulation was found to be lower for C2C12-
EVs (5%90.5) compared to B16F10-EVs (13%91.5) and
DC-EVs (10%90.9). B16F10-EVs were more readily
found in the GI-tract (15%93.3) compared to C2C12-
EVs (8%91.3) and DC-EVs (10%90.8). Interestingly, DC-
EVs showed increased accumulation in spleen (28%91.3)
compared to EVs derived from the other sources, with
C2C12-EVs and B16F10-EVs displaying similar splenic
distribution (12%91.5 and 12%90.6, respectively)
(Fig. 4C and D). The xenotransplanted EVs displayed
the same common distribution trend as the allotrans-
planted (mouse derived) EVs (Supplementary Fig. 6B
and C). MSC-EVs had the highest liver accumulation
(71%94.0) compared to the other 2 sources (OLN93-
EVs 65%92.5 and HEK293T-EVs 60%93.9). Inversely,
the GI-tract accumulation was significantly lower for the
MSC-EVs (3%91.5) compared to OLN93-EVs (11%90.4)
and HEK293T-EVs (16%91.8). Graphs displaying the
biodistribution of EVs in absolute values from all 6 cell
sources are shown in Supplementary Fig. 8A�F.
As aforementioned, the most prominent shift was
displayed by the DC-EVs, which showed increased dis-
tribution to the spleen. It is thus intriguing to speculate
that EVs may adopt the homing pattern of the parental
cell of origin, which suggests that EVs acquire the same
repertoire of surface receptors and extracellular matrix-
binding proteins as their parent cell. This natural tropism
emphasizes the importance of choosing the appropriate
cell source for derivation of EVs when initiating an in
vivo therapeutic project aiming at delivery to a given
organ. Others have shown that the tetraspanin-repertoire
of EVs can influence the in vivo biodistribution and uptake
in different cells (46,47). Surprisingly, the species origin
(human, rat or mouse) did not seem to affect the bio-
distribution. HEK293T-, OLN-93- and C2C12-EVs had
similar distribution patterns despite the different species
origin of the cells.
Untargeted EVs accumulate in tumour tissueUsing engineered EVs to treat cancer is an attractive
idea and several laboratories worldwide are currently
pursuing EVs as potential cancer treatments. To effi-
ciently target cancer directly with EVs, and not only by
immune-activation using, for example, DC-derived exo-
somes, the EVs need to localize to the tumour tissue in vivo.
Oscar P. B. Wiklander et al.
8(page number not for citation purpose)
Citation: Journal of Extracellular Vesicles 2015, 4: 26316 - http://dx.doi.org/10.3402/jev.v4.26316
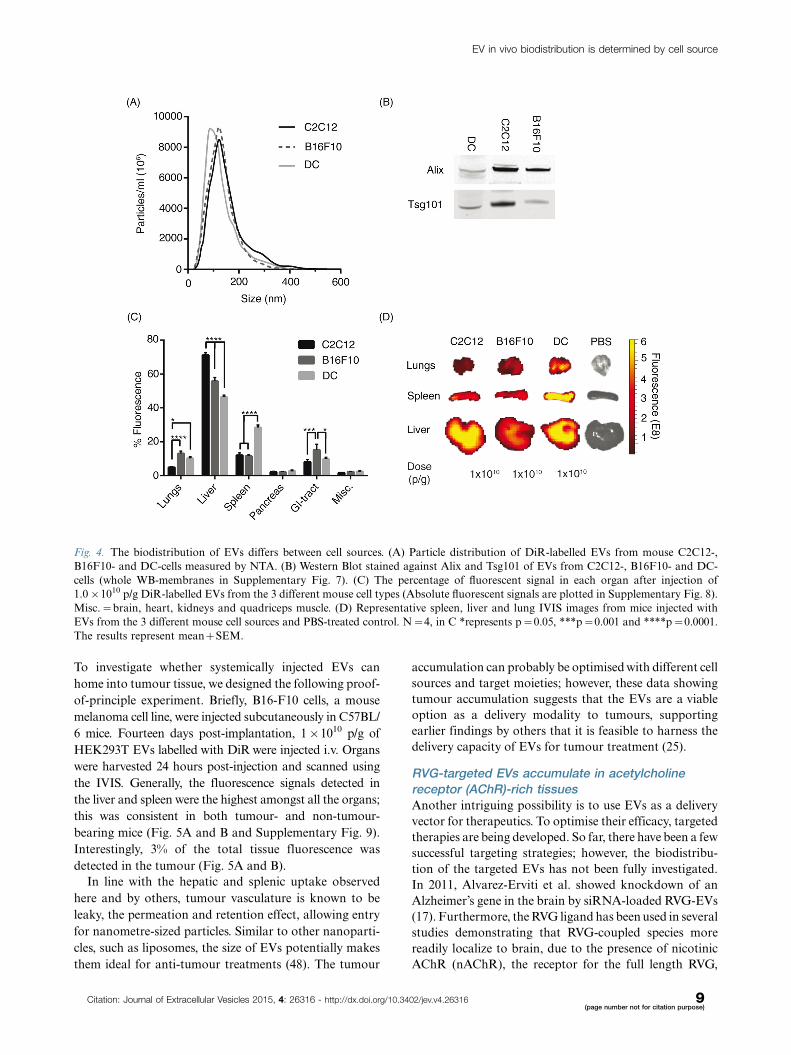
To investigate whether systemically injected EVs can
home into tumour tissue, we designed the following proof-
of-principle experiment. Briefly, B16-F10 cells, a mouse
melanoma cell line, were injected subcutaneously in C57BL/
6 mice. Fourteen days post-implantation, 1�1010 p/g of
HEK293T EVs labelled with DiR were injected i.v. Organs
were harvested 24 hours post-injection and scanned using
the IVIS. Generally, the fluorescence signals detected in
the liver and spleen were the highest amongst all the organs;
this was consistent in both tumour- and non-tumour-
bearing mice (Fig. 5A and B and Supplementary Fig. 9).
Interestingly, 3% of the total tissue fluorescence was
detected in the tumour (Fig. 5A and B).
In line with the hepatic and splenic uptake observed
here and by others, tumour vasculature is known to be
leaky, the permeation and retention effect, allowing entry
for nanometre-sized particles. Similar to other nanoparti-
cles, such as liposomes, the size of EVs potentially makes
them ideal for anti-tumour treatments (48). The tumour
accumulation can probably be optimised with different cell
sources and target moieties; however, these data showing
tumour accumulation suggests that the EVs are a viable
option as a delivery modality to tumours, supporting
earlier findings by others that it is feasible to harness the
delivery capacity of EVs for tumour treatment (25).
RVG-targeted EVs accumulate in acetylcholinereceptor (AChR)-rich tissuesAnother intriguing possibility is to use EVs as a delivery
vector for therapeutics. To optimise their efficacy, targeted
therapies are being developed. So far, there have been a few
successful targeting strategies; however, the biodistribu-
tion of the targeted EVs has not been fully investigated.
In 2011, Alvarez-Erviti et al. showed knockdown of an
Alzheimer’s gene in the brain by siRNA-loaded RVG-EVs
(17). Furthermore, the RVG ligand has been used in several
studies demonstrating that RVG-coupled species more
readily localize to brain, due to the presence of nicotinic
AChR (nAChR), the receptor for the full length RVG,
Fig. 4. The biodistribution of EVs differs between cell sources. (A) Particle distribution of DiR-labelled EVs from mouse C2C12-,
B16F10- and DC-cells measured by NTA. (B) Western Blot stained against Alix and Tsg101 of EVs from C2C12-, B16F10- and DC-
cells (whole WB-membranes in Supplementary Fig. 7). (C) The percentage of fluorescent signal in each organ after injection of
1.0�1010 p/g DiR-labelled EVs from the 3 different mouse cell types (Absolute fluorescent signals are plotted in Supplementary Fig. 8).
Misc.�brain, heart, kidneys and quadriceps muscle. (D) Representative spleen, liver and lung IVIS images from mice injected with
EVs from the 3 different mouse cell sources and PBS-treated control. N�4, in C *represents p�0.05, ***p�0.001 and ****p�0.0001.
The results represent mean�SEM.
EV in vivo biodistribution is determined by cell source
Citation: Journal of Extracellular Vesicles 2015, 4: 26316 - http://dx.doi.org/10.3402/jev.v4.26316 9(page number not for citation purpose)
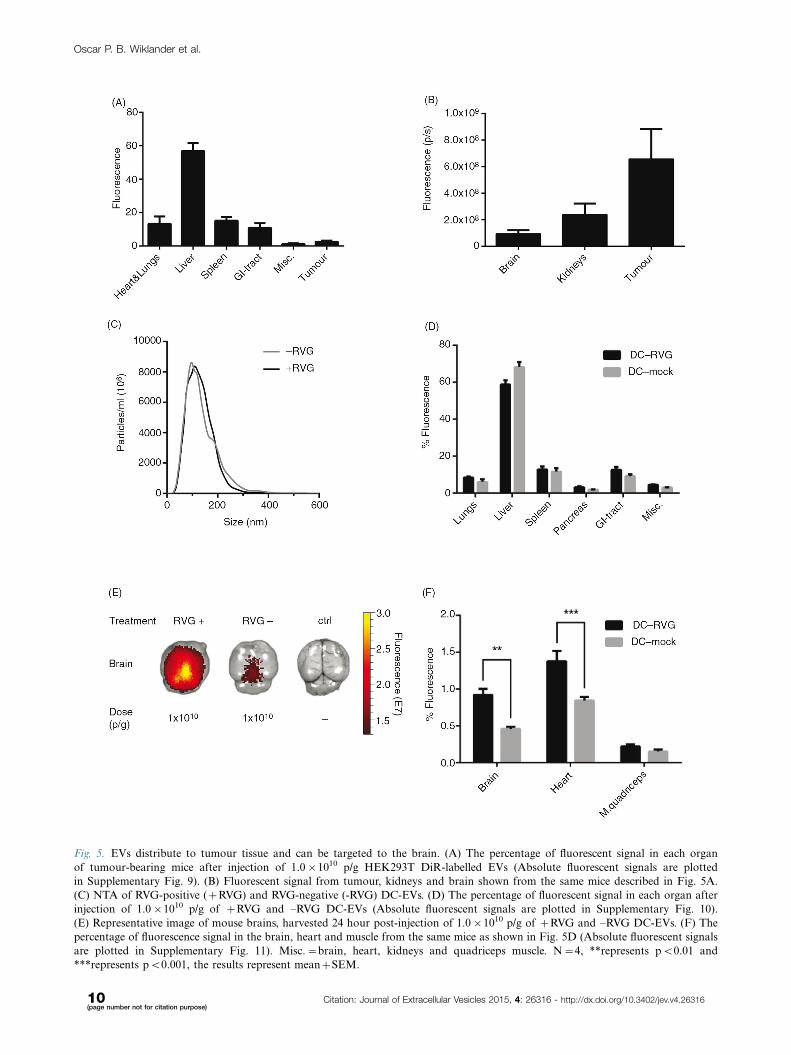
Fig. 5. EVs distribute to tumour tissue and can be targeted to the brain. (A) The percentage of fluorescent signal in each organ
of tumour-bearing mice after injection of 1.0�1010 p/g HEK293T DiR-labelled EVs (Absolute fluorescent signals are plotted
in Supplementary Fig. 9). (B) Fluorescent signal from tumour, kidneys and brain shown from the same mice described in Fig. 5A.
(C) NTA of RVG-positive (�RVG) and RVG-negative (-RVG) DC-EVs. (D) The percentage of fluorescent signal in each organ after
injection of 1.0�1010 p/g of �RVG and �RVG DC-EVs (Absolute fluorescent signals are plotted in Supplementary Fig. 10).
(E) Representative image of mouse brains, harvested 24 hour post-injection of 1.0�1010 p/g of �RVG and �RVG DC-EVs. (F) The
percentage of fluorescence signal in the brain, heart and muscle from the same mice as shown in Fig. 5D (Absolute fluorescent signals
are plotted in Supplementary Fig. 11). Misc.�brain, heart, kidneys and quadriceps muscle. N�4, **represents pB0.01 and
***represents pB0.001, the results represent mean�SEM.
Oscar P. B. Wiklander et al.
10(page number not for citation purpose)
Citation: Journal of Extracellular Vesicles 2015, 4: 26316 - http://dx.doi.org/10.3402/jev.v4.26316

which the RVG-peptide ligand is derived from (17,49�51).
Therefore, the influence of RVG ligand on biodistribution
was assessed by comparing RVG- and non-RVG-targeted
DC-EVs. Before EV harvesting, half of the DCs were
transfected with the fusion protein LAMP2b-RVG, which
targets the RVG peptide to the EV membrane, and the
other half was mock transfected. The NTA profiles of
RVG- and non-RVG DC-EVs were very similar with a
mode size of around 100 nm (Fig. 5C). The targeted
and untargeted EVs were subsequently labelled with DiR
and injected i.v. (1.0�1010 p/g) in C57BL/6 (syngeneic)
mice. The organs were harvested 24 hours post-injection
and imaged using the IVIS. The distribution of both
RVG and non-RVG-EVs followed the distribution of un-
modified EVs with the strongest signal detected in liver,
spleen, GI-tract and lungs (Fig. 5D and Supplementary
Fig. 10). Interestingly, the RVG-EVs displayed a signifi-
cantly increased signal in brain (pB0.01), heart (pB0.001)
and (higher but not significant) muscle, compared to the
non-RVG EV group (Fig. 5E and F and Supplementary
Fig. 11). In line with previous reports of RVG-labelled
liposomes and siRNA (17,49�51), a 2-fold greater accu-
mulation in brain was observed with RVG-EVs as com-
pared to non-targeted EVs. Besides the brain, the muscle
and heart also express high levels of the nAChR and
muscarinergic AChR, respectively (52�55); hence, further
supporting our findings of the higher signal intensities
when applying RVG-EVs in these 2 organs. The small but
significant change in the distribution of RVG-EVs shows
the sensitivity of the labelling technique and furthermore
corroborates the fact that we are indeed tracking EVs
as opposed to free dye.
ConclusionEVs and particularly exosomes are being increasingly
studied, as they appear to play an important role in inter-
cellular communication, complementing the endocrine
and paracrine systems. This has led to a number of re-
ported attempts to use EVs as therapeutic agents or disease
biomarkers in vivo. However, their biodistribution has
been less studied despite knowledge of this being essential
for understanding EV biology and for potential therapeu-
tic applications. To our knowledge, this is the first time
a comparative study is performed evaluating how the
biodistribution of EVs in vivo is affected by different
EV doses, routes of injection and cellular origin of EVs.
We also assessed how targeted EVs as well as tumour
burden influenced biodistribution. These results highlight
the important considerations for the design of in vivo
therapeutic studies using EVs.
Authors’ contributionsJN, OW, IM, AO, YG, HS, GC, PV, YL, NH and SEA
designed, performed the experiments and wrote the manu-
script. PM and PJ supervised the immunohistochemistry
experiments, KLB provided primary MSCs, and LAE,
MJW and CIE provided inputs on the manuscript draft.
All authors contributed with correction of the manuscript.
Conflict of interest and fundingThe authors declare no competing financial interests.
This project was funded by the Swedish Research Council
(VR-Med and EuroNanoMedII), Swedish Cancer Society
and SEA holds a research fellowship form the Swedish
Society of Medical Research (SSMF). JN and OW are both
recipients of Karolinska Institutet MD/PhD grants. AO is
supported by the Wellcome Trust and YL is supported by the
Agency for Science, Technology and Research (A*STAR),
Singapore. IM is supported by a Postdoctoral MOBILITAS
Fellowship of the Estonian Science Foundation and by the
EU IMI (Innovative Medicines Initiative) project COM-
PACT (Collaboration on the optimisation of macromolecular
pharmaceutical access to cellular targets). HS is supported by
the national scholarship program Kristjan Jaak, which is
funded and managed by Archimedes Foundation in colla-
boration with the Estonian Ministry of Education and
Research. NH and KLB are supported by Swedish Re-
search Council (VR K2014-64X-20742-07-5) and Vinnova
(2010-00501).
References
1. EL Andaloussi S, Mager I, Breakefield XO, Wood MJ.
Extracellular vesicles: biology and emerging therapeutic op-
portunities. Nat Rev Drug Discov. 2013;12:347�57.
2. Ratajczak J, Miekus K, Kucia M, Zhang J, Reca R,
Dvorak P, et al. Embryonic stem cell-derived microvesicles
reprogram hematopoietic progenitors: evidence for horizontal
transfer of mRNA and protein delivery. Leukemia. 2006;20:
847�56.
3. Peinado H, Aleckovic M, Lavotshkin S, Matei I, Costa-Silva B,
Moreno-Bueno G, et al. Melanoma exosomes educate bone
marrow progenitor cells toward a pro-metastatic phenotype
through MET. Nat Med. 2012;18:883�91.
4. Al-Nedawi K, Meehan B, Micallef J, Lhotak V, May L,
Guha A, et al. Intercellular transfer of the oncogenic receptor
EGFRvIII by microvesicles derived from tumour cells. Nat
Cell Biol. 2008;10:619�24.
5. Valadi H, Ekstrom K, Bossios A, Sjostrand M, Lee JJ, Lotvall
JO. Exosome-mediated transfer of mRNAs and microRNAs
is a novel mechanism of genetic exchange between cells. Nat
Cell Biol. 2007;9:654�9.
6. Keller S, Ridinger J, Rupp AK, Janssen JW, Altevogt P.
Body fluid derived exosomes as a novel template for clinical
diagnostics. J Transl Med. 2011;9:86.
7. Street JM, Barran PE, Mackay CL, Weidt S, Balmforth C,
Walsh TS, et al. Identification and proteomic profiling of
exosomes in human cerebrospinal fluid. J Transl Med. 2012;
10:5.
8. Lasser C, Alikhani VS, Ekstrom K, Eldh M, Paredes PT, Bossios
A, et al. Human saliva, plasma and breast milk exosomes contain
RNA: uptake by macrophages. J Transl Med. 2011;9:9.
9. Pisitkun T, Shen RF, Knepper MA. Identification and pro-
teomic profiling of exosomes in human urine. Proc Natl Acad
Sci USA. 2004;101:13368�73.
10. Yamada T, Inoshima Y, Matsuda T, Ishiguro N. Comparison
of methods for isolating exosomes from bovine milk. J Vet
Med Sci. 2012;74:1523�5.
EV in vivo biodistribution is determined by cell source
Citation: Journal of Extracellular Vesicles 2015, 4: 26316 - http://dx.doi.org/10.3402/jev.v4.26316 11(page number not for citation purpose)
11. Bellingham SA, Guo BB, Coleman BM, Hill AF. Exosomes:
vehicles for the transfer of toxic proteins associated with
neurodegenerative diseases? Front Physiol. 2012;3:124.
12. Emmanouilidou E, Melachroinou K, Roumeliotis T, Garbis SD,
Ntzouni M, Margaritis LH, et al. Cell-produced alpha-synuclein
is secreted in a calcium-dependent manner by exosomes and
impacts neuronal survival. J Neurosci. 2010;30:6838�51.
13. Lai RC, Chen TS, Lim SK. Mesenchymal stem cell exosome:
a novel stem cell-based therapy for cardiovascular disease.
Regen Med. 2011;6:481�92.
14. Timmers L, Lim SK, Hoefer IE, Arslan F, Lai RC,
Van Oorschot AA, et al. Human mesenchymal stem cell-
conditioned medium improves cardiac function following
myocardial infarction. Stem Cell Res. 2011;6:206�14.
15. Gatti S, Bruno S, Deregibus MC, Sordi A, Cantaluppi V, Tetta
C, et al. Microvesicles derived from human adult mesenchymal
stem cells protect against ischaemia-reperfusion-induced acute
and chronic kidney injury. Nephrol Dial Transplant. 2011;26:
1474�83.
16. Zitvogel L, Regnault A, Lozier A, Wolfers J, Flament C, Tenza
D, et al. Eradication of established murine tumors using
a novel cell-free vaccine: dendritic cell-derived exosomes. Nat
Med. 1998;4:594�600.
17. Alvarez-Erviti L, Seow Y, Yin H, Betts C, Lakhal S, Wood MJ.
Delivery of siRNA to the mouse brain by systemic injection of
targeted exosomes. Nat Biotechnol. 2011;29:341�5.
18. Kordelas L, Rebmann V, Ludwig AK, Radtke S, Ruesing J,
Doeppner TR, et al. MSC-derived exosomes: a novel tool to
treat therapy-refractory graft-versus-host disease. Leukemia.
2014;28:970�3.
19. Grange C, Tapparo M, Bruno S, Chatterjee D, Quesenberry
PJ, Tetta C, et al. Biodistribution of mesenchymal stem
cell-derived extracellular vesicles in a model of acute kidney
injury monitored by optical imaging. Int J Mol Med. 2014;33:
1055�63.
20. Jang SC, Kim SR, Yoon YJ, Park KS, Kim JH, Lee J, et al.
In vivo kinetic biodistribution of nano-sized outer membrane
vesicles derived from bacteria. Small. 2014;11:456�61.
21. Lai CP, Mardini O, Ericsson M, Prabhakar S, Maguire CA,
Chen JW, et al. Dynamic biodistribution of extracellular vesicles
in vivo using a multimodal imaging reporter. ACS Nano. 2014;
8:483�94.
22. Takahashi Y, Nishikawa M, Shinotsuka H, Matsui Y,
Ohara S, Imai T, et al. Visualization and in vivo tracking of
the exosomes of murine melanoma B16-BL6 cells in mice after
intravenous injection. J Biotechnol. 2013;165:77�84.
23. Ignowski JM, Schaffer DV. Kinetic analysis and modeling
of firefly luciferase as a quantitative reporter gene in live
mammalian cells. Biotechnol Bioeng. 2004;86:827�34.
24. Smyth T, Kullberg M, Malik N, Smith-Jones P, Graner MW,
Anchordoquy TJ. Biodistribution and delivery efficiency of
unmodified tumor-derived exosomes. J Control Release. 2014;
199C:145�55.
25. Ohno S, Takanashi M, Sudo K, Ueda S, Ishikawa A,
Matsuyama N, et al. Systemically injected exosomes targeted
to EGFR deliver antitumor microRNA to breast cancer cells.
Mol Ther. 2013;21:185�91.
26. Tian Y, Li S, Song J, Ji T, Zhu M, Anderson GJ, et al. A
doxorubicin delivery platform using engineered natural mem-
brane vesicle exosomes for targeted tumor therapy. Biomater-
ials. 2014;35:2383�90.
27. Le Blanc K, Frassoni F, Ball L, Locatelli F, Roelofs H,
Lewis I, et al. Mesenchymal stem cells for treatment of steroid-
resistant, severe, acute graft-versus-host disease: a phase II
study. Lancet. 2008;371:1579�86.
28. Le Blanc K, Samuelsson H, Gustafsson B, Remberger M,
Sundberg B, Arvidson J, et al. Transplantation of mesenchy-
mal stem cells to enhance engraftment of hematopoietic stem
cells. Leukemia. 2007;21:1733�8.
29. Dragovic RA, Gardiner C, Brooks AS, Tannetta DS, Ferguson
DJ, Hole P, et al. Sizing and phenotyping of cellular vesicles
using Nanoparticle tracking analysis. Nanomedicine. 2011;7:
780�8.
30. Niska JA, Meganck JA, Pribaz JR, Shahbazian JH, Lim E,
Zhang N, et al. Monitoring bacterial burden, inflammation
and bone damage longitudinally using optical and muCT
imaging in an orthopaedic implant infection in mice. PLoS
One. 2012;7:e47397.
31. Patel AR, Lim E, Francis KP, Singh M. Opening up the
optical imaging window using nano-luciferin. Pharm Res.
2014;31:3073�84.
32. Herschman HR. Molecular imaging: looking at problems,
seeing solutions. Science. 2003;302:605�8.
33. Hilderbrand SA, Weissleder R. Near-infrared fluorescence:
application to in vivo molecular imaging. Curr Opin Chem
Biol. 2010;14:71�9.
34. Luo S, Zhang E, Su Y, Cheng T, Shi C. A review of NIR
dyes in cancer targeting and imaging. Biomaterials. 2011;32:
7127�38.
35. Ntziachristos V, Bremer C, Weissleder R. Fluorescence ima-
ging with near-infrared light: new technological advances
that enable in vivo molecular imaging. Eur Radiol. 2003;13:
195�208.
36. Kalchenko V, Shivtiel S, Malina V, Lapid K, Haramati S,
Lapidot T, et al. Use of lipophilic near-infrared dye in whole-
body optical imaging of hematopoietic cell homing. J Biomed
Optics. 2006;11:050507.
37. Mathivanan S, Simpson RJ. ExoCarta: a compendium of
exosomal proteins and RNA. Proteomics. 2009;9:4997�5000.
38. Lopez-Berestein G, Kasi L, Rosenblum MG, Haynie T, Jahns
M, Glenn H, et al. Clinical pharmacology of 99mTc-labeled
liposomes in patients with cancer. Cancer Res. 1984;44:375�8.
39. Rank A, Nieuwland R, Crispin A, Grutzner S, Iberer M, Toth
B, et al. Clearance of platelet microparticles in vivo. Platelets.
2011;22:111�6.
40. Ostro MJ, Cullis PR. Use of liposomes as injectable-drug
delivery systems. Am J Hosp Pharm. 1989;46:1576�87.
41. Liu D, Mori A, Huang L. Role of liposome size and RES
blockade in controlling biodistribution and tumor uptake
of GM1-containing liposomes. Biochim Biophys Acta. 1992;
1104:95�101.
42. Moghimi SM, Hunter AC, Murray JC. Long-circulating and
target-specific nanoparticles: theory to practice. Pharmacol
Rev. 2001;53:283�318.
43. Sarin H. Physiologic upper limits of pore size of different
blood capillary types and another perspective on the dual
pore theory of microvascular permeability. J Angiogenesis Res.
2010;2:14.
44. Garnett MC, Kallinteri P. Nanomedicines and nanotoxi-
cology: some physiological principles. Occup Med. 2006;56:
307�11.
45. Kupiec-Weglinski JW, Austyn JM, Morris PJ. Migration
patterns of dendritic cells in the mouse. Traffic from the blood,
and T cell-dependent and -independent entry to lymphoid
tissues. J Exp Med. 1988;167:632�45.
46. Rana S, Yue S, Stadel D, Zoller M. Toward tailored exosomes:
the exosomal tetraspanin web contributes to target cell selection.
Int J Biochem Cell Biol. 2012;44:1574�84.
47. Rana S, Zoller M. Exosome target cell selection and the
importance of exosomal tetraspanins: a hypothesis. Biochem
Soc Trans. 2011;39:559�62.
Oscar P. B. Wiklander et al.
12(page number not for citation purpose)
Citation: Journal of Extracellular Vesicles 2015, 4: 26316 - http://dx.doi.org/10.3402/jev.v4.26316
48. Bae YH, Park K. Targeted drug delivery to tumors: myths,
reality and possibility. J Control Release. 2011;153:198�205.
49. Kumar P, Wu H, McBride JL, Jung KE, Kim MH, Davidson
BL, et al. Transvascular delivery of small interfering RNA to
the central nervous system. Nature. 2007;448:39�43.
50. Mazarakis ND, Azzouz M, Rohll JB, Ellard FM, Wilkes FJ,
Olsen AL, et al. Rabies virus glycoprotein pseudotyping
of lentiviral vectors enables retrograde axonal transport and
access to the nervous system after peripheral delivery. Hum
Mol Genet. 2001;10:2109�21.
51. Pulford B, Reim N, Bell A, Veatch J, Forster G, Bender H,
et al. Liposome-siRNA-peptide complexes cross the blood�brain barrier and significantly decrease PrP on neuronal cells
and PrP in infected cell cultures. PLoS One. 2010;5:e11085.
52. Boksa P, Quirion R. [3H]N-methyl-carbamylcholine, a new
radioligand specific for nicotinic acetylcholine receptors in
brain. Eur J Pharmacol. 1987;139:323�33.
53. Lentz TL, Burrage TG, Smith AL, Crick J, Tignor GH. Is the
acetylcholine receptor a rabies virus receptor? Science. 1982;
215:182�4.
54. Lentz TL, Burrage TG, Smith AL, Tignor GH. The acetylcho-
line receptor as a cellular receptor for rabies virus. Yale J Biol
Med. 1983;56:315�22.
55. Peralta EG, Ashkenazi A, Winslow JW, Smith DH,
Ramachandran J, Capon DJ. Distinct primary structures,
ligand-binding properties and tissue-specific expression of
four human muscarinic acetylcholine receptors. EMBO J.
1987;6:3923�9.
EV in vivo biodistribution is determined by cell source
Citation: Journal of Extracellular Vesicles 2015, 4: 26316 - http://dx.doi.org/10.3402/jev.v4.26316 13(page number not for citation purpose)