Larval and Post-Larval Stages of Pacific Oyster (Crassostrea gigas) Are Resistant to Elevated CO2
Upload
khangminh22Category
view
1download
0
HAL Id: inserm-00663539https://www.hal.inserm.fr/inserm-00663539
Submitted on 27 Jan 2012
HAL is a multi-disciplinary open accessarchive for the deposit and dissemination of sci-entific research documents, whether they are pub-lished or not. The documents may come fromteaching and research institutions in France orabroad, or from public or private research centers.
L’archive ouverte pluridisciplinaire HAL, estdestinée au dépôt et à la diffusion de documentsscientifiques de niveau recherche, publiés ou non,émanant des établissements d’enseignement et derecherche français ou étrangers, des laboratoirespublics ou privés.
Expression profiling of prospero in the Drosophila larvalchemosensory organ: Between growth and outgrowth.
Laure Guenin, Mahatsangy Raharijaona, Rémi Houlgatte, Fawzia Baba-Aissa
To cite this version:Laure Guenin, Mahatsangy Raharijaona, Rémi Houlgatte, Fawzia Baba-Aissa. Expression profilingof prospero in the Drosophila larval chemosensory organ: Between growth and outgrowth.. BMCGenomics, BioMed Central, 2010, 11 (1), pp.47. �10.1186/1471-2164-11-47�. �inserm-00663539�

RESEARCH ARTICLE Open Access
Expression profiling of prospero in the Drosophilalarval chemosensory organ: Between growth andoutgrowthLaure Guenin1,2, Mahatsangy Raharijaona3,4, Rémi Houlgatte3,4, Fawzia Baba-Aissa2*
Abstract
Background: The antenno-maxilary complex (AMC) forms the chemosensory system of the Drosophila larva and is
involved in gustatory and olfactory perception. We have previously shown that a mutant allele of the
homeodomain transcription factor Prospero (prosVoila1, V1), presents several developmental defects including
abnormal growth and altered taste responses. In addition, many neural tracts connecting the AMC to the central
nervous system (CNS) were affected. Our earlier reports on larval AMC did not argue in favour of a role of pros in
cell fate decision, but strongly suggested that pros could be involved in the control of other aspect of neuronal
development. In order to identify these functions, we used microarray analysis of larval AMC and CNS tissue
isolated from the wild type, and three other previously characterised prospero alleles, including the V1 mutant,
considered as a null allele for the AMC.
Results: A total of 17 samples were first analysed with hierarchical clustering. To determine those genes affected
by loss of pros function, we calculated a discriminating score reflecting the differential expression between V1
mutant and other pros alleles. We identified a total of 64 genes in the AMC. Additional manual annotation using all
the computed information on the attributed role of these genes in the Drosophila larvae nervous system, enabled
us to identify one functional category of potential Prospero target genes known to be involved in neurite
outgrowth, synaptic transmission and more specifically in neuronal connectivity remodelling. The second category
of genes found to be differentially expressed between the null mutant AMC and the other alleles concerned the
development of the sensory organs and more particularly the larval olfactory system. Surprisingly, a third category
emerged from our analyses and suggests an association of pros with the genes that regulate autophagy, growth
and insulin pathways. Interestingly, EGFR and Notch pathways were represented in all of these three functional
categories. We now propose that Pros could perform all of these different functions through the modulation of
these two antagonistic and synergic pathways.
Conclusions: The current data contribute to the clarification of the prospero function in the larval AMC and show
that pros regulates different function in larvae as compared to those controlled by this gene in embryos. In the
future, the possible mechanism by which Pros could achieve its function in the AMC will be explored in detail.
BackgroundIn Drosophila, some external sensory organs found in
the anterior region of larvae are composed of many neu-
rons and support cells that seem to represent an aggre-
gation of several sensory units. This is the case for the
antenno-maxillary complex (AMC) that forms the
chemosensory system of the Drosophila larva. The che-
mosensory apparatus of the larval head is formed during
embryogenesis [1] and consists essentially of three
major sensilla complexes on the cephalic lobe, the dorsal
(DO), terminal (TO) and ventral organs (VO), and a ser-
ies of pharyngeal sensilla [2,3]. While the DO appears to
be a mixed smell and taste organ, the TO, VO and
pharyngeal sensilla may be exclusively gustatory [4-7].
In previous studies, we described a mutant allele of
the transcription factor prospero (Voila1, V1) that is
* Correspondence: [email protected]é de Bourgogne, Facultés des Sciences, Unité Mixte de Recherche
5548 Associée au Centre National de la Recherche Scientifique, 6, Bd Gabriel,
21 000 Dijon, France
Guenin et al. BMC Genomics 2010, 11:47
http://www.biomedcentral.com/1471-2164/11/47
© 2010 Guenin et al; licensee BioMed Central Ltd. This is an Open Access article distributed under the terms of the Creative CommonsAttribution License (http://creativecommons.org/licenses/by/2.0), which permits unrestricted use, distribution, and reproduction inany medium, provided the original work is properly cited.

associated with several alterations in both AMC and the
CNS [8]. V1 homozygotes die before forming pupae.
Surviving larvae remain much smaller than wild-type
individuals and are impaired for their response to salt
and sucrose [9]. Using a set of previously characterised
Voila alleles (prosV) that express different levels of Pros-
pero (Pros) protein, we found that the level of Pros
expression detected in the embryonic precursor region
of the AMC, was related to the degree of alteration of
larval taste [10]. In embryonic and larval AMC, Pros is
expressed in the same cell cluster (~50 cells), including
neuronal cells (~10 cells) and many accessory cells but
no glial cells [8].
The pros gene encodes a transcription factor protein
that contains a highly divergent putative homeodomain
and a conserved Prospero domain that are both necessary
for sequence-specific DNA binding and Prospero nuclear
localisation [11-13]. Pros is known to be expressed in
neuronal precursor cells [14,15] and participates in cell
fate decision in both neuroblasts and sensory organ
lineages [16-19]. Pros has been shown to control axonal
and dendritic outgrowth [15], glial development [20,21]
and to be a key regulator of mitotic activity in embryos
[22]. Pros affects several cell cycle genes and can either
promote or inhibit them depending on the cellular or the
developmental context [23,24]. More recently Choksi et
al. [25] showed that in the embryonic nerve cord Pros
repressed target genes such as cell cycle genes required
for self-renewal, and was also required to activate genes
involved in terminal differentiation.
In a previous study on the larval antenno-maxillary
complex, we showed that loss of pros function did not
alter the mitotic activity or the final number of neurons.
By contrast, many neural tracts connecting the AMC to
the CNS are affected [8]. Therefore, it is possible that
one key role of Pros in the larval AMC is to control the
expression of genes involved in neuron-specific develop-
ment such as axon routing and/or neurite outgrowth.
However, as Pros is expressed in non-neuronal cells in
the AMC (accessory cells), it is likely that, it regulates
genes that are also involved in other functions.
In order to identify the Pros target genes associated
with this organ, we performed microarray analysis on
larval AMC tissue isolated from the wild type, the V1
mutant and two previously characterised prospero alleles
[8], V13 (prosVoila13) and V24 (prosVoila24, see also
Table 1). To establish the AMC specificity of these
genes, we included analysis of samples from isolated lar-
val CNS for these four alleles.
Our findings indicate that, in this sensory organ, pros
is mainly associated with the regulation of genes that
are essential for correct routing of neural processes and
synaptic transmission. Many of these genes are involved
in the development and remodelling of the nervous
system during metamorphosis. Interestingly, we also
found that loss of pros function induced the misregula-
tion of a subset of genes important for growth, and
autophagy. Finally, the possible role of EGFR (the epi-
dermal growth factor receptor) and the N (Notch) path-
way in regulating all of these functions is discussed.
ResultsThe developing AMC and Pros expression
We have previously shown [8] that in the developing
AMC, Pros is always expressed in the same cluster of
cells. In addition, neither mitotic activity nor apoptosis
was observed during the third instar larval stage or at
late embryonic stages suggesting that the final number
of Pros expressing cells is fixed before the end of
embryogenesis [8]. This hypothesis was further con-
firmed by analysing mitotic activity in the developing
wild type AMC (prosVoila14, V14) using an H3p mar-
ker. Our results showed that the H3p labelling disap-
peared completely after the embryonic stages 12-13
[Additional file 1] indicating that additional cells are not
provided until the last larval stage. However, some Pros
expressing cells grew in size at the LIII stage. Scoring
the different Pros+ cell type morphology (Figure 1,
Table 2), we found that the wild type larval AMC (TO
and DO) was composed of 8 (± 1) large Pros+ cells
(most probably accessory cells) and 40 (± 4.1) small
Pros+ cells. Among the latter, 10.7 (± 2.8) were neuro-
nal cells [8]. Pros is never expressed in glial cells. Inter-
estingly, pros loss of function affected the axonal
pathway in the embryonic AMC, but produced the cor-
rect number of neuronal cells [8] and curiously induced
an excess of glial cells, which, we suspect, originated
from incorrect peripheral glial cells migration. There-
fore, if Pros was expressed in the same number of cells
in the embryo and larvae and since no additional cell
division was seen after stage 13, it is likely that pros is
not involved in cell fate choice in the larval AMC.
To better clarify the role of pros in the AMC, we carried
out microarray analysis on wild type (V14) and three
prospero mutants (V1, V13, V24, see also Table 1),
which present different expression levels of Pros [8,10].
V1 is considered as a null pros allele for the larval AMC
as no Pros protein is detected in this organ. It presents
an abnormal taste response to sucrose and NaCl (indif-
ferent to both substances), and shows an alteration of
the neural connections between the AMC and CNS as
well as arborisation defects in larval neuromuscular
junction [10]. In the V1 larval CNS, Pros is still
expressed but at a lower level than in the wild type V14.
V1 larval CNS also shows several defects, which include
early initiation of cell death and abnormal sub-cellular
localization of the Pros protein [Additional file 2: sup-
plemental figure A].
Guenin et al. BMC Genomics 2010, 11:47
http://www.biomedcentral.com/1471-2164/11/47
Page 2 of 15

Table 1 Overview of the phenotypes associated with the different prosV alleles.
Allele Genotype Stage of lethality Larval tasteresponse
Pros expression inAMC
Pros expressionin CNS
Axonal routing inAMC
V14 Wild type (complete PGal4remobilization)
Viable Normal Normal Normal Normal
V13 Partial pGal4 excision (remainingof 718 bp)
Young adult < 2days old
Normal Normal altered Normal
V24 Partial pGal4 excision (remainingof 7400 pb)
pupal Intermediate Normal altered Normal
V1 full length pGal4 transposon(12900 pb)
larva Altered absent altered Misrouting
(redrawn from Guenin et al. [8]).
In the prosV1 (V1) allele, the full length PGal4 transposon is inserted upstream of the pros coding region (-216 bp). prosV14 (V14) results from the correct and
total remobilization of the transposon, in this strain the wild type phenotype is restored. In prosV24 (V24) and prosV13 (V13), the PGal4 element has been partially
removed, respectively 7400 and 718 bp remain inserted 216 bp upstream the pros start site. The peak of developmental lethality, the taste response of late
homozygous 2nd instar larva, Pros expression level in larvae and axonal misrouting are indicated for each prosV allele.
The larval taste response was measured towards 0.1 M sucrose and 0.3 M NaCl concentration that are known to respectively attract or repulse wild type
Drosophila. V1 mutants were indifferent to both substances (altered taste response), V24 showed an intermediate response: they were repulsed by NaCl but
remained indifferent to sucrose and V13 and V14 present a normal taste response to both substances. The Pros expression pattern is indicated by comparison to
the V14 wild type: In the AMC, V1 showed no Pros expression but for the other alleles, Pros expression pattern was similar to V14. In the CNS, all mutant alleles
showed a distinct altered expression pattern as compared to the wild type (further descriptions of the Pros pattern are found in the text and in [Additional file
2]).
Figure 1 AMC region from third instar larvae observed by optical microscopy. (A) Bright-field view of the larval AMC region (dorsal view,
anterior down), the hooks appear in dark. Cells that constitute the AMC are located on either side of the hooks. (B) 3D reconstruction of AMC
(TO +DO), labelled with Pros (red) and Elav (green) that labels neuronal cells. (B’1-3) Zoomed view of a confocal section of the framed region in
B showing respectively the Pros (B’1), Pros/Elav (B’2) and Elav (B’3) staining; Anti-Prospero labels two types of Pros expressing cells (Pros+): large
(arrowheads in B’1) and small cells (arrows in B’1). Some of the small Pros+ cells express Elav (B’2). Scale bars represent 10 μm.
Guenin et al. BMC Genomics 2010, 11:47
http://www.biomedcentral.com/1471-2164/11/47
Page 3 of 15

V13 and V24 are both derived from the V1 allele and
result from incomplete excision of the PGal4 transpo-
son, respectively 7400 and 718 bp remain inserted
upstream of the pros start site (see also Table 1). A pre-
vious study showed that V13 [8] and V24 (Personal
communication) present a correct structure of the larval
AMC and a normal expression level of pros mRNA. No
variation was observed in the number of glia or neuron
cells and the pattern of Pros expression was similar to
that of the wild type V14. Since, V14, V24 and V13 pre-
sent the same expression pattern in the AMC and have
the same genetic background, individual variations
(independent of Pros expression), can be more easily
eliminated by the use of several but similar fly lines.
In the CNS both alleles overexpress (at different
levels) the pros mRNA but present a distinct pattern as
regards to the mitotic activity or to the Pros and Elav
(neuronal cells marker) labelling [Additional file 2]. In
the ventral nerve cord V13 showed a clear hyperplasia
due to an excess of neurons [Additional file 2: supple-
mental figure B]. Finally, mitotic activity, revealed by
anti-pHistone-H3 antibody (H3p) [Additional file 2: sup-
plemental figure C] was strongly increased, especially in
the Optic Lobes of V24. In conclusion, each of V24 and
V13 allele presented a distinct abnormal pattern as com-
pared to the wild type V14. Therefore, we used in the
CNS V13 allele only as its Pros expression pattern was
previously published.
All these alleles were used to for the transcriptome
analysis since they have the same genetic background.
Most specifically, to identify the genes that are misre-
gulated in the AMC, the comparison was made between
the null AMC V1 mutant and the other alleles V14,
V24, V13 as all three present the same wild type expres-
sion pattern in this structure.
It should be mentioned that the role of Pros in the
larvae CNS was not investigated in this study. The CNS
was used to be compared with AMC (for this only V14,
V1 and V13 alleles were selected) and to determine
whether the putative candidate genes identified in the
AMC could be found in the CNS. For this latest pur-
pose, we decided to limit the microarray analysis in the
CNS to the comparison between V14 and V1, since the
V13 allele presents an intermediate Pros expression pat-
tern in the CNS. This avoids misinterpretation of the
CNS data.
Transcription profile of prosV1 larvae
Expression data of a total of 17 samples were analysed,
including both CNS and AMC samples for the four
prosV alleles and 2 to 3 independent RNA extractions
for each allele. We searched for sets of genes participat-
ing in the same biological function (with correlated
expression) and differentially expressed between prosV
mutants. We used the Discriminating Score (DS, see
also Methods section) as the detection method for dif-
ferential expression, smoothed on the hierarchical clus-
tering tree to detect peaks of correlated genes. This
method had the advantage of detecting peaks of optimal
size. This size could not be known a priori. A DS score
can be assigned to each node in the dendrogram. The
node corresponding to the maximum DS score was cho-
sen as the node best fitting the peak.
The results were displayed using TreeView [26]. As it
can be seen in the Figure 2A, a cluster of genes differen-
tially expressed in AMC and CNS tissues and in a Pros
independent manner was observed. The genes of this
cluster (AMC tissue specific signature) were clearly
overexpressed in the AMC while the same genes were
underexpressed for all alleles in the CNS (Figure 2A).
In the next step, we determined those genes affected
by loss of pros function for each organ with the DS. For
the AMC, as V13, V14 and V24 have a normal Pros
expression pattern in this structure, the DS was calcu-
lated for each gene between V1 and all other alleles. For
the CNS, since V13 exhibited a distinct pattern [Addi-
tional file 2], the DS for each gene was calculated
between V1 and the V14 alleles only.
To visualize groups of correlated genes that were dif-
ferentially expressed between V1 and other alleles, the
DS score obtained for the AMC or CNS was plotted
alongside the hierarchical clustering and smoothed in a
sliding windows of 100 genes. As shown in Figure 2B,
different peaks can be detected. Each peak represents
co-expressed genes sensitive to Pros expression. To
avoid the analysis of non-significant variations, we
decided to assess the biological functions of these
groups of genes. We therefore searched for significant
enrichments of Gene Ontology terms (GO) in each clus-
ter using GoMiner [27]. In the AMC, only 3 peaks
(peaks 1-3) could be associated with significant GO
functions (Figure 2B peaks 1, 2 and 3). Complete gene
lists for peaks 1-3 are presented in [Additional file 3 and
4].
In peak 3, the 26 genes overexpressed in V1 AMC
were significantly associated with the over-represented
GO term « signal transducer activity » (GO:0004871, p
= 0.0008, see also Table 3). Significant enrichments of
Table 2 Pros expressing cells in the larval AMC
Cell types Large cells Small cells
Alleles Pros+ Pros+ Pros+/Elav+ Elav+
V14 8 ± 1 40.9 ± 4.1 10.7 ± 2.8 65.8 ± 1.4
V1 0 *** 0 *** 0 *** 62.3 ± 0.9
We have quantified the number of Pros expressing cells (Pros+) and neuronal
cells (Elav+) in the third instar larval AMC of wild type (V14) and V1 mutants.
We distinguish two types of Pros+ cells on the basis of their size: large and
small cells. Some small Pros+ cells express Elav markers and are probably
differentiated neurons. In V1 mutants, no more Pros protein is detected in the
larval AMC, but the number of neurons remains unchanged.
Guenin et al. BMC Genomics 2010, 11:47
http://www.biomedcentral.com/1471-2164/11/47
Page 4 of 15

the GO term “proteasome complex” (GO:0000502, p <
10-5, see also Table 3) were found for 9 genes in peak 2.
All of these genes were underexpressed in V1 AMC.
Peak 1, with the highest DS, was common to AMC and
CNS and associated with the over-represented GO term
“cell fate commitment” (GO:0045165, p = 0.0003).
Inside this peak, a cluster of 29 genes overexpressed in
V1 AMC and highly correlated (r>0.9, Figure 2C, Table
3) was isolated and we found a cluster of 86 genes
overexpressed in V1 CNS and correlated (r>0.9, Figure
2D, see also [Additional file 5: Supplemental Table S1])
in the same peak. Interestingly, among the 86 CNS
genes, 28 (represented in red in the Figure 2D) also
belonged to the AMC gene list (see also Table 3 and
[Additional file 5: Supplemental Table S1]).
Finally, to assess our microarray analysis, we quanti-
fied the expression of seven selected genes by Q-PCR.
As shown in Table 4, our results were consistent with
Figure 2 Gene expression analyses. (A) Hierarchical clustering of 5950 genes for a total of 17 samples relative to the larval AMC and CNS of
the different prosV mutants. Each row represents a gene and each column a sample. For each organ, the samples at the top of the image are
classified according to the severity of their phenotypes (from wild type to the most severe phenotype: V14, V13, V24 and V1). Each cell in the
matrix corresponds to the expression level of one gene in a sample (see colour scale at the bottom of the image). The yellow frames represent
the AMC tissue specific signature and contain the genes that are differentially expressed between AMC and the CNS independently of Pros
expression. (B) Discriminating scores (DS) smoothed in a window of 100 genes, calculated between V1 and other prosV in the AMC (in red), and
between V1 and V14 in the CNS (in blue), among the gene clusters. In the AMC, three peaks, annotated 1, 2 and 3 (black bars), appear to be
enriched in differentially expressed genes, they have been associated respectively to “cell fate commitment”, “proteasome complex” and “signal
transduction” ontologies. (C) Hierarchical clustering of the 306 genes present in peak 1 in the AMC. Pink frame zooms on a set of highly
correlated (r>0.9) genes that are differentially expressed between V1 and all other alleles in the AMC. These genes are referenced on the right
according to the Drosophila nomenclature (see also Table 3). The dendrogram on the left represents correlation distances between the profiles
of the studied genes. Differentially expressed genes indicated in red were common with CNS. (D) Same as (C) in CNS samples. The Pink framed
region contains 86 genes which are referenced on the right according to the Drosophila nomenclature. Differentially expressed genes indicated
in red were common with AMC. (E) Motif found in the promoting region of the 28 genes common to AMC and CNS (genes indicated in red).
Guenin et al. BMC Genomics 2010, 11:47
http://www.biomedcentral.com/1471-2164/11/47
Page 5 of 15

the microarray data except for the hb (hunchback) gene
found to be overexpressed in the CNS but not in the
AMC. Because the two methods have different sensitiv-
ities, the magnitude of the change determined by micro-
array and real time PCR is not the same. The
orientation of changes, however, is identical.
An interesting observation was that we found highly
correlated genes responding to Pros variation in both
CNS and AMC. This tight correlation in two different
tissues could suggest that these genes may be controlled
by common transcription factors including Pros. We
searched for transcription factor binding sites that were
common to these 28 genes. We used a Gibbs sampling
method [28] on the -1700 to +300 bp promoter region
of these genes. This method allowed the determination
of degenerated motifs, described by a position weight
matrix (PWM), in a set of sequences by iterative
sampling.
We found a motif shown as a Logo [29] in Figure 2E.
It notably included a CAGCTG core. This motif shows
weak and probably not significant similarities with other
Pros motifs previously proposed for Drosophila:
TAAGNCT [25], CACNNCT [12], TAAGACG [30].
Therefore, additional experiments are now necessary to
see whether the motif identified in this study could
really bind the Prospero transcription factor in vivo.
Additional manual annotation to specify the role of pros
putative target genes in Drosophila larvae
Our microarray analyses showed that peak 1 contained
29 overexpressed genes associated with the GO annota-
tion, “cell fate commitment” (Table 3). These data are
not consistent with our previous studies showing that
pros is not involved in cell fate determination in the lar-
val AMC [8]. We were intrigued by this discrepancy and
therefore we looked more deeply for the function of
these genes in the larvae. Interestingly, though most of
the genes present in this peak were associated with cell
fate determination in embryos, such evidence was
mostly missing for the larvae peripheral nervous system
(PNS). Thus, it is likely that the GO annotation was
mostly deduced from the reported function of these
genes in Drosophila embryos. Therefore, to more speci-
fically identify the role of these genes in the Drosophila
larva PNS, we used additional manual annotation.
The first step consisted in compiling all of the infor-
mation available on the role attributed to each of the 64
genes identified from peaks 1-3, but most specifically in
Drosophila larvae. The information was collected using
Flybase, mutant analysis, associated phenotypes, research
articles and microarray data. As much as possible, we
selected only data that reported the function of these
genes in the larval nervous system and more specifically
the sensory system. Out of the 64 genes, we found that
27 had unknown biological functions or had not been
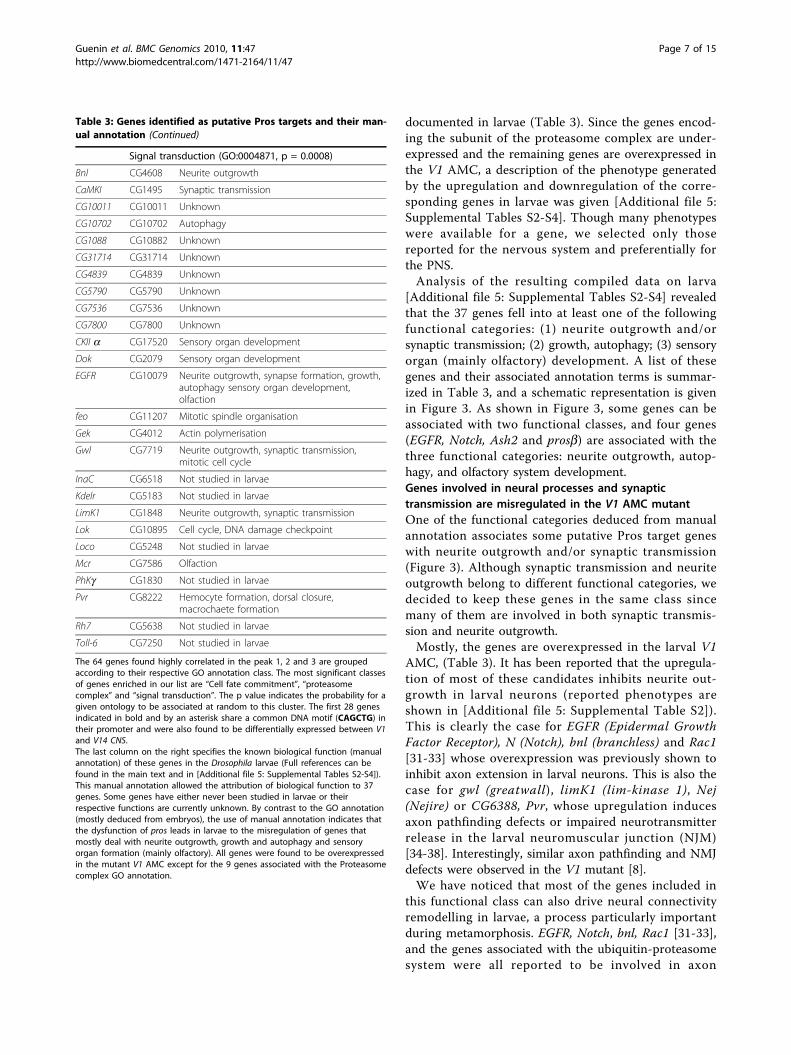
Table 3 Genes identified as putative Pros targets and
their manual annotation
Genes symbol Biological function in larvae (manualannotation)
Cell fate commitment (GO:0045165, p = 0.0003)
aEst1* CG1031 Sensory neuron morphogenesis
Art3* CG6563 Not studied in larvae
Ash2* CG6677 Neurite outgrowth, synapse formation, growth,sensory organ development
CG10632* CG10632 Unknown
CG10671* CG10671 Unknown
CG3021* CG3021 Unknown
CG31637* CG31637 Unknown
CG31961* CG31961 Unknown
CG31731* CG31731 Unknown
CG6388 CG6388 Neurite outgrowth
CG7878* CG7878 Unknown
CG8155* CG8155 Unknown
DPAL1* CG12130 Neuropeptide biosynthesis
FK506-bp1*
CG6226 Autophagy; growth
Ftz-F1* CG4059 Autophagy, sensory organ formation, olfaction
Hb* CG9786 Labial segment formation including senseorgan
Iap2* CG8293 Autophagy, sensory organ development
Inx3* CG1448 Not studied in larvae
Keren* CG32179 Autophagy, sensory organ development
Mbo* CG6819 Tracheal system development
Nak* CG10637 Not studied in larvae
Nej * CG15319 Synaptic transmission, autophagy
Notch* CG3936 Neurite outgrowth, nutrient sensing/growth,sense organ formation, olfaction
Pelo* CG3959 Not studied in larvae
Psq* CG2368 Sensory organ development, olfaction
Rac1* CG2248 Neurite outgrowth, sensory organ development
Tollo* CG6890 Synaptogenesis, wing development, immuneresponse
TFIIs* CG3710 Not studied in larvae
LK6 CG17342 Autophagy growth, nutrient sensor mechanism,
Proteasome complex (GO:0000502, p < 10-5,)
Pros 26.4 CG5289 Neuronal remodelling, Autophagy
Prosb2 CG3329 Neuronal remodelling, Synaptic transmission,autophagy, sensory organ formation
Pros26 CG4097 Neuronal remodelling, Synaptic transmission,autophagy
Prosa6 CG18495 Neuronal remodelling, Synaptic transmission,autophagy
Prosa7 CG1519 Neuronal remodelling, Synaptic transmission,autophagy
ProsMA5 CG10938 Not studied in larvae
RPN1 CG7762 Neuronal remodelling, Autophagy
RPN2 CG11888 Neuronal remodelling, Autophagy
RPN5 CG1100 Neuronal remodelling, Autophagy
Guenin et al. BMC Genomics 2010, 11:47
http://www.biomedcentral.com/1471-2164/11/47
Page 6 of 15
documented in larvae (Table 3). Since the genes encod-
ing the subunit of the proteasome complex are under-
expressed and the remaining genes are overexpressed in
the V1 AMC, a description of the phenotype generated
by the upregulation and downregulation of the corre-
sponding genes in larvae was given [Additional file 5:
Supplemental Tables S2-S4]. Though many phenotypes
were available for a gene, we selected only those
reported for the nervous system and preferentially for
the PNS.
Analysis of the resulting compiled data on larva
[Additional file 5: Supplemental Tables S2-S4] revealed
that the 37 genes fell into at least one of the following
functional categories: (1) neurite outgrowth and/or
synaptic transmission; (2) growth, autophagy; (3) sensory
organ (mainly olfactory) development. A list of these
genes and their associated annotation terms is summar-
ized in Table 3, and a schematic representation is given
in Figure 3. As shown in Figure 3, some genes can be
associated with two functional classes, and four genes
(EGFR, Notch, Ash2 and prosb) are associated with the
three functional categories: neurite outgrowth, autop-
hagy, and olfactory system development.
Genes involved in neural processes and synaptic
transmission are misregulated in the V1 AMC mutant
One of the functional categories deduced from manual
annotation associates some putative Pros target genes
with neurite outgrowth and/or synaptic transmission
(Figure 3). Although synaptic transmission and neurite
outgrowth belong to different functional categories, we
decided to keep these genes in the same class since
many of them are involved in both synaptic transmis-
sion and neurite outgrowth.
Mostly, the genes are overexpressed in the larval V1
AMC, (Table 3). It has been reported that the upregula-
tion of most of these candidates inhibits neurite out-
growth in larval neurons (reported phenotypes are
shown in [Additional file 5: Supplemental Table S2]).
This is clearly the case for EGFR (Epidermal Growth
Factor Receptor), N (Notch), bnl (branchless) and Rac1
[31-33] whose overexpression was previously shown to
inhibit axon extension in larval neurons. This is also the
case for gwl (greatwall), limK1 (lim-kinase 1), Nej
(Nejire) or CG6388, Pvr, whose upregulation induces
axon pathfinding defects or impaired neurotransmitter
release in the larval neuromuscular junction (NJM)
[34-38]. Interestingly, similar axon pathfinding and NMJ
defects were observed in the V1 mutant [8].
We have noticed that most of the genes included in
this functional class can also drive neural connectivity
remodelling in larvae, a process particularly important
during metamorphosis. EGFR, Notch, bnl, Rac1 [31-33],
and the genes associated with the ubiquitin-proteasome
system were all reported to be involved in axon
Table 3: Genes identified as putative Pros targets and their man-
ual annotation (Continued)
Signal transduction (GO:0004871, p = 0.0008)
Bnl CG4608 Neurite outgrowth
CaMKI CG1495 Synaptic transmission
CG10011 CG10011 Unknown
CG10702 CG10702 Autophagy
CG1088 CG10882 Unknown
CG31714 CG31714 Unknown
CG4839 CG4839 Unknown
CG5790 CG5790 Unknown
CG7536 CG7536 Unknown
CG7800 CG7800 Unknown
CKII a CG17520 Sensory organ development
Dok CG2079 Sensory organ development
EGFR CG10079 Neurite outgrowth, synapse formation, growth,autophagy sensory organ development,olfaction
feo CG11207 Mitotic spindle organisation
Gek CG4012 Actin polymerisation
Gwl CG7719 Neurite outgrowth, synaptic transmission,mitotic cell cycle
InaC CG6518 Not studied in larvae
Kdelr CG5183 Not studied in larvae
LimK1 CG1848 Neurite outgrowth, synaptic transmission
Lok CG10895 Cell cycle, DNA damage checkpoint
Loco CG5248 Not studied in larvae
Mcr CG7586 Olfaction
PhKg CG1830 Not studied in larvae
Pvr CG8222 Hemocyte formation, dorsal closure,macrochaete formation
Rh7 CG5638 Not studied in larvae
Toll-6 CG7250 Not studied in larvae
The 64 genes found highly correlated in the peak 1, 2 and 3 are grouped
according to their respective GO annotation class. The most significant classes
of genes enriched in our list are “Cell fate commitment”, “proteasome
complex” and “signal transduction”. The p value indicates the probability for a
given ontology to be associated at random to this cluster. The first 28 genes
indicated in bold and by an asterisk share a common DNA motif (CAGCTG) in
their promoter and were also found to be differentially expressed between V1
and V14 CNS.
The last column on the right specifies the known biological function (manual
annotation) of these genes in the Drosophila larvae (Full references can be
found in the main text and in [Additional file 5: Supplemental Tables S2-S4]).
This manual annotation allowed the attribution of biological function to 37
genes. Some genes have either never been studied in larvae or their
respective functions are currently unknown. By contrast to the GO annotation
(mostly deduced from embryos), the use of manual annotation indicates that
the dysfunction of pros leads in larvae to the misregulation of genes that
mostly deal with neurite outgrowth, growth and autophagy and sensory
organ formation (mainly olfactory). All genes were found to be overexpressed
in the mutant V1 AMC except for the 9 genes associated with the Proteasome
complex GO annotation.
Guenin et al. BMC Genomics 2010, 11:47
http://www.biomedcentral.com/1471-2164/11/47
Page 7 of 15

Figure 3 Schematic representation of the overlapping function attributed to the AMC putative Pros target genes. The functional
categories were established using a manual annotation (the criteria used for this annotation are indicated in the text, see also for further
phenotypic description and corresponding references [Additional file 5: Supplemental Tables S2-S4]). The three functional groups identified are
represented by three distinct colored sets. The genes located at the intersection between two sets can assume both functions. It should be
noted that the genes indicated in black (EGFR, Notch, Ash2 and prosb2) belong to the three functional groups: neurite outgrowth, sensory organ
development, and growth/autophagy.
Table 4 Validation of microarray data using real time PCR.
Relative expression level V1/V14
AMC CNS
Gene Primers Microarray Q-PCR Microarray Q-PCR
caps F 5’GCAGCCTGGATGAAGGTTTA 3’R 5’ATGGCGCAGCCATAGTAGTC 3’
1.38 0.63 3.8 2.38
Cdk4 F 5’ TACAACAGCACCGTGGACAT 3’R 5’ GGTCCAGCTGATTCTTTTCG 3’
0.95 1.3 4.99 2.5
hb F 5’ CCTTCCAGTGCGACAAATG 3’R 5’ ATCCGCACAACGGTACTGA 3’
6.71 0.85 6.38 1.6
Iap2 F 5’AAGGACTGGCCGAATCCCAACATC 3’R 5’ CGTTGCACCAAACACACTTC 3’
3.69 2.16 6.48 1.9
nak F 5’AGGAAGCATCACAGCAAAAT 3’R 5’GCACCAGGAGCAGCTGTAAC 3’
1.75 1.36 0.97 1.95
nej F 5’AATGGATCCAACGGATATCTCT 3’R 5’CTGATCCGACCAGCCACTAT 3’
3.26 1.63 3.79 3.75
Notch F 5’AACACCGTTCGCGGAACTGATACCG 3’R 5’GGTTTTGCCATTGAGTTGTG 3’
2.9 1.76 8.96 2.52
The relative expression level (V1/V14) of selected genes was measured using the Q- PCR or microarray analysis data; Our results were consistent with the
microarray data except for the hb (hunchback) gene found to be overexpressed in the CNS but not in the AMC. The values in gray correspond to the genes
found differentially expressed between V1 and V14 in the CNS but not in the AMC using microarray analysis. Accordingly, no significant variation was found for
these genes in the AMC, using Q-PCR.
Guenin et al. BMC Genomics 2010, 11:47
http://www.biomedcentral.com/1471-2164/11/47
Page 8 of 15

extension/retraction, pruning and morphogenesis of lar-
val peripheral sensory neurons [Additional file 5: Sup-
plemental Table S2]. Indeed, though most larval sensory
neurons will degenerate during metamorphosis, some
persist as neurons and undergo stereotyped pruning of
their dendrites and axon terminal branches during early
metamorphosis [39].
We were not surprised to find that the genes encoding
the different proteasome subunits (Prosa7, Prosb2,
Prosa6, Prosa26) are downregulated in V1 AMC (Figure
3, Table 3). Indeed, the acute regulation of their protein
level is a primary determinant of protein turnover and
neurotransmission strength [40,41].
Recently, an elegant study of Choksi et al. [25] showed
that pros is required for activation of neuronal differen-
tiation genes in embryos and identified N, bnl, LimKI,
EGFR and PVR, prosa6 as putative pros targets in
embryos. This reinforces our finding suggesting that in
the larval AMC, pros plays a crucial role in the modula-
tion of neuronal activity through the control of genes
involved in neurotransmission and synaptic plasticity.
Loss of pros function alters the expression of genes
involved in autophagy and growth
The second functional group that emerges from our
analysis includes candidates that play a critical role in
the control of autophagy, a process used to provide
energy and nutrients during metamorphosis and early
adulthood.
The association between Pros and the regulation of
autophagy is mainly attested by the upregulation of
genes such as CG10702, EGFR, Keren (EGFR ligand),
Ftz-F1 (Ftz transcription factor 1), FK506-bp1 (FK506-
binding protein 1), Iap2 (Inhibitor of apoptosis 2), nej,
Notch and genes associated with proteasome complex
(Table 3, Figure 3, see also [Additional file 5: Supple-
mental Table S3]).
Some of the genes cited above were also found to
mediate cell growth (Table 3 and [Additional file 5: Sup-
plemental Table S3]). However, it is not yet clear if the
overexpression of these genes systematically inhibits cell
growth. For example, the upregulation of LK6 (protein
serine/threonine kinase) or FK506-bp1 leads to either
the activation or inhibition of cell growth in a context-
dependent way [42-44].
We have already mentioned that Notch and EGFR
pathways were involved in neurite outgrowth (see
above), interestingly, we found that these two pathways
were also associated with both the regulation of autop-
hagy and cell growth control [45,46] (Figure 3), suggest-
ing that Pros could mediate all of these functions
through the modulation of these two pathways.
Our finding that pros is associated with the expression
of genes involved in growth and or autophagy is consis-
tent with the phenotypic defects observed in V1
homozygote mutants: i) individuals died before reaching
puparium formation; ii) surviving larvae and pupae
remained much smaller than wild-type individuals; iii)
numerous labelled cells were observed in the fat body
using PGal4 enhancer trap line V1 [9].
It is interesting to note that many of the genes found
in this functional group are directly or indirectly asso-
ciated with insulin-signalling pathways and more specifi-
cally the insulin/TOR (target of rapamycin) pathway, an
important mediator of growth, autophagy and nutrient
sensing [Additional file 5: Supplemental Table S3].
Pros and the olfactory system
Pros was detected both in the terminal (TO: mainly gus-
tatory) and in the dorsal (DO: mainly olfactory) organs
of the larval AMC [8]. Accordingly, we found that pros
loss of function in the AMC induced the upregulation
of all candidate genes (except prosb2) that were known
to be involved in the development of sensory organs
(Figure 3, Table 3). Most of our knowledge on the func-
tion of these genes came from studies done on adult
Drosophila sensory organs [Additional file 5: Supple-
mental Table S4]. For example, it has been reported
that mutations in the genes ash2 or ckII alpha (Casein
kinase II alpha subunit) can elicit supernumerary or
ectopic adult sensory organs [47,48]. Similarly, overex-
pression of Iap2 or limK1 induces respectively additional
macrochaetes [49] or ectopic glomeruli in adult anten-
nae lobes [36]. The transmembrane receptor Notch and
the epidermal growth factor receptor EGFR also seem to
play an important role in the organisation, remodelling
and function of the olfactory system [Additional file 5:
Supplemental Table S4]. This confirms previous obser-
vations which showed that they were respectively
required for selecting the sensory organ precursor
lineages [50,51] and for the development of some of the
neurons and cuticular structures of the antenno-maxil-
lary sensory complex [52].
DiscussionPros may regulate genes essential for neurite outgrowth
and remodelling
In the AMC, the transcription factor Prospero is
expressed in a cluster of cells (composed of neuronal
and support cells, but not glial cells) that emerge during
embryonic life and are maintained till the end of the lar-
val stages. In embryos, Pros was reported to be involved
in cell fate decision and in cell-cycle control. By con-
trast, our earlier data from the larval AMC rather sug-
gested that pros could assume more restricted functions,
such as the control of neuron-specific functions [8]. The
present study confirms this hypothesis and shows that
in the chemosensory organs dedicated to larval olfactory
and gustatory sensing, prospero could regulate genes
involved in neurite outgrowth and synaptic transmission.
Guenin et al. BMC Genomics 2010, 11:47
http://www.biomedcentral.com/1471-2164/11/47
Page 9 of 15

Since pros was clearly shown to control axonal and
dendritic outgrowth [53], we cannot exclude the possibi-
lity that the connection of pros with several genes that
drive synaptic activity could be the indirect consequence
of its involvement in neurite outgrowth control. In this
respect, it is interesting to mention that a recent study
[54] showed that axon targeting of the R7 Drosophila
photoreceptor cells to their synaptic partner requires
R7-specific transcription factor Prospero. These authors
proposed that Pros could promote cell-type-specific
expression of sensory receptors and cell-surface proteins
regulating synaptic target specificity.
As previously mentioned, some of the genes identified
in this functional class are also involved in neural con-
nectivity remodelling. How can this be achieved if the
AMC is completely histolysed? In fact, in Drosophila,
not all sensory neurons degenerate; Some larval neurons
persist and remodel to take on a new role in the adult
system [55,56]. During the metamorphosis larval arbors
of these neurons are pruned back and new adult-specific
arbors are generated through a subsequent period of
outgrowth. It seems that the neurites of these persistent
larval neurons are used to partly guide axons of adult
sensory neurons towards and within the CNS [55].
Therefore, histolysis and remodelling are two processes
that are achieved during metamorphosis and could con-
cern distinct neurons.
Does Pros play any role in AMC neuronal remodel-
ling? We cannot actually answer the question. However,
it has been previously reported that the insulin and epi-
dermal growth factor signalling pathways, as well as ubi-
quitin-specific proteases are all required for the
regulation of Drosophila neuronal remodelling [57].
Interestingly, all of these components emerge clearly
from our analysis.
Actually, no work was done on the Drosophila larvae
anterior sense organ in order to check whether some of
the sensory neurons (which have also an embryonic ori-
gin) persist and remodel to take place in the adult olfac-
tory or gustatory system. Therefore, the question is left
open. At least the answers will provide important
insights into the mechanisms that govern developmental
plasticity in insect nervous systems.
In summary, our data collected from larval AMC and
the previous genome wide expression profiling done on
embryos [25] confirms that pros is associated with the
regulation of neuronal specific genes. In this respect, it
is essential to note that except for a few genes (126),
most of the Pros target genes identified (~1000) in
Choksi et al. [25] were not represented on our microar-
rays. For this reason, and because our experiments were
performed on isolated individual larval tissues, it is not
possible to determine whether the genes identified by
these authors are specifically expressed in embryos and/
or in tissues other than AMC.
Prospero and the insulin pathway
In Drosophila, the insulin/TOR signalling pathway [58]
is divided into two branches. The insulin and its down-
stream effectors P13 and FOXO (forkhead box) repre-
sent one branch [59] of this pathway, while the other
branch acts through the TOR family of Serine-Threonin
kinases [60,61]. It has been shown that the insulin/TOR
signalling pathway inhibits autophagy (For review see
[58]) and controls growth by regulating ribosome bio-
genesis and protein biosynthetic capacity [62,63].
Columbani et al. [63] demonstrated that the TOR path-
way is a nutritional checkpoint that participates in the
systemic control of larval growth emanating from the
Fat body.
Our microarray analysis has revealed a group of highly
correlated pros candidate genes (correlation index: 0.9)
that are either controlled by the insulin/TOR signalling
pathway or are directly involved in the signalling cas-
cade. This is the case for Ash2 [64] which was found to
be regulated by TOR signalling. Similarly, FK506-bp1
affects autophagy through the modulation of FOXO [44]
and Lk6 was reported to be a direct FOXO Target [62].
Therefore it seems that in the larval AMC, Pros could
be associated with growth, autophagy and nutrient sen-
sing through the regulation of genes that are directly or
indirectly linked to the insulin/TOR pathway. Interest-
ingly, TOR was found to be differentially expressed in
the V1 pros mutant in the CNS [Additional file 5: Sup-
plemental Table S1].
ConclusionAs previously described, loss of pros function in the
AMC induced several alterations including axon path-
finding defects and abnormal growth and taste
responses. This is consistent with our microarray results
showing that in the larval AMC, Pros expression is asso-
ciated with the regulation of genes involved in the con-
trol of neurite outgrowth, mediation of growth and
autophagy and in the organisation and function of the
olfactory system. The mechanism by which all of these
functions are achieved by pros in the AMC is presently
not known but EGFR and/or Notch pathways could play
a central role. Several lines of evidence are in favour of
this hypothesis.
1- Four ligands are known to bind EGFR receptor:
Keren, Gurken, Spitz, and Vein [65]. Two of these were
identified as potential targets of Prospero: Keren in both
larval AMC and CNS and Gurken (Grk) in the larval
CNS only (see Table 3 and [Additional file 5: Supple-
mental Table S1]). Moreover, Notch and EGFR were
identified as putative Pros target genes in both embryos
Guenin et al. BMC Genomics 2010, 11:47
http://www.biomedcentral.com/1471-2164/11/47
Page 10 of 15

[25] and larval AMC, indicating that they could play a
central role.
2- It has been reported that EGFR signalling is
required for the development of some of the neurons
and cuticular structures present in the AMC [66,67]. In
this respect, it is interesting to point out that EGFR
involvement has been reported during the development
of mouse gustatory epithelia in the palate and tongue
[68].
3- The expression of Notch, EGFR and Pros have been
shown to be tightly linked. It has been demonstrated
that normal levels of Pros expression in photoreceptor
R7 cells in the Drosophila eye require EGFR signalling
as well as Notch activation [69,70]. In addition, a recent
analysis has shown that in R7 cells, Notch and EGFR
cooperate in a complex way to promote pros transcrip-
tion [71].
Although these data suggest that Notch and EGFR
could play a central role in the mechanism by which
Prospero carries out its function in the larval AMC, this
hypothesis has still to be validated. In the future, it will
be of great interest to explore in detail the mechanism
by which all of these functions are accomplished by the
homeodomain transcription factor Prospero.
MethodsDrosophila strains
All strains were maintained on standard cornmeal and
yeast medium at 25°C. The prosV strains used in this
study have already been described [72]. Briefly, prosV13
(V13) and prosV24 (V24) derived from the same prosV1
(V1) allele which contains the full length PGal4 transpo-
son inserted upstream (-216 bp) of the pros coding
region. The resulting behavioural and developmental
anomalies observed in these mutants have been pre-
viously reported [8], and are summarised in Table 1.
Additional descriptions of the expression pattern of
these different alleles in the larval CNS are also provided
in the [Additional file 2].
Isolation of AMC and CNS tissue
Around 150 larvae were used to obtain the AMC and
CNS samples. The anterior region of the Larva was dis-
sected to isolate CNS and AMC. The AMC region is
not a well-defined tissue but is rather constituted by a
small group of cells located in front of the hooks.
Therefore, to maintain AMC integrity we kept the cuti-
cle around it as well as the hooks.
Immunohistochemistry experiments
Staining experiments were performed as previously
described by Guenin et al. [8] Briefly, isolated larval
AMC from embryos at stage 10-17 were incubated with
various primary antibodies: MR1A mouse anti-Prospero
at 1:4 dilution, rat anti-Elav at 1/1000 (a neuronal mar-
ker; provided by A. Giangrande), and rabbit anti-
phosphohistone H3 at 1/1000 (a marker for mitotic
activity; SIGMA). The following secondary antibodies
were used to visualize these primary antibodies: anti-
mouse Cy3 at 1/100 (Sigma); anti-mouse Alexa 594
anti-rat Alexa 488 at 1/400 (Molecular probes, USA);
anti-rabbit Alexa 488 at 1/400 (Molecular probes, USA).
AMC and CNS were mounted on Vectashield (Vector
Laboratories, CA) before inspection under a fluores-
cence microscope (Leica DMRB) or a confocal micro-
scope (Leica 4SD).
RNA extraction and cDNA labelling
Total RNA from third instar larvae was extracted from
isolated AMC and CNS, according to Guenin et al. [8].
Four independent extractions were performed for each
sample condition. RNA integrity was checked on dena-
turing formaldehyde agarose gels. The presence of clear
bands corresponding to the 28s and 18s RNA with a 2:1
ratio and the absence of a smear were used to assess the
RNA quality. Total RNA (3.0 μg) were treated with RQ1
RNase-free DNase (Promega) and reverse transcripted in
presence of 33[P] dATP (Amersham Pharmacia Biotech,
Bucks, United Kingdom), Random Primers and the
reverse transcriptase (Maloney Murine Leukaemia Virus,
Invitrogen).
Microarray experiments
Nylon membrane microarrays provided by the TAGC
platform (Marseille-Nice Genopole) were used. They
contained 7500 amplification PCR products of unique
full length cDNA clones from the Drosophila Gene col-
lection release version 1.0 (Berkeley Drosophila Genome
project). To verify the quality of spotting on the micro-
arrays and the amount of DNA accessible for each spot,
a vector probe (labelled oligonucleotide common to all
spotted PCR products) hybridization was performed.
Hybridization of 33[P] labelled probes was conducted for
24 h at 68°C in 500 μl of hybridization buffer (5× SSC,
5× Denhardt’s, 0,5% SDS). After 3 washing of 1 h in 500
ml of washing buffer (0,1× SSC, 0,2% SDS) at 68°C,
arrays were exposed overnight to phosphor imaging
plates which were scanned using a BAS 5000 (Fuji, Rayt-
est, Paris France).
Data processing and analysis
Signal intensities were quantified using ArrayGauge soft-
ware (V1.3; Fuji, Paris, France). All images were carefully
inspected to exclude spots with overestimated intensities
due to neighbourhood effects. Artefacts were eliminated
by visual inspection. Spots were excluded from the
quantification, if they were contaminated by overflowing
neighbouring spots or if artefacts are present on the
membrane. Overflowing spots were also eliminated. One
sample was discarded (CNS V14) because of bad vector
signals. The variability due to experimental conditions
was eliminated by using a local weighted scattered plot
smoother analysis (LOWESS, [73]). The data were then
Guenin et al. BMC Genomics 2010, 11:47
http://www.biomedcentral.com/1471-2164/11/47
Page 11 of 15

filtered and only values found to be twice the mean
local background value were kept. Correlation coeffi-
cients between expression measurements of two identi-
cal alleles ranged from 0.74 to 0.93 for the same tissue.
Data were then log transformed.
Genes belonging to the same biological function or
cell type are known to exhibit correlated expression
[74]. Thus we searched for sets of genes with correlated
expression that were differentially expressed between
mutants. We used a method to detect groups of corre-
lated genes and a statistical method to detect differential
expression among these groups. Different methods were
able to detect correlated expressions. We chose hier-
archical clustering which has the advantage of not fixing
a priori the number of classes or the number of genes
per class. The statistical method used to detect genes
differentially expressed between the wild type and pros
mutants was the Discriminating Score [75], which is
very similar to the widely used SAM method [76]. As
the expected number of genes was not known, we calcu-
lated an average DS in a sliding window on the cluster.
This allowed us to detect peaks of the optimal size.
These peaks corresponded to genes with correlated
expression and differentially expressed between mutants.
For the clustering, we used the Cluster program with
Pearson correlation distance and average linkage as the
aggregation strategy. The results were displayed using
TreeView [26]. The DS measures the difference in gene
expression between 2 groups of samples. If M1 repre-
sents mean expression of a given gene in wild type sam-
ples, and M2 the mean expression of the same gene in
pros mutant samples, and SD the standard deviation of
this gene in all considered samples, DS = (M1-M2)/
(SD). As V13, V14 and V24 have a normal Pros expres-
sion pattern in the AMC, they were considered wild
type. The DS between V1 and all of the other alleles for
the AMC was calculated for each gene. As V13 and V24
exhibited a distinct pattern in the CNS, for each gene,
we calculated a DS between the V1 and V14 allele for
the CNS. The score for each gene was then smoothed
by calculating the mean score in a sliding window of
100 genes.
Finally, to highlight very tightly correlated genes in the
main peak (peak 1) for each tissue, we performed a sec-
ond hierarchical clustering with the genes of this peak,
separately in the CNS and AMC.
The complete dataset is available through the National
Center for Biotechnology Information (NCBI), in the
Gene Expression Omnibus database http://www.ncbi.
nlm.nih.gov/geo/ under the GSE12178 accession
number.
Functional Annotation
Functional annotations of gene clusters were performed
using GoMiner software [27] and the Gene Ontology
database [77]. GoMiner determines significant enrich-
ments of GO terms in a cluster of genes. This is per-
formed by comparing the frequencies of each GO term
in the cluster and in the microarray using Fisher’s exact
test.
Research of a putative common motif in the promoter of
co-expressed genes
Promoting regions of co-expressed genes were collected
from the Ensembl ftp site http://www.ensembl.org/
index.html The sequence located from -1700 to +300 bp
according to the +1 transcription start site of each gene
was extracted. Interspersed and simple repeats were
masked. These sequences were searched for a common
motif using the Gibbs sampling method [28] available at
the RSA Tools website: http://rsat.ulb.ac.be/rsat/. This
method allowed to determine degenerated motifs
described by a position weight matrix (PWM, a prob-
abilistic model of residue frequencies at each position),
in a set of sequences by iterative sampling. The initiali-
sation step of the algorithm selects a random subse-
quence in each sequence to be searched. The predictive
step builds a PWM from all the subsequences except
one. The sampling step selects a new subsequence from
the excluded sequence using a weighting strategy based
on the PWM scores. The predictive and the sampling
steps are iterated a given number of times or until con-
vergence. We performed many Gibbs sampling runs as
this method is stochastic. The motif found was identi-
fied in most of the runs. We used a Logo representation
[29] to show the information content of the PWM.
Q-PCR validation
In order to validate the Microarray results, seven genes
were selected and their expression levels were quantified
by Q-PCR for both prosV1 and prosV14. For each RNA
extraction used for microarrays, a sample was collected
in order to perform Q-PCR experiments. Reverse tran-
scriptions were done from 2 μg of total RNA as
described in Guenin et al. [8]. The selected genes and
the corresponding primers, designed using Primer
Express™ (Applied Biosystems) parameters, are indicated
in Table 4. Q-PCR reactions were performed with 1:10
diluted cDNA in 2× SybrGreen PCR master mix
(Applied Biosystems) with each specific primer (See
table 4) or control primers (actin 5C F 5’GCCCATC-
TACGAGGGTTATGC3’ and actin 5C R
5’CAAATCGCGACCAGCCAG3’). Signals were mea-
sured with ABI Prism 7000™ Sequence Detection System
software (Applied Biosystems). All signal thresholds to
be compared were standardized with the actin 5C
mRNA [8].
Additional file 1: Mitotic Activity in the AMC region, in stage 11
and stage 16 embryos. Wild type embryos from stage 11 to 16 were
stained with Pros (red) and H3p (green) which label cells in division. (A)
Guenin et al. BMC Genomics 2010, 11:47
http://www.biomedcentral.com/1471-2164/11/47
Page 12 of 15

Mitotic activity is observed until stage 11-12 (arrow) while no more
activity is detected from stage 16 embryos (B) in the AMC. Scale bar
correspond to 20 μm.
Click here for file
[ http://www.biomedcentral.com/content/supplementary/1471-2164-11-
47-S1.GIF ]
Additional file 2: Expression pattern of V24 in the third instar larval
CNS. The Pros (A) and Elav (B) expression pattern as well as the mitotic
activity (C) of V24 are shown as compared to the previously reported
pattern of V14, V13 and V1 alleles [8]. Although V24 and V13 present the
same expression pattern in the AMC, the situation is different in the CNS.
As it can be seen Pros (A) and Elav labeling (B) are distinctive for both
alleles in the region delimiting the two hemispheres and the Optic lobes
(OLs). As compared to V13, V24 presents a decrease of the staining in
this region for these two markers (B). In ventral nerve cord (VNC), V13
shows an important hyperplasia (arrowheads) due to an excess of
neurons. In V24, the VNC extremity presents a bifida aspect (arrow). The
mitotic activity, revealed by anti-pHistone-H3 (H3p) (C) is strongly
increased in V24, especially in the OLs.
Click here for file
[ http://www.biomedcentral.com/content/supplementary/1471-2164-11-
47-S2.GIF ]
Additional file 3: List of the AMC genes represented in the 3 peaks
obtained after the application of the discriminating score between
V1 and all other alleles for the AMC samples. Peak 1: Differentially
expressed genes involved in cell fate commitment. Peak 2: Differentially
expressed genes involved in the proteasome complex. Peak 3:
Differentially expressed genes involved in signal transducer activity.
Click here for file
[ http://www.biomedcentral.com/content/supplementary/1471-2164-11-
47-S3.XLS ]
Additional file 4: List of the CNS genes represented in the peak
obtained after the application of the discriminating score between
V1 and V1 4 for the CNS samples. The peak contains differentially
expressed genes involved in cell fate commitment.
Click here for file
[ http://www.biomedcentral.com/content/supplementary/1471-2164-11-
47-S4.XLS ]
Additional file 5: Supplemental Table S1: Genes found to be
differentially expressed between V1 and V14 CNS. We found 86
genes that are highly correlated (coeff> 0,9). Among the 86 genes, 28
were also found to be overexpressed in the V1 AMC (column on the left,
gene names are indicated in bold) and contain the common putative
pros DNA motif in their promoter. The 58 genes present in the two
columns on the right are specifically overexpressed in V1 CNS as
compared to V14 CNS. Supplemental Table S2: Phenotypic data
related to the candidate genes involved in neurite outgrowth and/
or synaptic transmission. The criteria used for the description of the
phenotypes were as follows: (1) if many larval phenotypes were available
for a gene, we selected only those observed in the nervous system and
preferentially in the peripheral nervous system (PNS). (2) If no larval
phenotype was available for a gene, we selected those observed in the
embryonic and/or adult PNS. (3) If available, the effect of the
upregulation or downregulation of these genes is mentioned
respectively for those that are overexpressed or underexpressed in V1
AMC. (4) All studies mentioned were done in Drosophila melanogaster.
Supplemental Table S3: Phenotype data related to the candidate
genes involved in growth and autophagy. The criteria used for the
description of the phenotypes were the same as those for Table S2.
Supplemental Table S4: Phenotype data related to the candidate
genes involved in sensory organ development and most
particularly in olfaction (in bold). The criteria used for the description
of the phenotypes were the same as those for Table S2.
Click here for file
[ http://www.biomedcentral.com/content/supplementary/1471-2164-11-
47-S5.PDF ]
Acknowledgements
We thank Nicolas Boulanger and Béatrice Loriod from the TAGC platform for
the excellent technical assistance. This work was funded by the Burgundy
Regional Council and the Centre National de la Recherche Scientifique.
Author details1Institut Pasteur, Pathogénomique Mycobactérienne Intégrée, 25, Rue du Dr.
Roux, 75724 Paris Cedex 15, France. 2Université de Bourgogne, Facultés des
Sciences, Unité Mixte de Recherche 5548 Associée au Centre National de la
Recherche Scientifique, 6, Bd Gabriel, 21 000 Dijon, France. 3INSERM, U915,
Nantes, F-44000, France. 4Université de Nantes, l’Institut du Thorax, Nantes, F-
44000, France.
Authors’ contributions
LG and FB generated the microarray data and drafted the manuscript. LG
carry out immunohistochemistry and Q-PCR experiments. LG, MR and RH,
performed the biostatistic analysis. MR performed the motif discovery. FB
generated the Drosophila larvae data compilation for manual annotation. FB
and RH provided direction and oversight of the experiments. FB holds the
grant. All authors read, corrected and approved the final manuscript.
Received: 17 March 2009
Accepted: 19 January 2010 Published: 19 January 2010
References
1. Frederick RD, Denell RE: Embryological origin of the antenno-maxillary
complex of the larva of Drosophila melanogaster Meigen (Diptera:
Drosophilidae). Int J Insect Morphol Embryol 1982, 11:227-233.
2. Singh RN, Singh K: Fine structure of the sensory organs of Drosophila
melanogaster Meigen larva (Diptera: Drosophilidae). Int J Insect Morphol
Embryol 1984, 13:255-273.
3. Gerber B, Stocker RF: he Drosophila larva as a model for studying
chemosensation and chemosensory learning: a review. Chem Senses
2007, 32(1):65-89.
4. Chu-Wang IW, Axtell RC: Fine structure of the terminal organ of the
house fly larva, Musca domestica L. Z Zellforsch Mikrosk Anat 1972,
127:287-305.
5. Chu-Wang IW, Axtell RC: Fine structure of the ventral organ of the house
fly larva, Musca domestica L. Z Zellforsch Mikrosk Anat 1972, 130:489-495.
6. Stocker RF: The organization of the chemosensory system in Drosophila
melanogaster: a review. Cell Tissue Res 1994, 275(1):3-26.
7. Heimbeck G, Bugnon V, Gendre N, Haberlin C, Stocker RF: Smell and taste
perception in Drosophila melanogaster larva: toxin expression studies in
chemosensory neurons. J Neurosci 1999, 19(15):6599-6609.
8. Guenin L, Grosjean Y, Fraichard S, Acebes A, Baba-Aissa F, Ferveur JF:
Spatio-temporal expression of Prospero is finely tuned to allow the
correct development and function of the nervous system in Drosophila
melanogaster. Dev Biol 2007, 304(1):62-74.
9. Balakireva M, Gendre N, Stocker RF, Ferveur JF: The genetic variant Voila
causes gustatory defects during Drosophila development. J Neurosci
2000, 20(9):3425-3433.
10. Grosjean Y, Lacaille F, Acebes A, Clemencet J, Ferveur JF: Taste, movement,
and death: varying effects of new prospero mutants during Drosophila
development. J Neurobiol 2003, 55(1):1-13.
11. Chu-Lagraff Q, Wright DM, McNeil LK, Doe CQ: The prospero gene
encodes a divergent homeodomain protein that controls neuronal
identity in Drosophila. Development 1991, , Suppl 2: 79-85.
12. Hassan B, Li L, Bremer KA, Chang W, Pinsonneault J, Vaessin H: Prospero is
a panneural transcription factor that modulates homeodomain protein
activity. Proc Natl Acad Sci USA 1997, 94(20):10991-10996.
13. Matsuzaki F, Koizumi K, Hama C, Yoshioka T, Nabeshima Y: Cloning of the
Drosophila prospero gene and its expression in ganglion mother cells.
Biochem Biophys Res Commun 1992, 182(3):1326-1332.
14. Doe CQ, Chu-LaGraff Q, Wright DM, Scott MP: The prospero gene specifies
cell fates in the Drosophila central nervous system. Cell 1991,
65(3):451-464.
15. Vaessin H, Grell E, Wolff E, Bier E, Jan LY, Jan YN: prospero is expressed in
neuronal precursors and encodes a nuclear protein that is involved in
the control of axonal outgrowth in Drosophila. cell 1991, 67(5):941-953.
Guenin et al. BMC Genomics 2010, 11:47
http://www.biomedcentral.com/1471-2164/11/47
Page 13 of 15

16. Hirata J, Nakagoshi H, Nabeshima Y, Matsuzaki F: Asymmetric segregation
of the homeodomain protein Prospero during Drosophila development.
Nature 1995, 377:627-630.
17. Knoblich JA, Jan LY, Jan YN: Asymmetric segregation of Numb and
Prospero during cell division. Nature 1995, 377:324-327.
18. Spana EP, Doe CQ: The prospero transcription factor is asymmetrically
localized to the cell cortex during neuroblast mitosis in Drosophila.
Development 1995, 121(10):3187-3195.
19. Manning L, Doe CQ: Prospero distinguishes sibling cell fate without
asymmetric localization in the Drosophila adult external sense organ
lineage. Development 1999, 126(10):2063-2071.
20. Akiyama-Oda Y, Hotta Y, Tsukita S, Oda H: Distinct mechanisms triggering
glial differentiation in Drosophila thoracic and abdominal neuroblasts 6-
4. Dev Biol 2000, 222(2):429-439.
21. Freeman MR, Doe CQ: Asymmetric Prospero localization is required to
generate mixed neuronal/glial lineages in the Drosophila CNS.
Development 2001, 128(20):4103-4112.
22. Li L, Vaessin H: Pan-neural Prospero terminates cell proliferation during
Drosophila neurogenesis. Genes Dev 2000, 14(2):147-151.
23. Griffiths RL, Hidalgo A: Prospero maintains the mitotic potential of glial
precursors enabling them to respond to neurons. EMBO J 2004,
23(12):2440-2450.
24. Liu TH, Li L, Vaessin H: Transcription of the Drosophila CKI gene dacapo
is regulated by a modular array of cis-regulatory sequences. Mech Dev
2002, 112(1-2):25-36.
25. Choksi SP, Southall TD, Bossing T, Edoff K, de Wit E, Fischer BE, van
Steensel B, Micklem G, Brand AH: Prospero acts as a binary switch
between self-renewal and differentiation in Drosophila neural stem cells.
Dev Cell 2006, 11(6):775-789.
26. Eisen MB, Spellman PT, Brown PO, Botstein D: Cluster analysis and display
of genome-wide expression patterns. Proc Natl Acad Sci USA 1998,
95(25):14863-14868.
27. Zeeberg BR, Feng W, Wang G, Wang MD, Fojo AT, Sunshine M,
Narasimhan S, Kane DW, Reinhold WC, Lababidi S, et al: GoMiner: a
resource for biological interpretation of genomic and proteomic data.
Genome Biol 2003, 4(4):R28.
28. Lawrence CE, F AS, Boguski MS, Liu JS, Neuwald AF, Wootton JC: Detecting
subtle sequence signals: a Gibbs sampling strategy for multiple
alignment. Science 1993, 262(5131):208-214.
29. Crooks GE, Hon G, Chandonia JM, Brenner SE: WebLogo: a sequence logo
generator. Genome Res 2004, 14(6):1188-1190.
30. Cook T, Pichaud F, Sonneville R, Papatsenko D, Desplan C: Distinction
between color photoreceptor cell fates is controlled by Prospero in
Drosophila. Dev Cell 2003, 4(6):853-864.
31. Garcia-Alonso L, Romani S, Jimenez F: The EGF and FGF receptors
mediate neuroglian function to control growth cone decisions during
sensory axon guidance in Drosophila. Neuron 2000, 28(3):741-752.
32. Hassan BA, Bermingham NA, He Y, Sun Y, Jan YN, Zoghbi HY, Bellen HJ:
atonal regulates neurite arborization but does not act as a proneural
gene in the Drosophila brain. Neuron 2000, 25(3):549-561.
33. Srahna M, Leyssen M, Choi CM, Fradkin LG, Noordermeer JN, Hassan BA: A
signaling network for patterning of neuronal connectivity in the
Drosophila brain. PLoS Biol 2006, 4(11):e348.
34. Marek KW, Ng N, Fetter R, Smolik S, Goodman CS, Davis GW: A genetic
analysis of synaptic development: pre- and postsynaptic dCBP control
transmitter release at the Drosophila NMJ. Neuron 2000, 25(3):537-547.
35. Kraut R, Menon K, Zinn K: A gain-of-function screen for genes controlling
motor axon guidance and synaptogenesis in Drosophila. Curr Biol 2001,
11(6):417-430.
36. Ang LH, Kim J, Stepensky V, Hing H: Dock and Pak regulate olfactory axon
pathfinding in Drosophila. Development 2003, 130(7):1307-1316.
37. Laviolette MJ, Nunes P, Peyre JB, Aigaki T, Stewart BA: A genetic screen for
suppressors of Drosophila NSF2 neuromuscular junction overgrowth.
Genetics 2005, 170(2):779-792.
38. Learte AR, Forero MG, Hidalgo A: Gliatrophic and gliatropic roles of PVF/
PVR signaling during axon guidance. Glia 2008, 56(2):164-176.
39. Marin EC, Watts RJ, Tanaka NK, Ito K, Luo L: Developmentally programmed
remodeling of the Drosophila olfactory circuit. Dev 2005, 132(4):725-737.
40. Speese SD, Trotta N, Rodesch CK, Aravamudan B, Broadie K: The ubiquitin
proteasome system acutely regulates presynaptic protein turnover and
synaptic efficacy. Curr Biol 2003, 13(11):899-910.
41. Haas KF, Miller SL, Friedman DB, Broadie K: The ubiquitin-proteasome
system postsynaptically regulates glutamatergic synaptic function. Mol
Cell Neurosci 2007, 35(1):64-75.
42. Arquier N, Bourouis M, Colombani J, Léopold P: Drosophila Lk6 kinase
controls phosphorylation of eukaryotic translation initiation factor 4E
and promotes normal growth and development. Curr Biol 2005,
15(1):19-23.
43. Reiling JH, Doepfner KT, Hafen E, Stocker H: Diet-dependent effects of the
Drosophila Mnk1/Mnk2 homolog Lk6 on growth via eIF4E. Curr Biol 2005,
15(1):24-30.
44. Juhasz G, Puskas LG, Komonyi O, Erdi B, Maroy P, Neufeld TP, Sass M: Gene
expression profiling identifies FKBP39 as an inhibitor of autophagy in
larval Drosophila fat body. Cell Death Differ 2007, 14(6):1181-1190.
45. Yue X, Song W, Zhang W, Chen L, Xi Z, Xin Z, Jiang X: Mitochondrially
localized EGFR is subjected to autophagic regulation and implicated in
cell survival. Autophagy 2008, 4(5):701-703.
46. Rafel N, Milán M: Notch signalling coordinates tissue growth and wing
fate specification in Drosophila. Development 2008, 135(24):3995-4001.
47. Adamson AL, Shearn A: Molecular genetic analysis of Drosophila ash2, a
member of the trithorax group required for imaginal disc pattern
formation. Genetics 1996, 144(2):621-633.
48. Bose A, Kahali B, Zhang S, Lin JM, Allada R, Karandikar U, Bidwai AP:
Drosophila CK2 regulates lateral-inhibition during eye and bristle
development. Mech Dev 2006, 123(9):649-664.
49. Kanuka H, Kuranaga E, Takemoto K, Hiratou T, Okano H, Miura M:
Drosophila caspase transduces Shaggy/GSK-3beta kinase activity in
neural precursor development. EMBO J 2005, 24(21):3793-3806.
50. Mollereau B, Domingos PM: Photoreceptor differentiation in Drosophila:
from immature neurons to functional photoreceptors. Dev Dyn 2005,
232(3):585-592.
51. Fichelson P, Audibert A, Simon F, Gho M: Cell cycle and cell-fate
determination in Drosophila neural cell lineages. Trends Genet 2005,
21(7):413-420.
52. Lai EC, Orgogozo V: A hidden program in Drosophila peripheral
neurogenesis revealed: fundamental principles underlying sensory organ
diversity. Dev Biol 2004, 269(1):1-17.
53. Gao FB, Brenman JE, Jan LY, Jan YN: Genes regulating dendritic
outgrowth, branching, and routing in Drosophila. Genes Dev 1999,
13(19):2549-2561.
54. Morey M, Yee SK, Herman T, Nern A, Blanco E, Zipursky S: Coordinate
control of synaptic-layer specificity and rhodopsins in photoreceptor
neurons. Nature 2008, 456:795-799.
55. Williams DW, Shepherd D: Persistent larval sensory neurons in adult
Drosophila melanogaster. J Neurobiol 1999, 39(2):275-286.
56. Tissot M, Stocker RF: Metamorphosis in drosophila and other insects: the
fate of neurons throughout the stages. Prog Neurobiol 2000, 62(1):89-111.
57. Zhao T, Gu T, Rice HC, McAdams KL, Roark KM, Lawson K, Gauthier SA,
Reagan KL, Hewes RS: A Drosophila gain-of-function screen for candidate
genes involved in steroid-dependent neuroendocrine cell remodeling.
Genetics 2008, 178(2):883-901.
58. Grewal SS: Insulin/TOR signaling in growth and homeostasis: a view from
the fly world. Int J Biochem Cell Biol 2009, 41:1006-1010.
59. Jünger MA, Rintelen F, Stocker H, Wasserman JD, Végh M, Radimerski T,
Greenberg ME, Hafen E: The Drosophila forkhead transcription factor
FOXO mediates the reduction in cell number associated with reduced
insulin signaling. J Biol 2003, 2(3):20.
60. Scott RC, Schuldiner O, Neufeld TP: Role and regulation of starvation-
induced autophagy in the Drosophila fat body. Dev Cell 2004,
7(2):167-178.
61. Jacinto E, Hall MN: Tor signalling in bugs, brain and brawn. Nat Rev Mol
Cell Biol 2003, 4(2):117-126.
62. Teleman AA, Hietakangas V, Sayadian AC, Cohen SM: Nutritional control of
protein biosynthetic capacity by insulin via Myc in Drosophila. Cell Metab
2008, 7(1):21-32.
63. Colombani J, Raisin S, Pantalacci S, Radimerski T, Montagne J, Leopold P: A
nutrient sensor mechanism controls Drosophila growth. Cell 2003,
114(6):739-749.
64. Guertin DA, Guntur KV, Bell GW, Thoreen CC, Sabatini DM: Functional
genomics identifies TOR-regulated genes that control growth and
division. Curr Biol 2006, 16(10):958-970.
Guenin et al. BMC Genomics 2010, 11:47
http://www.biomedcentral.com/1471-2164/11/47
Page 14 of 15

65. Shilo BZ: Regulating the dynamics of EGF receptor signaling in space
and time. Development 2005, 132(18):4017-4027.
66. Okano H, Hayashi S, Tanimura T, Sawamoto K, Yoshikawa S, Watanabe J,
Iwasak iM, Hirose S, Mikoshiba K, Montell C: Regulation of Drosophila
neural development by a putative secreted protein. Differentiation 1992,
52(1):1-11.
67. Mayer U, Nusslein-Volhard C: A group of genes required for pattern
formation in the ventral ectoderm of the Drosophila embryo. Genes Dev
1988, 2(11):1496-1511.
68. Sun H, Oakley B: Development of anterior gustatory epithelia in the
palate and tongue requires epidermal growth factor receptor. Dev Biol
2002, 242(1):31-43.
69. Kauffmann RC, Li S, Gallagher PA, Zhang J, Carthew RW: Ras1 signaling
and transcriptional competence in the R7 cell of Drosophila. Genes Dev
1996, 10(17):2167-2178.
70. Xu J, Xin S, Du W: Drosophila Chk2 is required for DNA damage-
mediated cell cycle arrest and apoptosis. FEBS lett 2001, 508(3):394-398.
71. Hayashi T, Xu C, Carthew RW: Cell-type-specific transcription of prospero
is controlled by combinatorial signaling in the Drosophila eye.
Development 2008, 135(16):2787-2796.
72. Grosjean Y, Balakireva M, Dartevelle L, Ferveur JF: PGal4 excision reveals
the pleiotropic effects of Voila, a Drosophila locus that affects
development and courtship behaviour. Genet Res 2001, 77(3):239-250.
73. Dudoit S, Fridlyand J: A prediction-based resampling method for
estimating the number of clusters in a dataset. genome Biol 2002,
3(7):31-21.
74. Shaffer AL, Rosenwald A, Hurt EM, Giltnane JM, Lam LT, Pickeral OK,
Staudt LM: Signatures of the immune response. Immunity 2001,
15(3):375-385.
75. Golub TR, Slonim DK, Tamayo P, Huard C, Gaasenbeek M, Mesirov JP,
Coller H, Loh ML, Downing JR, Caligiuri MA, et al: Molecular classification
of cancer: class discovery and class prediction by gene expression
monitoring. Science 1999, 286(5439):531-537.
76. Tusher VG, Tibshirani R, Chu G: Significance analysis of microarrays
applied to the ionizing radiation response. Proc Natl Acad Sci USA 2001,
98(9):5116-5121.
77. Ashburner M, Ball CA, Blake JA, Botstein D, Butler H, Cherry JM, Davis AP,
Dolinski K, Dwight SS, Eppig JT, et al: Gene ontology: tool for the
unification of biology. The Gene Ontology Consortium. Nat Genet 2000,
25(1):25-29.
doi:10.1186/1471-2164-11-47Cite this article as: Guenin et al.: Expression profiling of prospero in theDrosophila larval chemosensory organ: Between growth and outgrowth.BMC Genomics 2010 11:47.
Submit your next manuscript to BioMed Centraland take full advantage of:
• Convenient online submission
• Thorough peer review
• No space constraints or color figure charges
• Immediate publication on acceptance
• Inclusion in PubMed, CAS, Scopus and Google Scholar
• Research which is freely available for redistribution
Submit your manuscript at www.biomedcentral.com/submit
Guenin et al. BMC Genomics 2010, 11:47
http://www.biomedcentral.com/1471-2164/11/47
Page 15 of 15
Copyright © 2022 FDOKUMEN