How executive functions are related to intelligence in Williams syndrome
Upload
independentCategory
view
4download
0
www.elsevier.com/locate/modgep
Gene Expression Patterns 7 (2007) 396–404
Expression of Gtf2ird1, the Williams syndrome-associated gene,during mouse development
Stephen J. Palmer a,*, Enoch S.E. Tay a, Nicole Santucci a, Thi Thu Cuc Bach a,Jeff Hook c,d, Frances A. Lemckert c,d, Robyn V. Jamieson b, Peter W. Gunnning c,d,
Edna C. Hardeman a
a Muscle Development Unit, Children’s Medical Research Institute, Westmead, NSW, 2145, Australiab Eye Genetics Group, Embryology Unit, Children’s Medical Research Institute, Westmead, NSW, 2145, Australia
c Oncology Research Unit, The Children’s Hospital at Westmead, Locked Bag 4001, Westmead, NSW, 2145, Australiad Discipline of Paediatrics and Child Health, University of Sydney, NSW, Sydney 2006, Australia
Received 22 September 2006; received in revised form 22 November 2006; accepted 24 November 2006Available online 1 December 2006
Abstract
The gene GTF2IRD1 is localized within the critical region on chromosome 7 that is deleted in Williams syndrome patients. Genotype–phenotype comparisons of patients carrying variable deletions within this region have implicated GTF2IRD1 and a closely relatedhomolog, GTF2I, as prime candidates for the causation of the principal symptoms of Williams syndrome. We have generated mice withan nls-LacZ knockin mutation of the Gtf2ird1 allele to study its functional role and examine its expression profile. In adults, expression ismost prominent in neurons of the central and peripheral nervous system, the retina of the eye, the olfactory epithelium, the spiralganglion of the cochlea, brown fat adipocytes and to a lesser degree myocytes of the heart and smooth muscle. During development,a dynamic pattern of expression is found predominantly in musculoskeletal tissues, the pituitary, craniofacial tissues, the eyes and toothbuds. Expression of Gtf2ird1 in these tissues correlates with the manifestation of some of the clinical features of Williams syndrome.� 2006 Elsevier B.V. All rights reserved.
Keywords: MusTRD1; GTF2IRD1; WBSCR11; BEN; GTF3; TFII-I; Williams syndrome; LacZ; Knockout
1. Results and discussion
1.1. Gtf2ird1 and Williams syndrome clinical features
GTF2IRD1, GTF2I and GTF2IRD2 are members of agene family that are located on chromosome 7q11.23(Hinsley et al., 2004; Bayarsaihan et al., 2002). GTF2IRD1and GTF2I are adjacent and GTF2IRD2 is separated fromthe GTF2I gene by the NCF1 gene. They all share consid-erable homology within a repeated domain, which conferssequence-specific DNA binding properties (Polly et al.,2003; Roy, 2001; Vullhorst and Buonanno, 2003; Vullhorstand Buonanno, 2005). The high homology and tight link-
1567-133X/$ - see front matter � 2006 Elsevier B.V. All rights reserved.
doi:10.1016/j.modgep.2006.11.008
* Corresponding author. Tel.: +61 2 9687 2800; fax: +61 2 9687 2120.E-mail address: [email protected] (S.J. Palmer).
age suggest that these genes have evolved from a singlecommon ancestor via duplication and divergence (Hinsleyet al., 2004; Bayarsaihan et al., 2002; Makeyev et al.,2004; Tipney et al., 2004). Genotype–phenotype correla-tions drawn from patients who carry atypical deletionswithin 7q11.23 suggest that haploinsufficiency forGTF2IRD1 and GTF2I may account for the majority ofthe Williams syndrome characteristic features (Tassabehji,2003; Hirota et al., 2003; Karmiloff-Smith et al., 2003).
The most life-threatening symptom of Williams syn-drome is supravalvular aortic stenosis (SVAS) which hasbeen ascribed to hemizygosity at the elastin locus (Curranet al., 1993; Metcalfe et al., 2000). The remaining physicaland neurological symptoms have no known specific geneticcause. They include facial dysmorphology, stellate iridesand teeth that are often small and maloccluded. Muscle
S.J. Palmer et al. / Gene Expression Patterns 7 (2007) 396–404 397
hypotonia is often present in infants but joint contracturesmay appear later, and scoliosis, kyphosis and lordosis arecommon. Connective tissue weakness may manifest asinguinal hernias, bladder diverticula, and intestinal diver-ticulosis. The skin is often soft and the voice is typicallyhoarse. Potential involvement of the endocrine system isindicated by a tendency for infantile hypercalcaemia andgrowth retardation (reviewed in Perez Jurado, 2003;Franke, 1999). The neurological defects are complex andinclude a reduced IQ and an uneven cognitive profile,which bestows a characteristic set of personality traits onthese patients (reviewed by Meyer-Lindenberg et al., 2006).
1.2. Phenotypes in mice with Gtf2ird1 mutations
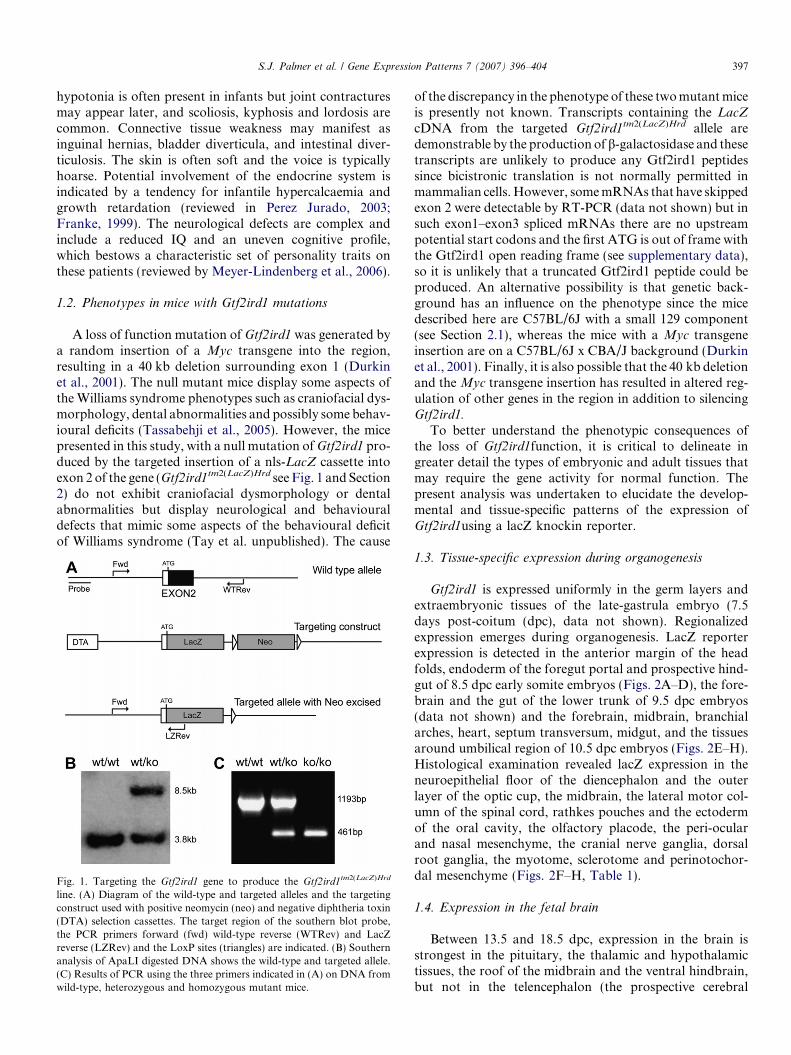
A loss of function mutation of Gtf2ird1 was generated bya random insertion of a Myc transgene into the region,resulting in a 40 kb deletion surrounding exon 1 (Durkinet al., 2001). The null mutant mice display some aspects ofthe Williams syndrome phenotypes such as craniofacial dys-morphology, dental abnormalities and possibly some behav-ioural deficits (Tassabehji et al., 2005). However, the micepresented in this study, with a null mutation of Gtf2ird1 pro-duced by the targeted insertion of a nls-LacZ cassette intoexon 2 of the gene (Gtf2ird1tm2(LacZ)Hrd see Fig. 1 and Section2) do not exhibit craniofacial dysmorphology or dentalabnormalities but display neurological and behaviouraldefects that mimic some aspects of the behavioural deficitof Williams syndrome (Tay et al. unpublished). The cause
Fig. 1. Targeting the Gtf2ird1 gene to produce the Gtf2ird1tm2(LacZ)Hrd
line. (A) Diagram of the wild-type and targeted alleles and the targetingconstruct used with positive neomycin (neo) and negative diphtheria toxin(DTA) selection cassettes. The target region of the southern blot probe,the PCR primers forward (fwd) wild-type reverse (WTRev) and LacZreverse (LZRev) and the LoxP sites (triangles) are indicated. (B) Southernanalysis of ApaLI digested DNA shows the wild-type and targeted allele.(C) Results of PCR using the three primers indicated in (A) on DNA fromwild-type, heterozygous and homozygous mutant mice.
of the discrepancy in the phenotype of these two mutant miceis presently not known. Transcripts containing the LacZ
cDNA from the targeted Gtf2ird1tm2(LacZ)Hrd allele aredemonstrable by the production of b-galactosidase and thesetranscripts are unlikely to produce any Gtf2ird1 peptidessince bicistronic translation is not normally permitted inmammalian cells. However, some mRNAs that have skippedexon 2 were detectable by RT-PCR (data not shown) but insuch exon1–exon3 spliced mRNAs there are no upstreampotential start codons and the first ATG is out of frame withthe Gtf2ird1 open reading frame (see supplementary data),so it is unlikely that a truncated Gtf2ird1 peptide could beproduced. An alternative possibility is that genetic back-ground has an influence on the phenotype since the micedescribed here are C57BL/6J with a small 129 component(see Section 2.1), whereas the mice with a Myc transgeneinsertion are on a C57BL/6J x CBA/J background (Durkinet al., 2001). Finally, it is also possible that the 40 kb deletionand the Myc transgene insertion has resulted in altered reg-ulation of other genes in the region in addition to silencingGtf2ird1.
To better understand the phenotypic consequences ofthe loss of Gtf2ird1function, it is critical to delineate ingreater detail the types of embryonic and adult tissues thatmay require the gene activity for normal function. Thepresent analysis was undertaken to elucidate the develop-mental and tissue-specific patterns of the expression ofGtf2ird1using a lacZ knockin reporter.
1.3. Tissue-specific expression during organogenesis
Gtf2ird1 is expressed uniformly in the germ layers andextraembryonic tissues of the late-gastrula embryo (7.5days post-coitum (dpc), data not shown). Regionalizedexpression emerges during organogenesis. LacZ reporterexpression is detected in the anterior margin of the headfolds, endoderm of the foregut portal and prospective hind-gut of 8.5 dpc early somite embryos (Figs. 2A–D), the fore-brain and the gut of the lower trunk of 9.5 dpc embryos(data not shown) and the forebrain, midbrain, branchialarches, heart, septum transversum, midgut, and the tissuesaround umbilical region of 10.5 dpc embryos (Figs. 2E–H).Histological examination revealed lacZ expression in theneuroepithelial floor of the diencephalon and the outerlayer of the optic cup, the midbrain, the lateral motor col-umn of the spinal cord, rathkes pouches and the ectodermof the oral cavity, the olfactory placode, the peri-ocularand nasal mesenchyme, the cranial nerve ganglia, dorsalroot ganglia, the myotome, sclerotome and perinotochor-dal mesenchyme (Figs. 2F–H, Table 1).
1.4. Expression in the fetal brain
Between 13.5 and 18.5 dpc, expression in the brain isstrongest in the pituitary, the thalamic and hypothalamictissues, the roof of the midbrain and the ventral hindbrain,but not in the telencephalon (the prospective cerebral
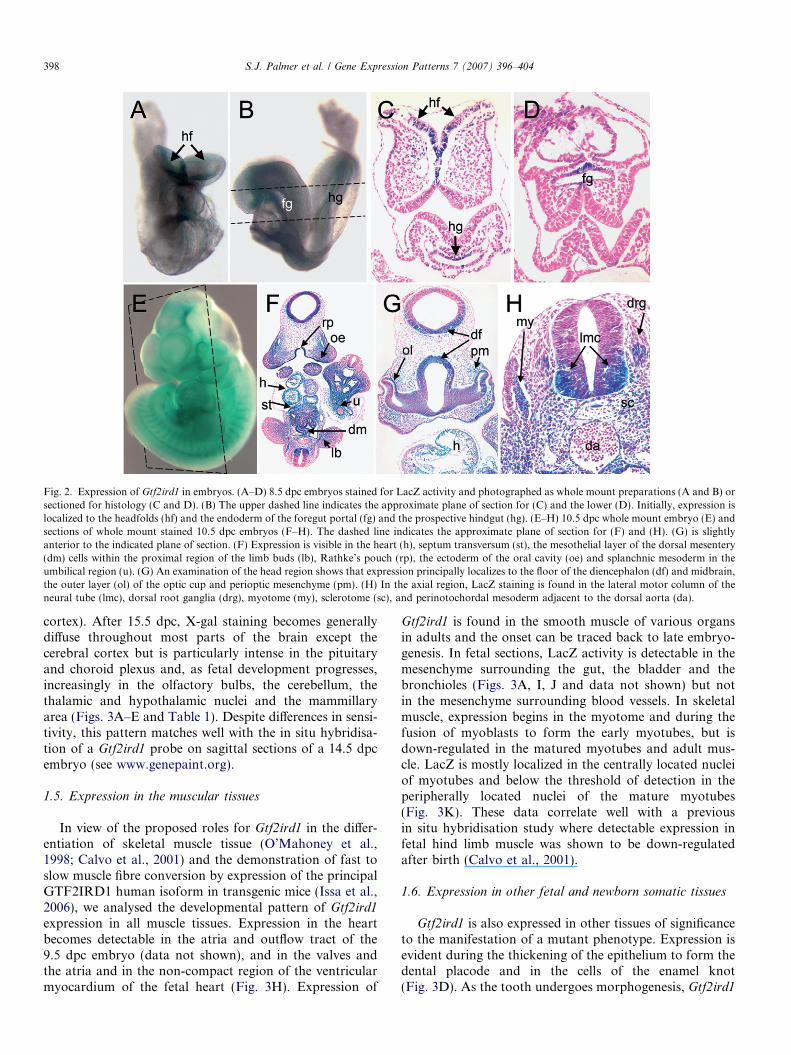
Fig. 2. Expression of Gtf2ird1 in embryos. (A–D) 8.5 dpc embryos stained for LacZ activity and photographed as whole mount preparations (A and B) orsectioned for histology (C and D). (B) The upper dashed line indicates the approximate plane of section for (C) and the lower (D). Initially, expression islocalized to the headfolds (hf) and the endoderm of the foregut portal (fg) and the prospective hindgut (hg). (E–H) 10.5 dpc whole mount embryo (E) andsections of whole mount stained 10.5 dpc embryos (F–H). The dashed line indicates the approximate plane of section for (F) and (H). (G) is slightlyanterior to the indicated plane of section. (F) Expression is visible in the heart (h), septum transversum (st), the mesothelial layer of the dorsal mesentery(dm) cells within the proximal region of the limb buds (lb), Rathke’s pouch (rp), the ectoderm of the oral cavity (oe) and splanchnic mesoderm in theumbilical region (u). (G) An examination of the head region shows that expression principally localizes to the floor of the diencephalon (df) and midbrain,the outer layer (ol) of the optic cup and perioptic mesenchyme (pm). (H) In the axial region, LacZ staining is found in the lateral motor column of theneural tube (lmc), dorsal root ganglia (drg), myotome (my), sclerotome (sc), and perinotochordal mesoderm adjacent to the dorsal aorta (da).
398 S.J. Palmer et al. / Gene Expression Patterns 7 (2007) 396–404
cortex). After 15.5 dpc, X-gal staining becomes generallydiffuse throughout most parts of the brain except thecerebral cortex but is particularly intense in the pituitaryand choroid plexus and, as fetal development progresses,increasingly in the olfactory bulbs, the cerebellum, thethalamic and hypothalamic nuclei and the mammillaryarea (Figs. 3A–E and Table 1). Despite differences in sensi-tivity, this pattern matches well with the in situ hybridisa-tion of a Gtf2ird1 probe on sagittal sections of a 14.5 dpcembryo (see www.genepaint.org).
1.5. Expression in the muscular tissues
In view of the proposed roles for Gtf2ird1 in the differ-entiation of skeletal muscle tissue (O’Mahoney et al.,1998; Calvo et al., 2001) and the demonstration of fast toslow muscle fibre conversion by expression of the principalGTF2IRD1 human isoform in transgenic mice (Issa et al.,2006), we analysed the developmental pattern of Gtf2ird1
expression in all muscle tissues. Expression in the heartbecomes detectable in the atria and outflow tract of the9.5 dpc embryo (data not shown), and in the valves andthe atria and in the non-compact region of the ventricularmyocardium of the fetal heart (Fig. 3H). Expression of
Gtf2ird1 is found in the smooth muscle of various organsin adults and the onset can be traced back to late embryo-genesis. In fetal sections, LacZ activity is detectable in themesenchyme surrounding the gut, the bladder and thebronchioles (Figs. 3A, I, J and data not shown) but notin the mesenchyme surrounding blood vessels. In skeletalmuscle, expression begins in the myotome and during thefusion of myoblasts to form the early myotubes, but isdown-regulated in the matured myotubes and adult mus-cle. LacZ is mostly localized in the centrally located nucleiof myotubes and below the threshold of detection in theperipherally located nuclei of the mature myotubes(Fig. 3K). These data correlate well with a previousin situ hybridisation study where detectable expression infetal hind limb muscle was shown to be down-regulatedafter birth (Calvo et al., 2001).
1.6. Expression in other fetal and newborn somatic tissues
Gtf2ird1 is also expressed in other tissues of significanceto the manifestation of a mutant phenotype. Expression isevident during the thickening of the epithelium to form thedental placode and in the cells of the enamel knot(Fig. 3D). As the tooth undergoes morphogenesis, Gtf2ird1
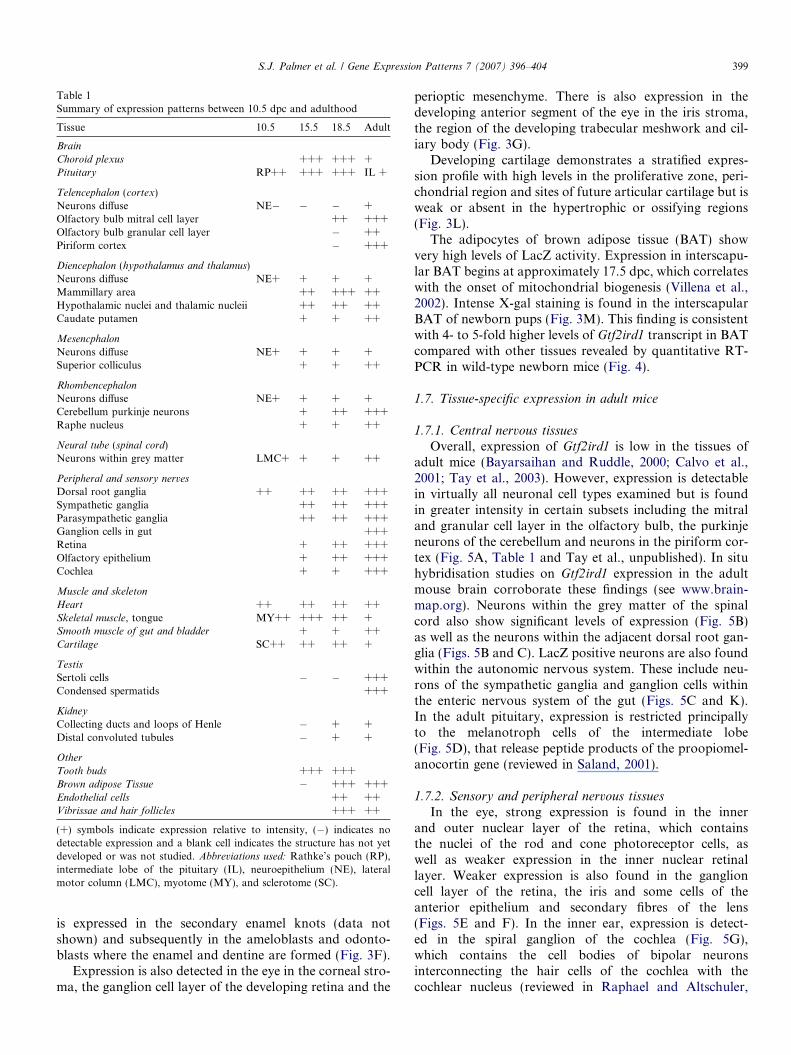
Table 1Summary of expression patterns between 10.5 dpc and adulthood
Tissue 10.5 15.5 18.5 Adult
Brain
Choroid plexus +++ +++ +Pituitary RP++ +++ +++ IL +
Telencephalon (cortex)Neurons diffuse NE� � � +Olfactory bulb mitral cell layer ++ +++Olfactory bulb granular cell layer � ++Piriform cortex � +++
Diencephalon (hypothalamus and thalamus)Neurons diffuse NE+ + + +Mammillary area ++ +++ ++Hypothalamic nuclei and thalamic nucleii ++ ++ ++Caudate putamen + + ++
Mesencphalon
Neurons diffuse NE+ + + +Superior colliculus + + ++
Rhombencephalon
Neurons diffuse NE+ + + +Cerebellum purkinje neurons + ++ +++Raphe nucleus + + ++
Neural tube (spinal cord)Neurons within grey matter LMC+ + + ++
Peripheral and sensory nerves
Dorsal root ganglia ++ ++ ++ +++Sympathetic ganglia ++ ++ +++Parasympathetic ganglia ++ ++ +++Ganglion cells in gut +++Retina + ++ +++Olfactory epithelium + ++ +++Cochlea + + +++
Muscle and skeleton
Heart ++ ++ ++ ++Skeletal muscle, tongue MY++ +++ ++ +Smooth muscle of gut and bladder + + ++Cartilage SC++ ++ ++ +
Testis
Sertoli cells � � +++Condensed spermatids +++
Kidney
Collecting ducts and loops of Henle � + +Distal convoluted tubules � + +
Other
Tooth buds +++ +++Brown adipose Tissue � +++ +++Endothelial cells ++ ++Vibrissae and hair follicles +++ ++
(+) symbols indicate expression relative to intensity, (�) indicates nodetectable expression and a blank cell indicates the structure has not yetdeveloped or was not studied. Abbreviations used: Rathke’s pouch (RP),intermediate lobe of the pituitary (IL), neuroepithelium (NE), lateralmotor column (LMC), myotome (MY), and sclerotome (SC).
S.J. Palmer et al. / Gene Expression Patterns 7 (2007) 396–404 399
is expressed in the secondary enamel knots (data notshown) and subsequently in the ameloblasts and odonto-blasts where the enamel and dentine are formed (Fig. 3F).
Expression is also detected in the eye in the corneal stro-ma, the ganglion cell layer of the developing retina and the
perioptic mesenchyme. There is also expression in thedeveloping anterior segment of the eye in the iris stroma,the region of the developing trabecular meshwork and cil-iary body (Fig. 3G).
Developing cartilage demonstrates a stratified expres-sion profile with high levels in the proliferative zone, peri-chondrial region and sites of future articular cartilage but isweak or absent in the hypertrophic or ossifying regions(Fig. 3L).
The adipocytes of brown adipose tissue (BAT) showvery high levels of LacZ activity. Expression in interscapu-lar BAT begins at approximately 17.5 dpc, which correlateswith the onset of mitochondrial biogenesis (Villena et al.,2002). Intense X-gal staining is found in the interscapularBAT of newborn pups (Fig. 3M). This finding is consistentwith 4- to 5-fold higher levels of Gtf2ird1 transcript in BATcompared with other tissues revealed by quantitative RT-PCR in wild-type newborn mice (Fig. 4).
1.7. Tissue-specific expression in adult mice
1.7.1. Central nervous tissues
Overall, expression of Gtf2ird1 is low in the tissues ofadult mice (Bayarsaihan and Ruddle, 2000; Calvo et al.,2001; Tay et al., 2003). However, expression is detectablein virtually all neuronal cell types examined but is foundin greater intensity in certain subsets including the mitraland granular cell layer in the olfactory bulb, the purkinjeneurons of the cerebellum and neurons in the piriform cor-tex (Fig. 5A, Table 1 and Tay et al., unpublished). In situhybridisation studies on Gtf2ird1 expression in the adultmouse brain corroborate these findings (see www.brain-map.org). Neurons within the grey matter of the spinalcord also show significant levels of expression (Fig. 5B)as well as the neurons within the adjacent dorsal root gan-glia (Figs. 5B and C). LacZ positive neurons are also foundwithin the autonomic nervous system. These include neu-rons of the sympathetic ganglia and ganglion cells withinthe enteric nervous system of the gut (Figs. 5C and K).In the adult pituitary, expression is restricted principallyto the melanotroph cells of the intermediate lobe(Fig. 5D), that release peptide products of the proopiomel-anocortin gene (reviewed in Saland, 2001).
1.7.2. Sensory and peripheral nervous tissues
In the eye, strong expression is found in the innerand outer nuclear layer of the retina, which containsthe nuclei of the rod and cone photoreceptor cells, aswell as weaker expression in the inner nuclear retinallayer. Weaker expression is also found in the ganglioncell layer of the retina, the iris and some cells of theanterior epithelium and secondary fibres of the lens(Figs. 5E and F). In the inner ear, expression is detect-ed in the spiral ganglion of the cochlea (Fig. 5G),which contains the cell bodies of bipolar neuronsinterconnecting the hair cells of the cochlea with thecochlear nucleus (reviewed in Raphael and Altschuler,
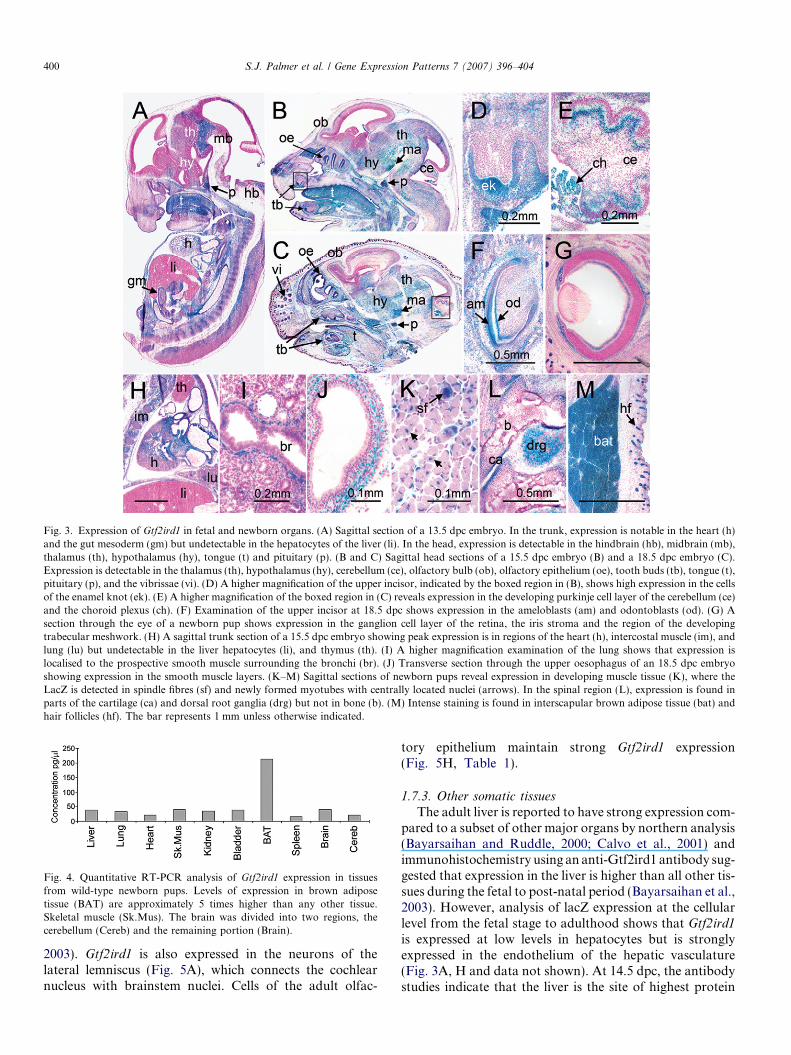
Fig. 3. Expression of Gtf2ird1 in fetal and newborn organs. (A) Sagittal section of a 13.5 dpc embryo. In the trunk, expression is notable in the heart (h)and the gut mesoderm (gm) but undetectable in the hepatocytes of the liver (li). In the head, expression is detectable in the hindbrain (hb), midbrain (mb),thalamus (th), hypothalamus (hy), tongue (t) and pituitary (p). (B and C) Sagittal head sections of a 15.5 dpc embryo (B) and a 18.5 dpc embryo (C).Expression is detectable in the thalamus (th), hypothalamus (hy), cerebellum (ce), olfactory bulb (ob), olfactory epithelium (oe), tooth buds (tb), tongue (t),pituitary (p), and the vibrissae (vi). (D) A higher magnification of the upper incisor, indicated by the boxed region in (B), shows high expression in the cellsof the enamel knot (ek). (E) A higher magnification of the boxed region in (C) reveals expression in the developing purkinje cell layer of the cerebellum (ce)and the choroid plexus (ch). (F) Examination of the upper incisor at 18.5 dpc shows expression in the ameloblasts (am) and odontoblasts (od). (G) Asection through the eye of a newborn pup shows expression in the ganglion cell layer of the retina, the iris stroma and the region of the developingtrabecular meshwork. (H) A sagittal trunk section of a 15.5 dpc embryo showing peak expression is in regions of the heart (h), intercostal muscle (im), andlung (lu) but undetectable in the liver hepatocytes (li), and thymus (th). (I) A higher magnification examination of the lung shows that expression islocalised to the prospective smooth muscle surrounding the bronchi (br). (J) Transverse section through the upper oesophagus of an 18.5 dpc embryoshowing expression in the smooth muscle layers. (K–M) Sagittal sections of newborn pups reveal expression in developing muscle tissue (K), where theLacZ is detected in spindle fibres (sf) and newly formed myotubes with centrally located nuclei (arrows). In the spinal region (L), expression is found inparts of the cartilage (ca) and dorsal root ganglia (drg) but not in bone (b). (M) Intense staining is found in interscapular brown adipose tissue (bat) andhair follicles (hf). The bar represents 1 mm unless otherwise indicated.
Fig. 4. Quantitative RT-PCR analysis of Gtf2ird1 expression in tissuesfrom wild-type newborn pups. Levels of expression in brown adiposetissue (BAT) are approximately 5 times higher than any other tissue.Skeletal muscle (Sk.Mus). The brain was divided into two regions, thecerebellum (Cereb) and the remaining portion (Brain).
400 S.J. Palmer et al. / Gene Expression Patterns 7 (2007) 396–404
2003). Gtf2ird1 is also expressed in the neurons of thelateral lemniscus (Fig. 5A), which connects the cochlearnucleus with brainstem nuclei. Cells of the adult olfac-
tory epithelium maintain strong Gtf2ird1 expression(Fig. 5H, Table 1).
1.7.3. Other somatic tissues
The adult liver is reported to have strong expression com-pared to a subset of other major organs by northern analysis(Bayarsaihan and Ruddle, 2000; Calvo et al., 2001) andimmunohistochemistry using an anti-Gtf2ird1 antibody sug-gested that expression in the liver is higher than all other tis-sues during the fetal to post-natal period (Bayarsaihan et al.,2003). However, analysis of lacZ expression at the cellularlevel from the fetal stage to adulthood shows that Gtf2ird1
is expressed at low levels in hepatocytes but is stronglyexpressed in the endothelium of the hepatic vasculature(Fig. 3A, H and data not shown). At 14.5 dpc, the antibodystudies indicate that the liver is the site of highest protein
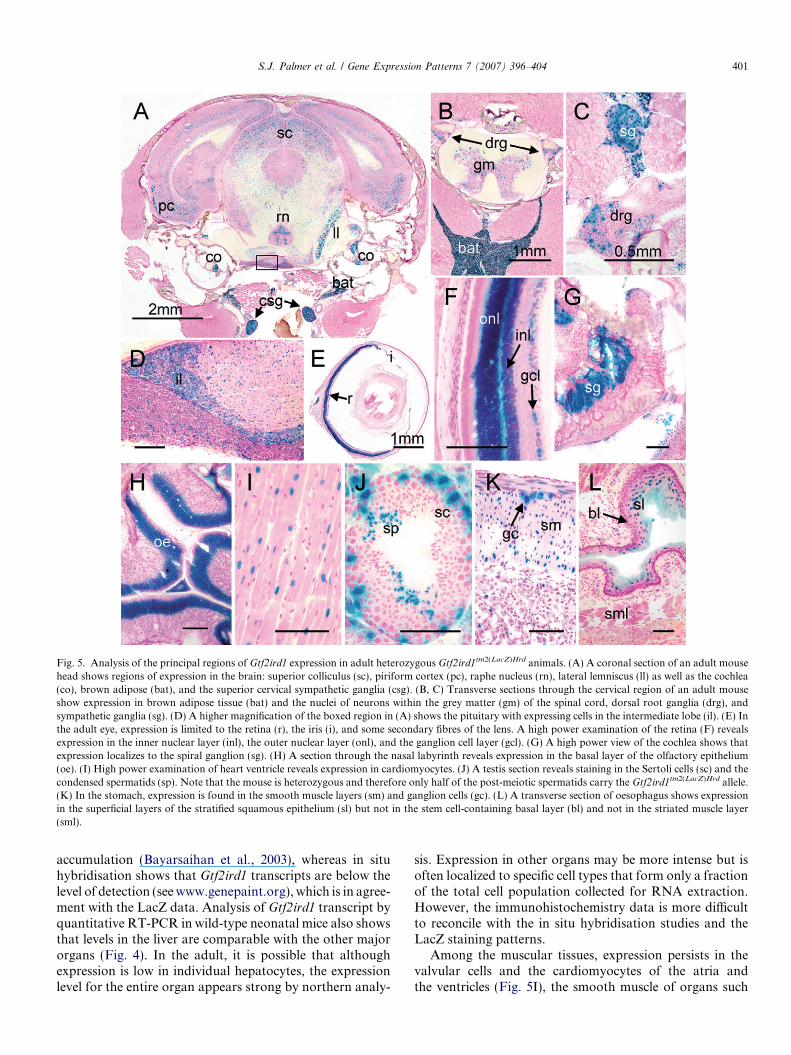
Fig. 5. Analysis of the principal regions of Gtf2ird1 expression in adult heterozygous Gtf2ird1tm2(LacZ)Hrd animals. (A) A coronal section of an adult mousehead shows regions of expression in the brain: superior colliculus (sc), piriform cortex (pc), raphe nucleus (rn), lateral lemniscus (ll) as well as the cochlea(co), brown adipose (bat), and the superior cervical sympathetic ganglia (csg). (B, C) Transverse sections through the cervical region of an adult mouseshow expression in brown adipose tissue (bat) and the nuclei of neurons within the grey matter (gm) of the spinal cord, dorsal root ganglia (drg), andsympathetic ganglia (sg). (D) A higher magnification of the boxed region in (A) shows the pituitary with expressing cells in the intermediate lobe (il). (E) Inthe adult eye, expression is limited to the retina (r), the iris (i), and some secondary fibres of the lens. A high power examination of the retina (F) revealsexpression in the inner nuclear layer (inl), the outer nuclear layer (onl), and the ganglion cell layer (gcl). (G) A high power view of the cochlea shows thatexpression localizes to the spiral ganglion (sg). (H) A section through the nasal labyrinth reveals expression in the basal layer of the olfactory epithelium(oe). (I) High power examination of heart ventricle reveals expression in cardiomyocytes. (J) A testis section reveals staining in the Sertoli cells (sc) and thecondensed spermatids (sp). Note that the mouse is heterozygous and therefore only half of the post-meiotic spermatids carry the Gtf2ird1tm2(LacZ)Hrd allele.(K) In the stomach, expression is found in the smooth muscle layers (sm) and ganglion cells (gc). (L) A transverse section of oesophagus shows expressionin the superficial layers of the stratified squamous epithelium (sl) but not in the stem cell-containing basal layer (bl) and not in the striated muscle layer(sml).
S.J. Palmer et al. / Gene Expression Patterns 7 (2007) 396–404 401
accumulation (Bayarsaihan et al., 2003), whereas in situhybridisation shows that Gtf2ird1 transcripts are below thelevel of detection (see www.genepaint.org), which is in agree-ment with the LacZ data. Analysis of Gtf2ird1 transcript byquantitative RT-PCR in wild-type neonatal mice also showsthat levels in the liver are comparable with the other majororgans (Fig. 4). In the adult, it is possible that althoughexpression is low in individual hepatocytes, the expressionlevel for the entire organ appears strong by northern analy-
sis. Expression in other organs may be more intense but isoften localized to specific cell types that form only a fractionof the total cell population collected for RNA extraction.However, the immunohistochemistry data is more difficultto reconcile with the in situ hybridisation studies and theLacZ staining patterns.
Among the muscular tissues, expression persists in thevalvular cells and the cardiomyocytes of the atria andthe ventricles (Fig. 5I), the smooth muscle of organs such
402 S.J. Palmer et al. / Gene Expression Patterns 7 (2007) 396–404
as the bladder (data not shown), and the gut (Fig. 5K).Interestingly, the conversion of smooth muscle to striatedmuscle in the upper third of the oesophagus is accompa-nied by the down-regulation of Gtf2ird1 expression (com-pare Fig. 3J with Fig. 5L).
Expression is found in the outer layers of the stratifiedsquamous epithelium of the oesophagus (Fig. 5L), theSertoli cells and condensed spermatids in the testis(Fig. 5J), the matrix and inner root sheath cells of hair fol-licles and vibrissae and weakly in the medulla and the distalconvoluted tubules of the kidney (Table 1 and data notshown). Expression in brown adipose tissue persists strong-ly during adulthood in the interscapular region and inminor sites such as around the major vessels of the heart,at the kidney hilus and in small deposits in the head andneck (Figs. 5A and B and data not shown).
1.8. Comparison of the LacZ pattern with other expression
studies
The LacZ expression data presented here areconsistent with other analyses of transcription bothby in situ hybridisation (see www.genepaint.org,www.brain-map.org, Calvo et al., 2001) and by RT-PCR (Fig. 4). However, these patterns show some signif-icant differences to the expression patterns reported usingan anti-Gtf2ird1 antibody (Bayarsaihan et al., 2003).While there is some overlap between the studies, e.g.the nervous system and the developing teeth, the concor-dance is poor in many other areas such as the eye andthe liver, and no mention is made of expression in brownadipose tissue. While it is possible to explain some differ-ences by post-transcriptional regulation it is difficult toaccount for all. This may call into question the specificityof the antibody since, at the time of its first report, itwas shown to detect multiple bands on western blots(Bayarsaihan and Ruddle, 2000).
In summary, the expression patterns of Gtf2ird1 in theembryonic and adult tissues are consistent with the mani-festation of neurological defects in the mutant mice. Untilthe discrepancy between the effects of the 40 kb deletion(Durkin et al., 2001; Tassabehji et al., 2005) and the exon2 mutation studied here is resolved, it would be prematureto dismiss Gtf2ird1 as a contributor to the non-neurolog-ical symptoms of Williams syndrome. It is possible thatmouse-human differences mean that equivalent geneticalterations cause less phenotypic impact in mice. Alterna-tively, it could suggest a combinatorial genetic explanationof Williams syndrome and experiments involving the pro-duction of mice with combined mutations in Gtf2ird1,Gtf2i, and possibly Gtf2ird2 may be required to replicatethe disease phenotype. Therefore, it will be important tocatalogue the developmental expression profile of theother two family members (Gtf2i and Gtf2ird2) and tostudy the consequences of their inactivation, to fullyunderstand the molecular mechanisms underlying thisdisorder.
2. Experimental procedures
2.1. Generation of Gtf2ird1tm2(LacZ)Hrd mice
The mutant reporter allele was produced by targeted homologousrecombination in 129 embryonic stem cells. Exon 2 of the Gtf2ird1 genewas replaced with a LacZ cDNA fused to a nuclear localisation signal(Kalderon et al., 1984). A pgkNEO cassette flanked by LoxP sites wasinserted downstream to select for ES cell integrants. This cassette wasremoved after germ line transmission was established by inter-breedingwith C57BL/6 mice that carry the CMV-Cre transgene (Schwenk et al.,1995). The mutant reporter allele was backcrossed onto the C57BL/6background and had reached the N5 backcross generation at the time ofthe study. Specimens for expression studies were obtained from embryosproduced by the mating of heterozygous Gtf2ird1tm2(LacZ)Hrd mice withwild-type C57BL/6 mice.
2.2. Detection of LacZ expression
For whole mount b-galactosidase detection, all embryos were removedand dissected in phosphate buffered saline (PBS), fixed in 4% paraformal-dehyde in PBS for 15 min, rinsed in PBS and then immersed in LacZ stain-ing solution (5 mM K4Fe(CN)6, 5 mM K3Fe(CN)6, 2 mM MgCl2, and1 mg/ml X-gal in PBS) for as long as required to achieve the desired col-our. Usually this was approximately 2–3 h for embryos that were to bephotographed as whole mounts or overnight for embryos that were paraf-fin embedded and sectioned.
Frozen sections were used for embryos beyond 12.5 dpc and adult tissues.Tissues or embryos were embedded in O.C.T. compound (Tissue-Tek) andfrozen in liquid nitrogen. Cryostat sections of variable thickness, usually10 lM, were fixed for 5 min in 0.5% glutaraldehyde in PBS, rinsed in PBS sev-eral times and immersed in LacZ staining solution overnight. Sections werecounterstained in nuclear fast red, dehydrated, and mounted in DPX.
2.3. Total RNA extraction and first-strand cDNA synthesis
Tissues from newborn mice were dissected and immediately treatedwith RNAlater Stabilization Reagent (Ambion) according to the manufac-turer’s instructions. Total RNA was extracted using TriReagent (Sigma).The yield and quality of RNA was checked by spectrophotometry and gelelectrophoresis. First strand synthesis was performed using 1 lg of totalRNA, M-MLV reverse transcriptase (Promega) and oligo (dT)15 primers(Promega).
2.4. Quantitative real time PCR (qRT-PCR)
Gtf2ird1 cDNA was detected by real time PCR using the forwardprimer 50-GATCCCACTTCTCTGACTTGTCATG-30 and reverse 50-TACAGCACTTCGATGCCCAACCAC-3 0, and 1· QuantiTect SYBR GreenPCR Master Mix (Qiagen, Victoria, Australia) which contains dNTPs,HotStarTaq DNA polymerase, Tris–HCl, pH 8.7, KCl, (NH4)2SO4,5 mM MgCl2, and SYBR Green I. qRT-PCR was performed using theRotor-Gene 2000 Real-Time Cycler (Corbett, Australia) and includedan initial denaturing step of 15 min followed by 40 cycles of 95 �C for15 s, 54 �C for 30 s, and 72 �C for 30 s. These data were corrected by mea-surements of the levels of hypoxanthine–guanine phosphoribosyltransfer-ase (HPRT), which was determined by qRT-PCR using the HPRTforward primer: AGCTTGCTGGTGAAAAGGAC and HPRT reverseprimer: TCAACTTGCGCTCATCTTAG.
2.5. PCR and southern blot screening of Gtf2ird1tm2(LacZ)Hrd mice
Small portions of mouse tail collected at 10 days of age were used toextract DNA which was digested and electrophoresed using standardmethods (Sambrook et al., 1989), then Southern blotted onto HybondN+ membrane (Amersham Biosciences) using the manufacturer’s proto-col. Probes were produced by labelling DNA fragments with 32P-dCTP
S.J. Palmer et al. / Gene Expression Patterns 7 (2007) 396–404 403
using DECAprimeII (Ambion) random primer labelling and purified withProbeQuant G-50 micro columns (Amersham Biosciences). Hybridisationof probes was performed in the hybridisation solution of Church and Gil-bert (1984). The probe used was derived from a region outside the 5 0 endof the targeting construct.
PCR genotyping of mice was performed using standard methods and acombination of three primers added simultaneously: common forwardprimer GCATCTCTGGAACTTGAGTTG, wild-type reverse primerGACTTCCTGTAGGTGCTAGGTG and LacZ reverse primerTGTGCTGCAAGGCGATTAAG.
Acknowledgements
We thank Patrick Tam for critical review of the manu-script, Dr. Christine Biben for supplying the C57BL/6-CMV-Cre mice, Kata Popovic for help with genotyping,Minru Xiou for assistance with histology and ShahragimTajbakhsh for supplying the nuclear localized LacZ cDNAcassette.
Appendix A. Supplementary data
Supplementary data associated with this article can befound, in the online version, at doi:10.1016/j.modgep.2006.11.008.
References
Bayarsaihan, D., Ruddle, F.H., 2000. Isolation and characterization ofBEN, a member of the TFII-I family of DNA-binding proteinscontaining distinct helix–loop–helix domains. Proc. Natl. Acad. Sci.USA 97, 7342–7347.
Bayarsaihan, D., Dunai, J., Greally, J.M., Kawasaki, K., Sumiyama, K.,Enkhmandakh, B., Shimizu, N., Ruddle, F.H., 2002. Genomicorganization of the genes Gtf2ird1, Gtf2i, and Ncf1 at the mousechromosome 5 region syntenic to the human chromosome 7q11.23Williams syndrome critical region. Genomics 79, 137–143.
Bayarsaihan, D., Bitchevaia, N., Enkhmandakh, B., Tussie-Luna, M.I.,Leckman, J.F., Roy, A., Ruddle, F., 2003. Expression of BEN, amember of TFII-I family of transcription factors, during mousepre- and postimplantation development. Gene Exp. Patterns 3,579–589.
Calvo, S., Vullhorst, D., Venepally, P., Cheng, J., Karavanova, I.,Buonanno, A., 2001. Molecular dissection of DNA sequences andfactors involved in slow muscle-specific transcription. Mol. Cell. Biol.21, 8490–8503.
Church, G.M., Gilbert, W., 1984. Genomic sequencing. Proc. Natl. Acad.Sci. USA 81, 1991–1995.
Curran, M.E., Atkinson, D.L., Ewart, A.K., Morris, C.A., Leppert, M.F.,Keating, M.T., 1993. The elastin gene is disrupted by a translocationassociated with supravalvular aortic stenosis. Cell 73, 159–168.
Durkin, M.E., Keck-Waggoner, C.L., Popescu, N.C., Thorgeirsson, S.S.,2001. Integration of a c-myc transgene results in disruption of the mouseGtf2ird1 gene, the homologue of the human GTF2IRD1 gene hemizy-gously deleted in Williams–Beuren syndrome. Genomics 73, 20–27.
Franke, U., 1999. Williams–Beuren syndrome: genes and mechanisms.Hum. Mol. Genet. 8, 1947–1954.
Hinsley, T.A., Cunliffe, P., Tipney, H.J., Brass, A., Tassabehji, M., 2004.Comparison of TFII-I gene family members deleted in Williams–Beuren syndrome. Protein Sci. 13, 2588–2599.
Hirota, H., Matsuoka, R., Chen, X.N., Salandanan, L.S., Lincoln, A., Rose,F.E., Sunahara, M., Osawa, M., Bellugi, U., Korenberg, J.R., 2003.Williams syndrome deficits in visual spatial processing linked to
GTF2IRD1 and GTF2I on chromosome 7q11.23. Genet. Med. 5, 311–321.
Issa, L.L., Palmer, S.J., Guven, K.L., Santucci, N., Hodgson, V.R.,Popovic, K., Joya, J.E., Hardeman, E.C., 2006. MusTRD canregulate postnatal fiber-specific expression. Dev. Biol. 293, 104–115.
Kalderon, D., Roberts, B.L., Richardson, W.D., Smith, A.E., 1984. Ashort amino acid sequence able to specify nuclear location. Cell 39,499–509.
Karmiloff-Smith, A., Grant, J., Ewing, S., Carette, M.J., Metcalfe, K.,Donnai, D., Read, A.P., Tassabehji, M., 2003. Using case studycomparisons to explore genotype–phenotype correlations in Williams–Beuren syndrome. J. Med. Genet. 40, 136–140.
Makeyev, A.V., Erdenechimeg, L., Mungunsukh, O., Roth, J.J., Enkh-mandakh, B., Ruddle, F.H., Bayarsaihan, D., 2004. GTF2IRD2 islocated in the Williams–Beuren syndrome critical region 7q11.23 andencodes a protein with two TFII-I-like helix–loop–helix repeats. Proc.Natl. Acad. Sci. USA 101, 11052–11057.
Metcalfe, K., Rucka, A.K., Smoot, L., Hofstadler, G., Tuzler, G.,McKeown, P., Siu, V., Rauch, A., Dean, J., Dennis, N., Ellis, I.,Reardon, W., Cytrynbaum, C., Osborne, L., Yates, J.R., Read,A.P., Donnai, D., Tassabehji, M., 2000. Elastin: mutational spec-trum in supravalvular aortic stenosis. Eur. J. Hum. Genet. 8, 955–963.
Meyer-Lindenberg, A., Mervis, C.B., Berman, K.F., 2006. Neuralmechanisms in Williams syndrome: a unique window to geneticinfluences on cognition and behaviour. Nat. Neurosci. 7, 380–393.
O’Mahoney, J.V., Guven, K.L., Lin, J., Joya, J.E., Robinson, C.S., Wade,R.P., Hardeman, E.C., 1998. Identification of a novel slow-muscle-fiber enhancer binding protein, MusTRD1. Mol. Cell. Biol. 18, 6641–6652.
Perez Jurado, L.A., 2003. Williams–Beuren syndrome: a model ofrecurrent genomic mutation. Horm. Res. 59 (suppl 1), 106–113.
Polly, P., Haddadi, L.M., Issa, L.L., Subramaniam, N., Palmer, S.J., Tay,E.S., Hardeman, E.C., 2003. hMusTRD1alpha1 represses MEF2activation of the troponin I slow enhancer. J. Biol. Chem. 278,36603–36610.
Raphael, Y., Altschuler, R.A., 2003. Structure and innervation of thecochlea. Brain Res. Bull. 60, 397–422.
Roy, A.L., 2001. Biochemistry and biology of the inducible multifunc-tional transcription factor TFII-I. Gene 274, 1–13.
Saland, L.C., 2001. The mammalian pituitary intermediate lobe: an updateon innervation and regulation. Brain Res. Bull. 54, 587–593.
Sambrook, J., Fritsch, E.F., Maniatis, T., 1989. Molecular Cloning. ColdSpring Harbor Laboratory Press, Cold Spring Harbor.
Schwenk, F., Baron, U., Rajewsky, K., 1995. A cre-transgenicmouse strain for the ubiquitous deletion of loxP-flanked genesegments including deletion in germ cells. Nucleic Acids Res. 23,5080–5081.
Tassabehji, M., 2003. Williams–Beuren syndrome: a challenge for geno-type–phenotype correlations. Hum. Mol. Genet. 12 (Spec. No. 2),R229–R237.
Tassabehji, M., Hammond, P., Karmiloff-Smith, A., Thompson, P.,Thorgeirsson, S.S., Durkin, M.E., Popescu, N.C., Hutton, T.,Metcalfe, K., Rucka, A., Stewart, H., Read, A.P., Maconochie, M.,Donnai, D., 2005. GTF2IRD1 in craniofacial development of humansand mice. Science 310, 1184–1187.
Tay, E.S., Guven, K.L., Subramaniam, N., Polly, P., Issa, L.L., Gunning,P.W., Hardeman, E.C., 2003. Regulation of alternative splicing ofGtf2ird1 and its impact on slow muscle promoter activity. Biochem. J.374, 359–367.
Tipney, H.J., Hinsley, T.A., Brass, A., Metcalfe, K., Donnai, D.,Tassabehji, M., 2004. Isolation and characterisation of GTF2IRD2,a novel fusion gene and member of the TFII-I family of transcrip-tion factors, deleted in Williams–Beuren syndrome. Eur. J. Hum.Genet. 12, 551–560.

404 S.J. Palmer et al. / Gene Expression Patterns 7 (2007) 396–404
Villena, J.A., Carmona, M.C., Rodriguez, D.L.C., Rossmeisl, M., Vinas,O., Mampel, T., Iglesias, R., Giralt, M., Villarroya, F., 2002.Mitochondrial biogenesis in brown adipose tissue is associated withdifferential expression of transcription regulatory factors. Cell Mol.Life Sci. 59, 1934–1944.
Vullhorst, D., Buonanno, A., 2003. Characterization of generaltranscription factor 3, a transcription factor involved in slow
muscle-specific gene expression. J. Biol. Chem. 278, 8370–8379.
Vullhorst, D., Buonanno, A., 2005. Multiple GTF2I-like repeatsof general transcription factor 3 exhibit DNA bindingproperties. Evidence for a common origin as a sequence-specific DNA interaction module. J. Biol. Chem. 280, 31722–31731.
Copyright © 2022 FDOKUMEN