EXPRES 2017 - epget.bme.hu
114
1 Proceedings 9 th International Symposium on Exploitation of Renewable Energy Sources and Efficiency 9 th International Symposium on Exploitation of Renewable Energy Sources and Efficiency March 30 – April 01, 2017, Subotica, Serbia EXPRES 2017
-
Upload
khangminh22 -
Category
Documents
-
view
2 -
download
0
Transcript of EXPRES 2017 - epget.bme.hu

1
Proc
eedi
ngs
9th International Symposium on Exploitation of Renewable Energy Sources and Efficiency
9th International Symposium on Exploitation of Renewable Energy Sources and Efficiency March 30 – April 01, 2017, Subotica, Serbia
EXPRES 2017
2
EXPRES 2017 ____________________________________________________________________
9th International Symposium on Exploitation of Renewable Energy Sources and
Efficiency
March 30- April 01, 2017
Subotica, Serbia
_______________________________________________________________________________
http://expres 2017 ISBN 978-86-919769-1-0
_______________________________________________________________________________
ISBN: 978-86-919769-1-0
2
EXPRES 2017
9th International Symposium on Exploitation of Renewable Energy
Sources and Efficiency
Subotica, Serbia March 30- April 01, 2017
_____________________________________________________________________________
Proceedings
CIP - Каталогизација у публикацији , Библиотека Матице српске, Нови Сад , 620.91(082) INTERNATIONAL Symposium on Exploitation of Renewable Energy Sources and Efficiency (8; 2017; Subotica) Proceedings [Elektronski izvori] / 8th International Symposium on Exploitation of Renewable Energy Sources and Efficiency, Subotica, March 30- April 01, 2017 ; [proceedings editor József Nyers]. - Subotica : Inženjersko-tehničko udruženje vojvođanskih Mađara, 2017. - 1 elektronski optički disk (CD-ROM) ; 12 cm Tekst štampan dvostubačno. - Tiraž 50. - Bibliografija uz svaki rad.
ISBN 978-86-919769-1-0
a) Енергија - Обновљиви извори – Зборници
COBISS.SR-ID 304712967
http://Expres 2017 ISBN 978-86-919769-1-0

3
EXPRES 2017 ____________________________________________________________________
9th International Symposium on Exploitation of Renewable Energy Sources and
Efficiency
March 30- April 01, 2017
Subotica, Serbia
_______________________________________________________________________________
http://expres 2017 ISBN 978-86-919769-1-0
_______________________________________________________________________________
ISBN: 978-86-919769-1-0
2
EXPRES 2017
9th International Symposium on Exploitation of Renewable Energy
Sources and Efficiency
Subotica, Serbia March 30- April 01, 2017
_____________________________________________________________________________
Proceedings
CIP - Каталогизација у публикацији , Библиотека Матице српске, Нови Сад , 620.91(082) INTERNATIONAL Symposium on Exploitation of Renewable Energy Sources and Efficiency (8; 2017; Subotica) Proceedings [Elektronski izvori] / 8th International Symposium on Exploitation of Renewable Energy Sources and Efficiency, Subotica, March 30- April 01, 2017 ; [proceedings editor József Nyers]. - Subotica : Inženjersko-tehničko udruženje vojvođanskih Mađara, 2017. - 1 elektronski optički disk (CD-ROM) ; 12 cm Tekst štampan dvostubačno. - Tiraž 50. - Bibliografija uz svaki rad.
ISBN 978-86-919769-1-0
a) Енергија - Обновљиви извори – Зборници
COBISS.SR-ID 304712967
http://Expres 2017 ISBN 978-86-919769-1-0

4
Numerical investigation on the energy consumption of ventilation systems ............................................................................6 Miklos KassaiBudapest University of Technology and EconomicsDepartment of Building Service Engineering and Process Engineering, Budapest, Hungary
Steady-state mathematical model with lumped parameters of the heat pump evaporator and ...........................................10simulation resultats
Jozsef Nyers, Zoltan Pek Obuda University Budapest, Becsi ut 96, 1034 Budapest, Hungary
Recycling of ashes from biomass-combustion power plant in swage sludgemanagement ..................................................................................................................................................................................15
M. Wójcika, F. Stachowiczb, A. MasłońcDepartment of Materials Forming and Processing,RzeszowUniversity of Technology, 35-959 Rzeszow, Powstańców Warszawy 8, PolandDepartment of Chemistry and Environmental Engineering,RzeszowUniversity of Technology, 35-959 Rzeszow, Powstańców Warszawy 6, Poland
Application of analogy of momentum and heat transfer at shell and tube condenser ..........................................................21 Orsolya Molnar, Zalan Zsigmond BME Budapest, Department of Building Service and Process Engineering, Budapest Hungary
Performance of heat pump’s condenser in heating process .....................................................................................................27J. Nyers, A. NyersObuda UniversityBudapest, HungaryeUniversity BME, Budapest, Hungarye
Increasing efficiency of fixture planning by automating some planning steps .......................................................................32M. Stampfer, A. RétfalviDepartment of Mechanical Engineering, , University of PécsH-7624 Pécs, Boszorkány u. 2, HungaryDepartment of Mechanical Engineering, Subotica Tech24000 Subotica, Marka Oreškovića 16, Serbia
Simulation result of a nuclear power plant cooling system using Matlab ..............................................................................37A, Szente, I. Farkas, P. OdryPaks Nuklear Power Plant, Paks, HungaryUniversity of Dunaújváros/Computer Engineering, Dunaújváros, HungaryUniversity of Dunaújváros/Computer Engineering, Dunaújváros, Hungary
Composite materials for wind power turbine blades ................................................................................................................44R. SZABÓ a, L. SZABÓ bIngtex Bt - Rejtő Sándor Foundation H-1056 Budapest Nyáry Pál u. 5, HungaryInstitute of Environmental Protection Engineering, Rejtő Sándor Faculty of Light Industry and Environmental ProtectionEngineering, Óbuda University, H-1034 Budapest, Doberdó u. 6, Hungary
Application of machine learning techniques in forecasting energy efficiency in buildings ...................................................51O. Grljević, L. Seres, S. BošnjakDepartment of Business Informatics and Quantitative Methods, University of Novi Sad, Faculty of Economics SuboticaSegedinski put 9-11, Serbia
Hydraulics of a thermal network for district heating system ..................................................................................................58J. Takács, Z. Straková, L .RáczSlovak University of Technology in Bratislava, Faculty of Civil Engineering,Department of Building Services, Radlinského 11, 810 05 Bratislava, Slovak Republic
Table of contents

5
Comparisons of experimental measurements of indoor climate parameters in a swimming pool during winter and summer operation period ...........................................................................................................................................................................63
Belo B. Füri, Róbert TurzaDepartment of Building Services, Faculty of Civil Engineering, Slovak University ofTechnology in Bratislava SK-810 05 Bratislava,, Radlinského 11, Slovakia
Optimal operating conditions for manure biogas plants in Serbia .........................................................................................69P. Kovač, S. Kirin, B. Savković, D. Jesic, D. GolubovicDepartment for Production Engineering, Faculty of Technical Sciences, University of Novi Sad21000 Novi Sad, Trg D Obradovica 6, SerbiaInovative Centre of Faculty of Mecchanical Engineering, University of Belgrade11000 Beograd Trg Kraljice Marije, SerbiaInternational Technology and Management Academy – MTMA,TrgD.Obradovića 7, 21000 Novi Sad, SerbiaFaculty of Mechanical Engineering, University of East Sarajevo71123East Sarajevo, Vuka Karadžića 30, Bosnia and Hercegovina
Temperature parameters changing of a space heating element after human action .............................................................75M. KurčováSlovak University of Technology in Bratislava, Faculty of Civil Engineering, Department of Building ServicesSK – 810 05 Bratislava, Radlinského 11, Slovakia
Modern cost accounting techniques for renewable energy and sustainable development ....................................................79Đ. Petkovič, I. MedvedUniversity of Novi Sad, Faculty of Economics, Subotica,Segedinski put 9-11, Serbia
Environmentally sustainable tourist behaviour in the function of sustainable development ...............................................83M. Jelača Strugar, A. Boljević, S. BoljevićDepartment of Management, Faculty of Economics in Subotica,University of Novi Sad, 24000 Subotica, Segedinski put 9-11, Srbija
Seasonal savings of transpired solar collectors .........................................................................................................................89B. Bokor, L. Kajtár, D. Eryener, H. AkhanBudapest University of Technology and Economics, Department of Building Service and Process EngineeringH-1111 Budapest, Műegyetemrkp. 3-9, Hungary
Circular business model – effects on company’s energy efficiency and renewable energy use .............................................95S. Tomić, D. Delić, A. StoiljkovićFaculty of Economics, Universityof Novi Sad24000 Subotica, Segedinski put 9-11, Serbia
The development of plastic rainwater tank by creating a construction which can be economically produced under domestic circumstances .............................................................................................................................................................................101
A. Nagy, B. Dudinszky , A. SzekrényesDepartment of Building Services and Process Engineering, Faculty of Mechanical Engineering,Budapest University of Technology and Economics, Budapest, Hungary
Geothermal heating of public buildings in downtown Zalaegerszeg ....................................................................................107J. Kontra, L. Garbai, J. SzanyiBudapest University of Technology and Economics, Műegyetemrakpart 3., 1111 BudapestUniversity of Szeged, Hungary
Thermal comfort tests using thermal manikin ........................................................................................................................ 111Balázs CakóPhD StudentBreuer Marcell Doctorial School, University of Pécs, Faculty of Engineering and Information TechnologyDepartment of Mechanical Engineering at University of Pécs, Faculty of Engineering and Information Technology2 Boszorkány u.,H-7626 Pécs Hungary

6
EXPRES 2017 ISBN 978-86-919769-1-0
Numerical investigation on the energy consumption of ventilation systems
M. KASSAI a
Department of Building Service Engineering and Process, Budapest University of
Technology and Economics
H-1111 Budapest, Muegyetem rkp. 3-9., Hungary aE-mail:[email protected]
The object of this research study was to investigate the heating energy consumption of ventilation systems with five different
heat-and energy recovery units in three different weather European climates. Using the ambient temperature and enthalpy
duration curves, detailed mathematical expressions are presented to determine the energy consumption of ventilation systems
during the heating period. The three different climate cities are: Palermo (as Mediterranean zone), Krakow (as temperate zone)
and to Helsinki (as cold climate region). The investigated heat recoveries that are suitable only for heat transfer are the fixed-plate
heat exchanger, the run around coil and the heat-pipe technology. Energy exchangers allow both heat-and moisture transfer with
higher moisture transfer effectiveness by a sorption rotor and with lower without sorption coating. The effectiveness values of
heat and energy exchangers were selected based on VDI 2071 standard.
Keywords: ventilation system, energy consumption, heat recovery, numerical investigation
1. Introducn
There is more and more attention for energy
consumption reduction, achieving sustainable
development that by primary energy source (coal,
oil natural gas) saving and utilization of renewable
energy sources [1, 2]. Spread of new techniques in
building construction, low-energy and passive
houses can be seen in recent years [3]. Herewith
the number of ventilation systems used in
buildings has been also increased. The
requirements for air tightness of passive house are
much higher than in case of a traditional house [4].
Due to the increasing indoor air quality
(IAQ) standard, the ventilation loads represent
about 20–50% part of the total heating demand for
new and retrofitted buildings [5,6,7,8,9,10,11],
depending on the building’s insulation,
compactness, air change rate, indoor heat sources,
indoor set points and outdoor climate. Therefore,
there is a need for residential buildings and their
systems to provide a comfortable and acceptable
indoor environment. The usage of mechanical
ventilation system equipped with an air-to-air
recovery heat-and energy exchanger is a solution
to ensure a high global energy performance of the
building and reach the requirements in terms of
IAQ [12]. In these systems, indoor air extracted
from the building is used to pre-heat (in winter) or
pre-cool (in summer) the fresh air flow rate
coming from the outdoor environment. While such
exchangers [13,14] have been on the market for
many years, only a few modeling works are
presented in technical and scientific literature.
Only the parameters having an impact on the
energy performance of heat recovery ventilation
have been investigated deeper in the last years.
Mardiana and Riffat [15] list physical
characteristics ofthe main components: heat
exchanger and fans that influence the efficiency of heat
or energy recovery. Roulet et al. [16] discuss the effect of
leakages and shortcuts on heat recovery unit and show
that the conventional methods to determine the heat
recovery efficiency are not sufficient to outline the global
performance of ventilation systems; and propose a
method based on the specific net energy savings to
characterize the energy performance. Manz et al. [17]
investigate the same effect on a single room ventilation
system and define a heat recovery efficiency based on
heating load reduction. Based on the above mentioned
facts it is easy to see that the calculation of energy
consumption and energy saved of ventilation systems is a
complex design problem requiring many pieces of
information.
The object of this research study was to investigate
the heating energy saved of five different constructed air-
to-air heat-and energy exchangers in three in different
weather European. Using the ambient temperature and
enthalpy duration curves, detailed mathematical
expressions were worked out to determine the heating
energy consumption of the ventilation systems and the
heating energy saved by air-to-air heat-and energy
recovery units during. The three different climate cities
are: Palermo (as Mediterranean zone), Krakow (as
temperate zone) and to Helsinki (as cold climate region).
The investigated heat recoveries that are suitable only for
heat transfer are the fixed-plate heat exchanger, the run
around coil and the heat-pipe technology. Energy
exchangers, that were also considered, allow both heat-
and moisture transfer with higher moisture transfer
effectiveness by a sorption rotor and with lower without
sorption coating. The results by the developed method
show that before the selection of the proper heat-and
energy recovery unit into an air handling unit, their
energy saved has to be investigatedconsidering also the
given climate region.
2. Method
The comparative energetic study was carried out on
the types of heat exchangers most frequently used in
practice. From among heat exchangers only capable
of heat transfer, the energy saving ability of cross-
flow plate heat exchangers, run around coil and heat
pipe heat exchangers was numerically investigated
and from among those capable of heat-, and moisture
transfer, the energy saving ability of rotary heat
exchangers with sorption (sorption wheel) and non-
sorption coating was calculated. The heat and
moisture effectiveness values typical of heat
exchangers were selected from the value range
determined by the VDI 2071 standard [18]. As heat
transfer effectiveness 0.6 for cross flow plate heat
recovery, 0.4 for run around coil heat recovery, 0.3
for heat pipe heat exchanger, 0.8 for rotary energy
recovery unit with sorption coating and also for
rotary energy recovery unit with non-sorption coating
were selected. As moisture transfer effectiveness the
value of 0.65 for rotary energy recovery unit with
sorption coating and 0.15 for rotary energy recovery
unit with non-sorption coating were selected.
During the investigation a steady air volume flow
rate was assumed to 1000 m3/h, and the air density
was assumed to constant 1,2 kg/m3. For heat recovery
systems, that are suitable only for heat transfer,
temperature controlling was considered during
calculations, which means the heat exchanger works
only when outer air temperature is higher than the
exhaust temperature delivered from the conditioned
space. In case of energy recovery systems that are
suitable for both heat-and moisture transfer, enthalpy
controlling was considered, thus energy exchanger
operates until enthalpy of ambient air decreases to the
exhaust air enthalpy value. During the research a
comparative energetic investigation was performed
for the heat-and energy recovery systems most
commonly applied in HVAC practice. Among heat
recovery technologies that transfer only heat energy,
cross flow plate heat recovery, run around coil heat
recovery and heat pipe heat exchangers were
investigated. Among energy recovery systems that
are suitable for both heat and moisture transfer rotary
energy recovery unit with sorption and non-sorption
coating were investigated. The object was to predict
the energy savings in the different cases for heating
season.
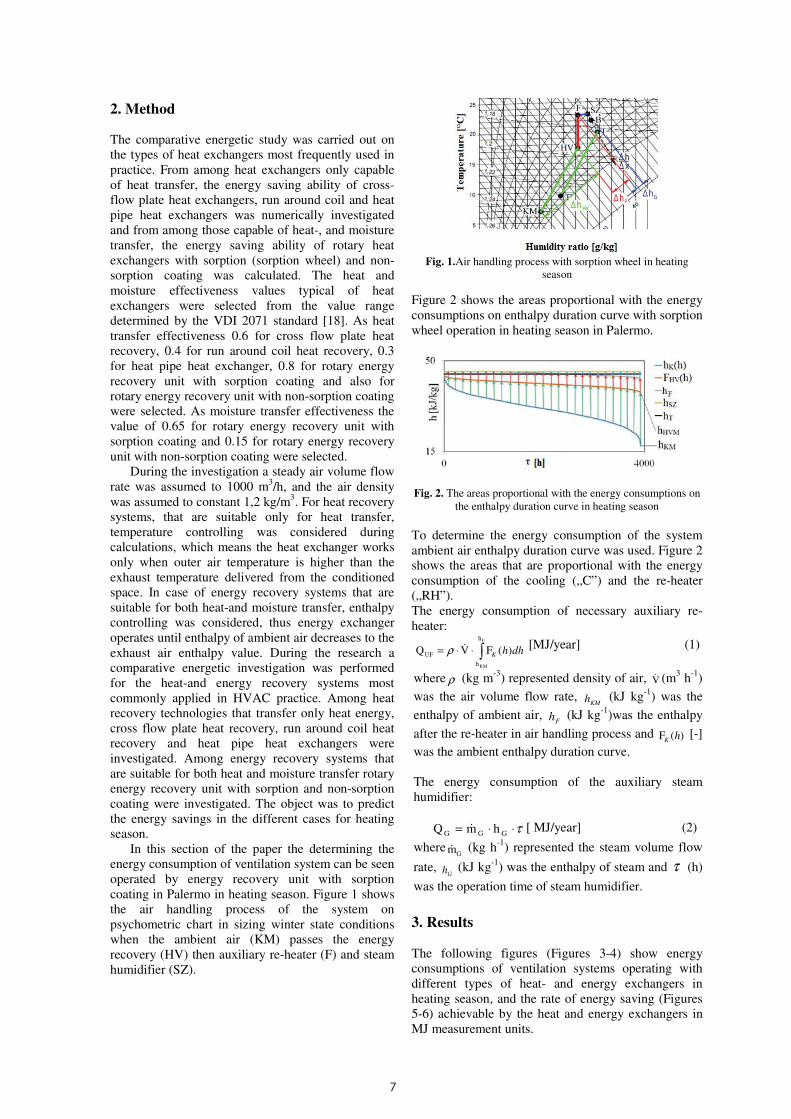
In this section of the paper the determining the
energy consumption of ventilation system can be seen
operated by energy recovery unit with sorption
coating in Palermo in heating season. Figure 1 shows
the air handling process of the system on
psychometric chart in sizing winter state conditions
when the ambient air (KM) passes the energy
recovery (HV) then auxiliary re-heater (F) and steam
humidifier (SZ).
Fig. 1.Air handling process with sorption wheel in heating
season
Figure 2 shows the areas proportional with the energy
consumptions on enthalpy duration curve with sorption
wheel operation in heating season in Palermo.
Fig. 2. The areas proportional with the energy consumptions on
the enthalpy duration curve in heating season
To determine the energy consumption of the system
ambient air enthalpy duration curve was used. Figure 2
shows the areas that are proportional with the energy
consumption of the cooling („C”) and the re-heater
(„RH”).
The energy consumption of necessary auxiliary re-
heater:
)(FVQF
KM
h
h
UF ∫⋅⋅= dhhK&ρ
[MJ/year] (1)
where ρ (kg m-3
) represented density of air, V& (m3 h
-1)
was the air volume flow rate, KMh (kJ kg
-1) was the
enthalpy of ambient air, Fh (kJ kg
-1)was the enthalpy
after the re-heater in air handling process and )(F hK [-]
was the ambient enthalpy duration curve.
The energy consumption of the auxiliary steam
humidifier:
τ⋅⋅= GGG hmQ & [ MJ/year] (2)
whereGm& (kg h
-1) represented the steam volume flow
rate, Gh (kJ kg
-1) was the enthalpy of steam and τ (h)
was the operation time of steam humidifier.
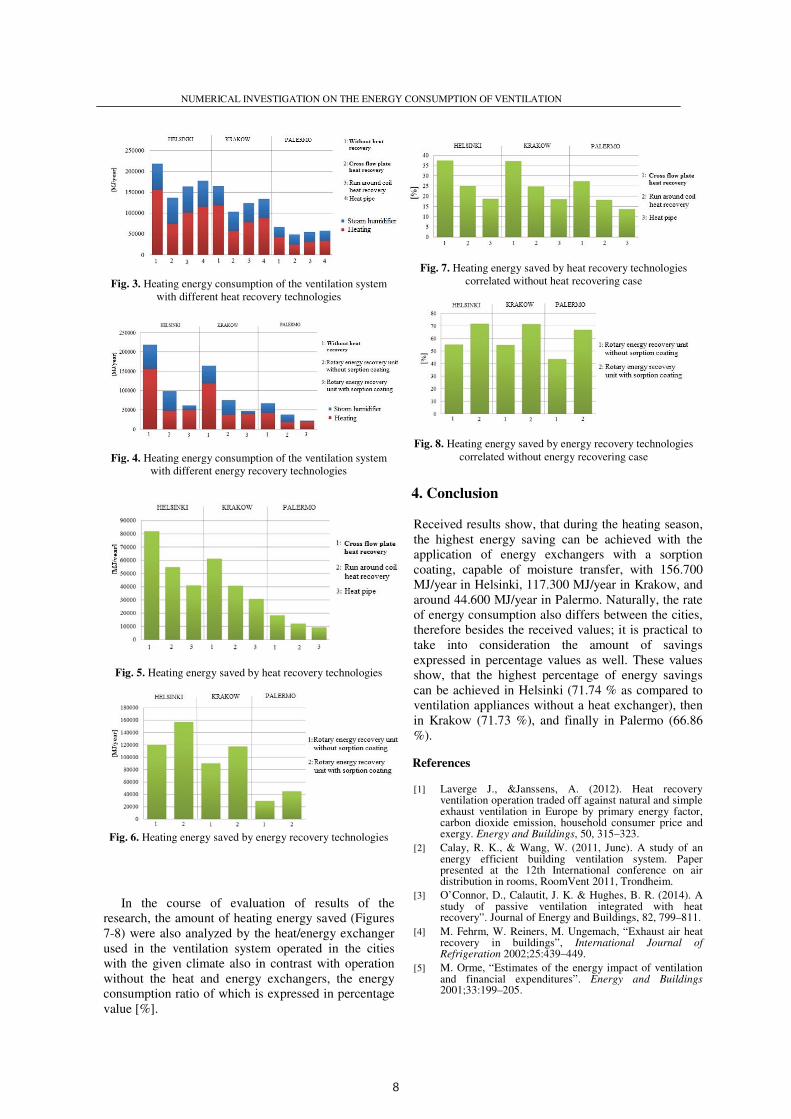
3. Results
The following figures (Figures 3-4) show energy
consumptions of ventilation systems operating with
different types of heat- and energy exchangers in
heating season, and the rate of energy saving (Figures
5-6) achievable by the heat and energy exchangers in
MJ measurement units.
7
EXPRES 2017 ISBN 978-86-919769-1-0
Numerical investigation on the energy consumption of ventilation systems
M. KASSAI a
Department of Building Service Engineering and Process, Budapest University of
Technology and Economics
H-1111 Budapest, Muegyetem rkp. 3-9., Hungary aE-mail:[email protected]
The object of this research study was to investigate the heating energy consumption of ventilation systems with five different
heat-and energy recovery units in three different weather European climates. Using the ambient temperature and enthalpy
duration curves, detailed mathematical expressions are presented to determine the energy consumption of ventilation systems
during the heating period. The three different climate cities are: Palermo (as Mediterranean zone), Krakow (as temperate zone)
and to Helsinki (as cold climate region). The investigated heat recoveries that are suitable only for heat transfer are the fixed-plate
heat exchanger, the run around coil and the heat-pipe technology. Energy exchangers allow both heat-and moisture transfer with
higher moisture transfer effectiveness by a sorption rotor and with lower without sorption coating. The effectiveness values of
heat and energy exchangers were selected based on VDI 2071 standard.
Keywords: ventilation system, energy consumption, heat recovery, numerical investigation
1. Introducn
There is more and more attention for energy
consumption reduction, achieving sustainable
development that by primary energy source (coal,
oil natural gas) saving and utilization of renewable
energy sources [1, 2]. Spread of new techniques in
building construction, low-energy and passive
houses can be seen in recent years [3]. Herewith
the number of ventilation systems used in
buildings has been also increased. The
requirements for air tightness of passive house are
much higher than in case of a traditional house [4].
Due to the increasing indoor air quality
(IAQ) standard, the ventilation loads represent
about 20–50% part of the total heating demand for
new and retrofitted buildings [5,6,7,8,9,10,11],
depending on the building’s insulation,
compactness, air change rate, indoor heat sources,
indoor set points and outdoor climate. Therefore,
there is a need for residential buildings and their
systems to provide a comfortable and acceptable
indoor environment. The usage of mechanical
ventilation system equipped with an air-to-air
recovery heat-and energy exchanger is a solution
to ensure a high global energy performance of the
building and reach the requirements in terms of
IAQ [12]. In these systems, indoor air extracted
from the building is used to pre-heat (in winter) or
pre-cool (in summer) the fresh air flow rate
coming from the outdoor environment. While such
exchangers [13,14] have been on the market for
many years, only a few modeling works are
presented in technical and scientific literature.
Only the parameters having an impact on the
energy performance of heat recovery ventilation
have been investigated deeper in the last years.
Mardiana and Riffat [15] list physical
characteristics ofthe main components: heat
exchanger and fans that influence the efficiency of heat
or energy recovery. Roulet et al. [16] discuss the effect of
leakages and shortcuts on heat recovery unit and show
that the conventional methods to determine the heat
recovery efficiency are not sufficient to outline the global
performance of ventilation systems; and propose a
method based on the specific net energy savings to
characterize the energy performance. Manz et al. [17]
investigate the same effect on a single room ventilation
system and define a heat recovery efficiency based on
heating load reduction. Based on the above mentioned
facts it is easy to see that the calculation of energy
consumption and energy saved of ventilation systems is a
complex design problem requiring many pieces of
information.
The object of this research study was to investigate
the heating energy saved of five different constructed air-
to-air heat-and energy exchangers in three in different
weather European. Using the ambient temperature and
enthalpy duration curves, detailed mathematical
expressions were worked out to determine the heating
energy consumption of the ventilation systems and the
heating energy saved by air-to-air heat-and energy
recovery units during. The three different climate cities
are: Palermo (as Mediterranean zone), Krakow (as
temperate zone) and to Helsinki (as cold climate region).
The investigated heat recoveries that are suitable only for
heat transfer are the fixed-plate heat exchanger, the run
around coil and the heat-pipe technology. Energy
exchangers, that were also considered, allow both heat-
and moisture transfer with higher moisture transfer
effectiveness by a sorption rotor and with lower without
sorption coating. The results by the developed method
show that before the selection of the proper heat-and
energy recovery unit into an air handling unit, their
energy saved has to be investigatedconsidering also the
given climate region.
2. Method
The comparative energetic study was carried out on
the types of heat exchangers most frequently used in
practice. From among heat exchangers only capable
of heat transfer, the energy saving ability of cross-
flow plate heat exchangers, run around coil and heat
pipe heat exchangers was numerically investigated
and from among those capable of heat-, and moisture
transfer, the energy saving ability of rotary heat
exchangers with sorption (sorption wheel) and non-
sorption coating was calculated. The heat and
moisture effectiveness values typical of heat
exchangers were selected from the value range
determined by the VDI 2071 standard [18]. As heat
transfer effectiveness 0.6 for cross flow plate heat
recovery, 0.4 for run around coil heat recovery, 0.3
for heat pipe heat exchanger, 0.8 for rotary energy
recovery unit with sorption coating and also for
rotary energy recovery unit with non-sorption coating
were selected. As moisture transfer effectiveness the
value of 0.65 for rotary energy recovery unit with
sorption coating and 0.15 for rotary energy recovery
unit with non-sorption coating were selected.
During the investigation a steady air volume flow
rate was assumed to 1000 m3/h, and the air density
was assumed to constant 1,2 kg/m3. For heat recovery
systems, that are suitable only for heat transfer,
temperature controlling was considered during
calculations, which means the heat exchanger works
only when outer air temperature is higher than the
exhaust temperature delivered from the conditioned
space. In case of energy recovery systems that are
suitable for both heat-and moisture transfer, enthalpy
controlling was considered, thus energy exchanger
operates until enthalpy of ambient air decreases to the
exhaust air enthalpy value. During the research a
comparative energetic investigation was performed
for the heat-and energy recovery systems most
commonly applied in HVAC practice. Among heat
recovery technologies that transfer only heat energy,
cross flow plate heat recovery, run around coil heat
recovery and heat pipe heat exchangers were
investigated. Among energy recovery systems that
are suitable for both heat and moisture transfer rotary
energy recovery unit with sorption and non-sorption
coating were investigated. The object was to predict
the energy savings in the different cases for heating
season.
In this section of the paper the determining the
energy consumption of ventilation system can be seen
operated by energy recovery unit with sorption
coating in Palermo in heating season. Figure 1 shows
the air handling process of the system on
psychometric chart in sizing winter state conditions
when the ambient air (KM) passes the energy
recovery (HV) then auxiliary re-heater (F) and steam
humidifier (SZ).
Fig. 1.Air handling process with sorption wheel in heating
season
Figure 2 shows the areas proportional with the energy
consumptions on enthalpy duration curve with sorption
wheel operation in heating season in Palermo.
Fig. 2. The areas proportional with the energy consumptions on
the enthalpy duration curve in heating season
To determine the energy consumption of the system
ambient air enthalpy duration curve was used. Figure 2
shows the areas that are proportional with the energy
consumption of the cooling („C”) and the re-heater
(„RH”).
The energy consumption of necessary auxiliary re-
heater:
)(FVQF
KM
h
h
UF ∫⋅⋅= dhhK&ρ
[MJ/year] (1)
where ρ (kg m-3
) represented density of air, V& (m3 h
-1)
was the air volume flow rate, KMh (kJ kg
-1) was the
enthalpy of ambient air, Fh (kJ kg
-1)was the enthalpy
after the re-heater in air handling process and )(F hK [-]
was the ambient enthalpy duration curve.
The energy consumption of the auxiliary steam
humidifier:
τ⋅⋅= GGG hmQ & [ MJ/year] (2)
whereGm& (kg h
-1) represented the steam volume flow
rate, Gh (kJ kg
-1) was the enthalpy of steam and τ (h)
was the operation time of steam humidifier.
3. Results
The following figures (Figures 3-4) show energy
consumptions of ventilation systems operating with
different types of heat- and energy exchangers in
heating season, and the rate of energy saving (Figures
5-6) achievable by the heat and energy exchangers in
MJ measurement units.
8
NUMERICAL INVESTIGATION ON THE ENERGY CONSUMPTION OF VENTILATION
SYSTEMS
3
Fig. 3. Heating energy consumption of the ventilation system
with different heat recovery technologies
Fig. 4. Heating energy consumption of the ventilation system
with different energy recovery technologies
Fig. 5. Heating energy saved by heat recovery technologies
Fig. 6. Heating energy saved by energy recovery technologies
In the course of evaluation of results of the
research, the amount of heating energy saved (Figures
7-8) were also analyzed by the heat/energy exchanger
used in the ventilation system operated in the cities
with the given climate also in contrast with operation
without the heat and energy exchangers, the energy
consumption ratio of which is expressed in percentage
value [%].
Fig. 7. Heating energy saved by heat recovery technologies
correlated without heat recovering case
Fig. 8. Heating energy saved by energy recovery technologies
correlated without energy recovering case
4. Conclusion
Received results show, that during the heating season,
the highest energy saving can be achieved with the
application of energy exchangers with a sorption
coating, capable of moisture transfer, with 156.700
MJ/year in Helsinki, 117.300 MJ/year in Krakow, and
around 44.600 MJ/year in Palermo. Naturally, the rate
of energy consumption also differs between the cities,
therefore besides the received values; it is practical to
take into consideration the amount of savings
expressed in percentage values as well. These values
show, that the highest percentage of energy savings
can be achieved in Helsinki (71.74 % as compared to
ventilation appliances without a heat exchanger), then
in Krakow (71.73 %), and finally in Palermo (66.86
%).
References
[1] Laverge J., &Janssens, A. (2012). Heat recovery ventilation operation traded off against natural and simple exhaust ventilation in Europe by primary energy factor, carbon dioxide emission, household consumer price and exergy. Energy and Buildings, 50, 315–323.
[2] Calay, R. K., & Wang, W. (2011, June). A study of an energy efficient building ventilation system. Paper presented at the 12th International conference on air distribution in rooms, RoomVent 2011, Trondheim.
[3] O’Connor, D., Calautit, J. K. & Hughes, B. R. (2014). A study of passive ventilation integrated with heat recovery”. Journal of Energy and Buildings, 82, 799–811.
[4] M. Fehrm, W. Reiners, M. Ungemach, “Exhaust air heat recovery in buildings”, International Journal of Refrigeration 2002;25:439–449.
[5] M. Orme, “Estimates of the energy impact of ventilation and financial expenditures”. Energy and Buildings 2001;33:199–205.
NUMERICAL INVESTIGATION ON THE ENERGY CONSUMPTION OF VENTILATION SYSTEMS
4
[6] R.M. Lazzarin, A. Gasparella, “Technical and economical analysis of heat recovery in building ventilation systems”. Applied Thermal Engineering 1998;18:47–67.
[7] A. Dodoo, L. Gustavsson, R. Sathre, “Primary energy implications of ventilation heat recovery in residential buildings”, Energy and Buildings 2011;43:1566–1572.
[8] J. Nyers, L. Kajtar .S. Tomic, A. Nyers, “Investment-savings method for energy-economic optimization of external wall thermal insulation thickness.” Energy and Buildings, 2015;86:268-274.
[9] L. Kajtar, J. Nyers, J. Szabo, “Dynamic thermal dimensioning of underground spaces” Energy 2015;87:361–368.
[10] R.K. Calay, B.A. Borresen, A.E. Holdø, “Selective ventilation in large enclosures”. Energy and Buildings, vol. 2000;32:281–289.
[11] R.K. Calay, WC. Wang, “A study of an energy efficient building ventilation system”, RoomVent 2011 - 12th International conference on air distribution in rooms, Trondheim, Juny 19-22, pp. 1-8. 2011.
[12] C. Cristiana, N. Ilinca, B. Florin, M. Amina, D. Angel, “Thermal comfort models for indoor spaces and vehicles - Current capabilities and future perspectives”. Renewable and Sustainable Energy Reviews. 2015;44:304–318.
[13] T. Poos, V. Szabo, “Equations of volumetric heat transfer coefficients and mathematical models at rotary drum dryers”, Eurodrying'2015: 5th European Drying Conference. Budapest, October 21-23. 2015:322-328.
[14] T. Poos, E. Varju, “Determination of evaporation rate at free water surface. 8th International Symposium on Exploitation of Renewable Energy Resources”, Subotica, Serbia, 2016.03.31-04.02., 66-71.
[15] A. Mardiana, S.B. Riffat, “Review on physical and performance parameters ofheat recovery systems for building applications”. Renewable Sustainable Energy Rev. 2013;28:174–190.
[16] C.A. Roulet, F.D. Heidt, F. Foradini, M.C. Pibiri, “Real heat recovery with air handling units”, Energy and Buildings 2001;33:495–502.
[17] Manz, H., Huber, H. &Helfenfinger, D. (2001). Impact of air leakages and short circuits in ventilation units with heat recovery on ventilation efficiency and energy requirements for heating. Journal of Energy and Buildings, 33, 133–139.
[18] VereinDeutscherIngenieure. (1997). Heat recovery in heating, ventilation and air conditioning plants, VDI 2071-Richtlinien, Düsseldorf

9
NUMERICAL INVESTIGATION ON THE ENERGY CONSUMPTION OF VENTILATION
SYSTEMS
3
Fig. 3. Heating energy consumption of the ventilation system
with different heat recovery technologies
Fig. 4. Heating energy consumption of the ventilation system
with different energy recovery technologies
Fig. 5. Heating energy saved by heat recovery technologies
Fig. 6. Heating energy saved by energy recovery technologies
In the course of evaluation of results of the
research, the amount of heating energy saved (Figures
7-8) were also analyzed by the heat/energy exchanger
used in the ventilation system operated in the cities
with the given climate also in contrast with operation
without the heat and energy exchangers, the energy
consumption ratio of which is expressed in percentage
value [%].
Fig. 7. Heating energy saved by heat recovery technologies
correlated without heat recovering case
Fig. 8. Heating energy saved by energy recovery technologies
correlated without energy recovering case
4. Conclusion
Received results show, that during the heating season,
the highest energy saving can be achieved with the
application of energy exchangers with a sorption
coating, capable of moisture transfer, with 156.700
MJ/year in Helsinki, 117.300 MJ/year in Krakow, and
around 44.600 MJ/year in Palermo. Naturally, the rate
of energy consumption also differs between the cities,
therefore besides the received values; it is practical to
take into consideration the amount of savings
expressed in percentage values as well. These values
show, that the highest percentage of energy savings
can be achieved in Helsinki (71.74 % as compared to
ventilation appliances without a heat exchanger), then
in Krakow (71.73 %), and finally in Palermo (66.86
%).
References
[1] Laverge J., &Janssens, A. (2012). Heat recovery ventilation operation traded off against natural and simple exhaust ventilation in Europe by primary energy factor, carbon dioxide emission, household consumer price and exergy. Energy and Buildings, 50, 315–323.
[2] Calay, R. K., & Wang, W. (2011, June). A study of an energy efficient building ventilation system. Paper presented at the 12th International conference on air distribution in rooms, RoomVent 2011, Trondheim.
[3] O’Connor, D., Calautit, J. K. & Hughes, B. R. (2014). A study of passive ventilation integrated with heat recovery”. Journal of Energy and Buildings, 82, 799–811.
[4] M. Fehrm, W. Reiners, M. Ungemach, “Exhaust air heat recovery in buildings”, International Journal of Refrigeration 2002;25:439–449.
[5] M. Orme, “Estimates of the energy impact of ventilation and financial expenditures”. Energy and Buildings 2001;33:199–205.
NUMERICAL INVESTIGATION ON THE ENERGY CONSUMPTION OF VENTILATION SYSTEMS
4
[6] R.M. Lazzarin, A. Gasparella, “Technical and economical analysis of heat recovery in building ventilation systems”. Applied Thermal Engineering 1998;18:47–67.
[7] A. Dodoo, L. Gustavsson, R. Sathre, “Primary energy implications of ventilation heat recovery in residential buildings”, Energy and Buildings 2011;43:1566–1572.
[8] J. Nyers, L. Kajtar .S. Tomic, A. Nyers, “Investment-savings method for energy-economic optimization of external wall thermal insulation thickness.” Energy and Buildings, 2015;86:268-274.
[9] L. Kajtar, J. Nyers, J. Szabo, “Dynamic thermal dimensioning of underground spaces” Energy 2015;87:361–368.
[10] R.K. Calay, B.A. Borresen, A.E. Holdø, “Selective ventilation in large enclosures”. Energy and Buildings, vol. 2000;32:281–289.
[11] R.K. Calay, WC. Wang, “A study of an energy efficient building ventilation system”, RoomVent 2011 - 12th International conference on air distribution in rooms, Trondheim, Juny 19-22, pp. 1-8. 2011.
[12] C. Cristiana, N. Ilinca, B. Florin, M. Amina, D. Angel, “Thermal comfort models for indoor spaces and vehicles - Current capabilities and future perspectives”. Renewable and Sustainable Energy Reviews. 2015;44:304–318.
[13] T. Poos, V. Szabo, “Equations of volumetric heat transfer coefficients and mathematical models at rotary drum dryers”, Eurodrying'2015: 5th European Drying Conference. Budapest, October 21-23. 2015:322-328.
[14] T. Poos, E. Varju, “Determination of evaporation rate at free water surface. 8th International Symposium on Exploitation of Renewable Energy Resources”, Subotica, Serbia, 2016.03.31-04.02., 66-71.
[15] A. Mardiana, S.B. Riffat, “Review on physical and performance parameters ofheat recovery systems for building applications”. Renewable Sustainable Energy Rev. 2013;28:174–190.
[16] C.A. Roulet, F.D. Heidt, F. Foradini, M.C. Pibiri, “Real heat recovery with air handling units”, Energy and Buildings 2001;33:495–502.
[17] Manz, H., Huber, H. &Helfenfinger, D. (2001). Impact of air leakages and short circuits in ventilation units with heat recovery on ventilation efficiency and energy requirements for heating. Journal of Energy and Buildings, 33, 133–139.
[18] VereinDeutscherIngenieure. (1997). Heat recovery in heating, ventilation and air conditioning plants, VDI 2071-Richtlinien, Düsseldorf
10
EXPRES 2017 ISBN 978-86-919769-1-0
Simulation resultats of the heat pump evaporator by means
the steady-state lumped parameter mathematical model
J. NYERS
A, Z. PEK
b
a,b Doctoral School of Applied Informatics and Applied Mathematics, Obuda University,
1034 Budapest, Bécsi út 96/B, Hungary aDoctoral School of Mechanical Engineering, Szent István University,
2100 Gödöllő, Páter Károly utca 1, Hungary aE-mail:[email protected] bE-mail:[email protected]
The primary objective of the paper is to present the heat pump evaporator's steady-state lumped parameter mathematical model and
apply the model to investigate the thermal behavior of the evaporator. In fact, the ultimate objective is, and the model has been
designed in this sense, the model has to be part of the mathematical model of heat pump heating system. The evaporator's model is
composed of the superheated and evaporation sections. In the model the basic equations are the energy conservation balance
equations, the auxiliary equations are the logarithmic or arithmetic temperature differences, heat transfer coefficients and the overall
heat transfer coefficients. The mentioned equations are algebraic, coupled, nonlinear and with many variables. The solution of the
equation system can be only obtained using iterative numerical procedure. The numerically obtained results are arranged in the
vector or matrix format and presented in 2D graphics. In the case study, we investigated the heat flow behavior in the evaporator as a
function of the well water- and the refrigerant mass flow rate.
Keywords: heat pump evaporator, steady-state mathematical model, lumped parameters
1. Introduction
The lumped parameter mathematical model is only
suitable for the analytical energy optimization of the
heat pump heating system. This statement applies to all
components of the heat pump, including both heat
exchangers, evaporator and condenser as well. The
model is solvable numerically [1].
In this case tested evaporator is chevron plate heat
exchanger. The plates in the exchanger are thin, their
thickness is O.3-O.5 mm and are made of the
Prochrom plates. In the plates the chevrons are of the
60° pressed and in the chevron's perpendicular cross
section the plates have the sinuous shape.The prochrom
plates are brazed with copper [2].
In the plate evaporator on the one side is the
refrigerant while on the other side the well water in the
co-current or countercurrent manner flows. Between
the flowing mediums the heat transfers by convection
and conduction through the plate wall. In deed, the
heat from the warmer well water transfers to the
refrigerant.
In the heat exchanger two processes take place:
evaporation and superheating. From the aspect of the
heat transfer the evaporation is dominant because
almost 95-96% of the heat is transferred in this manner.
The superheating is necessary evil but justifiable
because of the safety operation of the compressor.
The evaporation in opposite of the condensation is
not a self regulated process, but requires
regulation.The process is regulated by thermal
expansion valve. The valve regulates the amount of the
refrigerant mass flow and thereby the evaporating
pressure and temperature as well. The aim of the
regulation is, the evaporation temperature should be at
a low level and the temperature increasing of the
superheated vapour which is flowing out of the
evaporator keeps the referent set value. In practice, the
optimum value of the superheated vapour's
temperature increasing is 4°C [3].
The primary objective of the paper is, to present the
steady-state lumped parameter mathematical model of
the heat pump evaporator and applying the model we
investigated the evaporator's thermal behavior. The
ultimate objective is that the model has to be part of the
mathematical model of heat pump heating system.
Since the ultimate objective is optimization, so the
model is steady-state, namely the model of the heating
system is designed for steady state operation mode.
The analytical optimization requires a lumped
parameter model.
The evaporator's mathematical model consists of
two parts of the superheating and the evaporation
section. The basic equations in the model are the
energy conservation balance equations, the auxiliary
equations are the logarithmic or arithmetic temperature
differences, heat transfer coefficients and the overall
heat transfer coefficients. The listed equations are
algebraic, coupled, non-linear and with many
variables. The solution of the equation system is only
possible using iterative numerical procedure. The
numerically obtained results are arranged in the vector
or matrix format and presented in 2D graphics.
EXPRES 2017 ISBN 978-86-919769-1-0
In the case study, we investigated the heat flow
behavior in the evaporator and the latent heat both as a
function of the well water- and the refrigerant mass
flow rate.
2. The physical model of evaporator
Fig. 1. Shema of heat pump evaporator
3. The basic mathematical model of the
evaporator
Introduction
The steady-state lumped parameter mathematical
model is created on the basis of the energy conservation
and comprises the evaporation and superheat sections.
Both section's thermal behavior describe the three heat
flow balance equations. The equations include
dependent and independent variables.
The independent selected variables of the
evaporator
• Inlet temperature of the refrigerant liquid-vapour
mixture
• Inlet temperature of the well water
• Mass flow rate of the well water
• Mass flow rate of the refrigerant liquid-vapour mixture
• Heat transfer surface area of the evaporator
• Vapour quality
The dependent variables to elimination
The evaporation section
1. The saturated vapour temperature of the evaporating
section
2. The well water temperature at the end of the
evaporation section
3. Heat flow in the evaporation section
4. Heat transfer surface area of the evaporation section
The vapour superheating section
5. Superheated vapour temperature at the end of the
superheating section
6. Well water outlet temperature at the end of the
superheating section
7. Heat flow in the vapour superheating section
8. Heat transfer surface area of the vapour superheating
section
In addition
• saturated vapour inlet temperature at the superheating
section is equal to the evaporation temperature
• well water inlet temperature at the superheating
section is equal to the well water outlet temperature at
the end of the evaporation section.
The governing equations of the evaporation section
The heat flow from well water to the evaporating
refrigerant
= ∙ ∙ ∆ (1)
The heat flow between the two fluids through the
wall of the heat exchanger
= ∙ ∙ ∆, (2)
The heat flux absorbed by the refrigerant fluid +
vapour phase for evaporation
= ∙ ∆, ∙ (1 − ) (3)
The governing equations of superheating section.
The heat flux from the well water to the refrigerant
vapour
= ∙ ∙ ∆ (4)
The heat flow between the two fluids through the
wall of the heat exchanger
= ∙ ∙ ∆, (5)
The heat flux absorbed by the refrigerant vapour
for superheating
= , ∙ ∙ ∆ (6)
The superheatied temperature different
∆ ≅ 4℃ − variable constant (7)
All heat flow tranfered in the evaporator. = + (8)
The heat flow transfered by the well water to the
refrigerant
= ∙ ∙ (, − , )
The all heat flux absorbed by the refrigerant
= ∙ ∆, + , ∙ ∙ ∆= ∙ ∆, + ∆
(9)
All active surface area of the evaporator. Evaporation
and the superheating section surface.
= + (10)

11
EXPRES 2017 ISBN 978-86-919769-1-0
Simulation resultats of the heat pump evaporator by means
the steady-state lumped parameter mathematical model
J. NYERS
A, Z. PEK
b
a,b Doctoral School of Applied Informatics and Applied Mathematics, Obuda University,
1034 Budapest, Bécsi út 96/B, Hungary aDoctoral School of Mechanical Engineering, Szent István University,
2100 Gödöllő, Páter Károly utca 1, Hungary aE-mail:[email protected] bE-mail:[email protected]
The primary objective of the paper is to present the heat pump evaporator's steady-state lumped parameter mathematical model and
apply the model to investigate the thermal behavior of the evaporator. In fact, the ultimate objective is, and the model has been
designed in this sense, the model has to be part of the mathematical model of heat pump heating system. The evaporator's model is
composed of the superheated and evaporation sections. In the model the basic equations are the energy conservation balance
equations, the auxiliary equations are the logarithmic or arithmetic temperature differences, heat transfer coefficients and the overall
heat transfer coefficients. The mentioned equations are algebraic, coupled, nonlinear and with many variables. The solution of the
equation system can be only obtained using iterative numerical procedure. The numerically obtained results are arranged in the
vector or matrix format and presented in 2D graphics. In the case study, we investigated the heat flow behavior in the evaporator as a
function of the well water- and the refrigerant mass flow rate.
Keywords: heat pump evaporator, steady-state mathematical model, lumped parameters
1. Introduction
The lumped parameter mathematical model is only
suitable for the analytical energy optimization of the
heat pump heating system. This statement applies to all
components of the heat pump, including both heat
exchangers, evaporator and condenser as well. The
model is solvable numerically [1].
In this case tested evaporator is chevron plate heat
exchanger. The plates in the exchanger are thin, their
thickness is O.3-O.5 mm and are made of the
Prochrom plates. In the plates the chevrons are of the
60° pressed and in the chevron's perpendicular cross
section the plates have the sinuous shape.The prochrom
plates are brazed with copper [2].
In the plate evaporator on the one side is the
refrigerant while on the other side the well water in the
co-current or countercurrent manner flows. Between
the flowing mediums the heat transfers by convection
and conduction through the plate wall. In deed, the
heat from the warmer well water transfers to the
refrigerant.
In the heat exchanger two processes take place:
evaporation and superheating. From the aspect of the
heat transfer the evaporation is dominant because
almost 95-96% of the heat is transferred in this manner.
The superheating is necessary evil but justifiable
because of the safety operation of the compressor.
The evaporation in opposite of the condensation is
not a self regulated process, but requires
regulation.The process is regulated by thermal
expansion valve. The valve regulates the amount of the
refrigerant mass flow and thereby the evaporating
pressure and temperature as well. The aim of the
regulation is, the evaporation temperature should be at
a low level and the temperature increasing of the
superheated vapour which is flowing out of the
evaporator keeps the referent set value. In practice, the
optimum value of the superheated vapour's
temperature increasing is 4°C [3].
The primary objective of the paper is, to present the
steady-state lumped parameter mathematical model of
the heat pump evaporator and applying the model we
investigated the evaporator's thermal behavior. The
ultimate objective is that the model has to be part of the
mathematical model of heat pump heating system.
Since the ultimate objective is optimization, so the
model is steady-state, namely the model of the heating
system is designed for steady state operation mode.
The analytical optimization requires a lumped
parameter model.
The evaporator's mathematical model consists of
two parts of the superheating and the evaporation
section. The basic equations in the model are the
energy conservation balance equations, the auxiliary
equations are the logarithmic or arithmetic temperature
differences, heat transfer coefficients and the overall
heat transfer coefficients. The listed equations are
algebraic, coupled, non-linear and with many
variables. The solution of the equation system is only
possible using iterative numerical procedure. The
numerically obtained results are arranged in the vector
or matrix format and presented in 2D graphics.
EXPRES 2017 ISBN 978-86-919769-1-0
In the case study, we investigated the heat flow
behavior in the evaporator and the latent heat both as a
function of the well water- and the refrigerant mass
flow rate.
2. The physical model of evaporator
Fig. 1. Shema of heat pump evaporator
3. The basic mathematical model of the
evaporator
Introduction
The steady-state lumped parameter mathematical
model is created on the basis of the energy conservation
and comprises the evaporation and superheat sections.
Both section's thermal behavior describe the three heat
flow balance equations. The equations include
dependent and independent variables.
The independent selected variables of the
evaporator
• Inlet temperature of the refrigerant liquid-vapour
mixture
• Inlet temperature of the well water
• Mass flow rate of the well water
• Mass flow rate of the refrigerant liquid-vapour mixture
• Heat transfer surface area of the evaporator
• Vapour quality
The dependent variables to elimination
The evaporation section
1. The saturated vapour temperature of the evaporating
section
2. The well water temperature at the end of the
evaporation section
3. Heat flow in the evaporation section
4. Heat transfer surface area of the evaporation section
The vapour superheating section
5. Superheated vapour temperature at the end of the
superheating section
6. Well water outlet temperature at the end of the
superheating section
7. Heat flow in the vapour superheating section
8. Heat transfer surface area of the vapour superheating
section
In addition
• saturated vapour inlet temperature at the superheating
section is equal to the evaporation temperature
• well water inlet temperature at the superheating
section is equal to the well water outlet temperature at
the end of the evaporation section.
The governing equations of the evaporation section
The heat flow from well water to the evaporating
refrigerant
= ∙ ∙ ∆ (1)
The heat flow between the two fluids through the
wall of the heat exchanger
= ∙ ∙ ∆, (2)
The heat flux absorbed by the refrigerant fluid +
vapour phase for evaporation
= ∙ ∆, ∙ (1 − ) (3)
The governing equations of superheating section.
The heat flux from the well water to the refrigerant
vapour
= ∙ ∙ ∆ (4)
The heat flow between the two fluids through the
wall of the heat exchanger
= ∙ ∙ ∆, (5)
The heat flux absorbed by the refrigerant vapour
for superheating
= , ∙ ∙ ∆ (6)
The superheatied temperature different
∆ ≅ 4℃ − variable constant (7)
All heat flow tranfered in the evaporator. = + (8)
The heat flow transfered by the well water to the
refrigerant
= ∙ ∙ (, − , )
The all heat flux absorbed by the refrigerant
= ∙ ∆, + , ∙ ∙ ∆= ∙ ∆, + ∆
(9)
All active surface area of the evaporator. Evaporation
and the superheating section surface.
= + (10)
12
EXPRES 2017 ISBN 978-86-919769-1-0
4. Auxiliary equations
The heat flow in the evaporation section
The heat flux in evaporation section equal to the
specific latent heat of evaporation.
The latent heat of evaporation expressed by an
exponential function depending on the evaporation
temperature.
∆, = + ∙ + ∙
(11)
Parameters for the refrigerant R 134a:
= 200.5965715; = −0.709168; =−0.00596796.
The arithmetic and logarithmic temperature
difference
The general form of the logarithmic temperature
difference for the evaporation and superheating
section.
∆,,, = ∆ − ∆(∆ ∕ ∆) (12)
The general form of the arithmetic temperature
difference.
∆,,, ≅ ∆,, + ∆,,2 (13)
Since the evaporation occurs at a near constant
temperature and the superheating section the
temperature decreasing only 4 oC, therefore in the both
section by a negligible difference the logarithmic
temperature difference substitutable with arithmetic.
Temperature differences in evaporation section
The co-current flow
The maximal temperature difference between the
evaporation and the well water temperature.
∆ = − (14)
The the minimul temperature difference between
the evaporation and the well water temperature.
∆ = − (15)
The well water temperature difference between inlet
and outlet at the evaporation section
∆, = − (16)
Temperature differences in vapor superheating
sections
The superheated vapor temperature is same as the
evaporation temperature.
= (17)
The co-current flow.
The maximal temperature difference between the
vapor and the well water input temperature.
∆ = − (18)
The minimal temperature difference between the
vapor and the well water output temperature.
∆ = − (19)
The well water temperature difference between inlet
and outlet at the superheating section
∆ = − (20)
The refrigerant temperature difference between inlet
and outlet at the superheating section
∆ = − (21)
The overall heat transfer coefficients
The plate evaporator can be approximately
considered as a smoot-wall exchager, so the heat
transfer coefficient in both section, in the evaporation
and the superheating section, can be calculated by the
following relationship.
, = 1
+ ∑
+ ,
(22)
Since the wall thickness of the plate evaporator is
only 0.3-0.5 mm, so the heat resistance of the wall
insignificant that is Σδ / λ ≅0. After neglect the
expression of the heat transfer coefficient is:
, ≅ ∙ , + ,
(23)
5. A mathematical procedure
The mathematical model is composed of a non-
linear, multivariable, coupled and large number
algebraic equations. Since the model is so complex the solution can be
obtained by means a numerical iterative procedure.
The Matlab software package has been applied to this
purpose.
6. Case study
The evaporator's heat flux behavior is ivestigated as a
function of the well water and refigerant mass flow
rate using the mathematical model and the iterative
numerical procedure. The known input data.
• Vapour quality, x = 0.25,
• The well water inlet temperature., twi = 14OC -
• The mass flow of the well water., ṁw = 0.3, 0.4, 0.5,
0.6, 0.7, 0.8, 0.9, 1, 1.1, 1.2 kg/s,
• The refrigerant mass flow rate., ṁf = 0.03, 0.04,
0.05;0.06;0.07;0.08;0.09;0.1;0.11;0.12 kg/s,
• The size of the evaporator heat transfer surface. F = 2
m2.
EXPRES 2017 ISBN 978-86-919769-1-0
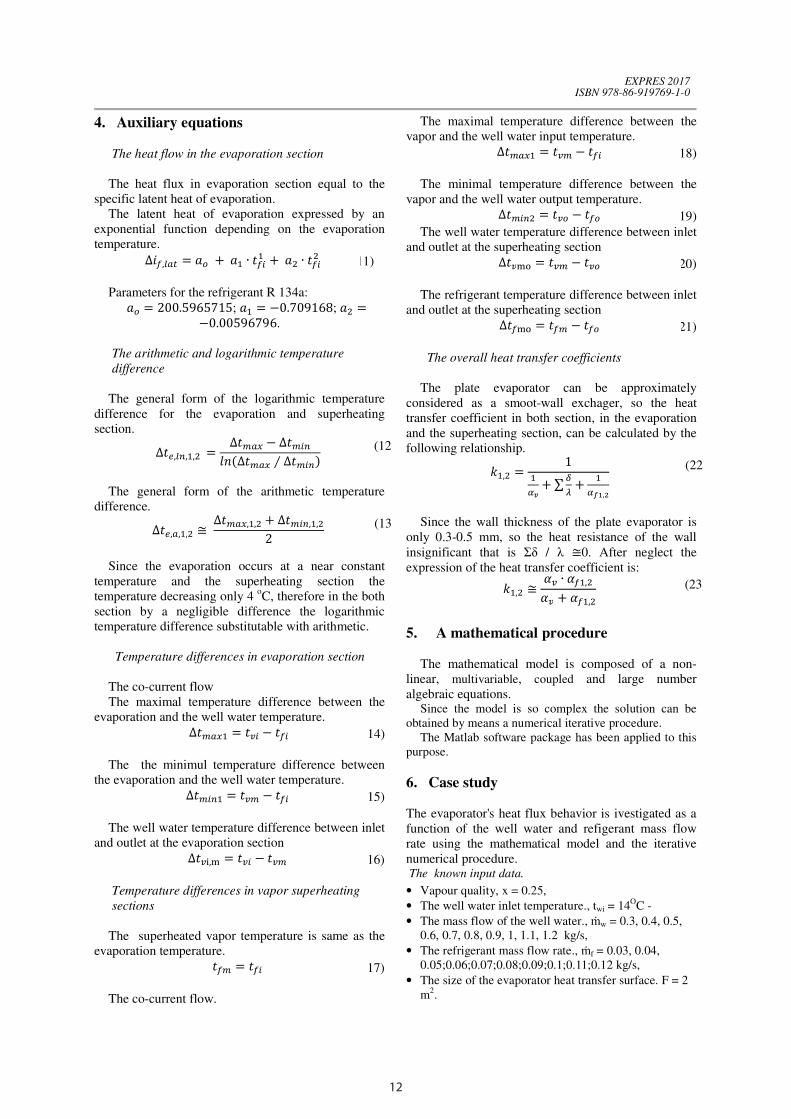
7. The simulation results and discussion
Based on the results of numerical simulations we
can conclude that:
• The heat flux in the evaporation section varies near
linearly depending on the mass flow rates.
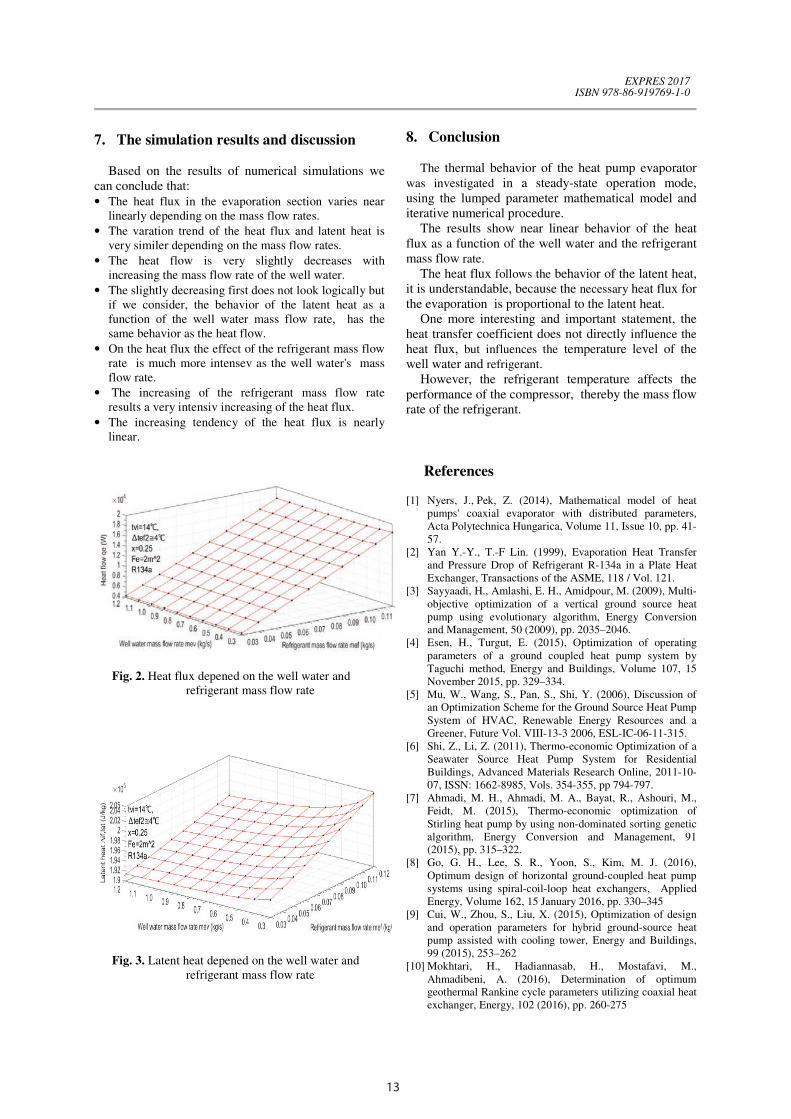
• The varation trend of the heat flux and latent heat is
very similer depending on the mass flow rates.
• The heat flow is very slightly decreases with
increasing the mass flow rate of the well water.
• The slightly decreasing first does not look logically but
if we consider, the behavior of the latent heat as a
function of the well water mass flow rate, has the
same behavior as the heat flow.
• On the heat flux the effect of the refrigerant mass flow
rate is much more intensev as the well water's mass
flow rate.
• The increasing of the refrigerant mass flow rate
results a very intensiv increasing of the heat flux.
• The increasing tendency of the heat flux is nearly
linear.
Fig. 2. Heat flux depened on the well water and
refrigerant mass flow rate
Fig. 3. Latent heat depened on the well water and
refrigerant mass flow rate
8. Conclusion
The thermal behavior of the heat pump evaporator
was investigated in a steady-state operation mode,
using the lumped parameter mathematical model and
iterative numerical procedure.
The results show near linear behavior of the heat
flux as a function of the well water and the refrigerant
mass flow rate.
The heat flux follows the behavior of the latent heat,
it is understandable, because the necessary heat flux for
the evaporation is proportional to the latent heat.
One more interesting and important statement, the
heat transfer coefficient does not directly influence the
heat flux, but influences the temperature level of the
well water and refrigerant.
However, the refrigerant temperature affects the
performance of the compressor, thereby the mass flow
rate of the refrigerant.
References
[1] Nyers, J., Pek, Z. (2014), Mathematical model of heat
pumps' coaxial evaporator with distributed parameters,
Acta Polytechnica Hungarica, Volume 11, Issue 10, pp. 41-
57.
[2] Yan Y.-Y., T.-F Lin. (1999), Evaporation Heat Transfer
and Pressure Drop of Refrigerant R-134a in a Plate Heat
Exchanger, Transactions of the ASME, 118 / Vol. 121.
[3] Sayyaadi, H., Amlashi, E. H., Amidpour, M. (2009), Multi-
objective optimization of a vertical ground source heat
pump using evolutionary algorithm, Energy Conversion
and Management, 50 (2009), pp. 2035–2046.
[4] Esen, H., Turgut, E. (2015), Optimization of operating
parameters of a ground coupled heat pump system by
Taguchi method, Energy and Buildings, Volume 107, 15
November 2015, pp. 329–334.
[5] Mu, W., Wang, S., Pan, S., Shi, Y. (2006), Discussion of
an Optimization Scheme for the Ground Source Heat Pump
System of HVAC, Renewable Energy Resources and a
Greener, Future Vol. VIII-13-3 2006, ESL-IC-06-11-315.
[6] Shi, Z., Li, Z. (2011), Thermo-economic Optimization of a
Seawater Source Heat Pump System for Residential
Buildings, Advanced Materials Research Online, 2011-10-
07, ISSN: 1662-8985, Vols. 354-355, pp 794-797.
[7] Ahmadi, M. H., Ahmadi, M. A., Bayat, R., Ashouri, M.,
Feidt, M. (2015), Thermo-economic optimization of
Stirling heat pump by using non-dominated sorting genetic
algorithm, Energy Conversion and Management, 91
(2015), pp. 315–322.
[8] Go, G. H., Lee, S. R., Yoon, S., Kim, M. J. (2016),
Optimum design of horizontal ground-coupled heat pump
systems using spiral-coil-loop heat exchangers, Applied
Energy, Volume 162, 15 January 2016, pp. 330–345
[9] Cui, W., Zhou, S., Liu, X. (2015), Optimization of design
and operation parameters for hybrid ground-source heat
pump assisted with cooling tower, Energy and Buildings,
99 (2015), 253–262
[10] Mokhtari, H., Hadiannasab, H., Mostafavi, M.,
Ahmadibeni, A. (2016), Determination of optimum
geothermal Rankine cycle parameters utilizing coaxial heat
exchanger, Energy, 102 (2016), pp. 260-275
13
EXPRES 2017 ISBN 978-86-919769-1-0
4. Auxiliary equations
The heat flow in the evaporation section
The heat flux in evaporation section equal to the
specific latent heat of evaporation.
The latent heat of evaporation expressed by an
exponential function depending on the evaporation
temperature.
∆, = + ∙ + ∙
(11)
Parameters for the refrigerant R 134a:
= 200.5965715; = −0.709168; =−0.00596796.
The arithmetic and logarithmic temperature
difference
The general form of the logarithmic temperature
difference for the evaporation and superheating
section.
∆,,, = ∆ − ∆(∆ ∕ ∆) (12)
The general form of the arithmetic temperature
difference.
∆,,, ≅ ∆,, + ∆,,2 (13)
Since the evaporation occurs at a near constant
temperature and the superheating section the
temperature decreasing only 4 oC, therefore in the both
section by a negligible difference the logarithmic
temperature difference substitutable with arithmetic.
Temperature differences in evaporation section
The co-current flow
The maximal temperature difference between the
evaporation and the well water temperature.
∆ = − (14)
The the minimul temperature difference between
the evaporation and the well water temperature.
∆ = − (15)
The well water temperature difference between inlet
and outlet at the evaporation section
∆, = − (16)
Temperature differences in vapor superheating
sections
The superheated vapor temperature is same as the
evaporation temperature.
= (17)
The co-current flow.
The maximal temperature difference between the
vapor and the well water input temperature.
∆ = − (18)
The minimal temperature difference between the
vapor and the well water output temperature.
∆ = − (19)
The well water temperature difference between inlet
and outlet at the superheating section
∆ = − (20)
The refrigerant temperature difference between inlet
and outlet at the superheating section
∆ = − (21)
The overall heat transfer coefficients
The plate evaporator can be approximately
considered as a smoot-wall exchager, so the heat
transfer coefficient in both section, in the evaporation
and the superheating section, can be calculated by the
following relationship.
, = 1
+ ∑
+ ,
(22)
Since the wall thickness of the plate evaporator is
only 0.3-0.5 mm, so the heat resistance of the wall
insignificant that is Σδ / λ ≅0. After neglect the
expression of the heat transfer coefficient is:
, ≅ ∙ , + ,
(23)
5. A mathematical procedure
The mathematical model is composed of a non-
linear, multivariable, coupled and large number
algebraic equations. Since the model is so complex the solution can be
obtained by means a numerical iterative procedure.
The Matlab software package has been applied to this
purpose.
6. Case study
The evaporator's heat flux behavior is ivestigated as a
function of the well water and refigerant mass flow
rate using the mathematical model and the iterative
numerical procedure. The known input data.
• Vapour quality, x = 0.25,
• The well water inlet temperature., twi = 14OC -
• The mass flow of the well water., ṁw = 0.3, 0.4, 0.5,
0.6, 0.7, 0.8, 0.9, 1, 1.1, 1.2 kg/s,
• The refrigerant mass flow rate., ṁf = 0.03, 0.04,
0.05;0.06;0.07;0.08;0.09;0.1;0.11;0.12 kg/s,
• The size of the evaporator heat transfer surface. F = 2
m2.
EXPRES 2017 ISBN 978-86-919769-1-0
7. The simulation results and discussion
Based on the results of numerical simulations we
can conclude that:
• The heat flux in the evaporation section varies near
linearly depending on the mass flow rates.
• The varation trend of the heat flux and latent heat is
very similer depending on the mass flow rates.
• The heat flow is very slightly decreases with
increasing the mass flow rate of the well water.
• The slightly decreasing first does not look logically but
if we consider, the behavior of the latent heat as a
function of the well water mass flow rate, has the
same behavior as the heat flow.
• On the heat flux the effect of the refrigerant mass flow
rate is much more intensev as the well water's mass
flow rate.
• The increasing of the refrigerant mass flow rate
results a very intensiv increasing of the heat flux.
• The increasing tendency of the heat flux is nearly
linear.
Fig. 2. Heat flux depened on the well water and
refrigerant mass flow rate
Fig. 3. Latent heat depened on the well water and
refrigerant mass flow rate
8. Conclusion
The thermal behavior of the heat pump evaporator
was investigated in a steady-state operation mode,
using the lumped parameter mathematical model and
iterative numerical procedure.
The results show near linear behavior of the heat
flux as a function of the well water and the refrigerant
mass flow rate.
The heat flux follows the behavior of the latent heat,
it is understandable, because the necessary heat flux for
the evaporation is proportional to the latent heat.
One more interesting and important statement, the
heat transfer coefficient does not directly influence the
heat flux, but influences the temperature level of the
well water and refrigerant.
However, the refrigerant temperature affects the
performance of the compressor, thereby the mass flow
rate of the refrigerant.
References
[1] Nyers, J., Pek, Z. (2014), Mathematical model of heat
pumps' coaxial evaporator with distributed parameters,
Acta Polytechnica Hungarica, Volume 11, Issue 10, pp. 41-
57.
[2] Yan Y.-Y., T.-F Lin. (1999), Evaporation Heat Transfer
and Pressure Drop of Refrigerant R-134a in a Plate Heat
Exchanger, Transactions of the ASME, 118 / Vol. 121.
[3] Sayyaadi, H., Amlashi, E. H., Amidpour, M. (2009), Multi-
objective optimization of a vertical ground source heat
pump using evolutionary algorithm, Energy Conversion
and Management, 50 (2009), pp. 2035–2046.
[4] Esen, H., Turgut, E. (2015), Optimization of operating
parameters of a ground coupled heat pump system by
Taguchi method, Energy and Buildings, Volume 107, 15
November 2015, pp. 329–334.
[5] Mu, W., Wang, S., Pan, S., Shi, Y. (2006), Discussion of
an Optimization Scheme for the Ground Source Heat Pump
System of HVAC, Renewable Energy Resources and a
Greener, Future Vol. VIII-13-3 2006, ESL-IC-06-11-315.
[6] Shi, Z., Li, Z. (2011), Thermo-economic Optimization of a
Seawater Source Heat Pump System for Residential
Buildings, Advanced Materials Research Online, 2011-10-
07, ISSN: 1662-8985, Vols. 354-355, pp 794-797.
[7] Ahmadi, M. H., Ahmadi, M. A., Bayat, R., Ashouri, M.,
Feidt, M. (2015), Thermo-economic optimization of
Stirling heat pump by using non-dominated sorting genetic
algorithm, Energy Conversion and Management, 91
(2015), pp. 315–322.
[8] Go, G. H., Lee, S. R., Yoon, S., Kim, M. J. (2016),
Optimum design of horizontal ground-coupled heat pump
systems using spiral-coil-loop heat exchangers, Applied
Energy, Volume 162, 15 January 2016, pp. 330–345
[9] Cui, W., Zhou, S., Liu, X. (2015), Optimization of design
and operation parameters for hybrid ground-source heat
pump assisted with cooling tower, Energy and Buildings,
99 (2015), 253–262
[10] Mokhtari, H., Hadiannasab, H., Mostafavi, M.,
Ahmadibeni, A. (2016), Determination of optimum
geothermal Rankine cycle parameters utilizing coaxial heat
exchanger, Energy, 102 (2016), pp. 260-275
14
EXPRES 2017 ISBN 978-86-919769-1-0
[11] Takács J. (2015), Enhance of the efficiency of exploitation
of geothermal energy, EXPRES 2015 Proceedings, ISBN
978-86-82621-15-7, Subotica, pp. 46-49*
[12] Wu, W., Shi, W., Wang, B., Li, X. (2015), Annual
performance investigation and economic analysis of
heating systems with a compression-assisted air source
absorption heat pump, Energy Conversion and
Management, Volume 98, 1 July 2015, pp. 290–302
[13] Dragičević, S., Bojić, M. (2009), An energy optimization
model for a combined heat and power production energy
supply system with a heat pump, Proc. IMechE Vol. 223
Part A: J. Power and Energy, 2009, pp. 321-328
[14] Kalmár, F. (2016), Interrelation between glazing and
summer operative temperature in buildings, International
Review of Applied Sciences and Engineering, 7 (2016) 1,
pp. 51–60, DOI: 10.1556/1848.2016.7.1.7
[15] Kalmár, F., Csomós, Gy., Lakatos, Á. (2013), Focus on
renewable energy (energy policy) — Editorial,
International Review of Applied Sciences and Engineering,
4 (1), 95-95 (2013)
[16] Kajtár, L., Kassai, M., Bánhidi, L. (2011), Computerized
simulation of the energy consumption of air handling units.
2011, Energy and Buildings, ISSN 0378-7788, (45) pp. 54-
59.
[17] Kassai, M., Ge, G., Simonson, C. J. (2015),
Dehumidification performance investigation of liquid-to-air
membrane energy exchanger system, Thermal Science,
DOI: 10.2298/TSCI140816129K (2015).
[18] Nyers, J., Garbai, L., Nyers, A. (2015), A modified
mathematical model of heat pump's condenser for
analytical optimization, International J. Energy, Vol. 80,
pp. 706-714, 1 February 2015.
DOI:10.1016/j.energy.2014.12.028
[19] Nyers, J., Nyers, A. (2013), Hydraulic Analysis of Heat
Pump's Heating Circuit using Mathematical Model, 9th
ICCC International Conferenc, Proceedings-USB, ISBN
978-1-4799-0061-9, pp. 349-353, Tihany, Hungary, 2013
[20] Nyers, J., Nyers, A.(2011), COP of heating-cooling system
with heat pump, EXPRES 2011, 3rd IEEE International
Symposium on Exploitation of Renewable Energy Sources,
Subotica, Serbia; 2011, Proceedings, pp. 17-21, Article
number 5741809
[21] Kajtár L., Hrustinszky T.: Investigation and influence of
indoor air quality on energy demand of office buildings.
WSEAS Transactions on Heat and Mass Transfer, Issue 4,
Volume 3, October 2008. 219-228 p.
[22] M. Kassai, C. J. Simonson, “Performance investigation of
liquid-to-air membrane energy exchanger under low
solution/air heat capacity rates ratio conditions,” Building
Services Engineering Research & Technology. vol. 36. n.
5. pp. 535-545, 2015.
[23] TK. Dabis, Z. Szánthó: Control of Domestic Hot Water
production is instantaneous heating system with a speed
controlled pump, 6th International symposium “EXPRES
2014 VTS.” Subotica. Serbia, 2014. pp. 101-106. ISBN
978-86-85409-96-7.
[24] Balázs Both, Zoltán Szánthó, Róbert Goda: Numerical
investigation of offset jet attaching to a wall, EXPRES
2015. Subotica. Serbia, 2015. pp. 70-73. ISBN 978-86-
82621-15-7
[25] Mária Kurcová: The effect of thermal insulation of an
apartment house on thermo-hydraulic stability of the space
heating system. EXPRES 2015. Subotica. Serbia, 2015. pp.
88-91. ISBN 978-86-82621-15-7
[26] Miklos Kassai, Mohammad Rafati Nasr, Carey J.
Simonson: A developed procedure to predict annual
heating energy by heat-and energy recovery technologies in
different climate European countries. Energy and
Buildings. Vol. 109, pp. 267-273,
DOI:10.1016/j.enbuild.2015.10.008 (2015).
[27] L. Šereš L., O. Grljević, S. Bošnjak, IT Support of
Buildings Energy Efficiency Improvement, International
Conference on Energy Efficiency and Environmental
Sustainability, EEES 2012, Conference proceedings, ISBN:
978-86-7233-320-6, pp. 55-62.
[28] A. Szente, I. Farkas, and P. Odry: The application of
Thermopile Technology in high Energy Nuclear Power
Plants, EXPRES 2014, pp.23-28, 2014, ISBN 978-86-
85409-96-7
[29] Ferenc Kalmár, Sándor Hámori: Investigation of
unbalancing problems in central heating systems, EXPRES
2015, pp. 7-12. ISBN 978-86-82621-15-7. 2015
[30] Füri, B.: Practical experiences with multi-compressor
refrigeration systems, Proceedings of 6th International
Conference on Compressors and Coolants – Compressors
2006, 27. - 29. 9. 2006, Častá – Papiernička, p. 158– 161.
ISBN 80-968986-5-5
[31] Füri, B. Švingál, J.: Some experimental results with
ammonia base azeotropic refrigerant R 723 in small heat
pump, p. 139 – 142. Proceedings of 7th International
Conference on Compressors and Coolants – Compressors
2009, 30. 9.- 2. 10. 2009, Častá -Papiernička, ISBN: 978-
80-89376-02-2
[32] Ján Takács, Marek Bukoviansky: Utilization of Geothermal
Energy for Residential Sector of the City District Galanta
North. EXPRES 2014, pp.82-85, ISBN 978-86-85409-96-
7, 2014.
[33] F. E. Kiss and D. P. Petkovic: Revealing the costs of air
pollution caused by coal-based electricity generation in
Serbia, EXPRES 2015, pp. 96-101. ISBN 978-86-82621-
15-7, 2015.
[34] Slavica Tomic, Aleksandra Stoiljkovic: Energy efficiency
as a precondition of sustainable tourism. EXPRES 2015,
pp. 134-139. ISBN 978-86-82621-15-7, 2015.
[35] A. Nagy: Determination of the Gasket Load Drop at Large
Size Welding Neck Flange Joints in the Case of Nonlinear
Gasket Model. Int. J. Pres. Ves. & Piping. 67 (1996) 243-
248.
[36] A. Nagy: Time Depending Characteristics of Gasket at
Flange Joints. Int. J. Pres. Ves. & Piping. (1997).
[37] Nagy Károly, Divéki Szabolcs, Odry Péter, Sokola Matija,
Vujicic Vladimir:"A Stochastic Approach to Fuzzy
Control", I.J. Acta Polytechnica Hungarica, Vol. 9, No 6,
2012, pp. 29-48. (ISSN: 1785-8860).
EXPRES 2017 ISBN 978-86-919769-1-0
Recycling of ashes from biomass-combustion power plant in swage sludge management M. WÓJCIKa, F. STACHOWICZb
, A. MASŁOŃc a-bDepartment of Materials Forming and Processing,
RzeszowUniversity of Technology
35-959 Rzeszow, Powstańców Warszawy 8, Poland c Department of Chemistry and Environmental Engineering,
RzeszowUniversity of Technology
35-959 Rzeszow, Powstańców Warszawy 6, Poland aE-mail:[email protected] bE-mail:[email protected] cE-mail:[email protected]
Biomass energy plays an important role in the production of energy from renewable energy sources. Currently, biomass energy
constitutes approximately 8÷15 % of the world energy supplies and it is estimated to increase to 33÷50 % by 2050. During bio-
mass combustion, there are formed combustion products, especially ashes. Available data indicate that only 29.1 % of biomass
ashes were recycled in Poland in 2013. Specific physicochemical properties of biomass combustion products prevent their applica-
tion in many sectors of economy and for this reason, biomass ashes are mainly stored in landfill sites. The growth of biomass share
in energy production requires new biomass ashes utilization methods. Chemical composition and sorptive properties of ashes
enable their application in the sewage sludge treatment. This paper analyses the impact of ashes from biomass combustion power
plant on sewage sludge dewatering and hygienisation. The application of biomass combustion products in sewage sludge manage-
ment can provide methods of their utilization according to law and environmental requirements.
Keywords: biomass ash, sewage sludge, sewage sludge management, recycling, renewable energy
1. Introduction
Energetic industry is one of the main sources ofair pol-
lution today.The combustion of conventional fuels, for
example: coal, causes gas and dust emissions. Coal
combustion also causes emissionof greenhouse gases,
NOx and SOx. Although, the elimination of fossil fuel
combustion is impossible, we can limit their participa-
tion in final energy production. For this reason, acts
that supportthe use of renewable energy sources (cli-
mate and energy package 3 x 20 %) were imple-
mented.
Biomass plays a special importance amongst re-
newable energy sources. It is estimated that biomass
energy constituted approximately 53 % of world re-
newable energy production in 2010 [1]. Hydrogeologi-
cal location of Poland prevents a significant share of
renewable energy from natural sources, for example:
from wind and sun and for this reason, biomass energy
is becoming more and more popular in Poland. For
heating purposes, forest or agricultural biomass are
particularly used [2]. The main sources of biomass in
Poland are energetic crops, for example: straw and Sa-lix viminalis. The largest share of whole energetic
plants has a willow tree. In Poland, there are about 780
willow plant plantations with a surface area of 9480 ha
whichcontains approximately95 % of perennial
plants cultivation [3]. Biomass comprises compo-
nents which are contained in organs, for example:
proteins, fat and lignin and structural material of
biomass: polymerized carbonohydres, lignin and cel-
lulose. The above-mentioned substances consist of
gluconic acid and glucose chains. The definite advan-
tage of biomass combustion is “zero emission” of
carbon dioxide. During the biomass burning, only so
much carbon dioxide is emitted as a plant takes from
the atmosphere by photosynthesis when the plants
grow [4].Therefore, biomass can be treated as a
source of clean energy. Biomass is burnt in fluidized-
bed incinerators in power plants. The biomass con-
sumption is systematically growing. In Poland the
biomass consumption was 9 317 763 GJ in coal-
burning power plants in 2005. For comparison, the
use of biomass grew to 42 917 011 GJ in 2013. In
2013 the biomass consumption was 26 275 970 GJ in
biomass-burning power plants [2]. During the bio-
mass combustion, there are formed combustion prod-
ucts, such as fly and bottom ashes. The increasing
share of biomass in final energy production causes
the problem with the ash utilization. Available data
indicate that only 29.1 % of biomass ashes were re-
cycled in Poland in 2012 [5].
15
EXPRES 2017 ISBN 978-86-919769-1-0
[11] Takács J. (2015), Enhance of the efficiency of exploitation
of geothermal energy, EXPRES 2015 Proceedings, ISBN
978-86-82621-15-7, Subotica, pp. 46-49*
[12] Wu, W., Shi, W., Wang, B., Li, X. (2015), Annual
performance investigation and economic analysis of
heating systems with a compression-assisted air source
absorption heat pump, Energy Conversion and
Management, Volume 98, 1 July 2015, pp. 290–302
[13] Dragičević, S., Bojić, M. (2009), An energy optimization
model for a combined heat and power production energy
supply system with a heat pump, Proc. IMechE Vol. 223
Part A: J. Power and Energy, 2009, pp. 321-328
[14] Kalmár, F. (2016), Interrelation between glazing and
summer operative temperature in buildings, International
Review of Applied Sciences and Engineering, 7 (2016) 1,
pp. 51–60, DOI: 10.1556/1848.2016.7.1.7
[15] Kalmár, F., Csomós, Gy., Lakatos, Á. (2013), Focus on
renewable energy (energy policy) — Editorial,
International Review of Applied Sciences and Engineering,
4 (1), 95-95 (2013)
[16] Kajtár, L., Kassai, M., Bánhidi, L. (2011), Computerized
simulation of the energy consumption of air handling units.
2011, Energy and Buildings, ISSN 0378-7788, (45) pp. 54-
59.
[17] Kassai, M., Ge, G., Simonson, C. J. (2015),
Dehumidification performance investigation of liquid-to-air
membrane energy exchanger system, Thermal Science,
DOI: 10.2298/TSCI140816129K (2015).
[18] Nyers, J., Garbai, L., Nyers, A. (2015), A modified
mathematical model of heat pump's condenser for
analytical optimization, International J. Energy, Vol. 80,
pp. 706-714, 1 February 2015.
DOI:10.1016/j.energy.2014.12.028
[19] Nyers, J., Nyers, A. (2013), Hydraulic Analysis of Heat
Pump's Heating Circuit using Mathematical Model, 9th
ICCC International Conferenc, Proceedings-USB, ISBN
978-1-4799-0061-9, pp. 349-353, Tihany, Hungary, 2013
[20] Nyers, J., Nyers, A.(2011), COP of heating-cooling system
with heat pump, EXPRES 2011, 3rd IEEE International
Symposium on Exploitation of Renewable Energy Sources,
Subotica, Serbia; 2011, Proceedings, pp. 17-21, Article
number 5741809
[21] Kajtár L., Hrustinszky T.: Investigation and influence of
indoor air quality on energy demand of office buildings.
WSEAS Transactions on Heat and Mass Transfer, Issue 4,
Volume 3, October 2008. 219-228 p.
[22] M. Kassai, C. J. Simonson, “Performance investigation of
liquid-to-air membrane energy exchanger under low
solution/air heat capacity rates ratio conditions,” Building
Services Engineering Research & Technology. vol. 36. n.
5. pp. 535-545, 2015.
[23] TK. Dabis, Z. Szánthó: Control of Domestic Hot Water
production is instantaneous heating system with a speed
controlled pump, 6th International symposium “EXPRES
2014 VTS.” Subotica. Serbia, 2014. pp. 101-106. ISBN
978-86-85409-96-7.
[24] Balázs Both, Zoltán Szánthó, Róbert Goda: Numerical
investigation of offset jet attaching to a wall, EXPRES
2015. Subotica. Serbia, 2015. pp. 70-73. ISBN 978-86-
82621-15-7
[25] Mária Kurcová: The effect of thermal insulation of an
apartment house on thermo-hydraulic stability of the space
heating system. EXPRES 2015. Subotica. Serbia, 2015. pp.
88-91. ISBN 978-86-82621-15-7
[26] Miklos Kassai, Mohammad Rafati Nasr, Carey J.
Simonson: A developed procedure to predict annual
heating energy by heat-and energy recovery technologies in
different climate European countries. Energy and
Buildings. Vol. 109, pp. 267-273,
DOI:10.1016/j.enbuild.2015.10.008 (2015).
[27] L. Šereš L., O. Grljević, S. Bošnjak, IT Support of
Buildings Energy Efficiency Improvement, International
Conference on Energy Efficiency and Environmental
Sustainability, EEES 2012, Conference proceedings, ISBN:
978-86-7233-320-6, pp. 55-62.
[28] A. Szente, I. Farkas, and P. Odry: The application of
Thermopile Technology in high Energy Nuclear Power
Plants, EXPRES 2014, pp.23-28, 2014, ISBN 978-86-
85409-96-7
[29] Ferenc Kalmár, Sándor Hámori: Investigation of
unbalancing problems in central heating systems, EXPRES
2015, pp. 7-12. ISBN 978-86-82621-15-7. 2015
[30] Füri, B.: Practical experiences with multi-compressor
refrigeration systems, Proceedings of 6th International
Conference on Compressors and Coolants – Compressors
2006, 27. - 29. 9. 2006, Častá – Papiernička, p. 158– 161.
ISBN 80-968986-5-5
[31] Füri, B. Švingál, J.: Some experimental results with
ammonia base azeotropic refrigerant R 723 in small heat
pump, p. 139 – 142. Proceedings of 7th International
Conference on Compressors and Coolants – Compressors
2009, 30. 9.- 2. 10. 2009, Častá -Papiernička, ISBN: 978-
80-89376-02-2
[32] Ján Takács, Marek Bukoviansky: Utilization of Geothermal
Energy for Residential Sector of the City District Galanta
North. EXPRES 2014, pp.82-85, ISBN 978-86-85409-96-
7, 2014.
[33] F. E. Kiss and D. P. Petkovic: Revealing the costs of air
pollution caused by coal-based electricity generation in
Serbia, EXPRES 2015, pp. 96-101. ISBN 978-86-82621-
15-7, 2015.
[34] Slavica Tomic, Aleksandra Stoiljkovic: Energy efficiency
as a precondition of sustainable tourism. EXPRES 2015,
pp. 134-139. ISBN 978-86-82621-15-7, 2015.
[35] A. Nagy: Determination of the Gasket Load Drop at Large
Size Welding Neck Flange Joints in the Case of Nonlinear
Gasket Model. Int. J. Pres. Ves. & Piping. 67 (1996) 243-
248.
[36] A. Nagy: Time Depending Characteristics of Gasket at
Flange Joints. Int. J. Pres. Ves. & Piping. (1997).
[37] Nagy Károly, Divéki Szabolcs, Odry Péter, Sokola Matija,
Vujicic Vladimir:"A Stochastic Approach to Fuzzy
Control", I.J. Acta Polytechnica Hungarica, Vol. 9, No 6,
2012, pp. 29-48. (ISSN: 1785-8860).
EXPRES 2017 ISBN 978-86-919769-1-0
Recycling of ashes from biomass-combustion power plant in swage sludge management M. WÓJCIKa, F. STACHOWICZb
, A. MASŁOŃc a-bDepartment of Materials Forming and Processing,
RzeszowUniversity of Technology
35-959 Rzeszow, Powstańców Warszawy 8, Poland c Department of Chemistry and Environmental Engineering,
RzeszowUniversity of Technology
35-959 Rzeszow, Powstańców Warszawy 6, Poland aE-mail:[email protected] bE-mail:[email protected] cE-mail:[email protected]
Biomass energy plays an important role in the production of energy from renewable energy sources. Currently, biomass energy
constitutes approximately 8÷15 % of the world energy supplies and it is estimated to increase to 33÷50 % by 2050. During bio-
mass combustion, there are formed combustion products, especially ashes. Available data indicate that only 29.1 % of biomass
ashes were recycled in Poland in 2013. Specific physicochemical properties of biomass combustion products prevent their applica-
tion in many sectors of economy and for this reason, biomass ashes are mainly stored in landfill sites. The growth of biomass share
in energy production requires new biomass ashes utilization methods. Chemical composition and sorptive properties of ashes
enable their application in the sewage sludge treatment. This paper analyses the impact of ashes from biomass combustion power
plant on sewage sludge dewatering and hygienisation. The application of biomass combustion products in sewage sludge manage-
ment can provide methods of their utilization according to law and environmental requirements.
Keywords: biomass ash, sewage sludge, sewage sludge management, recycling, renewable energy
1. Introduction
Energetic industry is one of the main sources ofair pol-
lution today.The combustion of conventional fuels, for
example: coal, causes gas and dust emissions. Coal
combustion also causes emissionof greenhouse gases,
NOx and SOx. Although, the elimination of fossil fuel
combustion is impossible, we can limit their participa-
tion in final energy production. For this reason, acts
that supportthe use of renewable energy sources (cli-
mate and energy package 3 x 20 %) were imple-
mented.
Biomass plays a special importance amongst re-
newable energy sources. It is estimated that biomass
energy constituted approximately 53 % of world re-
newable energy production in 2010 [1]. Hydrogeologi-
cal location of Poland prevents a significant share of
renewable energy from natural sources, for example:
from wind and sun and for this reason, biomass energy
is becoming more and more popular in Poland. For
heating purposes, forest or agricultural biomass are
particularly used [2]. The main sources of biomass in
Poland are energetic crops, for example: straw and Sa-lix viminalis. The largest share of whole energetic
plants has a willow tree. In Poland, there are about 780
willow plant plantations with a surface area of 9480 ha
whichcontains approximately95 % of perennial
plants cultivation [3]. Biomass comprises compo-
nents which are contained in organs, for example:
proteins, fat and lignin and structural material of
biomass: polymerized carbonohydres, lignin and cel-
lulose. The above-mentioned substances consist of
gluconic acid and glucose chains. The definite advan-
tage of biomass combustion is “zero emission” of
carbon dioxide. During the biomass burning, only so
much carbon dioxide is emitted as a plant takes from
the atmosphere by photosynthesis when the plants
grow [4].Therefore, biomass can be treated as a
source of clean energy. Biomass is burnt in fluidized-
bed incinerators in power plants. The biomass con-
sumption is systematically growing. In Poland the
biomass consumption was 9 317 763 GJ in coal-
burning power plants in 2005. For comparison, the
use of biomass grew to 42 917 011 GJ in 2013. In
2013 the biomass consumption was 26 275 970 GJ in
biomass-burning power plants [2]. During the bio-
mass combustion, there are formed combustion prod-
ucts, such as fly and bottom ashes. The increasing
share of biomass in final energy production causes
the problem with the ash utilization. Available data
indicate that only 29.1 % of biomass ashes were re-
cycled in Poland in 2012 [5].
16
RECYCLING OF ASHES FROM BIOMASS COMBUSTION POWER PLANT IN SEWAGE SLUDGE MANAGEMENT
Specific properties of biomass combustion prod-
ucts prevent their application in many sectors of econ-
omy. The chemical composition and high losses of ig-
nition lead to the fact that most of biomass ashes fail to
fulfill standard requirements as a component of cement
and concrete production. Biomass ashes are applied as
a valuable fertilizer improving the plant growth. Bio-
mass ashes can be also used as a component improving
geotechnical properties of ground [5].
Sewage sludge is a by-product of sewage
treatment which contains mineral and organic com-
pounds. Due to theconnection of new areas to the se-
wage system, the amount of sewage sludge is syste-
matically growing. According to GUS [6], there were
produced 556 Mg of dry mass of municipal sewage
sludge in Poland in 2014. Before the land application,
sewage sludge have to be processed in order to de-
crease the health risk. Additionally, the effective de-
watering can reduce the transport cost of sewage
sludge. Raw sewage sludge has a stable structure with
a low capacity of dewatering and sedimentation.
Thus, sludge dewateringis enhanced by conditioning
with the application of mineral and organic reagents.
Recently, the application of polyelectrolytes is very
popular in treatment plants. The disadvantages of
aforementioned reagents are their high costs. What is
more, high amountsof polyelectrolytes are required
for effective dewatering. Eye and Basu [7] proved
that the application of coal fly ashes as a conditioner
can reduce operating costs of treatment plant by 88 %
in comparison to other chemical reagents (Table 1).
The alternative solution for popular polyelectro-
lytes could be ashes. Ashes with a diameter below
300 µm are the weights of sewage sludge flocs. In the
wake of incorporation of ash in sludge flocs, the
shape, dimension and structure of flocs are altered.
Ashes are integrated in sewage sludge floc matrix,
what can improve the sewage sludge dewatering
[8,9].
The purpose of the paper was to determine the in-
fluence of biomass ash on sewage sludge dewatering.
The findings show the positive influence of ash on
sewage sludge treatment.Additionally, the mixture of
ash and sewage sludge can be applied as a valuable
fertilizer in plant plantations.
2. Materials and methods
The academic research concerning the influence of
biomass ash on sewage sludge dewatering was per-
formed under laboratory conditions. Sewage sludge
used in tests was obtained from the thickening tank
from Municipal Wastewater Treatment Plant in Świl-
cza in the Podkarpacie region. Sewage sludge was
taken during summer/autumn and was characterized
by grey-brown colour and earthy smell. The physical
and chemical properties of unconditioned sludge were
as follows: pH= 6.40, the moisture content= 97.48 %,
dry mass= 2.52 % , capillary suction time (CST)=
130.89 s.
In laboratory research, ash from biomass combus-
tion power plant was used (Fig.1). Ash was derived
from a power plant “Łężańska” in Krosno, in the
South-Eastern of Poland. In power plant, there is
mainly used biomass from timber industry and green
waste. For biomass combustion, Organic Rankine
Cycle (ORC)technology is used. The simultaneous
transport heat from biomass combustion into electric-
ity and thermal power is the main advantage of ORC
technology.
Malvern Mastersizer 2000 particle size analyser
was used to determine the particle size distribution of
ash. The biomass ash was characterized by particles in
the range of 0.399 ÷ 399 µm (Fig.2). Due to the fact
that ash was not sieved before laboratory research,
there were some coarse particles above 300 µm. To
determine micromorphological characteristics of bio-
mass ash, scanning electron microscope SEM S-
3400N HITACHI was used.SEM images of biomass
ash are shown in Fig. 3. The biomass ash contains the
following micromorphological types of particles: ir-
regular sharp and spongy. The SEM analysis also
shows that the material contains polyhedral and highly
porous particles. The chemical composition of ash was
determined by means of Energy Dispersive Spectros-
copy (EDS). The results of EDS analysis show that the
ash comprises mainly the followingcompounds: Ca, O,
S, and Cl (Fig. 4).
Table1.The economic analyses of sewage sludge conditioning with different reagents [8]
Reagent Dose of reagents [kg per day] Cost of reagents [PLN per year]
FeCl3+CaO 137.7 16700
CaO+ coal fly ash 775 7660
Coal fly ash 3125 9960
RECYCLING OF ASHES FROM BIOMASS COMBUST
Fig.2.
Due to the biomass combustion from surrounding ti
ber industry, ash also contains molybdenum. The phase
composition of biomass ash is as follows:
CaO, Na2O2, SO2, Na2O, P2O5 and KO2.
Laboratory tests of sewage conditioning and d
watering were carried out in tree series. The scope of
the study included the analysis of sewage sludge dew
tering and the determination of the moisture content,
CSK and pH of conditioned sludge. The
of sludge conditioning was compared with the results
for raw sewage sludge. The sewage sludge conditio
ing was carried out as follows: five beakers with
a volume of 1 dm3 were poured into 500 cm cm
a)
Fig. 3.SEM images of biomass ash
0
1
2
3
4
5
0 50 100
Co
nte
nt
of
pa
rtic
les
[%]
RECYCLING OF ASHES FROM BIOMASS COMBUSTION POWER PLANT IN SEWAGE SLUDGE MANAGEMENT
Fig.1.The image of biomass ash
Fig.2.The granulometric analysis of biomass ash
Due to the biomass combustion from surrounding tim-
ash also contains molybdenum. The phase
composition of biomass ash is as follows: SiO2, Fe2O3,
age conditioning and de-
tree series. The scope of
study included the analysis of sewage sludge dewa-
tering and the determination of the moisture content,
CSK and pH of conditioned sludge. The effectiveness
with the results
sludge. The sewage sludge condition-
ried out as follows: five beakers with
500 cm cm3 of
raw sewage sludge. The appropriate
biomass ash: 5 g·dm-3
, 7.5 g·dm-3
,
g·dm-3
were applied to four beakers with sludge.
dosages of biomass ash were expressed as the weight
ratio ofash to sewage sludge dry mass, based on
literature review. Firstly, mixtures were rapidly stirred
with a speed of 200 rpm for 1 minute and after that,
they were stirred with a speed o
minutes by means of flocculator.
after conditioning, pH and capillary suction time
(CST) were determined. Then, for prepared samples
of sewage sludge, the dewatering capacity
was investigated.
b)
SEM images of biomass ash at two magnifications: 1000x (a) and 3500x (b)
150 200 250 300 350 400
Diameter of particles [µm]
MANAGEMENT
appropriate dosages of
, 15 g·dm-3
and 30
were applied to four beakers with sludge.The
dosages of biomass ash were expressed as the weight
ash to sewage sludge dry mass, based on
Firstly, mixtures were rapidly stirred
speed of 200 rpm for 1 minute and after that,
speed of 50 rpm for 15
In sewage sludge
after conditioning, pH and capillary suction time
determined. Then, for prepared samples
capacity of sludge
400 450
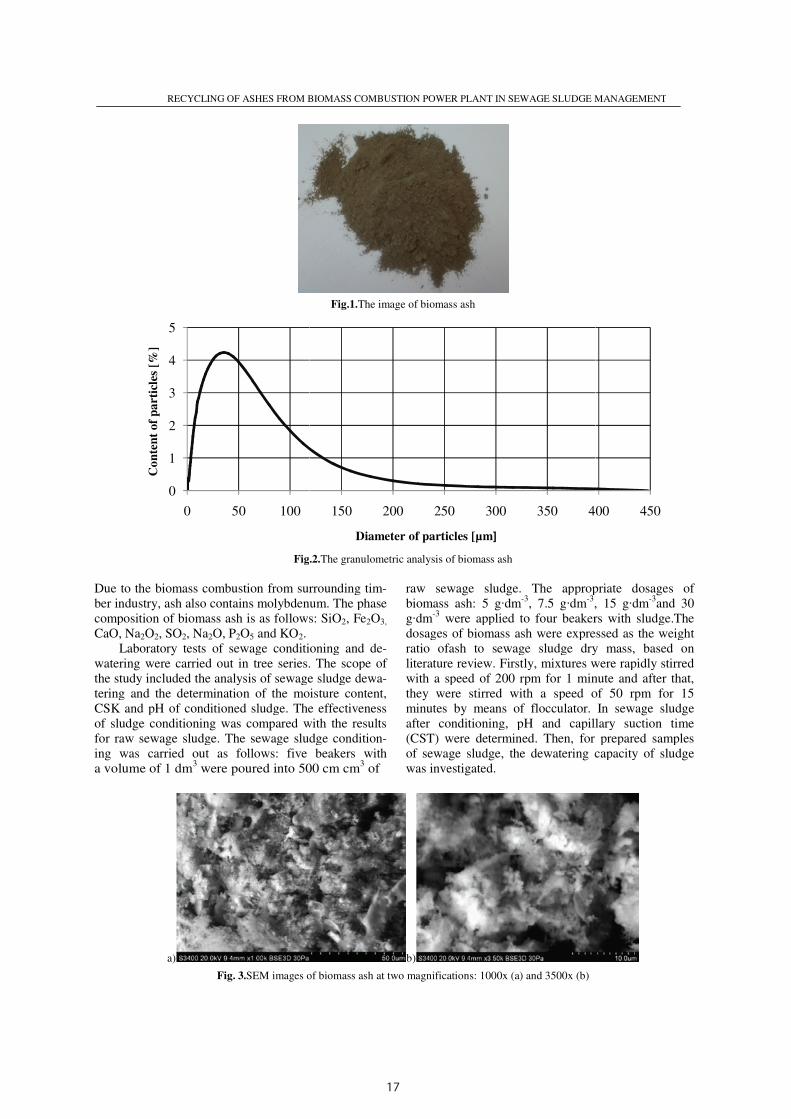
17
RECYCLING OF ASHES FROM BIOMASS COMBUSTION POWER PLANT IN SEWAGE SLUDGE MANAGEMENT
Specific properties of biomass combustion prod-
ucts prevent their application in many sectors of econ-
omy. The chemical composition and high losses of ig-
nition lead to the fact that most of biomass ashes fail to
fulfill standard requirements as a component of cement
and concrete production. Biomass ashes are applied as
a valuable fertilizer improving the plant growth. Bio-
mass ashes can be also used as a component improving
geotechnical properties of ground [5].
Sewage sludge is a by-product of sewage
treatment which contains mineral and organic com-
pounds. Due to theconnection of new areas to the se-
wage system, the amount of sewage sludge is syste-
matically growing. According to GUS [6], there were
produced 556 Mg of dry mass of municipal sewage
sludge in Poland in 2014. Before the land application,
sewage sludge have to be processed in order to de-
crease the health risk. Additionally, the effective de-
watering can reduce the transport cost of sewage
sludge. Raw sewage sludge has a stable structure with
a low capacity of dewatering and sedimentation.
Thus, sludge dewateringis enhanced by conditioning
with the application of mineral and organic reagents.
Recently, the application of polyelectrolytes is very
popular in treatment plants. The disadvantages of
aforementioned reagents are their high costs. What is
more, high amountsof polyelectrolytes are required
for effective dewatering. Eye and Basu [7] proved
that the application of coal fly ashes as a conditioner
can reduce operating costs of treatment plant by 88 %
in comparison to other chemical reagents (Table 1).
The alternative solution for popular polyelectro-
lytes could be ashes. Ashes with a diameter below
300 µm are the weights of sewage sludge flocs. In the
wake of incorporation of ash in sludge flocs, the
shape, dimension and structure of flocs are altered.
Ashes are integrated in sewage sludge floc matrix,
what can improve the sewage sludge dewatering
[8,9].
The purpose of the paper was to determine the in-
fluence of biomass ash on sewage sludge dewatering.
The findings show the positive influence of ash on
sewage sludge treatment.Additionally, the mixture of
ash and sewage sludge can be applied as a valuable
fertilizer in plant plantations.
2. Materials and methods
The academic research concerning the influence of
biomass ash on sewage sludge dewatering was per-
formed under laboratory conditions. Sewage sludge
used in tests was obtained from the thickening tank
from Municipal Wastewater Treatment Plant in Świl-
cza in the Podkarpacie region. Sewage sludge was
taken during summer/autumn and was characterized
by grey-brown colour and earthy smell. The physical
and chemical properties of unconditioned sludge were
as follows: pH= 6.40, the moisture content= 97.48 %,
dry mass= 2.52 % , capillary suction time (CST)=
130.89 s.
In laboratory research, ash from biomass combus-
tion power plant was used (Fig.1). Ash was derived
from a power plant “Łężańska” in Krosno, in the
South-Eastern of Poland. In power plant, there is
mainly used biomass from timber industry and green
waste. For biomass combustion, Organic Rankine
Cycle (ORC)technology is used. The simultaneous
transport heat from biomass combustion into electric-
ity and thermal power is the main advantage of ORC
technology.
Malvern Mastersizer 2000 particle size analyser
was used to determine the particle size distribution of
ash. The biomass ash was characterized by particles in
the range of 0.399 ÷ 399 µm (Fig.2). Due to the fact
that ash was not sieved before laboratory research,
there were some coarse particles above 300 µm. To
determine micromorphological characteristics of bio-
mass ash, scanning electron microscope SEM S-
3400N HITACHI was used.SEM images of biomass
ash are shown in Fig. 3. The biomass ash contains the
following micromorphological types of particles: ir-
regular sharp and spongy. The SEM analysis also
shows that the material contains polyhedral and highly
porous particles. The chemical composition of ash was
determined by means of Energy Dispersive Spectros-
copy (EDS). The results of EDS analysis show that the
ash comprises mainly the followingcompounds: Ca, O,
S, and Cl (Fig. 4).
Table1.The economic analyses of sewage sludge conditioning with different reagents [8]
Reagent Dose of reagents [kg per day] Cost of reagents [PLN per year]
FeCl3+CaO 137.7 16700
CaO+ coal fly ash 775 7660
Coal fly ash 3125 9960
RECYCLING OF ASHES FROM BIOMASS COMBUST
Fig.2.
Due to the biomass combustion from surrounding ti
ber industry, ash also contains molybdenum. The phase
composition of biomass ash is as follows:
CaO, Na2O2, SO2, Na2O, P2O5 and KO2.
Laboratory tests of sewage conditioning and d
watering were carried out in tree series. The scope of
the study included the analysis of sewage sludge dew
tering and the determination of the moisture content,
CSK and pH of conditioned sludge. The
of sludge conditioning was compared with the results
for raw sewage sludge. The sewage sludge conditio
ing was carried out as follows: five beakers with
a volume of 1 dm3 were poured into 500 cm cm
a)
Fig. 3.SEM images of biomass ash
0
1
2
3
4
5
0 50 100
Co
nte
nt
of
pa
rtic
les
[%]
RECYCLING OF ASHES FROM BIOMASS COMBUSTION POWER PLANT IN SEWAGE SLUDGE MANAGEMENT
Fig.1.The image of biomass ash
Fig.2.The granulometric analysis of biomass ash
Due to the biomass combustion from surrounding tim-
ash also contains molybdenum. The phase
composition of biomass ash is as follows: SiO2, Fe2O3,
age conditioning and de-
tree series. The scope of
study included the analysis of sewage sludge dewa-
tering and the determination of the moisture content,
CSK and pH of conditioned sludge. The effectiveness
with the results
sludge. The sewage sludge condition-
ried out as follows: five beakers with
500 cm cm3 of
raw sewage sludge. The appropriate
biomass ash: 5 g·dm-3
, 7.5 g·dm-3
,
g·dm-3
were applied to four beakers with sludge.
dosages of biomass ash were expressed as the weight
ratio ofash to sewage sludge dry mass, based on
literature review. Firstly, mixtures were rapidly stirred
with a speed of 200 rpm for 1 minute and after that,
they were stirred with a speed o
minutes by means of flocculator.
after conditioning, pH and capillary suction time
(CST) were determined. Then, for prepared samples
of sewage sludge, the dewatering capacity
was investigated.
b)
SEM images of biomass ash at two magnifications: 1000x (a) and 3500x (b)
150 200 250 300 350 400
Diameter of particles [µm]
MANAGEMENT
appropriate dosages of
, 15 g·dm-3
and 30
were applied to four beakers with sludge.The
dosages of biomass ash were expressed as the weight
ash to sewage sludge dry mass, based on
Firstly, mixtures were rapidly stirred
speed of 200 rpm for 1 minute and after that,
speed of 50 rpm for 15
In sewage sludge
after conditioning, pH and capillary suction time
determined. Then, for prepared samples
capacity of sludge
400 450
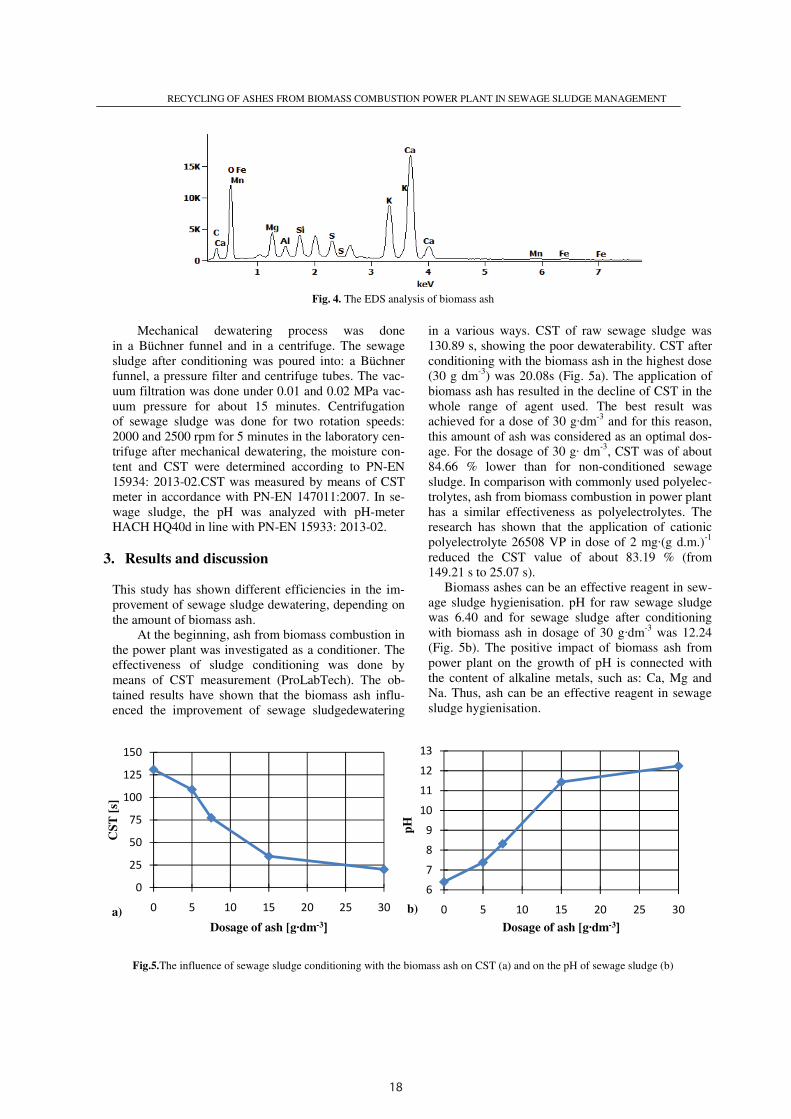
18
RECYCLING OF ASHES FROM BIOMASS COMBUSTION POWER PLANT IN SEWAGE SLUDGE MANAGEMENT
Fig. 4. The EDS analysis of biomass ash
Mechanical dewatering process was done
in a Büchner funnel and in a centrifuge. The sewage
sludge after conditioning was poured into: a Büchner
funnel, a pressure filter and centrifuge tubes. The vac-
uum filtration was done under 0.01 and 0.02 MPa vac-
uum pressure for about 15 minutes. Centrifugation
of sewage sludge was done for two rotation speeds:
2000 and 2500 rpm for 5 minutes in the laboratory cen-
trifuge after mechanical dewatering, the moisture con-
tent and CST were determined according to PN-EN
15934: 2013-02.CST was measured by means of CST
meter in accordance with PN-EN 147011:2007. In se-
wage sludge, the pH was analyzed with pH-meter
HACH HQ40d in line with PN-EN 15933: 2013-02.
3. Results and discussion
This study has shown different efficiencies in the im-
provement of sewage sludge dewatering, depending on
the amount of biomass ash. At the beginning, ash from biomass combustion in
the power plant was investigated as a conditioner. The
effectiveness of sludge conditioning was done by
means of CST measurement (ProLabTech). The ob-
tained results have shown that the biomass ash influ-
enced the improvement of sewage sludgedewatering
in a various ways. CST of raw sewage sludge was
130.89 s, showing the poor dewaterability. CST after
conditioning with the biomass ash in the highest dose
(30 g dm-3
) was 20.08s (Fig. 5a). The application of
biomass ash has resulted in the decline of CST in the
whole range of agent used. The best result was
achieved for a dose of 30 g·dm-3
and for this reason,
this amount of ash was considered as an optimal dos-
age. For the dosage of 30 g· dm-3
, CST was of about
84.66 % lower than for non-conditioned sewage
sludge. In comparison with commonly used polyelec-
trolytes, ash from biomass combustion in power plant
has a similar effectiveness as polyelectrolytes. The
research has shown that the application of cationic
polyelectrolyte 26508 VP in dose of 2 mg·(g d.m.)-1
reduced the CST value of about 83.19 % (from
149.21 s to 25.07 s).
Biomass ashes can be an effective reagent in sew-
age sludge hygienisation. pH for raw sewage sludge
was 6.40 and for sewage sludge after conditioning
with biomass ash in dosage of 30 g·dm-3
was 12.24
(Fig. 5b). The positive impact of biomass ash from
power plant on the growth of pH is connected with
the content of alkaline metals, such as: Ca, Mg and
Na. Thus, ash can be an effective reagent in sewage
sludge hygienisation.
Fig.5.The influence of sewage sludge conditioning with the biomass ash on CST (a) and on the pH of sewage sludge (b)
0
25
50
75
100
125
150
0 5 10 15 20 25 30
CS
T [
s]
Dosage of ash [g·dm-3]
6
7
8
9
10
11
12
13
0 5 10 15 20 25 30
pH
Dosage of ash [g·dm-3]a)
)
b)
)
RECYCLING OF ASHES FROM BIOMASS COMBUSTION POWER PLANT IN SEWAGE SLUDGE MANAGEMENT
In order to determine the effectiveness of sewage
sludge conditioning with biomass ash,, sewage sludge
as investigated by means of centrifugation. The re-
search was carried out for two rotation speed: 2000
rpm and 2500 rpm. As with the pressure filtration, the
moisture content decreased with an increase of dosage
of ash. The changes of moisture content are shown in
Fig. 6. The best results were obtained for the highest
amount of ash. With 30 g·dm-3
dosage of ash, the
moisture content decreased from 92.71 % (rawsewage
sludge) to84.52 % (conditioned sewage sludge) for the
rotation speed of 2000 rpm. Better results were ob-
tained for higher rotation speed. The application of 30
g·dm-3
dosage of biomass ash reduced the moisture
content from 92.52 % (raw sludge) to 76.21 % (condi-
tioned sludge). In comparison to raw sewage sludge,
the highest dosage of biomass ash reduced the moisture
content of about 10.23 % for a rotation speed of 2000
rpm and of about 19.06 % for a rotation speed of 2500
rpm. In any case, low dosages of ash did not influence
the reduction of moisture content in a significant way.
Additionally, the centrifugation of conditioned
sewage sludge was more efficient in comparison to raw
sewage sludge, as witnesses by the liquidvolume
after mechanical dewatering. The water volume was
approximately 27 cm3 for raw sewage sludge and in the
range of 31÷34 cm3
(2000 rpm) and 33÷34 cm3 (2500
rpm) for sewage sludge after conditioning with bio-
mass ash from power plant. Although the water volume
didnot change significantly, the dividing line between
sludge and liquid was clearer than for raw sewage
sludge.
Finally, sewage sludge was dewatered by means
of vacuum filtration. This method provided the best
results of sewage sludge dewatering. The filter cake
moisture for raw sewage sludge was respectively 88.21
% for 0.01 MPa vacuum pressure and 87.94% for 0.02
MPa vacuum pressure. The hydration of sewage sludge
decreasedas the dosage of ash and the vacuum pressure
increased. The dose of 30 g· dm-3
of biomass ash de-
creased themoisture content to 75.64 % (0.01 MPa) and
to 70.91% (0.02 MPa) (Fig.7). For the vacuum filtra-
tion process, the application of biomass ash is effective
in a whole range of doses. The lowest dosage of bio-
mass ash reduced the moisture content of about 11.72
% (0.01 MPa) and of about 14.15 % (0.02 MPa). But
the optimal dosage of biomass ash was the most effec-
tive in sewage sludge dewatering with a Büchner fun-
nel. The application of biomass ash in a dose of 30
g·dm-3
reduced the moisture content of about 19.66 %
for a vacuum pressure 0.01 MPa and 24.68 % for a
vacuum pressure 0.02 MPa. Considering the other
methods of sewage sludge dewatering, the filtered wa-
ter volume did not change significantly.
But the sludge filtration was more rapid in
comparison to raw sewage sludge. With a biomass ash
dosage of 30 g·dm-3
, the filter duration reduced from
200 s to about 60 s. The effectiveness of sewage sludge
conditioning with ash results from the special structural
properties of ash. Sewage sludge has a negative charge
and createsa stable system with low-sediment and low-
dewatering capacity. After conditioning with biomass
ash, the sludge particles congregated around the ash
microspheres and flocs were formed. When the raw
sewage sludge was compressed, a highly compressible
sludge might deform under pressure. The biomass ash
acts as skeleton builders and formed a permeable and
rigid lattice structure. Opposite to raw sewage sludge,
conditioned sludge remained porous under high pres-
sure [9].
Fig.6.The influence of sewage sludge conditioning with biomass ash on the moisture content after centrifugation
75
80
85
90
95
0 5 10 15 20 25 30
the
mois
ture
con
ten
t [%
]
Dosage of ash [g·dm-3]
2000 rpm
2500 rpm
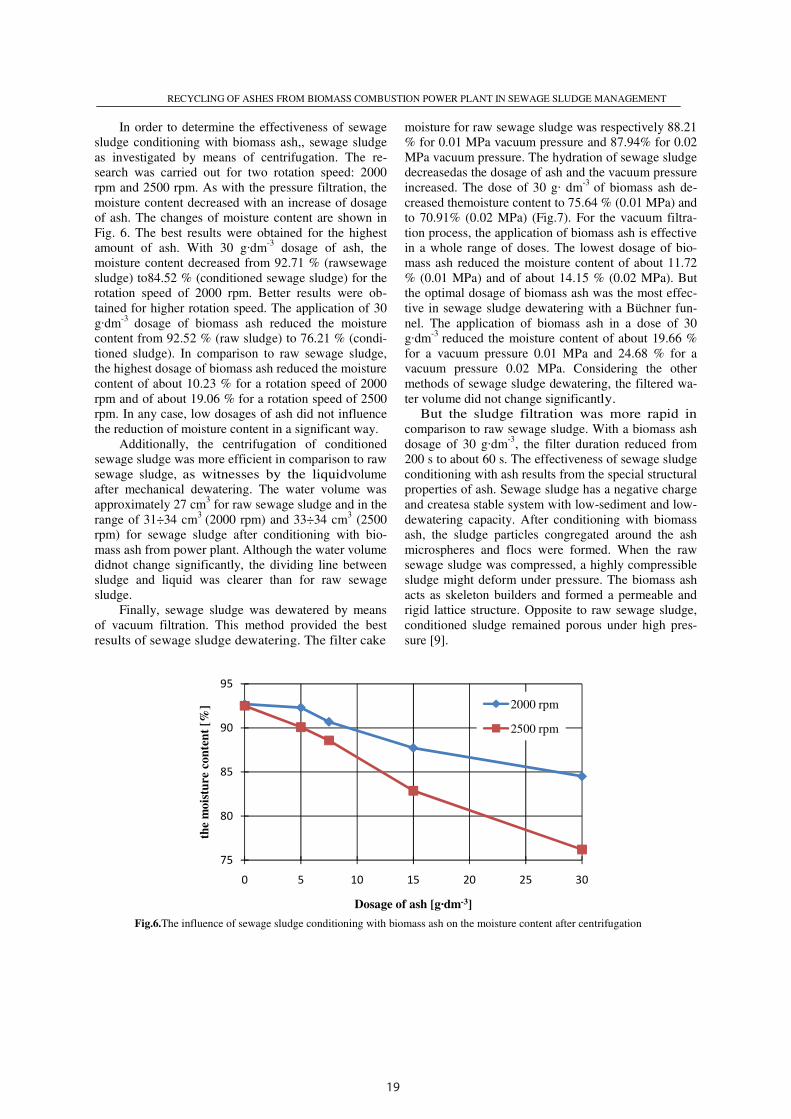
19
RECYCLING OF ASHES FROM BIOMASS COMBUSTION POWER PLANT IN SEWAGE SLUDGE MANAGEMENT
Fig. 4. The EDS analysis of biomass ash
Mechanical dewatering process was done
in a Büchner funnel and in a centrifuge. The sewage
sludge after conditioning was poured into: a Büchner
funnel, a pressure filter and centrifuge tubes. The vac-
uum filtration was done under 0.01 and 0.02 MPa vac-
uum pressure for about 15 minutes. Centrifugation
of sewage sludge was done for two rotation speeds:
2000 and 2500 rpm for 5 minutes in the laboratory cen-
trifuge after mechanical dewatering, the moisture con-
tent and CST were determined according to PN-EN
15934: 2013-02.CST was measured by means of CST
meter in accordance with PN-EN 147011:2007. In se-
wage sludge, the pH was analyzed with pH-meter
HACH HQ40d in line with PN-EN 15933: 2013-02.
3. Results and discussion
This study has shown different efficiencies in the im-
provement of sewage sludge dewatering, depending on
the amount of biomass ash. At the beginning, ash from biomass combustion in
the power plant was investigated as a conditioner. The
effectiveness of sludge conditioning was done by
means of CST measurement (ProLabTech). The ob-
tained results have shown that the biomass ash influ-
enced the improvement of sewage sludgedewatering
in a various ways. CST of raw sewage sludge was
130.89 s, showing the poor dewaterability. CST after
conditioning with the biomass ash in the highest dose
(30 g dm-3
) was 20.08s (Fig. 5a). The application of
biomass ash has resulted in the decline of CST in the
whole range of agent used. The best result was
achieved for a dose of 30 g·dm-3
and for this reason,
this amount of ash was considered as an optimal dos-
age. For the dosage of 30 g· dm-3
, CST was of about
84.66 % lower than for non-conditioned sewage
sludge. In comparison with commonly used polyelec-
trolytes, ash from biomass combustion in power plant
has a similar effectiveness as polyelectrolytes. The
research has shown that the application of cationic
polyelectrolyte 26508 VP in dose of 2 mg·(g d.m.)-1
reduced the CST value of about 83.19 % (from
149.21 s to 25.07 s).
Biomass ashes can be an effective reagent in sew-
age sludge hygienisation. pH for raw sewage sludge
was 6.40 and for sewage sludge after conditioning
with biomass ash in dosage of 30 g·dm-3
was 12.24
(Fig. 5b). The positive impact of biomass ash from
power plant on the growth of pH is connected with
the content of alkaline metals, such as: Ca, Mg and
Na. Thus, ash can be an effective reagent in sewage
sludge hygienisation.
Fig.5.The influence of sewage sludge conditioning with the biomass ash on CST (a) and on the pH of sewage sludge (b)
0
25
50
75
100
125
150
0 5 10 15 20 25 30
CS
T [
s]
Dosage of ash [g·dm-3]
6
7
8
9
10
11
12
13
0 5 10 15 20 25 30
pH
Dosage of ash [g·dm-3]a)
)
b)
)
RECYCLING OF ASHES FROM BIOMASS COMBUSTION POWER PLANT IN SEWAGE SLUDGE MANAGEMENT
In order to determine the effectiveness of sewage
sludge conditioning with biomass ash,, sewage sludge
as investigated by means of centrifugation. The re-
search was carried out for two rotation speed: 2000
rpm and 2500 rpm. As with the pressure filtration, the
moisture content decreased with an increase of dosage
of ash. The changes of moisture content are shown in
Fig. 6. The best results were obtained for the highest
amount of ash. With 30 g·dm-3
dosage of ash, the
moisture content decreased from 92.71 % (rawsewage
sludge) to84.52 % (conditioned sewage sludge) for the
rotation speed of 2000 rpm. Better results were ob-
tained for higher rotation speed. The application of 30
g·dm-3
dosage of biomass ash reduced the moisture
content from 92.52 % (raw sludge) to 76.21 % (condi-
tioned sludge). In comparison to raw sewage sludge,
the highest dosage of biomass ash reduced the moisture
content of about 10.23 % for a rotation speed of 2000
rpm and of about 19.06 % for a rotation speed of 2500
rpm. In any case, low dosages of ash did not influence
the reduction of moisture content in a significant way.
Additionally, the centrifugation of conditioned
sewage sludge was more efficient in comparison to raw
sewage sludge, as witnesses by the liquidvolume
after mechanical dewatering. The water volume was
approximately 27 cm3 for raw sewage sludge and in the
range of 31÷34 cm3
(2000 rpm) and 33÷34 cm3 (2500
rpm) for sewage sludge after conditioning with bio-
mass ash from power plant. Although the water volume
didnot change significantly, the dividing line between
sludge and liquid was clearer than for raw sewage
sludge.
Finally, sewage sludge was dewatered by means
of vacuum filtration. This method provided the best
results of sewage sludge dewatering. The filter cake
moisture for raw sewage sludge was respectively 88.21
% for 0.01 MPa vacuum pressure and 87.94% for 0.02
MPa vacuum pressure. The hydration of sewage sludge
decreasedas the dosage of ash and the vacuum pressure
increased. The dose of 30 g· dm-3
of biomass ash de-
creased themoisture content to 75.64 % (0.01 MPa) and
to 70.91% (0.02 MPa) (Fig.7). For the vacuum filtra-
tion process, the application of biomass ash is effective
in a whole range of doses. The lowest dosage of bio-
mass ash reduced the moisture content of about 11.72
% (0.01 MPa) and of about 14.15 % (0.02 MPa). But
the optimal dosage of biomass ash was the most effec-
tive in sewage sludge dewatering with a Büchner fun-
nel. The application of biomass ash in a dose of 30
g·dm-3
reduced the moisture content of about 19.66 %
for a vacuum pressure 0.01 MPa and 24.68 % for a
vacuum pressure 0.02 MPa. Considering the other
methods of sewage sludge dewatering, the filtered wa-
ter volume did not change significantly.
But the sludge filtration was more rapid in
comparison to raw sewage sludge. With a biomass ash
dosage of 30 g·dm-3
, the filter duration reduced from
200 s to about 60 s. The effectiveness of sewage sludge
conditioning with ash results from the special structural
properties of ash. Sewage sludge has a negative charge
and createsa stable system with low-sediment and low-
dewatering capacity. After conditioning with biomass
ash, the sludge particles congregated around the ash
microspheres and flocs were formed. When the raw
sewage sludge was compressed, a highly compressible
sludge might deform under pressure. The biomass ash
acts as skeleton builders and formed a permeable and
rigid lattice structure. Opposite to raw sewage sludge,
conditioned sludge remained porous under high pres-
sure [9].
Fig.6.The influence of sewage sludge conditioning with biomass ash on the moisture content after centrifugation
75
80
85
90
95
0 5 10 15 20 25 30
the
mois
ture
con
ten
t [%
]
Dosage of ash [g·dm-3]
2000 rpm
2500 rpm
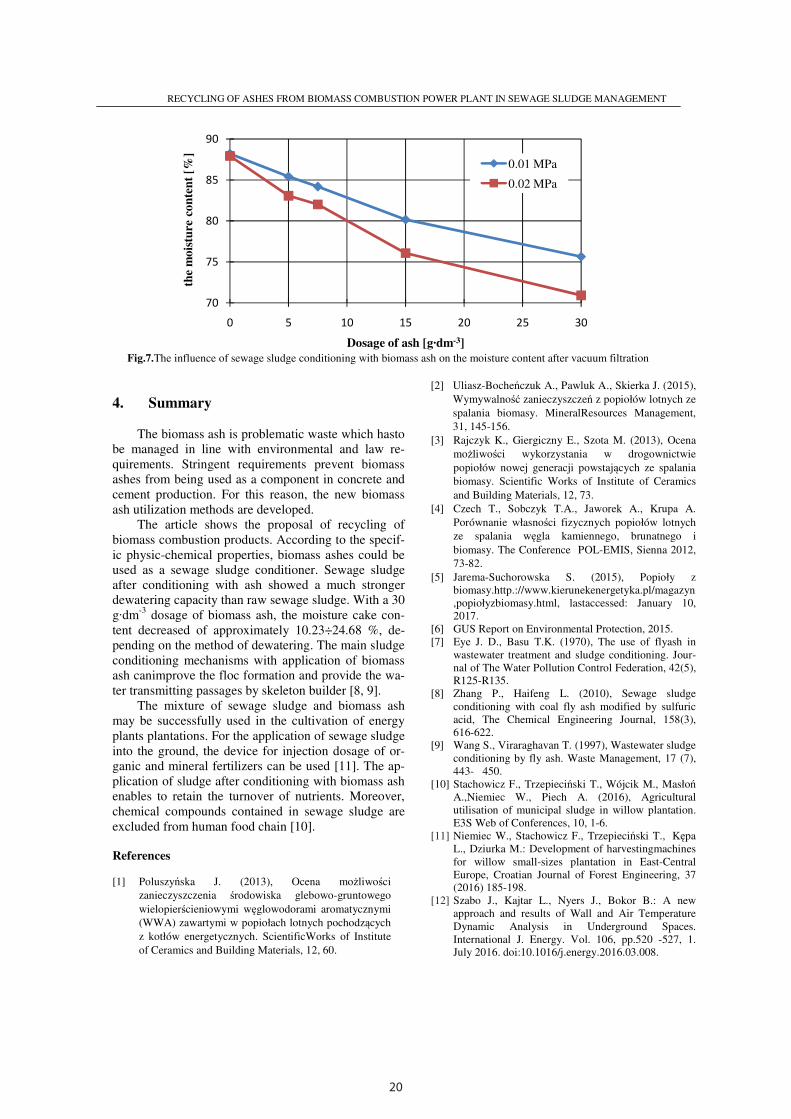
20
RECYCLING OF ASHES FROM BIOMASS COMBUSTION POWER PLANT IN SEWAGE SLUDGE MANAGEMENT
Fig.7.The influence of sewage sludge conditioning with biomass ash on the moisture content after vacuum filtration
4. Summary
The biomass ash is problematic waste which hasto
be managed in line with environmental and law re-
quirements. Stringent requirements prevent biomass
ashes from being used as a component in concrete and
cement production. For this reason, the new biomass
ash utilization methods are developed.
The article shows the proposal of recycling of
biomass combustion products. According to the specif-
ic physic-chemical properties, biomass ashes could be
used as a sewage sludge conditioner. Sewage sludge
after conditioning with ash showed a much stronger
dewatering capacity than raw sewage sludge. With a 30
g·dm-3
dosage of biomass ash, the moisture cake con-
tent decreased of approximately 10.23÷24.68 %, de-
pending on the method of dewatering. The main sludge
conditioning mechanisms with application of biomass
ash canimprove the floc formation and provide the wa-
ter transmitting passages by skeleton builder [8, 9].
The mixture of sewage sludge and biomass ash
may be successfully used in the cultivation of energy
plants plantations. For the application of sewage sludge
into the ground, the device for injection dosage of or-
ganic and mineral fertilizers can be used [11]. The ap-
plication of sludge after conditioning with biomass ash
enables to retain the turnover of nutrients. Moreover,
chemical compounds contained in sewage sludge are
excluded from human food chain [10].
References
[1] Poluszyńska J. (2013), Ocena możliwości
zanieczyszczenia środowiska glebowo-gruntowego
wielopierścieniowymi węglowodorami aromatycznymi
(WWA) zawartymi w popiołach lotnych pochodzących
z kotłów energetycznych. ScientificWorks of Institute
of Ceramics and Building Materials, 12, 60.
[2] Uliasz-Bocheńczuk A., Pawluk A., Skierka J. (2015),
Wymywalność zanieczyszczeń z popiołów lotnych ze
spalania biomasy. MineralResources Management,
31, 145-156.
[3] Rajczyk K., Giergiczny E., Szota M. (2013), Ocena
możliwości wykorzystania w drogownictwie
popiołów nowej generacji powstających ze spalania
biomasy. Scientific Works of Institute of Ceramics
and Building Materials, 12, 73.
[4] Czech T., Sobczyk T.A., Jaworek A., Krupa A.
Porównanie własności fizycznych popiołów lotnych
ze spalania węgla kamiennego, brunatnego i
biomasy. The Conference POL-EMIS, Sienna 2012,
73-82.
[5] Jarema-Suchorowska S. (2015), Popioły z
biomasy.http.://www.kierunekenergetyka.pl/magazyn
,popiołyzbiomasy.html, lastaccessed: January 10,
2017.
[6] GUS Report on Environmental Protection, 2015.
[7] Eye J. D., Basu T.K. (1970), The use of flyash in
wastewater treatment and sludge conditioning. Jour-
nal of The Water Pollution Control Federation, 42(5),
R125-R135.
[8] Zhang P., Haifeng L. (2010), Sewage sludge
conditioning with coal fly ash modified by sulfuric
acid, The Chemical Engineering Journal, 158(3),
616-622.
[9] Wang S., Viraraghavan T. (1997), Wastewater sludge
conditioning by fly ash. Waste Management, 17 (7),
443- 450.
[10] Stachowicz F., Trzepieciński T., Wójcik M., Masłoń
A.,Niemiec W., Piech A. (2016), Agricultural
utilisation of municipal sludge in willow plantation.
E3S Web of Conferences, 10, 1-6.
[11] Niemiec W., Stachowicz F., Trzepieciński T., Kępa
L., Dziurka M.: Development of harvestingmachines
for willow small-sizes plantation in East-Central
Europe, Croatian Journal of Forest Engineering, 37
(2016) 185-198.
[12] Szabo J., Kajtar L., Nyers J., Bokor B.: A new
approach and results of Wall and Air Temperature
Dynamic Analysis in Underground Spaces.
International J. Energy. Vol. 106, pp.520 -527, 1.
July 2016. doi:10.1016/j.energy.2016.03.008.
70
75
80
85
90
0 5 10 15 20 25 30
the
mois
ture
co
nte
nt
[%]
Dosage of ash [g·dm-3]
0.01 MPa
0.02 MPa
EXPRES 2017 ISBN 978-86-919769-1-0
Application of analogy of momentum and heat transfer at shell and tube condenser
O. MOLNARa, Z. ZSIGMOND
b
Department of Building Services and Process Engineering, Faculty of Mechanical Engineering,
Budapest University of Technology and Economics,
H-1111 Budapest, Műegyetem rkp. 3, Hungary aE-mail: [email protected] bE-mail: [email protected]
In environmental and chemical industry majority of processes are based on the simultaneous transfer of extensive properties.
These can be the heat, mass and momentum transfer. Because of the close relation of these transport phenomena, correlations
can be created between transport coefficients. These are the so-called transport analogies. In this paper relation of heat and
momentum transfer is studied. In order to perform the analysis, experimental investigations were made on a shell and tube
heat exchanger device. Goals of our work are to calculate tube side heat transfer coefficient and Nu number with formulas of
transport analogies; to validate them by measured data; to find reason of decreasing Nu number with increasing Re number in
the condenser at higher Re levels. Finally operation of the condenser is modelled by the analogy of heat and momentum
transfer.
Keywords: shell and tube heat exchanger, transport analogy, friction factor, heat transfer coefficient
1. Introduction
In environmental and chemical engineering
majority of processes are based on the
simultaneous transfer of extensive properties.
These can be the heat- mass- and momentum
transfer. Because of the close relation of these
transport phenomena, correlations can be created
among transport properties.
At the end of 19th
century Osborne
Reynolds was the first who recognized the
analogy between heat and momentum transfer
during his experimental investigation on rough
tubes. His observations resulted in the so-called
Reynolds analogy which describes the
connection between heat transfer coefficient and
friction factor [1, 2]:
= ∙ = ℎ = 2 (1)
Eq (1) is applicable for turbulent flow in a pipe
or over a flat plate when Pr is equal or close to
unity. This is a reasonable approximation for
many gases, but for liquids the Pr numbers are
much larger than 1. Therefore this analogy is not
appropriate for liquids.
Since applicability of the Reynolds analogy
is very limited, derivation of a more general
expression was necessary. In independent works
Ludwig Prandtl and Geoffry Ingram Taylor
modified the Reynolds analogy in the first half of
the 20th
century. A new formula was created
between heat transfer coefficient and friction
factor by combining the resistances of a viscous
sublayer where molecular effects dominate with
a turbulent outer layer where turbulent effects
control [1, 2]:
= ℎ =1 + 5 ( − 1) (2)
Prandtl-Taylor analogy can be applied in a wider
range, it allows Pr to differ from 1. Hence it is
applicable mainly in case of Pr smaller than 2
[1].
Theodore von Kármán (1881-1963)
extended Reynolds analogy even further by
including an intermittent boundary layer between
the viscous sublayer and the turbulent bulk.
Turbulent viscosity and turbulent heat
conductivity were determined from the universal
velocity profile. Thus the Kármán analogy is [1,
3]:
21
RECYCLING OF ASHES FROM BIOMASS COMBUSTION POWER PLANT IN SEWAGE SLUDGE MANAGEMENT
Fig.7.The influence of sewage sludge conditioning with biomass ash on the moisture content after vacuum filtration
4. Summary
The biomass ash is problematic waste which hasto
be managed in line with environmental and law re-
quirements. Stringent requirements prevent biomass
ashes from being used as a component in concrete and
cement production. For this reason, the new biomass
ash utilization methods are developed.
The article shows the proposal of recycling of
biomass combustion products. According to the specif-
ic physic-chemical properties, biomass ashes could be
used as a sewage sludge conditioner. Sewage sludge
after conditioning with ash showed a much stronger
dewatering capacity than raw sewage sludge. With a 30
g·dm-3
dosage of biomass ash, the moisture cake con-
tent decreased of approximately 10.23÷24.68 %, de-
pending on the method of dewatering. The main sludge
conditioning mechanisms with application of biomass
ash canimprove the floc formation and provide the wa-
ter transmitting passages by skeleton builder [8, 9].
The mixture of sewage sludge and biomass ash
may be successfully used in the cultivation of energy
plants plantations. For the application of sewage sludge
into the ground, the device for injection dosage of or-
ganic and mineral fertilizers can be used [11]. The ap-
plication of sludge after conditioning with biomass ash
enables to retain the turnover of nutrients. Moreover,
chemical compounds contained in sewage sludge are
excluded from human food chain [10].
References
[1] Poluszyńska J. (2013), Ocena możliwości
zanieczyszczenia środowiska glebowo-gruntowego
wielopierścieniowymi węglowodorami aromatycznymi
(WWA) zawartymi w popiołach lotnych pochodzących
z kotłów energetycznych. ScientificWorks of Institute
of Ceramics and Building Materials, 12, 60.
[2] Uliasz-Bocheńczuk A., Pawluk A., Skierka J. (2015),
Wymywalność zanieczyszczeń z popiołów lotnych ze
spalania biomasy. MineralResources Management,
31, 145-156.
[3] Rajczyk K., Giergiczny E., Szota M. (2013), Ocena
możliwości wykorzystania w drogownictwie
popiołów nowej generacji powstających ze spalania
biomasy. Scientific Works of Institute of Ceramics
and Building Materials, 12, 73.
[4] Czech T., Sobczyk T.A., Jaworek A., Krupa A.
Porównanie własności fizycznych popiołów lotnych
ze spalania węgla kamiennego, brunatnego i
biomasy. The Conference POL-EMIS, Sienna 2012,
73-82.
[5] Jarema-Suchorowska S. (2015), Popioły z
biomasy.http.://www.kierunekenergetyka.pl/magazyn
,popiołyzbiomasy.html, lastaccessed: January 10,
2017.
[6] GUS Report on Environmental Protection, 2015.
[7] Eye J. D., Basu T.K. (1970), The use of flyash in
wastewater treatment and sludge conditioning. Jour-
nal of The Water Pollution Control Federation, 42(5),
R125-R135.
[8] Zhang P., Haifeng L. (2010), Sewage sludge
conditioning with coal fly ash modified by sulfuric
acid, The Chemical Engineering Journal, 158(3),
616-622.
[9] Wang S., Viraraghavan T. (1997), Wastewater sludge
conditioning by fly ash. Waste Management, 17 (7),
443- 450.
[10] Stachowicz F., Trzepieciński T., Wójcik M., Masłoń
A.,Niemiec W., Piech A. (2016), Agricultural
utilisation of municipal sludge in willow plantation.
E3S Web of Conferences, 10, 1-6.
[11] Niemiec W., Stachowicz F., Trzepieciński T., Kępa
L., Dziurka M.: Development of harvestingmachines
for willow small-sizes plantation in East-Central
Europe, Croatian Journal of Forest Engineering, 37
(2016) 185-198.
[12] Szabo J., Kajtar L., Nyers J., Bokor B.: A new
approach and results of Wall and Air Temperature
Dynamic Analysis in Underground Spaces.
International J. Energy. Vol. 106, pp.520 -527, 1.
July 2016. doi:10.1016/j.energy.2016.03.008.
70
75
80
85
90
0 5 10 15 20 25 30
the
mois
ture
co
nte
nt
[%]
Dosage of ash [g·dm-3]
0.01 MPa
0.02 MPa
EXPRES 2017 ISBN 978-86-919769-1-0
Application of analogy of momentum and heat transfer at shell and tube condenser
O. MOLNARa, Z. ZSIGMOND
b
Department of Building Services and Process Engineering, Faculty of Mechanical Engineering,
Budapest University of Technology and Economics,
H-1111 Budapest, Műegyetem rkp. 3, Hungary aE-mail: [email protected] bE-mail: [email protected]
In environmental and chemical industry majority of processes are based on the simultaneous transfer of extensive properties.
These can be the heat, mass and momentum transfer. Because of the close relation of these transport phenomena, correlations
can be created between transport coefficients. These are the so-called transport analogies. In this paper relation of heat and
momentum transfer is studied. In order to perform the analysis, experimental investigations were made on a shell and tube
heat exchanger device. Goals of our work are to calculate tube side heat transfer coefficient and Nu number with formulas of
transport analogies; to validate them by measured data; to find reason of decreasing Nu number with increasing Re number in
the condenser at higher Re levels. Finally operation of the condenser is modelled by the analogy of heat and momentum
transfer.
Keywords: shell and tube heat exchanger, transport analogy, friction factor, heat transfer coefficient
1. Introduction
In environmental and chemical engineering
majority of processes are based on the
simultaneous transfer of extensive properties.
These can be the heat- mass- and momentum
transfer. Because of the close relation of these
transport phenomena, correlations can be created
among transport properties.
At the end of 19th
century Osborne
Reynolds was the first who recognized the
analogy between heat and momentum transfer
during his experimental investigation on rough
tubes. His observations resulted in the so-called
Reynolds analogy which describes the
connection between heat transfer coefficient and
friction factor [1, 2]:
= ∙ = ℎ = 2 (1)
Eq (1) is applicable for turbulent flow in a pipe
or over a flat plate when Pr is equal or close to
unity. This is a reasonable approximation for
many gases, but for liquids the Pr numbers are
much larger than 1. Therefore this analogy is not
appropriate for liquids.
Since applicability of the Reynolds analogy
is very limited, derivation of a more general
expression was necessary. In independent works
Ludwig Prandtl and Geoffry Ingram Taylor
modified the Reynolds analogy in the first half of
the 20th
century. A new formula was created
between heat transfer coefficient and friction
factor by combining the resistances of a viscous
sublayer where molecular effects dominate with
a turbulent outer layer where turbulent effects
control [1, 2]:
= ℎ =1 + 5 ( − 1) (2)
Prandtl-Taylor analogy can be applied in a wider
range, it allows Pr to differ from 1. Hence it is
applicable mainly in case of Pr smaller than 2
[1].
Theodore von Kármán (1881-1963)
extended Reynolds analogy even further by
including an intermittent boundary layer between
the viscous sublayer and the turbulent bulk.
Turbulent viscosity and turbulent heat
conductivity were determined from the universal
velocity profile. Thus the Kármán analogy is [1,
3]:
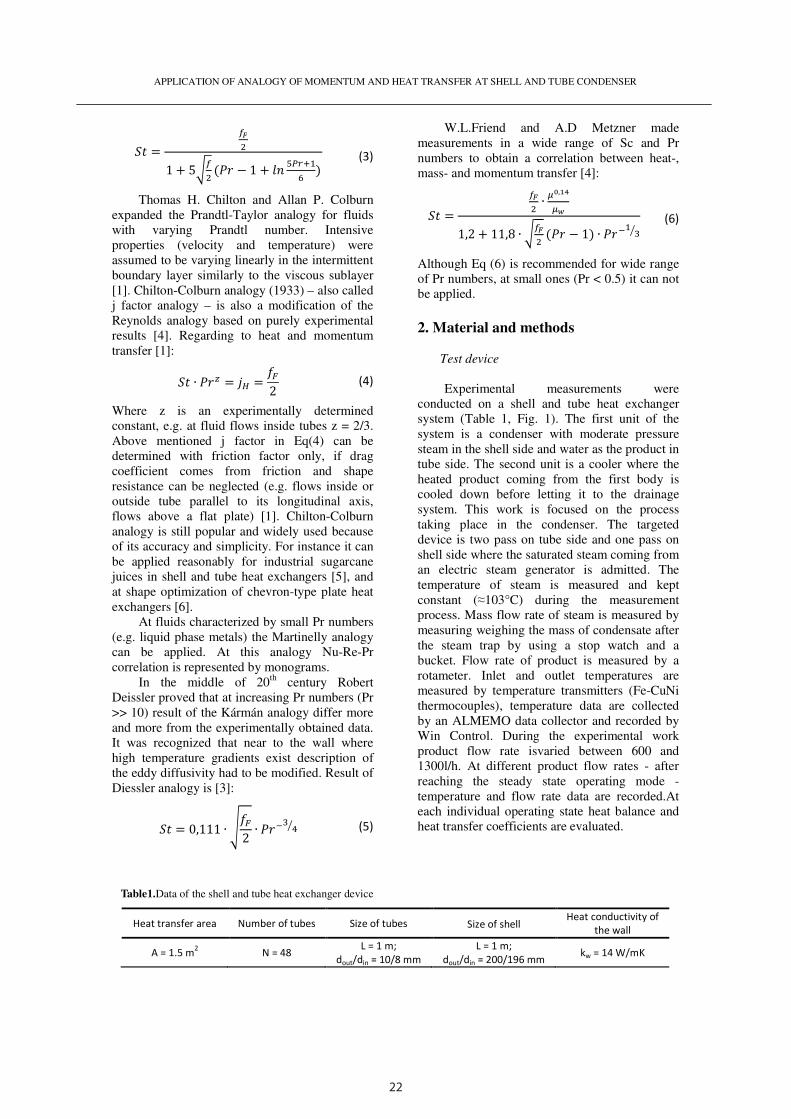
22
APPLICATION OF ANALOGY OF MOMENTUM AND HEAT TRANSFER AT SHELL AND TUBE CONDENSER
2
= 1 + 5 ( − 1 + ) (3)
Thomas H. Chilton and Allan P. Colburn
expanded the Prandtl-Taylor analogy for fluids
with varying Prandtl number. Intensive
properties (velocity and temperature) were
assumed to be varying linearly in the intermittent
boundary layer similarly to the viscous sublayer
[1]. Chilton-Colburn analogy (1933) – also called
j factor analogy – is also a modification of the
Reynolds analogy based on purely experimental
results [4]. Regarding to heat and momentum
transfer [1]:
∙ = = 2 (4)
Where z is an experimentally determined
constant, e.g. at fluid flows inside tubes z = 2/3.
Above mentioned j factor in Eq(4) can be
determined with friction factor only, if drag
coefficient comes from friction and shape
resistance can be neglected (e.g. flows inside or
outside tube parallel to its longitudinal axis,
flows above a flat plate) [1]. Chilton-Colburn
analogy is still popular and widely used because
of its accuracy and simplicity. For instance it can
be applied reasonably for industrial sugarcane
juices in shell and tube heat exchangers [5], and
at shape optimization of chevron-type plate heat
exchangers [6].
At fluids characterized by small Pr numbers
(e.g. liquid phase metals) the Martinelly analogy
can be applied. At this analogy Nu-Re-Pr
correlation is represented by monograms.
In the middle of 20th
century Robert
Deissler proved that at increasing Pr numbers (Pr
>> 10) result of the Kármán analogy differ more
and more from the experimentally obtained data.
It was recognized that near to the wall where
high temperature gradients exist description of
the eddy diffusivity had to be modified. Result of
Diessler analogy is [3]:
= 0,111 ∙ 2 ∙ (5)
W.L.Friend and A.D Metzner made
measurements in a wide range of Sc and Pr
numbers to obtain a correlation between heat-,
mass- and momentum transfer [4]:
= ∙ ,1,2 + 11,8 ∙ ( − 1) ∙ (6)
Although Eq (6) is recommended for wide range
of Pr numbers, at small ones (Pr < 0.5) it can not
be applied.
2. Material and methods
Test device
Experimental measurements were
conducted on a shell and tube heat exchanger
system (Table 1, Fig. 1). The first unit of the
system is a condenser with moderate pressure
steam in the shell side and water as the product in
tube side. The second unit is a cooler where the
heated product coming from the first body is
cooled down before letting it to the drainage
system. This work is focused on the process
taking place in the condenser. The targeted
device is two pass on tube side and one pass on
shell side where the saturated steam coming from
an electric steam generator is admitted. The
temperature of steam is measured and kept
constant (≈103°C) during the measurement
process. Mass flow rate of steam is measured by
measuring weighing the mass of condensate after
the steam trap by using a stop watch and a
bucket. Flow rate of product is measured by a
rotameter. Inlet and outlet temperatures are
measured by temperature transmitters (Fe-CuNi
thermocouples), temperature data are collected
by an ALMEMO data collector and recorded by
Win Control. During the experimental work
product flow rate isvaried between 600 and
1300l/h. At different product flow rates - after
reaching the steady state operating mode -
temperature and flow rate data are recorded.At
each individual operating state heat balance and
heat transfer coefficients are evaluated.
Table1.Data of the shell and tube heat exchanger device
Heat transfer area Number of tubes Size of tubes Size of shell Heat conductivity of
the wall
A = 1.5 m2 N = 48 L = 1 m; dout/din = 10/8 mm
L = 1 m; dout/din = 200/196 mm kw = 14 W/mK
APPLICATION OF ANALOGY OF MOMENTUM AND HEAT TRANSFER AT SHELL AND TUBE CONDENSER
3
Evaluation of heat transfer coefficient
There is sensible heat transfer in tube side,
while condensation on shell side in the first unit
of the device. The tube side heat transfer
coefficient can be determined from the next
equation:
ℎ = 1 − − (7)
The condensation heat transfer coefficient along
vertical tubs can be calculated by the next
correlation [7]:
ℎ = 1.47 ∙ ∙ ∙ ∙ (8)
In Eq (8) the Reynolds number of the
condensation film:
= 4 ∙ ∙ ∙ ∙ (9)
The overall heat transfer coefficient can be
calculated from the transferred heat flow rate and
the logarithmic temperature difference:
= ∆ ∙ (10)
The transferred heat is the average of deflated
and admitted heat:
= ∙ 2 (11)
Deflated heat flow rate by the steam on shell
side: = ∙ ∆ℎ (12)
Admitted heat flow rate by the product on tube
side [9, 10]: = ∙ ∙ ( − ) (13)
During the conducted series of experimental
measurements it was found that - contrary to
expectations - the tube side heat transfer
coefficient (and Nu number)at a distinct level of
Re numberdoes not continue increasing but
slightly decreases instead (at Tst ≈ 103°C, this
level is Re ≈ 4000) (Fig. 2). Just before thislevel
of Re number temperature of the condensate
measured at the outlet pipe of the shell side starts
strongly falling (Fig. 3). It can be suspected that
condensate does not leave the device due to
inappropriate installation and shell side becomes
flooded (Fig. 4). This phenomenon is realized
directly through the cut down of the condensate
temperature. To verify this hypothesis we turned
to transport analogies to simulate the operation of
the condenser.
Fig. 1. Flow chart of the test equipment
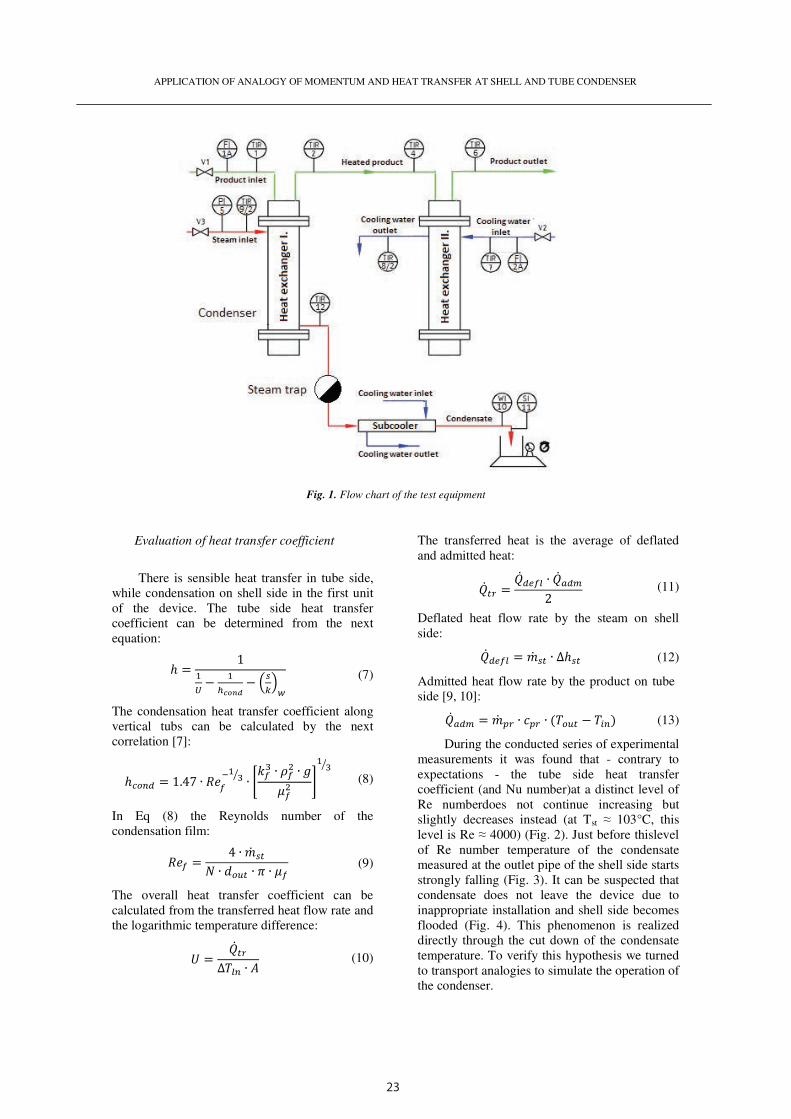
23
APPLICATION OF ANALOGY OF MOMENTUM AND HEAT TRANSFER AT SHELL AND TUBE CONDENSER
2
= 1 + 5 ( − 1 + ) (3)
Thomas H. Chilton and Allan P. Colburn
expanded the Prandtl-Taylor analogy for fluids
with varying Prandtl number. Intensive
properties (velocity and temperature) were
assumed to be varying linearly in the intermittent
boundary layer similarly to the viscous sublayer
[1]. Chilton-Colburn analogy (1933) – also called
j factor analogy – is also a modification of the
Reynolds analogy based on purely experimental
results [4]. Regarding to heat and momentum
transfer [1]:
∙ = = 2 (4)
Where z is an experimentally determined
constant, e.g. at fluid flows inside tubes z = 2/3.
Above mentioned j factor in Eq(4) can be
determined with friction factor only, if drag
coefficient comes from friction and shape
resistance can be neglected (e.g. flows inside or
outside tube parallel to its longitudinal axis,
flows above a flat plate) [1]. Chilton-Colburn
analogy is still popular and widely used because
of its accuracy and simplicity. For instance it can
be applied reasonably for industrial sugarcane
juices in shell and tube heat exchangers [5], and
at shape optimization of chevron-type plate heat
exchangers [6].
At fluids characterized by small Pr numbers
(e.g. liquid phase metals) the Martinelly analogy
can be applied. At this analogy Nu-Re-Pr
correlation is represented by monograms.
In the middle of 20th
century Robert
Deissler proved that at increasing Pr numbers (Pr
>> 10) result of the Kármán analogy differ more
and more from the experimentally obtained data.
It was recognized that near to the wall where
high temperature gradients exist description of
the eddy diffusivity had to be modified. Result of
Diessler analogy is [3]:
= 0,111 ∙ 2 ∙ (5)
W.L.Friend and A.D Metzner made
measurements in a wide range of Sc and Pr
numbers to obtain a correlation between heat-,
mass- and momentum transfer [4]:
= ∙ ,1,2 + 11,8 ∙ ( − 1) ∙ (6)
Although Eq (6) is recommended for wide range
of Pr numbers, at small ones (Pr < 0.5) it can not
be applied.
2. Material and methods
Test device
Experimental measurements were
conducted on a shell and tube heat exchanger
system (Table 1, Fig. 1). The first unit of the
system is a condenser with moderate pressure
steam in the shell side and water as the product in
tube side. The second unit is a cooler where the
heated product coming from the first body is
cooled down before letting it to the drainage
system. This work is focused on the process
taking place in the condenser. The targeted
device is two pass on tube side and one pass on
shell side where the saturated steam coming from
an electric steam generator is admitted. The
temperature of steam is measured and kept
constant (≈103°C) during the measurement
process. Mass flow rate of steam is measured by
measuring weighing the mass of condensate after
the steam trap by using a stop watch and a
bucket. Flow rate of product is measured by a
rotameter. Inlet and outlet temperatures are
measured by temperature transmitters (Fe-CuNi
thermocouples), temperature data are collected
by an ALMEMO data collector and recorded by
Win Control. During the experimental work
product flow rate isvaried between 600 and
1300l/h. At different product flow rates - after
reaching the steady state operating mode -
temperature and flow rate data are recorded.At
each individual operating state heat balance and
heat transfer coefficients are evaluated.
Table1.Data of the shell and tube heat exchanger device
Heat transfer area Number of tubes Size of tubes Size of shell Heat conductivity of
the wall
A = 1.5 m2 N = 48 L = 1 m; dout/din = 10/8 mm
L = 1 m; dout/din = 200/196 mm kw = 14 W/mK
APPLICATION OF ANALOGY OF MOMENTUM AND HEAT TRANSFER AT SHELL AND TUBE CONDENSER
3
Evaluation of heat transfer coefficient
There is sensible heat transfer in tube side,
while condensation on shell side in the first unit
of the device. The tube side heat transfer
coefficient can be determined from the next
equation:
ℎ = 1 − − (7)
The condensation heat transfer coefficient along
vertical tubs can be calculated by the next
correlation [7]:
ℎ = 1.47 ∙ ∙ ∙ ∙ (8)
In Eq (8) the Reynolds number of the
condensation film:
= 4 ∙ ∙ ∙ ∙ (9)
The overall heat transfer coefficient can be
calculated from the transferred heat flow rate and
the logarithmic temperature difference:
= ∆ ∙ (10)
The transferred heat is the average of deflated
and admitted heat:
= ∙ 2 (11)
Deflated heat flow rate by the steam on shell
side: = ∙ ∆ℎ (12)
Admitted heat flow rate by the product on tube
side [9, 10]: = ∙ ∙ ( − ) (13)
During the conducted series of experimental
measurements it was found that - contrary to
expectations - the tube side heat transfer
coefficient (and Nu number)at a distinct level of
Re numberdoes not continue increasing but
slightly decreases instead (at Tst ≈ 103°C, this
level is Re ≈ 4000) (Fig. 2). Just before thislevel
of Re number temperature of the condensate
measured at the outlet pipe of the shell side starts
strongly falling (Fig. 3). It can be suspected that
condensate does not leave the device due to
inappropriate installation and shell side becomes
flooded (Fig. 4). This phenomenon is realized
directly through the cut down of the condensate
temperature. To verify this hypothesis we turned
to transport analogies to simulate the operation of
the condenser.
Fig. 1. Flow chart of the test equipment
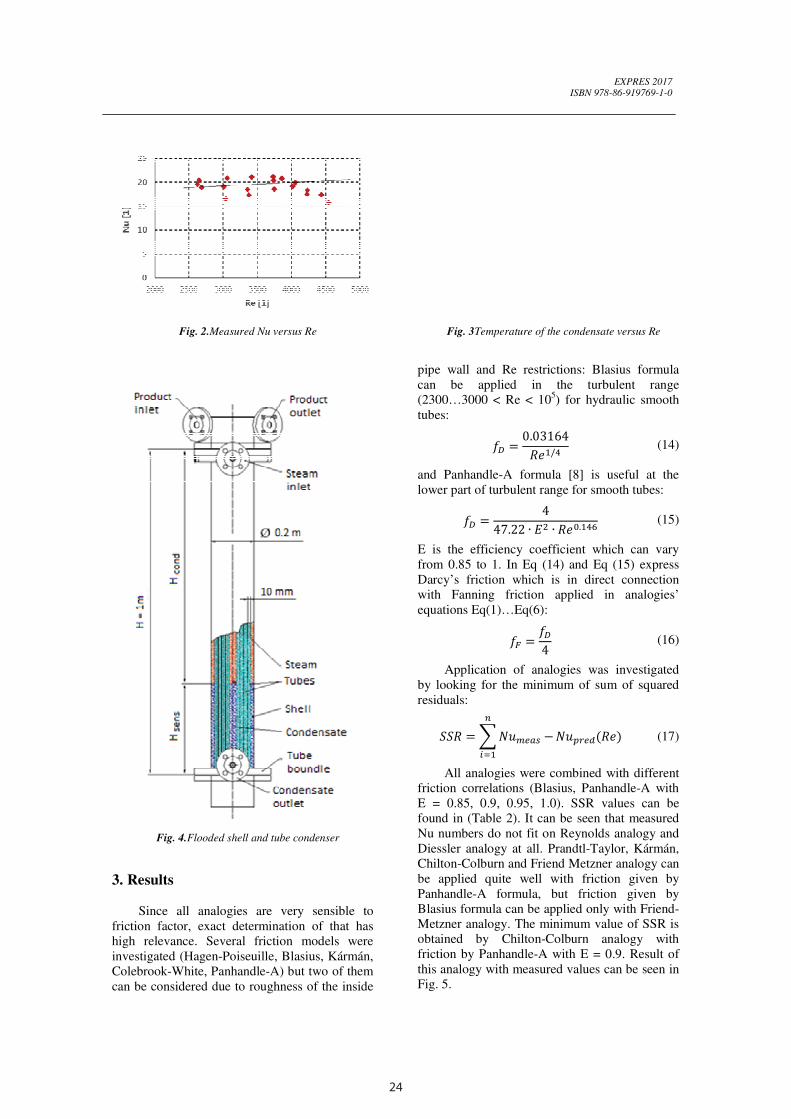
24
EXPRES 2017 ISBN 978-86-919769-1-0
3. Results
Since all analogies are very sensible to
friction factor, exact determination of that has
high relevance. Several friction models were
investigated (Hagen-Poiseuille, Blasius, Kármán,
Colebrook-White, Panhandle-A) but two of them
can be considered due to roughness of the inside
pipe wall and Re restrictions: Blasius formula
can be applied in the turbulent range
(2300…3000 < Re < 105) for hydraulic smooth
tubes:
= 0.03164/ (14)
and Panhandle-A formula [8] is useful at the
lower part of turbulent range for smooth tubes:
= 447.22 ∙ ∙ . (15)
E is the efficiency coefficient which can vary
from 0.85 to 1. In Eq (14) and Eq (15) express
Darcy’s friction which is in direct connection
with Fanning friction applied in analogies’
equations Eq(1)…Eq(6):
= 4 (16)
Application of analogies was investigated
by looking for the minimum of sum of squared
residuals:
= − () (17)
All analogies were combined with different
friction correlations (Blasius, Panhandle-A with
E = 0.85, 0.9, 0.95, 1.0). SSR values can be
found in (Table 2). It can be seen that measured
Nu numbers do not fit on Reynolds analogy and
Diessler analogy at all. Prandtl-Taylor, Kármán,
Chilton-Colburn and Friend Metzner analogy can
be applied quite well with friction given by
Panhandle-A formula, but friction given by
Blasius formula can be applied only with Friend-
Metzner analogy. The minimum value of SSR is
obtained by Chilton-Colburn analogy with
friction by Panhandle-A with E = 0.9. Result of
this analogy with measured values can be seen in
Fig. 5.
Fig. 4.Flooded shell and tube condenser
Fig. 3Temperature of the condensate versus Re
Fig. 2.Measured Nu versus Re
APPLICATION OF ANALOGY OF MOMENTUM AND HEAT TRANSFER AT SHELL AND TUBE CONDENSER
5
Table 2. SSR values of the analogies with different
friction formulas
REYNOLDS ANALOGY with
Blasius Pan-A(E=0,85)
Pan-A (E=0,9)
Pan-A (E=0,95)
Pan-A (E=1)
741,7 437,6 277,0 170,3 100,4
PRANDTL-TAYLOR ANALOGY with
Blasius Pan-A (E=0,85)
Pan-A (E=0,9)
Pan-A (E=0,95)
Pan-A (E=1)
102,9 49,3 24,4 11,6 7,0
KARMAN ANALOGY with
Blasius Pan-A (E=0,85)
Pan-A (E=0,9)
Pan-A (E=0,95)
Pan-A (E=1)
31,7 12,7 7,1 7,7 12,7
CHILTON-COLBURN ANALOGY with
Blasius Pan-A (E=0,85)
Pan-A (E=0,9)
Pan-A (E=0,95)
Pan-A (E=1)
30,0 8,9 6,7 12,8 23,9
DEISSLER ANALOGY with
Blasius Pan-A(E=0,85)
Pan-A (E=0,9)
Pan-A (E=0,95)
Pan-A (E=1)
237,5 169,2 127,0 94,6 69,8
FRIEND-METZNER ANALOGY with
Blasius Pan-A (E=0,85)
Pan-A (E=0,9)
Pan-A (E=0,95)
Pan-A (E=1)
8,8 7,2 11,7 19,9 30,3
At Re > 4000 the measured heat transfer
coefficients and Nu numbers start falling because
of suspected reduction of condensation heat
transfer area of the device which is probably
caused by condensate retention. Due to
inadequate condensate drainage in the bottom of
the heat exchanger there is sensible heat transfer
instead of condensation (Fig. 4). At Re > 4000
modified heat transfer area can be calculated
from the predicted heat transfer coefficient from
the Chilton-Colburn analogy by Eq (18) and Eq
(19). The predicted condensate level is
represented in Fig. 6.
′ = 1 + + (18)
′ = ∆ ∙ ′ (19)
4. Conclusion
Several analogies of heat and momentum
transfer can be applied quite well at shell and
tube heat exchanger. Since all analogies are very
sensible on friction coefficient, determination of
its exact value needs further investigations.
Inappropriate operation of the condenser could
be modeled successfully. Installation of a
condensate pump in the system is recommended
to prevent flooding of the shell (Fig.6).
Fig. 6.Installation of a condensate pump in the system
Fig. 6.Condensate level in the shell at large Re range
Fig. 5.Measured and predicted (by Chilton-Colburn
analogy) Nu versus Re
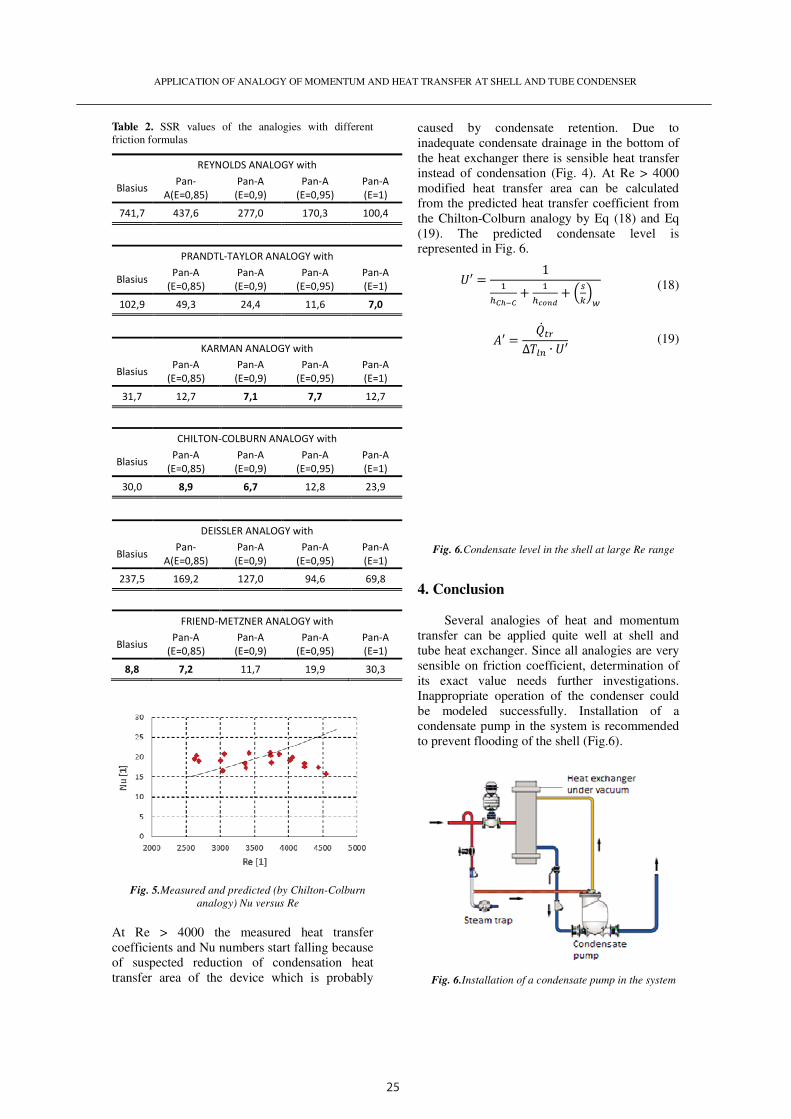
25
EXPRES 2017 ISBN 978-86-919769-1-0
3. Results
Since all analogies are very sensible to
friction factor, exact determination of that has
high relevance. Several friction models were
investigated (Hagen-Poiseuille, Blasius, Kármán,
Colebrook-White, Panhandle-A) but two of them
can be considered due to roughness of the inside
pipe wall and Re restrictions: Blasius formula
can be applied in the turbulent range
(2300…3000 < Re < 105) for hydraulic smooth
tubes:
= 0.03164/ (14)
and Panhandle-A formula [8] is useful at the
lower part of turbulent range for smooth tubes:
= 447.22 ∙ ∙ . (15)
E is the efficiency coefficient which can vary
from 0.85 to 1. In Eq (14) and Eq (15) express
Darcy’s friction which is in direct connection
with Fanning friction applied in analogies’
equations Eq(1)…Eq(6):
= 4 (16)
Application of analogies was investigated
by looking for the minimum of sum of squared
residuals:
= − () (17)
All analogies were combined with different
friction correlations (Blasius, Panhandle-A with
E = 0.85, 0.9, 0.95, 1.0). SSR values can be
found in (Table 2). It can be seen that measured
Nu numbers do not fit on Reynolds analogy and
Diessler analogy at all. Prandtl-Taylor, Kármán,
Chilton-Colburn and Friend Metzner analogy can
be applied quite well with friction given by
Panhandle-A formula, but friction given by
Blasius formula can be applied only with Friend-
Metzner analogy. The minimum value of SSR is
obtained by Chilton-Colburn analogy with
friction by Panhandle-A with E = 0.9. Result of
this analogy with measured values can be seen in
Fig. 5.
Fig. 4.Flooded shell and tube condenser
Fig. 3Temperature of the condensate versus Re
Fig. 2.Measured Nu versus Re
APPLICATION OF ANALOGY OF MOMENTUM AND HEAT TRANSFER AT SHELL AND TUBE CONDENSER
5
Table 2. SSR values of the analogies with different
friction formulas
REYNOLDS ANALOGY with
Blasius Pan-A(E=0,85)
Pan-A (E=0,9)
Pan-A (E=0,95)
Pan-A (E=1)
741,7 437,6 277,0 170,3 100,4
PRANDTL-TAYLOR ANALOGY with
Blasius Pan-A (E=0,85)
Pan-A (E=0,9)
Pan-A (E=0,95)
Pan-A (E=1)
102,9 49,3 24,4 11,6 7,0
KARMAN ANALOGY with
Blasius Pan-A (E=0,85)
Pan-A (E=0,9)
Pan-A (E=0,95)
Pan-A (E=1)
31,7 12,7 7,1 7,7 12,7
CHILTON-COLBURN ANALOGY with
Blasius Pan-A (E=0,85)
Pan-A (E=0,9)
Pan-A (E=0,95)
Pan-A (E=1)
30,0 8,9 6,7 12,8 23,9
DEISSLER ANALOGY with
Blasius Pan-A(E=0,85)
Pan-A (E=0,9)
Pan-A (E=0,95)
Pan-A (E=1)
237,5 169,2 127,0 94,6 69,8
FRIEND-METZNER ANALOGY with
Blasius Pan-A (E=0,85)
Pan-A (E=0,9)
Pan-A (E=0,95)
Pan-A (E=1)
8,8 7,2 11,7 19,9 30,3
At Re > 4000 the measured heat transfer
coefficients and Nu numbers start falling because
of suspected reduction of condensation heat
transfer area of the device which is probably
caused by condensate retention. Due to
inadequate condensate drainage in the bottom of
the heat exchanger there is sensible heat transfer
instead of condensation (Fig. 4). At Re > 4000
modified heat transfer area can be calculated
from the predicted heat transfer coefficient from
the Chilton-Colburn analogy by Eq (18) and Eq
(19). The predicted condensate level is
represented in Fig. 6.
′ = 1 + + (18)
′ = ∆ ∙ ′ (19)
4. Conclusion
Several analogies of heat and momentum
transfer can be applied quite well at shell and
tube heat exchanger. Since all analogies are very
sensible on friction coefficient, determination of
its exact value needs further investigations.
Inappropriate operation of the condenser could
be modeled successfully. Installation of a
condensate pump in the system is recommended
to prevent flooding of the shell (Fig.6).
Fig. 6.Installation of a condensate pump in the system
Fig. 6.Condensate level in the shell at large Re range
Fig. 5.Measured and predicted (by Chilton-Colburn
analogy) Nu versus Re

26
APPLICATION OF ANALOGY OF MOMENTUM AND HEAT TRANSFER AT SHELL AND TUBE CONDENSER
6
Nomenclature
A [m2] surface
c [J/kgK] specific heat
d [m] diameter
E [1] hydraulic efficiency coefficient
f [1] friction factor
g [m/s2] gravitational acceleration
h [W/m2K] heat transfer coefficient
∆h [J/kg] heat of condensation
H [m] height
j [1] colburn factor
k [W/mK] heat conductivity
L [m] length [kg/s] mass flow rate
N [1] number of tubes
Nu [1] Nusselt number
Pr [1] Prandtl number [J/s] heat flow rate
Re [1] Reynolds number
s [m] wall thickness
SSR [1] sum of squared residuals
St [1] Stanton number
T [°C] temperature
∆T [°C] temperature difference
U [W/m2K] overall heat transfer coefficient
z [1] constant
µ [kg/ms] dynamic viscosity
ν [m2/s] kinematic viscosity
ρ [kg/m3] density
subscripts:
adm admitted
Ch-C Chilton-Colburn
cond condensation
D Darcy’s
defl deflated
F Fanning
f condensate film
H heat transfer
in inside/inlet
ln logarithmic
meas measured
out outside/outlet
p at constant pressure
pr product
pred predicted
s steam
sens sensible
tr transferred
w wall
References
[1] S. Szentgyörgyi, K. Molnár, M. Parti: Transzport
folyamatok, Tankönyvkiadó, Budapest (1986)
[2] E.U. Schündler: Analogy between heat and
momentum transfer, Chemical Engineering and
Processing, Vol.37 (1998), pp.103-107
[3] R.G. Deissler: Analysis of turbulent heat transfer,
mass transfer and friction in smooth tubes at high
Prandtl and Schmidt numbers – Lewis Flight
Propulsion Laboratory (1954)
[4] R.S. Brodkey, H.C. Hershey: Transport Phenomena:
A unified approach, McGraw-Hill Chemical
Engineering Series (1988)
[5] Z. Astolfi-Filho, E.B. de Oliveira: Friction factors,
convective heat transfer coefficients and the
Colburn analogy for industrial sugarcane juices,
Biochemical Engineering Journal, Vol.60 (2012),
pp.111-118
[6] L. Jonghyeok, L. Kwan-Soo: Friction and Colburn
factor correlations and shape optimization of
chevron-type plate heat exchangers, Applied
Thermal Engineering, Vol.89 (2015), pp.62-69
[7] T. Környei: Hőátvitel, Műegyetemi Kiadó, (1999)
[8] L. Tihanyi: A gázhálózati modellek kulcsparaméter,
Kőolaj és Földgáz Vol.35 No.7-8, (2002)
[9] J. Nyers, L. Garbai, A. Nyers: Analysis of Heat
Pump's Condenser Performance by means of
Mathematical Model, International J. Acta
Polytechnica Hungarica Vol. 11, No. 3, pp.139-
152, 2014. DOI: 10.12700/APH.11.03.2014.03.9.
[10] J. Nyers, L. Garbai, A. Nyers: A modified
mathematical model of heat pump's condenser for
analytical optimization, International J. Energy,
Vol. 80, pp. 706-714, 1 February 2015.
DOI:10.1016/j.energy.2014.12.028.
EXPRES 2017
ISBN 978-86-919769-1-0
Performance of heat pump's condenser in heating process
J. NYERS a, A. NYERS b
aObuda UniversityBudapest, Hungarye-mail:[email protected]
University BME, Budapest, Hugary e-mail:[email protected] The general aim of article is to analyze in wide range the behavior of performance of heat pump's plate condenser depending on
theexternal impacts. The external impacts are the inlet temperature of hot water, the hydraulic resistance of hot water circuit, the
powerof circulation pump, the surface dimension of condenser.The additional practical goal is to find the quasi-optimal power of
circulation pump to obtain the near maximum performance of condenser as a function of resistance to flow in the hot water
circuitand dimension of condenser.
The performance of condenser is the quantity of heat exchanged inside the condenser between the refrigerant and the hot water. The
analysis of performance and quasi-optimization is done using the non-linear lumped parameter mathematical model.
Themathematical model includes equations of heat transfer between the hot water and the refrigerant inside the condenser, the
power of circulation pump, the hydraulic resistance in hot water circuit.Mathematical model of condenser is divided into a section
ofsuperheated steam cooling and a section of saturation steam condensation of refrigerant.
In order to solve the mathematical model, who is consist of nonlinear algebraic equation system, the Newton-Taylor linearization
and Gauss elimination method has been applied.
By simulation obtained numerical results in two or three-dimensional graphics are presented.
Keywords:condenser, heat pump, quasi optimization,circulation pump, mathematicalmodel.
1. Introduction
In the scientific journals many articles deal with the
research of heat pumps in stationary regime using
various lumped parameter mathematical models.
Most of the mathematical models contain the main
four components including the condenser, as well.
Research of all reviewed articles focused on the
behavior of complete system rather than individual
components, such as the condenser.
In the enclosed article, research has focused on
investigating the performance of condenser as a
function of external impacts. The performance of
condenser represents the efficiency and the quantity
of heat transferred between the hot water and the
refrigerant inside the condenser. In the analyzed
system the external impacts are the power of
circulation pump, the inlet temperature of hot water,
the hydraulic resistance in hot water circuit, the
surface dimension of condenser. The hydraulic
resistance of hot water circuit is expressed in
measurable parameter of the system, in the pressure
drop.
The general aim of the investigation is to analyze in
wide range the behavior of performance of heat
pump's plate condenser.
The proposed procedure provides the analyze of
influence of above-mentioned four external impacts
on the performance of condenser.
The most influential external impact on the
performance of condenser is the inlet temperature of
hot water. If the inlet temperature is changed in the
range 21-50 °C then causes the increment of
performance of condenser for 17 kW.
The least impact on the performance of condenser
produces the hydraulic characteristics of hot water
circuit. Increases the power of circulation pump from
21-310 W hardly enhances the performance of
condenser only for 1 kW. From the above data it follows that the best
improvement of performance of condenser is achieved
with increasing the surface of heating bodies in the hot
water circuit. Advisable to apply panel heating bodies
instead radiators. Panels consist of pipe packages in the
floor, wall and ceiling and have a significantly higher
heating surfaces from the radiators, with that the inlet
temperature of hot water for heating decreases and
increases the performance of condenser. Increasing the
power of circulation pump very poorly enhances the
performance of condenser.
The additional practical goal is to find the quasi-optimal
power of circulation pump.The quasi-optimal
powerprovides the near maximum performance of
condenser at the defined hydraulic resistance of hot
water circuit and the defined dimension of condenser.
The theoretical optimum power of circulation pump is in
infinity.
Upper statement can to confirm the results of attached
simulations. With increasing the power of circulation
pump the performance of condenser at the beginning
exponentially but later slow monotonically increases and
in the infinity reaches maximum.
In practice, to the end of exponential increasing of
performance it makes sense to increase the power of
circulation pump. In this point are the quasi-optimal
power of circulation pump and the near maximum
performance of condenser.
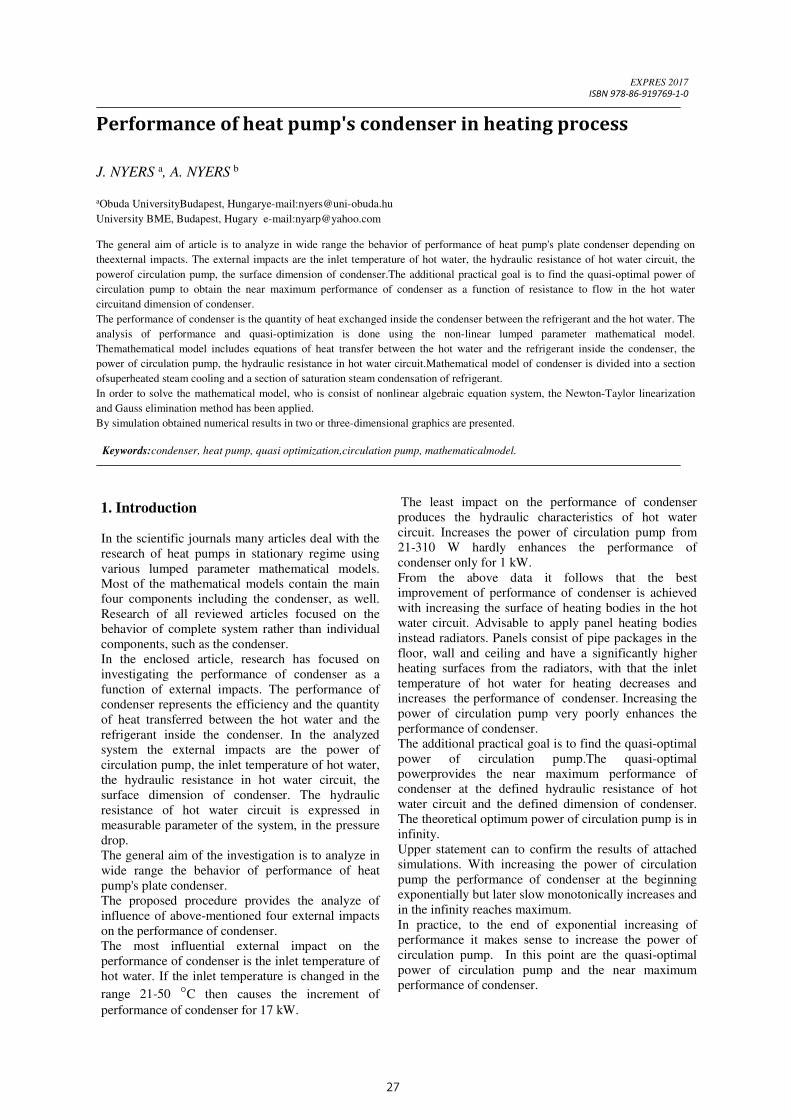
27
APPLICATION OF ANALOGY OF MOMENTUM AND HEAT TRANSFER AT SHELL AND TUBE CONDENSER
6
Nomenclature
A [m2] surface
c [J/kgK] specific heat
d [m] diameter
E [1] hydraulic efficiency coefficient
f [1] friction factor
g [m/s2] gravitational acceleration
h [W/m2K] heat transfer coefficient
∆h [J/kg] heat of condensation
H [m] height
j [1] colburn factor
k [W/mK] heat conductivity
L [m] length [kg/s] mass flow rate
N [1] number of tubes
Nu [1] Nusselt number
Pr [1] Prandtl number [J/s] heat flow rate
Re [1] Reynolds number
s [m] wall thickness
SSR [1] sum of squared residuals
St [1] Stanton number
T [°C] temperature
∆T [°C] temperature difference
U [W/m2K] overall heat transfer coefficient
z [1] constant
µ [kg/ms] dynamic viscosity
ν [m2/s] kinematic viscosity
ρ [kg/m3] density
subscripts:
adm admitted
Ch-C Chilton-Colburn
cond condensation
D Darcy’s
defl deflated
F Fanning
f condensate film
H heat transfer
in inside/inlet
ln logarithmic
meas measured
out outside/outlet
p at constant pressure
pr product
pred predicted
s steam
sens sensible
tr transferred
w wall
References
[1] S. Szentgyörgyi, K. Molnár, M. Parti: Transzport
folyamatok, Tankönyvkiadó, Budapest (1986)
[2] E.U. Schündler: Analogy between heat and
momentum transfer, Chemical Engineering and
Processing, Vol.37 (1998), pp.103-107
[3] R.G. Deissler: Analysis of turbulent heat transfer,
mass transfer and friction in smooth tubes at high
Prandtl and Schmidt numbers – Lewis Flight
Propulsion Laboratory (1954)
[4] R.S. Brodkey, H.C. Hershey: Transport Phenomena:
A unified approach, McGraw-Hill Chemical
Engineering Series (1988)
[5] Z. Astolfi-Filho, E.B. de Oliveira: Friction factors,
convective heat transfer coefficients and the
Colburn analogy for industrial sugarcane juices,
Biochemical Engineering Journal, Vol.60 (2012),
pp.111-118
[6] L. Jonghyeok, L. Kwan-Soo: Friction and Colburn
factor correlations and shape optimization of
chevron-type plate heat exchangers, Applied
Thermal Engineering, Vol.89 (2015), pp.62-69
[7] T. Környei: Hőátvitel, Műegyetemi Kiadó, (1999)
[8] L. Tihanyi: A gázhálózati modellek kulcsparaméter,
Kőolaj és Földgáz Vol.35 No.7-8, (2002)
[9] J. Nyers, L. Garbai, A. Nyers: Analysis of Heat
Pump's Condenser Performance by means of
Mathematical Model, International J. Acta
Polytechnica Hungarica Vol. 11, No. 3, pp.139-
152, 2014. DOI: 10.12700/APH.11.03.2014.03.9.
[10] J. Nyers, L. Garbai, A. Nyers: A modified
mathematical model of heat pump's condenser for
analytical optimization, International J. Energy,
Vol. 80, pp. 706-714, 1 February 2015.
DOI:10.1016/j.energy.2014.12.028.
EXPRES 2017
ISBN 978-86-919769-1-0
Performance of heat pump's condenser in heating process
J. NYERS a, A. NYERS b
aObuda UniversityBudapest, Hungarye-mail:[email protected]
University BME, Budapest, Hugary e-mail:[email protected] The general aim of article is to analyze in wide range the behavior of performance of heat pump's plate condenser depending on
theexternal impacts. The external impacts are the inlet temperature of hot water, the hydraulic resistance of hot water circuit, the
powerof circulation pump, the surface dimension of condenser.The additional practical goal is to find the quasi-optimal power of
circulation pump to obtain the near maximum performance of condenser as a function of resistance to flow in the hot water
circuitand dimension of condenser.
The performance of condenser is the quantity of heat exchanged inside the condenser between the refrigerant and the hot water. The
analysis of performance and quasi-optimization is done using the non-linear lumped parameter mathematical model.
Themathematical model includes equations of heat transfer between the hot water and the refrigerant inside the condenser, the
power of circulation pump, the hydraulic resistance in hot water circuit.Mathematical model of condenser is divided into a section
ofsuperheated steam cooling and a section of saturation steam condensation of refrigerant.
In order to solve the mathematical model, who is consist of nonlinear algebraic equation system, the Newton-Taylor linearization
and Gauss elimination method has been applied.
By simulation obtained numerical results in two or three-dimensional graphics are presented.
Keywords:condenser, heat pump, quasi optimization,circulation pump, mathematicalmodel.
1. Introduction
In the scientific journals many articles deal with the
research of heat pumps in stationary regime using
various lumped parameter mathematical models.
Most of the mathematical models contain the main
four components including the condenser, as well.
Research of all reviewed articles focused on the
behavior of complete system rather than individual
components, such as the condenser.
In the enclosed article, research has focused on
investigating the performance of condenser as a
function of external impacts. The performance of
condenser represents the efficiency and the quantity
of heat transferred between the hot water and the
refrigerant inside the condenser. In the analyzed
system the external impacts are the power of
circulation pump, the inlet temperature of hot water,
the hydraulic resistance in hot water circuit, the
surface dimension of condenser. The hydraulic
resistance of hot water circuit is expressed in
measurable parameter of the system, in the pressure
drop.
The general aim of the investigation is to analyze in
wide range the behavior of performance of heat
pump's plate condenser.
The proposed procedure provides the analyze of
influence of above-mentioned four external impacts
on the performance of condenser.
The most influential external impact on the
performance of condenser is the inlet temperature of
hot water. If the inlet temperature is changed in the
range 21-50 °C then causes the increment of
performance of condenser for 17 kW.
The least impact on the performance of condenser
produces the hydraulic characteristics of hot water
circuit. Increases the power of circulation pump from
21-310 W hardly enhances the performance of
condenser only for 1 kW. From the above data it follows that the best
improvement of performance of condenser is achieved
with increasing the surface of heating bodies in the hot
water circuit. Advisable to apply panel heating bodies
instead radiators. Panels consist of pipe packages in the
floor, wall and ceiling and have a significantly higher
heating surfaces from the radiators, with that the inlet
temperature of hot water for heating decreases and
increases the performance of condenser. Increasing the
power of circulation pump very poorly enhances the
performance of condenser.
The additional practical goal is to find the quasi-optimal
power of circulation pump.The quasi-optimal
powerprovides the near maximum performance of
condenser at the defined hydraulic resistance of hot
water circuit and the defined dimension of condenser.
The theoretical optimum power of circulation pump is in
infinity.
Upper statement can to confirm the results of attached
simulations. With increasing the power of circulation
pump the performance of condenser at the beginning
exponentially but later slow monotonically increases and
in the infinity reaches maximum.
In practice, to the end of exponential increasing of
performance it makes sense to increase the power of
circulation pump. In this point are the quasi-optimal
power of circulation pump and the near maximum
performance of condenser.

28
EXPRES 2017
ISBN 978-86-919769-1-0
After this interval the power of circulation pumps
linearly but performance of the condenser only
minimally increases, nearly constant.
In the attached simulation, based on the obtained
graphics by the given data quasi-optimum of the
power of the circulation pump is about 110 W.
The proposed procedure consists of the accurate
mathematical model, an appropriate numerical
procedure and two and three dimensional graphics.
Created mathematical model describes the stationary
behavior of condenser, circulation pump and hot
water circuits in terms of hydraulics. The condenser
is plate and divided into section for cooling and
condensing of refrigerant vapor. The circulating
pump is described by power.
The hydraulic characteristic of a hot water circuit is
expressed using the pressure drop.
In the model all equations are algebraic, nonlinear
and coupled.
For solving the system of nonlinear, algebraic and of
coupled equations the Newton-Taylor's linearization
and Gauss's elimination method has been applied.
Results in numerical form were obtained and in two
or three dimensional graphics are presented.
The next objective of development is to expand the
model with compressor, and to determine the
optimal power of the circulation pump so that the
COP of condenser's performance reaches maximum.
2. Physical model
The physical model includes the condenser and its
environment. The environment is the hot water
circuit with pipline and the circulation pump.
The effect of the circulation pump on condenser's
performance is realized through the hot water mass
flow rate and hot water temperature difference.
Pipelinebythe pressure dropin thehotwatercircuit is
manifested
The effect of compressorthroughtheparameters as
the mass flow rate and the inlet temperature of
refrigerate is manifested.
Fig.1. Physical model
3. Mathematica lmodel
The general description of the condenser
The mathematical model of the condenser and its
environment is stationary and with lumped parameters.
In the condenser's mathematical model the governing
equations are based on the energy balance, separately
for the vapor cooling section and separately for the
condensing section. Three balance equations can be
created within the sections. These are the balance
equation of the refrigerant, the water and the heat
transfer between the water and the refrigerant.
The condenser's environment are the mathematical
model of the circulation pump's power and pressure
drop in hot water circuit.
The condenser's governing equations
Cooling section of superheated vapor
Heat flux of the refrigerant's vapor transferred to water
= ∙ ∙ ∆ (1)
Heat transfer between the superheated vapor and hot
water
= ∙ ∙ ∆ (2)
Heat flux absorbed by water
= ∙ ∙ ∆ (3)
Condensing section of saturated vapor
Heat transferred to water delivered by the condensation
of the refrigerant.
= ∙ ∆ (4)
Heat transfer between the vapor and water in the
condensation section.
= ∙ ∙ ∆ (5)
Heat flux absorbed by the water
= ∙ ∙ ∆ (6)
Auxiliary equations of the condenser
Logarithmic temperature difference between the
refrigerant and water
∆ = ∆ − ∆ ∆
∆
(7)
Overall heat transfer coefficient
Since the condenser wall of metal and thin therefore
thermal resistance tends to zero.
The obtained relation.
= 1
+ ∑
+
≅ ∙ +
(8)
The water convective heat transfer coefficient [4]
= 0.2121 ∙
∙ .( ) ∙ (9)
EXPRES 2017
ISBN 978-86-919769-1-0
The refrigerant vapor convective heat transfer
coefficient
= 0,004 ∙
∙ . ∙
(10)
The refrigerant condensate convective heat transfer
coefficient when x = 0 - 1 [4]
α = 4.118 ∙ λd
∙ Re.(m ) ∙ Pr
(11)
The latent heat of condensing vapor as the function
of the condensation temperature
di = a + a ∙ t + a ∙ t
(12)
Wheretheconstants of therefrigerant R 134a are:
a = 200.5965715
a = −0.709168
a = −0.00596796
The condenser’s total surface
= + (13)
The total amount of heat transferred between the
refrigerant and water
= + (14)
The condensing temperature and the inner boundary
temperature of the refrigerant is equal
= (15)
Circulation pump
The circulation pump supplies the hot water with the
energy to stream. The energy to stream serves to
overcome the resistance to flow in the condenser,
the pipeline and in the heating bodies. The hot water
mass flow rate and pressure drop determine the
demand of the circulation pump's power.
Pressure drop in the hot water circuit according to
Darcy-Weissbach relations
∆ = k1( ) ∙ (16)
Power demand of the circulation pump
2 = k1( ) ∙
= 2( ) ∙ (17)
4. The simulation results
By applying the proposed mathematical model, the
numerical procedure and 2D and 3D graphics, the
behavior of performance of condenser depending on
the power of circulation pump, pressure drop in the
hot water circuit, dimensions of the condenser and
inlet temperature of hot water in the condenser have
been investigated.Power of compressor during the
simulation was constant.Simulations were
performed with the following data. Compressor's
power is constant Pcomp = 4000 W. Other data are
changed in intervals that were taken from practice.
Power of circulation pump Pcirc = 20-310 W, input
water temperature Twi = 21-50 C, the pressure drop
in the hot water circuit Ap = 0.15-0.81 bar,
Condenser's surface f = 0.6-4.2 m2.
Discussion of three typical cases on the basis of
simulation results are follow.
Performance of condenser depending on the power of
circulation pump and pressure drop in the hot water
circuit if tvi=35 ℃ and f=2m2. Figures 2, 3.
Fig. 2. Performanceofcondenseras a functionofpower of
circulation pumpand of pressure drop in the hot water
circuit.
Fig. 3. Performanceofcondenseras a functionofpower of
circulation pump.
1-Theoretical optimum power of circulation pump is
infinite because the performance of condenser
asymptotically toward one the values and it reaches to
infinity. (Figure 2).
2-Practically, only to the quasi optimum makes sense to
increase the power of circulation pump. For the further
increase the power the performance of condenser only
minimal increases, monotonically approaches to the
asymptote.
3-Quasi-optimum power of circulation pump is
determined by visually estimation from diagram (Fig.
3).
4-Criteria for the evaluating the quasi optimum is, the
end of exponential increases the performance of
condenser.
5- Quasi optimum power of circulation pump around
Pcirc = 120 W if ∆p = 0.81 bar, and around Pcirc = 80 W if
∆p = 0.15 bar at the conditions tvi= 35 C and f = 2 m2.
(Figure 3).
6- Increasing the power of circulation pump from Pcirc
= 20W to 321W, ie 16 times, the increment of
performance of condenser only ∆q = 1 kW if ∆p = 0.15
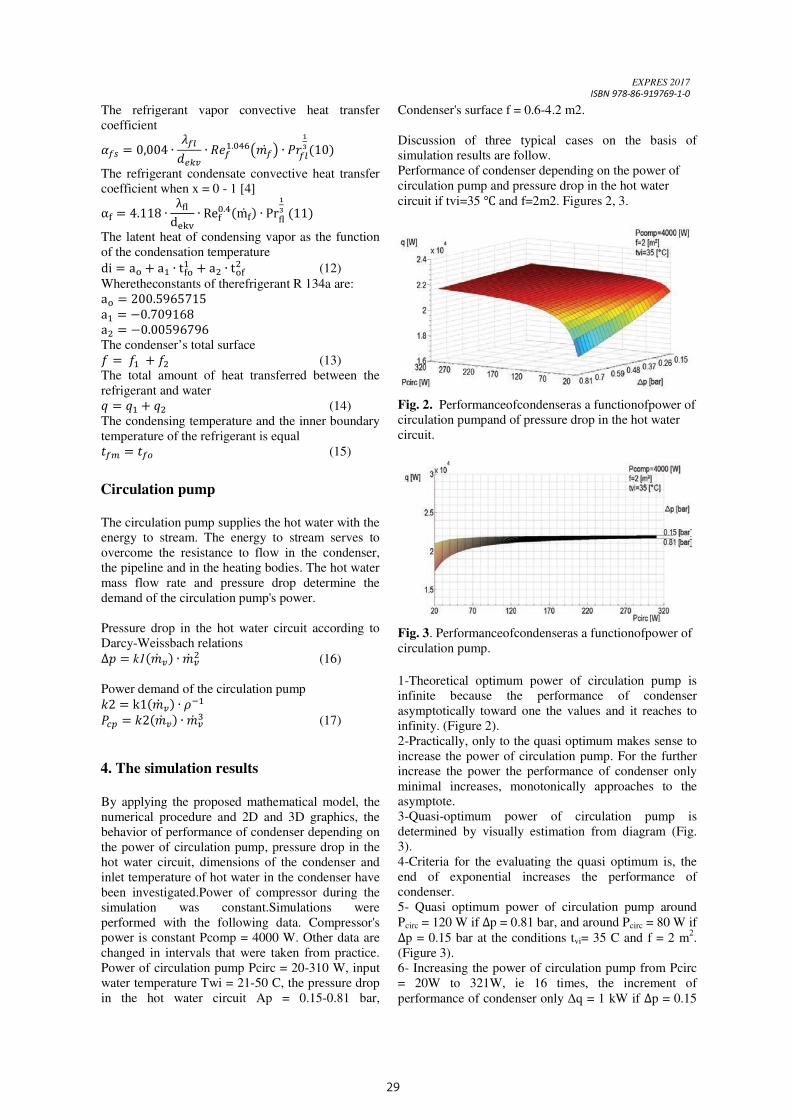
29
EXPRES 2017
ISBN 978-86-919769-1-0
After this interval the power of circulation pumps
linearly but performance of the condenser only
minimally increases, nearly constant.
In the attached simulation, based on the obtained
graphics by the given data quasi-optimum of the
power of the circulation pump is about 110 W.
The proposed procedure consists of the accurate
mathematical model, an appropriate numerical
procedure and two and three dimensional graphics.
Created mathematical model describes the stationary
behavior of condenser, circulation pump and hot
water circuits in terms of hydraulics. The condenser
is plate and divided into section for cooling and
condensing of refrigerant vapor. The circulating
pump is described by power.
The hydraulic characteristic of a hot water circuit is
expressed using the pressure drop.
In the model all equations are algebraic, nonlinear
and coupled.
For solving the system of nonlinear, algebraic and of
coupled equations the Newton-Taylor's linearization
and Gauss's elimination method has been applied.
Results in numerical form were obtained and in two
or three dimensional graphics are presented.
The next objective of development is to expand the
model with compressor, and to determine the
optimal power of the circulation pump so that the
COP of condenser's performance reaches maximum.
2. Physical model
The physical model includes the condenser and its
environment. The environment is the hot water
circuit with pipline and the circulation pump.
The effect of the circulation pump on condenser's
performance is realized through the hot water mass
flow rate and hot water temperature difference.
Pipelinebythe pressure dropin thehotwatercircuit is
manifested
The effect of compressorthroughtheparameters as
the mass flow rate and the inlet temperature of
refrigerate is manifested.
Fig.1. Physical model
3. Mathematica lmodel
The general description of the condenser
The mathematical model of the condenser and its
environment is stationary and with lumped parameters.
In the condenser's mathematical model the governing
equations are based on the energy balance, separately
for the vapor cooling section and separately for the
condensing section. Three balance equations can be
created within the sections. These are the balance
equation of the refrigerant, the water and the heat
transfer between the water and the refrigerant.
The condenser's environment are the mathematical
model of the circulation pump's power and pressure
drop in hot water circuit.
The condenser's governing equations
Cooling section of superheated vapor
Heat flux of the refrigerant's vapor transferred to water
= ∙ ∙ ∆ (1)
Heat transfer between the superheated vapor and hot
water
= ∙ ∙ ∆ (2)
Heat flux absorbed by water
= ∙ ∙ ∆ (3)
Condensing section of saturated vapor
Heat transferred to water delivered by the condensation
of the refrigerant.
= ∙ ∆ (4)
Heat transfer between the vapor and water in the
condensation section.
= ∙ ∙ ∆ (5)
Heat flux absorbed by the water
= ∙ ∙ ∆ (6)
Auxiliary equations of the condenser
Logarithmic temperature difference between the
refrigerant and water
∆ = ∆ − ∆ ∆
∆
(7)
Overall heat transfer coefficient
Since the condenser wall of metal and thin therefore
thermal resistance tends to zero.
The obtained relation.
= 1
+ ∑
+
≅ ∙ +
(8)
The water convective heat transfer coefficient [4]
= 0.2121 ∙
∙ .( ) ∙ (9)
EXPRES 2017
ISBN 978-86-919769-1-0
The refrigerant vapor convective heat transfer
coefficient
= 0,004 ∙
∙ . ∙
(10)
The refrigerant condensate convective heat transfer
coefficient when x = 0 - 1 [4]
α = 4.118 ∙ λd
∙ Re.(m ) ∙ Pr
(11)
The latent heat of condensing vapor as the function
of the condensation temperature
di = a + a ∙ t + a ∙ t
(12)
Wheretheconstants of therefrigerant R 134a are:
a = 200.5965715
a = −0.709168
a = −0.00596796
The condenser’s total surface
= + (13)
The total amount of heat transferred between the
refrigerant and water
= + (14)
The condensing temperature and the inner boundary
temperature of the refrigerant is equal
= (15)
Circulation pump
The circulation pump supplies the hot water with the
energy to stream. The energy to stream serves to
overcome the resistance to flow in the condenser,
the pipeline and in the heating bodies. The hot water
mass flow rate and pressure drop determine the
demand of the circulation pump's power.
Pressure drop in the hot water circuit according to
Darcy-Weissbach relations
∆ = k1( ) ∙ (16)
Power demand of the circulation pump
2 = k1( ) ∙
= 2( ) ∙ (17)
4. The simulation results
By applying the proposed mathematical model, the
numerical procedure and 2D and 3D graphics, the
behavior of performance of condenser depending on
the power of circulation pump, pressure drop in the
hot water circuit, dimensions of the condenser and
inlet temperature of hot water in the condenser have
been investigated.Power of compressor during the
simulation was constant.Simulations were
performed with the following data. Compressor's
power is constant Pcomp = 4000 W. Other data are
changed in intervals that were taken from practice.
Power of circulation pump Pcirc = 20-310 W, input
water temperature Twi = 21-50 C, the pressure drop
in the hot water circuit Ap = 0.15-0.81 bar,
Condenser's surface f = 0.6-4.2 m2.
Discussion of three typical cases on the basis of
simulation results are follow.
Performance of condenser depending on the power of
circulation pump and pressure drop in the hot water
circuit if tvi=35 ℃ and f=2m2. Figures 2, 3.
Fig. 2. Performanceofcondenseras a functionofpower of
circulation pumpand of pressure drop in the hot water
circuit.
Fig. 3. Performanceofcondenseras a functionofpower of
circulation pump.
1-Theoretical optimum power of circulation pump is
infinite because the performance of condenser
asymptotically toward one the values and it reaches to
infinity. (Figure 2).
2-Practically, only to the quasi optimum makes sense to
increase the power of circulation pump. For the further
increase the power the performance of condenser only
minimal increases, monotonically approaches to the
asymptote.
3-Quasi-optimum power of circulation pump is
determined by visually estimation from diagram (Fig.
3).
4-Criteria for the evaluating the quasi optimum is, the
end of exponential increases the performance of
condenser.
5- Quasi optimum power of circulation pump around
Pcirc = 120 W if ∆p = 0.81 bar, and around Pcirc = 80 W if
∆p = 0.15 bar at the conditions tvi= 35 C and f = 2 m2.
(Figure 3).
6- Increasing the power of circulation pump from Pcirc
= 20W to 321W, ie 16 times, the increment of
performance of condenser only ∆q = 1 kW if ∆p = 0.15
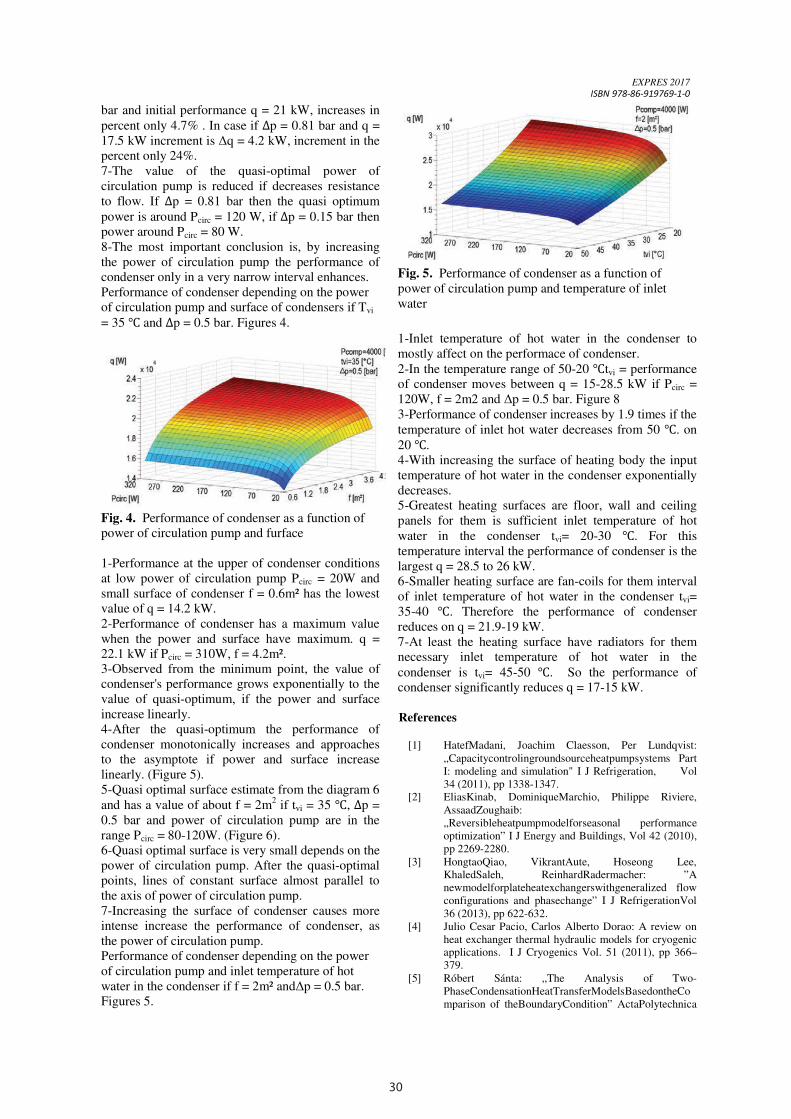
30
EXPRES 2017
ISBN 978-86-919769-1-0
bar and initial performance q = 21 kW, increases in
percent only 4.7% . In case if ∆p = 0.81 bar and q =
17.5 kW increment is ∆q = 4.2 kW, increment in the
percent only 24%.
7-The value of the quasi-optimal power of
circulation pump is reduced if decreases resistance
to flow. If ∆p = 0.81 bar then the quasi optimum
power is around Pcirc = 120 W, if ∆p = 0.15 bar then
power around Pcirc = 80 W.
8-The most important conclusion is, by increasing
the power of circulation pump the performance of
condenser only in a very narrow interval enhances.
Performance of condenser depending on the power
of circulation pump and surface of condensers if Tvi
= 35 ℃ and ∆p = 0.5 bar. Figures 4.
Fig. 4. Performance of condenser as a function of
power of circulation pump and furface
1-Performance at the upper of condenser conditions
at low power of circulation pump Pcirc = 20W and
small surface of condenser f = 0.6m² has the lowest
value of q = 14.2 kW.
2-Performance of condenser has a maximum value
when the power and surface have maximum. q =
22.1 kW if Pcirc = 310W, f = 4.2m².
3-Observed from the minimum point, the value of
condenser's performance grows exponentially to the
value of quasi-optimum, if the power and surface
increase linearly.
4-After the quasi-optimum the performance of
condenser monotonically increases and approaches
to the asymptote if power and surface increase
linearly. (Figure 5).
5-Quasi optimal surface estimate from the diagram 6
and has a value of about f = 2m2 if tvi = 35 ℃, ∆p =
0.5 bar and power of circulation pump are in the
range Pcirc = 80-120W. (Figure 6).
6-Quasi optimal surface is very small depends on the
power of circulation pump. After the quasi-optimal
points, lines of constant surface almost parallel to
the axis of power of circulation pump.
7-Increasing the surface of condenser causes more
intense increase the performance of condenser, as
the power of circulation pump.
Performance of condenser depending on the power
of circulation pump and inlet temperature of hot
water in the condenser if f = 2m² and∆p = 0.5 bar.
Figures 5.
Fig. 5. Performance of condenser as a function of
power of circulation pump and temperature of inlet
water
1-Inlet temperature of hot water in the condenser to
mostly affect on the performace of condenser.
2-In the temperature range of 50-20 ℃tvi = performance
of condenser moves between q = 15-28.5 kW if Pcirc =
120W, f = 2m2 and ∆p = 0.5 bar. Figure 8
3-Performance of condenser increases by 1.9 times if the
temperature of inlet hot water decreases from 50 ℃. on
20 ℃.
4-With increasing the surface of heating body the input
temperature of hot water in the condenser exponentially
decreases.
5-Greatest heating surfaces are floor, wall and ceiling
panels for them is sufficient inlet temperature of hot
water in the condenser tvi= 20-30 ℃. For this
temperature interval the performance of condenser is the
largest q = 28.5 to 26 kW.
6-Smaller heating surface are fan-coils for them interval
of inlet temperature of hot water in the condenser tvi=
35-40 ℃. Therefore the performance of condenser
reduces on q = 21.9-19 kW.
7-At least the heating surface have radiators for them
necessary inlet temperature of hot water in the
condenser is tvi= 45-50 ℃. So the performance of
condenser significantly reduces q = 17-15 kW.
References
[1] HatefMadani, Joachim Claesson, Per Lundqvist:
„Capacitycontrolingroundsourceheatpumpsystems Part
I: modeling and simulation" I J Refrigeration, Vol
34 (2011), pp 1338-1347.
[2] EliasKinab, DominiqueMarchio, Philippe Riviere,
AssaadZoughaib:
„Reversibleheatpumpmodelforseasonal performance
optimization” I J Energy and Buildings, Vol 42 (2010),
pp 2269-2280.
[3] HongtaoQiao, VikrantAute, Hoseong Lee,
KhaledSaleh, ReinhardRadermacher: ”A
newmodelforplateheatexchangerswithgeneralized flow
configurations and phasechange” I J RefrigerationVol
36 (2013), pp 622-632.
[4] Julio Cesar Pacio, Carlos Alberto Dorao: A review on
heat exchanger thermal hydraulic models for cryogenic
applications. I J Cryogenics Vol. 51 (2011), pp 366–
379.
[5] Róbert Sánta: „The Analysis of Two-
PhaseCondensationHeatTransferModelsBasedontheCo
mparison of theBoundaryCondition” ActaPolytechnica
EXPRES 2017
ISBN 978-86-919769-1-0
Hungarica Vol. 9, No. 6, 2012, pp 167-180.
[6] Yi-YieYan, Hsiang-ChaoLio, Tsing-FaLin:
”Condensationheattransfer and pressuredrop of
refrigerant R-134ain a plateheatexchanger”
International Journal of Heat and MassTransferVol
42 (1999), pp 993-1006.
[7] Imrich Bartal, Hc László Bánhidi, László Garbai:
”Analysis of thestaticthermalcomfortequation”
Energy and BuildingsVol. 49 (2012), pp 188-191.
[8] Garbai L., JasperA. : A matematikai
rendszerelmélet feldolgozása és alkalmazása
épületgépészeti optimalizációs feladatok
megoldására; Magyar Épületgépészet LX.
évfolyam, 2011/3. szám, pp. 3-6.
[9] ]Garbai L., Méhes Sz.: Energy Analysis of
Geothermal Heat Pump with U-tube Installations. IEEE
International Symposium CFP 1188N-PRT “EXPRES
2011.” Proceedings, pp 107-112. Subotica, Serbia. 11-
12 03. 2011.
[10] M. M. Awad, H. M. Mostafa, G. I. Sultan, A. Elbooz,
A. M. K. El-ghonemy: Performance Enhancement of
Air-cooled Condensers, ActaPolytechnicaHungarica,
Volume 4, No. 2, pp. 125-142, 2007
[11] Nyers J. Stoyan G.:" A Dynamical Model Adequate for
Controlling the Evaporator of Heat Pump",
Internationale Journal of Refrigeration,Vol.17, Issue 2,
p.101-108, 1994.

31
EXPRES 2017
ISBN 978-86-919769-1-0
bar and initial performance q = 21 kW, increases in
percent only 4.7% . In case if ∆p = 0.81 bar and q =
17.5 kW increment is ∆q = 4.2 kW, increment in the
percent only 24%.
7-The value of the quasi-optimal power of
circulation pump is reduced if decreases resistance
to flow. If ∆p = 0.81 bar then the quasi optimum
power is around Pcirc = 120 W, if ∆p = 0.15 bar then
power around Pcirc = 80 W.
8-The most important conclusion is, by increasing
the power of circulation pump the performance of
condenser only in a very narrow interval enhances.
Performance of condenser depending on the power
of circulation pump and surface of condensers if Tvi
= 35 ℃ and ∆p = 0.5 bar. Figures 4.
Fig. 4. Performance of condenser as a function of
power of circulation pump and furface
1-Performance at the upper of condenser conditions
at low power of circulation pump Pcirc = 20W and
small surface of condenser f = 0.6m² has the lowest
value of q = 14.2 kW.
2-Performance of condenser has a maximum value
when the power and surface have maximum. q =
22.1 kW if Pcirc = 310W, f = 4.2m².
3-Observed from the minimum point, the value of
condenser's performance grows exponentially to the
value of quasi-optimum, if the power and surface
increase linearly.
4-After the quasi-optimum the performance of
condenser monotonically increases and approaches
to the asymptote if power and surface increase
linearly. (Figure 5).
5-Quasi optimal surface estimate from the diagram 6
and has a value of about f = 2m2 if tvi = 35 ℃, ∆p =
0.5 bar and power of circulation pump are in the
range Pcirc = 80-120W. (Figure 6).
6-Quasi optimal surface is very small depends on the
power of circulation pump. After the quasi-optimal
points, lines of constant surface almost parallel to
the axis of power of circulation pump.
7-Increasing the surface of condenser causes more
intense increase the performance of condenser, as
the power of circulation pump.
Performance of condenser depending on the power
of circulation pump and inlet temperature of hot
water in the condenser if f = 2m² and∆p = 0.5 bar.
Figures 5.
Fig. 5. Performance of condenser as a function of
power of circulation pump and temperature of inlet
water
1-Inlet temperature of hot water in the condenser to
mostly affect on the performace of condenser.
2-In the temperature range of 50-20 ℃tvi = performance
of condenser moves between q = 15-28.5 kW if Pcirc =
120W, f = 2m2 and ∆p = 0.5 bar. Figure 8
3-Performance of condenser increases by 1.9 times if the
temperature of inlet hot water decreases from 50 ℃. on
20 ℃.
4-With increasing the surface of heating body the input
temperature of hot water in the condenser exponentially
decreases.
5-Greatest heating surfaces are floor, wall and ceiling
panels for them is sufficient inlet temperature of hot
water in the condenser tvi= 20-30 ℃. For this
temperature interval the performance of condenser is the
largest q = 28.5 to 26 kW.
6-Smaller heating surface are fan-coils for them interval
of inlet temperature of hot water in the condenser tvi=
35-40 ℃. Therefore the performance of condenser
reduces on q = 21.9-19 kW.
7-At least the heating surface have radiators for them
necessary inlet temperature of hot water in the
condenser is tvi= 45-50 ℃. So the performance of
condenser significantly reduces q = 17-15 kW.
References
[1] HatefMadani, Joachim Claesson, Per Lundqvist:
„Capacitycontrolingroundsourceheatpumpsystems Part
I: modeling and simulation" I J Refrigeration, Vol
34 (2011), pp 1338-1347.
[2] EliasKinab, DominiqueMarchio, Philippe Riviere,
AssaadZoughaib:
„Reversibleheatpumpmodelforseasonal performance
optimization” I J Energy and Buildings, Vol 42 (2010),
pp 2269-2280.
[3] HongtaoQiao, VikrantAute, Hoseong Lee,
KhaledSaleh, ReinhardRadermacher: ”A
newmodelforplateheatexchangerswithgeneralized flow
configurations and phasechange” I J RefrigerationVol
36 (2013), pp 622-632.
[4] Julio Cesar Pacio, Carlos Alberto Dorao: A review on
heat exchanger thermal hydraulic models for cryogenic
applications. I J Cryogenics Vol. 51 (2011), pp 366–
379.
[5] Róbert Sánta: „The Analysis of Two-
PhaseCondensationHeatTransferModelsBasedontheCo
mparison of theBoundaryCondition” ActaPolytechnica
EXPRES 2017
ISBN 978-86-919769-1-0
Hungarica Vol. 9, No. 6, 2012, pp 167-180.
[6] Yi-YieYan, Hsiang-ChaoLio, Tsing-FaLin:
”Condensationheattransfer and pressuredrop of
refrigerant R-134ain a plateheatexchanger”
International Journal of Heat and MassTransferVol
42 (1999), pp 993-1006.
[7] Imrich Bartal, Hc László Bánhidi, László Garbai:
”Analysis of thestaticthermalcomfortequation”
Energy and BuildingsVol. 49 (2012), pp 188-191.
[8] Garbai L., JasperA. : A matematikai
rendszerelmélet feldolgozása és alkalmazása
épületgépészeti optimalizációs feladatok
megoldására; Magyar Épületgépészet LX.
évfolyam, 2011/3. szám, pp. 3-6.
[9] ]Garbai L., Méhes Sz.: Energy Analysis of
Geothermal Heat Pump with U-tube Installations. IEEE
International Symposium CFP 1188N-PRT “EXPRES
2011.” Proceedings, pp 107-112. Subotica, Serbia. 11-
12 03. 2011.
[10] M. M. Awad, H. M. Mostafa, G. I. Sultan, A. Elbooz,
A. M. K. El-ghonemy: Performance Enhancement of
Air-cooled Condensers, ActaPolytechnicaHungarica,
Volume 4, No. 2, pp. 125-142, 2007
[11] Nyers J. Stoyan G.:" A Dynamical Model Adequate for
Controlling the Evaporator of Heat Pump",
Internationale Journal of Refrigeration,Vol.17, Issue 2,
p.101-108, 1994.
32
EXPRES 2017 ISBN 978-86-919769-1-0
Increasing efficiency of fixture planning by
automating some planning steps M. STAMPFERa,b, A. RÉTFALVIb
a) Department of Mechanical Engineering, , University of Pécs
H-7624 Pécs, Boszorkány u. 2, Hungary
b) Department of Mechanical Engineering, Subotica Tech
24000 Subotica, Marka Oreškovića 16, Serbia a E-mail: [email protected] b E-mail: [email protected]
In this paper a short description of an expert system for setup and fixture planning and fixture design is presented. The expert system
reduces the time spent on fixture design compared to manual fixture design.
Keywords: Computer Aided Fixture Design (CAFD), Process Planning
1. Introduction
The technological planning can be broken down
into several steps (Figure1): (1) setup planning and
conceptual design of fixtures; (2) operation planning:
(3) fixture configuration and design. The setup planning and conceptual design of fixtures
is one of the most complex intellectual tasks in the
process of industrial design and can be automated
only with great difficulty. The reason is perhaps that
the existing knowledge for the fixture solution is not
available in explicit form as formulas, logical
diagrams, or well-defined processes. Some of the
major achievements in this field are listed below.
[1] presented the FIXES system for setup and fixture
planning for prismatic parts. It is a subsystem of the
PART CAPP system which is the first complete
expert process planning system to be commercialised
and covers most of the process planning functions.
The approach of [2] provided a short description of a
Setup planner, and a more detailed description of a
Fixture planning program. [3] presented an
automated fixture design system in which the
fixturing surfaces are automatically determined based
on geometric and operational information. [4] offered
a method for setup planning and setup sequence
optimising by applying genetic algorithms. [5]
applied case-based reasoning for process planning for
prismatic parts where the clamping device is a vice.
[6] developed a method which deals with
simultaneous grouping of machining operations in
the setup and selects adapted fixturing solutions. [7]
presented an integrated setup and fixture planning
system that sets out from the STEP (Standard for
Exhcahnge of Product model data) format model of
the workpiece. Several researchers have employed
modular fixturing principles to generate fixture
designs.
Although numerous CAFD (Computer Aided Fixture
Design) techniques have been proposed and
implemented, fixture design still continues to be a
major bottleneck in the integration of CAD (Computer
Aided Design) and CAM (Computer Aided
Manufacturing) activities. With the review of the new
method for fixture planning, developed for box-shaped
parts machined on four-axis horizontal machines, we
wish to contribute to overcoming the difficulty.
Figure 1 Integrated Process Planning and Fixture Planning
System
INCREASING EFFICIENCY OF FIXTURE PLANNING BY AUTOMATING SOME PLANNING STEPS
2. The IGES postprocessing / SUPFIX
preprocessing module (IPPO) [8] Nowadays product design is mainly done with the
help of some kind of 3D modeling software. Since
different software packages stores the models made
with them in a little bit different format, several so-
called neutral (platform independent) file format
standard have been developed. The most commonly
used are STEP and IGES (Initial Graphics Exchange
Specifications). Our system contains a module which
can open CAD models saved in IGES format, and
from that data set regenerates the curves and surfaces
of the model, and visualize them. This module
examines curves and surfaces, picks common curves
and surfaces they belong, and examines if they form
a machining feature. This module can recognize the
features shown in Figure 2, these features are most
frequently present on box-shaped parts, especially on
gearbox casings.
Figure 2 Most common features on gearbox casings
The program at first looks for common circular or
elliptical arcs and investigates if they are part of any
feature marked with tf 1.., tf 2.. or tf 3.. . Then it
examines plane surfaces and looks if there are such
coplanar surfaces that could serve as supporting,
locating or clamping surfaces. Finally from those
surfaces that do not belong either of above mentioned
two groups, and are not hindered (less than 40% of
their surface area is covered, so they could be used for
locating or clamping) the program makes stand alone
features (one surface features). Of course besides
recognizing features, the program extracts their
characteristic parameters like diameter or length, etc.
The most important parameters of each feature are also
shown in Figure 2
After feature recogniton we can define which features
should be machined. Technologycal requirements like
IT class and surface roughness can be determined, as
well as whether or not a surface should be threaded. If
a feature is selected and the “tolerances” button
clicked on, then another feature may be selected, and
position or distance tolerance between them
prescribed. When all technological requirements are
defined we store all data in such a form that the next
module (SUPFIX) can process. In other words the data
stored in the form shown in Figure 3 are converted and
stored in form as shown in Figure 4
Figure 3 Data structure of IGES files
Figure 4 Data structure of IPPO files
3. The Setup and Fixture Planning
module (SUPFIX) [9][10]
This module uses data stored by IGES postprocessing
module. It analyzes machining requirements and
relationship tolerances, and selects eligible supporting
side and supporting type. First it tries to find such
supporting surface that ensures the machining of all
tolerance connected surfaces in the same setup (the
ideal technological position). If this succeeds, it checks
if there are eligible locating and clamping surfaces. If
it finds eligible surfaces, it gives us a proposal. The
process engineer can accept or refuse that proposal. In
case of rejection the program tries to find another
solution. If the ideal technological position strategy
does not bring fruits, the program tries to find such a
solution at which at least the strictly connected
surfaces are machined in the same setup. If this
attempt fails, the program decomposes a strictly
connected side and all strictly connected surfaces are
machined in the same setup, while the loosely
connected surfaces in the other setup. This solution
needs special fixture solution, which ensures that the
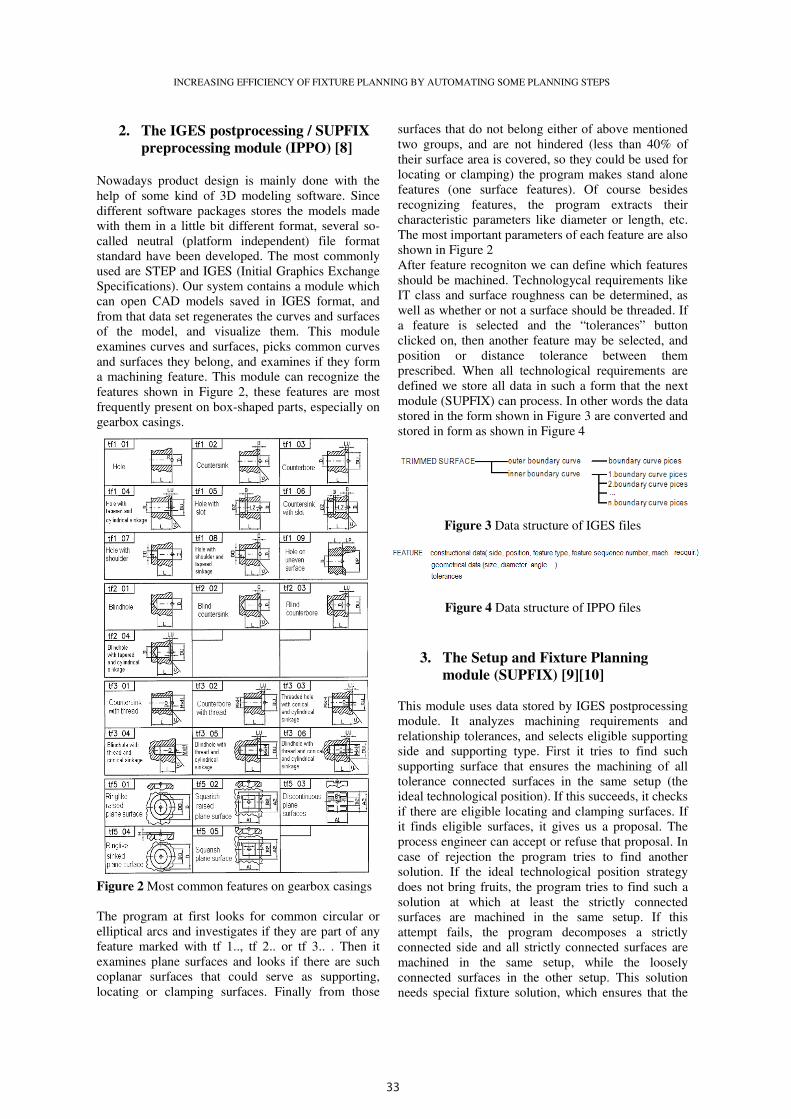
33
EXPRES 2017 ISBN 978-86-919769-1-0
Increasing efficiency of fixture planning by
automating some planning steps M. STAMPFERa,b, A. RÉTFALVIb
a) Department of Mechanical Engineering, , University of Pécs
H-7624 Pécs, Boszorkány u. 2, Hungary
b) Department of Mechanical Engineering, Subotica Tech
24000 Subotica, Marka Oreškovića 16, Serbia a E-mail: [email protected] b E-mail: [email protected]
In this paper a short description of an expert system for setup and fixture planning and fixture design is presented. The expert system
reduces the time spent on fixture design compared to manual fixture design.
Keywords: Computer Aided Fixture Design (CAFD), Process Planning
1. Introduction
The technological planning can be broken down
into several steps (Figure1): (1) setup planning and
conceptual design of fixtures; (2) operation planning:
(3) fixture configuration and design. The setup planning and conceptual design of fixtures
is one of the most complex intellectual tasks in the
process of industrial design and can be automated
only with great difficulty. The reason is perhaps that
the existing knowledge for the fixture solution is not
available in explicit form as formulas, logical
diagrams, or well-defined processes. Some of the
major achievements in this field are listed below.
[1] presented the FIXES system for setup and fixture
planning for prismatic parts. It is a subsystem of the
PART CAPP system which is the first complete
expert process planning system to be commercialised
and covers most of the process planning functions.
The approach of [2] provided a short description of a
Setup planner, and a more detailed description of a
Fixture planning program. [3] presented an
automated fixture design system in which the
fixturing surfaces are automatically determined based
on geometric and operational information. [4] offered
a method for setup planning and setup sequence
optimising by applying genetic algorithms. [5]
applied case-based reasoning for process planning for
prismatic parts where the clamping device is a vice.
[6] developed a method which deals with
simultaneous grouping of machining operations in
the setup and selects adapted fixturing solutions. [7]
presented an integrated setup and fixture planning
system that sets out from the STEP (Standard for
Exhcahnge of Product model data) format model of
the workpiece. Several researchers have employed
modular fixturing principles to generate fixture
designs.
Although numerous CAFD (Computer Aided Fixture
Design) techniques have been proposed and
implemented, fixture design still continues to be a
major bottleneck in the integration of CAD (Computer
Aided Design) and CAM (Computer Aided
Manufacturing) activities. With the review of the new
method for fixture planning, developed for box-shaped
parts machined on four-axis horizontal machines, we
wish to contribute to overcoming the difficulty.
Figure 1 Integrated Process Planning and Fixture Planning
System
INCREASING EFFICIENCY OF FIXTURE PLANNING BY AUTOMATING SOME PLANNING STEPS
2. The IGES postprocessing / SUPFIX
preprocessing module (IPPO) [8] Nowadays product design is mainly done with the
help of some kind of 3D modeling software. Since
different software packages stores the models made
with them in a little bit different format, several so-
called neutral (platform independent) file format
standard have been developed. The most commonly
used are STEP and IGES (Initial Graphics Exchange
Specifications). Our system contains a module which
can open CAD models saved in IGES format, and
from that data set regenerates the curves and surfaces
of the model, and visualize them. This module
examines curves and surfaces, picks common curves
and surfaces they belong, and examines if they form
a machining feature. This module can recognize the
features shown in Figure 2, these features are most
frequently present on box-shaped parts, especially on
gearbox casings.
Figure 2 Most common features on gearbox casings
The program at first looks for common circular or
elliptical arcs and investigates if they are part of any
feature marked with tf 1.., tf 2.. or tf 3.. . Then it
examines plane surfaces and looks if there are such
coplanar surfaces that could serve as supporting,
locating or clamping surfaces. Finally from those
surfaces that do not belong either of above mentioned
two groups, and are not hindered (less than 40% of
their surface area is covered, so they could be used for
locating or clamping) the program makes stand alone
features (one surface features). Of course besides
recognizing features, the program extracts their
characteristic parameters like diameter or length, etc.
The most important parameters of each feature are also
shown in Figure 2
After feature recogniton we can define which features
should be machined. Technologycal requirements like
IT class and surface roughness can be determined, as
well as whether or not a surface should be threaded. If
a feature is selected and the “tolerances” button
clicked on, then another feature may be selected, and
position or distance tolerance between them
prescribed. When all technological requirements are
defined we store all data in such a form that the next
module (SUPFIX) can process. In other words the data
stored in the form shown in Figure 3 are converted and
stored in form as shown in Figure 4
Figure 3 Data structure of IGES files
Figure 4 Data structure of IPPO files
3. The Setup and Fixture Planning
module (SUPFIX) [9][10]
This module uses data stored by IGES postprocessing
module. It analyzes machining requirements and
relationship tolerances, and selects eligible supporting
side and supporting type. First it tries to find such
supporting surface that ensures the machining of all
tolerance connected surfaces in the same setup (the
ideal technological position). If this succeeds, it checks
if there are eligible locating and clamping surfaces. If
it finds eligible surfaces, it gives us a proposal. The
process engineer can accept or refuse that proposal. In
case of rejection the program tries to find another
solution. If the ideal technological position strategy
does not bring fruits, the program tries to find such a
solution at which at least the strictly connected
surfaces are machined in the same setup. If this
attempt fails, the program decomposes a strictly
connected side and all strictly connected surfaces are
machined in the same setup, while the loosely
connected surfaces in the other setup. This solution
needs special fixture solution, which ensures that the
34
INCREASING EFFICIENCY OF FIXTURE PLANNING BY AUTOMATING SOME PLANNING STEPS
part can be partly machined on the supporting side
too. If the program is unable to find such solution,
then some strictly connected surfaces must be
machined in different setups. In that case complicated
and expensive fixtures are needed.
During the analysis of a feature from the aspect of
supporting eligibility the program performs shape,
size, machining requirements and tolerance
relationships analysis. The locating surface
candidates are investigated from the aspects of shape,
size and location. The clamping surface candidates
are investigated from the aspects of shape, size,
location and force closure.
4. The Fixture Configuration module
(FIXCO)
In the possession of (by the SUPFIX module)
proposed supporting, locating and clamping surfaces,
this module tries to build a modular fixture that is
eligible for precise and stable clamping of the
workpiece. In first step the program selects the
proper ground plate and (if needed) supporting
elements, then puts the workpiece on the centre of the
ground plate, then selects locating elements
depending on the kind, height and orientation of
locating surfaces. In the following step the program
moves the workpiece as the locating elements
require. After that the program tries to place
clamping elements over such ground plate holes
which are close enough to the clamping surface
contour to ensure stiff clamping. If this attempt does
not succeed, then adopting elements should be used.
Adopting elements are used to increase the height of
functional elements, or when we have to move the
functional elements along a given direction, in order
to be at the ideal position. But by applying adopter
elements the fixture becomes complicated, increases
the fixture weight and decreases the stability and
accuracy. So if possible, it is better to design fixture
with possible least number of elements. When the
fixture – built only from standard modular elements –
would be too complicated, or the precision of the
fixture would not be satisfying, then the system can
generate extra locator elements. Thenks to these extra
locator elements the resulting fixture is much
simpler. The system also can modify these extra
locator elements – if it is required, for example in the
sake of avoiding some interference between the
fixtrure elements, or between the extra locator
element and the workpiece. To make the process
planning easier, the program visualizes not only the
3D image of the fixture, but in a separate window it
shows the 2D views of the fixture from top and side
directions. This way it is easier to notice if any
element is not in the right position. In such cases the
process engineer can grasp the element with the
mouse and move it to the right place.
5. Implementation and test example
The Integrated Process Planning and Fixture Planning
System is made up of several modules presented in
Figure 1. All modules are implemented in Visual
Prolog programming language. The feature-based
workpiece model, which is created by the CAD model
post processing module, is the input of the Fixture
Planning System. Based on this input the system
generates an acceptable solution for setup(s) and
fixture(s) definition. Search for a fixture solution is
carried out automatically, but the solution offered by
the system must be approved by the user. This may
primarily be necessary regarding the selection of the
clamping points, as it may happen that the clamping
element obstructs the machining and, at its current
level of development, the system is unable to detect
this kind of inference.
The approach described above has been tested on
industrial parts. Presented in Figure 5 is an example of
a typical workpiece. The surfaces (features) of the
workpiece are marked with numbers on the drawing.
With geometrical – and tolerance analysis of the
workpiece, the following facts are known: Strictly
connected features of the workpiece are the features
marked with the numbers 2, 3, 12 and 13. Loosely
connected features are marked with 1 and 11.
Respectively the front – and the back faces are strictly
connected faces, and the top, bottom, left and right
faces are free faces. In the first step, the system tries to
solve the main clamping, applying the first strategy,
namely the main clamping fixture solution for the
technologically ideal position of the workpiece. The
workpiece can be placed in the workspace of the
machine tool in the technologically ideal workpiece
position if, for example, the plane locating face is at
the bottom because the bottom face and top faces are
not tolerance-related faces, but the bottom face is not
suitable for plane locating. Hence this attempt will fail.
The same problem occurs by supposing the plane
locating face is the top, left, or right face. That is why
this strategy must be skipped and the second strategy
be applied. By using the second strategy, namely the
Fixture solution based on disregarding the loosely
tolerance-related faces, the same problems are likely to
occur as with the first strategy. After the failure of
both the first and second strategies the system will
apply the third strategy, which is the fixture solution
based on the reduction of a strictly tolerance-related
side into loosely tolerance-related surfaces and strictly
tolerance-related surfaces. According to this strategy
the plane locating type is vertical with ability of partial
machining of the locating face. The system checks the
suitability of possible workpiece positions for locating
and clamping. At this strategy the system looks for
supporting faces only among the strictly connected
faces.
INCREASING EFFICIENCY OF FIXTURE PLANNING BY AUTOMATING SOME PLANNING STEPS
Figure 5 Test example
If it is assumed that the plane locating face is the
front face, the system will yield the fixture solution
for the main clamping (Figure 6). The plane locating
surface is the feature marked by number 1. The side
locating is possible by using two threaded joints
denoted with number 4 and 5 on the front face. The
clamping is done by screws and threaded joints on
the front face denoted with number 4, 5, 6, 7. The
features on the front face denoted with number 1, 4,
5, 6 and 7 will be machined in additional clamping
while the strictly connected features 2 and 3 will be
machined in the main clamping together with the
other strictly connected features of the workpiece.
This is possible only through the opening in the
fixture body (Figure 7).
Figure 6 The proposed conceptual solution for the main setup
Figure 7 The realised fixture for the main clamping with the
workpiece
6. Conclusions
By automating the feature recognition, the search for
the conceptual solution of the fixture, and the building
of the model of the modular fixture substantial time
can be spared during the fixture planning. The model
or the fixture is built from standard modular elements,
and when it is required, is complemented withe some
extra locator element. The generation and modification
of the extra elements is also automated. In Table 1 the
time costs (AMD Athlon 64 processor, 3200+, 2,01
GHz and 2GB RAM) of the stages of fixture planning
and design can be seen for the gearbox housings
shown in Figure 8. Earlier these stages took several
hours, now – thanks to automation of some fixture
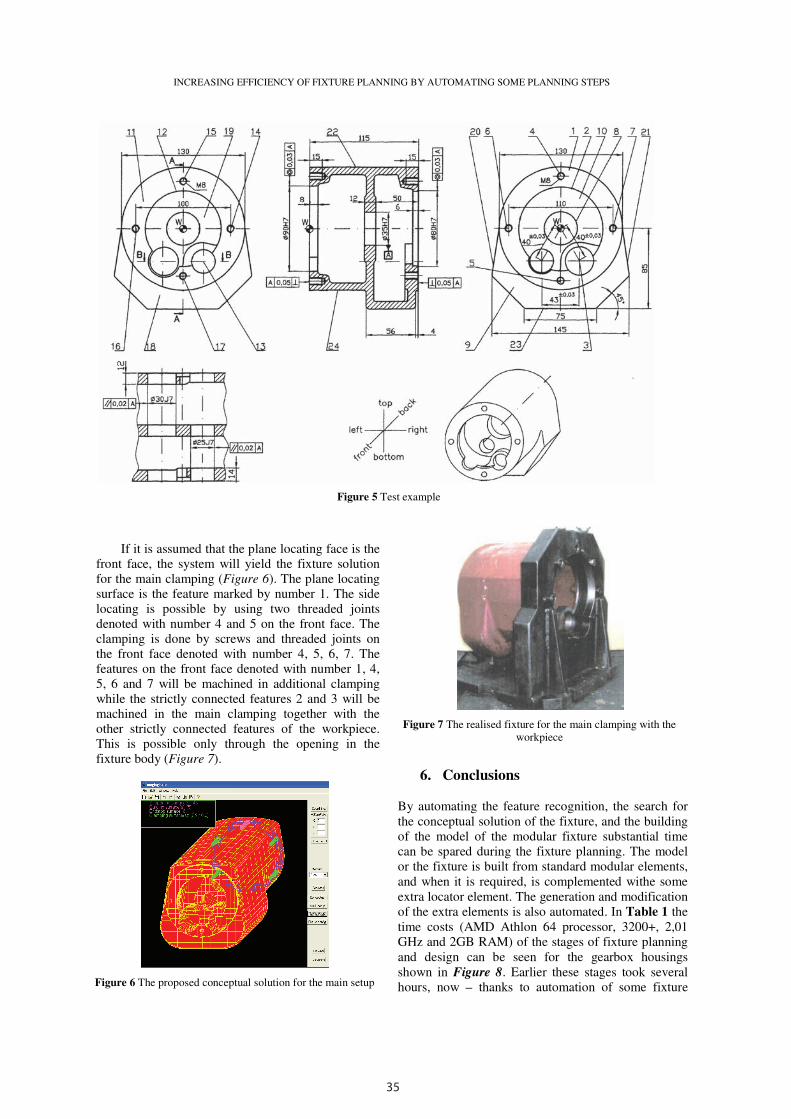
35
INCREASING EFFICIENCY OF FIXTURE PLANNING BY AUTOMATING SOME PLANNING STEPS
part can be partly machined on the supporting side
too. If the program is unable to find such solution,
then some strictly connected surfaces must be
machined in different setups. In that case complicated
and expensive fixtures are needed.
During the analysis of a feature from the aspect of
supporting eligibility the program performs shape,
size, machining requirements and tolerance
relationships analysis. The locating surface
candidates are investigated from the aspects of shape,
size and location. The clamping surface candidates
are investigated from the aspects of shape, size,
location and force closure.
4. The Fixture Configuration module
(FIXCO)
In the possession of (by the SUPFIX module)
proposed supporting, locating and clamping surfaces,
this module tries to build a modular fixture that is
eligible for precise and stable clamping of the
workpiece. In first step the program selects the
proper ground plate and (if needed) supporting
elements, then puts the workpiece on the centre of the
ground plate, then selects locating elements
depending on the kind, height and orientation of
locating surfaces. In the following step the program
moves the workpiece as the locating elements
require. After that the program tries to place
clamping elements over such ground plate holes
which are close enough to the clamping surface
contour to ensure stiff clamping. If this attempt does
not succeed, then adopting elements should be used.
Adopting elements are used to increase the height of
functional elements, or when we have to move the
functional elements along a given direction, in order
to be at the ideal position. But by applying adopter
elements the fixture becomes complicated, increases
the fixture weight and decreases the stability and
accuracy. So if possible, it is better to design fixture
with possible least number of elements. When the
fixture – built only from standard modular elements –
would be too complicated, or the precision of the
fixture would not be satisfying, then the system can
generate extra locator elements. Thenks to these extra
locator elements the resulting fixture is much
simpler. The system also can modify these extra
locator elements – if it is required, for example in the
sake of avoiding some interference between the
fixtrure elements, or between the extra locator
element and the workpiece. To make the process
planning easier, the program visualizes not only the
3D image of the fixture, but in a separate window it
shows the 2D views of the fixture from top and side
directions. This way it is easier to notice if any
element is not in the right position. In such cases the
process engineer can grasp the element with the
mouse and move it to the right place.
5. Implementation and test example
The Integrated Process Planning and Fixture Planning
System is made up of several modules presented in
Figure 1. All modules are implemented in Visual
Prolog programming language. The feature-based
workpiece model, which is created by the CAD model
post processing module, is the input of the Fixture
Planning System. Based on this input the system
generates an acceptable solution for setup(s) and
fixture(s) definition. Search for a fixture solution is
carried out automatically, but the solution offered by
the system must be approved by the user. This may
primarily be necessary regarding the selection of the
clamping points, as it may happen that the clamping
element obstructs the machining and, at its current
level of development, the system is unable to detect
this kind of inference.
The approach described above has been tested on
industrial parts. Presented in Figure 5 is an example of
a typical workpiece. The surfaces (features) of the
workpiece are marked with numbers on the drawing.
With geometrical – and tolerance analysis of the
workpiece, the following facts are known: Strictly
connected features of the workpiece are the features
marked with the numbers 2, 3, 12 and 13. Loosely
connected features are marked with 1 and 11.
Respectively the front – and the back faces are strictly
connected faces, and the top, bottom, left and right
faces are free faces. In the first step, the system tries to
solve the main clamping, applying the first strategy,
namely the main clamping fixture solution for the
technologically ideal position of the workpiece. The
workpiece can be placed in the workspace of the
machine tool in the technologically ideal workpiece
position if, for example, the plane locating face is at
the bottom because the bottom face and top faces are
not tolerance-related faces, but the bottom face is not
suitable for plane locating. Hence this attempt will fail.
The same problem occurs by supposing the plane
locating face is the top, left, or right face. That is why
this strategy must be skipped and the second strategy
be applied. By using the second strategy, namely the
Fixture solution based on disregarding the loosely
tolerance-related faces, the same problems are likely to
occur as with the first strategy. After the failure of
both the first and second strategies the system will
apply the third strategy, which is the fixture solution
based on the reduction of a strictly tolerance-related
side into loosely tolerance-related surfaces and strictly
tolerance-related surfaces. According to this strategy
the plane locating type is vertical with ability of partial
machining of the locating face. The system checks the
suitability of possible workpiece positions for locating
and clamping. At this strategy the system looks for
supporting faces only among the strictly connected
faces.
INCREASING EFFICIENCY OF FIXTURE PLANNING BY AUTOMATING SOME PLANNING STEPS
Figure 5 Test example
If it is assumed that the plane locating face is the
front face, the system will yield the fixture solution
for the main clamping (Figure 6). The plane locating
surface is the feature marked by number 1. The side
locating is possible by using two threaded joints
denoted with number 4 and 5 on the front face. The
clamping is done by screws and threaded joints on
the front face denoted with number 4, 5, 6, 7. The
features on the front face denoted with number 1, 4,
5, 6 and 7 will be machined in additional clamping
while the strictly connected features 2 and 3 will be
machined in the main clamping together with the
other strictly connected features of the workpiece.
This is possible only through the opening in the
fixture body (Figure 7).
Figure 6 The proposed conceptual solution for the main setup
Figure 7 The realised fixture for the main clamping with the
workpiece
6. Conclusions
By automating the feature recognition, the search for
the conceptual solution of the fixture, and the building
of the model of the modular fixture substantial time
can be spared during the fixture planning. The model
or the fixture is built from standard modular elements,
and when it is required, is complemented withe some
extra locator element. The generation and modification
of the extra elements is also automated. In Table 1 the
time costs (AMD Athlon 64 processor, 3200+, 2,01
GHz and 2GB RAM) of the stages of fixture planning
and design can be seen for the gearbox housings
shown in Figure 8. Earlier these stages took several
hours, now – thanks to automation of some fixture

36
INCREASING EFFICIENCY OF FIXTURE PLANNING BY AUTOMATING SOME PLANNING STEPS
planning steps – they take remarkably less time.
Figure 8 Gearbox housings [11]
Table 1 The time needed for different stages of the fixture planning and design [11]
Stages of the fixture planning and design
Gearbox housings
Part A Part B Part C Part D
Regeneration of the model and feature recognition 1 min 8 s 9 s 10 s 7 s
Defining machining requirements 12 min 9 min 13 min 7 min
Finding the conceptual solution of the fixture 1 min 42 s 1 min 8 s 2 min 10 s 1 min 56 s
Fixture configuration Auxiliary setup 56 s
Main setup 32
s
Auxiliary setup 46 s
Main setup 22 s
Auxiliary setup 41 s
Main setup 28 s
Auxiliary setup 30 s
Main setup 24 s
References
[1] J. R.. Boerma, H. J. J. Kals: „FIXES, a System for
Automatic Selection of Setups and Design of Fixtures”,
Annals of CIRP Vol. 37/1, 1988. pp. 443-446.
[2] A. Joneja, T-C Chang „Setup and fixture planning in
autmated process planning systems”, IIE Transaction
31, 1999. pp. 653-665.
[3] W. Ma, J. Li and Y. Rong, „Development of Automated
Fixture Planning Systems”, Int. J. of Adv. Manuf.
Techn. 15, pp. 171-181, 1999.
[4] M. Horváth, A. Márkus, J. Váncza „Process planning
with genetic algorithms on results of knowledge-based
reasoning”, Int. J. Comp. Integ. Manuf. 9,No.2, 1996,
pp. 145-166.
[5] M. Marefat, J. Britanik „Case-based process planning
using an object-oriented model representation”, Robo.
and Comp.-Integ. Manuf. 13, No. 3, 1997. pp. 229-251..
[6] H. Paris, D. Brissaud „Process planning strategy based
on fixturing indicator evaluation”, Int. J. of Adv.
Manuf. Techn. 25, pp. 913-922, 2005.
[7] S. Bansal, S. Nagarajan, N. Venkata Reddy „An
integrated fixture planning system for minimum
tolerances”, Int. J. of Adv. Manuf. Techn. 38, pp. 501-
513, 2008.
[8] A. Rétfalvi “IGES-based CAD model postprocessing
module of a Setup and Fixture Planning System for box-
shaped parts”, IEEE 9th Symp. on Intel. Syst. and Inform.,
September 8-10, 2011, Subotica, Serbia
[9] M. Stampfer „Integrated Setup and Fixture Planning
System for Gearbox Casings”, Int. J. of Adv. Manuf.
Techn., 26, pp.310-318, 2005.
[10] M. Stampfer „Automated setup and fixture planning
system for box-shaped parts”, Int. J. of Adv. Manuf.
Techn. 45, pp. 540-552, 2009.
[11] A. Rétfalvi „Fixture Design System with Automatic
Generation and Modification of Compementary Elements
for Modular Fixtures”, Acta Polytechnica Hungarica,
vol.12, No.7, pp. 163-182, 2015
EXPRES 2017
ISBN 978-86-919769-1-0
Simulation result of a nuclear power plant cooling system using Matlab
A, SZENTE a , I. FARKAS
b, P. ODRY
c
a Paks Nuklear Power Plant, Paks, Hungary, E-mail: [email protected] b University of Dunaújváros/Computer Engineering, Dunaújváros, Hungary, E-mail: [email protected] c University of Dunaújváros/Computer Engineering, Dunaújváros, Hungary, E-mail: [email protected]
It has been shown in recent years that there is a great need for additional security measures to be taken in high security systems in
case of occurrence of unanticipated events. A Nuclear Power Plant is exactly such kind of a sophisticated system. Thou, before
we begin to work on improving the overall security of a system, we must familiarize ourselves with the type of event that causes
the issue during an unanticipated event. For this we need a well-constructed simulation. The fortification of the removal of decay
heat following the subcritical stage of a reactor shutdown forms a significant portion of the workings of a nuclear power plant.
The lack of such a measure could lead to a catastrophic meltdown (Fukushima 2011). The necessary electrical energy for this
process under normal conditions is supplied by the primary (national and home power grids) and secondary (diesel generators)
electrical supply systems. One of the key factors of the insurance of higher plant safety could be the application of a third diverse
decay heat removal ensuring system. The solutions that we came up with were based on the observations of the Paks Nuclear
Power Plant in Hungary VVER440 type reactor cores, thou it could be reflected to any similar working nuclear power plant type.
Keywords: Nuclear Power Plant, subcritical stage of a reactor, primary electrical supply systems, security,
simulation
1. The basics of nuclear power plant
cooling
Once the adequate boric concentration is reached
during shutdown the reactor needs to be cooled down,
and kept at a desirable temperature. During cooldown
on the one hand the heat stored in the structure as well
as the decay heat generated by the active zone needs to
be removed.
During the first stage of the process, it’s necessary to
set the prescribed temperature difference of 60oC in the
primary circuit-pressurizer, using the cooling of the
pressurizer. Naturally, this implies that the pressure in
the primary circuit needs to be lowered. Later, besides
the cooling of the primary circuit it’s important to
constantly keep this difference.
Due to the constant pressure lowering in the primary
circuit, the hydro-accumulators need to be disengaged
from the primary circuit once a pI<75bar pressure is
reached, also as the primary circuit is being cooled, it’s
pressure needs to be let out by releasing the nitrogen
(to avoid any risk of brittle fracture). Once we reach a
pressure of pI≤20[bar] during the depressurization of
the primary circuit, the steam cushion in the
pressurizers needs to be changed to nitrogen. To
minimize the necessary quantity of nitrogen, it’s
imperative that the pressurizers are to be filled to their
maximal capacity (LYP10 = 7.5±0.5 m) before the
administration of nitrogen. In the following the precise
level in the pressurizers should be kept particularly in
mind, because the changes in that significantly affect the
primary circuit pressure. (Due to the continuous primary
circuit cooling, the constant level in the pressurizer can
only be ensured if the drop-in volume is substituted
continuously with water, unlike the power stage, where
per the average temperature we let the level change,
namely we keep a constant volume of water.) The
∆T=60oC between the primary circuit and the
pressurizer needs to be kept at until TI≤ 150oC,
following which it’s needs to be lowered to ∆T = 30oC.
Attention needs to be paid during the set of the
cooling speed, so as the maximum allowed is not
exceeded, therefore it must be approached from below.
In the case of huge supply tanks and big primary circuit
temperature differences the exceedance can easily
occur. The cooling must be carried out by the
Fig. 1. The remanans heat generation performance
Fig. 2. Diagram of the cooling for a normal cooling process
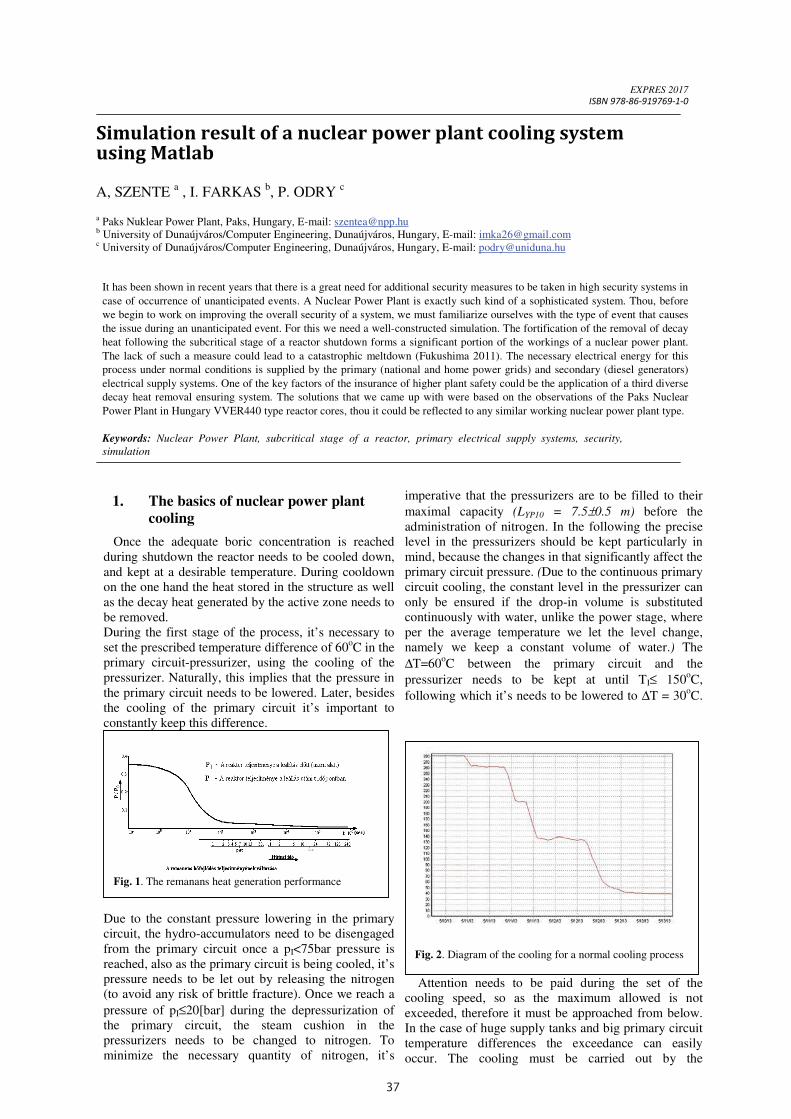
37
INCREASING EFFICIENCY OF FIXTURE PLANNING BY AUTOMATING SOME PLANNING STEPS
planning steps – they take remarkably less time.
Figure 8 Gearbox housings [11]
Table 1 The time needed for different stages of the fixture planning and design [11]
Stages of the fixture planning and design
Gearbox housings
Part A Part B Part C Part D
Regeneration of the model and feature recognition 1 min 8 s 9 s 10 s 7 s
Defining machining requirements 12 min 9 min 13 min 7 min
Finding the conceptual solution of the fixture 1 min 42 s 1 min 8 s 2 min 10 s 1 min 56 s
Fixture configuration Auxiliary setup 56 s
Main setup 32
s
Auxiliary setup 46 s
Main setup 22 s
Auxiliary setup 41 s
Main setup 28 s
Auxiliary setup 30 s
Main setup 24 s
References
[1] J. R.. Boerma, H. J. J. Kals: „FIXES, a System for
Automatic Selection of Setups and Design of Fixtures”,
Annals of CIRP Vol. 37/1, 1988. pp. 443-446.
[2] A. Joneja, T-C Chang „Setup and fixture planning in
autmated process planning systems”, IIE Transaction
31, 1999. pp. 653-665.
[3] W. Ma, J. Li and Y. Rong, „Development of Automated
Fixture Planning Systems”, Int. J. of Adv. Manuf.
Techn. 15, pp. 171-181, 1999.
[4] M. Horváth, A. Márkus, J. Váncza „Process planning
with genetic algorithms on results of knowledge-based
reasoning”, Int. J. Comp. Integ. Manuf. 9,No.2, 1996,
pp. 145-166.
[5] M. Marefat, J. Britanik „Case-based process planning
using an object-oriented model representation”, Robo.
and Comp.-Integ. Manuf. 13, No. 3, 1997. pp. 229-251..
[6] H. Paris, D. Brissaud „Process planning strategy based
on fixturing indicator evaluation”, Int. J. of Adv.
Manuf. Techn. 25, pp. 913-922, 2005.
[7] S. Bansal, S. Nagarajan, N. Venkata Reddy „An
integrated fixture planning system for minimum
tolerances”, Int. J. of Adv. Manuf. Techn. 38, pp. 501-
513, 2008.
[8] A. Rétfalvi “IGES-based CAD model postprocessing
module of a Setup and Fixture Planning System for box-
shaped parts”, IEEE 9th Symp. on Intel. Syst. and Inform.,
September 8-10, 2011, Subotica, Serbia
[9] M. Stampfer „Integrated Setup and Fixture Planning
System for Gearbox Casings”, Int. J. of Adv. Manuf.
Techn., 26, pp.310-318, 2005.
[10] M. Stampfer „Automated setup and fixture planning
system for box-shaped parts”, Int. J. of Adv. Manuf.
Techn. 45, pp. 540-552, 2009.
[11] A. Rétfalvi „Fixture Design System with Automatic
Generation and Modification of Compementary Elements
for Modular Fixtures”, Acta Polytechnica Hungarica,
vol.12, No.7, pp. 163-182, 2015
EXPRES 2017
ISBN 978-86-919769-1-0
Simulation result of a nuclear power plant cooling system using Matlab
A, SZENTE a , I. FARKAS
b, P. ODRY
c
a Paks Nuklear Power Plant, Paks, Hungary, E-mail: [email protected] b University of Dunaújváros/Computer Engineering, Dunaújváros, Hungary, E-mail: [email protected] c University of Dunaújváros/Computer Engineering, Dunaújváros, Hungary, E-mail: [email protected]
It has been shown in recent years that there is a great need for additional security measures to be taken in high security systems in
case of occurrence of unanticipated events. A Nuclear Power Plant is exactly such kind of a sophisticated system. Thou, before
we begin to work on improving the overall security of a system, we must familiarize ourselves with the type of event that causes
the issue during an unanticipated event. For this we need a well-constructed simulation. The fortification of the removal of decay
heat following the subcritical stage of a reactor shutdown forms a significant portion of the workings of a nuclear power plant.
The lack of such a measure could lead to a catastrophic meltdown (Fukushima 2011). The necessary electrical energy for this
process under normal conditions is supplied by the primary (national and home power grids) and secondary (diesel generators)
electrical supply systems. One of the key factors of the insurance of higher plant safety could be the application of a third diverse
decay heat removal ensuring system. The solutions that we came up with were based on the observations of the Paks Nuclear
Power Plant in Hungary VVER440 type reactor cores, thou it could be reflected to any similar working nuclear power plant type.
Keywords: Nuclear Power Plant, subcritical stage of a reactor, primary electrical supply systems, security,
simulation
1. The basics of nuclear power plant
cooling
Once the adequate boric concentration is reached
during shutdown the reactor needs to be cooled down,
and kept at a desirable temperature. During cooldown
on the one hand the heat stored in the structure as well
as the decay heat generated by the active zone needs to
be removed.
During the first stage of the process, it’s necessary to
set the prescribed temperature difference of 60oC in the
primary circuit-pressurizer, using the cooling of the
pressurizer. Naturally, this implies that the pressure in
the primary circuit needs to be lowered. Later, besides
the cooling of the primary circuit it’s important to
constantly keep this difference.
Due to the constant pressure lowering in the primary
circuit, the hydro-accumulators need to be disengaged
from the primary circuit once a pI<75bar pressure is
reached, also as the primary circuit is being cooled, it’s
pressure needs to be let out by releasing the nitrogen
(to avoid any risk of brittle fracture). Once we reach a
pressure of pI≤20[bar] during the depressurization of
the primary circuit, the steam cushion in the
pressurizers needs to be changed to nitrogen. To
minimize the necessary quantity of nitrogen, it’s
imperative that the pressurizers are to be filled to their
maximal capacity (LYP10 = 7.5±0.5 m) before the
administration of nitrogen. In the following the precise
level in the pressurizers should be kept particularly in
mind, because the changes in that significantly affect the
primary circuit pressure. (Due to the continuous primary
circuit cooling, the constant level in the pressurizer can
only be ensured if the drop-in volume is substituted
continuously with water, unlike the power stage, where
per the average temperature we let the level change,
namely we keep a constant volume of water.) The
∆T=60oC between the primary circuit and the
pressurizer needs to be kept at until TI≤ 150oC,
following which it’s needs to be lowered to ∆T = 30oC.
Attention needs to be paid during the set of the
cooling speed, so as the maximum allowed is not
exceeded, therefore it must be approached from below.
In the case of huge supply tanks and big primary circuit
temperature differences the exceedance can easily
occur. The cooling must be carried out by the
Fig. 1. The remanans heat generation performance
Fig. 2. Diagram of the cooling for a normal cooling process
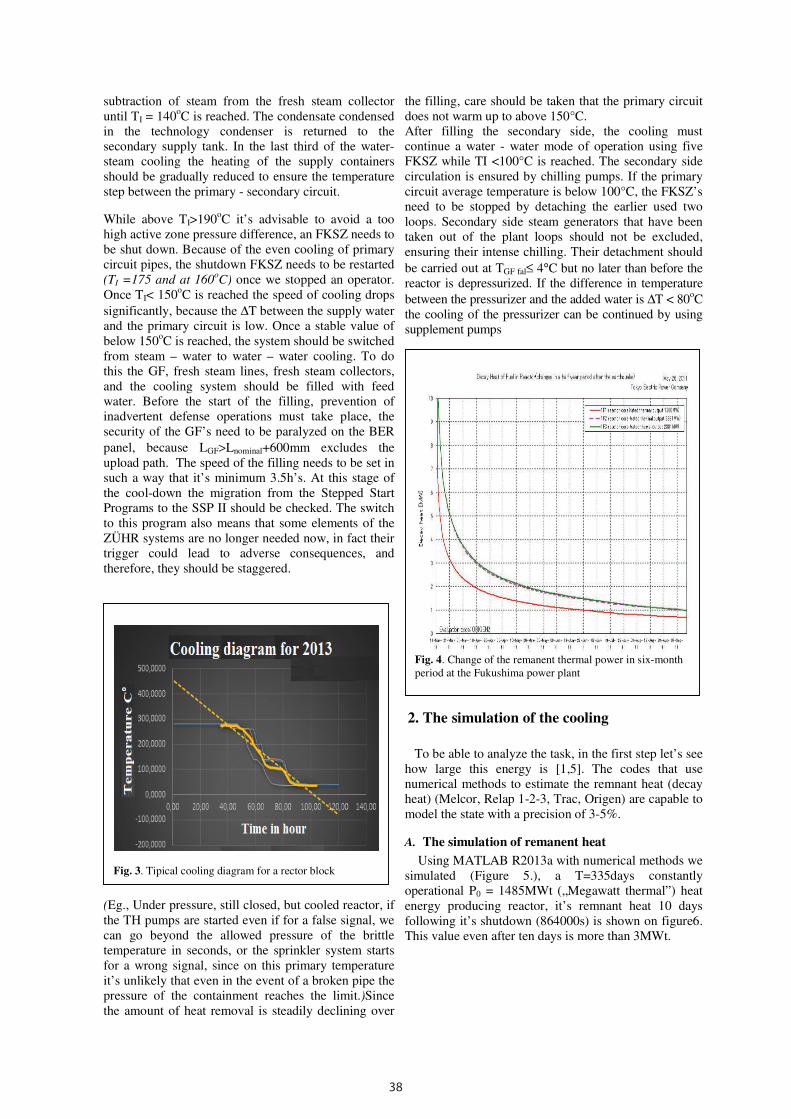
38
2
subtraction of steam from the fresh steam collector
until TI = 140oC is reached. The condensate condensed
in the technology condenser is returned to the
secondary supply tank. In the last third of the water-
steam cooling the heating of the supply containers
should be gradually reduced to ensure the temperature
step between the primary - secondary circuit.
While above TI>190oC it’s advisable to avoid a too
high active zone pressure difference, an FKSZ needs to
be shut down. Because of the even cooling of primary
circuit pipes, the shutdown FKSZ needs to be restarted
(TI =175 and at 160oC) once we stopped an operator.
Once TI< 150oC is reached the speed of cooling drops
significantly, because the ∆T between the supply water
and the primary circuit is low. Once a stable value of
below 150oC is reached, the system should be switched
from steam – water to water – water cooling. To do
this the GF, fresh steam lines, fresh steam collectors,
and the cooling system should be filled with feed
water. Before the start of the filling, prevention of
inadvertent defense operations must take place, the
security of the GF’s need to be paralyzed on the BER
panel, because LGF>Lnominal+600mm excludes the
upload path. The speed of the filling needs to be set in
such a way that it’s minimum 3.5h’s. At this stage of
the cool-down the migration from the Stepped Start
Programs to the SSP II should be checked. The switch
to this program also means that some elements of the
ZÜHR systems are no longer needed now, in fact their
trigger could lead to adverse consequences, and
therefore, they should be staggered.
(Eg., Under pressure, still closed, but cooled reactor, if
the TH pumps are started even if for a false signal, we
can go beyond the allowed pressure of the brittle
temperature in seconds, or the sprinkler system starts
for a wrong signal, since on this primary temperature
it’s unlikely that even in the event of a broken pipe the
pressure of the containment reaches the limit.)Since
the amount of heat removal is steadily declining over
the filling, care should be taken that the primary circuit
does not warm up to above 150°C.
After filling the secondary side, the cooling must
continue a water - water mode of operation using five
FKSZ while TI <100°C is reached. The secondary side
circulation is ensured by chilling pumps. If the primary
circuit average temperature is below 100°C, the FKSZ’s
need to be stopped by detaching the earlier used two
loops. Secondary side steam generators that have been
taken out of the plant loops should not be excluded,
ensuring their intense chilling. Their detachment should
be carried out at TGF fal≤ 4°C but no later than before the
reactor is depressurized. If the difference in temperature
between the pressurizer and the added water is ∆T < 80oC
the cooling of the pressurizer can be continued by using
supplement pumps
2. The simulation of the cooling
To be able to analyze the task, in the first step let’s see
how large this energy is [1,5]. The codes that use
numerical methods to estimate the remnant heat (decay
heat) (Melcor, Relap 1-2-3, Trac, Origen) are capable to
model the state with a precision of 3-5%.
A. The simulation of remanent heat
Using MATLAB R2013a with numerical methods we
simulated (Figure 5.), a T=335days constantly
operational P0 = 1485MWt („Megawatt thermal”) heat
energy producing reactor, it’s remnant heat 10 days
following it’s shutdown (864000s) is shown on figure6.
This value even after ten days is more than 3MWt.
Fig. 3. Tipical cooling diagram for a rector block
Fig. 4. Change of the remanent thermal power in six-month
period at the Fukushima power plant
3
The algorithm used [M. Ragheb, 3/22/2011] [2]:
P(t) = 6.48x10⁻³
P0 [t -0.2
– (t+T0) -0.2
] [MWt] (1)
B. The emergency stop in the system after shutdown
Hereinafter, we excited the SCRAM (emergency
stop) signal shutdown reactor and associated metalwork
combined transfer function with the current heat output
signal (Figure 7.).
The transfer function was determined by a single
proportional storage member (PT1) function,
determined because of water and metal mass,
considering the reactor, fuel, main water circuit lines,
primary coolant masses and specific heat values.
Without forced circulation or additional heat removal,
using an account with very high heat storage capacity,
the output function scaled in average temperatures
even after ten days shows a monotonic character
(Figure 4.). Assuming continuously available (fixed)
emergency stop heat extracting system and power, the
about 4MWt heat removal reverses its trend on the
seventh day, at a temperature of 300°C (Figure 8, the
third chart).
Fig. 5. Simulation modelling of remanent heat
Fig. 6. The simulated remanent thermal power
Fig. 7. Extended simulation model
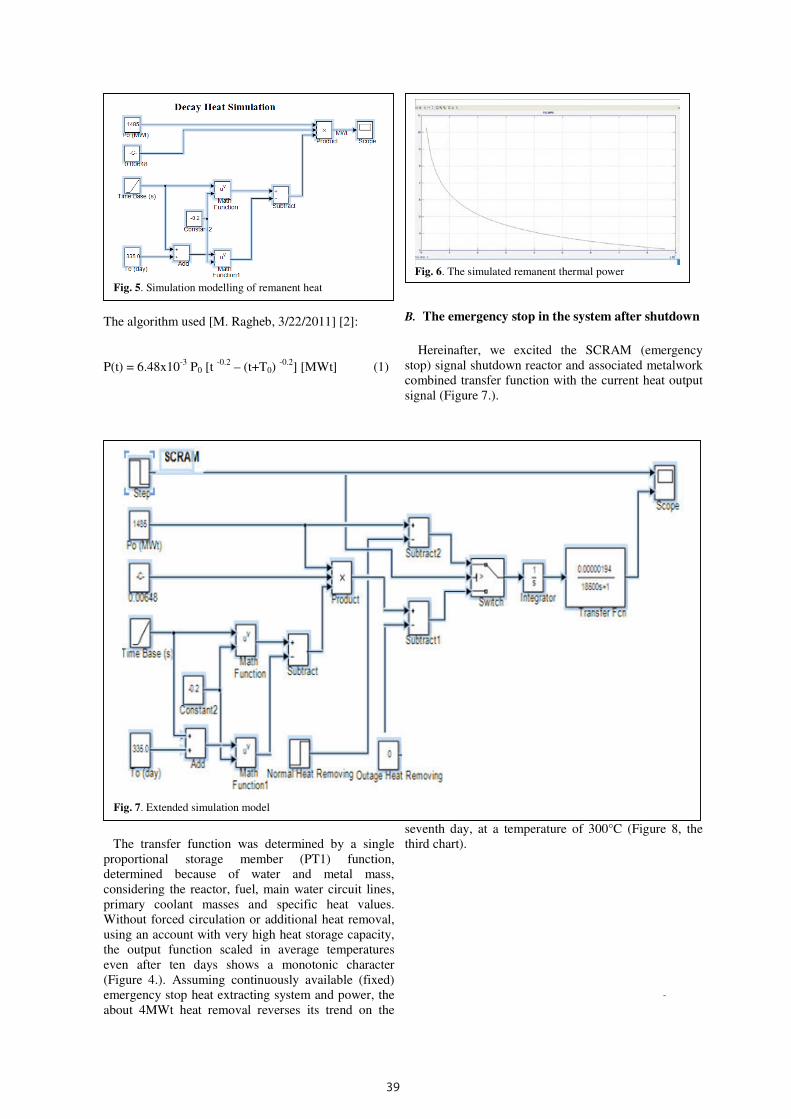
39
2
subtraction of steam from the fresh steam collector
until TI = 140oC is reached. The condensate condensed
in the technology condenser is returned to the
secondary supply tank. In the last third of the water-
steam cooling the heating of the supply containers
should be gradually reduced to ensure the temperature
step between the primary - secondary circuit.
While above TI>190oC it’s advisable to avoid a too
high active zone pressure difference, an FKSZ needs to
be shut down. Because of the even cooling of primary
circuit pipes, the shutdown FKSZ needs to be restarted
(TI =175 and at 160oC) once we stopped an operator.
Once TI< 150oC is reached the speed of cooling drops
significantly, because the ∆T between the supply water
and the primary circuit is low. Once a stable value of
below 150oC is reached, the system should be switched
from steam – water to water – water cooling. To do
this the GF, fresh steam lines, fresh steam collectors,
and the cooling system should be filled with feed
water. Before the start of the filling, prevention of
inadvertent defense operations must take place, the
security of the GF’s need to be paralyzed on the BER
panel, because LGF>Lnominal+600mm excludes the
upload path. The speed of the filling needs to be set in
such a way that it’s minimum 3.5h’s. At this stage of
the cool-down the migration from the Stepped Start
Programs to the SSP II should be checked. The switch
to this program also means that some elements of the
ZÜHR systems are no longer needed now, in fact their
trigger could lead to adverse consequences, and
therefore, they should be staggered.
(Eg., Under pressure, still closed, but cooled reactor, if
the TH pumps are started even if for a false signal, we
can go beyond the allowed pressure of the brittle
temperature in seconds, or the sprinkler system starts
for a wrong signal, since on this primary temperature
it’s unlikely that even in the event of a broken pipe the
pressure of the containment reaches the limit.)Since
the amount of heat removal is steadily declining over
the filling, care should be taken that the primary circuit
does not warm up to above 150°C.
After filling the secondary side, the cooling must
continue a water - water mode of operation using five
FKSZ while TI <100°C is reached. The secondary side
circulation is ensured by chilling pumps. If the primary
circuit average temperature is below 100°C, the FKSZ’s
need to be stopped by detaching the earlier used two
loops. Secondary side steam generators that have been
taken out of the plant loops should not be excluded,
ensuring their intense chilling. Their detachment should
be carried out at TGF fal≤ 4°C but no later than before the
reactor is depressurized. If the difference in temperature
between the pressurizer and the added water is ∆T < 80oC
the cooling of the pressurizer can be continued by using
supplement pumps
2. The simulation of the cooling
To be able to analyze the task, in the first step let’s see
how large this energy is [1,5]. The codes that use
numerical methods to estimate the remnant heat (decay
heat) (Melcor, Relap 1-2-3, Trac, Origen) are capable to
model the state with a precision of 3-5%.
A. The simulation of remanent heat
Using MATLAB R2013a with numerical methods we
simulated (Figure 5.), a T=335days constantly
operational P0 = 1485MWt („Megawatt thermal”) heat
energy producing reactor, it’s remnant heat 10 days
following it’s shutdown (864000s) is shown on figure6.
This value even after ten days is more than 3MWt.
Fig. 3. Tipical cooling diagram for a rector block
Fig. 4. Change of the remanent thermal power in six-month
period at the Fukushima power plant
3
The algorithm used [M. Ragheb, 3/22/2011] [2]:
P(t) = 6.48x10⁻³
P0 [t -0.2
– (t+T0) -0.2
] [MWt] (1)
B. The emergency stop in the system after shutdown
Hereinafter, we excited the SCRAM (emergency
stop) signal shutdown reactor and associated metalwork
combined transfer function with the current heat output
signal (Figure 7.).
The transfer function was determined by a single
proportional storage member (PT1) function,
determined because of water and metal mass,
considering the reactor, fuel, main water circuit lines,
primary coolant masses and specific heat values.
Without forced circulation or additional heat removal,
using an account with very high heat storage capacity,
the output function scaled in average temperatures
even after ten days shows a monotonic character
(Figure 4.). Assuming continuously available (fixed)
emergency stop heat extracting system and power, the
about 4MWt heat removal reverses its trend on the
seventh day, at a temperature of 300°C (Figure 8, the
third chart).
Fig. 5. Simulation modelling of remanent heat
Fig. 6. The simulated remanent thermal power
Fig. 7. Extended simulation model

40
4
It should be noted, a lesser value is also capable of
reversing the trend, that is to cause cooling, since the
thermal decomposition function decreases
monotonically, the question is when and how long will
it allow the average temperature to climb up. In the
case of our operating systems protection signals are
formed at - 305°C and 310°C values, it is not
appropriate to allow a higher value for a standing
block either. An obvious question is whether the huge,
metal and water - weight stored heat energy should be
directly converted in to electrical energy by an
electrical (TEG) converter and used for powering the
residual heat removal as a "third kind" diverse
authoritarian type supply.
Main equipment otherwise covered with insulation if
you cover them with TEG –considering characteristics
of temperature and ventilation of the area (the box) will
continue, - it is required due to cold-side heat removal
by the TEG–to generate approximately 2.5 - 3.0MW of
electricity, if we assume current TEG efficiencies [4].
C. The installation of TEG as a residual heat-
absorber
A system thus formed, from a thermal perspective is a
negative feedback system, which guarantees safety (9)
for protection against overtemperature. The
thermoelectric generator in the feedback path can also
be modeled as a PT1 member, however, it’s time
constant is much smaller than the pre-coupling loop, the
time constant of the technology.
The thus constructed MATLAB model can be seen on
figure 10., while the cooling curves are shown on figure
11. The “minima” function that does not allow the
temperature to climb above 300°C, should have at least
a transfer function. Increasing the time
constant does not affect the shape of the curve, it
determines the availability of electric power that can be
extracted from the TEG, while the proportional transfer
component has effect on the slope of the cooling.
Fig. 8. Without forced circulation or additional heat
removal SCRAM
PT1
PT1
-
TEG
Technológia
Fig. 10. The model of effect for incorporated TEG heat removal
5
D. TEG as a residual heat-absorber
The increase of storage capacity can be resolved by the
storage of electricity generated by the TEG’s in
batteries (Figure 12).
During the campaign, the heat produced is
continuously "there" in a time after SCRAM as well in
the form of stored heat, so during the residual heat
removal’s critical stage of 2-3 days the multiple
amount of charger (conditioning)power could be
removed from the batteries to maintain the circulation.
Each plant has a battery-supported DC rail (220V or
24V), so building that will not be an additional cost.
3. Analysis of a nuclear power plant from
the usage perspective of a TEG
The thermopile technology is turning out to be an
interesting application in the field of nuclear power
plants. It has been successfully used for some time
now in outer space electric power generation [3]. It
holds additional capabilities in high-energy nuclear
systems. Continued, we explore these application
possibilities in this article.
Nuclear power plants are essentially thermal power
plants fueled by nuclear fission reactions. Instead of the
conventional burning of fuels like in the furnaces of
thermal power plants, nuclear reactions in the reactor
are generating the energy. However, using the hot water
coming out the reactor, only relatively low pressure (40-
60bar) saturated steam can be produced, so the cycle’s
parameters are rather moderate. This is the cause of the
relatively low efficiency of nuclear power plants (η = 30
- 40%). The following table shows the thermal
characteristics of the main types of thermal reactors:
Huge volumetric heat capacity and low efficiency
entail considerable heat loss. This parameter gives a
good chance for the study of the application of
thermopile effect. The study of the usage of thermopile
cells in nuclear power plants could cover case studies
of:
- detailed exploration of the heat loss in certain
reactors (holding tanks, heat exchange pipes, rotary
machines)
- for the calculation of recoverable electrical energy,
and the maximum increase in efficiency
- for the thus obtained usability of the electrical
energy for feed-in the safety system, increasing the
availability of the safety system.
4. Performance conditions, normal VVER 440
reactor shutdown needs
Given that only measuring circuits and signal
processing systems (providing feedback information)
are used and for emergency powering of about 4 -
20mA, this implies a few 100W of power demand. (In
this case, the wireless sensor technology, as a stand-by
measuring system can play a significant role, but power
consumption is not a major surplus.)
Power consumption of a residual heat removal
(cooling), after normal or emergency shutdown, during
the cooling period from 72 to 120 hours, considering the
main consumers:
- 2 pc of main circulation pumps 1600kW/pump
(6kV);
- 1 pc Feed pump 2500kW (6kV)
- 1 pc Emergency pump 200kW (0.4kV)
0.0015
700S + 0.1YTEG =
0.015
700S + 0.1
0.15
700S + 0.1
YTEG =
YTEG =
Fig. 11. The simulation results for the installated TEG
heat removal
SCRAM
PT1
PT1
-
TEG
Technológia
akkutelep
Fig. 12. Model of installated battery pack system
Table 1. Thermal charachterictic of reactor types
Reactor PWR BWR GGR AGR HTGR Volumetric heat capacity (W/cm3)
70-110 40-50 3-5 5-10 10-20
Efficiency (%)
30-40 30-40 30-40 40-45 40-45
PWR (Pressurized Water Reactor)
BWR (Boiling Water Reactor)
GGR (Gas cooled, Graphite moderated Reactor)
AGR (Advanced Gas cooled Reactor)
HTGR (High Temperature, Gas cooled Reactor)
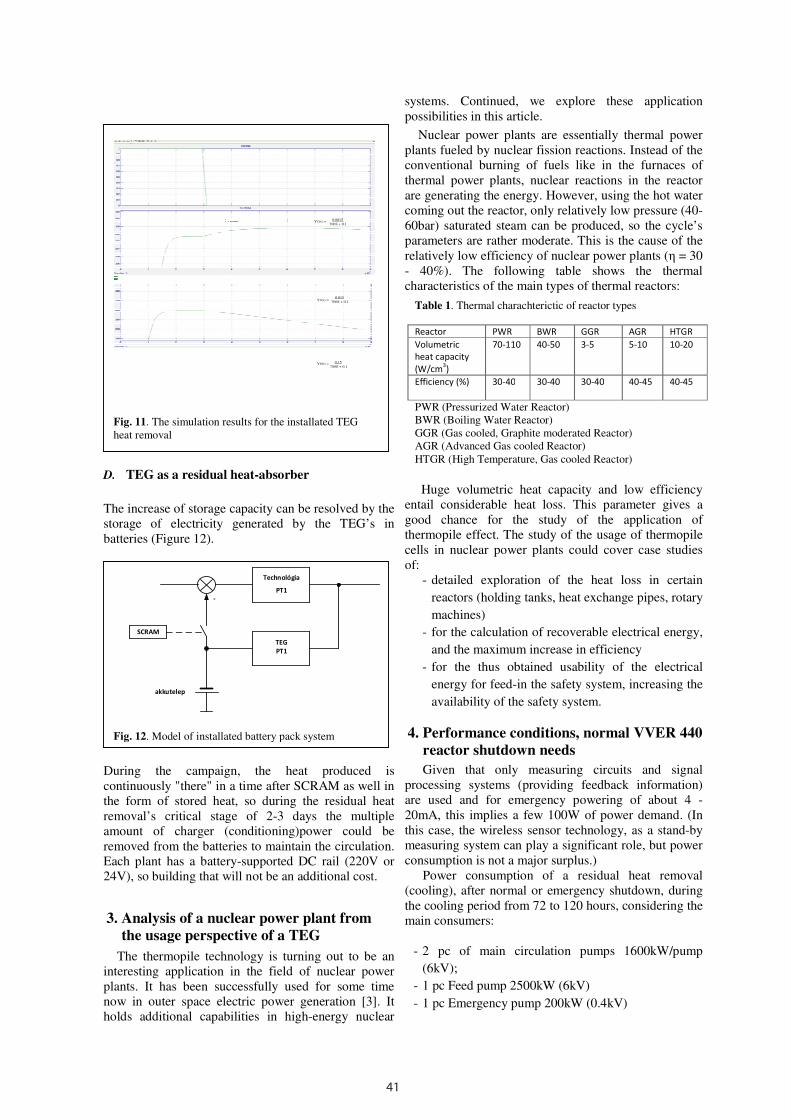
41
4
It should be noted, a lesser value is also capable of
reversing the trend, that is to cause cooling, since the
thermal decomposition function decreases
monotonically, the question is when and how long will
it allow the average temperature to climb up. In the
case of our operating systems protection signals are
formed at - 305°C and 310°C values, it is not
appropriate to allow a higher value for a standing
block either. An obvious question is whether the huge,
metal and water - weight stored heat energy should be
directly converted in to electrical energy by an
electrical (TEG) converter and used for powering the
residual heat removal as a "third kind" diverse
authoritarian type supply.
Main equipment otherwise covered with insulation if
you cover them with TEG –considering characteristics
of temperature and ventilation of the area (the box) will
continue, - it is required due to cold-side heat removal
by the TEG–to generate approximately 2.5 - 3.0MW of
electricity, if we assume current TEG efficiencies [4].
C. The installation of TEG as a residual heat-
absorber
A system thus formed, from a thermal perspective is a
negative feedback system, which guarantees safety (9)
for protection against overtemperature. The
thermoelectric generator in the feedback path can also
be modeled as a PT1 member, however, it’s time
constant is much smaller than the pre-coupling loop, the
time constant of the technology.
The thus constructed MATLAB model can be seen on
figure 10., while the cooling curves are shown on figure
11. The “minima” function that does not allow the
temperature to climb above 300°C, should have at least
a transfer function. Increasing the time
constant does not affect the shape of the curve, it
determines the availability of electric power that can be
extracted from the TEG, while the proportional transfer
component has effect on the slope of the cooling.
Fig. 8. Without forced circulation or additional heat
removal SCRAM
PT1
PT1
-
TEG
Technológia
Fig. 10. The model of effect for incorporated TEG heat removal
5
D. TEG as a residual heat-absorber
The increase of storage capacity can be resolved by the
storage of electricity generated by the TEG’s in
batteries (Figure 12).
During the campaign, the heat produced is
continuously "there" in a time after SCRAM as well in
the form of stored heat, so during the residual heat
removal’s critical stage of 2-3 days the multiple
amount of charger (conditioning)power could be
removed from the batteries to maintain the circulation.
Each plant has a battery-supported DC rail (220V or
24V), so building that will not be an additional cost.
3. Analysis of a nuclear power plant from
the usage perspective of a TEG
The thermopile technology is turning out to be an
interesting application in the field of nuclear power
plants. It has been successfully used for some time
now in outer space electric power generation [3]. It
holds additional capabilities in high-energy nuclear
systems. Continued, we explore these application
possibilities in this article.
Nuclear power plants are essentially thermal power
plants fueled by nuclear fission reactions. Instead of the
conventional burning of fuels like in the furnaces of
thermal power plants, nuclear reactions in the reactor
are generating the energy. However, using the hot water
coming out the reactor, only relatively low pressure (40-
60bar) saturated steam can be produced, so the cycle’s
parameters are rather moderate. This is the cause of the
relatively low efficiency of nuclear power plants (η = 30
- 40%). The following table shows the thermal
characteristics of the main types of thermal reactors:
Huge volumetric heat capacity and low efficiency
entail considerable heat loss. This parameter gives a
good chance for the study of the application of
thermopile effect. The study of the usage of thermopile
cells in nuclear power plants could cover case studies
of:
- detailed exploration of the heat loss in certain
reactors (holding tanks, heat exchange pipes, rotary
machines)
- for the calculation of recoverable electrical energy,
and the maximum increase in efficiency
- for the thus obtained usability of the electrical
energy for feed-in the safety system, increasing the
availability of the safety system.
4. Performance conditions, normal VVER 440
reactor shutdown needs
Given that only measuring circuits and signal
processing systems (providing feedback information)
are used and for emergency powering of about 4 -
20mA, this implies a few 100W of power demand. (In
this case, the wireless sensor technology, as a stand-by
measuring system can play a significant role, but power
consumption is not a major surplus.)
Power consumption of a residual heat removal
(cooling), after normal or emergency shutdown, during
the cooling period from 72 to 120 hours, considering the
main consumers:
- 2 pc of main circulation pumps 1600kW/pump
(6kV);
- 1 pc Feed pump 2500kW (6kV)
- 1 pc Emergency pump 200kW (0.4kV)
0.0015
700S + 0.1YTEG =
0.015
700S + 0.1
0.15
700S + 0.1
YTEG =
YTEG =
Fig. 11. The simulation results for the installated TEG
heat removal
SCRAM
PT1
PT1
-
TEG
Technológia
akkutelep
Fig. 12. Model of installated battery pack system
Table 1. Thermal charachterictic of reactor types
Reactor PWR BWR GGR AGR HTGR Volumetric heat capacity (W/cm3)
70-110 40-50 3-5 5-10 10-20
Efficiency (%)
30-40 30-40 30-40 40-45 40-45
PWR (Pressurized Water Reactor)
BWR (Boiling Water Reactor)
GGR (Gas cooled, Graphite moderated Reactor)
AGR (Advanced Gas cooled Reactor)
HTGR (High Temperature, Gas cooled Reactor)
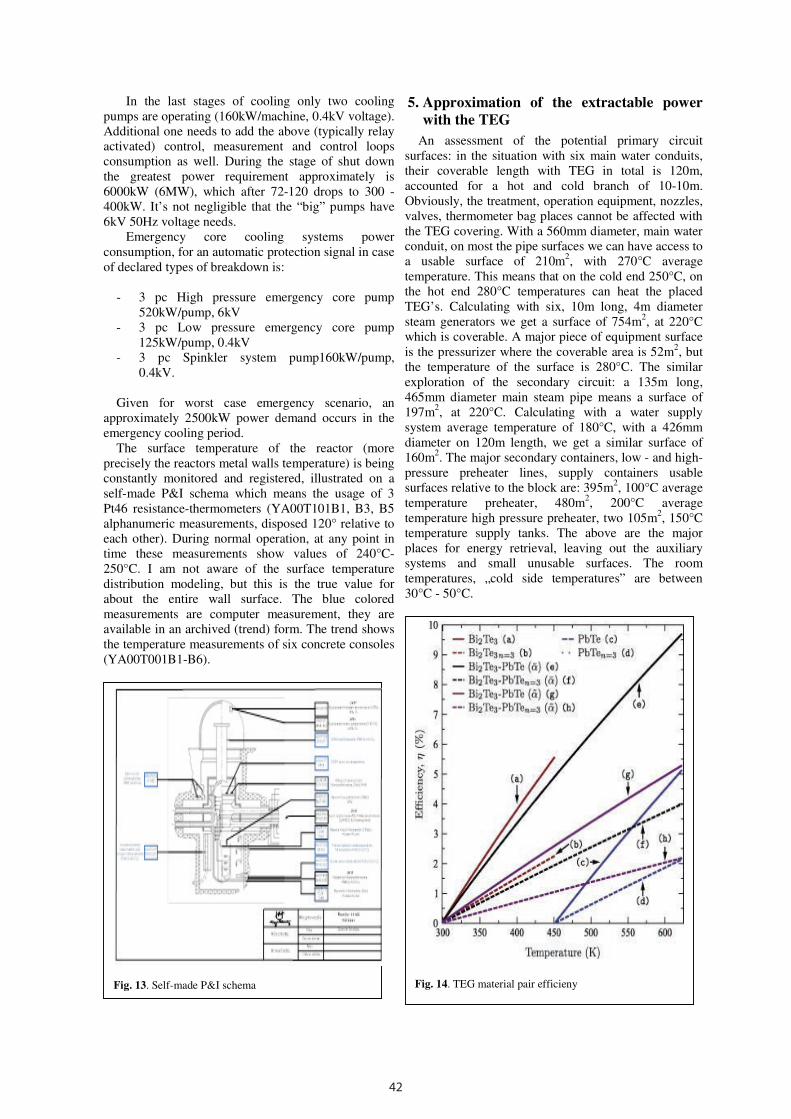
42
6
In the last stages of cooling only two cooling
pumps are operating (160kW/machine, 0.4kV voltage).
Additional one needs to add the above (typically relay
activated) control, measurement and control loops
consumption as well. During the stage of shut down
the greatest power requirement approximately is
6000kW (6MW), which after 72-120 drops to 300 -
400kW. It’s not negligible that the “big” pumps have
6kV 50Hz voltage needs.
Emergency core cooling systems power
consumption, for an automatic protection signal in case
of declared types of breakdown is:
- 3 pc High pressure emergency core pump
520kW/pump, 6kV
- 3 pc Low pressure emergency core pump
125kW/pump, 0.4kV
- 3 pc Spinkler system pump160kW/pump,
0.4kV.
Given for worst case emergency scenario, an
approximately 2500kW power demand occurs in the
emergency cooling period.
The surface temperature of the reactor (more
precisely the reactors metal walls temperature) is being
constantly monitored and registered, illustrated on a
self-made P&I schema which means the usage of 3
Pt46 resistance-thermometers (YA00T101B1, B3, B5
alphanumeric measurements, disposed 120° relative to
each other). During normal operation, at any point in
time these measurements show values of 240°C-
250°C. I am not aware of the surface temperature
distribution modeling, but this is the true value for
about the entire wall surface. The blue colored
measurements are computer measurement, they are
available in an archived (trend) form. The trend shows
the temperature measurements of six concrete consoles
(YA00T001B1-B6).
5. Approximation of the extractable power
with the TEG
An assessment of the potential primary circuit
surfaces: in the situation with six main water conduits,
their coverable length with TEG in total is 120m,
accounted for a hot and cold branch of 10-10m.
Obviously, the treatment, operation equipment, nozzles,
valves, thermometer bag places cannot be affected with
the TEG covering. With a 560mm diameter, main water
conduit, on most the pipe surfaces we can have access to
a usable surface of 210m2, with 270°C average
temperature. This means that on the cold end 250°C, on
the hot end 280°C temperatures can heat the placed
TEG’s. Calculating with six, 10m long, 4m diameter
steam generators we get a surface of 754m2, at 220°C
which is coverable. A major piece of equipment surface
is the pressurizer where the coverable area is 52m2, but
the temperature of the surface is 280°C. The similar
exploration of the secondary circuit: a 135m long,
465mm diameter main steam pipe means a surface of
197m2, at 220°C. Calculating with a water supply
system average temperature of 180°C, with a 426mm
diameter on 120m length, we get a similar surface of
160m2. The major secondary containers, low - and high-
pressure preheater lines, supply containers usable
surfaces relative to the block are: 395m2, 100°C average
temperature preheater, 480m2, 200°C average
temperature high pressure preheater, two 105m2, 150°C
temperature supply tanks. The above are the major
places for energy retrieval, leaving out the auxiliary
systems and small unusable surfaces. The room
temperatures, „cold side temperatures” are between
30°C - 50°C.
Fig. 13. Self-made P&I schema
Fig. 14. TEG material pair efficieny
7
Thanks to Thomson, Seebeck and Peltier’s research,
we use thermocouples for measurement purposes for a
long time now. However, the phenomenon of using it
as an energy source application is made possible
through experimenting with new materials. One of the
best types of such thermoelectric modules (TEG’s)
with the best thermoelectric properties is the bismuth-
telluride (Bi2TE3) based pseudo-binary group of alloys.
Figure 7. shows some of the more important TEG
material pairs efficiency as a function of temperature.
6. Summary
In this paper, we have tried to show how is it possible
to simulate processes taking place in an abandoned
nuclear power plant. As you can see this can be
resolved perfectly using MATLAB. We have outlined
the theoretical possibility of usage of residual heat
removal using a third, diverse way method. In further
studies, we try to put more emphasis on the fine tuning
of the simulated system and to clarify the physical
realization of the possibilities.
During the study, it can be concluded that, yes, there is
justification in using the TEG in nuclear power plants.
We may have to wait a few years so that TEG’s with
such parameters hit the market that enable greater power
generation (and thus enabling the operation of stronger
motors with them), but the results outlined here are said
to be promising. If we only consider that the resulting
2.68MW, the daily consumption of a small town, can be
covered by it, or it can supply the mentioned measuring
and signaling devices current needs, we should look at it
as it is worth it. In any case, its usage is worth further
consideration when critical outages, or emergencies
occur.
Acknowledgements This work/publication is supported by the EFOP-3.6.1-
16-2016-00003 project. The project is co-financed by
the European Union.
References [1] Laszlo Kajtar, Jozsef Nyers, Janos Szabo: Dynamic
thermal dimensioning of underground spaces;
Volume 87, 1 July 2015, Pages 361–368
[2] M. Ragheb: Decay heat generation in fission
reactors, 3/22/2011
[3] A. Szente, I. Farkas and P. Odry: The application of
ThermopileTechnology in high Energy Nuclear
Power Plants,Expres 2014
[4] http://www.tecteg.com/
[5] Nyers József, Kajtar Laszlo, Slavica Tomic, Nyers
ArpadInvestment-savings Method for Energy-
economic Optimization of External Wall Thermal
Insulation ThicknessENERGY AND BUILDINGS
86: pp. 268-274. (2014)
Hot side
Heat source temperature: 500°C Hot side temperature 480°C Cool side temperature: 45°C Open circuit voltage: 19.45V Output voltage: 9.75V Load current: 1.13 A Output power: 11.0 W Surface: 0.004 m2
Cool side Fig. 15. CMO-32-62S CASCADE TEG module

43
6
In the last stages of cooling only two cooling
pumps are operating (160kW/machine, 0.4kV voltage).
Additional one needs to add the above (typically relay
activated) control, measurement and control loops
consumption as well. During the stage of shut down
the greatest power requirement approximately is
6000kW (6MW), which after 72-120 drops to 300 -
400kW. It’s not negligible that the “big” pumps have
6kV 50Hz voltage needs.
Emergency core cooling systems power
consumption, for an automatic protection signal in case
of declared types of breakdown is:
- 3 pc High pressure emergency core pump
520kW/pump, 6kV
- 3 pc Low pressure emergency core pump
125kW/pump, 0.4kV
- 3 pc Spinkler system pump160kW/pump,
0.4kV.
Given for worst case emergency scenario, an
approximately 2500kW power demand occurs in the
emergency cooling period.
The surface temperature of the reactor (more
precisely the reactors metal walls temperature) is being
constantly monitored and registered, illustrated on a
self-made P&I schema which means the usage of 3
Pt46 resistance-thermometers (YA00T101B1, B3, B5
alphanumeric measurements, disposed 120° relative to
each other). During normal operation, at any point in
time these measurements show values of 240°C-
250°C. I am not aware of the surface temperature
distribution modeling, but this is the true value for
about the entire wall surface. The blue colored
measurements are computer measurement, they are
available in an archived (trend) form. The trend shows
the temperature measurements of six concrete consoles
(YA00T001B1-B6).
5. Approximation of the extractable power
with the TEG
An assessment of the potential primary circuit
surfaces: in the situation with six main water conduits,
their coverable length with TEG in total is 120m,
accounted for a hot and cold branch of 10-10m.
Obviously, the treatment, operation equipment, nozzles,
valves, thermometer bag places cannot be affected with
the TEG covering. With a 560mm diameter, main water
conduit, on most the pipe surfaces we can have access to
a usable surface of 210m2, with 270°C average
temperature. This means that on the cold end 250°C, on
the hot end 280°C temperatures can heat the placed
TEG’s. Calculating with six, 10m long, 4m diameter
steam generators we get a surface of 754m2, at 220°C
which is coverable. A major piece of equipment surface
is the pressurizer where the coverable area is 52m2, but
the temperature of the surface is 280°C. The similar
exploration of the secondary circuit: a 135m long,
465mm diameter main steam pipe means a surface of
197m2, at 220°C. Calculating with a water supply
system average temperature of 180°C, with a 426mm
diameter on 120m length, we get a similar surface of
160m2. The major secondary containers, low - and high-
pressure preheater lines, supply containers usable
surfaces relative to the block are: 395m2, 100°C average
temperature preheater, 480m2, 200°C average
temperature high pressure preheater, two 105m2, 150°C
temperature supply tanks. The above are the major
places for energy retrieval, leaving out the auxiliary
systems and small unusable surfaces. The room
temperatures, „cold side temperatures” are between
30°C - 50°C.
Fig. 13. Self-made P&I schema
Fig. 14. TEG material pair efficieny
7
Thanks to Thomson, Seebeck and Peltier’s research,
we use thermocouples for measurement purposes for a
long time now. However, the phenomenon of using it
as an energy source application is made possible
through experimenting with new materials. One of the
best types of such thermoelectric modules (TEG’s)
with the best thermoelectric properties is the bismuth-
telluride (Bi2TE3) based pseudo-binary group of alloys.
Figure 7. shows some of the more important TEG
material pairs efficiency as a function of temperature.
6. Summary
In this paper, we have tried to show how is it possible
to simulate processes taking place in an abandoned
nuclear power plant. As you can see this can be
resolved perfectly using MATLAB. We have outlined
the theoretical possibility of usage of residual heat
removal using a third, diverse way method. In further
studies, we try to put more emphasis on the fine tuning
of the simulated system and to clarify the physical
realization of the possibilities.
During the study, it can be concluded that, yes, there is
justification in using the TEG in nuclear power plants.
We may have to wait a few years so that TEG’s with
such parameters hit the market that enable greater power
generation (and thus enabling the operation of stronger
motors with them), but the results outlined here are said
to be promising. If we only consider that the resulting
2.68MW, the daily consumption of a small town, can be
covered by it, or it can supply the mentioned measuring
and signaling devices current needs, we should look at it
as it is worth it. In any case, its usage is worth further
consideration when critical outages, or emergencies
occur.
Acknowledgements This work/publication is supported by the EFOP-3.6.1-
16-2016-00003 project. The project is co-financed by
the European Union.
References [1] Laszlo Kajtar, Jozsef Nyers, Janos Szabo: Dynamic
thermal dimensioning of underground spaces;
Volume 87, 1 July 2015, Pages 361–368
[2] M. Ragheb: Decay heat generation in fission
reactors, 3/22/2011
[3] A. Szente, I. Farkas and P. Odry: The application of
ThermopileTechnology in high Energy Nuclear
Power Plants,Expres 2014
[4] http://www.tecteg.com/
[5] Nyers József, Kajtar Laszlo, Slavica Tomic, Nyers
ArpadInvestment-savings Method for Energy-
economic Optimization of External Wall Thermal
Insulation ThicknessENERGY AND BUILDINGS
86: pp. 268-274. (2014)
Hot side
Heat source temperature: 500°C Hot side temperature 480°C Cool side temperature: 45°C Open circuit voltage: 19.45V Output voltage: 9.75V Load current: 1.13 A Output power: 11.0 W Surface: 0.004 m2
Cool side Fig. 15. CMO-32-62S CASCADE TEG module

44
EXPRES 2017 ISBN 978-86-919769-1-0
Composite materials for wind power turbine blades R. SZABÓ a, L. SZABÓ b
a Ingtex Bt - Rejtő Sándor Foundation H-1056 Budapest Nyáry Pál u. 5, Hungary
E-mail: [email protected] b
Institute of Environmental Protection Engineering, Rejtő Sándor Faculty of Light Industry and Environmental Protection
Engineering, Óbuda University, H-1034 Budapest, Doberdó u. 6, Hungary
E-mail: [email protected]
Energy is an essential ingredient of socio-economic development and economic growth. Renewable energy sources like wind
energy is domestic and can help in reducing the dependency on fossil fuels. Renewable energy resources, of which wind
energy is prominent, are part of the solution to the global energy problem and reduce the CO₂ emission. Wind turbine and the
rotorblade concepts are reviewed, and loadings by wind and gravity as important factors for the fatigue performance of the
materials are considered.Composites are discussed as candidates for rotor blades. The fibers and matrices for composites are
described, and their high stiffness, low density, and good fatigue performance are emphasized. This presentation will explore
properties of carbon fiber, the advantages/ disadvantage between CFRP and competitive materials as GFRP.
Keywords: airfoil, wind turbine blade, carbon fiber, composites, CFRP, power
1. Introduction
Windmills have been assisting mankind to
convert the energy contained in wind to many
other useful forms for the last three thousand
years. In the early 70s, the serial production of
GRP (glass-fibre reinforced plastics) rotor blades
a length of 17 metres was developed on small
systems, starting in Denmark. In the initial
phases, the achieved performance was
approximately 10 kilowatts bu now we are able
to attain magnitudes of 8 to 10 Megawatts.
Today’s wind turbines are capable of converting
a great amount of energy in the wind into
electricity. This is due to blades which are
developed using state-of-the-art aerodynamic
analysis and other performance-enhancing
equipment. The wind turbine performance
improvement is the key to increase the length of
the blade. The wind blades to make are needed
extremely high loads, high stiffness and high-
strength structural materials. The environmental
load of electricity produced from wind power
generation is the most favourable, so you can
expect a bright future.
2. The wind blade functions
Main components of wind turbines:
Rotor – generates aerodynamic torque from the
wind
Nacelle – converters the torque into electrical
power
Tower – holds nacelle and rotor blades up in the
wind and provides access to the nacelle
Foundation – ensures that the turbine stays upright
The presentation mainly focused on the turbine
blade.
If the blowing wind can turn the blade, we will
receive electricity from the generator that is
attached to it. A lift force is produced when air
moves over an airfoil (Bernoulli-equation) (Fig. 1).
Fig. 1.
The pressure difference on the airfoil makes the
wind turbine blade turn. This way the wind turbine
achieves the basic rotation. Wind turbine blades
turn at a very low rate of rpm. So before the low
speed shaft connecting to the generator the speed
is increased in a gearbox (planetary gear set,
speed ratio ~ 1:90) to achieve the high speed
ratio. The moving wind turbine blade also
experiences the relative wind velocity is as
shown in Fig. 2. [12].
EXPRES 2017 ISBN 978-86-919769-1-0
Fig. 2.
As the blade velocity increases to the tip the
relative wind speed become more inclined
towards the trip. The blade has a lot of air foil
cross-section consisting of different sizes and
shapes from the root to tip. This means by the
manufacturing that a continuous twist is given to
the blade from the root to tip. Therefore the wind
turbine is positioned in a pitched manner in order
to align with the relative wind speed.
Wind turbine always be aligned with the wind
direction. Wind velocity sensor on top of the
nacelle measures the wind speed and direction.
The deviation in the wind’s direction yawing
mechanism to correct the error (picture).
According to the wind speed the relative velocity
angle of the wind also changes. A blade pitching
mechanism turns the blades and guarantees a
proper alignment of the blade with the relative
velocity. Thus the blades are always at the
optimum angle of attack with the relative wind
flow. Pitch control mechanism keep the rotation
speed of a turbine constant for changing wind
speed. This is necessary to keep the rpm of the
generator constant.
The swept area increases by approximately the
square of blade length. Spinning blades cause
wind behind turbine to rotate. Faster moving
blades tip cause less rotation and have less wake
rotation losses. The longer the turbine blades to
achieve the goal.
3. Wind turbine power
The wind power depends on the wind speed.
During excessively windy (cut off speed ~ 80
km/h) the brake is arrest wind blade rotation (Fig.
3).
Fig. 3.
The power of the wind turbine
P = 1/2 η ρ A v v² = 1/2 η ρ π r² v³
where:
P – Performance of wind turbine,
η – Efficiency of wind turbine,
ρ – Air density (1.2 kg/m³),
A – Swept area of wind turbine (A = L²π),
L – Length of blade,
v – wind velocity.
To gain a good insight into wind turbine
efficiency assume that you are measuring wind
speed at upstream and downstream over wind
turbine. The wind speed at the downstream is
much smaller than the upstream because the
blades absorb some kinetic energy from the
wind.
The efficiency of wind turbine (η): Energy out/
Energy in.
The concept would also allow the blades to
spread out when the wind is blowing lightly to
capture as much power as possible.
A portion of the kinetic energy of wind the
turbine blades converts the torque work (M= F x
r). The wind turbines theoretically of the wind
kinetic energy is 59.26% (Betz's law) exploits
(Fig. 4).
Fig. 4
Increasing wind turbine blade lengths lead to
higher energy production (Fig. 5).
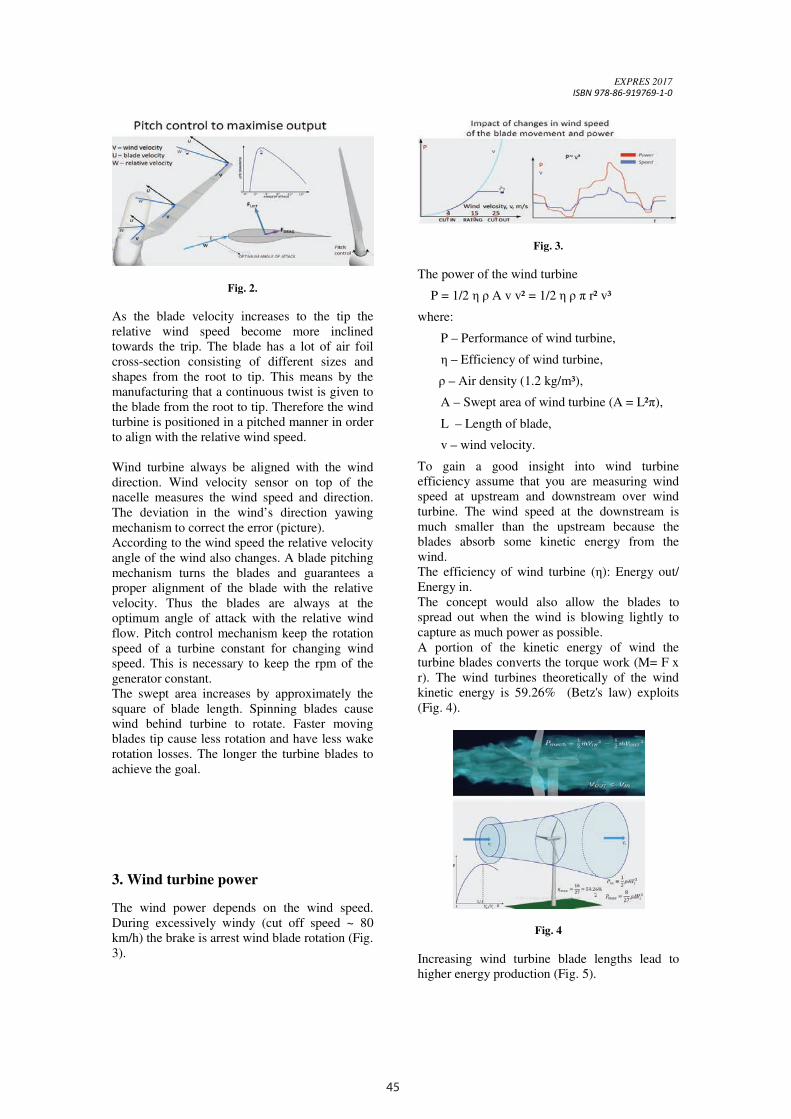
45
EXPRES 2017 ISBN 978-86-919769-1-0
Composite materials for wind power turbine blades R. SZABÓ a, L. SZABÓ b
a Ingtex Bt - Rejtő Sándor Foundation H-1056 Budapest Nyáry Pál u. 5, Hungary
E-mail: [email protected] b
Institute of Environmental Protection Engineering, Rejtő Sándor Faculty of Light Industry and Environmental Protection
Engineering, Óbuda University, H-1034 Budapest, Doberdó u. 6, Hungary
E-mail: [email protected]
Energy is an essential ingredient of socio-economic development and economic growth. Renewable energy sources like wind
energy is domestic and can help in reducing the dependency on fossil fuels. Renewable energy resources, of which wind
energy is prominent, are part of the solution to the global energy problem and reduce the CO₂ emission. Wind turbine and the
rotorblade concepts are reviewed, and loadings by wind and gravity as important factors for the fatigue performance of the
materials are considered.Composites are discussed as candidates for rotor blades. The fibers and matrices for composites are
described, and their high stiffness, low density, and good fatigue performance are emphasized. This presentation will explore
properties of carbon fiber, the advantages/ disadvantage between CFRP and competitive materials as GFRP.
Keywords: airfoil, wind turbine blade, carbon fiber, composites, CFRP, power
1. Introduction
Windmills have been assisting mankind to
convert the energy contained in wind to many
other useful forms for the last three thousand
years. In the early 70s, the serial production of
GRP (glass-fibre reinforced plastics) rotor blades
a length of 17 metres was developed on small
systems, starting in Denmark. In the initial
phases, the achieved performance was
approximately 10 kilowatts bu now we are able
to attain magnitudes of 8 to 10 Megawatts.
Today’s wind turbines are capable of converting
a great amount of energy in the wind into
electricity. This is due to blades which are
developed using state-of-the-art aerodynamic
analysis and other performance-enhancing
equipment. The wind turbine performance
improvement is the key to increase the length of
the blade. The wind blades to make are needed
extremely high loads, high stiffness and high-
strength structural materials. The environmental
load of electricity produced from wind power
generation is the most favourable, so you can
expect a bright future.
2. The wind blade functions
Main components of wind turbines:
Rotor – generates aerodynamic torque from the
wind
Nacelle – converters the torque into electrical
power
Tower – holds nacelle and rotor blades up in the
wind and provides access to the nacelle
Foundation – ensures that the turbine stays upright
The presentation mainly focused on the turbine
blade.
If the blowing wind can turn the blade, we will
receive electricity from the generator that is
attached to it. A lift force is produced when air
moves over an airfoil (Bernoulli-equation) (Fig. 1).
Fig. 1.
The pressure difference on the airfoil makes the
wind turbine blade turn. This way the wind turbine
achieves the basic rotation. Wind turbine blades
turn at a very low rate of rpm. So before the low
speed shaft connecting to the generator the speed
is increased in a gearbox (planetary gear set,
speed ratio ~ 1:90) to achieve the high speed
ratio. The moving wind turbine blade also
experiences the relative wind velocity is as
shown in Fig. 2. [12].
EXPRES 2017 ISBN 978-86-919769-1-0
Fig. 2.
As the blade velocity increases to the tip the
relative wind speed become more inclined
towards the trip. The blade has a lot of air foil
cross-section consisting of different sizes and
shapes from the root to tip. This means by the
manufacturing that a continuous twist is given to
the blade from the root to tip. Therefore the wind
turbine is positioned in a pitched manner in order
to align with the relative wind speed.
Wind turbine always be aligned with the wind
direction. Wind velocity sensor on top of the
nacelle measures the wind speed and direction.
The deviation in the wind’s direction yawing
mechanism to correct the error (picture).
According to the wind speed the relative velocity
angle of the wind also changes. A blade pitching
mechanism turns the blades and guarantees a
proper alignment of the blade with the relative
velocity. Thus the blades are always at the
optimum angle of attack with the relative wind
flow. Pitch control mechanism keep the rotation
speed of a turbine constant for changing wind
speed. This is necessary to keep the rpm of the
generator constant.
The swept area increases by approximately the
square of blade length. Spinning blades cause
wind behind turbine to rotate. Faster moving
blades tip cause less rotation and have less wake
rotation losses. The longer the turbine blades to
achieve the goal.
3. Wind turbine power
The wind power depends on the wind speed.
During excessively windy (cut off speed ~ 80
km/h) the brake is arrest wind blade rotation (Fig.
3).
Fig. 3.
The power of the wind turbine
P = 1/2 η ρ A v v² = 1/2 η ρ π r² v³
where:
P – Performance of wind turbine,
η – Efficiency of wind turbine,
ρ – Air density (1.2 kg/m³),
A – Swept area of wind turbine (A = L²π),
L – Length of blade,
v – wind velocity.
To gain a good insight into wind turbine
efficiency assume that you are measuring wind
speed at upstream and downstream over wind
turbine. The wind speed at the downstream is
much smaller than the upstream because the
blades absorb some kinetic energy from the
wind.
The efficiency of wind turbine (η): Energy out/
Energy in.
The concept would also allow the blades to
spread out when the wind is blowing lightly to
capture as much power as possible.
A portion of the kinetic energy of wind the
turbine blades converts the torque work (M= F x
r). The wind turbines theoretically of the wind
kinetic energy is 59.26% (Betz's law) exploits
(Fig. 4).
Fig. 4
Increasing wind turbine blade lengths lead to
higher energy production (Fig. 5).
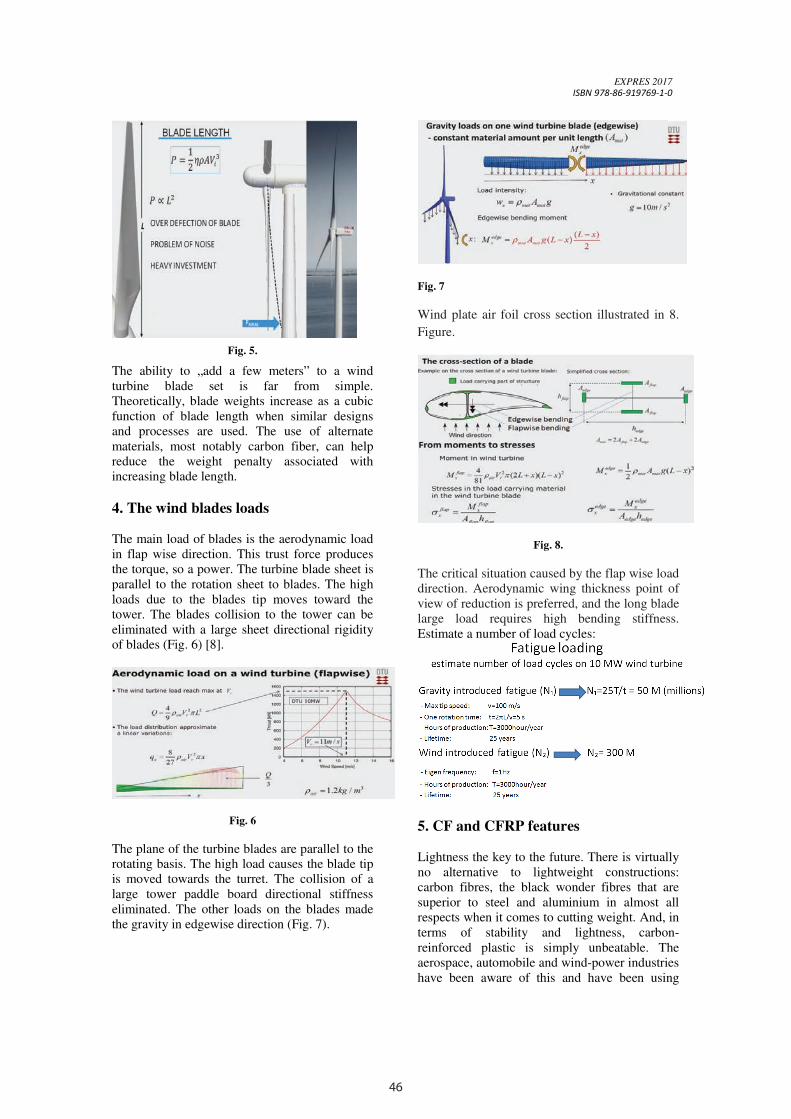
46
EXPRES 2017 ISBN 978-86-919769-1-0
Fig. 5.
The ability to „add a few meters” to a wind
turbine blade set is far from simple.
Theoretically, blade weights increase as a cubic
function of blade length when similar designs
and processes are used. The use of alternate
materials, most notably carbon fiber, can help
reduce the weight penalty associated with
increasing blade length.
4. The wind blades loads
The main load of blades is the aerodynamic load
in flap wise direction. This trust force produces
the torque, so a power. The turbine blade sheet is
parallel to the rotation sheet to blades. The high
loads due to the blades tip moves toward the
tower. The blades collision to the tower can be
eliminated with a large sheet directional rigidity
of blades (Fig. 6) [8].
Fig. 6
The plane of the turbine blades are parallel to the
rotating basis. The high load causes the blade tip
is moved towards the turret. The collision of a
large tower paddle board directional stiffness
eliminated. The other loads on the blades made
the gravity in edgewise direction (Fig. 7).
Fig. 7
Wind plate air foil cross section illustrated in 8.
Figure.
Fig. 8.
The critical situation caused by the flap wise load
direction. Aerodynamic wing thickness point of
view of reduction is preferred, and the long blade
large load requires high bending stiffness.
Estimate a number of load cycles:
5. CF and CFRP features
Lightness the key to the future. There is virtually
no alternative to lightweight constructions:
carbon fibres, the black wonder fibres that are
superior to steel and aluminium in almost all
respects when it comes to cutting weight. And, in
terms of stability and lightness, carbon-
reinforced plastic is simply unbeatable. The
aerospace, automobile and wind-power industries
have been aware of this and have been using
EXPRES 2017 ISBN 978-86-919769-1-0
carbon fiber reinforced polymer for many years.
Without it, much of what we nowadays regard as
given – from Formula 1 racing cars, via the
Airbus A350 to the innumerable large wind
turbines – would not be possible.
The quantity of CF (Carbon Fiber) to other
structural material is a little, but many specific
area key important (Fig. 9).
Fig. 9.
6. Carbon fiber
The excellent mechanical properties of
composites with a thin fibrous materials in the
array relative to a significantly higher strength
and, secondly, in accordance with the load
direction are arranged in a large number of
matrix imbedded fiber structure (anisotropic)
results (Fig. 10) [1].
Fig. 10
The reinforcing fibers (carbon fiber, glass fiber,
p-aramid fibers), and comparison of the steel and
the aluminium main mechanical properties are
shown in Table 1.
Table 1. Strength properties of structural materials
7. Carbon fiber production and
characteristics
Most of the carbon fiber is used reinforced
composite. The growth of demand and
production capacity of carbon fibers is shown in
Figure 11.
Fig. 11.
The structure of carbon fiber from the atomic
structure to the composites are shown in 12.
figure [6].
Fig. 12
The engineering practice previously used for
steel, the strength and stiffness values given in
pascals (N/m²). The density of composites more
lighter then steel, so advisable the specific
strength (free breaking length) and specific
stiffness to use (Fig. 12) [2].
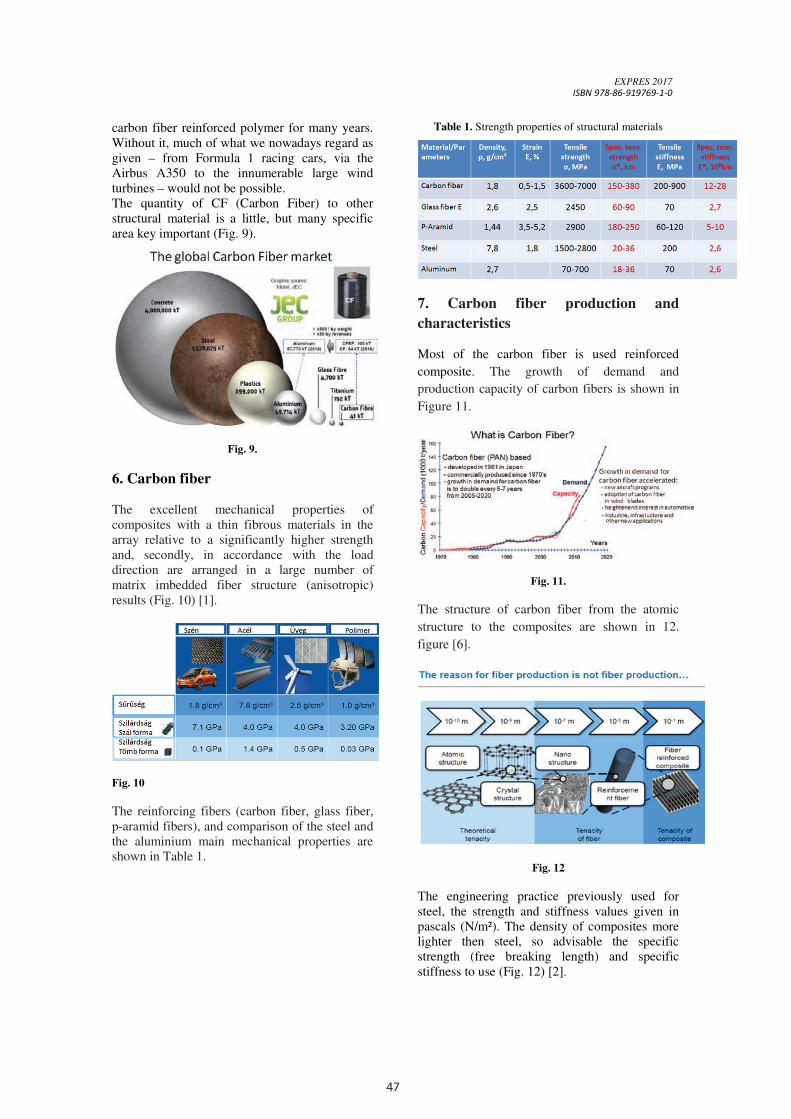
47
EXPRES 2017 ISBN 978-86-919769-1-0
Fig. 5.
The ability to „add a few meters” to a wind
turbine blade set is far from simple.
Theoretically, blade weights increase as a cubic
function of blade length when similar designs
and processes are used. The use of alternate
materials, most notably carbon fiber, can help
reduce the weight penalty associated with
increasing blade length.
4. The wind blades loads
The main load of blades is the aerodynamic load
in flap wise direction. This trust force produces
the torque, so a power. The turbine blade sheet is
parallel to the rotation sheet to blades. The high
loads due to the blades tip moves toward the
tower. The blades collision to the tower can be
eliminated with a large sheet directional rigidity
of blades (Fig. 6) [8].
Fig. 6
The plane of the turbine blades are parallel to the
rotating basis. The high load causes the blade tip
is moved towards the turret. The collision of a
large tower paddle board directional stiffness
eliminated. The other loads on the blades made
the gravity in edgewise direction (Fig. 7).
Fig. 7
Wind plate air foil cross section illustrated in 8.
Figure.
Fig. 8.
The critical situation caused by the flap wise load
direction. Aerodynamic wing thickness point of
view of reduction is preferred, and the long blade
large load requires high bending stiffness.
Estimate a number of load cycles:
5. CF and CFRP features
Lightness the key to the future. There is virtually
no alternative to lightweight constructions:
carbon fibres, the black wonder fibres that are
superior to steel and aluminium in almost all
respects when it comes to cutting weight. And, in
terms of stability and lightness, carbon-
reinforced plastic is simply unbeatable. The
aerospace, automobile and wind-power industries
have been aware of this and have been using
EXPRES 2017 ISBN 978-86-919769-1-0
carbon fiber reinforced polymer for many years.
Without it, much of what we nowadays regard as
given – from Formula 1 racing cars, via the
Airbus A350 to the innumerable large wind
turbines – would not be possible.
The quantity of CF (Carbon Fiber) to other
structural material is a little, but many specific
area key important (Fig. 9).
Fig. 9.
6. Carbon fiber
The excellent mechanical properties of
composites with a thin fibrous materials in the
array relative to a significantly higher strength
and, secondly, in accordance with the load
direction are arranged in a large number of
matrix imbedded fiber structure (anisotropic)
results (Fig. 10) [1].
Fig. 10
The reinforcing fibers (carbon fiber, glass fiber,
p-aramid fibers), and comparison of the steel and
the aluminium main mechanical properties are
shown in Table 1.
Table 1. Strength properties of structural materials
7. Carbon fiber production and
characteristics
Most of the carbon fiber is used reinforced
composite. The growth of demand and
production capacity of carbon fibers is shown in
Figure 11.
Fig. 11.
The structure of carbon fiber from the atomic
structure to the composites are shown in 12.
figure [6].
Fig. 12
The engineering practice previously used for
steel, the strength and stiffness values given in
pascals (N/m²). The density of composites more
lighter then steel, so advisable the specific
strength (free breaking length) and specific
stiffness to use (Fig. 12) [2].
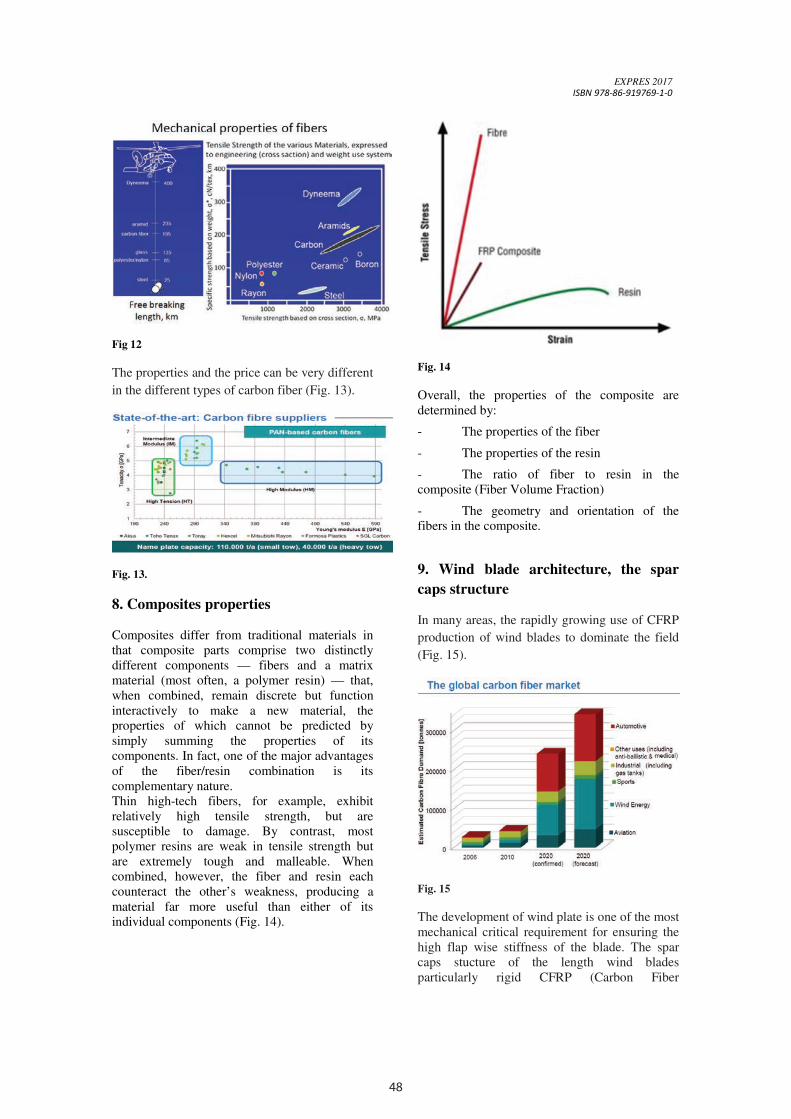
48
EXPRES 2017 ISBN 978-86-919769-1-0
Fig 12
The properties and the price can be very different
in the different types of carbon fiber (Fig. 13).
Fig. 13.
8. Composites properties
Composites differ from traditional materials in
that composite parts comprise two distinctly
different components — fibers and a matrix
material (most often, a polymer resin) — that,
when combined, remain discrete but function
interactively to make a new material, the
properties of which cannot be predicted by
simply summing the properties of its
components. In fact, one of the major advantages
of the fiber/resin combination is its
complementary nature.
Thin high-tech fibers, for example, exhibit
relatively high tensile strength, but are
susceptible to damage. By contrast, most
polymer resins are weak in tensile strength but
are extremely tough and malleable. When
combined, however, the fiber and resin each
counteract the other’s weakness, producing a
material far more useful than either of its
individual components (Fig. 14).
Fig. 14
Overall, the properties of the composite are
determined by:
- The properties of the fiber
- The properties of the resin
- The ratio of fiber to resin in the
composite (Fiber Volume Fraction)
- The geometry and orientation of the
fibers in the composite.
9. Wind blade architecture, the spar
caps structure
In many areas, the rapidly growing use of CFRP
production of wind blades to dominate the field
(Fig. 15).
Fig. 15
The development of wind plate is one of the most
mechanical critical requirement for ensuring the
high flap wise stiffness of the blade. The spar
caps stucture of the length wind blades
particularly rigid CFRP (Carbon Fiber
EXPRES 2017 ISBN 978-86-919769-1-0
Reinforced Polimer) with UD (Uni Directionally)
fiber orientacio. Wind blade is some of the
world's biggest constructions (fig. 16).
Fig. 16
Global wind installations were 54.6 GW in 2016,
some 14% lower than the record 63.6 GW
installed in 2015. In 2016 to implement the ten
largest wind turbine capacity increase investment
in the country's pie chat illustrated.
10. Market characteristics of wind
turbines
Global wind installations were 54.6 GW in 2016,
some 14% lower than the record 63.6 GW
installed in 2015. In China, the most active wind
power market, annual wind installations fell from
30 GW in 2015 to 23 GW in 2016 (Fig. 16).
Fig. 16
The world wind power capacity and the increase
of the annual variation in the 17. Figure
illustrates [10].
Fig. 17
The wind turbines can be placed on land (onshore)
at sea (offshore fix and float). The greatest wind
blade (d=180 m) constructed offshore, the water
depth 10-50 m. By countries wind power capacity
in 2015 and has an installed capacity shown in Fig.
18.
Fig. 18
Europe wind investments rise 5% on offshore
surge. Europe's total installed wind capacity was
153.7 GW at the end of 2016. Wind power
provided 10% of Europe's power last year
(Fig.19).
Fig. 19

49
EXPRES 2017 ISBN 978-86-919769-1-0
Fig 12
The properties and the price can be very different
in the different types of carbon fiber (Fig. 13).
Fig. 13.
8. Composites properties
Composites differ from traditional materials in
that composite parts comprise two distinctly
different components — fibers and a matrix
material (most often, a polymer resin) — that,
when combined, remain discrete but function
interactively to make a new material, the
properties of which cannot be predicted by
simply summing the properties of its
components. In fact, one of the major advantages
of the fiber/resin combination is its
complementary nature.
Thin high-tech fibers, for example, exhibit
relatively high tensile strength, but are
susceptible to damage. By contrast, most
polymer resins are weak in tensile strength but
are extremely tough and malleable. When
combined, however, the fiber and resin each
counteract the other’s weakness, producing a
material far more useful than either of its
individual components (Fig. 14).
Fig. 14
Overall, the properties of the composite are
determined by:
- The properties of the fiber
- The properties of the resin
- The ratio of fiber to resin in the
composite (Fiber Volume Fraction)
- The geometry and orientation of the
fibers in the composite.
9. Wind blade architecture, the spar
caps structure
In many areas, the rapidly growing use of CFRP
production of wind blades to dominate the field
(Fig. 15).
Fig. 15
The development of wind plate is one of the most
mechanical critical requirement for ensuring the
high flap wise stiffness of the blade. The spar
caps stucture of the length wind blades
particularly rigid CFRP (Carbon Fiber
EXPRES 2017 ISBN 978-86-919769-1-0
Reinforced Polimer) with UD (Uni Directionally)
fiber orientacio. Wind blade is some of the
world's biggest constructions (fig. 16).
Fig. 16
Global wind installations were 54.6 GW in 2016,
some 14% lower than the record 63.6 GW
installed in 2015. In 2016 to implement the ten
largest wind turbine capacity increase investment
in the country's pie chat illustrated.
10. Market characteristics of wind
turbines
Global wind installations were 54.6 GW in 2016,
some 14% lower than the record 63.6 GW
installed in 2015. In China, the most active wind
power market, annual wind installations fell from
30 GW in 2015 to 23 GW in 2016 (Fig. 16).
Fig. 16
The world wind power capacity and the increase
of the annual variation in the 17. Figure
illustrates [10].
Fig. 17
The wind turbines can be placed on land (onshore)
at sea (offshore fix and float). The greatest wind
blade (d=180 m) constructed offshore, the water
depth 10-50 m. By countries wind power capacity
in 2015 and has an installed capacity shown in Fig.
18.
Fig. 18
Europe wind investments rise 5% on offshore
surge. Europe's total installed wind capacity was
153.7 GW at the end of 2016. Wind power
provided 10% of Europe's power last year
(Fig.19).
Fig. 19

50
EXPRES 2017 ISBN 978-86-919769-1-0
11. Conclusion
To lower the cost of energy from wind turbines,
designers have focused on the power-generating
capacity of each turbine. Carbon fibre-reinforced
plastics make it possible to create even larger and
better optimised rotor blades for wind power
systems. They have lengthened blades to capture
more wind. The size of these gigantic blade
length has increased 10 per cent annually and
doubled approximately every seven years.
Automated manufacturing processes will be
further developed to reduce costs and improve
quality. Further, performance, aerodynamics and
aero acoustics will also be improved. And we
will have large, divided blades which will enable
the challenges of transportation and installation
to be solved more easily.
References
[1] Steinmann: Carbon fibers: an overview on manufacturing, research and market ITA/RWTH Aachen University Mitteilungen 2015.
[2] Szabó L. – Szabó R.: Kompozitok Magyar Textiltechnika 2014/4. p. 2-7.
[3] T. Gries, – B.: Veihelmann: Kombinierte Faserverbundstrukturen zum Aufprallschutz Institut für Textiltechnik der RWTH Aachen (ITA)
[4] Czvikovszky T. – Nagy P. – Gaál J.: A polimertechnika alapjai Műegyetemi
[5] K. Durst: Faserverbunde im Automobilbau: Warum „leicht“ schwer ist Material 13. 10. 2009, München
[6] Szabó R.: A könnyű a jövő XVII. ENELKO 2016. Kolozsvár, 2016. október 6-9. p. 146-151.
[7] www.google.hu The wind resource - Sustainable Energy - TU Delft
[8] www.google.hu Aerodynamic theory - Sustainable Energy - TU Delft
[9] www.google.hu Future trends in wind energy - Sustainable Energy - TU Delft
[10] www.google.hu Global wind report annual market update 2015
[11] www.google.hu Global wind installs dip as China growth slows; Vestas
[12] www.google.hu How do Wind Turbines work ?
EXPRES 2017 ISBN 978-86-919769-1-0
Application of machine learning techniques in forecasting energy efficiency in buildings
O. GRLJEVIĆ a, L. SERES b, S. BOŠNJAK c
Department of Business Informatics and Quantitative Methods, University of Novi Sad, Faculty of Economics Subotica,
Segedinski put 9-11, Serbia a E-mail: [email protected] b E-mail: [email protected] c E-mail: [email protected]
Improvement of energy efficiency in buildings is crucial to achieving the goals of efficient energy consumption, to tackle climate
change and secure energy supply. This paper illustrates potential use of machine learning approaches, in particular classification,
for prediction of the heating load and the cooling load. These two aspects are crucial for energy efficient building design. We
study the effect of eight different variables on the heating and cooling loads and examine results of different classifiers. The
results prove suitability of machine learning approach in the field of energy efficiency in buildings, as well as the fact that rule-
based classifiers perform better on the given set of inputs.
Keywords: Building energy evaluation, Heating load, Cooling load, Machine learning, Classification
1. Introduction Efficient consumption of energy, as a general social
imperative, implies ensuring a stable financial system,
appropriate institutional and legislative framework
and activities to promote public awareness and change
in the habits regarding energy consumption.
The European Union (EU) has adopted Directive
[3] for efficient usage of energy among end-users and
energy services which include achieving significant
energy savings (20% of the greenhouse gases
emissions by 2020 and a 20% energy savings by
2020), as well as obligations to introduce measures
and incentives to promote energy efficiency at the
national level for all Member States [1]. Under the
Energy efficiency Directive EU countries must draw
up National Energy Efficiency Action Plans every
three years. These Action Plans include improvement
measures for energy performance of products,
buildings and services, the improvement of energy
production and distribution, reduction of the impact of
transport on energy consumption, facilitation of
financing and investments in the sector, and
encouragement of rational energy consumption.
The population can have little influence on
energy supply, due to the given natural resources.
However, they can influence the energy demand by
reducing energy consumption. In order to mitigate
climate change the general public has to change its
lifestyle to a less energy-intensive. According to the
report presented in [2] average global temperatures are
likely to rise by 2–3 °C within the next 50 years if a
current emission trends continue. Efficient
consumption of the end-users is also gaining an
increased importance within the European national
policy and the EU objectives related to climate and
energy. According to the European Commission,
residential buildings are responsible for 40% of
energy consumption and 36% of carbon dioxide
emissions in the EU. Potential energy savings in
residential areas and commercial buildings are
estimated at about 27% and 30%, respectively [1].
Similarly to the EU, residential buildings are the
largest consumers of energy in Serbia. The share of
renewable energy in total energy consumption of the
EU for the year 2014 was only 12.5% [3], and Serbia
is only at the beginning of use of renewable energy
sources.
Heating, ventilation, and air conditioning
(HVAC) play crucial role in regulation of indoor
temperatures and have the highest impact on energy
consumption in buildings. One of the ways to mitigate
increased demand for energy is to design and build
energy efficient buildings. EU Directive on energy
performance of buildings [1] obligates Member States
to apply minimum requirements to the energy
performance of new and existing buildings, to ensure
the certification of their energy performance and
require the regular inspection of boilers and air
conditioning systems in buildings. Similar to the EU
Directive, Serbia complies to the Regulations on
energy efficiency of buildings [4] which regulates
assessment of the energy efficiency of the building
based on the heating load, while it is planned to
include the cooling load in the future. Evaluation of
the overall energy efficiency of a building, according

51
EXPRES 2017 ISBN 978-86-919769-1-0
11. Conclusion
To lower the cost of energy from wind turbines,
designers have focused on the power-generating
capacity of each turbine. Carbon fibre-reinforced
plastics make it possible to create even larger and
better optimised rotor blades for wind power
systems. They have lengthened blades to capture
more wind. The size of these gigantic blade
length has increased 10 per cent annually and
doubled approximately every seven years.
Automated manufacturing processes will be
further developed to reduce costs and improve
quality. Further, performance, aerodynamics and
aero acoustics will also be improved. And we
will have large, divided blades which will enable
the challenges of transportation and installation
to be solved more easily.
References
[1] Steinmann: Carbon fibers: an overview on manufacturing, research and market ITA/RWTH Aachen University Mitteilungen 2015.
[2] Szabó L. – Szabó R.: Kompozitok Magyar Textiltechnika 2014/4. p. 2-7.
[3] T. Gries, – B.: Veihelmann: Kombinierte Faserverbundstrukturen zum Aufprallschutz Institut für Textiltechnik der RWTH Aachen (ITA)
[4] Czvikovszky T. – Nagy P. – Gaál J.: A polimertechnika alapjai Műegyetemi
[5] K. Durst: Faserverbunde im Automobilbau: Warum „leicht“ schwer ist Material 13. 10. 2009, München
[6] Szabó R.: A könnyű a jövő XVII. ENELKO 2016. Kolozsvár, 2016. október 6-9. p. 146-151.
[7] www.google.hu The wind resource - Sustainable Energy - TU Delft
[8] www.google.hu Aerodynamic theory - Sustainable Energy - TU Delft
[9] www.google.hu Future trends in wind energy - Sustainable Energy - TU Delft
[10] www.google.hu Global wind report annual market update 2015
[11] www.google.hu Global wind installs dip as China growth slows; Vestas
[12] www.google.hu How do Wind Turbines work ?
EXPRES 2017 ISBN 978-86-919769-1-0
Application of machine learning techniques in forecasting energy efficiency in buildings
O. GRLJEVIĆ a, L. SERES b, S. BOŠNJAK c
Department of Business Informatics and Quantitative Methods, University of Novi Sad, Faculty of Economics Subotica,
Segedinski put 9-11, Serbia a E-mail: [email protected] b E-mail: [email protected] c E-mail: [email protected]
Improvement of energy efficiency in buildings is crucial to achieving the goals of efficient energy consumption, to tackle climate
change and secure energy supply. This paper illustrates potential use of machine learning approaches, in particular classification,
for prediction of the heating load and the cooling load. These two aspects are crucial for energy efficient building design. We
study the effect of eight different variables on the heating and cooling loads and examine results of different classifiers. The
results prove suitability of machine learning approach in the field of energy efficiency in buildings, as well as the fact that rule-
based classifiers perform better on the given set of inputs.
Keywords: Building energy evaluation, Heating load, Cooling load, Machine learning, Classification
1. Introduction Efficient consumption of energy, as a general social
imperative, implies ensuring a stable financial system,
appropriate institutional and legislative framework
and activities to promote public awareness and change
in the habits regarding energy consumption.
The European Union (EU) has adopted Directive
[3] for efficient usage of energy among end-users and
energy services which include achieving significant
energy savings (20% of the greenhouse gases
emissions by 2020 and a 20% energy savings by
2020), as well as obligations to introduce measures
and incentives to promote energy efficiency at the
national level for all Member States [1]. Under the
Energy efficiency Directive EU countries must draw
up National Energy Efficiency Action Plans every
three years. These Action Plans include improvement
measures for energy performance of products,
buildings and services, the improvement of energy
production and distribution, reduction of the impact of
transport on energy consumption, facilitation of
financing and investments in the sector, and
encouragement of rational energy consumption.
The population can have little influence on
energy supply, due to the given natural resources.
However, they can influence the energy demand by
reducing energy consumption. In order to mitigate
climate change the general public has to change its
lifestyle to a less energy-intensive. According to the
report presented in [2] average global temperatures are
likely to rise by 2–3 °C within the next 50 years if a
current emission trends continue. Efficient
consumption of the end-users is also gaining an
increased importance within the European national
policy and the EU objectives related to climate and
energy. According to the European Commission,
residential buildings are responsible for 40% of
energy consumption and 36% of carbon dioxide
emissions in the EU. Potential energy savings in
residential areas and commercial buildings are
estimated at about 27% and 30%, respectively [1].
Similarly to the EU, residential buildings are the
largest consumers of energy in Serbia. The share of
renewable energy in total energy consumption of the
EU for the year 2014 was only 12.5% [3], and Serbia
is only at the beginning of use of renewable energy
sources.
Heating, ventilation, and air conditioning
(HVAC) play crucial role in regulation of indoor
temperatures and have the highest impact on energy
consumption in buildings. One of the ways to mitigate
increased demand for energy is to design and build
energy efficient buildings. EU Directive on energy
performance of buildings [1] obligates Member States
to apply minimum requirements to the energy
performance of new and existing buildings, to ensure
the certification of their energy performance and
require the regular inspection of boilers and air
conditioning systems in buildings. Similar to the EU
Directive, Serbia complies to the Regulations on
energy efficiency of buildings [4] which regulates
assessment of the energy efficiency of the building
based on the heating load, while it is planned to
include the cooling load in the future. Evaluation of
the overall energy efficiency of a building, according
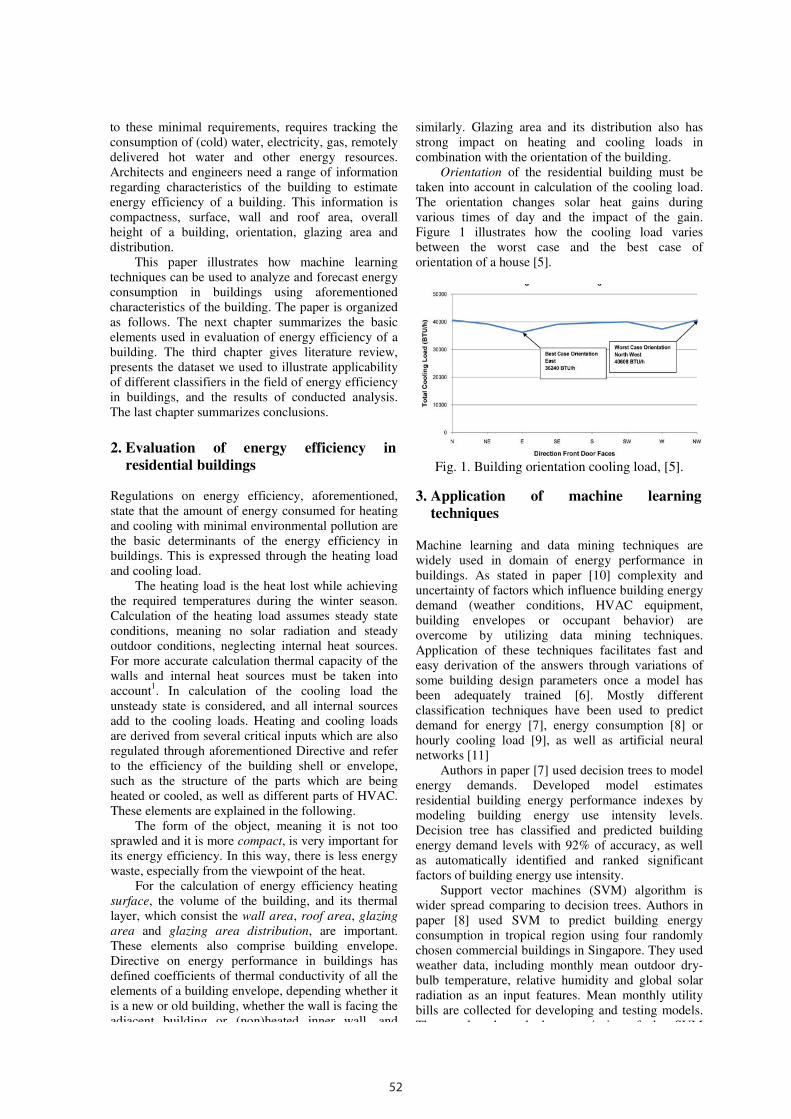
52
to these minimal requirements, requires tracking the
consumption of (cold) water, electricity, gas, remotely
delivered hot water and other energy resources.
Architects and engineers need a range of information
regarding characteristics of the building to estimate
energy efficiency of a building. This information is
compactness, surface, wall and roof area, overall
height of a building, orientation, glazing area and
distribution.
This paper illustrates how machine learning
techniques can be used to analyze and forecast energy
consumption in buildings using aforementioned
characteristics of the building. The paper is organized
as follows. The next chapter summarizes the basic
elements used in evaluation of energy efficiency of a
building. The third chapter gives literature review,
presents the dataset we used to illustrate applicability
of different classifiers in the field of energy efficiency
in buildings, and the results of conducted analysis.
The last chapter summarizes conclusions.
2. Evaluation of energy efficiency in
residential buildings
Regulations on energy efficiency, aforementioned,
state that the amount of energy consumed for heating
and cooling with minimal environmental pollution are
the basic determinants of the energy efficiency in
buildings. This is expressed through the heating load
and cooling load.
The heating load is the heat lost while achieving
the required temperatures during the winter season.
Calculation of the heating load assumes steady state
conditions, meaning no solar radiation and steady
outdoor conditions, neglecting internal heat sources.
For more accurate calculation thermal capacity of the
walls and internal heat sources must be taken into
account1. In calculation of the cooling load the
unsteady state is considered, and all internal sources
add to the cooling loads. Heating and cooling loads
are derived from several critical inputs which are also
regulated through aforementioned Directive and refer
to the efficiency of the building shell or envelope,
such as the structure of the parts which are being
heated or cooled, as well as different parts of HVAC.
These elements are explained in the following.
The form of the object, meaning it is not too
sprawled and it is more compact, is very important for
its energy efficiency. In this way, there is less energy
waste, especially from the viewpoint of the heat.
For the calculation of energy efficiency heating
surface, the volume of the building, and its thermal
layer, which consist the wall area, roof area, glazing
area and glazing area distribution, are important.
These elements also comprise building envelope.
Directive on energy performance in buildings has
defined coefficients of thermal conductivity of all the
elements of a building envelope, depending whether it
is a new or old building, whether the wall is facing the
adjacent building or (non)heated inner wall, and
similarly. Glazing area and its distribution also has
strong impact on heating and cooling loads in
combination with the orientation of the building.
Orientation of the residential building must be
taken into account in calculation of the cooling load.
The orientation changes solar heat gains during
various times of day and the impact of the gain.
Figure 1 illustrates how the cooling load varies
between the worst case and the best case of
orientation of a house [5].
Fig. 1. Building orientation cooling load, [5].
3. Application of machine learning
techniques Machine learning and data mining techniques are
widely used in domain of energy performance in
buildings. As stated in paper [10] complexity and
uncertainty of factors which influence building energy
demand (weather conditions, HVAC equipment,
building envelopes or occupant behavior) are
overcome by utilizing data mining techniques.
Application of these techniques facilitates fast and
easy derivation of the answers through variations of
some building design parameters once a model has
been adequately trained [6]. Mostly different
classification techniques have been used to predict
demand for energy [7], energy consumption [8] or
hourly cooling load [9], as well as artificial neural
networks [11]
Authors in paper [7] used decision trees to model
energy demands. Developed model estimates
residential building energy performance indexes by
modeling building energy use intensity levels.
Decision tree has classified and predicted building
energy demand levels with 92% of accuracy, as well
as automatically identified and ranked significant
factors of building energy use intensity.
Support vector machines (SVM) algorithm is
wider spread comparing to decision trees. Authors in
paper [8] used SVM to predict building energy
consumption in tropical region using four randomly
chosen commercial buildings in Singapore. They used
weather data, including monthly mean outdoor dry-
bulb temperature, relative humidity and global solar
radiation as an input features. Mean monthly utility
bills are collected for developing and testing models.
The results showed the superiority of the SVM
for hourly changes in cooling load. They used the
outdoor dry-bulb temperature, relative humidity and
solar radiation as the input parameters. The results
also proved superiority of SVM method in terms of
accuracy and generalization comparing to traditional
artificial neural network model.
Artificial neural networks are more reliable than
traditional simulation models and regression
techniques in predicting energy consumption. As
demonstrated in [12, 13] neural networks successfully
predict heating and cooling loads of a building. In
paper [12] authors used 250 known cases of heating
load in combination with type of room and its
characteristics to train neural network, such as areas
of windows, walls, partitions and floors, the type of
windows and walls, roof or ceiling. The accuracy of
the prediction was improved by grouping the input
data into two categories, one with spaces of floor
areas up to 7 m2 and another with floor areas from 7
to 100 m2. Authors in [13] used neural networks to
predict both heating and cooling loads in nine
different buildings in Cyprus. In addition to daily
loads authors used single and double walls, as well as
different roof insulations. High accuracy was achieved
for both types of loads (R2-values are 0.9885 for
heating load and 0.9905 for cooling load) and the
results indicate that the proposed method can be used
for the required predictions for buildings of different
constructions.
In the following we present the case study based
on the publicly available data regarding energy
efficiency in buildings. We extend research presented
in the paper [6] experimenting with different
classifiers compared to the classifiers used in
previously described papers.
Energy efficiency dataset
Simulations of building energy aspects are widely
used approach. Although, it is impossible to
guarantee that the simulation findings will perfectly
reflect actual data in the real world simulated results
give good indication of the likely percentage change
and underlying trend of the actual data and enable
energy comparisons of buildings [6]. Authors of the
paper [6] associated heating load (Y1) and cooling
load (Y2) with eight variables: relative compactness
(X1), surface area (X2), wall area (X3), roof area
(X4), overall height (X5), orientation (X6), glazing
area (X7), and glazing area distribution (X8). These
parameters are used in an environmental analysis
tool Ecotect, which allows designers to simulate
building performance from the earliest stages of
conceptual design, to simulate 768 different
buildings with the same volume of 771.75 m2, but
different surface areas and dimensions. Detailed
description of used parameters, building
characteristics, location, occupancy, and internal
design conditions, as well as the simulation process
is described in the paper [6]. Resulting dataset is
publicly available2 and it is used in this paper to
further the research presented in the paper [6]. The
authors of the paper [6] used standard robust linear
regression technique, and a powerful nonlinear non-
parametric classifier, while this paper presents
comparison of different classifiers. In addition to
regression we used meta-, lazy-, rule- and tree-based
classifiers. Our approach illustrates that rule-based
classifiers outperform all other classifiers.
Dataset contains all numeric variables. There
are no missing values. Table 1 presents basic
statistics of dataset and correlation of input and
output attributes (Y1 and Y2).
Table 1. Basic statistics of the dataset
Simple statistics illustrate the need for data
normalization, since values of attributes vary on
quite different spans. Normalization refers to data
transformation which will result in scaling of all
attributes on the range from 0 to 1. Such preparation
facilitates comparison of attributes. Statistics
presented in Table 1 point to conclusion that the
strongest association is between X4 and X5 input
attributes with both output attributes. X4 attribute, i.e. roof area, is inversely proportional to Y1
(heating load) and Y2 (cooling load) attributes,
while X5 attribute, i.e. overall height, is in positive
and proportional relationship with output attributes.
Prediction models of heating and cooling loads
Classification represents well known supervised data
mining approach. It is a process of finding the
common properties of data objects that belong to the
same class [16]. Data labeled by the class to which
each object belongs is used to train classifier [14].
The main task of classification is to build a model
that will enable correct classification of the newly
encountered instances. Authors of the [15] have
formally defined classification as follows. A dataset
of observations is described with a fix number of
attributes Ai, and designated class attribute C. The
learning task is to find a mapping f that is able to
compute the class value C = f (A1, ... , An) from the
attribute values of new, previously unseen
observations.
Based on the input attributes we developed
Min Max Mean StdCorrel
Y1
Correl
Y2
X1 0.62 0.98 0.76 0.11 0.62 0.63
X2 514.50 808.50 671.71 88.09 -0.66 -0.67
X3 245.00 416.50 318.50 43.63 0.46 0.43
X4 110.25 220.50 176.60 45.17 -0.86 -0.86
X5 3.50 7.00 5.25 1.75 0.89 0.90
X6 2.00 5.00 3.50 1.12 0.00 0.01
X7 0.00 0.40 0.23 0.13 0.27 0.21
X8 0.00 5.00 2.81 1.55 0.09 0.05
Y1 6.01 43.10 22.31 10.09 - 0.98
Y2 10.90 48.03 24.59 9.51 0.98 -
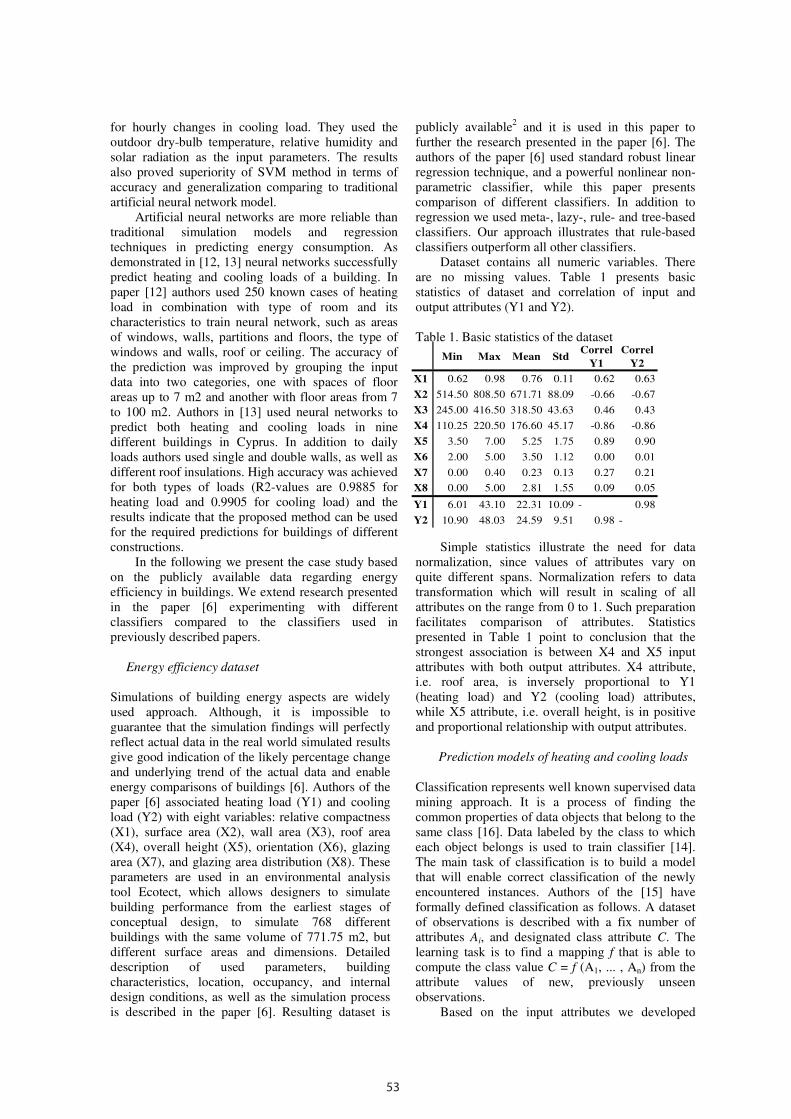
53
to these minimal requirements, requires tracking the
consumption of (cold) water, electricity, gas, remotely
delivered hot water and other energy resources.
Architects and engineers need a range of information
regarding characteristics of the building to estimate
energy efficiency of a building. This information is
compactness, surface, wall and roof area, overall
height of a building, orientation, glazing area and
distribution.
This paper illustrates how machine learning
techniques can be used to analyze and forecast energy
consumption in buildings using aforementioned
characteristics of the building. The paper is organized
as follows. The next chapter summarizes the basic
elements used in evaluation of energy efficiency of a
building. The third chapter gives literature review,
presents the dataset we used to illustrate applicability
of different classifiers in the field of energy efficiency
in buildings, and the results of conducted analysis.
The last chapter summarizes conclusions.
2. Evaluation of energy efficiency in
residential buildings
Regulations on energy efficiency, aforementioned,
state that the amount of energy consumed for heating
and cooling with minimal environmental pollution are
the basic determinants of the energy efficiency in
buildings. This is expressed through the heating load
and cooling load.
The heating load is the heat lost while achieving
the required temperatures during the winter season.
Calculation of the heating load assumes steady state
conditions, meaning no solar radiation and steady
outdoor conditions, neglecting internal heat sources.
For more accurate calculation thermal capacity of the
walls and internal heat sources must be taken into
account1. In calculation of the cooling load the
unsteady state is considered, and all internal sources
add to the cooling loads. Heating and cooling loads
are derived from several critical inputs which are also
regulated through aforementioned Directive and refer
to the efficiency of the building shell or envelope,
such as the structure of the parts which are being
heated or cooled, as well as different parts of HVAC.
These elements are explained in the following.
The form of the object, meaning it is not too
sprawled and it is more compact, is very important for
its energy efficiency. In this way, there is less energy
waste, especially from the viewpoint of the heat.
For the calculation of energy efficiency heating
surface, the volume of the building, and its thermal
layer, which consist the wall area, roof area, glazing
area and glazing area distribution, are important.
These elements also comprise building envelope.
Directive on energy performance in buildings has
defined coefficients of thermal conductivity of all the
elements of a building envelope, depending whether it
is a new or old building, whether the wall is facing the
adjacent building or (non)heated inner wall, and
similarly. Glazing area and its distribution also has
strong impact on heating and cooling loads in
combination with the orientation of the building.
Orientation of the residential building must be
taken into account in calculation of the cooling load.
The orientation changes solar heat gains during
various times of day and the impact of the gain.
Figure 1 illustrates how the cooling load varies
between the worst case and the best case of
orientation of a house [5].
Fig. 1. Building orientation cooling load, [5].
3. Application of machine learning
techniques Machine learning and data mining techniques are
widely used in domain of energy performance in
buildings. As stated in paper [10] complexity and
uncertainty of factors which influence building energy
demand (weather conditions, HVAC equipment,
building envelopes or occupant behavior) are
overcome by utilizing data mining techniques.
Application of these techniques facilitates fast and
easy derivation of the answers through variations of
some building design parameters once a model has
been adequately trained [6]. Mostly different
classification techniques have been used to predict
demand for energy [7], energy consumption [8] or
hourly cooling load [9], as well as artificial neural
networks [11]
Authors in paper [7] used decision trees to model
energy demands. Developed model estimates
residential building energy performance indexes by
modeling building energy use intensity levels.
Decision tree has classified and predicted building
energy demand levels with 92% of accuracy, as well
as automatically identified and ranked significant
factors of building energy use intensity.
Support vector machines (SVM) algorithm is
wider spread comparing to decision trees. Authors in
paper [8] used SVM to predict building energy
consumption in tropical region using four randomly
chosen commercial buildings in Singapore. They used
weather data, including monthly mean outdoor dry-
bulb temperature, relative humidity and global solar
radiation as an input features. Mean monthly utility
bills are collected for developing and testing models.
The results showed the superiority of the SVM
for hourly changes in cooling load. They used the
outdoor dry-bulb temperature, relative humidity and
solar radiation as the input parameters. The results
also proved superiority of SVM method in terms of
accuracy and generalization comparing to traditional
artificial neural network model.
Artificial neural networks are more reliable than
traditional simulation models and regression
techniques in predicting energy consumption. As
demonstrated in [12, 13] neural networks successfully
predict heating and cooling loads of a building. In
paper [12] authors used 250 known cases of heating
load in combination with type of room and its
characteristics to train neural network, such as areas
of windows, walls, partitions and floors, the type of
windows and walls, roof or ceiling. The accuracy of
the prediction was improved by grouping the input
data into two categories, one with spaces of floor
areas up to 7 m2 and another with floor areas from 7
to 100 m2. Authors in [13] used neural networks to
predict both heating and cooling loads in nine
different buildings in Cyprus. In addition to daily
loads authors used single and double walls, as well as
different roof insulations. High accuracy was achieved
for both types of loads (R2-values are 0.9885 for
heating load and 0.9905 for cooling load) and the
results indicate that the proposed method can be used
for the required predictions for buildings of different
constructions.
In the following we present the case study based
on the publicly available data regarding energy
efficiency in buildings. We extend research presented
in the paper [6] experimenting with different
classifiers compared to the classifiers used in
previously described papers.
Energy efficiency dataset
Simulations of building energy aspects are widely
used approach. Although, it is impossible to
guarantee that the simulation findings will perfectly
reflect actual data in the real world simulated results
give good indication of the likely percentage change
and underlying trend of the actual data and enable
energy comparisons of buildings [6]. Authors of the
paper [6] associated heating load (Y1) and cooling
load (Y2) with eight variables: relative compactness
(X1), surface area (X2), wall area (X3), roof area
(X4), overall height (X5), orientation (X6), glazing
area (X7), and glazing area distribution (X8). These
parameters are used in an environmental analysis
tool Ecotect, which allows designers to simulate
building performance from the earliest stages of
conceptual design, to simulate 768 different
buildings with the same volume of 771.75 m2, but
different surface areas and dimensions. Detailed
description of used parameters, building
characteristics, location, occupancy, and internal
design conditions, as well as the simulation process
is described in the paper [6]. Resulting dataset is
publicly available2 and it is used in this paper to
further the research presented in the paper [6]. The
authors of the paper [6] used standard robust linear
regression technique, and a powerful nonlinear non-
parametric classifier, while this paper presents
comparison of different classifiers. In addition to
regression we used meta-, lazy-, rule- and tree-based
classifiers. Our approach illustrates that rule-based
classifiers outperform all other classifiers.
Dataset contains all numeric variables. There
are no missing values. Table 1 presents basic
statistics of dataset and correlation of input and
output attributes (Y1 and Y2).
Table 1. Basic statistics of the dataset
Simple statistics illustrate the need for data
normalization, since values of attributes vary on
quite different spans. Normalization refers to data
transformation which will result in scaling of all
attributes on the range from 0 to 1. Such preparation
facilitates comparison of attributes. Statistics
presented in Table 1 point to conclusion that the
strongest association is between X4 and X5 input
attributes with both output attributes. X4 attribute, i.e. roof area, is inversely proportional to Y1
(heating load) and Y2 (cooling load) attributes,
while X5 attribute, i.e. overall height, is in positive
and proportional relationship with output attributes.
Prediction models of heating and cooling loads
Classification represents well known supervised data
mining approach. It is a process of finding the
common properties of data objects that belong to the
same class [16]. Data labeled by the class to which
each object belongs is used to train classifier [14].
The main task of classification is to build a model
that will enable correct classification of the newly
encountered instances. Authors of the [15] have
formally defined classification as follows. A dataset
of observations is described with a fix number of
attributes Ai, and designated class attribute C. The
learning task is to find a mapping f that is able to
compute the class value C = f (A1, ... , An) from the
attribute values of new, previously unseen
observations.
Based on the input attributes we developed
Min Max Mean StdCorrel
Y1
Correl
Y2
X1 0.62 0.98 0.76 0.11 0.62 0.63
X2 514.50 808.50 671.71 88.09 -0.66 -0.67
X3 245.00 416.50 318.50 43.63 0.46 0.43
X4 110.25 220.50 176.60 45.17 -0.86 -0.86
X5 3.50 7.00 5.25 1.75 0.89 0.90
X6 2.00 5.00 3.50 1.12 0.00 0.01
X7 0.00 0.40 0.23 0.13 0.27 0.21
X8 0.00 5.00 2.81 1.55 0.09 0.05
Y1 6.01 43.10 22.31 10.09 - 0.98
Y2 10.90 48.03 24.59 9.51 0.98 -

54
several classification models in Weka
3 tool. We
experimented with different types of algorithms:
functions (Gaussian Processes, Isotonic Regression,
Least Med Sq, Linear Regression, Pace Regression,
Simple Linear Regression, SMO reg and Multilayer
Perceptron), lazy classifiers (IBk and KStar),
Bagging meta classifier, classifiers based on rules
(Decision table and M5Rules) and classification
trees (M5P and REPTree). Since both heating and
cooling load are relevant for energy efficiency of the
building, two scenarios are taken into account for
their classification: 1. the second output attribute is
known, and 2. the second output attribute is
unknown. Figure 2 and Figure 3 illustrate
comparison of these scenarios when classification
error is observed.
General conclusions, derived from Figure 2 and
Figure 3, are described in the following.
• Almost every classifier classifies heating
load, i.e. attribute Y1, with lower
classification error compared to the cooling
load classification, i.e. Y2 attribute.
• Based on the input parameters it is far more
difficult to predict values of the cooling load
in comparison to the prediction of the heating
load. Results are explained in more details in
the following.
• Ruled based classifiers and classification
trees are performing better in classification of
both output attributes than functions, lazy or
meta classifiers.
• Classifiers predict values with larger
deviations when it comes to higher values of
the heating and the cooling loads, i.e. it is
easier to predict smaller values.
• Decision table algorithm gives the best
classification results for both heating and
cooling load.
A decision table consists of a hierarchical table
in which each entry in a higher level table gets
broken down by the values of a pair of additional
attributes to form another table [17]. It is formally
defined in [16] as follows. Decision table for dataset
D with n attributes A1, A2, ..., An is a table with
schema R (A1, A2, ... , An, Class, Sup, Conf). A row
Ri = ( a1i, a2i, ... , ani, ci,supi, confi) in table R
represents a classification rule, where aij (1 ≤ j ≤ n)
can be either from DOM(Ai) or a special value ANY,
ci ∈ { c1, c2, ..., cm}, minsup ≤ supi ≤ 1, and minconf ≤
confi ≤ 1 and minsup and minconf are predetermined
thresholds. The interpretation of the rule is if (A1 =
a1) and (A2 = a2) and … and (An= an) then class= ci
with probability confi and having support supi, where
aj ≠ ANY, 1 ≤ j ≤ n.
In classification of the heating load higher
precision is achieved if cooling loads are familiar,
except in the case of Bagging meta classifier,
Decision table and REPTree, Figure 2. Classification
based on a decision table is resulting with the
smallest classification error: 4% if the cooling load
3 Weka tool http://www.cs.waikato.ac.nz/ml/weka/.
is familiar and used in classification and 3.54% if the
value of the cooling load is unfamiliar, Figure 2, i.e.
in 3.54% cases building will be assigned false value.
Even though an overall error is smaller when cooling
load is unfamiliar and it is not used in the
classification process, smaller deviations between
the actual and predicted value are achieved in the
classification which is using the cooling load as an
input parameter. Table 2 illustrates the first 10 rules
– results of a classification based on decision table.
Resulting rules point to the variables that are the
most important for the precise classification of the
heating load: surface area, wall area, glazing area,
and glazing area distribution.
Classification of the cooling load is more
precise if value of the heating load is familiar and
taken into account, Figure 3. Approximate
classification error, in both scenarios, is achieved
with Bagging meta classifier, Decision table and
REPTree. Classification with decision table is
resulting with the smallest classification error:
9.81% if the heating load is familiar and taken into
account and 11.19% if it is not considered in the
classification, Figure 3. Table 3 illustrates the first
10 rules – results of a classification based on
decision table. Resulting rules point to the most
important variables for the precise classification of
Fig. 2. Comparison of classification errors for heating load (Y1)
Table 2. Classification rules for the heating load
the cooling load: surface area, wall area, and glazing
area.
4. Conclusion Improvement of energy efficiency in buildings is
crucial to achieving the goals of efficient energy
consumption, to tackle climate change and secure
energy supply. If we want to achieve significant and
sustainable energy savings, primarily we need to
develop energy-efficient technology, pr
services, and change consumer habits in terms of
energy use, in order to maintain the same quality of
life with less energy consumption. As one of the
steps towards efficient energy consumption,
Surface area Wall area Glazing area
Glazing area
distribution
'(632.1-661.5]' '(399.35-inf)' '(0.36-inf)' '(4.5-inf)'
'(779.1-inf)' '(365.05-382.2]' '(0.36-inf)' '(4.5-inf)'
'(779.1-inf)' '(330.75-347.9]' '(0.36-inf)' '(4.5-inf)'
'(632.1-661.5]' '(330.75-347.9]' '(0.36-inf)' '(4.5-inf)'
'(749.7-779.1]' '(313.6-330.75]' '(0.36-inf)' '(4.5-inf)'
'(602.7-632.1]' '(313.6-330.75]' '(0.36-inf)' '(4.5-inf)'
'(543.9-573.3]' '(313.6-330.75]' '(0.36-inf)' '(4.5-inf)'
'(632.1-661.5]' '(399.35-inf)' '(0.36-inf)' '(3.5-4]'
'(632.1-661.5]' '(399.35-inf)' '(0.24-0.28]' '(4.5-inf)'
'(720.3-749.7]' '(279.3-296.45]' '(0.36-inf)' '(4.5-inf)'
Fig. 2. Comparison of classification errors for heating load (Y1)
Table 2. Classification rules for the heating load Table 3. Classification rules for the cooling load
the cooling load: surface area, wall area, and glazing
energy efficiency in buildings is
crucial to achieving the goals of efficient energy
consumption, to tackle climate change and secure
energy supply. If we want to achieve significant and
sustainable energy savings, primarily we need to
ient technology, products and
consumer habits in terms of
energy use, in order to maintain the same quality of
life with less energy consumption. As one of the
steps towards efficient energy consumption,
buildings in European countries are legally bound to
conform to appropriate minimum requirements
regarding energy efficiency following the European
Directive 2002/91/EC. In efficient building design
computation of the heating and the cooling loads are
required. They determine the specif
heating and cooling equipment needed to maintain
comfortable indoor air conditions. This paper
illustrates possibilities of machine learning
applications for prediction of the heating and the
cooling loads in buildings. We used publicly
available dataset which comprise 8 input variables
(relative compactness, surface area, wall area, roof
area, overall height, orientation, glazing area and
Glazing area
distribution Heating load
'(4.5-inf)' 39.43
'(4.5-inf)' 16.53
'(4.5-inf)' 17.98
'(4.5-inf)' 41.49
'(4.5-inf)' 14.99
'(4.5-inf)' 29.62
'(4.5-inf)' 35.16
'(3.5-4]' 40.45
'(4.5-inf)' 36.27
'(4.5-inf)' 14.25
Surface area Wall area Glazing area
'(632.1-661.5]' '(399.35-inf)' '(0.36-inf)'
'(779.1-inf)' '(365.05-382.2]' '(0.36-inf)'
'(779.1-inf)' '(330.75-347.9]' '(0.36-inf)'
'(632.1-661.5]' '(330.75-347.9]' '(0.36-inf)'
'(749.7-779.1]' '(313.6-330.75]' '(0.36-inf)'
'(602.7-632.1]' '(313.6-330.75]' '(0.36-inf)'
'(543.9-573.3]' '(313.6-330.75]' '(0.36-inf)'
'(632.1-661.5]' '(399.35-inf)' '(0.24-0.28]'
'(720.3-749.7]' '(279.3-296.45]' '(0.36-inf)'
'(573.3-602.7]' '(279.3-296.45]' '(0.36-inf)'
Classification rules for the cooling load
are legally bound to
conform to appropriate minimum requirements
regarding energy efficiency following the European
Directive 2002/91/EC. In efficient building design
computation of the heating and the cooling loads are
required. They determine the specifications of the
heating and cooling equipment needed to maintain
comfortable indoor air conditions. This paper
illustrates possibilities of machine learning
of the heating and the
cooling loads in buildings. We used publicly
ilable dataset which comprise 8 input variables
(relative compactness, surface area, wall area, roof
area, overall height, orientation, glazing area and
Glazing area Cooling load
'(0.36-inf)' 39.638
'(0.36-inf)' 16.892
'(0.36-inf)' 21.709
'(0.36-inf)' 42.4515
'(0.36-inf)' 17.941
'(0.36-inf)' 30.5995
'(0.36-inf)' 36.685
'(0.24-0.28]' 36.9115
'(0.36-inf)' 16.7715
'(0.36-inf)' 33.483

55
several classification models in Weka
3 tool. We
experimented with different types of algorithms:
functions (Gaussian Processes, Isotonic Regression,
Least Med Sq, Linear Regression, Pace Regression,
Simple Linear Regression, SMO reg and Multilayer
Perceptron), lazy classifiers (IBk and KStar),
Bagging meta classifier, classifiers based on rules
(Decision table and M5Rules) and classification
trees (M5P and REPTree). Since both heating and
cooling load are relevant for energy efficiency of the
building, two scenarios are taken into account for
their classification: 1. the second output attribute is
known, and 2. the second output attribute is
unknown. Figure 2 and Figure 3 illustrate
comparison of these scenarios when classification
error is observed.
General conclusions, derived from Figure 2 and
Figure 3, are described in the following.
• Almost every classifier classifies heating
load, i.e. attribute Y1, with lower
classification error compared to the cooling
load classification, i.e. Y2 attribute.
• Based on the input parameters it is far more
difficult to predict values of the cooling load
in comparison to the prediction of the heating
load. Results are explained in more details in
the following.
• Ruled based classifiers and classification
trees are performing better in classification of
both output attributes than functions, lazy or
meta classifiers.
• Classifiers predict values with larger
deviations when it comes to higher values of
the heating and the cooling loads, i.e. it is
easier to predict smaller values.
• Decision table algorithm gives the best
classification results for both heating and
cooling load.
A decision table consists of a hierarchical table
in which each entry in a higher level table gets
broken down by the values of a pair of additional
attributes to form another table [17]. It is formally
defined in [16] as follows. Decision table for dataset
D with n attributes A1, A2, ..., An is a table with
schema R (A1, A2, ... , An, Class, Sup, Conf). A row
Ri = ( a1i, a2i, ... , ani, ci,supi, confi) in table R
represents a classification rule, where aij (1 ≤ j ≤ n)
can be either from DOM(Ai) or a special value ANY,
ci ∈ { c1, c2, ..., cm}, minsup ≤ supi ≤ 1, and minconf ≤
confi ≤ 1 and minsup and minconf are predetermined
thresholds. The interpretation of the rule is if (A1 =
a1) and (A2 = a2) and … and (An= an) then class= ci
with probability confi and having support supi, where
aj ≠ ANY, 1 ≤ j ≤ n.
In classification of the heating load higher
precision is achieved if cooling loads are familiar,
except in the case of Bagging meta classifier,
Decision table and REPTree, Figure 2. Classification
based on a decision table is resulting with the
smallest classification error: 4% if the cooling load
3 Weka tool http://www.cs.waikato.ac.nz/ml/weka/.
is familiar and used in classification and 3.54% if the
value of the cooling load is unfamiliar, Figure 2, i.e.
in 3.54% cases building will be assigned false value.
Even though an overall error is smaller when cooling
load is unfamiliar and it is not used in the
classification process, smaller deviations between
the actual and predicted value are achieved in the
classification which is using the cooling load as an
input parameter. Table 2 illustrates the first 10 rules
– results of a classification based on decision table.
Resulting rules point to the variables that are the
most important for the precise classification of the
heating load: surface area, wall area, glazing area,
and glazing area distribution.
Classification of the cooling load is more
precise if value of the heating load is familiar and
taken into account, Figure 3. Approximate
classification error, in both scenarios, is achieved
with Bagging meta classifier, Decision table and
REPTree. Classification with decision table is
resulting with the smallest classification error:
9.81% if the heating load is familiar and taken into
account and 11.19% if it is not considered in the
classification, Figure 3. Table 3 illustrates the first
10 rules – results of a classification based on
decision table. Resulting rules point to the most
important variables for the precise classification of
Fig. 2. Comparison of classification errors for heating load (Y1)
Table 2. Classification rules for the heating load
the cooling load: surface area, wall area, and glazing
area.
4. Conclusion Improvement of energy efficiency in buildings is
crucial to achieving the goals of efficient energy
consumption, to tackle climate change and secure
energy supply. If we want to achieve significant and
sustainable energy savings, primarily we need to
develop energy-efficient technology, pr
services, and change consumer habits in terms of
energy use, in order to maintain the same quality of
life with less energy consumption. As one of the
steps towards efficient energy consumption,
Surface area Wall area Glazing area
Glazing area
distribution
'(632.1-661.5]' '(399.35-inf)' '(0.36-inf)' '(4.5-inf)'
'(779.1-inf)' '(365.05-382.2]' '(0.36-inf)' '(4.5-inf)'
'(779.1-inf)' '(330.75-347.9]' '(0.36-inf)' '(4.5-inf)'
'(632.1-661.5]' '(330.75-347.9]' '(0.36-inf)' '(4.5-inf)'
'(749.7-779.1]' '(313.6-330.75]' '(0.36-inf)' '(4.5-inf)'
'(602.7-632.1]' '(313.6-330.75]' '(0.36-inf)' '(4.5-inf)'
'(543.9-573.3]' '(313.6-330.75]' '(0.36-inf)' '(4.5-inf)'
'(632.1-661.5]' '(399.35-inf)' '(0.36-inf)' '(3.5-4]'
'(632.1-661.5]' '(399.35-inf)' '(0.24-0.28]' '(4.5-inf)'
'(720.3-749.7]' '(279.3-296.45]' '(0.36-inf)' '(4.5-inf)'
Fig. 2. Comparison of classification errors for heating load (Y1)
Table 2. Classification rules for the heating load Table 3. Classification rules for the cooling load
the cooling load: surface area, wall area, and glazing
energy efficiency in buildings is
crucial to achieving the goals of efficient energy
consumption, to tackle climate change and secure
energy supply. If we want to achieve significant and
sustainable energy savings, primarily we need to
ient technology, products and
consumer habits in terms of
energy use, in order to maintain the same quality of
life with less energy consumption. As one of the
steps towards efficient energy consumption,
buildings in European countries are legally bound to
conform to appropriate minimum requirements
regarding energy efficiency following the European
Directive 2002/91/EC. In efficient building design
computation of the heating and the cooling loads are
required. They determine the specif
heating and cooling equipment needed to maintain
comfortable indoor air conditions. This paper
illustrates possibilities of machine learning
applications for prediction of the heating and the
cooling loads in buildings. We used publicly
available dataset which comprise 8 input variables
(relative compactness, surface area, wall area, roof
area, overall height, orientation, glazing area and
Glazing area
distribution Heating load
'(4.5-inf)' 39.43
'(4.5-inf)' 16.53
'(4.5-inf)' 17.98
'(4.5-inf)' 41.49
'(4.5-inf)' 14.99
'(4.5-inf)' 29.62
'(4.5-inf)' 35.16
'(3.5-4]' 40.45
'(4.5-inf)' 36.27
'(4.5-inf)' 14.25
Surface area Wall area Glazing area
'(632.1-661.5]' '(399.35-inf)' '(0.36-inf)'
'(779.1-inf)' '(365.05-382.2]' '(0.36-inf)'
'(779.1-inf)' '(330.75-347.9]' '(0.36-inf)'
'(632.1-661.5]' '(330.75-347.9]' '(0.36-inf)'
'(749.7-779.1]' '(313.6-330.75]' '(0.36-inf)'
'(602.7-632.1]' '(313.6-330.75]' '(0.36-inf)'
'(543.9-573.3]' '(313.6-330.75]' '(0.36-inf)'
'(632.1-661.5]' '(399.35-inf)' '(0.24-0.28]'
'(720.3-749.7]' '(279.3-296.45]' '(0.36-inf)'
'(573.3-602.7]' '(279.3-296.45]' '(0.36-inf)'
Classification rules for the cooling load
are legally bound to
conform to appropriate minimum requirements
regarding energy efficiency following the European
Directive 2002/91/EC. In efficient building design
computation of the heating and the cooling loads are
required. They determine the specifications of the
heating and cooling equipment needed to maintain
comfortable indoor air conditions. This paper
illustrates possibilities of machine learning
of the heating and the
cooling loads in buildings. We used publicly
ilable dataset which comprise 8 input variables
(relative compactness, surface area, wall area, roof
area, overall height, orientation, glazing area and
Glazing area Cooling load
'(0.36-inf)' 39.638
'(0.36-inf)' 16.892
'(0.36-inf)' 21.709
'(0.36-inf)' 42.4515
'(0.36-inf)' 17.941
'(0.36-inf)' 30.5995
'(0.36-inf)' 36.685
'(0.24-0.28]' 36.9115
'(0.36-inf)' 16.7715
'(0.36-inf)' 33.483

56
Fig. 3. Comparison of classification errors for cooling loads (Y2)
glazing area distribution) and 2 output variables
(heating and cooling loads). We applied different
classifiers on the input variables in order to predict
the heating load and the cooling load. Based on the
results we can conclude that machine learning
approach is well suited for this problem and the rule
and tree-based classifiers outperform all other
classification techniques. Surface area, wall area,
glazing area and glazing area distribution are the key
parameters in predicting heating and cooling load
Classifiers are more efficient in predicting heating
loads than cooling loads leading to the conclusion
that some additional variables may
when predicting cooling loads.
References
[1] Directive 2010/31/EU of the European Parliament and of
the Council of 19 May 2010 on the energy performance
of buildings, available at http://eur-lex.europa.eu/legal
content/EN/ALL/;ELX_SESSIONID=FZMjThLLzfxmm
MCQGp2Y1s2d3TjwtD8QS3pqdkhXZbwqGwlgY9KN!
2064651424?uri=CELEX:32010L0031.
[2] HMT, 2006. Stern Review: The Economics of Climate
Change. Her Majesty’s Treasury.
/http://www.hmtreasury.gov.uk/independent_reviews/ster
n_review_economics_climate_change/stern_review_
report.cfmS.
[3] Directive 2012/27/EU of the European Parliament and of
the Council of 25 October 2012 on energy efficiency,
amending Directives 2009/125/EC and 2010/30/EU and
repealing Directives 2004/8/EC and 2006/32/EC Text
with EEA relevance, available on: http://eur
lex.europa.eu/legal-
content/EN/TXT/?uri=celex%3A32012L0027
[4] Regulations on energy efficiency in building in Serbia,
available at:
http://www.ingkomora.org.rs/strucniispiti/download/ee/P
Fig. 3. Comparison of classification errors for cooling loads (Y2)
glazing area distribution) and 2 output variables
(heating and cooling loads). We applied different
classifiers on the input variables in order to predict
the heating load and the cooling load. Based on the
results we can conclude that machine learning
roach is well suited for this problem and the rule-
based classifiers outperform all other
. Surface area, wall area,
glazing area and glazing area distribution are the key
parameters in predicting heating and cooling loads.
Classifiers are more efficient in predicting heating
loads than cooling loads leading to the conclusion
be considered
Directive 2010/31/EU of the European Parliament and of
May 2010 on the energy performance
lex.europa.eu/legal-
content/EN/ALL/;ELX_SESSIONID=FZMjThLLzfxmm
MCQGp2Y1s2d3TjwtD8QS3pqdkhXZbwqGwlgY9KN!
424?uri=CELEX:32010L0031.
HMT, 2006. Stern Review: The Economics of Climate
Change. Her Majesty’s Treasury.
/http://www.hmtreasury.gov.uk/independent_reviews/ster
n_review_economics_climate_change/stern_review_
ean Parliament and of
October 2012 on energy efficiency,
amending Directives 2009/125/EC and 2010/30/EU and
repealing Directives 2004/8/EC and 2006/32/EC Text
with EEA relevance, available on: http://eur-
/?uri=celex%3A32012L0027.
Regulations on energy efficiency in building in Serbia,
available at:
http://www.ingkomora.org.rs/strucniispiti/download/ee/P
Energy, IBACOS, Inc. Pittsburg, USA. Available at:
http://www.nrel.gov/docs/fy11osti/51603.pdf. Accesed
on 20th February 2017.
[6] Tsanas A., Xifara A. (2012), Accurate quantitative
estimation of energy performance of residential
using statistical machine learning tools
Buildings, Vol. 49, 560–567.
[7] Yu Z., Haghigrat F., Fung B.C.M., Yoshimo H. (2010),
A decision tree method for building energy demand
modeling. Energy and Buildings, Vol. 42, 1637
[8] Dong B., Cao C., Lee S.E. (2005), Applying support
vector machines to predict building energy consumption
in tropical region. Energy and Buildings, Vol. 37, 545
553.
[9] Li Q., Meng Q., Cai J., Yoshino H., Mochida A. (2009),
Applying support vector machine to predict
cooling load in the building. Applied Energy, Vol. 86,
2249–2256.
[10] Yu Z., Haghighat F., Fung B.C.M. (2016)
challenges in building engineering and data mining
applications for energy-efficient communities
Sustainable Cities and Society, Vol.
[11] Kumar R., Aggarwal R.K., Sharmaa J.D. (2013)
analysis of a building using artificial neural network: A
review. Energy and Buildings, Vol.
[12] Kaligirou S.A., Neocleous C., Schizas C.
Artificial neural networks used for estimation of building
heating load. Proceedings of the CLIMA 2000
International Conference, Brussels, Belgium, Paper
Number P 159, 1997.
[13] Kaligirou S.A., Florides G., Neocleous
(2001), Estimation of daily heating and cooling loads
using artificial neural networks.
CLIMA 2000 International Conference on CD
Naples, Italy.
[14] Kotsiantis S. B., Zaharakis I. D.,
Machine learning: a review of classif
combining techniques. Artificial Intelligence Review,
Vol. 26 (3), 159-190.
[15] Fürnkranz J., Gamberger D., Lavra
Foundations of Rule Learning. Berlin, Germany.
Energy, IBACOS, Inc. Pittsburg, USA. Available at:
http://www.nrel.gov/docs/fy11osti/51603.pdf. Accesed
Accurate quantitative
estimation of energy performance of residential buildings
using statistical machine learning tools. Energy and
Yu Z., Haghigrat F., Fung B.C.M., Yoshimo H. (2010),
A decision tree method for building energy demand
modeling. Energy and Buildings, Vol. 42, 1637–1646.
Cao C., Lee S.E. (2005), Applying support
vector machines to predict building energy consumption
in tropical region. Energy and Buildings, Vol. 37, 545–
Li Q., Meng Q., Cai J., Yoshino H., Mochida A. (2009),
Applying support vector machine to predict hourly
cooling load in the building. Applied Energy, Vol. 86,
C.M. (2016), Advances and
challenges in building engineering and data mining
efficient communities.
. 25, 33–38.
, Aggarwal R.K., Sharmaa J.D. (2013), Energy
analysis of a building using artificial neural network: A
Vol. 65, 352–358.
Kaligirou S.A., Neocleous C., Schizas C. (2000),
Artificial neural networks used for estimation of building
Proceedings of the CLIMA 2000
International Conference, Brussels, Belgium, Paper
, Neocleous C., Schizas C.
Estimation of daily heating and cooling loads
Proceedings of the
CLIMA 2000 International Conference on CD-ROM,
, Pintelas P. E. (2006)
Machine learning: a review of classification and
Artificial Intelligence Review,
, Lavrač N. (2012),
Foundations of Rule Learning. Berlin, Germany.
Proceedings of the 26th International Conference on
Very Large Databases, Cairo, Egypt, 373-384.
[17] Becker B.G. (1998), Visualizing decision table
classifiers. Proceedings IEEE Symposium on Information
Visualization, 102-105.

57
Fig. 3. Comparison of classification errors for cooling loads (Y2)
glazing area distribution) and 2 output variables
(heating and cooling loads). We applied different
classifiers on the input variables in order to predict
the heating load and the cooling load. Based on the
results we can conclude that machine learning
approach is well suited for this problem and the rule
and tree-based classifiers outperform all other
classification techniques. Surface area, wall area,
glazing area and glazing area distribution are the key
parameters in predicting heating and cooling load
Classifiers are more efficient in predicting heating
loads than cooling loads leading to the conclusion
that some additional variables may
when predicting cooling loads.
References
[1] Directive 2010/31/EU of the European Parliament and of
the Council of 19 May 2010 on the energy performance
of buildings, available at http://eur-lex.europa.eu/legal
content/EN/ALL/;ELX_SESSIONID=FZMjThLLzfxmm
MCQGp2Y1s2d3TjwtD8QS3pqdkhXZbwqGwlgY9KN!
2064651424?uri=CELEX:32010L0031.
[2] HMT, 2006. Stern Review: The Economics of Climate
Change. Her Majesty’s Treasury.
/http://www.hmtreasury.gov.uk/independent_reviews/ster
n_review_economics_climate_change/stern_review_
report.cfmS.
[3] Directive 2012/27/EU of the European Parliament and of
the Council of 25 October 2012 on energy efficiency,
amending Directives 2009/125/EC and 2010/30/EU and
repealing Directives 2004/8/EC and 2006/32/EC Text
with EEA relevance, available on: http://eur
lex.europa.eu/legal-
content/EN/TXT/?uri=celex%3A32012L0027
[4] Regulations on energy efficiency in building in Serbia,
available at:
http://www.ingkomora.org.rs/strucniispiti/download/ee/P
Fig. 3. Comparison of classification errors for cooling loads (Y2)
glazing area distribution) and 2 output variables
(heating and cooling loads). We applied different
classifiers on the input variables in order to predict
the heating load and the cooling load. Based on the
results we can conclude that machine learning
roach is well suited for this problem and the rule-
based classifiers outperform all other
. Surface area, wall area,
glazing area and glazing area distribution are the key
parameters in predicting heating and cooling loads.
Classifiers are more efficient in predicting heating
loads than cooling loads leading to the conclusion
be considered
Directive 2010/31/EU of the European Parliament and of
May 2010 on the energy performance
lex.europa.eu/legal-
content/EN/ALL/;ELX_SESSIONID=FZMjThLLzfxmm
MCQGp2Y1s2d3TjwtD8QS3pqdkhXZbwqGwlgY9KN!
424?uri=CELEX:32010L0031.
HMT, 2006. Stern Review: The Economics of Climate
Change. Her Majesty’s Treasury.
/http://www.hmtreasury.gov.uk/independent_reviews/ster
n_review_economics_climate_change/stern_review_
ean Parliament and of
October 2012 on energy efficiency,
amending Directives 2009/125/EC and 2010/30/EU and
repealing Directives 2004/8/EC and 2006/32/EC Text
with EEA relevance, available on: http://eur-
/?uri=celex%3A32012L0027.
Regulations on energy efficiency in building in Serbia,
available at:
http://www.ingkomora.org.rs/strucniispiti/download/ee/P
Energy, IBACOS, Inc. Pittsburg, USA. Available at:
http://www.nrel.gov/docs/fy11osti/51603.pdf. Accesed
on 20th February 2017.
[6] Tsanas A., Xifara A. (2012), Accurate quantitative
estimation of energy performance of residential
using statistical machine learning tools
Buildings, Vol. 49, 560–567.
[7] Yu Z., Haghigrat F., Fung B.C.M., Yoshimo H. (2010),
A decision tree method for building energy demand
modeling. Energy and Buildings, Vol. 42, 1637
[8] Dong B., Cao C., Lee S.E. (2005), Applying support
vector machines to predict building energy consumption
in tropical region. Energy and Buildings, Vol. 37, 545
553.
[9] Li Q., Meng Q., Cai J., Yoshino H., Mochida A. (2009),
Applying support vector machine to predict
cooling load in the building. Applied Energy, Vol. 86,
2249–2256.
[10] Yu Z., Haghighat F., Fung B.C.M. (2016)
challenges in building engineering and data mining
applications for energy-efficient communities
Sustainable Cities and Society, Vol.
[11] Kumar R., Aggarwal R.K., Sharmaa J.D. (2013)
analysis of a building using artificial neural network: A
review. Energy and Buildings, Vol.
[12] Kaligirou S.A., Neocleous C., Schizas C.
Artificial neural networks used for estimation of building
heating load. Proceedings of the CLIMA 2000
International Conference, Brussels, Belgium, Paper
Number P 159, 1997.
[13] Kaligirou S.A., Florides G., Neocleous
(2001), Estimation of daily heating and cooling loads
using artificial neural networks.
CLIMA 2000 International Conference on CD
Naples, Italy.
[14] Kotsiantis S. B., Zaharakis I. D.,
Machine learning: a review of classif
combining techniques. Artificial Intelligence Review,
Vol. 26 (3), 159-190.
[15] Fürnkranz J., Gamberger D., Lavra
Foundations of Rule Learning. Berlin, Germany.
Energy, IBACOS, Inc. Pittsburg, USA. Available at:
http://www.nrel.gov/docs/fy11osti/51603.pdf. Accesed
Accurate quantitative
estimation of energy performance of residential buildings
using statistical machine learning tools. Energy and
Yu Z., Haghigrat F., Fung B.C.M., Yoshimo H. (2010),
A decision tree method for building energy demand
modeling. Energy and Buildings, Vol. 42, 1637–1646.
Cao C., Lee S.E. (2005), Applying support
vector machines to predict building energy consumption
in tropical region. Energy and Buildings, Vol. 37, 545–
Li Q., Meng Q., Cai J., Yoshino H., Mochida A. (2009),
Applying support vector machine to predict hourly
cooling load in the building. Applied Energy, Vol. 86,
C.M. (2016), Advances and
challenges in building engineering and data mining
efficient communities.
. 25, 33–38.
, Aggarwal R.K., Sharmaa J.D. (2013), Energy
analysis of a building using artificial neural network: A
Vol. 65, 352–358.
Kaligirou S.A., Neocleous C., Schizas C. (2000),
Artificial neural networks used for estimation of building
Proceedings of the CLIMA 2000
International Conference, Brussels, Belgium, Paper
, Neocleous C., Schizas C.
Estimation of daily heating and cooling loads
Proceedings of the
CLIMA 2000 International Conference on CD-ROM,
, Pintelas P. E. (2006)
Machine learning: a review of classification and
Artificial Intelligence Review,
, Lavrač N. (2012),
Foundations of Rule Learning. Berlin, Germany.
Proceedings of the 26th International Conference on
Very Large Databases, Cairo, Egypt, 373-384.
[17] Becker B.G. (1998), Visualizing decision table
classifiers. Proceedings IEEE Symposium on Information
Visualization, 102-105.
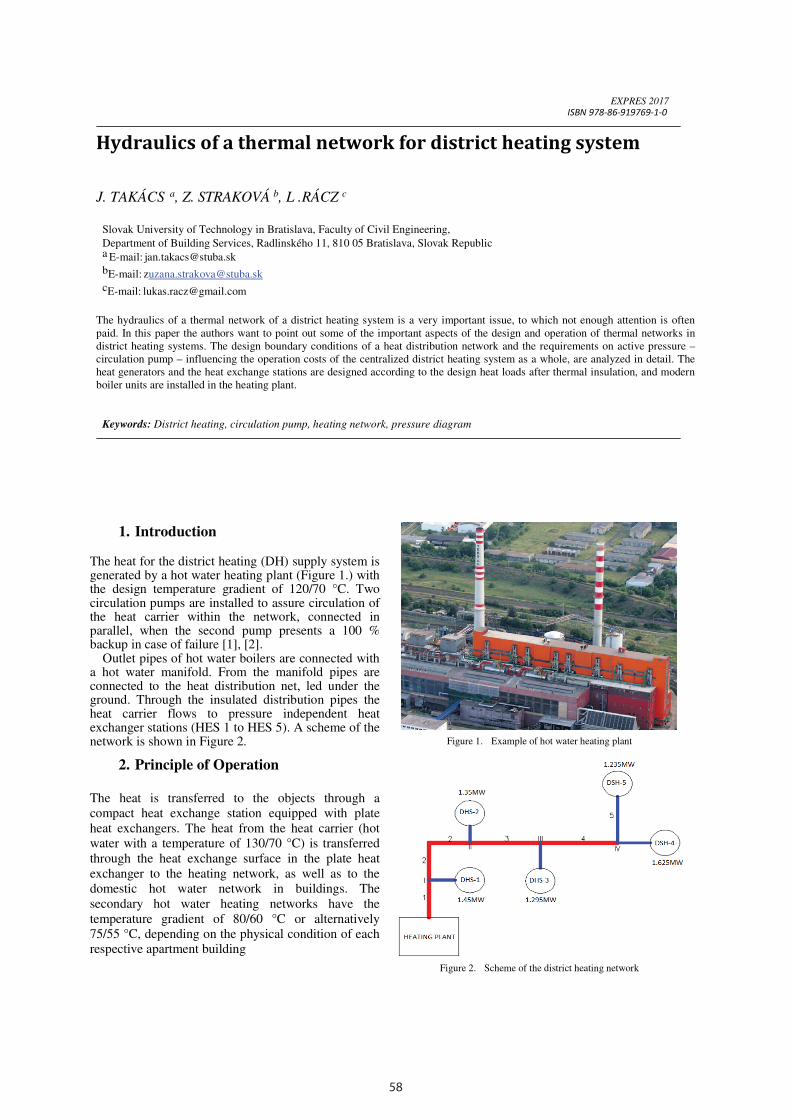
58
EXPRES 2017
ISBN 978-86-919769-1-0
Hydraulics of a thermal network for district heating system J. TAKÁCS a, Z. STRAKOVÁ b, L .RÁCZ c
Slovak University of Technology in Bratislava, Faculty of Civil Engineering,
Department of Building Services, Radlinského 11, 810 05 Bratislava, Slovak Republic a E-mail: [email protected]
bE-mail: [email protected]
cE-mail: [email protected]
The hydraulics of a thermal network of a district heating system is a very important issue, to which not enough attention is often
paid. In this paper the authors want to point out some of the important aspects of the design and operation of thermal networks in
district heating systems. The design boundary conditions of a heat distribution network and the requirements on active pressure –
circulation pump – influencing the operation costs of the centralized district heating system as a whole, are analyzed in detail. The
heat generators and the heat exchange stations are designed according to the design heat loads after thermal insulation, and modern
boiler units are installed in the heating plant.
Keywords: District heating, circulation pump, heating network, pressure diagram
1. Introduction The heat for the district heating (DH) supply system is generated by a hot water heating plant (Figure 1.) with the design temperature gradient of 120/70 °C. Two circulation pumps are installed to assure circulation of the heat carrier within the network, connected in parallel, when the second pump presents a 100 % backup in case of failure [1], [2].
Outlet pipes of hot water boilers are connected with a hot water manifold. From the manifold pipes are connected to the heat distribution net, led under the ground. Through the insulated distribution pipes the heat carrier flows to pressure independent heat exchanger stations (HES 1 to HES 5). A scheme of the network is shown in Figure 2.
2. Principle of Operation
The heat is transferred to the objects through a
compact heat exchange station equipped with plate
heat exchangers. The heat from the heat carrier (hot
water with a temperature of 130/70 °C) is transferred
through the heat exchange surface in the plate heat
exchanger to the heating network, as well as to the
domestic hot water network in buildings. The
secondary hot water heating networks have the
temperature gradient of 80/60 °C or alternatively
75/55 °C, depending on the physical condition of each
respective apartment building
Figure 1. Example of hot water heating plant
Figure 2. Scheme of the district heating network
HYDRAULICS OF A THERMAL NETWORK FOR DISTRICT HEATING SYSTEM
The heating networks are designed based on
hydraulic equations for hot water networks and the pressure losses consist of the friction pressure losses in pipes and the losses due to local resistances (twists, reductions, branches and closing valves). The share of pressure losses due to the local resistances is estimated to 10 to 20 % of the total pressure losses, depending on the complexity of the heating network. The recommended flow speed of the heat carrier is in the range of w = 0.5 to 2.5 m/s and the specific pressure drop in the pipes is in the range of R = 100 to 200 Pa/m. Lower values are recommended, which put lower demands on the pump, however, they increase the initial investment to the heating network [3].
Example of the heat source – heating plant with boilers burning natural gas – is shown in Figure 3. The heating medium is circulated by circulation pumps. The heat is exchanged to the heating systems through compact heat exchange stations (Figure 4.).
Figure 3. Heat source – hot water heating plant station
Figure 4. Compact heat exchange station
3. Boundary Conditions
The monitored DH will be analyzed for two
alternatives [4]:
Alternative I. – representing the perspective of an
investor, who wants to save money on investments to
the heating network, where the designer will be
expected to design pipes of a smaller diameter,
resulting in higher demands on the circulation pump.
Alternative II. – representing the perspective of an
operator, who wants to save money on the operation of
the DH, which will require the designer to design a
network with larger pipe diameters, resulting in lower
power consumption of the pumps.
The circulation pump must overcome the friction
pressure losses and the local resistances and also
pressure losses of the heat exchange station. The value
of the coefficient 1.1 in eq. 1 reflects the increase in
pressure losses by the pressure loss of the heat source
itself (boiler, pipes in heat plants, hot water manifold
and so on) [9].
4. Calculation and Design of Circulation
Pumps
The required operation pressure of the circulation
pump ∆pp integrated in the heat source is calculated by following equation [5]:
( )[ ]∑ ∑ ++= HESp pZlR11p ∆∆ .., (1)
where: ∆pp is required operation pressure (kPa),
Σ(R.l) is the friction pressure loss in the piping of the heating network (kPa),
ΣZ is the pressure loss by local resistances (kPa), about 10 to 20 % of the friction pressure loss (R.l), depending on the complexity of the proposed DH network,
∆pHES is hydraulic gradient of the district heating on the primary side (kPa).
Calculation of Alternative I.
The pressure losses of the DH network calculated for Alternative I. are summarized in Table I.
TABLE I.
PRESSURE LOSSES OF THE DH NETWORK – ALTERNATIVE I.
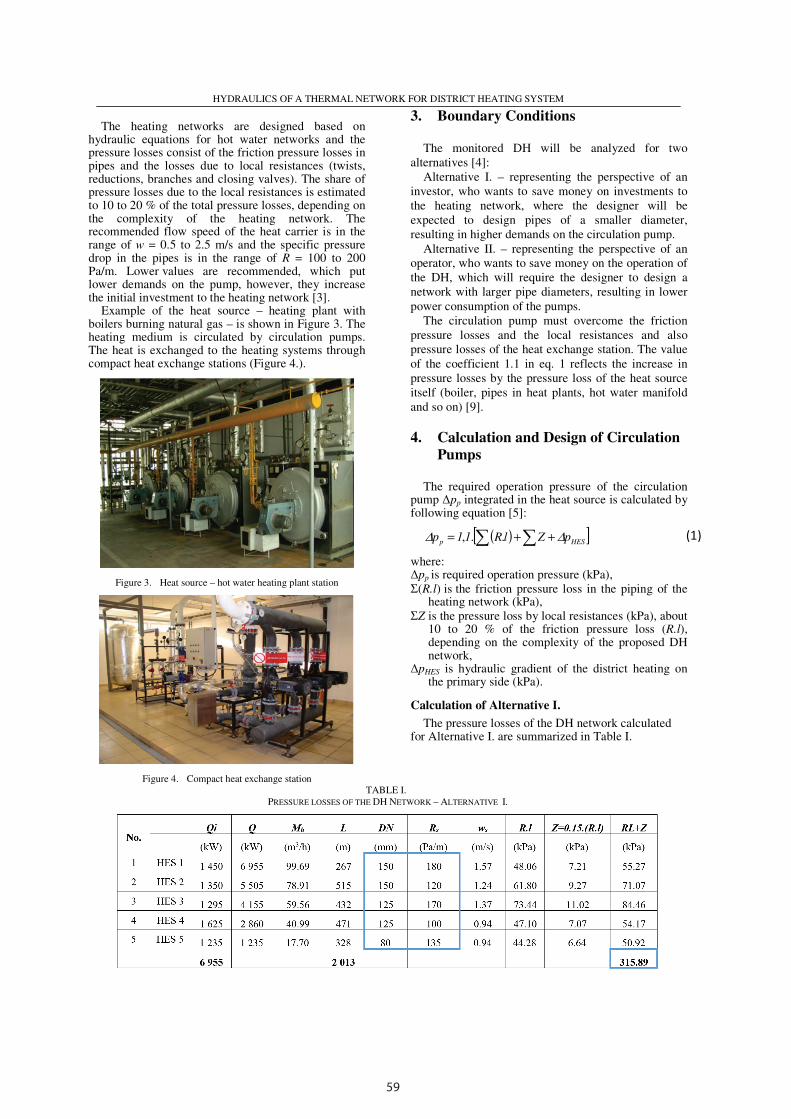
59
EXPRES 2017
ISBN 978-86-919769-1-0
Hydraulics of a thermal network for district heating system J. TAKÁCS a, Z. STRAKOVÁ b, L .RÁCZ c
Slovak University of Technology in Bratislava, Faculty of Civil Engineering,
Department of Building Services, Radlinského 11, 810 05 Bratislava, Slovak Republic a E-mail: [email protected]
bE-mail: [email protected]
cE-mail: [email protected]
The hydraulics of a thermal network of a district heating system is a very important issue, to which not enough attention is often
paid. In this paper the authors want to point out some of the important aspects of the design and operation of thermal networks in
district heating systems. The design boundary conditions of a heat distribution network and the requirements on active pressure –
circulation pump – influencing the operation costs of the centralized district heating system as a whole, are analyzed in detail. The
heat generators and the heat exchange stations are designed according to the design heat loads after thermal insulation, and modern
boiler units are installed in the heating plant.
Keywords: District heating, circulation pump, heating network, pressure diagram
1. Introduction The heat for the district heating (DH) supply system is generated by a hot water heating plant (Figure 1.) with the design temperature gradient of 120/70 °C. Two circulation pumps are installed to assure circulation of the heat carrier within the network, connected in parallel, when the second pump presents a 100 % backup in case of failure [1], [2].
Outlet pipes of hot water boilers are connected with a hot water manifold. From the manifold pipes are connected to the heat distribution net, led under the ground. Through the insulated distribution pipes the heat carrier flows to pressure independent heat exchanger stations (HES 1 to HES 5). A scheme of the network is shown in Figure 2.
2. Principle of Operation
The heat is transferred to the objects through a
compact heat exchange station equipped with plate
heat exchangers. The heat from the heat carrier (hot
water with a temperature of 130/70 °C) is transferred
through the heat exchange surface in the plate heat
exchanger to the heating network, as well as to the
domestic hot water network in buildings. The
secondary hot water heating networks have the
temperature gradient of 80/60 °C or alternatively
75/55 °C, depending on the physical condition of each
respective apartment building
Figure 1. Example of hot water heating plant
Figure 2. Scheme of the district heating network
HYDRAULICS OF A THERMAL NETWORK FOR DISTRICT HEATING SYSTEM
The heating networks are designed based on
hydraulic equations for hot water networks and the pressure losses consist of the friction pressure losses in pipes and the losses due to local resistances (twists, reductions, branches and closing valves). The share of pressure losses due to the local resistances is estimated to 10 to 20 % of the total pressure losses, depending on the complexity of the heating network. The recommended flow speed of the heat carrier is in the range of w = 0.5 to 2.5 m/s and the specific pressure drop in the pipes is in the range of R = 100 to 200 Pa/m. Lower values are recommended, which put lower demands on the pump, however, they increase the initial investment to the heating network [3].
Example of the heat source – heating plant with boilers burning natural gas – is shown in Figure 3. The heating medium is circulated by circulation pumps. The heat is exchanged to the heating systems through compact heat exchange stations (Figure 4.).
Figure 3. Heat source – hot water heating plant station
Figure 4. Compact heat exchange station
3. Boundary Conditions
The monitored DH will be analyzed for two
alternatives [4]:
Alternative I. – representing the perspective of an
investor, who wants to save money on investments to
the heating network, where the designer will be
expected to design pipes of a smaller diameter,
resulting in higher demands on the circulation pump.
Alternative II. – representing the perspective of an
operator, who wants to save money on the operation of
the DH, which will require the designer to design a
network with larger pipe diameters, resulting in lower
power consumption of the pumps.
The circulation pump must overcome the friction
pressure losses and the local resistances and also
pressure losses of the heat exchange station. The value
of the coefficient 1.1 in eq. 1 reflects the increase in
pressure losses by the pressure loss of the heat source
itself (boiler, pipes in heat plants, hot water manifold
and so on) [9].
4. Calculation and Design of Circulation
Pumps
The required operation pressure of the circulation
pump ∆pp integrated in the heat source is calculated by following equation [5]:
( )[ ]∑ ∑ ++= HESp pZlR11p ∆∆ .., (1)
where: ∆pp is required operation pressure (kPa),
Σ(R.l) is the friction pressure loss in the piping of the heating network (kPa),
ΣZ is the pressure loss by local resistances (kPa), about 10 to 20 % of the friction pressure loss (R.l), depending on the complexity of the proposed DH network,
∆pHES is hydraulic gradient of the district heating on the primary side (kPa).
Calculation of Alternative I.
The pressure losses of the DH network calculated for Alternative I. are summarized in Table I.
TABLE I.
PRESSURE LOSSES OF THE DH NETWORK – ALTERNATIVE I.
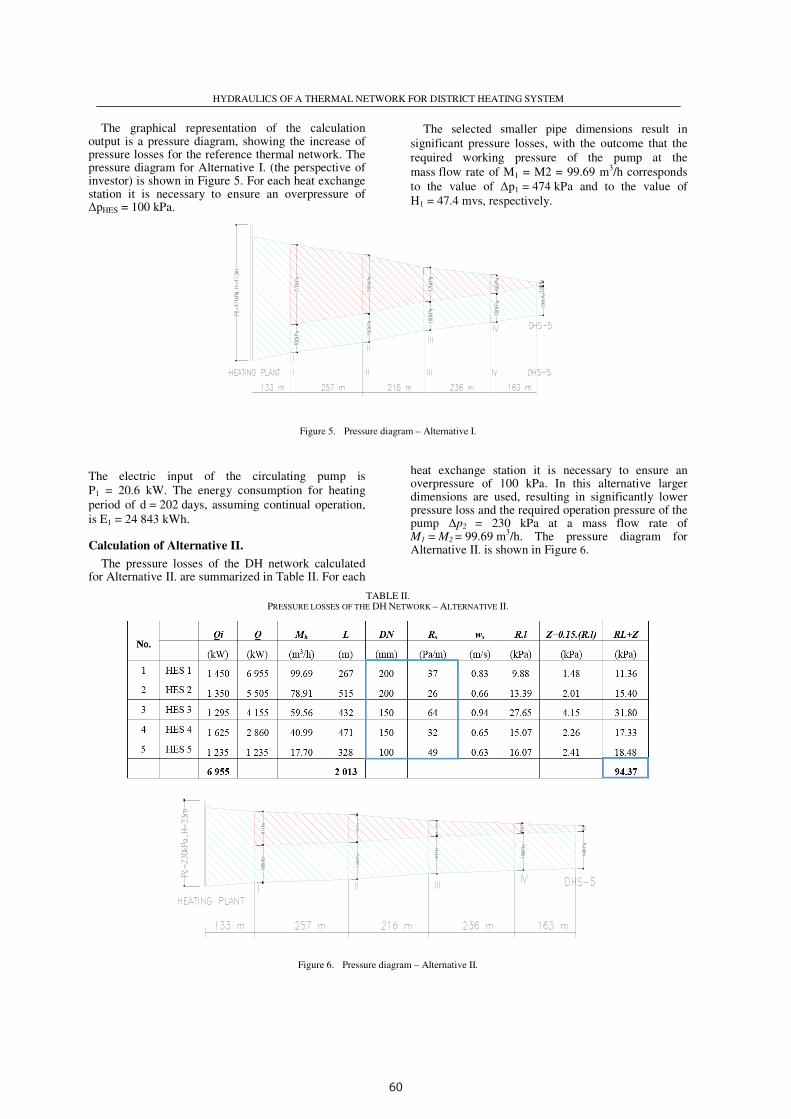
60
HYDRAULICS OF A THERMAL NETWORK FOR DISTRICT HEATING SYSTEM
The graphical representation of the calculation output is a pressure diagram, showing the increase of pressure losses for the reference thermal network. The pressure diagram for Alternative I. (the perspective of investor) is shown in Figure 5. For each heat exchange station it is necessary to ensure an overpressure of ∆pHES = 100 kPa.
The selected smaller pipe dimensions result in
significant pressure losses, with the outcome that the
required working pressure of the pump at the
mass flow rate of M1 = M2 = 99.69 m3/h corresponds
to the value of ∆p1 = 474 kPa and to the value of
H1 = 47.4 mvs, respectively.
Figure 5. Pressure diagram – Alternative I.
The electric input of the circulating pump is
P1 = 20.6 kW. The energy consumption for heating
period of d = 202 days, assuming continual operation,
is E1 = 24 843 kWh.
Calculation of Alternative II.
The pressure losses of the DH network calculated for Alternative II. are summarized in Table II. For each
heat exchange station it is necessary to ensure an overpressure of 100 kPa. In this alternative larger dimensions are used, resulting in significantly lower pressure loss and the required operation pressure of the pump ∆p2 = 230 kPa at a mass flow rate of M1 = M2 = 99.69 m
3/h. The pressure diagram for
Alternative II. is shown in Figure 6.
TABLE II. PRESSURE LOSSES OF THE DH NETWORK – ALTERNATIVE II.
Figure 6. Pressure diagram – Alternative II.
HYDRAULICS OF A THERMAL NETWORK FOR DISTRICT HEATING SYSTEM
The input power of the circulation pump is
P2 = 11.4 kW. The energy consumption for the heating period d = 202 days in continual operation is E2 = 12 924 kWh. This value is 48 % less than in Alternative I.
Economic Evaluation
It can be concluded that at the cost of 4.72 thousand € the circulation pumps in Alternative I. are more expensive than in Alternative II. by 2.27 thousands €, which is caused by higher requirements on operation of the circulation pumps. The total initial investments in the heating networks in Alternative I. are 8.69 thousand €.
Although the investments in the circulation pumps
(2.45 thousand €) are lower for Alternative II. by 2.27 thousand €/per year, the investments in the heating networks (11.77 thousand €) are higher by 3.08 thousand € for this Alternative.
Thus, the total investments to purchase the
equipment are higher by 4.2 thousand € for Alternative II., which represents 12.7 %, but the operation expenses in Alternative II. are lower by 2.27 thousand €.
The most substantial savings will be achieved in the
operation costs in the period of 25 years, when Alternative II. is cheaper by 56.6 thousand €. In Figure 7 the resulting evaluation confirms the viability of the Alternative II. (Figure 8) with the savings of 52.4 thousand €, representing 34.7 %.
The economic calculations for the circulation pumps, heating network and operation costs for the period of 25 years, along with the inflation rate and the increase in energy prices, considered in the calculation, are shown in Table III.
Payback of the investments is shown in Figure 9.
Figure 7. Operation curve of the proposed the circulation pump
Figure 8. Operation curve of the circulation pump
TABLE III. EVALUATION OF THE PERFORMANCE OF ALTERNATIVE I. AND ALTERNATIVE II. IN TERMS OF INVESTMENT AND OPERATION COSTS
Figure 9. Payback of the investment
Figure 9 clearly indicates the payback of the systems
from the side of view of the investor and operator. The
higher investment will return after 2 years of service.

61
HYDRAULICS OF A THERMAL NETWORK FOR DISTRICT HEATING SYSTEM
The graphical representation of the calculation output is a pressure diagram, showing the increase of pressure losses for the reference thermal network. The pressure diagram for Alternative I. (the perspective of investor) is shown in Figure 5. For each heat exchange station it is necessary to ensure an overpressure of ∆pHES = 100 kPa.
The selected smaller pipe dimensions result in
significant pressure losses, with the outcome that the
required working pressure of the pump at the
mass flow rate of M1 = M2 = 99.69 m3/h corresponds
to the value of ∆p1 = 474 kPa and to the value of
H1 = 47.4 mvs, respectively.
Figure 5. Pressure diagram – Alternative I.
The electric input of the circulating pump is
P1 = 20.6 kW. The energy consumption for heating
period of d = 202 days, assuming continual operation,
is E1 = 24 843 kWh.
Calculation of Alternative II.
The pressure losses of the DH network calculated for Alternative II. are summarized in Table II. For each
heat exchange station it is necessary to ensure an overpressure of 100 kPa. In this alternative larger dimensions are used, resulting in significantly lower pressure loss and the required operation pressure of the pump ∆p2 = 230 kPa at a mass flow rate of M1 = M2 = 99.69 m
3/h. The pressure diagram for
Alternative II. is shown in Figure 6.
TABLE II. PRESSURE LOSSES OF THE DH NETWORK – ALTERNATIVE II.
Figure 6. Pressure diagram – Alternative II.
HYDRAULICS OF A THERMAL NETWORK FOR DISTRICT HEATING SYSTEM
The input power of the circulation pump is
P2 = 11.4 kW. The energy consumption for the heating period d = 202 days in continual operation is E2 = 12 924 kWh. This value is 48 % less than in Alternative I.
Economic Evaluation
It can be concluded that at the cost of 4.72 thousand € the circulation pumps in Alternative I. are more expensive than in Alternative II. by 2.27 thousands €, which is caused by higher requirements on operation of the circulation pumps. The total initial investments in the heating networks in Alternative I. are 8.69 thousand €.
Although the investments in the circulation pumps
(2.45 thousand €) are lower for Alternative II. by 2.27 thousand €/per year, the investments in the heating networks (11.77 thousand €) are higher by 3.08 thousand € for this Alternative.
Thus, the total investments to purchase the
equipment are higher by 4.2 thousand € for Alternative II., which represents 12.7 %, but the operation expenses in Alternative II. are lower by 2.27 thousand €.
The most substantial savings will be achieved in the
operation costs in the period of 25 years, when Alternative II. is cheaper by 56.6 thousand €. In Figure 7 the resulting evaluation confirms the viability of the Alternative II. (Figure 8) with the savings of 52.4 thousand €, representing 34.7 %.
The economic calculations for the circulation pumps, heating network and operation costs for the period of 25 years, along with the inflation rate and the increase in energy prices, considered in the calculation, are shown in Table III.
Payback of the investments is shown in Figure 9.
Figure 7. Operation curve of the proposed the circulation pump
Figure 8. Operation curve of the circulation pump
TABLE III. EVALUATION OF THE PERFORMANCE OF ALTERNATIVE I. AND ALTERNATIVE II. IN TERMS OF INVESTMENT AND OPERATION COSTS
Figure 9. Payback of the investment
Figure 9 clearly indicates the payback of the systems
from the side of view of the investor and operator. The
higher investment will return after 2 years of service.
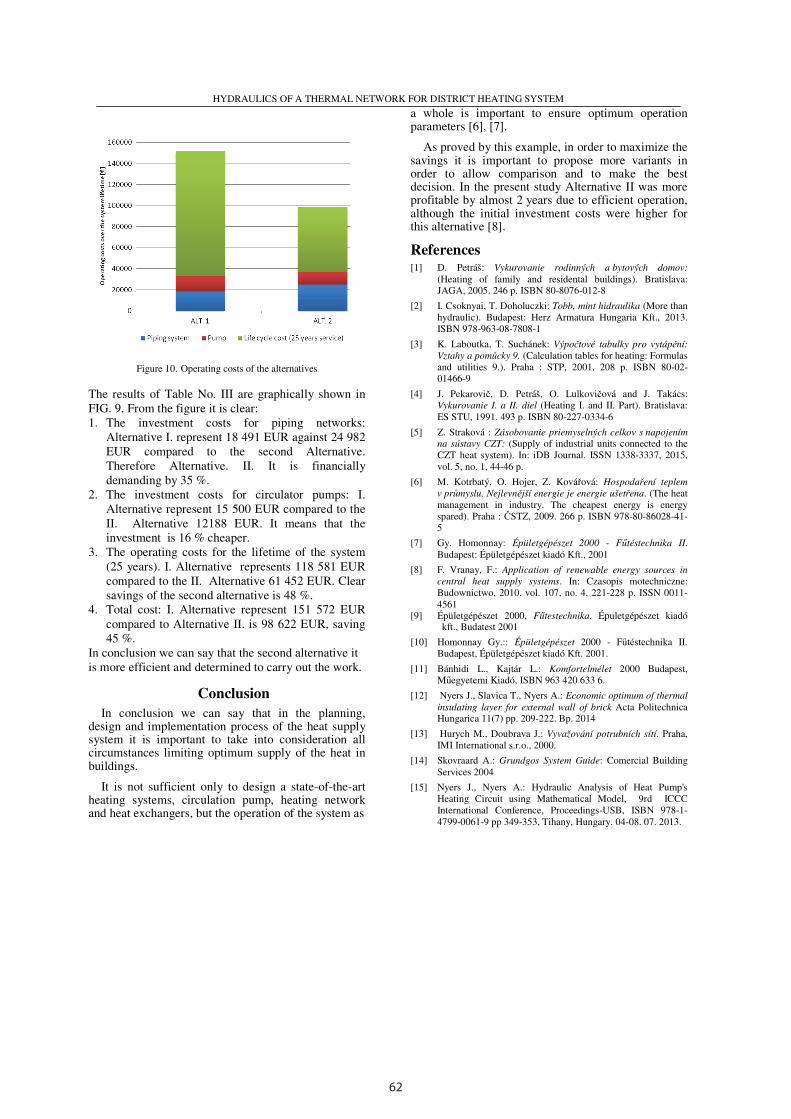
62
HYDRAULICS OF A THERMAL NETWORK FOR DISTRICT HEATING SYSTEM
Figure 10. Operating costs of the alternatives
The results of Table No. III are graphically shown in
FIG. 9. From the figure it is clear:
1. The investment costs for piping networks:
Alternative I. represent 18 491 EUR against 24 982
EUR compared to the second Alternative.
Therefore Alternative. II. It is financially
demanding by 35 %.
2. The investment costs for circulator pumps: I.
Alternative represent 15 500 EUR compared to the
II. Alternative 12188 EUR. It means that the
investment is 16 % cheaper.
3. The operating costs for the lifetime of the system
(25 years). I. Alternative represents 118 581 EUR
compared to the II. Alternative 61 452 EUR. Clear
savings of the second alternative is 48 %.
4. Total cost: I. Alternative represent 151 572 EUR
compared to Alternative II. is 98 622 EUR, saving
45 %.
In conclusion we can say that the second alternative it
is more efficient and determined to carry out the work.
Conclusion
In conclusion we can say that in the planning, design and implementation process of the heat supply system it is important to take into consideration all circumstances limiting optimum supply of the heat in buildings.
It is not sufficient only to design a state-of-the-art heating systems, circulation pump, heating network and heat exchangers, but the operation of the system as
a whole is important to ensure optimum operation parameters [6], [7].
As proved by this example, in order to maximize the savings it is important to propose more variants in order to allow comparison and to make the best decision. In the present study Alternative II was more profitable by almost 2 years due to efficient operation, although the initial investment costs were higher for this alternative [8].
References [1] D. Petráš: Vykurovanie rodinných a bytových domov:
(Heating of family and residental buildings). Bratislava: JAGA, 2005. 246 p. ISBN 80-8076-012-8
[2] I. Csoknyai, T. Doholuczki: Tobb, mint hidraulika (More than
hydraulic). Budapest: Herz Armatura Hungaria Kft., 2013.
ISBN 978-963-08-7808-1
[3] K. Laboutka, T. Suchánek: Výpočtové tabulky pro vytápění: Vztahy a pomůcky 9. (Calculation tables for heating: Formulas
and utilities 9.). Praha : STP, 2001. 208 p. ISBN 80-02-
01466-9
[4] J. Pekarovič, D. Petráš, O. Lulkovičová and J. Takács: Vykurovanie I. a II. diel (Heating I. and II. Part). Bratislava:
ES STU, 1991. 493 p. ISBN 80-227-0334-6
[5] Z. Straková : Zásobovanie priemyselných celkov s napojením na sústavy CZT: (Supply of industrial units connected to the
CZT heat system). In: iDB Journal. ISSN 1338-3337, 2015,
vol. 5, no. 1, 44-46 p.
[6] M. Kotrbatý, O. Hojer, Z. Kovářová: Hospodaření teplem v průmyslu, Nejlevnější energie je energie ušetřena. (The heat
management in industry. The cheapest energy is energy
spared). Praha : ČSTZ, 2009. 266 p. ISBN 978-80-86028-41-
5
[7] Gy. Homonnay: Épületgépészet 2000 - Fűtéstechnika II. Budapest: Épületgépészet kiadó Kft., 2001
[8] F. Vranay, F.: Application of renewable energy sources in central heat supply systems. In: Czasopis motechniczne:
Budownictwo, 2010. vol. 107, no. 4, 221-228 p. ISSN 0011-
4561 [9] Épületgépészet 2000, Fűtestechnika, Épuletgépészet kiadó
kft., Budatest 2001
[10] Homonnay Gy.:: Épületgépészet 2000 - Fűtéstechnika II.
Budapest, Épületgépészet kiadó Kft. 2001.
[11] Bánhidi L., Kajtár L.: Komfortelmélet 2000 Budapest, Műegyetemi Kiadó, ISBN 963 420 633 6.
[12] Nyers J., Slavica T., Nyers A.: Economic optimum of thermal insulating layer for external wall of brick Acta Politechnica Hungarica 11(7) pp. 209-222. Bp. 2014
[13] Hurych M., Doubrava J.: Vyvažování potrubních sítí. Praha,
IMI International s.r.o., 2000.
[14] Skovraard A.: Grundgos System Guide: Comercial Building
Services 2004
[15] Nyers J., Nyers A.: Hydraulic Analysis of Heat Pump's
Heating Circuit using Mathematical Model, 9rd ICCC
International Conference, Proceedings-USB, ISBN 978-1-
4799-0061-9 pp 349-353, Tihany, Hungary. 04-08. 07. 2013.
EXPRES 2017 ISBN 978-86-919769-1-0
Comparisons of experimental measurements of indoor climate parameters in a swimming pool during winter and summer operation period Belo B. FÜRI a, Róbert TURZA b
Department of Building Services, Faculty of Civil Engineering, Slovak University of
Technology in Bratislava SK-810 05 Bratislava,, Radlinského 11, Slovakia a E-mail: [email protected] b E-mail: [email protected]
Number of indoor swimming pools and wellness centers currently is growing, it is necessary to concern on parameters of their indoor environment. These parameters are necessary for the design of HVAC systems that operate in these premises. In indoor swimming pool facilities, the energy demand is large due to ventilation losses with the exhaust air. Since water is evaporated from the pool surface, the exhaust air has a high water content and specific enthalpy. In this publication measurements of indoor climate parameters and the comparison of indoor climate parameter during winter and summer operation period are described.
Keywords: swimming pool, measurements, water evaporation, air temperature, relative humidity, air velocity
1. Introduction
This paper deals with the topic of hygro-thermal
climate in indoor swimming pool. Ventilation in
these places ensures mainly the hygienic function. A
ventilation device provide internal environment for
people to feel comfortable in the swimming pool,
protecting their health by eliminating pollutants and
finally keep the technology in run and protects the
building structure. Indoor swimming pools belong
to premises with high moisture production,
respectively water vapor, where the relative
humidity in this area is usually between 60 to 80 %
and in rare cases even more.
Indoor swimming pools are water bodies
designed for recreational or competitive swimming,
diving and other water sports that require swimming
or aquatic exercise. Indoor swimming pools make
use artificial environment with technological
elements (filtration, ventilation equipments, pumps,
dosing of chemicals, etc.). Water temperature
depends on pool type. In table 1 are described
design water temperatures for different pool types.
The water temperature affects the heat and mass
transfer between water and human body. Because of
evaporation of the film of water on the unclothed
body additional heat is lost. Therefore to minimize
feel of cold, air temperature should be 2 K to 4 K
(min. 1 °C according to [6]) above the water
temperature, but not above 34 °C [4, 5]. Relative
humidity in swimming pool hall should be within
the range 40 ÷ 65 %. Air flow velocity in the zone
of stay should be below 0,2 m/s.
The water evaporation is a natural process and it
is a critical energy parameter in design and control
system. The forecast of water evaporation from
swimming pools by its reliable calculation is
required for accurate projection of HVAC systems.
In order to eliminate condensation on cold surfaces
in a swimming pool, water vapor has to be removed
by HVAC system and on the other hand water in the
pool has to heated to compensate the heat lost by
evaporation. According to statistics, 70 % of energy
loss in swimming pools goes to water evaporation.
Water evaporation rate to its complex and
stochastic nature is nearly impossible to predict. In
the literature is available wide variation in
correlations for predicting water evaporation and
energy consumption.
63
HYDRAULICS OF A THERMAL NETWORK FOR DISTRICT HEATING SYSTEM
Figure 10. Operating costs of the alternatives
The results of Table No. III are graphically shown in
FIG. 9. From the figure it is clear:
1. The investment costs for piping networks:
Alternative I. represent 18 491 EUR against 24 982
EUR compared to the second Alternative.
Therefore Alternative. II. It is financially
demanding by 35 %.
2. The investment costs for circulator pumps: I.
Alternative represent 15 500 EUR compared to the
II. Alternative 12188 EUR. It means that the
investment is 16 % cheaper.
3. The operating costs for the lifetime of the system
(25 years). I. Alternative represents 118 581 EUR
compared to the II. Alternative 61 452 EUR. Clear
savings of the second alternative is 48 %.
4. Total cost: I. Alternative represent 151 572 EUR
compared to Alternative II. is 98 622 EUR, saving
45 %.
In conclusion we can say that the second alternative it
is more efficient and determined to carry out the work.
Conclusion
In conclusion we can say that in the planning, design and implementation process of the heat supply system it is important to take into consideration all circumstances limiting optimum supply of the heat in buildings.
It is not sufficient only to design a state-of-the-art heating systems, circulation pump, heating network and heat exchangers, but the operation of the system as
a whole is important to ensure optimum operation parameters [6], [7].
As proved by this example, in order to maximize the savings it is important to propose more variants in order to allow comparison and to make the best decision. In the present study Alternative II was more profitable by almost 2 years due to efficient operation, although the initial investment costs were higher for this alternative [8].
References [1] D. Petráš: Vykurovanie rodinných a bytových domov:
(Heating of family and residental buildings). Bratislava: JAGA, 2005. 246 p. ISBN 80-8076-012-8
[2] I. Csoknyai, T. Doholuczki: Tobb, mint hidraulika (More than
hydraulic). Budapest: Herz Armatura Hungaria Kft., 2013.
ISBN 978-963-08-7808-1
[3] K. Laboutka, T. Suchánek: Výpočtové tabulky pro vytápění: Vztahy a pomůcky 9. (Calculation tables for heating: Formulas
and utilities 9.). Praha : STP, 2001. 208 p. ISBN 80-02-
01466-9
[4] J. Pekarovič, D. Petráš, O. Lulkovičová and J. Takács: Vykurovanie I. a II. diel (Heating I. and II. Part). Bratislava:
ES STU, 1991. 493 p. ISBN 80-227-0334-6
[5] Z. Straková : Zásobovanie priemyselných celkov s napojením na sústavy CZT: (Supply of industrial units connected to the
CZT heat system). In: iDB Journal. ISSN 1338-3337, 2015,
vol. 5, no. 1, 44-46 p.
[6] M. Kotrbatý, O. Hojer, Z. Kovářová: Hospodaření teplem v průmyslu, Nejlevnější energie je energie ušetřena. (The heat
management in industry. The cheapest energy is energy
spared). Praha : ČSTZ, 2009. 266 p. ISBN 978-80-86028-41-
5
[7] Gy. Homonnay: Épületgépészet 2000 - Fűtéstechnika II. Budapest: Épületgépészet kiadó Kft., 2001
[8] F. Vranay, F.: Application of renewable energy sources in central heat supply systems. In: Czasopis motechniczne:
Budownictwo, 2010. vol. 107, no. 4, 221-228 p. ISSN 0011-
4561 [9] Épületgépészet 2000, Fűtestechnika, Épuletgépészet kiadó
kft., Budatest 2001
[10] Homonnay Gy.:: Épületgépészet 2000 - Fűtéstechnika II.
Budapest, Épületgépészet kiadó Kft. 2001.
[11] Bánhidi L., Kajtár L.: Komfortelmélet 2000 Budapest, Műegyetemi Kiadó, ISBN 963 420 633 6.
[12] Nyers J., Slavica T., Nyers A.: Economic optimum of thermal insulating layer for external wall of brick Acta Politechnica Hungarica 11(7) pp. 209-222. Bp. 2014
[13] Hurych M., Doubrava J.: Vyvažování potrubních sítí. Praha,
IMI International s.r.o., 2000.
[14] Skovraard A.: Grundgos System Guide: Comercial Building
Services 2004
[15] Nyers J., Nyers A.: Hydraulic Analysis of Heat Pump's
Heating Circuit using Mathematical Model, 9rd ICCC
International Conference, Proceedings-USB, ISBN 978-1-
4799-0061-9 pp 349-353, Tihany, Hungary. 04-08. 07. 2013.
EXPRES 2017 ISBN 978-86-919769-1-0
Comparisons of experimental measurements of indoor climate parameters in a swimming pool during winter and summer operation period Belo B. FÜRI a, Róbert TURZA b
Department of Building Services, Faculty of Civil Engineering, Slovak University of
Technology in Bratislava SK-810 05 Bratislava,, Radlinského 11, Slovakia a E-mail: [email protected] b E-mail: [email protected]
Number of indoor swimming pools and wellness centers currently is growing, it is necessary to concern on parameters of their indoor environment. These parameters are necessary for the design of HVAC systems that operate in these premises. In indoor swimming pool facilities, the energy demand is large due to ventilation losses with the exhaust air. Since water is evaporated from the pool surface, the exhaust air has a high water content and specific enthalpy. In this publication measurements of indoor climate parameters and the comparison of indoor climate parameter during winter and summer operation period are described.
Keywords: swimming pool, measurements, water evaporation, air temperature, relative humidity, air velocity
1. Introduction
This paper deals with the topic of hygro-thermal
climate in indoor swimming pool. Ventilation in
these places ensures mainly the hygienic function. A
ventilation device provide internal environment for
people to feel comfortable in the swimming pool,
protecting their health by eliminating pollutants and
finally keep the technology in run and protects the
building structure. Indoor swimming pools belong
to premises with high moisture production,
respectively water vapor, where the relative
humidity in this area is usually between 60 to 80 %
and in rare cases even more.
Indoor swimming pools are water bodies
designed for recreational or competitive swimming,
diving and other water sports that require swimming
or aquatic exercise. Indoor swimming pools make
use artificial environment with technological
elements (filtration, ventilation equipments, pumps,
dosing of chemicals, etc.). Water temperature
depends on pool type. In table 1 are described
design water temperatures for different pool types.
The water temperature affects the heat and mass
transfer between water and human body. Because of
evaporation of the film of water on the unclothed
body additional heat is lost. Therefore to minimize
feel of cold, air temperature should be 2 K to 4 K
(min. 1 °C according to [6]) above the water
temperature, but not above 34 °C [4, 5]. Relative
humidity in swimming pool hall should be within
the range 40 ÷ 65 %. Air flow velocity in the zone
of stay should be below 0,2 m/s.
The water evaporation is a natural process and it
is a critical energy parameter in design and control
system. The forecast of water evaporation from
swimming pools by its reliable calculation is
required for accurate projection of HVAC systems.
In order to eliminate condensation on cold surfaces
in a swimming pool, water vapor has to be removed
by HVAC system and on the other hand water in the
pool has to heated to compensate the heat lost by
evaporation. According to statistics, 70 % of energy
loss in swimming pools goes to water evaporation.
Water evaporation rate to its complex and
stochastic nature is nearly impossible to predict. In
the literature is available wide variation in
correlations for predicting water evaporation and
energy consumption.
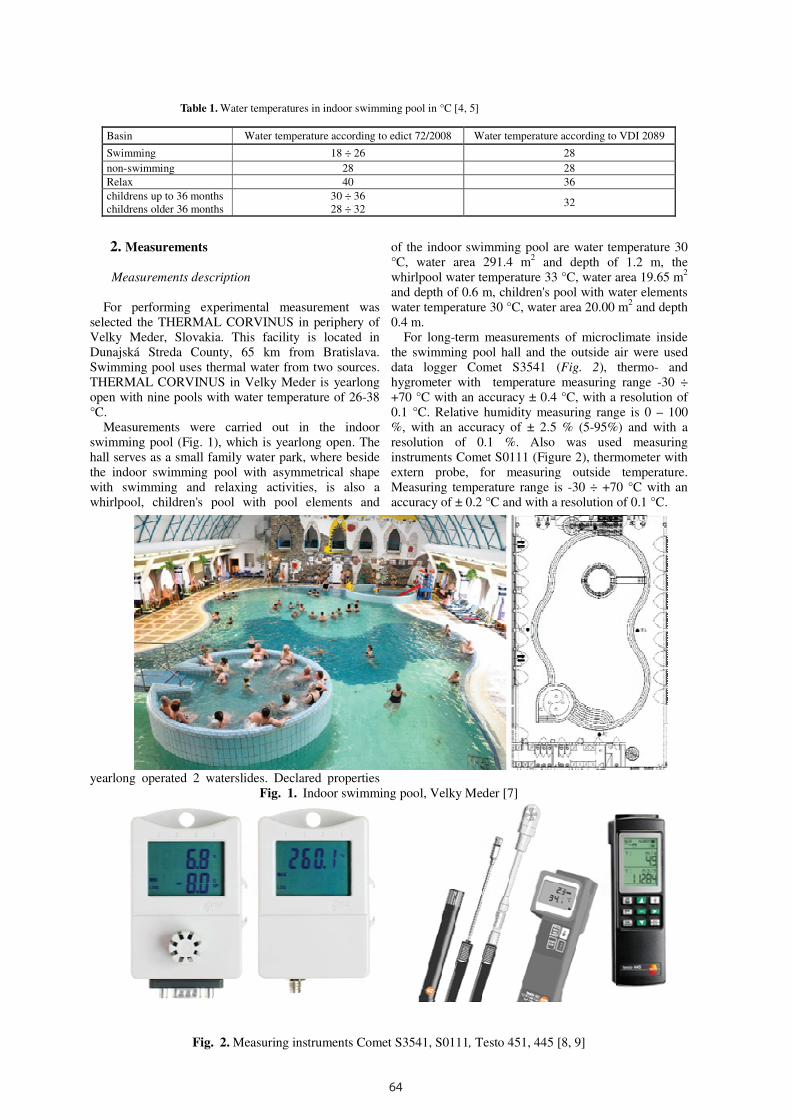
64
Table 1. Water temperatures in indoor swimming pool in °C [4, 5]
Basin Water temperature according to edict 72/2008 Water temperature according to VDI 2089
Swimming 18 ÷ 26 28
non-swimming 28 28
Relax 40 36
childrens up to 36 months
childrens older 36 months
30 ÷ 36
28 ÷ 32 32
2. Measurements
Measurements description
For performing experimental measurement was
selected the THERMAL CORVINUS in periphery of
Velky Meder, Slovakia. This facility is located in
Dunajská Streda County, 65 km from Bratislava.
Swimming pool uses thermal water from two sources.
THERMAL CORVINUS in Velky Meder is yearlong
open with nine pools with water temperature of 26-38
°C.
Measurements were carried out in the indoor
swimming pool (Fig. 1), which is yearlong open. The
hall serves as a small family water park, where beside
the indoor swimming pool with asymmetrical shape
with swimming and relaxing activities, is also a
whirlpool, children's pool with pool elements and
yearlong operated 2 waterslides. Declared properties
of the indoor swimming pool are water temperature 30
°C, water area 291.4 m2 and depth of 1.2 m, the
whirlpool water temperature 33 °C, water area 19.65 m2
and depth of 0.6 m, children's pool with water elements
water temperature 30 °C, water area 20.00 m2 and depth
0.4 m.
For long-term measurements of microclimate inside
the swimming pool hall and the outside air were used
data logger Comet S3541 (Fig. 2), thermo- and
hygrometer with temperature measuring range -30 ÷
+70 °C with an accuracy ± 0.4 °C, with a resolution of
0.1 °C. Relative humidity measuring range is 0 – 100
%, with an accuracy of ± 2.5 % (5-95%) and with a
resolution of 0.1 %. Also was used measuring
instruments Comet S0111 (Figure 2), thermometer with
extern probe, for measuring outside temperature.
Measuring temperature range is -30 ÷ +70 °C with an
accuracy of ± 0.2 °C and with a resolution of 0.1 °C.
Fig. 1. Indoor swimming pool, Velky Meder [7]
Fig. 2. Measuring instruments Comet S3541, S0111, Testo 451, 445 [8, 9]
For instant measurements of microclimate inside the
swimming pool hall were used measuring instruments
Testo 451 and 445 (Fig. 2). Measuring instrument
Testo 451 has the measurable range of air temperature
-40 ÷ +70 °C with an accuracy ±0,1 °C and resolution
0,1 °C, relative humidity range 0 ÷ 100 %, with an
accuracy ±2,0 % (2 ÷ 98 %), and resolution 0,1 %
and air flow velocity range 0,2 ÷ 60 m/s with an
accuracy ±0,1 °C and resolution 0,1 °C. Measuring
instrument Testo 445 has the measurable range of air
temperature of -50 ÷ +150 °C with an accuracy ±0,2 °C
and resolution 0,1 °C, relative humidity 0 ÷ 100 %,
with an accuracy ±2,0 % (2 ÷ 98 %) and resolution 0,1
% and air flow velocity 0,0 ÷ 10 m/s with an accuracy
±0,03 m/s and resolution 0,01 m/s.
Measurements of hygro - thermal microclimate
During the days 09. - 22.07.2013, 04.-08.08.2014
and 06.-13.02.2015 were made measurements of
temperature and humidity in the occupation zone (1 m
from ground) inside the swimming pool and outside air
temperature. Inside the hall was used data logger
Comet S3541 with the set of record interval every 5
min and outside data logger Comet S0111. With this
could be evaluated air temperature and relative
humidity values inside the covered swimming pool.
In the following figures (Fig. 3, 4) you can see the
behavior of hygro-thermal microclimate in swimming
pool. During summer period of 2013 the average inside
air temperature was 27,9 °C and the relative humidity
62,5 % and the average outside air temperature 23,1
°C. During summer period of 2014 the average inside
air temperature was 27,7 °C and the relative humidity
72,2 % and the average outside air temperature 23,0
°C.
During winter period 2015 the average inside air
temperature was 26,05 ± 0,02 °C and the relative
humidity 56,01 ± 0,34 %, the average outside air
temperature 1,98 ± 0,09 °C and the relative humidity
68,20 ± 0,31 %.
Fig. 3. Time course of air temperature and relative humidity inside swimming pool during summer period 2013, 2014
and winter period 2015
Fig. 4. Time course of air temperature and relative humidity outside swimming pool during summer period 2013, 2014
and winter period 2015
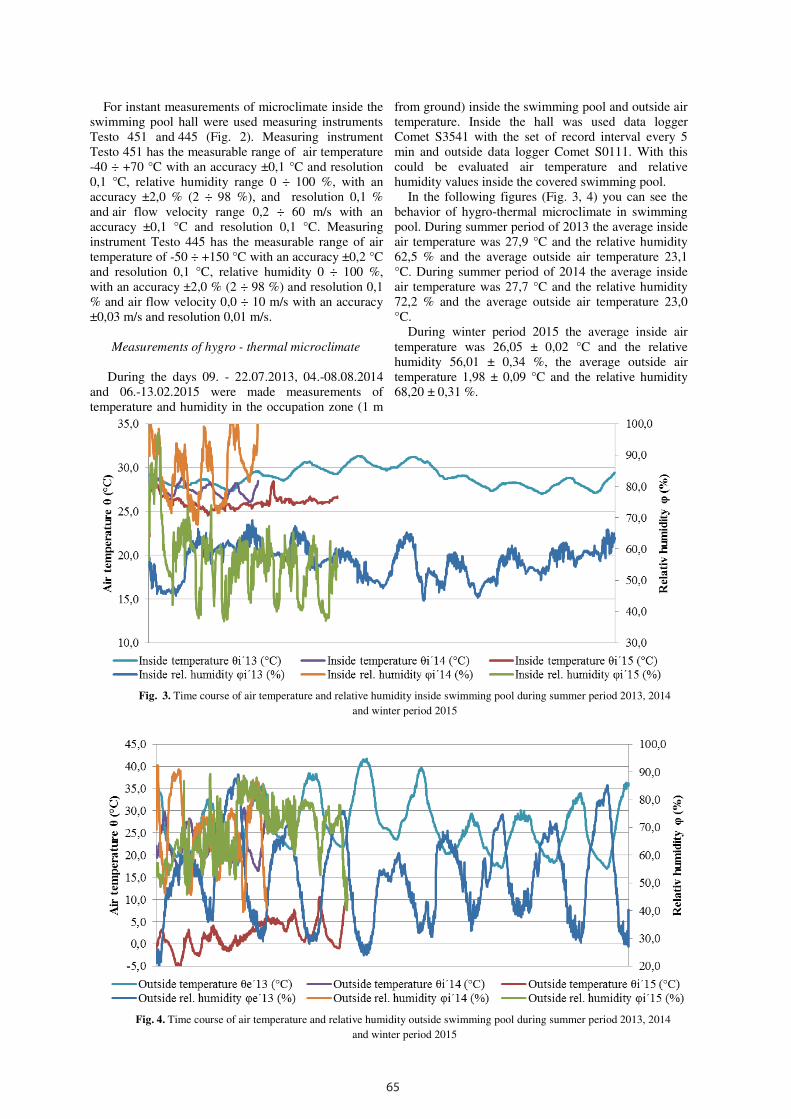
65
Table 1. Water temperatures in indoor swimming pool in °C [4, 5]
Basin Water temperature according to edict 72/2008 Water temperature according to VDI 2089
Swimming 18 ÷ 26 28
non-swimming 28 28
Relax 40 36
childrens up to 36 months
childrens older 36 months
30 ÷ 36
28 ÷ 32 32
2. Measurements
Measurements description
For performing experimental measurement was
selected the THERMAL CORVINUS in periphery of
Velky Meder, Slovakia. This facility is located in
Dunajská Streda County, 65 km from Bratislava.
Swimming pool uses thermal water from two sources.
THERMAL CORVINUS in Velky Meder is yearlong
open with nine pools with water temperature of 26-38
°C.
Measurements were carried out in the indoor
swimming pool (Fig. 1), which is yearlong open. The
hall serves as a small family water park, where beside
the indoor swimming pool with asymmetrical shape
with swimming and relaxing activities, is also a
whirlpool, children's pool with pool elements and
yearlong operated 2 waterslides. Declared properties
of the indoor swimming pool are water temperature 30
°C, water area 291.4 m2 and depth of 1.2 m, the
whirlpool water temperature 33 °C, water area 19.65 m2
and depth of 0.6 m, children's pool with water elements
water temperature 30 °C, water area 20.00 m2 and depth
0.4 m.
For long-term measurements of microclimate inside
the swimming pool hall and the outside air were used
data logger Comet S3541 (Fig. 2), thermo- and
hygrometer with temperature measuring range -30 ÷
+70 °C with an accuracy ± 0.4 °C, with a resolution of
0.1 °C. Relative humidity measuring range is 0 – 100
%, with an accuracy of ± 2.5 % (5-95%) and with a
resolution of 0.1 %. Also was used measuring
instruments Comet S0111 (Figure 2), thermometer with
extern probe, for measuring outside temperature.
Measuring temperature range is -30 ÷ +70 °C with an
accuracy of ± 0.2 °C and with a resolution of 0.1 °C.
Fig. 1. Indoor swimming pool, Velky Meder [7]
Fig. 2. Measuring instruments Comet S3541, S0111, Testo 451, 445 [8, 9]
For instant measurements of microclimate inside the
swimming pool hall were used measuring instruments
Testo 451 and 445 (Fig. 2). Measuring instrument
Testo 451 has the measurable range of air temperature
-40 ÷ +70 °C with an accuracy ±0,1 °C and resolution
0,1 °C, relative humidity range 0 ÷ 100 %, with an
accuracy ±2,0 % (2 ÷ 98 %), and resolution 0,1 %
and air flow velocity range 0,2 ÷ 60 m/s with an
accuracy ±0,1 °C and resolution 0,1 °C. Measuring
instrument Testo 445 has the measurable range of air
temperature of -50 ÷ +150 °C with an accuracy ±0,2 °C
and resolution 0,1 °C, relative humidity 0 ÷ 100 %,
with an accuracy ±2,0 % (2 ÷ 98 %) and resolution 0,1
% and air flow velocity 0,0 ÷ 10 m/s with an accuracy
±0,03 m/s and resolution 0,01 m/s.
Measurements of hygro - thermal microclimate
During the days 09. - 22.07.2013, 04.-08.08.2014
and 06.-13.02.2015 were made measurements of
temperature and humidity in the occupation zone (1 m
from ground) inside the swimming pool and outside air
temperature. Inside the hall was used data logger
Comet S3541 with the set of record interval every 5
min and outside data logger Comet S0111. With this
could be evaluated air temperature and relative
humidity values inside the covered swimming pool.
In the following figures (Fig. 3, 4) you can see the
behavior of hygro-thermal microclimate in swimming
pool. During summer period of 2013 the average inside
air temperature was 27,9 °C and the relative humidity
62,5 % and the average outside air temperature 23,1
°C. During summer period of 2014 the average inside
air temperature was 27,7 °C and the relative humidity
72,2 % and the average outside air temperature 23,0
°C.
During winter period 2015 the average inside air
temperature was 26,05 ± 0,02 °C and the relative
humidity 56,01 ± 0,34 %, the average outside air
temperature 1,98 ± 0,09 °C and the relative humidity
68,20 ± 0,31 %.
Fig. 3. Time course of air temperature and relative humidity inside swimming pool during summer period 2013, 2014
and winter period 2015
Fig. 4. Time course of air temperature and relative humidity outside swimming pool during summer period 2013, 2014
and winter period 2015
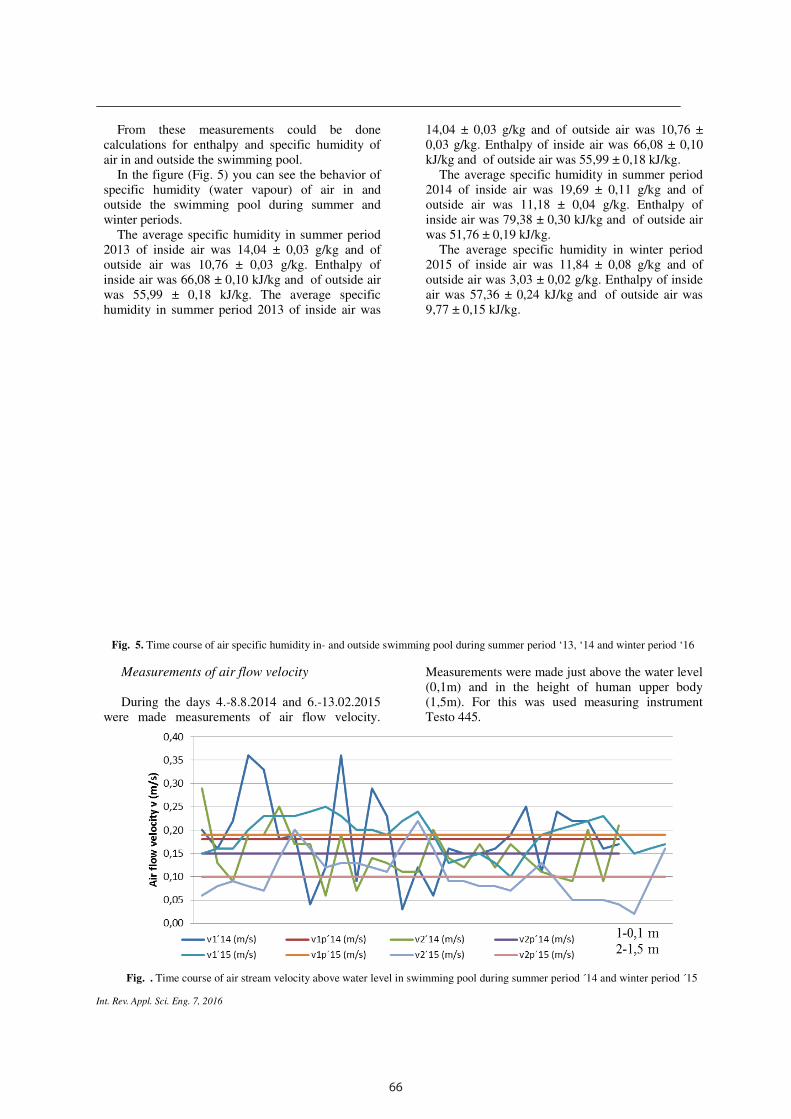
66
123 Int. Rev. Appl. Sci. Eng. 7, 2016
From these measurements could be done
calculations for enthalpy and specific humidity of
air in and outside the swimming pool.
In the figure (Fig. 5) you can see the behavior of
specific humidity (water vapour) of air in and
outside the swimming pool during summer and
winter periods.
The average specific humidity in summer period
2013 of inside air was 14,04 ± 0,03 g/kg and of
outside air was 10,76 ± 0,03 g/kg. Enthalpy of
inside air was 66,08 ± 0,10 kJ/kg and of outside air
was 55,99 ± 0,18 kJ/kg. The average specific
humidity in summer period 2013 of inside air was
14,04 ± 0,03 g/kg and of outside air was 10,76 ±
0,03 g/kg. Enthalpy of inside air was 66,08 ± 0,10
kJ/kg and of outside air was 55,99 ± 0,18 kJ/kg.
The average specific humidity in summer period
2014 of inside air was 19,69 ± 0,11 g/kg and of
outside air was 11,18 ± 0,04 g/kg. Enthalpy of
inside air was 79,38 ± 0,30 kJ/kg and of outside air
was 51,76 ± 0,19 kJ/kg.
The average specific humidity in winter period
2015 of inside air was 11,84 ± 0,08 g/kg and of
outside air was 3,03 ± 0,02 g/kg. Enthalpy of inside
air was 57,36 ± 0,24 kJ/kg and of outside air was
9,77 ± 0,15 kJ/kg.
Fig. 5. Time course of air specific humidity in- and outside swimming pool during summer period ‘13, ‘14 and winter period ‘16
Measurements of air flow velocity
During the days 4.-8.8.2014 and 6.-13.02.2015
were made measurements of air flow velocity.
Measurements were made just above the water level
(0,1m) and in the height of human upper body
(1,5m). For this was used measuring instrument
Testo 445.
Fig. . Time course of air stream velocity above water level in swimming pool during summer period ´14 and winter period ´15
In the figure (Fig. 6) you can see the behavior of
air flow above the water level.
The average velocity in summer period in the
height of 0,1 m was 0,18 ± 0,02 m/s and in the
height of 1,5 m was 0,15 ± 0,01 m/s.
The average velocity in winter period 2015 in
the height of 0,1 m was 0,19 ± 0,01 m/s and in the
height of 1,5 m was 0,10 ± 0,01 m/s.
3. Water evaporation calculation
After these measurements was made also
calculations of water evaporation. Numerous empirical
correlations have been presented for unoccupied or
occupied swimming pools. I have chosen the formula
most used in Slovakia, which is according to [4].
The mass flow of evaporated water mw:
( ) ( )( ) ( )skgAppTR
m hpp
v
w iw/..
.θθ
β−′′= (1)
β=f (βx) (2)
βx=f (swimming pool type, air flow velocity) (3)
where:
β – coefficient of mass transfer (m/h),
Rv – specific gas constant for water vapor (J/(kg.K)),
T – arithmetic mean of water and air temperature (K),
p“v(θw) – saturation pressure of water vapors at water
temperature (Pa),
pv(θi) – water vapor pressure of tinside air (Pa),
Ah – water area (m2).
In the figure below (Fig. 7) is shown time course of
the mass flow of evaporated water from the pool.
During the summer period 2013 was the average
mass flow of evaporated water 198,66 ± 1,33 kg/h and
latent heat flow needed to vaporize this amount of
water was 496,65 ± 1,28 kJ.
During the summer period 2014 was the average
mass flow of evaporated water 111,93 ± 1,63 kg/h and
latent heat flow needed to vaporize this amount of
water was 279,83 ± 4,08 kJ.
During the winter period 2015 was the average mass
flow of evaporated water 234,54 ± 1,33 kg/h and the
amount of latent heat needed to vaporize this amount of
water was 586,35 ± 3,32 kJ.
Fig. 7. Time course of evaporated water flow from the swimming pool during summer period ´13, ´14 and winter period´15
4. Conclusion
During the summer period 2013, 2014 and winter
period 2015 were made measurements of hydro-
thermal microclimate in the indoor swimming pool
in Thermal Corvinus Velky Meder. This paper
presents the results of these measurements. During
the measurements in summer period was also used
natural ventilation through open windows and
doors. In consequence of this, inside air temperature
depended on the temperature of the external
environment. Therefore it was not permanently
secured required level of air temperature, which
should be at least 2 °C higher from the water
temperature. Relative humidity in the swimming
pool was below the required level 65%. The
exception was side of the swimming pool with
toboggans, where the relative humidity was affected
by significant water spilling due to slipping on the
water slides. Solution of this could be elimination of
additional moisture by closing doors and windows
and running the HVAC system with better
regulation.
Air flow velocity above the water level was
met, i.e. below 0,2 m/s.
In this paper was presented also calculation
of water evaporation from water level according to
VDI 2089 methodology.
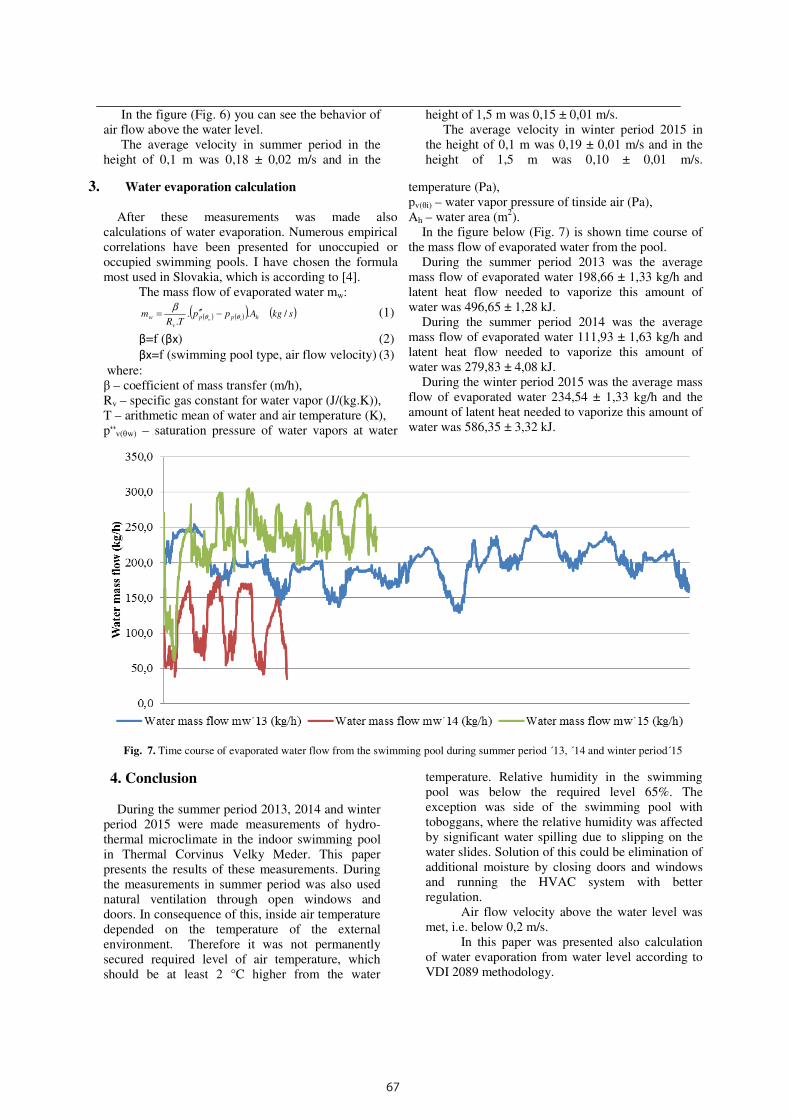
67
123 Int. Rev. Appl. Sci. Eng. 7, 2016
From these measurements could be done
calculations for enthalpy and specific humidity of
air in and outside the swimming pool.
In the figure (Fig. 5) you can see the behavior of
specific humidity (water vapour) of air in and
outside the swimming pool during summer and
winter periods.
The average specific humidity in summer period
2013 of inside air was 14,04 ± 0,03 g/kg and of
outside air was 10,76 ± 0,03 g/kg. Enthalpy of
inside air was 66,08 ± 0,10 kJ/kg and of outside air
was 55,99 ± 0,18 kJ/kg. The average specific
humidity in summer period 2013 of inside air was
14,04 ± 0,03 g/kg and of outside air was 10,76 ±
0,03 g/kg. Enthalpy of inside air was 66,08 ± 0,10
kJ/kg and of outside air was 55,99 ± 0,18 kJ/kg.
The average specific humidity in summer period
2014 of inside air was 19,69 ± 0,11 g/kg and of
outside air was 11,18 ± 0,04 g/kg. Enthalpy of
inside air was 79,38 ± 0,30 kJ/kg and of outside air
was 51,76 ± 0,19 kJ/kg.
The average specific humidity in winter period
2015 of inside air was 11,84 ± 0,08 g/kg and of
outside air was 3,03 ± 0,02 g/kg. Enthalpy of inside
air was 57,36 ± 0,24 kJ/kg and of outside air was
9,77 ± 0,15 kJ/kg.
Fig. 5. Time course of air specific humidity in- and outside swimming pool during summer period ‘13, ‘14 and winter period ‘16
Measurements of air flow velocity
During the days 4.-8.8.2014 and 6.-13.02.2015
were made measurements of air flow velocity.
Measurements were made just above the water level
(0,1m) and in the height of human upper body
(1,5m). For this was used measuring instrument
Testo 445.
Fig. . Time course of air stream velocity above water level in swimming pool during summer period ´14 and winter period ´15
In the figure (Fig. 6) you can see the behavior of
air flow above the water level.
The average velocity in summer period in the
height of 0,1 m was 0,18 ± 0,02 m/s and in the
height of 1,5 m was 0,15 ± 0,01 m/s.
The average velocity in winter period 2015 in
the height of 0,1 m was 0,19 ± 0,01 m/s and in the
height of 1,5 m was 0,10 ± 0,01 m/s.
3. Water evaporation calculation
After these measurements was made also
calculations of water evaporation. Numerous empirical
correlations have been presented for unoccupied or
occupied swimming pools. I have chosen the formula
most used in Slovakia, which is according to [4].
The mass flow of evaporated water mw:
( ) ( )( ) ( )skgAppTR
m hpp
v
w iw/..
.θθ
β−′′= (1)
β=f (βx) (2)
βx=f (swimming pool type, air flow velocity) (3)
where:
β – coefficient of mass transfer (m/h),
Rv – specific gas constant for water vapor (J/(kg.K)),
T – arithmetic mean of water and air temperature (K),
p“v(θw) – saturation pressure of water vapors at water
temperature (Pa),
pv(θi) – water vapor pressure of tinside air (Pa),
Ah – water area (m2).
In the figure below (Fig. 7) is shown time course of
the mass flow of evaporated water from the pool.
During the summer period 2013 was the average
mass flow of evaporated water 198,66 ± 1,33 kg/h and
latent heat flow needed to vaporize this amount of
water was 496,65 ± 1,28 kJ.
During the summer period 2014 was the average
mass flow of evaporated water 111,93 ± 1,63 kg/h and
latent heat flow needed to vaporize this amount of
water was 279,83 ± 4,08 kJ.
During the winter period 2015 was the average mass
flow of evaporated water 234,54 ± 1,33 kg/h and the
amount of latent heat needed to vaporize this amount of
water was 586,35 ± 3,32 kJ.
Fig. 7. Time course of evaporated water flow from the swimming pool during summer period ´13, ´14 and winter period´15
4. Conclusion
During the summer period 2013, 2014 and winter
period 2015 were made measurements of hydro-
thermal microclimate in the indoor swimming pool
in Thermal Corvinus Velky Meder. This paper
presents the results of these measurements. During
the measurements in summer period was also used
natural ventilation through open windows and
doors. In consequence of this, inside air temperature
depended on the temperature of the external
environment. Therefore it was not permanently
secured required level of air temperature, which
should be at least 2 °C higher from the water
temperature. Relative humidity in the swimming
pool was below the required level 65%. The
exception was side of the swimming pool with
toboggans, where the relative humidity was affected
by significant water spilling due to slipping on the
water slides. Solution of this could be elimination of
additional moisture by closing doors and windows
and running the HVAC system with better
regulation.
Air flow velocity above the water level was
met, i.e. below 0,2 m/s.
In this paper was presented also calculation
of water evaporation from water level according to
VDI 2089 methodology.

68
References
[1] FERSTL, K., Vetranie a klimatizácia priestorov
s vyššou produkciou vlhkosti (Ventilation and air
conditioning in areas with higher humidity production),
SSTP, Bratislava, 2001
[2] FERSTL, K., MASARYK, M., Prenos tepla (Heat
transfer), STU, Bratislava, 2011, ISBN 978-80-227-
3534-6
[3] Turza, R., Teplovzdušné vetranie krytej plavárne
(Ventilation of indoor swimming pool), Diplomová
práca, STU, Bratislava, 2011
[4] VDI 2089, Building services in swimming baths –
Indoor pools
[5] Edict of Ministry of Health SK 72/2008 - requirements
for water quality, facilities for the natural and indoor
swimming pools
[6] Edict of Ministry of Health SK 259/2008 - requirements
for indoor climate environment
[7] Thermal Corvinus, Veľký Meder,.
http://www.thermalcorvinus.sk
[8] Comet, http://www.cometsystem.cz
[9] Testo, http://www.testo.sk
[10] Szabo J., Kajtar L., Nyers J., Bokor B.: A new
approach and results of Wall and Air Temperature
Dynamic Analysis in Underground Spaces.
International J. Energy. Vol. 106, pp.520 -527, 1. July
2016. doi:10.1016/j.energy.2016.03.008.
[11] Kajtar L., Nyers J., Szabo J.: Dynamic thermal
dimensioning of underground spaces, International J.
Energy. Vol. 87, pp. 361-368, 1 July 2015.
doi:10.1016/j.energy.2015.04.112.
EXPRES 2017
ISBN 978-86-919769-1-0
Optimal operating conditions for manure biogas plants in Serbia
P. KOVAČ a, S. KIRIN b, B. SAVKOVIĆ a, D. JESIC c, D. GOLUBOVIC d
a Department for Production Engineering, Faculty of Technical Sciences, University of Novi Sad
21000 Novi Sad, Trg D Obradovica 6, Serbia
E-mail:[email protected], [email protected] bInovative Centre of Faculty of Mecchanical Engineering, University of Belgrade
11000 Beograd Trg Kraljice Marije, Serbia
E-mail:[email protected] cInternational Technology and Management Academy – MTMA,
TrgD.Obradovića 7, 21000 Novi Sad, Serbia
E-mail:[email protected] dFaculty of Mechanical Engineering, University of East Sarajevo
71123East Sarajevo, Vuka Karadžića 30, Bosnia and Hercegovina
E-mail:[email protected]
Serbia has significant potential for renewable energy by using agriculture and forestry. Despite a high incidence of renewable raw
materials and residues from the agricultural industry, the biogas market in Serbia is still in the beginning phase. The paper gives
short overview of biogas production from organic waste and animal manure. First attempts to produce energy from anaerobic
digestion were made in the 1980s when several biogas plants had been built to digest manure and (sewage) sludge. None of these
plants has been operated beyond the 1990s due to commercial and technical problems. After a gap of almost 20 years biogas
technology today is new to Serbia and little experience exists. Between 2009 and 2012 a small number of biogas plants have been
built. Here is proposal for an additional income source for medium sized farms with small scale slurry biogas plants. Here is
project proposal for 50 kWel biogas plant for pig farm or cattle farm. This way is given contribution to renewable energy from
biogas sources in energy production in Serbia
Keywords:renewable energy, biogas, operating conditions
1. Introduction
Over the past decade, and particularly in recent years,
advances in renewable energy technologies, global
increases in capacity, and rapid cost reductions have
been due largely to policy support, which has
attracted significant investment and has further driven
down costs through economies of scale.
According to recently conducted studies there
are currently no CHP-plants fired with biomass from
agriculture. In the sector of heating of private
households wooden biomass is widely used in Serbia.
In 2010/2011 around 6.4 Mm3 wood were used for
heating purposes in households in Serbia [1]. The use
of biogas in Serbia is just at the beginning. There are
3 agricultural biogas plants online and two more,
using organic waste or by-products as substrate [2].
The biogas plants in Vrbas and Blace have been
visited in the course of the project.
The biogas plant in Vrbas uses around 27,000 t of
manure annually. The manure is provided by a farm
next to the biogas plant, which belongs to Mirotin-
Group as well. In addition to the manure also the use
of 10,000 t of maize silage was planned. Due to the
relatively high prizes for maize the substrate
consumption was switched to sugar beet pulp.
Currently half of the initially planned maize silage
consumption is replaced by around 15,000 t of sugar
beet pulp. In the moment there is no usage of the heat.
But in the course of the planned extension of biogas
production the usage of heat is envisaged.
69
References
[1] FERSTL, K., Vetranie a klimatizácia priestorov
s vyššou produkciou vlhkosti (Ventilation and air
conditioning in areas with higher humidity production),
SSTP, Bratislava, 2001
[2] FERSTL, K., MASARYK, M., Prenos tepla (Heat
transfer), STU, Bratislava, 2011, ISBN 978-80-227-
3534-6
[3] Turza, R., Teplovzdušné vetranie krytej plavárne
(Ventilation of indoor swimming pool), Diplomová
práca, STU, Bratislava, 2011
[4] VDI 2089, Building services in swimming baths –
Indoor pools
[5] Edict of Ministry of Health SK 72/2008 - requirements
for water quality, facilities for the natural and indoor
swimming pools
[6] Edict of Ministry of Health SK 259/2008 - requirements
for indoor climate environment
[7] Thermal Corvinus, Veľký Meder,.
http://www.thermalcorvinus.sk
[8] Comet, http://www.cometsystem.cz
[9] Testo, http://www.testo.sk
[10] Szabo J., Kajtar L., Nyers J., Bokor B.: A new
approach and results of Wall and Air Temperature
Dynamic Analysis in Underground Spaces.
International J. Energy. Vol. 106, pp.520 -527, 1. July
2016. doi:10.1016/j.energy.2016.03.008.
[11] Kajtar L., Nyers J., Szabo J.: Dynamic thermal
dimensioning of underground spaces, International J.
Energy. Vol. 87, pp. 361-368, 1 July 2015.
doi:10.1016/j.energy.2015.04.112.
EXPRES 2017
ISBN 978-86-919769-1-0
Optimal operating conditions for manure biogas plants in Serbia
P. KOVAČ a, S. KIRIN b, B. SAVKOVIĆ a, D. JESIC c, D. GOLUBOVIC d
a Department for Production Engineering, Faculty of Technical Sciences, University of Novi Sad
21000 Novi Sad, Trg D Obradovica 6, Serbia
E-mail:[email protected], [email protected] bInovative Centre of Faculty of Mecchanical Engineering, University of Belgrade
11000 Beograd Trg Kraljice Marije, Serbia
E-mail:[email protected] cInternational Technology and Management Academy – MTMA,
TrgD.Obradovića 7, 21000 Novi Sad, Serbia
E-mail:[email protected] dFaculty of Mechanical Engineering, University of East Sarajevo
71123East Sarajevo, Vuka Karadžića 30, Bosnia and Hercegovina
E-mail:[email protected]
Serbia has significant potential for renewable energy by using agriculture and forestry. Despite a high incidence of renewable raw
materials and residues from the agricultural industry, the biogas market in Serbia is still in the beginning phase. The paper gives
short overview of biogas production from organic waste and animal manure. First attempts to produce energy from anaerobic
digestion were made in the 1980s when several biogas plants had been built to digest manure and (sewage) sludge. None of these
plants has been operated beyond the 1990s due to commercial and technical problems. After a gap of almost 20 years biogas
technology today is new to Serbia and little experience exists. Between 2009 and 2012 a small number of biogas plants have been
built. Here is proposal for an additional income source for medium sized farms with small scale slurry biogas plants. Here is
project proposal for 50 kWel biogas plant for pig farm or cattle farm. This way is given contribution to renewable energy from
biogas sources in energy production in Serbia
Keywords:renewable energy, biogas, operating conditions
1. Introduction
Over the past decade, and particularly in recent years,
advances in renewable energy technologies, global
increases in capacity, and rapid cost reductions have
been due largely to policy support, which has
attracted significant investment and has further driven
down costs through economies of scale.
According to recently conducted studies there
are currently no CHP-plants fired with biomass from
agriculture. In the sector of heating of private
households wooden biomass is widely used in Serbia.
In 2010/2011 around 6.4 Mm3 wood were used for
heating purposes in households in Serbia [1]. The use
of biogas in Serbia is just at the beginning. There are
3 agricultural biogas plants online and two more,
using organic waste or by-products as substrate [2].
The biogas plants in Vrbas and Blace have been
visited in the course of the project.
The biogas plant in Vrbas uses around 27,000 t of
manure annually. The manure is provided by a farm
next to the biogas plant, which belongs to Mirotin-
Group as well. In addition to the manure also the use
of 10,000 t of maize silage was planned. Due to the
relatively high prizes for maize the substrate
consumption was switched to sugar beet pulp.
Currently half of the initially planned maize silage
consumption is replaced by around 15,000 t of sugar
beet pulp. In the moment there is no usage of the heat.
But in the course of the planned extension of biogas
production the usage of heat is envisaged.

70
OPTIMAL OPERATING CONDITIONS FORMANURE BIOGASPLANTS IN SERBIA
The biogas plant in Blace uses around 12,700 t
of manure annually. In addition 14,600 t/a of whey
from the dairy production is used, as well as 7,300 t/a
of maize silage. As maize silage is too expensive the
partial replacement with whole crop silage from
wheat or triticale is planned. For the use of heat a
dryer for digestate is under construction. It is planned
to use the dried digestate afterwards as fuel for heat
production at the dairy. Both visited biogas plants run
more than 8,000 operating hours annually.
2. Materialandmethods
Biogas is produced in the performance of
anaerobic digestion of organic matter. Due to the
different degree of processing biomass resources are
divided into:
– Landfill gas, obtained by the fermentation of
waste in landfills,
– Gas from sewage sludge, produced by anaerobic
digestion of sludge sewerage,
– Other biogas:
a) agricultural biogas obtained in anaerobic
digestion of biomass from energy crops, crop
residues and animal manure;
b) biogas obtained in anaerobic digestion of
biomass from wastes in abattoirs, breweries and
other food industries.
Biogas is a gas consisting mainly of methane
and carbon dioxide, obtained in the process of
anaerobic digestion of biomass. Building agricultural
biogas plants contribute in the longer term to the
environment, production of additional clean energy,
which will ensure energy security. Biogas plants are
highly efficient - producing four times more power
than wind power. Their construction will contribute
to reducing pollution, reducing the odor that
accompanies crop production and most importantly,
increase the share of RES in the energy balance.
All 6 plants that are in operation in Serbia were
built after the first version of the statutory feed-in
remuneration for biogas in 2009, whereby three of
these plants are fermenting industrial wastewater and
sewage sludge for their own power supply. The
remaining three biogas plants are mainly charged
with cattle manure and slurry, maize silage and beet
pulp. The latter is a raw material that exists in high
quantities in particular in the region of Vojvodina,
because there are numerous sugar beet processing
plants. According to the information provided by
operators of these plants, whose installed electrical
capacity ranges between 635 kW and 1.5 MW, they
have a capacity utilization rate of over 90%, which
figure indicates solid plant technology paired with
strong know-how of the operators. Also the
profitability of biogas plants under the remuneration
scheme from year 2009 seems to be convincing for
the operators - so all three agricultural plants are
planning to expand plant capacity plus to add as yet
non-existing heat utilization through construction of
new greenhouses and district heating networks.
Serbia has accepted the obligation to increase the
share of renewable energy sources in in total energy
consumption from 21.1% in 2009 to 27% in 2020.
Table 1 shows combined heat and power (CHP) plant
planned in year 2020 and achieved in 2015, [3].
Table1.Biomass and biogas plan in realization
Plan (2020) Achieved (2015)
MW MW
Biomas – CHP plant 100 0
Biogas – CHP plant 30 4,9
Serbia is above average rich in renewable energy,
in contrast to conventional and Serbia wants to develop
the energy use of its enormous potential of biomass
from agriculture and forestry. Agricultural residues
represent the greatest potential resource.
The estimated total of produced biomass in
Serbia, is around 12.5 million tons per year, of which 9
million tons is produced in Vojvodina (72%), [4].
Manure can be used for the commercial energy
production on and near farms without competing with
the supply needed for fertilization. According to
statistical data, published by the Statistical Office of
the Republic of Serbia for year 2014, [5], the total
livestock of the Republic is in Table 2. Manure can be
used for the commercial energy production on and near
farms without competing with the supply needed for
fertilization. According to statistical data, published by
the Statistical Office of the Republic of Serbia for year
2014, [5], the total livestock of the Republic is in Table
2.
Table 2.Total livestock of the Republic Serbia
Livestock in Serbia
Cattle 915 641
Horses 15 222
Sheep 1 789 144
Goats 202 828
Pigs 3 284 378
Poultry 17 449 938
However, the economics might not be beneficial
to all farmers, since the methane yield per mass unit of
manure is comparatively low. Therefore, co-digestion
with other substrates (e.g. energy crops, crop residues)
is common and their availability in the presented
hotspots should be included in future evaluations Table
3.
In addition to the feed-in tariffs, heat and steam
generation with biogas and CHP waste heat will play a
significant role for the profitability of biogas plants in
OPTIMAL OPERATING CONDITIONS FORMANURE BIOGASPLANTS IN SERBIA
Serbia. Although cheap energy sources, such as coal
and firewood, are still in many regions and sectors
the main fuels, approximately 40% of public
buildings in Serbia are heated with fuel oil HEL,
which is currently with a heat price in average of
approximately 100€ per MWh of heat (approximately
1.05 € per litre net) exerting a massive impact on the
budgets of the municipalities. Particularly in the
agricultural and forestry regions of Serbia people are
looking into reasonably priced and available
bioenergy. In Figure 1 biogas plant model is shown
[6].
Table3.Estimated biogas production of livestock manure per head (m3/head*day) [4]
Livestock
Categories
Estimated fresch manure
(FM) (m3/head*year)
Methane yield in
(ml/m3 FM)
Net caloric
value biogas
Cattle 11.76 17.00
21.8 MJ/m3
= 6 kwh
Cattle 18.00 17.00
Pigs 2.20 12.00
Poultry 0.02 82.00
Fig.1.Biogas plant model
All 6 plants that are in operation in Serbia were
built after the first version of the statutory feed-in
remuneration for biogas in 2009, whereby three of
these plants are fermenting industrial wastewater and
sewage sludge for their own power supply. Realized
biogas plant in Mirotin is shown in Figure 2. The
remaining three biogas plants are mainly charged with
cattle manure and slurry, maize silage and beet pulp.
There is no project for construction of a biomass plant
in Serbia yet, despite the favorable position that
biomass has with a 60% share of the total potential for
renewable energy in the country.
Fig.2.Mirotin/biogas plant
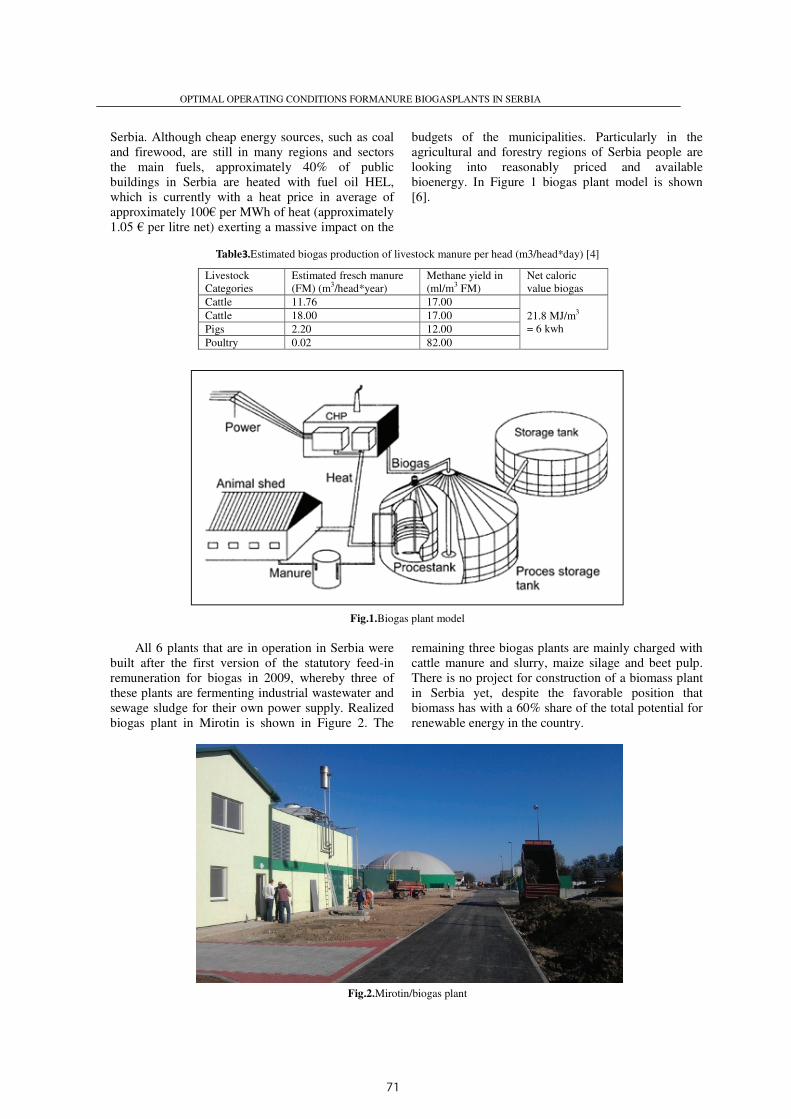
71
OPTIMAL OPERATING CONDITIONS FORMANURE BIOGASPLANTS IN SERBIA
The biogas plant in Blace uses around 12,700 t
of manure annually. In addition 14,600 t/a of whey
from the dairy production is used, as well as 7,300 t/a
of maize silage. As maize silage is too expensive the
partial replacement with whole crop silage from
wheat or triticale is planned. For the use of heat a
dryer for digestate is under construction. It is planned
to use the dried digestate afterwards as fuel for heat
production at the dairy. Both visited biogas plants run
more than 8,000 operating hours annually.
2. Materialandmethods
Biogas is produced in the performance of
anaerobic digestion of organic matter. Due to the
different degree of processing biomass resources are
divided into:
– Landfill gas, obtained by the fermentation of
waste in landfills,
– Gas from sewage sludge, produced by anaerobic
digestion of sludge sewerage,
– Other biogas:
a) agricultural biogas obtained in anaerobic
digestion of biomass from energy crops, crop
residues and animal manure;
b) biogas obtained in anaerobic digestion of
biomass from wastes in abattoirs, breweries and
other food industries.
Biogas is a gas consisting mainly of methane
and carbon dioxide, obtained in the process of
anaerobic digestion of biomass. Building agricultural
biogas plants contribute in the longer term to the
environment, production of additional clean energy,
which will ensure energy security. Biogas plants are
highly efficient - producing four times more power
than wind power. Their construction will contribute
to reducing pollution, reducing the odor that
accompanies crop production and most importantly,
increase the share of RES in the energy balance.
All 6 plants that are in operation in Serbia were
built after the first version of the statutory feed-in
remuneration for biogas in 2009, whereby three of
these plants are fermenting industrial wastewater and
sewage sludge for their own power supply. The
remaining three biogas plants are mainly charged
with cattle manure and slurry, maize silage and beet
pulp. The latter is a raw material that exists in high
quantities in particular in the region of Vojvodina,
because there are numerous sugar beet processing
plants. According to the information provided by
operators of these plants, whose installed electrical
capacity ranges between 635 kW and 1.5 MW, they
have a capacity utilization rate of over 90%, which
figure indicates solid plant technology paired with
strong know-how of the operators. Also the
profitability of biogas plants under the remuneration
scheme from year 2009 seems to be convincing for
the operators - so all three agricultural plants are
planning to expand plant capacity plus to add as yet
non-existing heat utilization through construction of
new greenhouses and district heating networks.
Serbia has accepted the obligation to increase the
share of renewable energy sources in in total energy
consumption from 21.1% in 2009 to 27% in 2020.
Table 1 shows combined heat and power (CHP) plant
planned in year 2020 and achieved in 2015, [3].
Table1.Biomass and biogas plan in realization
Plan (2020) Achieved (2015)
MW MW
Biomas – CHP plant 100 0
Biogas – CHP plant 30 4,9
Serbia is above average rich in renewable energy,
in contrast to conventional and Serbia wants to develop
the energy use of its enormous potential of biomass
from agriculture and forestry. Agricultural residues
represent the greatest potential resource.
The estimated total of produced biomass in
Serbia, is around 12.5 million tons per year, of which 9
million tons is produced in Vojvodina (72%), [4].
Manure can be used for the commercial energy
production on and near farms without competing with
the supply needed for fertilization. According to
statistical data, published by the Statistical Office of
the Republic of Serbia for year 2014, [5], the total
livestock of the Republic is in Table 2. Manure can be
used for the commercial energy production on and near
farms without competing with the supply needed for
fertilization. According to statistical data, published by
the Statistical Office of the Republic of Serbia for year
2014, [5], the total livestock of the Republic is in Table
2.
Table 2.Total livestock of the Republic Serbia
Livestock in Serbia
Cattle 915 641
Horses 15 222
Sheep 1 789 144
Goats 202 828
Pigs 3 284 378
Poultry 17 449 938
However, the economics might not be beneficial
to all farmers, since the methane yield per mass unit of
manure is comparatively low. Therefore, co-digestion
with other substrates (e.g. energy crops, crop residues)
is common and their availability in the presented
hotspots should be included in future evaluations Table
3.
In addition to the feed-in tariffs, heat and steam
generation with biogas and CHP waste heat will play a
significant role for the profitability of biogas plants in
OPTIMAL OPERATING CONDITIONS FORMANURE BIOGASPLANTS IN SERBIA
Serbia. Although cheap energy sources, such as coal
and firewood, are still in many regions and sectors
the main fuels, approximately 40% of public
buildings in Serbia are heated with fuel oil HEL,
which is currently with a heat price in average of
approximately 100€ per MWh of heat (approximately
1.05 € per litre net) exerting a massive impact on the
budgets of the municipalities. Particularly in the
agricultural and forestry regions of Serbia people are
looking into reasonably priced and available
bioenergy. In Figure 1 biogas plant model is shown
[6].
Table3.Estimated biogas production of livestock manure per head (m3/head*day) [4]
Livestock
Categories
Estimated fresch manure
(FM) (m3/head*year)
Methane yield in
(ml/m3 FM)
Net caloric
value biogas
Cattle 11.76 17.00
21.8 MJ/m3
= 6 kwh
Cattle 18.00 17.00
Pigs 2.20 12.00
Poultry 0.02 82.00
Fig.1.Biogas plant model
All 6 plants that are in operation in Serbia were
built after the first version of the statutory feed-in
remuneration for biogas in 2009, whereby three of
these plants are fermenting industrial wastewater and
sewage sludge for their own power supply. Realized
biogas plant in Mirotin is shown in Figure 2. The
remaining three biogas plants are mainly charged with
cattle manure and slurry, maize silage and beet pulp.
There is no project for construction of a biomass plant
in Serbia yet, despite the favorable position that
biomass has with a 60% share of the total potential for
renewable energy in the country.
Fig.2.Mirotin/biogas plant

72
OPTIMAL OPERATING CONDITIONS FORMANURE BIOGASPLANTS IN SERBIA
3. Results and analyze
Table4.Project Proposal of 50 kWel Biogas plant in Serbia: Manure input– required quantity and quality
Biogas production of substrate
Substrate Fresh material DMS oDMS Production of CH4 Production of biogas
t/a m3/d % FM % DMS % m3/year l/kg oDMS m3/year
Liquid Pork Manure 31 928 87 2.0 % 75 % 60% 120 687 420.0 201 145
total 31 928 87 120 687 201 145
or
Biogas production of substrate
Substrate Fresh material DMS oDMS Production of CH4 Production of biogas
t/a m3/d % FM % DMS % m3/year l/kg oDMS m3/year
Liquid cattle manure 9445 26 7.0% 75% 55% 95 458.15 350.0 175 560
Solid cattle manure 730 2 18.0% 80% 60% 25 229 400.0 42 048
total 10.175 28 120 687 215 608
Pig farm of around 5.000 animal units or cattle
farm around 1.000 animal units can provide needed
amount for the proposed plant size analysis of
organic dry matter content and real quantity values
necessary for each individual farm and projectcosts
of biogas production, in cattle farming.
Ideal operating conditions for manure -based
small installations to 75 KW
Ideal operating conditions for manure -based
small installations to 75 KW, domestic conditions
are:
• Significantly more than 4.000 m³ manure (> 200
GV), a part as solid manure
• No manure pit
• Slurry attack at a central location
• Large manure storage (new / with leakage film)
present or needed anyway for animal
husbandry, which can be gas-tight covered
• In silage economy oriented (cattle farming)
• Low cost upgrade the silo possible
• Transformer already exists (PV)
• Still additional space available
• Proper Location
• Heat demand in the house and / or shed.
1.1. Work Economic Aspects
• Time required (only plant care without transport
work): ca. 600 h / year, that is, on average 1.5
hours/day
• Routine work (monitoring, documentation,
feeding): 30 - 60 min / day
• Remaining time for maintenance works (for
example, oil changes), repairs, organization and
management
• Technical skills should be present (repairs,
maintenance), and a willingness to learn new
things (biology, plant care) and a certain nerve
strength is not disadvantageous.
1.2. Heat utilization
• For pure manure plants, during the winter months
no excess of heat. At low dry matter levels even
possibly too little heat for the fermenter heating
- Good thermal insulation of the tank, if
necessary, heat exchanger
• With fermentable of solid biomass, the heat
balance improved
- Heating residential house and possibly
stables conceivable
Reasons for implementation
• Additional cash-flow of over 378.000 € per
project without taxation in 15 years possible
around 25.200 € per year)
• Emission reduction of methane from manure
storage
• Environmental treatment of manure waste
• Renewable energy sources, energy independency
• Conditioning of fertilizer, nutrients stay in
effluents
• Upscale and multiplication possible
• Positive visibility
Are smaller plants useful?
• This is highly dependent on the construction
costs biogas plants are relatively expensive in
Serbia, as a high technical standard and many
statutory. Requirements must be observed.
• If the additional benefits (manure improvement,
etc.) or the autonomous power supply operation
(electricity + heat) is in the foreground.
OPTIMAL OPERATING CONDITIONS FORMANURE BIOGASPLANTS IN SERBIA
Table5.Operating economics with cattle farming (EEG 2014, Remuneration: 23.53 ct / kWh )
30KW 50KW 75 KW
manure slurry manure slurry manure + silage manure slurry manure + silage
Investment cost € 270,000 € 400,000 € 480,000 € 450,000 €550,000
Current
production 240 000 kw 400 000 kw 600 000 kw
Revenue € 57 000 € 94 900 € 94 900 €142 000 € 142 400
Heat Proceeds € 2 500 € 2 500
cost without
Biomasse € 40 500 €59 500 € 70 200 € 68 900 € 81 800
Slurry (1 € / m³) € 4 400 € 7 200 € € 2 900 € 10 500 €4 150
total cost € 44 900 € 66 700 € 99 100 € 79 050 € 122 450
profit (excluding
labor costs) € 12 100 €28 200 € 1 700 € 63 350 € 22 450
biomass € 2600 € 36 500
profit rate 21. 2% 29,7% -0.2% 44.5 % 15.8%
working € 6 000 € 6 000 € 7 500 € 6 000 € 9 000
entrepreneurs
profit /loss kWh
€ 6 100
ct
€ 22 200
5.6 ct
€ 9 200
-2.3 ct
€ 57 350
9.6 ct
€ 13 450
2.2 ct
return on
investment 8.4 % 15.1 % 0.2 % 29.6 % 8.9%
Electricity production from renewable resources
in Serbia is still quite unfamiliar, except generated
electricity from hydro power. However, in the year
2013 the Statistical Office has started keeping track
of the electricity production from existing biogas
plants which is a step forward to a better oversight of
generated energy from renewables. There is no
official statistical document nor is report that can
validate how much electricity is actually produced
from all renewable energies. However, on the website
of the Ministry of Mining and Energy, there is a list
of all registered privileged electricity producers, as
well as the list of all submitted applications for
obtaining the status of privileged electricity produces
(http://mre.gov.rs/energetska-efikasnost-obnovljivi-
izvori.php). This list is updated every three months.
According to the Energy Law (2014), the records and
information of electricity and heat produced from the
renewable energy sources should be kept and up-dated
by the authorities on local level. Once a year, these
records should be submitted to the Ministry of Mining
and Energy.
Fig.3.Energetic use of biogas
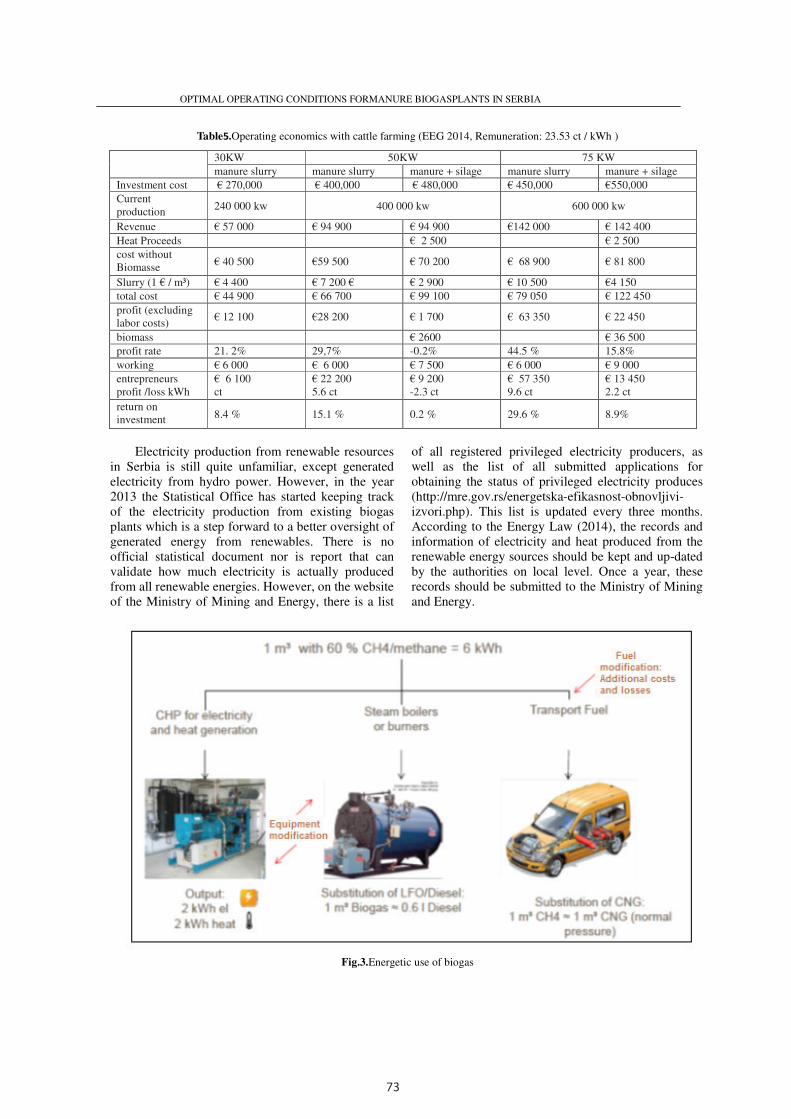
73
OPTIMAL OPERATING CONDITIONS FORMANURE BIOGASPLANTS IN SERBIA
3. Results and analyze
Table4.Project Proposal of 50 kWel Biogas plant in Serbia: Manure input– required quantity and quality
Biogas production of substrate
Substrate Fresh material DMS oDMS Production of CH4 Production of biogas
t/a m3/d % FM % DMS % m3/year l/kg oDMS m3/year
Liquid Pork Manure 31 928 87 2.0 % 75 % 60% 120 687 420.0 201 145
total 31 928 87 120 687 201 145
or
Biogas production of substrate
Substrate Fresh material DMS oDMS Production of CH4 Production of biogas
t/a m3/d % FM % DMS % m3/year l/kg oDMS m3/year
Liquid cattle manure 9445 26 7.0% 75% 55% 95 458.15 350.0 175 560
Solid cattle manure 730 2 18.0% 80% 60% 25 229 400.0 42 048
total 10.175 28 120 687 215 608
Pig farm of around 5.000 animal units or cattle
farm around 1.000 animal units can provide needed
amount for the proposed plant size analysis of
organic dry matter content and real quantity values
necessary for each individual farm and projectcosts
of biogas production, in cattle farming.
Ideal operating conditions for manure -based
small installations to 75 KW
Ideal operating conditions for manure -based
small installations to 75 KW, domestic conditions
are:
• Significantly more than 4.000 m³ manure (> 200
GV), a part as solid manure
• No manure pit
• Slurry attack at a central location
• Large manure storage (new / with leakage film)
present or needed anyway for animal
husbandry, which can be gas-tight covered
• In silage economy oriented (cattle farming)
• Low cost upgrade the silo possible
• Transformer already exists (PV)
• Still additional space available
• Proper Location
• Heat demand in the house and / or shed.
1.1. Work Economic Aspects
• Time required (only plant care without transport
work): ca. 600 h / year, that is, on average 1.5
hours/day
• Routine work (monitoring, documentation,
feeding): 30 - 60 min / day
• Remaining time for maintenance works (for
example, oil changes), repairs, organization and
management
• Technical skills should be present (repairs,
maintenance), and a willingness to learn new
things (biology, plant care) and a certain nerve
strength is not disadvantageous.
1.2. Heat utilization
• For pure manure plants, during the winter months
no excess of heat. At low dry matter levels even
possibly too little heat for the fermenter heating
- Good thermal insulation of the tank, if
necessary, heat exchanger
• With fermentable of solid biomass, the heat
balance improved
- Heating residential house and possibly
stables conceivable
Reasons for implementation
• Additional cash-flow of over 378.000 € per
project without taxation in 15 years possible
around 25.200 € per year)
• Emission reduction of methane from manure
storage
• Environmental treatment of manure waste
• Renewable energy sources, energy independency
• Conditioning of fertilizer, nutrients stay in
effluents
• Upscale and multiplication possible
• Positive visibility
Are smaller plants useful?
• This is highly dependent on the construction
costs biogas plants are relatively expensive in
Serbia, as a high technical standard and many
statutory. Requirements must be observed.
• If the additional benefits (manure improvement,
etc.) or the autonomous power supply operation
(electricity + heat) is in the foreground.
OPTIMAL OPERATING CONDITIONS FORMANURE BIOGASPLANTS IN SERBIA
Table5.Operating economics with cattle farming (EEG 2014, Remuneration: 23.53 ct / kWh )
30KW 50KW 75 KW
manure slurry manure slurry manure + silage manure slurry manure + silage
Investment cost € 270,000 € 400,000 € 480,000 € 450,000 €550,000
Current
production 240 000 kw 400 000 kw 600 000 kw
Revenue € 57 000 € 94 900 € 94 900 €142 000 € 142 400
Heat Proceeds € 2 500 € 2 500
cost without
Biomasse € 40 500 €59 500 € 70 200 € 68 900 € 81 800
Slurry (1 € / m³) € 4 400 € 7 200 € € 2 900 € 10 500 €4 150
total cost € 44 900 € 66 700 € 99 100 € 79 050 € 122 450
profit (excluding
labor costs) € 12 100 €28 200 € 1 700 € 63 350 € 22 450
biomass € 2600 € 36 500
profit rate 21. 2% 29,7% -0.2% 44.5 % 15.8%
working € 6 000 € 6 000 € 7 500 € 6 000 € 9 000
entrepreneurs
profit /loss kWh
€ 6 100
ct
€ 22 200
5.6 ct
€ 9 200
-2.3 ct
€ 57 350
9.6 ct
€ 13 450
2.2 ct
return on
investment 8.4 % 15.1 % 0.2 % 29.6 % 8.9%
Electricity production from renewable resources
in Serbia is still quite unfamiliar, except generated
electricity from hydro power. However, in the year
2013 the Statistical Office has started keeping track
of the electricity production from existing biogas
plants which is a step forward to a better oversight of
generated energy from renewables. There is no
official statistical document nor is report that can
validate how much electricity is actually produced
from all renewable energies. However, on the website
of the Ministry of Mining and Energy, there is a list
of all registered privileged electricity producers, as
well as the list of all submitted applications for
obtaining the status of privileged electricity produces
(http://mre.gov.rs/energetska-efikasnost-obnovljivi-
izvori.php). This list is updated every three months.
According to the Energy Law (2014), the records and
information of electricity and heat produced from the
renewable energy sources should be kept and up-dated
by the authorities on local level. Once a year, these
records should be submitted to the Ministry of Mining
and Energy.
Fig.3.Energetic use of biogas

74
OPTIMAL OPERATING CONDITIONS FORMANURE BIOGASPLANTS IN SERBIA
4. Conclusions
According to Directive 2009/28/EC, each
Member State shall ensure that its share of energy
from renewable sources in gross final energy
consumption in 2020 is at least its national overall
target for the share of renewable energy this year, as
specified in directive. In addition, each Member State
should ensure that the share of renewable energy in all
modes of transport in 2020 is at least 10% of final
energy consumption in transport in that Member State.
These mandatory national targets are consistent with
the overall goal on assumptions of 20% share of
energy from renewable sources in gross final energy
consumption in the Community in 2020, the fastest
growing sector of renewable energy sources is solar
energy. In 2007 the installed collector area has
increased almost to the level of 40% over the previous
year. The most effective and efficient because of the
attractiveness to investors in the long run, it may be
the energy production from wind and biogas.
References
[1] Glavonjić B., Vasiljević A., Petrović S., Pajović L.,
Sretenović P., Radović S. (2009), The economic
(macro-level) aspects of wood energy systems in
Serbia. University of Belgrade, Faculty of forestry.
[2] Köttner M., Kayser K.(2014), Assessment of the
framework conditions for biogas production in Serbia.
IBBK Fachgruppe Biogas GmbH.
[3] Ćosić B., Stanić Z., Duić N. (2011), Geographic
distribution of economic potential of agricultural and
forest biomass residual for energy use: Case study
Croatia.
[4] Dodic S., Zekic V., Rodic V., Tica N., Dodic J. (2010),
Situation and perspectives of waste biomass application
as energy source in Serbia. Renew. Sustain. Energy
Rev., 14, 3171–3177.
[5] Ericsson K., Nilsson L.J. (2006), Assessment of the
potential biomass supply in Europe using a resource-
focused approach. Biomass Bioenergy, 30, 1–15.
[6] Cvetković S., Kaluđerović-Radoičić T., Vukadinović B., Kijevčanin M. (2014),Potentials and status of
biogas as energy source in the Republic of Serbia,
Renewable and Sustainable Energy Reviews, 31, 407-
416.
[7] Wojtczak J. Bajda L. (2010), Biogas. ISBN-978-83-
911711-8-9.
[8] Kiedrowicz M., Palkova Z, Kovac P. (2013),
Renewable energy from biogas - status and prospects in
Poland relating to the european union, XIX TREND,
Pohorje, Slovenija, 18–21.02.
[9] Petrovic M., Petrovic P., Petrovic M. (2013), Biogas
production posibility of Agricultural and other organic
Wastebto secondary sustanable ecology and Tourism in
Rural and other Areas, Tractors and power machines,
18/3, 102–111.
[10] Cvetković S., Vukadinović B., Kijevčanin M.,
Radoičić-Kaludjerović T. (2013), Potentials and status
of biogas as energy source in the Republic of Serbia.
[11] Faasch R. J., Patenaude G. (2012), The economics of
short rotation coppice in Germany. Biomass Bioenergy
45, 27–40.
[12] Nyers J., Tomic S. (2013): Financial Optimum of
Thermal Insulating Layer for the Buildings of Bricket,
5rd International Symposium, EXPRES 2013.
Proceedings ISBN 978-86-85409-82-0, pp. 33-37,
Subotica, Serbia.
[13] Nyers J., Kajtar L., Tomic S., Nyers A. (2015):
Investment-savings method for energy-economic
optimization of external wall thermal insulation
thickness, International J. Energy and Buildings. Vol.
86, pp. 268–274, .
http://dx.doi.org/10.1016/j.enbuild.2014.10.023.
TEMPERATURE PARAMETERS CHANGING OF A SPACE HEATING ELEMENT AFTER HUMAN ACTION
1
Temperature parameters changing of a space heating element after human action
M. KURČOVÁ
Slovak University of Technology in Bratislava, Faculty of Civil Engineering, Department of Building Services
SK – 810 05 Bratislava, Radlinského 11, Slovakia
E-mail: [email protected]
Assignment of space heating element is to deliver an amount of heat, what cover actually energy losses in interior. Emplacement
of space heating element, with design on the ground of heat losses, not yet guarantee his accurate function. Immediate
performance of space heating elements many time is affect human behavior of user in connection with space heating elements.
Keywords:heating element, heating system
1. Introduction
Space heating elements are integral part of living
interiors. Look of space heating elements emerge from
conditions of building constructions and material basis of
heating elements, appropriate his capacity and
dimension. Esthetical appearances of heating element
nevertheless fall behind to appearance of interiors. Hence
of times effort of architects, to cover over space heating
elements. 2. Design of space heating element
Main assignment of space heating elements is
supply such amount of heat to the space obtain
thermal comfort.
Fig.1.Distribution of ideal air flow in a room
with a heating elements
From this main requirement is outgoing for
design of space heating elements. Heat capacity of
space heating element outgoing from projected
incoming heat power (heat losses) of space, on
grounds choices of temperature decrease of circulated
heating water. Ideally emplacement of space heating
element to the mostly cooled construction – up to
windows, equivalent of windows length, i.e.
minimally 80 % of windows length. Solution of
heating element design like this, results ideal air flow
in heated space (Fig. 1).
3.Factors affecting fhe performance of the heating element
Heating element's heat output is transmitted into
the room by radiation and convection while the
proportion of the radiant component of heat transfer
can be between 30 and 50% depending on the type of
the heater.
Performance of heating element located in the
heated space is influenced by several factors according
to:
f.NΦΦ = (W)
pnoxm f.f.f.f.f.ffθ∆
= (-)
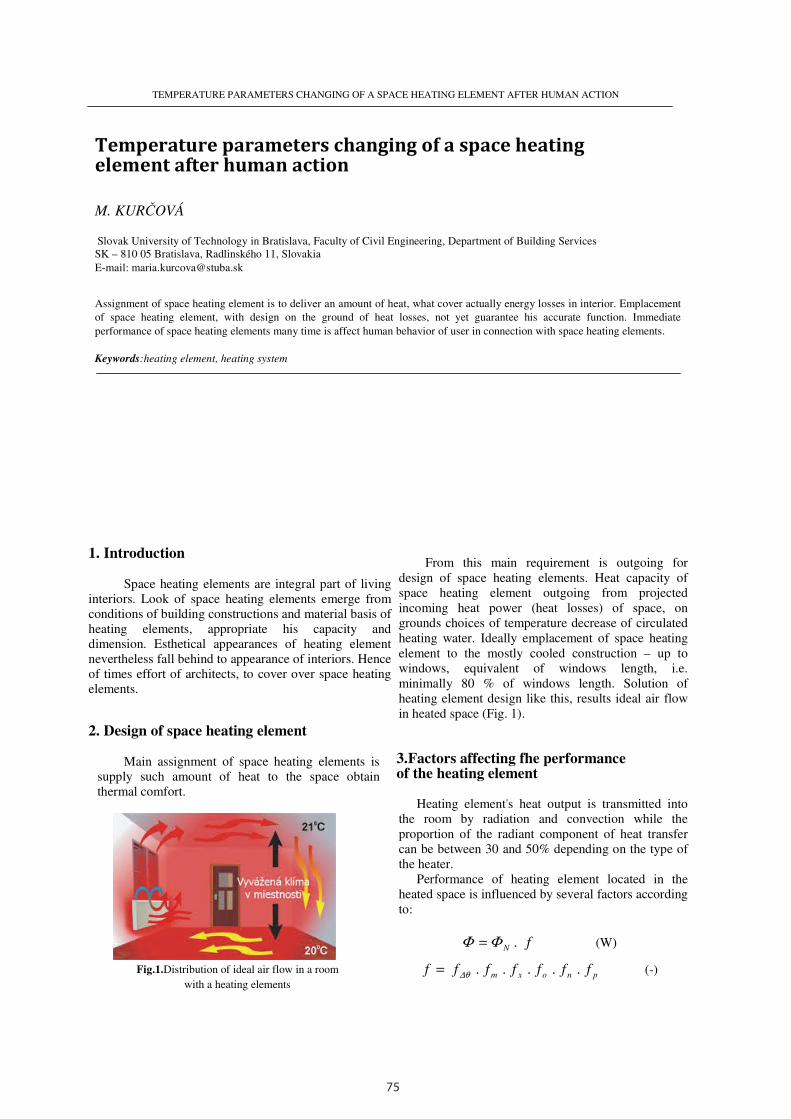
75
OPTIMAL OPERATING CONDITIONS FORMANURE BIOGASPLANTS IN SERBIA
4. Conclusions
According to Directive 2009/28/EC, each
Member State shall ensure that its share of energy
from renewable sources in gross final energy
consumption in 2020 is at least its national overall
target for the share of renewable energy this year, as
specified in directive. In addition, each Member State
should ensure that the share of renewable energy in all
modes of transport in 2020 is at least 10% of final
energy consumption in transport in that Member State.
These mandatory national targets are consistent with
the overall goal on assumptions of 20% share of
energy from renewable sources in gross final energy
consumption in the Community in 2020, the fastest
growing sector of renewable energy sources is solar
energy. In 2007 the installed collector area has
increased almost to the level of 40% over the previous
year. The most effective and efficient because of the
attractiveness to investors in the long run, it may be
the energy production from wind and biogas.
References
[1] Glavonjić B., Vasiljević A., Petrović S., Pajović L.,
Sretenović P., Radović S. (2009), The economic
(macro-level) aspects of wood energy systems in
Serbia. University of Belgrade, Faculty of forestry.
[2] Köttner M., Kayser K.(2014), Assessment of the
framework conditions for biogas production in Serbia.
IBBK Fachgruppe Biogas GmbH.
[3] Ćosić B., Stanić Z., Duić N. (2011), Geographic
distribution of economic potential of agricultural and
forest biomass residual for energy use: Case study
Croatia.
[4] Dodic S., Zekic V., Rodic V., Tica N., Dodic J. (2010),
Situation and perspectives of waste biomass application
as energy source in Serbia. Renew. Sustain. Energy
Rev., 14, 3171–3177.
[5] Ericsson K., Nilsson L.J. (2006), Assessment of the
potential biomass supply in Europe using a resource-
focused approach. Biomass Bioenergy, 30, 1–15.
[6] Cvetković S., Kaluđerović-Radoičić T., Vukadinović B., Kijevčanin M. (2014),Potentials and status of
biogas as energy source in the Republic of Serbia,
Renewable and Sustainable Energy Reviews, 31, 407-
416.
[7] Wojtczak J. Bajda L. (2010), Biogas. ISBN-978-83-
911711-8-9.
[8] Kiedrowicz M., Palkova Z, Kovac P. (2013),
Renewable energy from biogas - status and prospects in
Poland relating to the european union, XIX TREND,
Pohorje, Slovenija, 18–21.02.
[9] Petrovic M., Petrovic P., Petrovic M. (2013), Biogas
production posibility of Agricultural and other organic
Wastebto secondary sustanable ecology and Tourism in
Rural and other Areas, Tractors and power machines,
18/3, 102–111.
[10] Cvetković S., Vukadinović B., Kijevčanin M.,
Radoičić-Kaludjerović T. (2013), Potentials and status
of biogas as energy source in the Republic of Serbia.
[11] Faasch R. J., Patenaude G. (2012), The economics of
short rotation coppice in Germany. Biomass Bioenergy
45, 27–40.
[12] Nyers J., Tomic S. (2013): Financial Optimum of
Thermal Insulating Layer for the Buildings of Bricket,
5rd International Symposium, EXPRES 2013.
Proceedings ISBN 978-86-85409-82-0, pp. 33-37,
Subotica, Serbia.
[13] Nyers J., Kajtar L., Tomic S., Nyers A. (2015):
Investment-savings method for energy-economic
optimization of external wall thermal insulation
thickness, International J. Energy and Buildings. Vol.
86, pp. 268–274, .
http://dx.doi.org/10.1016/j.enbuild.2014.10.023.
TEMPERATURE PARAMETERS CHANGING OF A SPACE HEATING ELEMENT AFTER HUMAN ACTION
1
Temperature parameters changing of a space heating element after human action
M. KURČOVÁ
Slovak University of Technology in Bratislava, Faculty of Civil Engineering, Department of Building Services
SK – 810 05 Bratislava, Radlinského 11, Slovakia
E-mail: [email protected]
Assignment of space heating element is to deliver an amount of heat, what cover actually energy losses in interior. Emplacement
of space heating element, with design on the ground of heat losses, not yet guarantee his accurate function. Immediate
performance of space heating elements many time is affect human behavior of user in connection with space heating elements.
Keywords:heating element, heating system
1. Introduction
Space heating elements are integral part of living
interiors. Look of space heating elements emerge from
conditions of building constructions and material basis of
heating elements, appropriate his capacity and
dimension. Esthetical appearances of heating element
nevertheless fall behind to appearance of interiors. Hence
of times effort of architects, to cover over space heating
elements. 2. Design of space heating element
Main assignment of space heating elements is
supply such amount of heat to the space obtain
thermal comfort.
Fig.1.Distribution of ideal air flow in a room
with a heating elements
From this main requirement is outgoing for
design of space heating elements. Heat capacity of
space heating element outgoing from projected
incoming heat power (heat losses) of space, on
grounds choices of temperature decrease of circulated
heating water. Ideally emplacement of space heating
element to the mostly cooled construction – up to
windows, equivalent of windows length, i.e.
minimally 80 % of windows length. Solution of
heating element design like this, results ideal air flow
in heated space (Fig. 1).
3.Factors affecting fhe performance of the heating element
Heating element's heat output is transmitted into
the room by radiation and convection while the
proportion of the radiant component of heat transfer
can be between 30 and 50% depending on the type of
the heater.
Performance of heating element located in the
heated space is influenced by several factors according
to:
f.NΦΦ = (W)
pnoxm f.f.f.f.f.ffθ∆
= (-)
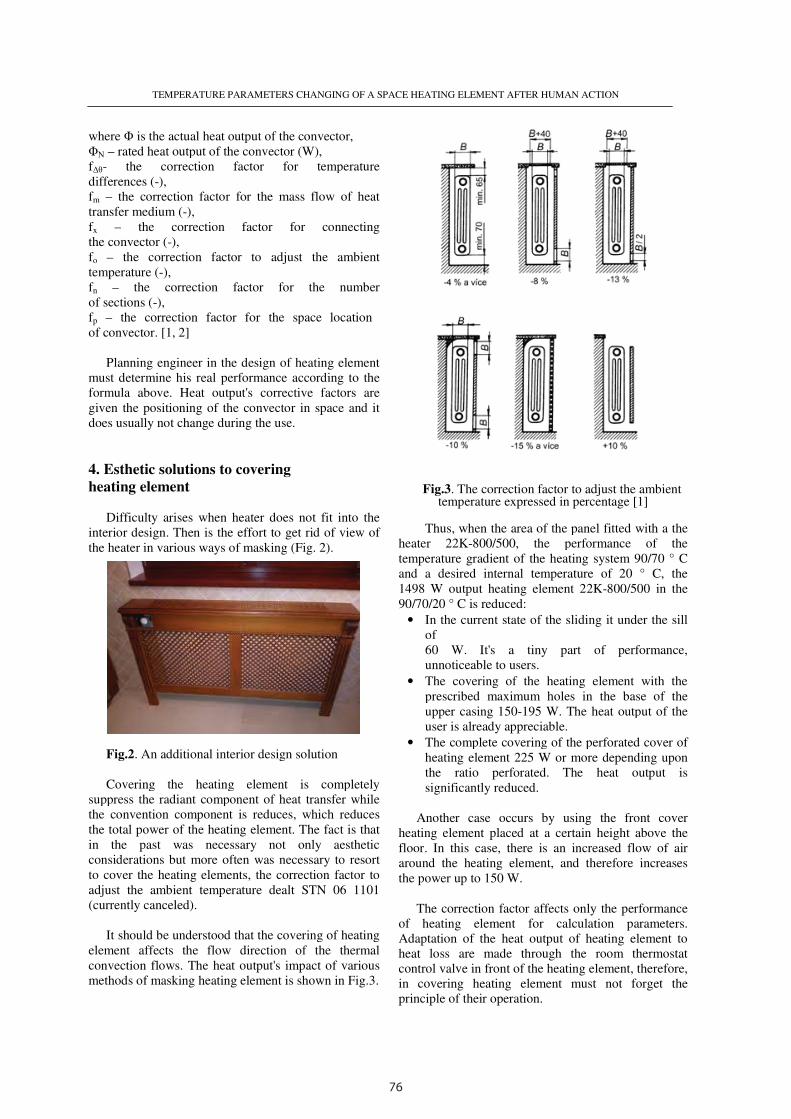
76
TEMPERATURE PARAMETERS CHANGING OF A SPACE HEATING ELEMENT AFTER HUMAN ACTION
where Φ is the actual heat output of the convector,
ΦN – rated heat output of the convector (W),
f∆θ- the correction factor for temperature
differences (-),
fm – the correction factor for the mass flow of heat
transfer medium (-),
fx – the correction factor for connecting
the convector (-),
fo – the correction factor to adjust the ambient
temperature (-),
fn – the correction factor for the number
of sections (-),
fp – the correction factor for the space location
of convector. [1, 2]
Planning engineer in the design of heating element
must determine his real performance according to the
formula above. Heat output's corrective factors are
given the positioning of the convector in space and it
does usually not change during the use.
4. Esthetic solutions to covering
heating element
Difficulty arises when heater does not fit into the
interior design. Then is the effort to get rid of view of
the heater in various ways of masking (Fig. 2).
Fig.2. An additional interior design solution
Covering the heating element is completely
suppress the radiant component of heat transfer while
the convention component is reduces, which reduces
the total power of the heating element. The fact is that
in the past was necessary not only aesthetic
considerations but more often was necessary to resort
to cover the heating elements, the correction factor to
adjust the ambient temperature dealt STN 06 1101
(currently canceled).
It should be understood that the covering of heating
element affects the flow direction of the thermal
convection flows. The heat output's impact of various
methods of masking heating element is shown in F
TEMPERATURE PARAMETERS CHANGING OF A SPACE HEATING ELEMENT AFTER HUMAN ACTION
is the actual heat output of the convector,
rated heat output of the convector (W),
the correction factor for temperature
the correction factor for the mass flow of heat
the correction factor for connecting
the correction factor to adjust the ambient
the correction factor for the number
the correction factor for the space location
Planning engineer in the design of heating element
must determine his real performance according to the
corrective factors are
given the positioning of the convector in space and it
Difficulty arises when heater does not fit into the
effort to get rid of view of
the heater in various ways of masking (Fig. 2).
. An additional interior design solution
Covering the heating element is completely
suppress the radiant component of heat transfer while
reduces, which reduces
the total power of the heating element. The fact is that
in the past was necessary not only aesthetic
considerations but more often was necessary to resort
to cover the heating elements, the correction factor to
mperature dealt STN 06 1101
It should be understood that the covering of heating
element affects the flow direction of the thermal
impact of various
methods of masking heating element is shown in Fig.3.
Fig.3. The correction factor to adjust the ambient temperature expressed in percentage [1]
Thus, when the area of the panel fitted with a the
heater 22K-800/500, the performance of the
temperature gradient of the heating system 90/70 ° C
and a desired internal temperature of 20 ° C, the
1498 W output heating element 22K
90/70/20 ° C is reduced:
• In the current state of the sliding it under the sill
of
60 W. It's a tiny part of performance,
unnoticeable to users.
• The covering of the heating element with the
prescribed maximum holes in the base of the
upper casing 150-195 W. The heat output of the
user is already appreciable.
• The complete covering of the perforated cover of
heating element 225 W or more depending upon
the ratio perforated. The heat output is
significantly reduced.
Another case occurs by using the front cover
heating element placed at a certain height above the
floor. In this case, there is an increased flow of air
around the heating element, and therefore increases
the power up to 150 W.
The correction factor affects only the performance
of heating element for calculation parameters.
Adaptation of the heat output of heating element to
heat loss are made through the room thermostat
control valve in front of the heating element, therefore,
in covering heating element must not forget the
principle of their operation.
TEMPERATURE PARAMETERS CHANGING OF A SPACE HEATING ELEMENT AFTER HUMAN ACTION
2
. The correction factor to adjust the ambient temperature expressed in percentage [1]
Thus, when the area of the panel fitted with a the
800/500, the performance of the
temperature gradient of the heating system 90/70 ° C
desired internal temperature of 20 ° C, the
1498 W output heating element 22K-800/500 in the
In the current state of the sliding it under the sill
60 W. It's a tiny part of performance,
the heating element with the
prescribed maximum holes in the base of the
195 W. The heat output of the
The complete covering of the perforated cover of
heating element 225 W or more depending upon
forated. The heat output is
Another case occurs by using the front cover
heating element placed at a certain height above the
floor. In this case, there is an increased flow of air
around the heating element, and therefore increases
The correction factor affects only the performance
of heating element for calculation parameters.
Adaptation of the heat output of heating element to
heat loss are made through the room thermostat
ing element, therefore,
in covering heating element must not forget the
TEMPERATURE PARAMETERS CHANGING OF A SPACE HEATING ELEMENT AFTER HUMAN ACTION
3
5. Human intervention and temperature
parameters of heating element
Monitoring human impacts on heating element
temperature parameters was carried out on the heating
element placed in a residential building. The heater is
on supply pipe valve with thermostat. The heater is
part of a two-pipe hydronic heating system of
residential building. The heating system is
hydraulically balanced.
Fig.4. Measurement of physical parameters
For monitoring temperature changes in radiator human
intervention was measured:
• Outside air temperature,
• Indoor air temperature in the middle of the room,
• Indoor air temperature 15 cm in front of the heater,
• the supply pipe temperature,
• the return pipe temperature.
As part of the measurements was studied human impact
on physical parameters:
a) in affecting the temperature performance of heating
element by turning the thermostat,
b) the covering of heating element by cover.
In the first stage is shown progress of temperatures at
the measurement starting position. The heater is freely
accessible to the thermostat to position 4. The difference
between inlet and return temperature of the heating
water temperature is 7 K. Indoor air measured in the
middle of the room and close to heating element is
about the same. The second phase of measurement is a
reduction of the mass flow of heating water to the
heating element by adjusting the thermostat from
position 4 to the position 2
Fig.5.Temperature of the heating element
This occurs slow temperature drop inlet and return
heating water. The temperature in the room and in
front of the heater remains due to the accumulation
of heat in the room at the same value. The third
phase is a measurement of a sudden increase in the
mass flow of heating water to the heating element.
After turning the thermostat to its original setting 4
occurring temperature increase inlet and return
water. At the same time inside air temperature
gentle rise near the heating element, while the air
temperature in the middle of the room does not
change. Gradual change of temperature on the
heater can be seen in images from the thermal
imaging camera
Fig. 6.
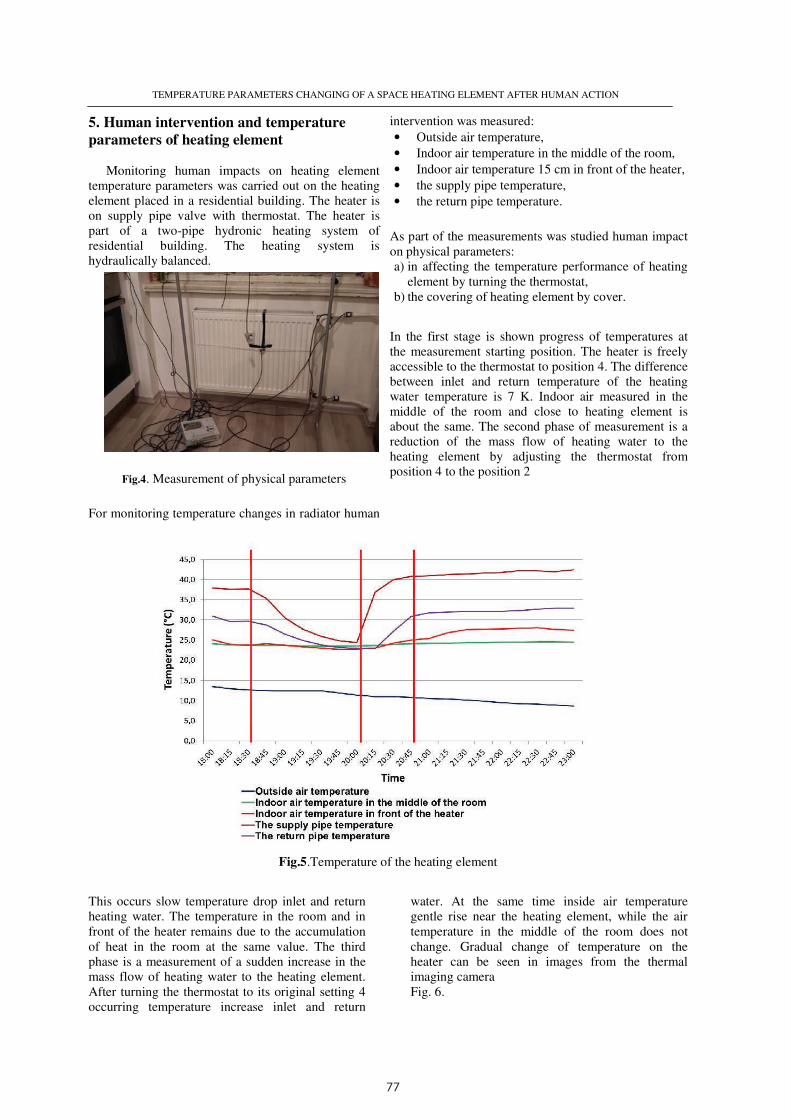
77
TEMPERATURE PARAMETERS CHANGING OF A SPACE HEATING ELEMENT AFTER HUMAN ACTION
where Φ is the actual heat output of the convector,
ΦN – rated heat output of the convector (W),
f∆θ- the correction factor for temperature
differences (-),
fm – the correction factor for the mass flow of heat
transfer medium (-),
fx – the correction factor for connecting
the convector (-),
fo – the correction factor to adjust the ambient
temperature (-),
fn – the correction factor for the number
of sections (-),
fp – the correction factor for the space location
of convector. [1, 2]
Planning engineer in the design of heating element
must determine his real performance according to the
formula above. Heat output's corrective factors are
given the positioning of the convector in space and it
does usually not change during the use.
4. Esthetic solutions to covering
heating element
Difficulty arises when heater does not fit into the
interior design. Then is the effort to get rid of view of
the heater in various ways of masking (Fig. 2).
Fig.2. An additional interior design solution
Covering the heating element is completely
suppress the radiant component of heat transfer while
the convention component is reduces, which reduces
the total power of the heating element. The fact is that
in the past was necessary not only aesthetic
considerations but more often was necessary to resort
to cover the heating elements, the correction factor to
adjust the ambient temperature dealt STN 06 1101
(currently canceled).
It should be understood that the covering of heating
element affects the flow direction of the thermal
convection flows. The heat output's impact of various
methods of masking heating element is shown in F
TEMPERATURE PARAMETERS CHANGING OF A SPACE HEATING ELEMENT AFTER HUMAN ACTION
is the actual heat output of the convector,
rated heat output of the convector (W),
the correction factor for temperature
the correction factor for the mass flow of heat
the correction factor for connecting
the correction factor to adjust the ambient
the correction factor for the number
the correction factor for the space location
Planning engineer in the design of heating element
must determine his real performance according to the
corrective factors are
given the positioning of the convector in space and it
Difficulty arises when heater does not fit into the
effort to get rid of view of
the heater in various ways of masking (Fig. 2).
. An additional interior design solution
Covering the heating element is completely
suppress the radiant component of heat transfer while
reduces, which reduces
the total power of the heating element. The fact is that
in the past was necessary not only aesthetic
considerations but more often was necessary to resort
to cover the heating elements, the correction factor to
mperature dealt STN 06 1101
It should be understood that the covering of heating
element affects the flow direction of the thermal
impact of various
methods of masking heating element is shown in Fig.3.
Fig.3. The correction factor to adjust the ambient temperature expressed in percentage [1]
Thus, when the area of the panel fitted with a the
heater 22K-800/500, the performance of the
temperature gradient of the heating system 90/70 ° C
and a desired internal temperature of 20 ° C, the
1498 W output heating element 22K
90/70/20 ° C is reduced:
• In the current state of the sliding it under the sill
of
60 W. It's a tiny part of performance,
unnoticeable to users.
• The covering of the heating element with the
prescribed maximum holes in the base of the
upper casing 150-195 W. The heat output of the
user is already appreciable.
• The complete covering of the perforated cover of
heating element 225 W or more depending upon
the ratio perforated. The heat output is
significantly reduced.
Another case occurs by using the front cover
heating element placed at a certain height above the
floor. In this case, there is an increased flow of air
around the heating element, and therefore increases
the power up to 150 W.
The correction factor affects only the performance
of heating element for calculation parameters.
Adaptation of the heat output of heating element to
heat loss are made through the room thermostat
control valve in front of the heating element, therefore,
in covering heating element must not forget the
principle of their operation.
TEMPERATURE PARAMETERS CHANGING OF A SPACE HEATING ELEMENT AFTER HUMAN ACTION
2
. The correction factor to adjust the ambient temperature expressed in percentage [1]
Thus, when the area of the panel fitted with a the
800/500, the performance of the
temperature gradient of the heating system 90/70 ° C
desired internal temperature of 20 ° C, the
1498 W output heating element 22K-800/500 in the
In the current state of the sliding it under the sill
60 W. It's a tiny part of performance,
the heating element with the
prescribed maximum holes in the base of the
195 W. The heat output of the
The complete covering of the perforated cover of
heating element 225 W or more depending upon
forated. The heat output is
Another case occurs by using the front cover
heating element placed at a certain height above the
floor. In this case, there is an increased flow of air
around the heating element, and therefore increases
The correction factor affects only the performance
of heating element for calculation parameters.
Adaptation of the heat output of heating element to
heat loss are made through the room thermostat
ing element, therefore,
in covering heating element must not forget the
TEMPERATURE PARAMETERS CHANGING OF A SPACE HEATING ELEMENT AFTER HUMAN ACTION
3
5. Human intervention and temperature
parameters of heating element
Monitoring human impacts on heating element
temperature parameters was carried out on the heating
element placed in a residential building. The heater is
on supply pipe valve with thermostat. The heater is
part of a two-pipe hydronic heating system of
residential building. The heating system is
hydraulically balanced.
Fig.4. Measurement of physical parameters
For monitoring temperature changes in radiator human
intervention was measured:
• Outside air temperature,
• Indoor air temperature in the middle of the room,
• Indoor air temperature 15 cm in front of the heater,
• the supply pipe temperature,
• the return pipe temperature.
As part of the measurements was studied human impact
on physical parameters:
a) in affecting the temperature performance of heating
element by turning the thermostat,
b) the covering of heating element by cover.
In the first stage is shown progress of temperatures at
the measurement starting position. The heater is freely
accessible to the thermostat to position 4. The difference
between inlet and return temperature of the heating
water temperature is 7 K. Indoor air measured in the
middle of the room and close to heating element is
about the same. The second phase of measurement is a
reduction of the mass flow of heating water to the
heating element by adjusting the thermostat from
position 4 to the position 2
Fig.5.Temperature of the heating element
This occurs slow temperature drop inlet and return
heating water. The temperature in the room and in
front of the heater remains due to the accumulation
of heat in the room at the same value. The third
phase is a measurement of a sudden increase in the
mass flow of heating water to the heating element.
After turning the thermostat to its original setting 4
occurring temperature increase inlet and return
water. At the same time inside air temperature
gentle rise near the heating element, while the air
temperature in the middle of the room does not
change. Gradual change of temperature on the
heater can be seen in images from the thermal
imaging camera
Fig. 6.

78
TEMPERATURE PARAMETERS CHANGING OF A SPACE HEATING ELEMENT AFTER HUMAN ACTION
Fig.6. Images of a
The fourth phase of measurements show a change
of temperature in cover heating element. The
temperature of the air in the middle of the room
does not change the temperature of air near the
heating element will rise to about 3 K.
6. Conclusion
Heating element is the part of the heating system,
which gets into direct contact with users of heated
space. That's why the user thinks is his property
and he can do with it what he wants. The most
common problem of heating element is
appearance, which the user cannot control.
Therefore makes additional aesthetic solutions
covering different types of heating element covers
and do not realize that this will impoverish
himself of some of the heat that heat element can
provide.
References
[1] J. Bašta, Otopnéplochy, část 1 až 4 ( www.tzb
[2] D. Petráš, a kol.:Vykurovanie rodinných a bytovýchdomov, Jaga, Bratislava, 2005, ISBN 80-8076
[3] J. Cihelka, Vytápění, větrání a klimatizace, SNTL, Praha, 1985, ISBN 04-201-85.
TEMPERATURE PARAMETERS CHANGING OF A SPACE HEATING ELEMENT AFTER HUMAN ACTION
. Images of a thermal imaging camera
The fourth phase of measurements show a change
of temperature in cover heating element. The
mperature of the air in the middle of the room
does not change the temperature of air near the
Heating element is the part of the heating system,
which gets into direct contact with users of heated
s why the user thinks is his property
and he can do with it what he wants. The most
common problem of heating element is
appearance, which the user cannot control.
Therefore makes additional aesthetic solutions
ng element covers
and do not realize that this will impoverish
himself of some of the heat that heat element can
www.tzb-info.cz)
bytových 8076-012-8. J.
klimatizace, SNTL,
[4] STN 06 1101 Vykurovacie telesána vykurovanie, 1992.
[5] Kalmár, F. (2016), Interrelation betwesummer operative temperature in buildings, International Review of Applied Sciences and Engineering, 7 (2016) 1, pp. 51–60, DOI: 10.1556/1848.2016.7.1.7
[6] Kalmár, F., Csomós, Gy., Lakatos, Á. (2013),renewable energy (energy policy) —International Review of Applied Sciences and Engineering, 4 (1), 95-95 (2013)
[7] Kajtár, L., Kassai, M., Bánhidi, L. (2011), Computerized simulation of the energy consumption of air handling units. 2011, Energy and Buildings, ISSN 0378-7788, (45) pp. 54-59.
[8] Kassai, M., Ge, G., Simonson, C. J. Dehumidification performance investigation of to-air membrane energy exchanger system, Thermal Science, DOI: 10.2298/TSCI140816129K (2015).
[9] Nyers, J., Garbai, L., Nyers, A. (2015),mathematical model of heat pump's condenser for analytical optimization, International J. Energy, Vol. pp. 706-714, 1 February 2015.
DOI:10.1016/j.energy.2014.12.028
[10] Nyers, J., Nyers, A. (2013), Hydraulic Analysis of Heat Pump's Heating Circuit using Mathematical Model, 9ICCC International Conferenc, ProceedingsISBN 978-1-4799-0061-9, pp. 349Hungary, 2013
[11] Nyers, J., Nyers, A.(2011), COP of heatingsystem with heat pump, EXPRES 2011, 3rd IEEE International Symposium on Exploitation of Renewable Energy Sources, Subotica, Serbia; 2011, Proceedings, pp. 17-21, Article number 5741809
TEMPERATURE PARAMETERS CHANGING OF A SPACE HEATING ELEMENT AFTER HUMAN ACTION
4
ústredné
nterrelation between glazing and summer operative temperature in buildings, International Review of Applied Sciences and
60, DOI:
Kalmár, F., Csomós, Gy., Lakatos, Á. (2013), Focus on — Editorial,
International Review of Applied Sciences and
sai, M., Bánhidi, L. (2011), Computerized simulation of the energy consumption of air handling units. 2011, Energy and Buildings, ISSN
Kassai, M., Ge, G., Simonson, C. J. (2015), Dehumidification performance investigation of liquid-
air membrane energy exchanger system, Thermal Science, DOI: 10.2298/TSCI140816129K (2015).
Nyers, A. (2015), A modified mathematical model of heat pump's condenser for analytical optimization, International J. Energy, Vol. 80,
Hydraulic Analysis of Heat Pump's Heating Circuit using Mathematical Model, 9th ICCC International Conferenc, Proceedings-USB,
9, pp. 349-353, Tihany,
COP of heating-cooling EXPRES 2011, 3rd IEEE
International Symposium on Exploitation of Renewable Energy Sources, Subotica, Serbia; 2011, Proceedings,
ISBN
EXPRES 2017
ISBN 978-86-919769-1-0
Modern cost accounting techniques for renewable energy and sustainable development
Đ. PETKOVIČ a, I. MEDVED b
University of Novi Sad, Faculty of Economics,
Subotica, Segedinski put 9-11, Serbia aE-mail:[email protected] bE-mail:[email protected]
Costing and modern cost accounting techniques are important for cost measurement of sustainable development. The aim of this
paper is to analyze the possible advantages and limitations of modern costing tools for renewable energy technologies and
sustainable development. This paper points out that the calculation of the costs in sustainable development in modern business
conditions necessarily requires the use of modern costing systems in purpose to provide a suitable basis for making business
decisions, better measurement of profitability, improving operations in terms of cost savings and ensuring information for
keeping or gaining a competitive advantage. The issue of costs is central to the question of how renewable energy technologies
will development and spread as energy sources instead of fossil fuels.
Keywords:cost accounting,sustainable development,renewable energy technologies,modern costing systems
1. Introduction
Limited natural resources and a wish to fulfill the
most favorable financial effects of the business, it
indicates the need for planning, organization and
implementation of activities of business entities
through preservation of the environment and
enhancing the quality of life of people, seen through
the interests of the present generation, but also for
the benefit of future generations. Sustainable
development is focused on long-term stable
production of quality products and services while
preserving and protecting the environment, energy
and natural resources but with the provision earning
capacity of the organization and for the welfare of
individuals and the wider community.
The last decades of the twentieth and beginning
of XXI century brought many changes in the
business management and environment management
because of increase of consumption, world
population, industrial activity, etc. The attitude
towards customers and suppliers is also changed, as
same as mode of production and people’s sense for
environmental problems and sustainable
development.
Environmental problems such as harmful
pollution of water, air and soil, waste disposal,
climate change, Stratospheric ozone depletion and
other environmental degradation are current issues
for theoretical and practical study of various
disciplines. Some potential solutions to the current
environmental problems associated with the harmful
pollutant emissions have evolved, including: [2]
− renewable energy technologies;
− energy conservation (efficient energy utilization);
− cogeneration and district heating;
− energy storage technologies;
− alternative energy dimensions for transport;
− energy source switching from fossil fuels to
environmentally benign energy forms;
− coal cleaning technologies;
− optimum monitoring and evaluation of energy
indicators;
− policy integration;
− recycling;
− process change and sectoral shiftment;
− acceleration of forestation;
− carbon or fuel taxes;
− materials substitution;
− promoting public transport;
− changing life styles;
− increasing public awareness;
− education and training.
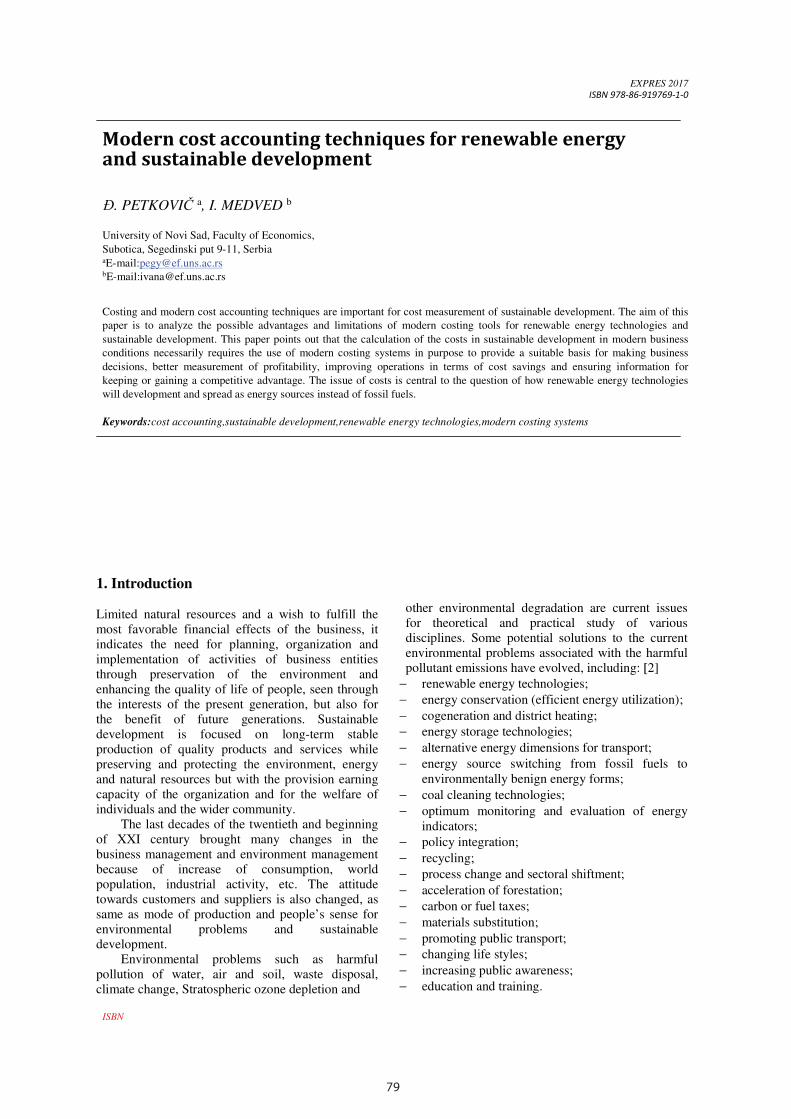
79
TEMPERATURE PARAMETERS CHANGING OF A SPACE HEATING ELEMENT AFTER HUMAN ACTION
Fig.6. Images of a
The fourth phase of measurements show a change
of temperature in cover heating element. The
temperature of the air in the middle of the room
does not change the temperature of air near the
heating element will rise to about 3 K.
6. Conclusion
Heating element is the part of the heating system,
which gets into direct contact with users of heated
space. That's why the user thinks is his property
and he can do with it what he wants. The most
common problem of heating element is
appearance, which the user cannot control.
Therefore makes additional aesthetic solutions
covering different types of heating element covers
and do not realize that this will impoverish
himself of some of the heat that heat element can
provide.
References
[1] J. Bašta, Otopnéplochy, část 1 až 4 ( www.tzb
[2] D. Petráš, a kol.:Vykurovanie rodinných a bytovýchdomov, Jaga, Bratislava, 2005, ISBN 80-8076
[3] J. Cihelka, Vytápění, větrání a klimatizace, SNTL, Praha, 1985, ISBN 04-201-85.
TEMPERATURE PARAMETERS CHANGING OF A SPACE HEATING ELEMENT AFTER HUMAN ACTION
. Images of a thermal imaging camera
The fourth phase of measurements show a change
of temperature in cover heating element. The
mperature of the air in the middle of the room
does not change the temperature of air near the
Heating element is the part of the heating system,
which gets into direct contact with users of heated
s why the user thinks is his property
and he can do with it what he wants. The most
common problem of heating element is
appearance, which the user cannot control.
Therefore makes additional aesthetic solutions
ng element covers
and do not realize that this will impoverish
himself of some of the heat that heat element can
www.tzb-info.cz)
bytových 8076-012-8. J.
klimatizace, SNTL,
[4] STN 06 1101 Vykurovacie telesána vykurovanie, 1992.
[5] Kalmár, F. (2016), Interrelation betwesummer operative temperature in buildings, International Review of Applied Sciences and Engineering, 7 (2016) 1, pp. 51–60, DOI: 10.1556/1848.2016.7.1.7
[6] Kalmár, F., Csomós, Gy., Lakatos, Á. (2013),renewable energy (energy policy) —International Review of Applied Sciences and Engineering, 4 (1), 95-95 (2013)
[7] Kajtár, L., Kassai, M., Bánhidi, L. (2011), Computerized simulation of the energy consumption of air handling units. 2011, Energy and Buildings, ISSN 0378-7788, (45) pp. 54-59.
[8] Kassai, M., Ge, G., Simonson, C. J. Dehumidification performance investigation of to-air membrane energy exchanger system, Thermal Science, DOI: 10.2298/TSCI140816129K (2015).
[9] Nyers, J., Garbai, L., Nyers, A. (2015),mathematical model of heat pump's condenser for analytical optimization, International J. Energy, Vol. pp. 706-714, 1 February 2015.
DOI:10.1016/j.energy.2014.12.028
[10] Nyers, J., Nyers, A. (2013), Hydraulic Analysis of Heat Pump's Heating Circuit using Mathematical Model, 9ICCC International Conferenc, ProceedingsISBN 978-1-4799-0061-9, pp. 349Hungary, 2013
[11] Nyers, J., Nyers, A.(2011), COP of heatingsystem with heat pump, EXPRES 2011, 3rd IEEE International Symposium on Exploitation of Renewable Energy Sources, Subotica, Serbia; 2011, Proceedings, pp. 17-21, Article number 5741809
TEMPERATURE PARAMETERS CHANGING OF A SPACE HEATING ELEMENT AFTER HUMAN ACTION
4
ústredné
nterrelation between glazing and summer operative temperature in buildings, International Review of Applied Sciences and
60, DOI:
Kalmár, F., Csomós, Gy., Lakatos, Á. (2013), Focus on — Editorial,
International Review of Applied Sciences and
sai, M., Bánhidi, L. (2011), Computerized simulation of the energy consumption of air handling units. 2011, Energy and Buildings, ISSN
Kassai, M., Ge, G., Simonson, C. J. (2015), Dehumidification performance investigation of liquid-
air membrane energy exchanger system, Thermal Science, DOI: 10.2298/TSCI140816129K (2015).
Nyers, A. (2015), A modified mathematical model of heat pump's condenser for analytical optimization, International J. Energy, Vol. 80,
Hydraulic Analysis of Heat Pump's Heating Circuit using Mathematical Model, 9th ICCC International Conferenc, Proceedings-USB,
9, pp. 349-353, Tihany,
COP of heating-cooling EXPRES 2011, 3rd IEEE
International Symposium on Exploitation of Renewable Energy Sources, Subotica, Serbia; 2011, Proceedings,
ISBN
EXPRES 2017
ISBN 978-86-919769-1-0
Modern cost accounting techniques for renewable energy and sustainable development
Đ. PETKOVIČ a, I. MEDVED b
University of Novi Sad, Faculty of Economics,
Subotica, Segedinski put 9-11, Serbia aE-mail:[email protected] bE-mail:[email protected]
Costing and modern cost accounting techniques are important for cost measurement of sustainable development. The aim of this
paper is to analyze the possible advantages and limitations of modern costing tools for renewable energy technologies and
sustainable development. This paper points out that the calculation of the costs in sustainable development in modern business
conditions necessarily requires the use of modern costing systems in purpose to provide a suitable basis for making business
decisions, better measurement of profitability, improving operations in terms of cost savings and ensuring information for
keeping or gaining a competitive advantage. The issue of costs is central to the question of how renewable energy technologies
will development and spread as energy sources instead of fossil fuels.
Keywords:cost accounting,sustainable development,renewable energy technologies,modern costing systems
1. Introduction
Limited natural resources and a wish to fulfill the
most favorable financial effects of the business, it
indicates the need for planning, organization and
implementation of activities of business entities
through preservation of the environment and
enhancing the quality of life of people, seen through
the interests of the present generation, but also for
the benefit of future generations. Sustainable
development is focused on long-term stable
production of quality products and services while
preserving and protecting the environment, energy
and natural resources but with the provision earning
capacity of the organization and for the welfare of
individuals and the wider community.
The last decades of the twentieth and beginning
of XXI century brought many changes in the
business management and environment management
because of increase of consumption, world
population, industrial activity, etc. The attitude
towards customers and suppliers is also changed, as
same as mode of production and people’s sense for
environmental problems and sustainable
development.
Environmental problems such as harmful
pollution of water, air and soil, waste disposal,
climate change, Stratospheric ozone depletion and
other environmental degradation are current issues
for theoretical and practical study of various
disciplines. Some potential solutions to the current
environmental problems associated with the harmful
pollutant emissions have evolved, including: [2]
− renewable energy technologies;
− energy conservation (efficient energy utilization);
− cogeneration and district heating;
− energy storage technologies;
− alternative energy dimensions for transport;
− energy source switching from fossil fuels to
environmentally benign energy forms;
− coal cleaning technologies;
− optimum monitoring and evaluation of energy
indicators;
− policy integration;
− recycling;
− process change and sectoral shiftment;
− acceleration of forestation;
− carbon or fuel taxes;
− materials substitution;
− promoting public transport;
− changing life styles;
− increasing public awareness;
− education and training.
80
ISBN
The renewable energy technologies are potential
very important solution for environmental problems.
A secure supply of energy resources is generally
agreed to be a necessary but not sufficient requirement
for development within a society. Furthermore,
sustainable development within a society demands a
sustainable supply of energy resources (that, in the
long term, is readily and sustainably available at
reasonable cost and can be utilized for all required
tasks without causing negative societal impacts) and
an effective and efficient utilization of energy
resources. In this regard, the connection between
renewable energy sources and sustainable
development comes out [2].
Renewable energy technologies produce marketable
energy by converting natural phenomena into useful
energy forms. These technologies use the energy
inherent in sunlight and its direct and indirect impacts
on the Earth
(photons, wind, falling water, heating effects, and
plant growth), gravitational forces (the tides), and the
heat of the Earth's core (geothermal) as the resources
from which they produce energy.[5]
Measuring sustainable development performance
and quantifying the benefits of sustainability progress
is more qualitative (non-monetary) then quantitative
(monetary) aspects. But, at different levels of
organizational systems (businesses, local government,
state, etc.) most important the question is - whether the
investment in green technologies is cost or
investment? – in context that good investment, in
future, will bring higher benefits than costs.
Investors and government representatives are
interested in:
a) amount of costs of pollution (environmental
damage) or amount of costs of reducing environmental
pollution;
b) amount of costs of prevention and protection of
environment; and
c) amount of eventual benefits of the (non) use
different ways to reduce pollution
which requires the provision of adequate data and
information [7].
Innovation in the sustainable management and
requirements in measuring costs of renewable energy
sources (RES) and sustainable development are
reflected in the Accounting Information System
(AIS) and Environmental Management Accounting
(EMA). Use of Cost Accounting techniques provide
decision making, budgeting, research and
development and control of some aspects of
renewable energy sources and sustainable
development.
2. Importance of modern costing techniques
Chronologically speaking, the industrial revolution at
the end of the eighteenth and at the beginning of early
nineteenth century, with the large scale of
production, gives impetus to the development of
cost accounting. The period from the late nineteenth
century until the outbreak of World War II could be
called the period of establishing the principles,
methods and procedures of processing costs.
Traditional costing systems include Standard
Costing and Absorption Costing among other. New,
modern (contemporary) cost accounting systems are
developed from the middle of the last century. Cost
accounting systems, traditional or contemporary,
are, in the main, concepts of cost allocation by the
effects of the revenue generating organization.
Contemporary (modern) costing systems and
techniques attempts, compared to traditional
(classical) cost accounting systems, to enable
adequate deployment of costs, especially overhead
costs to cost centers.
We believe that the following main reasons
contributed to the necessity of creation,
development and application of modern techniques
of cost accounting:
a) increase of overhead costs in total costs - the
most important changes in the cost of operations
reflected in the increase in overhead costs and a
reduction of direct costs in relation to total costs;
b) change of types and structure of the organization
business management;
c) the international market (the emergence of
international corporations contributes to increasing
the complexity of calculating the cost, the growing
importance of transfer pricing and other);
d) the search for new ways to achieve sustainable
competitiveness (cost accounting should provide
information about products, but also on markets,
customers and competition); and
e) the creation and development of strategic cost
management and strategic management accounting
(business is unthinkable without the cost
management and focuses on the measurement of
financial and non-financial performance measures
of results achieved).
Costing (cost accounting), together with
management accounting, which is an integral part,
is trying to respond to the challenges of measuring
sustainable development performance through the
creation of new cost accounting techniques,
methods and concepts to be more informative.
Among them, we emphasize the following modern
cost accounting techniques: Activity based costing
(ABC) and modification of that system as Time-
Driven Activity based costing (TDABC); Flexible
cost planning - Marginal costing
(Grenzplankostenrechnung - GPK); Target
costing; Life- cycle costing; Value chain; Kaizen
costing; Cost of quality reporting, The Balanced
Scorecard, Benchmarking, strategic mapping, etc.
A brief overview of the importance of modern
costing systems is presented in Table 1.
3
Table 1. A brief overview of the importance of modern costing systems
The aim of this paper is to analyze the possible
advantages of different modern systems for
measuring costs of some aspects of renewable energy
sources and sustainable development. In order to
achieve the object and purpose of research, tested the
hypothesis that the calculation of the costs and results
of renewable energy technologies and sustainable
production in modern business conditions necessarily
requires the use of modern costing techniques in the
function of providing a suitable basis for making
business decisions, better measurement of
performance, improving business in terms of cost
savings, providing information to maintain or gain a
competitive advantage and more.
3. Advantages and limitations of costing
tools in sustainable development
measurement and limitations of costing
tools in sustainable development
measurement
Possibilities of modern costing systems and techniques for information basis and performance measurement in sustainable production are:
a) the provision of accurate, timely and adequate information about costs - business decisions that are essential for sustainable production, above all, from the internal sphere of operations and necessary information on different cost structure which depends on the business decision nature,
b) modified techniques, concepts of modern costing systems and objectives of management accounting reports provide quality information support strategic
and operational business decisions in sustainable agricultural production;
c) changes in the level of costs and their behavior, changes in production volume and changes in production processes, changing the amount and structure of the cost of the product, which is particularly reflected in the increasing participation of overhead costs in total costs. Therefore, it is important that modern cost accounting systems generally do not use the same basis for allocation of costs as the traditional cost accounting systems;
d) the method of including general expenses unproductive functional areas eg. research and development costs, marketing and other (having increasing share of the total costs), may, with the appropriate methodological procedures using modern costing systems assign to renewable energy technologies or other sustainable development project in order to provide a suitable basis for making business decisions, better measurement of profitability, improvement of the business in terms of cost savings, providing information to maintain or gain a competitive advantage and more;
e) individual manufacturing costs may be excluded from the total cost of the sustainable development project - according to the modern systems costing, costs are allocated to project only if the product resulting from business decisions about the projects (activities, processes) caused costs.
Accountants are increasingly required to struggle with
issues of measuring sustainability performance. But
sustainable development as an interdisciplinary field of
examination and research incorporates insights from a
many academic disciplinesincluding the natural,
engineering and social sciences.[3]
As a result a number of different sustainability
assessment toolsthat have been developed to measure
Modern Costing Systems Concept basis
Activity-Based Costing – ABC Determining the cost driver of activity
Time-Driven Activity-Based
Costing – TDABC
Direct measurement of unused capacity
Marginal costing - GPK –
Grenzplankostenrechnung
Short-term orientation to variable costs, focus on cost
centers
Target Costing Manage cost reduction in the function of achieving
competitive advantages
Life-Cycle Costing – LCC Measurement of diferent investment alternatives
Value Chain The strategic orientation in order to achieve sustainable
competitive advantage
Kaizen Costing Measurement of continuous cost reduction and continuous
improvement
Cost of Quality Reporting Measuring the prevention costs and appraisal costs, focus
on cost centers
Balanced Scorecard – BSC The focus on the critical success factors - financial and
non-financial - in order to achieve strategic goals
Benchmarking Identifying and measuring competitive advantages through
analysis and comparison with best practices
Strategy Map Based on BSC with linking critical success factors through
cause-and-effect diagrams
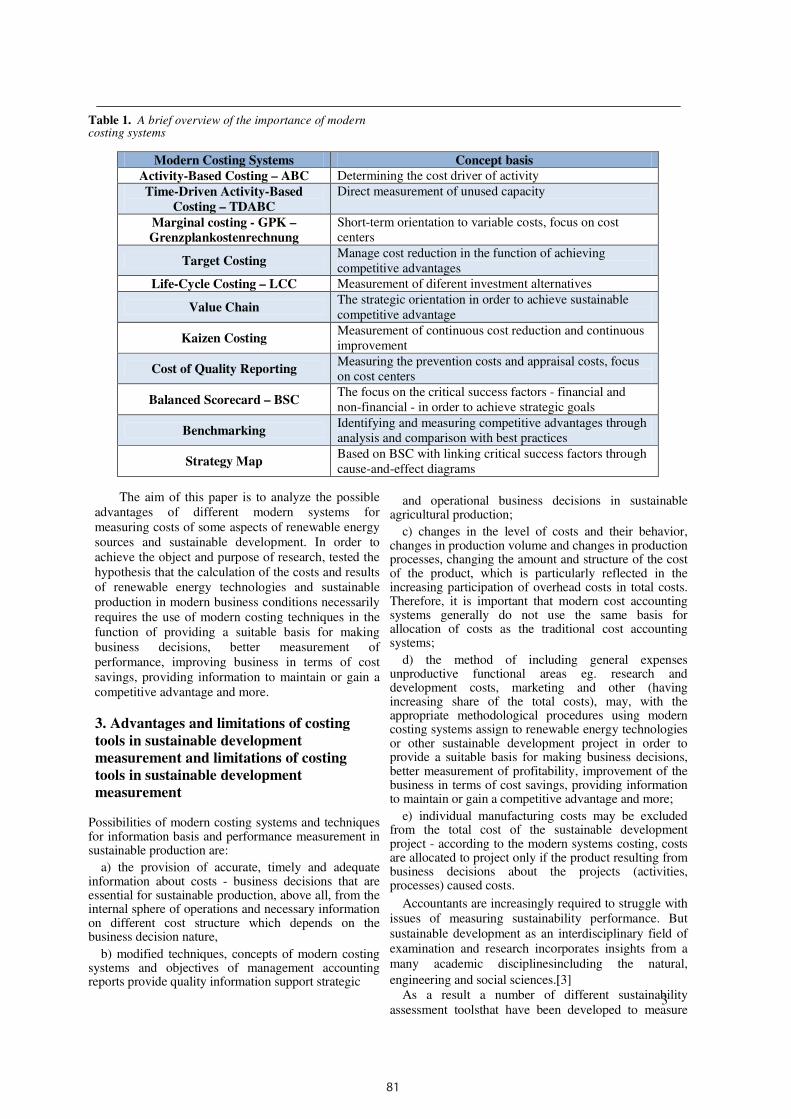
81
ISBN
The renewable energy technologies are potential
very important solution for environmental problems.
A secure supply of energy resources is generally
agreed to be a necessary but not sufficient requirement
for development within a society. Furthermore,
sustainable development within a society demands a
sustainable supply of energy resources (that, in the
long term, is readily and sustainably available at
reasonable cost and can be utilized for all required
tasks without causing negative societal impacts) and
an effective and efficient utilization of energy
resources. In this regard, the connection between
renewable energy sources and sustainable
development comes out [2].
Renewable energy technologies produce marketable
energy by converting natural phenomena into useful
energy forms. These technologies use the energy
inherent in sunlight and its direct and indirect impacts
on the Earth
(photons, wind, falling water, heating effects, and
plant growth), gravitational forces (the tides), and the
heat of the Earth's core (geothermal) as the resources
from which they produce energy.[5]
Measuring sustainable development performance
and quantifying the benefits of sustainability progress
is more qualitative (non-monetary) then quantitative
(monetary) aspects. But, at different levels of
organizational systems (businesses, local government,
state, etc.) most important the question is - whether the
investment in green technologies is cost or
investment? – in context that good investment, in
future, will bring higher benefits than costs.
Investors and government representatives are
interested in:
a) amount of costs of pollution (environmental
damage) or amount of costs of reducing environmental
pollution;
b) amount of costs of prevention and protection of
environment; and
c) amount of eventual benefits of the (non) use
different ways to reduce pollution
which requires the provision of adequate data and
information [7].
Innovation in the sustainable management and
requirements in measuring costs of renewable energy
sources (RES) and sustainable development are
reflected in the Accounting Information System
(AIS) and Environmental Management Accounting
(EMA). Use of Cost Accounting techniques provide
decision making, budgeting, research and
development and control of some aspects of
renewable energy sources and sustainable
development.
2. Importance of modern costing techniques
Chronologically speaking, the industrial revolution at
the end of the eighteenth and at the beginning of early
nineteenth century, with the large scale of
production, gives impetus to the development of
cost accounting. The period from the late nineteenth
century until the outbreak of World War II could be
called the period of establishing the principles,
methods and procedures of processing costs.
Traditional costing systems include Standard
Costing and Absorption Costing among other. New,
modern (contemporary) cost accounting systems are
developed from the middle of the last century. Cost
accounting systems, traditional or contemporary,
are, in the main, concepts of cost allocation by the
effects of the revenue generating organization.
Contemporary (modern) costing systems and
techniques attempts, compared to traditional
(classical) cost accounting systems, to enable
adequate deployment of costs, especially overhead
costs to cost centers.
We believe that the following main reasons
contributed to the necessity of creation,
development and application of modern techniques
of cost accounting:
a) increase of overhead costs in total costs - the
most important changes in the cost of operations
reflected in the increase in overhead costs and a
reduction of direct costs in relation to total costs;
b) change of types and structure of the organization
business management;
c) the international market (the emergence of
international corporations contributes to increasing
the complexity of calculating the cost, the growing
importance of transfer pricing and other);
d) the search for new ways to achieve sustainable
competitiveness (cost accounting should provide
information about products, but also on markets,
customers and competition); and
e) the creation and development of strategic cost
management and strategic management accounting
(business is unthinkable without the cost
management and focuses on the measurement of
financial and non-financial performance measures
of results achieved).
Costing (cost accounting), together with
management accounting, which is an integral part,
is trying to respond to the challenges of measuring
sustainable development performance through the
creation of new cost accounting techniques,
methods and concepts to be more informative.
Among them, we emphasize the following modern
cost accounting techniques: Activity based costing
(ABC) and modification of that system as Time-
Driven Activity based costing (TDABC); Flexible
cost planning - Marginal costing
(Grenzplankostenrechnung - GPK); Target
costing; Life- cycle costing; Value chain; Kaizen
costing; Cost of quality reporting, The Balanced
Scorecard, Benchmarking, strategic mapping, etc.
A brief overview of the importance of modern
costing systems is presented in Table 1.
3
Table 1. A brief overview of the importance of modern costing systems
The aim of this paper is to analyze the possible
advantages of different modern systems for
measuring costs of some aspects of renewable energy
sources and sustainable development. In order to
achieve the object and purpose of research, tested the
hypothesis that the calculation of the costs and results
of renewable energy technologies and sustainable
production in modern business conditions necessarily
requires the use of modern costing techniques in the
function of providing a suitable basis for making
business decisions, better measurement of
performance, improving business in terms of cost
savings, providing information to maintain or gain a
competitive advantage and more.
3. Advantages and limitations of costing
tools in sustainable development
measurement and limitations of costing
tools in sustainable development
measurement
Possibilities of modern costing systems and techniques for information basis and performance measurement in sustainable production are:
a) the provision of accurate, timely and adequate information about costs - business decisions that are essential for sustainable production, above all, from the internal sphere of operations and necessary information on different cost structure which depends on the business decision nature,
b) modified techniques, concepts of modern costing systems and objectives of management accounting reports provide quality information support strategic
and operational business decisions in sustainable agricultural production;
c) changes in the level of costs and their behavior, changes in production volume and changes in production processes, changing the amount and structure of the cost of the product, which is particularly reflected in the increasing participation of overhead costs in total costs. Therefore, it is important that modern cost accounting systems generally do not use the same basis for allocation of costs as the traditional cost accounting systems;
d) the method of including general expenses unproductive functional areas eg. research and development costs, marketing and other (having increasing share of the total costs), may, with the appropriate methodological procedures using modern costing systems assign to renewable energy technologies or other sustainable development project in order to provide a suitable basis for making business decisions, better measurement of profitability, improvement of the business in terms of cost savings, providing information to maintain or gain a competitive advantage and more;
e) individual manufacturing costs may be excluded from the total cost of the sustainable development project - according to the modern systems costing, costs are allocated to project only if the product resulting from business decisions about the projects (activities, processes) caused costs.
Accountants are increasingly required to struggle with
issues of measuring sustainability performance. But
sustainable development as an interdisciplinary field of
examination and research incorporates insights from a
many academic disciplinesincluding the natural,
engineering and social sciences.[3]
As a result a number of different sustainability
assessment toolsthat have been developed to measure
Modern Costing Systems Concept basis
Activity-Based Costing – ABC Determining the cost driver of activity
Time-Driven Activity-Based
Costing – TDABC
Direct measurement of unused capacity
Marginal costing - GPK –
Grenzplankostenrechnung
Short-term orientation to variable costs, focus on cost
centers
Target Costing Manage cost reduction in the function of achieving
competitive advantages
Life-Cycle Costing – LCC Measurement of diferent investment alternatives
Value Chain The strategic orientation in order to achieve sustainable
competitive advantage
Kaizen Costing Measurement of continuous cost reduction and continuous
improvement
Cost of Quality Reporting Measuring the prevention costs and appraisal costs, focus
on cost centers
Balanced Scorecard – BSC The focus on the critical success factors - financial and
non-financial - in order to achieve strategic goals
Benchmarking Identifying and measuring competitive advantages through
analysis and comparison with best practices
Strategy Map Based on BSC with linking critical success factors through
cause-and-effect diagrams
82
4
sustainability performance have been published over
the past years. Sustainabilityassessment tools must be
accurate, robust and based on sound theoretical
foundationsbacked with empirical evidence if
misleading policy messages are to be avoided.[3] In practice, traditional costing systems are often used
more then modern costing tools because of long tradition of use or high costs of implementation of modern cost tools. Sometimes, traditional costing system are used with modern costing techniques as addition. Nevertheless, modern costing techniques give contribution to more accurate cost allocation.
Energy budget savings or reducing costs of energy are central issues of almost every project of sustainable development. Energy is crucial for the functioning of the economy. Mostly, fossil fuels (non-renewable) like oils, natural gas and coal are main energy sources. Costing systems and techniques are adequate for cost measurement of renewable energy technologies like biomass production, hydropower, wind power, solar or geothermal energy production.
The renewable energy technologies already exist (some renewable sources are used for centuries) but are not used in sufficient quantities.
The issue of costs is central to the question of how rapidly an energy transition will occur. Costs include energy infrastructure investment and the day-to-day operations. In analyzing costs, we should consider both the market costs of supply and the environmental costs of various energy sources.The costs of renewable energy resources are attributable in part to inherent characteristics, particularly their low net energy ratios, intermittent availability, and capital intensity. Development of new technology will reduce cost but may not make renewable energy cost competitive with market prices of fossil fuels in the near future unless fossil-fuel externalities are considered.[8]
However, at the moment, none of costing methodological proposals are able to encompass all considerations for proper measuring of sustainable development, especially future benefits. There are methodological limitations, different concepts of value, time, economic, environmental and social horizonts and objectives.
The future benefits are difficult to quantify, unlike costs, and this make difficult to express the usefulness of designing and usingrenewable energy technologies and other sustainable development projects.
4. CONCLUSIONS
Measuring sustainable development performance and quantifying the benefits of sustainability progress is more qualitative then quantitative perspective. Sustainable development is an interdisciplinary field. That is the reason why is not yet developed proper system for quantitative measuring of sustainable development and it’s benefits. This paper exposes some of the strengths and weaknesses of traditional and modern accounting tools that follow the measurement of sustainable development.
Atdifferent levels of organizational systems (businesses, local government, state, etc.) very important issue is - whether the investment in the renewable energy technology, in future, bring greater benefits than costs.The future benefits are difficult to quantify. That is the reason why projects of renewable energy technologies and other sustainable development projects seems to have higher costs than benefits. Because of that, often sustainable development is based on savings in energy and efficiency improvement instead of use of renewable sources.
The renewable sources already exist and some are used for centuries. At the moment, the renewable sources technologies aren’t used in satisfactory quantities to reduce the disappearance of fossil fuels.
Modern costing techniques give contribution to more accurate cost allocation of renewable energy technologies and other sustainable development projects.
References
[1] A. Ball, R. Craig, “Using neo-institutionalism to advance
social and environmental accounting“, Critical Perspectives on Accounting, vol. 21, pp. 283-293, 2010.
[2] I. Dincer, “Renewable energy and sustainable development: a crucial review“, Renewable and Sustainable Energy Reviews, vol. 4, pp. 157-175, 2000.
[3] A. Gasparatos, M. El-Haram, M. Horner, “The argument against a reductionist approach for measuring sustainable development performance and the need for methodological pluralism“, Accounting Forum, vol. 33, pp. 245-256, 2008.
[4] M. J. Jones, “Accounting for the environment: Towards a theoretical perspective for environmental accounting and reporting“, Accounting Forum, vol. 34, pp. 123-138, 2010.
[5] D. L. Hartley, “Perspectives on renewable energy and the environment”, in Energy and the Environment in the 21st Century J.W. Tester, D.O. Wood, N.A. Ferrari (Eds.), MIT, Massachusetts, 1990, from [2].
[6] H. Lund, “Renewable energy strategies for sustainable development“, Energy vol. 32, pp. 912-919, 2007.
[7] I. Medved, „Obračun troškova u projektima zaštite životne sredine“, („Costing in Projects of Environment Protection“ – in Serbian with English abstract), Subotica: Anali Ekonomskog fakulteta, vol. 20, pp. 167-178, 2008.
[8] D. Timmons, J. M. Harris, B. Roach, The Economics of Renewable Energy,A GDAE Teaching Module on Social and Environmental Issues in Economics, Global Development And Environment Institute, Tufts University, 2014.
EXPRES 2017
ISBN 978-86-919769-1-0
Environmentally sustainable tourist behaviour in the function of sustainable development
M. JELAČA STRUGAR a, A. BOLJEVIĆ b, S. BOLJEVIĆ c
Department of Management, Faculty of Economics in Subotica,
University of Novi Sad, 24000 Subotica, Segedinski put 9-11, Srbija a E-mail: [email protected] b E-mail: [email protected] c E-mail:
Rapid tourism growth, along with irrational use of natural resources, leads to negative effects and multiple-growing crisis in the
field of applying the principles of sustainable development and especially environmental preservation of tourist destinations.
Therefore, within this paper’s framework is the focus on future propagation of tourists’ environmentally responsible behavior in
order to minimize the destruction of the environment. The initiative for conducting research in this area stems from the present
gap between theoretical activities to be implemented in order to successfully realize this way of tourist behavior and the actual
actions being carried out, that are often completely absent or present just on a small scale. Previous theoretical base on this
subject had put its emphasis on planning phase of the concept of sustainable tourism development with some slight looking back
at its implementation. It should be noted that the topic was dealt with from a macro point of view more than from a point of view
of the role of individual participants, where tourists have the most important role as agents of environmental impacts on the
tourist destination and are also potential agents of change in the light of benefits of ecologically responsible behavior. As a result
of the paper, the proposal of activities to be implemented during all phases of tourists’ travel organization is pointed out, starting
from the analysis and selection of the tourist product to implementation of activities during realization of the selected travel
arrangement.
Keywords: sustainable development concept, sustainable tourism development, environmentally sustainable
behavior
1. Introduction
Given that tourism is described as the largest human migration
in history, which annually represents 10% of the world's
population [1, p. 499], one of the most important issues being
raised is the impact of such a large movement of people on the
cultural and historical heritage of a tourist destination and the
possibility of its long-term preservation. Therefore, it is
necessary to observe tourist destination through the prism of
sustainable development, in order to analyze strong effects of
tourists on all elements of sustainability, namely economic,
social and environmental, which can lead to preservation vs
erosion of a tourist destination. Emphasis is placed on the
ecological side, because previous researches indicate and prove
evident negative impact of tourism trends in the ecological
sphere [2, 3, 4]. The need for observing this problem with a
high degree of seriousness stems from the fact that travel
becomes more and more accessible and therefore more
common and can be seen as a social norm of modern life.
Studies indicate exponential growth in the number of tourists
in the future and therefore greater negative environmental
effects caused by irrational use of natural resources,
environmental pollution and endangering natural heritage.
Thus, popular tourist destinations are faced with water
shortage, high emissions of carbon dioxide, excessive amounts
of garbage, dirty coast and numerous other problems [5].
Research suggests that particular destinations around the
Mediterranean are already close to the ecological risks that
threaten natural environment and population, and finally the
entire society [6].
Negative effects of mass tourism developments on
environment can be classified as follows [7]:
• Mechanical effects, such as destruction of vegetation,
soil erosion, etc.;
• Impacts caused by intensive use of surfaces and
changing the landscapes;
• Impacts due to the increase of harmful substances in the
air, water and soil due to higher combustion of fuel, vapor
emissions and waste;
• Hindering effects, such as increased noise.
In the long run, uncontrolled tourism growth and
neither taking into consideration this problem nor resolving it
will lead to future decline in tourism demand and hence
tourism revenues, which currently record significant foreign
exchange effects. Therefore, timely planning tourism’s future
development and the need for increased environmental
awareness of tourists will minimize or completely eliminate
potential damage that destroys the environment of tourist
destinations crucial for its sustainable development.
The aim of this paper is to interpret ecologically
responsible tourist behavior and identify instructions for its
improvement. However, this is just one link on the path of
solving the diagnosed problem, since it is necessary to
involve all participants of the tourism industry. All actors in
tourism industry need to find a sustainable way of doing
business in order to achieve stable long-term development of
the tourism sector [8].
83
4
sustainability performance have been published over
the past years. Sustainabilityassessment tools must be
accurate, robust and based on sound theoretical
foundationsbacked with empirical evidence if
misleading policy messages are to be avoided.[3] In practice, traditional costing systems are often used
more then modern costing tools because of long tradition of use or high costs of implementation of modern cost tools. Sometimes, traditional costing system are used with modern costing techniques as addition. Nevertheless, modern costing techniques give contribution to more accurate cost allocation.
Energy budget savings or reducing costs of energy are central issues of almost every project of sustainable development. Energy is crucial for the functioning of the economy. Mostly, fossil fuels (non-renewable) like oils, natural gas and coal are main energy sources. Costing systems and techniques are adequate for cost measurement of renewable energy technologies like biomass production, hydropower, wind power, solar or geothermal energy production.
The renewable energy technologies already exist (some renewable sources are used for centuries) but are not used in sufficient quantities.
The issue of costs is central to the question of how rapidly an energy transition will occur. Costs include energy infrastructure investment and the day-to-day operations. In analyzing costs, we should consider both the market costs of supply and the environmental costs of various energy sources.The costs of renewable energy resources are attributable in part to inherent characteristics, particularly their low net energy ratios, intermittent availability, and capital intensity. Development of new technology will reduce cost but may not make renewable energy cost competitive with market prices of fossil fuels in the near future unless fossil-fuel externalities are considered.[8]
However, at the moment, none of costing methodological proposals are able to encompass all considerations for proper measuring of sustainable development, especially future benefits. There are methodological limitations, different concepts of value, time, economic, environmental and social horizonts and objectives.
The future benefits are difficult to quantify, unlike costs, and this make difficult to express the usefulness of designing and usingrenewable energy technologies and other sustainable development projects.
4. CONCLUSIONS
Measuring sustainable development performance and quantifying the benefits of sustainability progress is more qualitative then quantitative perspective. Sustainable development is an interdisciplinary field. That is the reason why is not yet developed proper system for quantitative measuring of sustainable development and it’s benefits. This paper exposes some of the strengths and weaknesses of traditional and modern accounting tools that follow the measurement of sustainable development.
Atdifferent levels of organizational systems (businesses, local government, state, etc.) very important issue is - whether the investment in the renewable energy technology, in future, bring greater benefits than costs.The future benefits are difficult to quantify. That is the reason why projects of renewable energy technologies and other sustainable development projects seems to have higher costs than benefits. Because of that, often sustainable development is based on savings in energy and efficiency improvement instead of use of renewable sources.
The renewable sources already exist and some are used for centuries. At the moment, the renewable sources technologies aren’t used in satisfactory quantities to reduce the disappearance of fossil fuels.
Modern costing techniques give contribution to more accurate cost allocation of renewable energy technologies and other sustainable development projects.
References
[1] A. Ball, R. Craig, “Using neo-institutionalism to advance
social and environmental accounting“, Critical Perspectives on Accounting, vol. 21, pp. 283-293, 2010.
[2] I. Dincer, “Renewable energy and sustainable development: a crucial review“, Renewable and Sustainable Energy Reviews, vol. 4, pp. 157-175, 2000.
[3] A. Gasparatos, M. El-Haram, M. Horner, “The argument against a reductionist approach for measuring sustainable development performance and the need for methodological pluralism“, Accounting Forum, vol. 33, pp. 245-256, 2008.
[4] M. J. Jones, “Accounting for the environment: Towards a theoretical perspective for environmental accounting and reporting“, Accounting Forum, vol. 34, pp. 123-138, 2010.
[5] D. L. Hartley, “Perspectives on renewable energy and the environment”, in Energy and the Environment in the 21st Century J.W. Tester, D.O. Wood, N.A. Ferrari (Eds.), MIT, Massachusetts, 1990, from [2].
[6] H. Lund, “Renewable energy strategies for sustainable development“, Energy vol. 32, pp. 912-919, 2007.
[7] I. Medved, „Obračun troškova u projektima zaštite životne sredine“, („Costing in Projects of Environment Protection“ – in Serbian with English abstract), Subotica: Anali Ekonomskog fakulteta, vol. 20, pp. 167-178, 2008.
[8] D. Timmons, J. M. Harris, B. Roach, The Economics of Renewable Energy,A GDAE Teaching Module on Social and Environmental Issues in Economics, Global Development And Environment Institute, Tufts University, 2014.
EXPRES 2017
ISBN 978-86-919769-1-0
Environmentally sustainable tourist behaviour in the function of sustainable development
M. JELAČA STRUGAR a, A. BOLJEVIĆ b, S. BOLJEVIĆ c
Department of Management, Faculty of Economics in Subotica,
University of Novi Sad, 24000 Subotica, Segedinski put 9-11, Srbija a E-mail: [email protected] b E-mail: [email protected] c E-mail:
Rapid tourism growth, along with irrational use of natural resources, leads to negative effects and multiple-growing crisis in the
field of applying the principles of sustainable development and especially environmental preservation of tourist destinations.
Therefore, within this paper’s framework is the focus on future propagation of tourists’ environmentally responsible behavior in
order to minimize the destruction of the environment. The initiative for conducting research in this area stems from the present
gap between theoretical activities to be implemented in order to successfully realize this way of tourist behavior and the actual
actions being carried out, that are often completely absent or present just on a small scale. Previous theoretical base on this
subject had put its emphasis on planning phase of the concept of sustainable tourism development with some slight looking back
at its implementation. It should be noted that the topic was dealt with from a macro point of view more than from a point of view
of the role of individual participants, where tourists have the most important role as agents of environmental impacts on the
tourist destination and are also potential agents of change in the light of benefits of ecologically responsible behavior. As a result
of the paper, the proposal of activities to be implemented during all phases of tourists’ travel organization is pointed out, starting
from the analysis and selection of the tourist product to implementation of activities during realization of the selected travel
arrangement.
Keywords: sustainable development concept, sustainable tourism development, environmentally sustainable
behavior
1. Introduction
Given that tourism is described as the largest human migration
in history, which annually represents 10% of the world's
population [1, p. 499], one of the most important issues being
raised is the impact of such a large movement of people on the
cultural and historical heritage of a tourist destination and the
possibility of its long-term preservation. Therefore, it is
necessary to observe tourist destination through the prism of
sustainable development, in order to analyze strong effects of
tourists on all elements of sustainability, namely economic,
social and environmental, which can lead to preservation vs
erosion of a tourist destination. Emphasis is placed on the
ecological side, because previous researches indicate and prove
evident negative impact of tourism trends in the ecological
sphere [2, 3, 4]. The need for observing this problem with a
high degree of seriousness stems from the fact that travel
becomes more and more accessible and therefore more
common and can be seen as a social norm of modern life.
Studies indicate exponential growth in the number of tourists
in the future and therefore greater negative environmental
effects caused by irrational use of natural resources,
environmental pollution and endangering natural heritage.
Thus, popular tourist destinations are faced with water
shortage, high emissions of carbon dioxide, excessive amounts
of garbage, dirty coast and numerous other problems [5].
Research suggests that particular destinations around the
Mediterranean are already close to the ecological risks that
threaten natural environment and population, and finally the
entire society [6].
Negative effects of mass tourism developments on
environment can be classified as follows [7]:
• Mechanical effects, such as destruction of vegetation,
soil erosion, etc.;
• Impacts caused by intensive use of surfaces and
changing the landscapes;
• Impacts due to the increase of harmful substances in the
air, water and soil due to higher combustion of fuel, vapor
emissions and waste;
• Hindering effects, such as increased noise.
In the long run, uncontrolled tourism growth and
neither taking into consideration this problem nor resolving it
will lead to future decline in tourism demand and hence
tourism revenues, which currently record significant foreign
exchange effects. Therefore, timely planning tourism’s future
development and the need for increased environmental
awareness of tourists will minimize or completely eliminate
potential damage that destroys the environment of tourist
destinations crucial for its sustainable development.
The aim of this paper is to interpret ecologically
responsible tourist behavior and identify instructions for its
improvement. However, this is just one link on the path of
solving the diagnosed problem, since it is necessary to
involve all participants of the tourism industry. All actors in
tourism industry need to find a sustainable way of doing
business in order to achieve stable long-term development of
the tourism sector [8].
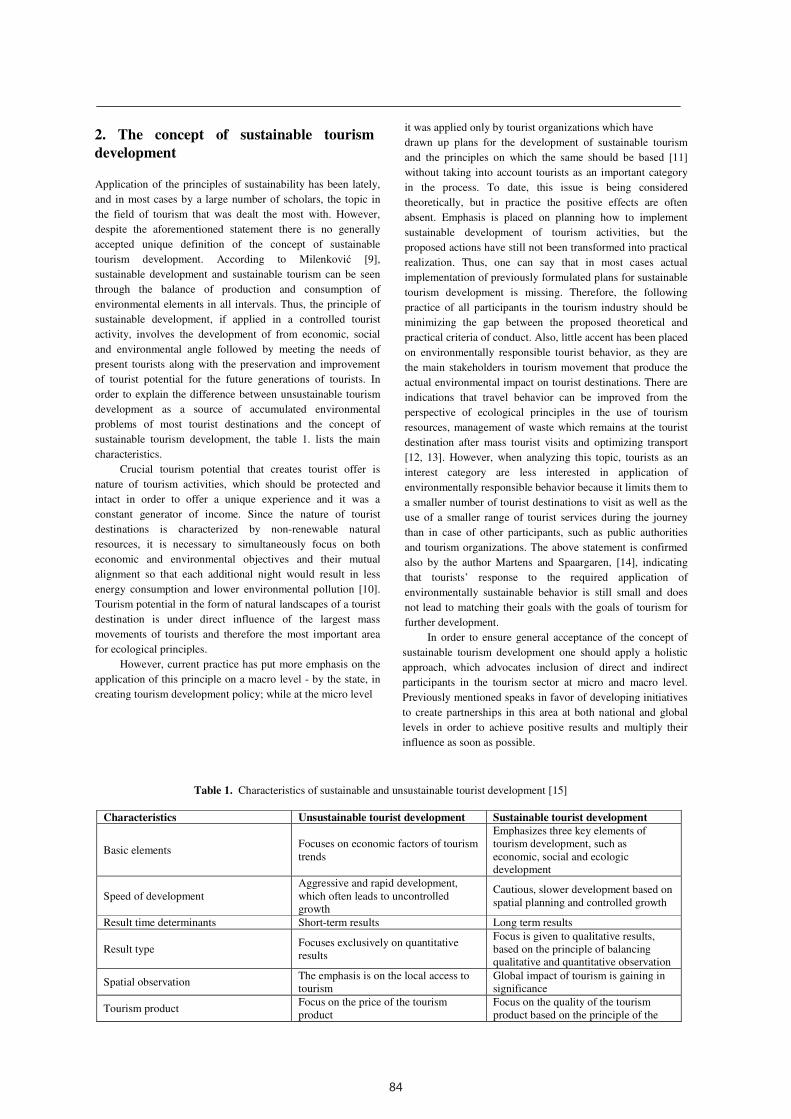
84
2. The concept of sustainable tourism
development
Application of the principles of sustainability has been lately,
and in most cases by a large number of scholars, the topic in
the field of tourism that was dealt the most with. However,
despite the aforementioned statement there is no generally
accepted unique definition of the concept of sustainable
tourism development. According to Milenković [9],
sustainable development and sustainable tourism can be seen
through the balance of production and consumption of
environmental elements in all intervals. Thus, the principle of
sustainable development, if applied in a controlled tourist
activity, involves the development of from economic, social
and environmental angle followed by meeting the needs of
present tourists along with the preservation and improvement
of tourist potential for the future generations of tourists. In
order to explain the difference between unsustainable tourism
development as a source of accumulated environmental
problems of most tourist destinations and the concept of
sustainable tourism development, the table 1. lists the main
characteristics.
Crucial tourism potential that creates tourist offer is
nature of tourism activities, which should be protected and
intact in order to offer a unique experience and it was a
constant generator of income. Since the nature of tourist
destinations is characterized by non-renewable natural
resources, it is necessary to simultaneously focus on both
economic and environmental objectives and their mutual
alignment so that each additional night would result in less
energy consumption and lower environmental pollution [10].
Tourism potential in the form of natural landscapes of a tourist
destination is under direct influence of the largest mass
movements of tourists and therefore the most important area
for ecological principles.
However, current practice has put more emphasis on the
application of this principle on a macro level - by the state, in
creating tourism development policy; while at the micro level
it was applied only by tourist organizations which have
drawn up plans for the development of sustainable tourism
and the principles on which the same should be based [11]
without taking into account tourists as an important category
in the process. To date, this issue is being considered
theoretically, but in practice the positive effects are often
absent. Emphasis is placed on planning how to implement
sustainable development of tourism activities, but the
proposed actions have still not been transformed into practical
realization. Thus, one can say that in most cases actual
implementation of previously formulated plans for sustainable
tourism development is missing. Therefore, the following
practice of all participants in the tourism industry should be
minimizing the gap between the proposed theoretical and
practical criteria of conduct. Also, little accent has been placed
on environmentally responsible tourist behavior, as they are
the main stakeholders in tourism movement that produce the
actual environmental impact on tourist destinations. There are
indications that travel behavior can be improved from the
perspective of ecological principles in the use of tourism
resources, management of waste which remains at the tourist
destination after mass tourist visits and optimizing transport
[12, 13]. However, when analyzing this topic, tourists as an
interest category are less interested in application of
environmentally responsible behavior because it limits them to
a smaller number of tourist destinations to visit as well as the
use of a smaller range of tourist services during the journey
than in case of other participants, such as public authorities
and tourism organizations. The above statement is confirmed
also by the author Martens and Spaargaren, [14], indicating
that tourists’ response to the required application of
environmentally sustainable behavior is still small and does
not lead to matching their goals with the goals of tourism for
further development.
In order to ensure general acceptance of the concept of
sustainable tourism development one should apply a holistic
approach, which advocates inclusion of direct and indirect
participants in the tourism sector at micro and macro level.
Previously mentioned speaks in favor of developing initiatives
to create partnerships in this area at both national and global
levels in order to achieve positive results and multiply their
influence as soon as possible.
Table 1. Characteristics of sustainable and unsustainable tourist development [15]
Characteristics Unsustainable tourist development Sustainable tourist development
Basic elements Focuses on economic factors of tourism
trends
Emphasizes three key elements of
tourism development, such as
economic, social and ecologic
development
Speed of development
Aggressive and rapid development,
which often leads to uncontrolled
growth
Cautious, slower development based on
spatial planning and controlled growth
Result time determinants Short-term results Long term results
Result type Focuses exclusively on quantitative
results
Focus is given to qualitative results,
based on the principle of balancing
qualitative and quantitative observation
Spatial observation The emphasis is on the local access to
tourism
Global impact of tourism is gaining in
significance
Tourism product Focus on the price of the tourism
product
Focus on the quality of the tourism
product based on the principle of the
true value for money
Tourists’ profile
Mass tourists who have no sense of
sustainable development and the need
to preserve natural sites for future
generations
Tourists who are educated and aware of
the importance of tourism’s sustainable
development
3. Environmental dimension of tourist
behaviour
Environmentally responsible behavior of tourists is
considered that "behavior that does not adversely affect the
environment or even leads to positive effects globally and
locally viewed through tourist destination" [16, p. 31]. In
order to promote previously explained behavior, a significant
step is recognized in adequate education of tourists and
establishment of ethical and eco-system values that
determine their behavior. Norms of his behavior, in terms of
whether or not to behave environmentally responsible, derive
from the system of values adopted by the tourists [17]. Their
ecological awareness derives from the existing problems
caused by current tourist activities as well as their sense of
responsibility that they should affect the reduction of this
problem [16]. Tourists who have developed environmental
awareness and responsibility aimed at ecologically
acceptable behavior belong to the group of so-called "green"
or eco-tourists. However, in order to be categorized as a
"green" or eco-tourist, it is not enough just to have a correct
belief and sense of responsibility - it is a precondition - but in
addition, to practically transform ecologically desired norms
of behavior into actual behavior. In environmentally
responsible behavior of tourists we categorize those tourists
who have intentions to act in this way and who conduct such
actions during vacation, affecting the environment in a
minimized way or even have a positive impact on the
environment of the tourist destination.
The following table summarizes definitions of various
authors who have dealt with the environmental dimension of
tourists’ behavior. In order to implement the analysis of the
existence of the above mentioned categories of tourists in
practice, empirical research was conducted by the authors
Juvan and Dolnicar [16]. The results indicate that 31% of
respondents possessed only good intention to behave
environmentally responsible, but such behavior was absent;
also the same percentage of respondents (31%) stated that they
possess pro-environmental values and standards, but still do
not behave environmentally responsibly as tourists. Thus, 62%
of tourists does not behave environmentally responsibly in
practice. The remaining 38% emphasizes application of such
behavior in practice, so that 22% of them did not have
intention to behave environmentally responsibly, but they still
acted this way, while only 15% of tourists identified intention
and real environmental responsibility during the trip. It is
pointed out that tourists who are environmentally responsible,
as shown in paying the registration fee for carbon dioxide,
choosing transport which is more environmentally friendly,
they were housed in environmentally responsible hotels and
used services of providers that operated by the principle of
ecological sustainability [16, p. 36]. A small percentage of
tourists who identified the desired environmental
responsibility can be attributed to mass tourists’ lower
awareness of the importance of it, as well as the result of
application of such behavior that leads to narrowing tourist
choice onto using only those services that are not inconsistent
with ecological principles. On the other hand, research
conducted by the author Martin (2001), which deals with the
tourists from Great Britain only, showed that majority of about
90% of tourists said it was very important to behave in an
environmentally responsible while traveling. However,
contrary to these empirical results, authors Goodwin and
Francis [18] point out that there is a difference in intent of
British tourists and their actual behavior during their visit to a
tourist destination, noting that only 32% of tourists from the
UK choose package tours which are especially formed for the
purpose of minimizing harmful effects of tourism on the
environment destination.
Table 2. Environmentally responsible tourist [16, p. 33-34]
Number Author Definition
1. Poon (1993)
Dolnicar (2004)
A group of new tourists includes those tourists that take into account
natural environment and tend to its preservation in a tourist destination.
2.
Swarbrooke &
Horner (1999)
There are three groups of "green tourists":
1) completely "green" tourists are those who do not go on tourist trips
because they do not want to destroy the environment of the tourist
destination in any way;
2) "Green tourist" is a tourist who does not accept and does not visit
hotels that do not point to the importance of preserving the
environment from the perspective of tourists;
3) Partially "green tourist" considers environmental issues of tourism
activities and strives to minimize negative effects.
3.
Dinan &
Sargeant
(2000)
Sustainable tourist is understood to be the one who appreciates the
possibilities of visits to certain tourist destinations with respect to
85
2. The concept of sustainable tourism
development
Application of the principles of sustainability has been lately,
and in most cases by a large number of scholars, the topic in
the field of tourism that was dealt the most with. However,
despite the aforementioned statement there is no generally
accepted unique definition of the concept of sustainable
tourism development. According to Milenković [9],
sustainable development and sustainable tourism can be seen
through the balance of production and consumption of
environmental elements in all intervals. Thus, the principle of
sustainable development, if applied in a controlled tourist
activity, involves the development of from economic, social
and environmental angle followed by meeting the needs of
present tourists along with the preservation and improvement
of tourist potential for the future generations of tourists. In
order to explain the difference between unsustainable tourism
development as a source of accumulated environmental
problems of most tourist destinations and the concept of
sustainable tourism development, the table 1. lists the main
characteristics.
Crucial tourism potential that creates tourist offer is
nature of tourism activities, which should be protected and
intact in order to offer a unique experience and it was a
constant generator of income. Since the nature of tourist
destinations is characterized by non-renewable natural
resources, it is necessary to simultaneously focus on both
economic and environmental objectives and their mutual
alignment so that each additional night would result in less
energy consumption and lower environmental pollution [10].
Tourism potential in the form of natural landscapes of a tourist
destination is under direct influence of the largest mass
movements of tourists and therefore the most important area
for ecological principles.
However, current practice has put more emphasis on the
application of this principle on a macro level - by the state, in
creating tourism development policy; while at the micro level
it was applied only by tourist organizations which have
drawn up plans for the development of sustainable tourism
and the principles on which the same should be based [11]
without taking into account tourists as an important category
in the process. To date, this issue is being considered
theoretically, but in practice the positive effects are often
absent. Emphasis is placed on planning how to implement
sustainable development of tourism activities, but the
proposed actions have still not been transformed into practical
realization. Thus, one can say that in most cases actual
implementation of previously formulated plans for sustainable
tourism development is missing. Therefore, the following
practice of all participants in the tourism industry should be
minimizing the gap between the proposed theoretical and
practical criteria of conduct. Also, little accent has been placed
on environmentally responsible tourist behavior, as they are
the main stakeholders in tourism movement that produce the
actual environmental impact on tourist destinations. There are
indications that travel behavior can be improved from the
perspective of ecological principles in the use of tourism
resources, management of waste which remains at the tourist
destination after mass tourist visits and optimizing transport
[12, 13]. However, when analyzing this topic, tourists as an
interest category are less interested in application of
environmentally responsible behavior because it limits them to
a smaller number of tourist destinations to visit as well as the
use of a smaller range of tourist services during the journey
than in case of other participants, such as public authorities
and tourism organizations. The above statement is confirmed
also by the author Martens and Spaargaren, [14], indicating
that tourists’ response to the required application of
environmentally sustainable behavior is still small and does
not lead to matching their goals with the goals of tourism for
further development.
In order to ensure general acceptance of the concept of
sustainable tourism development one should apply a holistic
approach, which advocates inclusion of direct and indirect
participants in the tourism sector at micro and macro level.
Previously mentioned speaks in favor of developing initiatives
to create partnerships in this area at both national and global
levels in order to achieve positive results and multiply their
influence as soon as possible.
Table 1. Characteristics of sustainable and unsustainable tourist development [15]
Characteristics Unsustainable tourist development Sustainable tourist development
Basic elements Focuses on economic factors of tourism
trends
Emphasizes three key elements of
tourism development, such as
economic, social and ecologic
development
Speed of development
Aggressive and rapid development,
which often leads to uncontrolled
growth
Cautious, slower development based on
spatial planning and controlled growth
Result time determinants Short-term results Long term results
Result type Focuses exclusively on quantitative
results
Focus is given to qualitative results,
based on the principle of balancing
qualitative and quantitative observation
Spatial observation The emphasis is on the local access to
tourism
Global impact of tourism is gaining in
significance
Tourism product Focus on the price of the tourism
product
Focus on the quality of the tourism
product based on the principle of the
true value for money
Tourists’ profile
Mass tourists who have no sense of
sustainable development and the need
to preserve natural sites for future
generations
Tourists who are educated and aware of
the importance of tourism’s sustainable
development
3. Environmental dimension of tourist
behaviour
Environmentally responsible behavior of tourists is
considered that "behavior that does not adversely affect the
environment or even leads to positive effects globally and
locally viewed through tourist destination" [16, p. 31]. In
order to promote previously explained behavior, a significant
step is recognized in adequate education of tourists and
establishment of ethical and eco-system values that
determine their behavior. Norms of his behavior, in terms of
whether or not to behave environmentally responsible, derive
from the system of values adopted by the tourists [17]. Their
ecological awareness derives from the existing problems
caused by current tourist activities as well as their sense of
responsibility that they should affect the reduction of this
problem [16]. Tourists who have developed environmental
awareness and responsibility aimed at ecologically
acceptable behavior belong to the group of so-called "green"
or eco-tourists. However, in order to be categorized as a
"green" or eco-tourist, it is not enough just to have a correct
belief and sense of responsibility - it is a precondition - but in
addition, to practically transform ecologically desired norms
of behavior into actual behavior. In environmentally
responsible behavior of tourists we categorize those tourists
who have intentions to act in this way and who conduct such
actions during vacation, affecting the environment in a
minimized way or even have a positive impact on the
environment of the tourist destination.
The following table summarizes definitions of various
authors who have dealt with the environmental dimension of
tourists’ behavior. In order to implement the analysis of the
existence of the above mentioned categories of tourists in
practice, empirical research was conducted by the authors
Juvan and Dolnicar [16]. The results indicate that 31% of
respondents possessed only good intention to behave
environmentally responsible, but such behavior was absent;
also the same percentage of respondents (31%) stated that they
possess pro-environmental values and standards, but still do
not behave environmentally responsibly as tourists. Thus, 62%
of tourists does not behave environmentally responsibly in
practice. The remaining 38% emphasizes application of such
behavior in practice, so that 22% of them did not have
intention to behave environmentally responsibly, but they still
acted this way, while only 15% of tourists identified intention
and real environmental responsibility during the trip. It is
pointed out that tourists who are environmentally responsible,
as shown in paying the registration fee for carbon dioxide,
choosing transport which is more environmentally friendly,
they were housed in environmentally responsible hotels and
used services of providers that operated by the principle of
ecological sustainability [16, p. 36]. A small percentage of
tourists who identified the desired environmental
responsibility can be attributed to mass tourists’ lower
awareness of the importance of it, as well as the result of
application of such behavior that leads to narrowing tourist
choice onto using only those services that are not inconsistent
with ecological principles. On the other hand, research
conducted by the author Martin (2001), which deals with the
tourists from Great Britain only, showed that majority of about
90% of tourists said it was very important to behave in an
environmentally responsible while traveling. However,
contrary to these empirical results, authors Goodwin and
Francis [18] point out that there is a difference in intent of
British tourists and their actual behavior during their visit to a
tourist destination, noting that only 32% of tourists from the
UK choose package tours which are especially formed for the
purpose of minimizing harmful effects of tourism on the
environment destination.
Table 2. Environmentally responsible tourist [16, p. 33-34]
Number Author Definition
1. Poon (1993)
Dolnicar (2004)
A group of new tourists includes those tourists that take into account
natural environment and tend to its preservation in a tourist destination.
2.
Swarbrooke &
Horner (1999)
There are three groups of "green tourists":
1) completely "green" tourists are those who do not go on tourist trips
because they do not want to destroy the environment of the tourist
destination in any way;
2) "Green tourist" is a tourist who does not accept and does not visit
hotels that do not point to the importance of preserving the
environment from the perspective of tourists;
3) Partially "green tourist" considers environmental issues of tourism
activities and strives to minimize negative effects.
3.
Dinan &
Sargeant
(2000)
Sustainable tourist is understood to be the one who appreciates the
possibilities of visits to certain tourist destinations with respect to

86
cultural, social and environmental norms and the uniqueness of a
destination.
4. Dolnicar &
Matus (2008)
"Green tourists" behave environmentally responsible while traveling and
during implementation of all activities that are associated with tourism
context.
5. Stanford (2008, str. 270)
Responsible tourists should have the following dimensions:
• respect,
• awareness;
• involvement;
• excellence and reciprocity.
6.
Bergin-Seers &
Mair (2009, str. 117)
"Green tourist" is interested in behaving environmentally responsibly
towards the environment while on vacation. Also, one is ready to pay a
higher price in order to be the user of goods and services obtained by
environmentally responsible tourist agency.
7. Mehmetoglu
(2010)
A tourist who advocates the principle of sustainable development and is
concerned with the issues of sustainability and economic benefits for the
local population of the tourist destination.
8.
Wehrli and others
(2011)
A tourist who is aware of the importance of tourist destinations’
sustainable development and when booking a holiday takes into account
sustainability factor.
9.
Perkins &
Brown (2012)
The real eco-tourist travels guided by the values of the biosphere, on
one’s way supports environmental responsibility and avoids the use of
resources just for entertainment, while taking into account the impact of
that usege on the environment.
4. Proposal for action in implementation of
environmentally responsible tourist
behavior
The impact of tourist behavior on social, economic and
ecological system is essential for tourist destination and
follows all the stages of tourist travel - from its planning,
through selection and realization of the selected packages, as
shown in the Figure 1.
While planning a tourist travel, tourists choose individual
elements of the tourist package tour, such as travel itinerary, or
the path to arrive to the selected travel destinations and
accommodation capacities. Decisions about the elements
mentioned should be based on principles of environmentally
responsible behavior, so that the tourists choose:
• such a product of a tourist agency or a package deal,
consisting of a set of tourist services that are in line with the
concept of sustainable development of tourism in a chosen
tourist destination. This criterion may reduce available tourist
offer and narrow the choice. Since the demand for these
packages is still not large and massive, they cannot be
considered the usual tourist outfit, so agencies often do not
have them in mind when forming advertised arrangements, but
only order and create those individually, if there are interested
tourists. The above situation leads to differentiation and
individualization of tourist offer, which carries a higher price;
• transport by railways, since it has the smallest contribution to
the greenhouse effect compared to road and air transport [19],
which are, when observing the European Union, the most
common choices of tourists. Selection of rail transport reduces
the possibility of going to destinations that are not connected
by rails, as well as tourist destinations that are spatially very
far from the potential tourists’ place of residence;
• accommodation in such facilities which have lower
consumption of water and energy, the so-called eco-efficient
accommodation facilities. The attractiveness to these
properties is present with tourists from Denmark, who are even
willing to allocate more funds for such accommodation. Most
Italian tourists also prefer this type of accommodation, while
tourists from Germany are minority here [1, p. 500]. Observing
from the perspective of mass tourists who focus on the cost of
the service provided, it is unlikely that they will choose such
accommodation facilities, which are often offered at a higher
price.
Also, tourists and their stay at the selected tourist destination
must be accompanied by preservation of the welfare of local
population and the existing ecosystem, from the point of
activity to be performed [1]:
• natural area should not be over-used, in order to avoid the
crowds (skiing in the Alps)
• activities targeted towards party, that lead to consumption of
high amount of energy, such as diving, should be carried out to
a lesser extent;
• use of alcohol should be limited in order not to upset local
population and infringe upon their well-being;
• the differences in culture, social values and religion should
not be highlighted, in order to reduce tensions between the
tourists and residents.
Fig. 1. The impact of the choice of tourism product on environment [1, p. 501]
5. Final consideration
Placing emphasis on the environmental dimension of tourist
trips will allow better control of negative impacts of
aggressive growth of mass tourism trends which they have on
the environment. Further growth in the tourism activities
should be followed by the course of transformation of the
traditional economic Trinity, such as profit, power and prestige
into elements of sustainable economic Trinity - efficiency,
economy and ecology. In order to implement the
aforementioned transformation into practice and lead to
tangible results, it is necessary to include not only participants
of the tourism supply, but also those on the side of tourist
demand, it est tourists. Today there is a mismatch between the
preferences of modern tourists and their motivation for
selecting certain tourism products and services, as well as
expectations from them on one hand and environmental
principles on the other. Therefore, it is necessary to develop
awareness on tourists’ side of the need for ecologically
responsible behavior during tourist visits. However, in
addition, it is necessary and direct tourists to form a group of
eco-tourists, or so-called green tourists who apply such tourist
behavior. Parallel support and implementation of such
behavior will lead to positive long-term effects, both in terms
of natural resources of tourist destinations and their residents,
through minimizing tensions and other social problems. With
regard to environmental and social problems accumulated at
the most famous and most visited tourist destinations, it is
necessary to implement the proposed course of action in a
short period of time, which is possible only through radical
changes on the demand and supply side. It is necessary to
correct common tourist behavior through application of more
rigorous criteria and initiatives in favor of ecology
preservation (such as introduction of taxes, fees, etc.), as well
as the expansion of the tourist offer in terms of a large number
of variants of tourist services, along with satisfying principles
of economy. In this way, obligation for environmentally
responsible behavior will be created for all the tourists, who
will be able to find pro-ecological tourist services in
accordance with their preferences, expectations and purchase
power.
References
[1] Budeanu A. (2007), Sustainable tourist behaviour – a
discussion of opportunities for change. International
Journal of Consumer Studies, 31, 499-508.
[2] Gössling S. (2002), Global environmental consequences
of tourism. Global Environmental Change, 12(4), 283–
302.
[3] UNWTO & UNEP (2008): Climate change and tourism:
Responding to global challenges.
http://www.unwto.org/sustainable/doc/climate2008.pdf,
last accessed: Decembre 20, 2016.
[4] World Wide Fund For Nature (2012). Living Planet
Report. Switzerland, WWF.
[5] European Commission (2004), Feasibility and
Preparatory Study Regarding Multi-stakeholder European
Targeted Action Sustainable Tourism and Transport.
European Commission, DG Enterprise, Hague.
[6] Schmidt H.W. (2002), How Europeans go on holiday,
Eurostat.
[7] Hahn P. (1989), Analyse des Konflikts umwelt, Tu
Berlin, Berlin.
[8] Štetić S. (2009), Značaj I uloga turoperatora za razvoj
održivog turizma, Zbornik radova naučnog skupa:
Savremene tendencije u turizmu, hotelijerstvu i
gastronomiji, Novi Sad: Univerzitet u Novom Sadu,
PMF.
[9] Milenković S. (2009), Monografija: Turizam i ekonomija,
Kragujevac: Univerzitet u Kragujevcu, Ekonomski
fakultet.
[10] Daly E. H. (1999), Beyond growth: the economics of
sustainable development, Beacon Press.
[11] Sharpley R. (2000), Tourism and Sustainable
Development: Exploring the Theoretical Divide. Journal
of Sustainable Tourism, 8(1), 1-19.
[12] Upham P. (2001), A comparison of sustainability theory
87
cultural, social and environmental norms and the uniqueness of a
destination.
4. Dolnicar &
Matus (2008)
"Green tourists" behave environmentally responsible while traveling and
during implementation of all activities that are associated with tourism
context.
5. Stanford (2008, str. 270)
Responsible tourists should have the following dimensions:
• respect,
• awareness;
• involvement;
• excellence and reciprocity.
6.
Bergin-Seers &
Mair (2009, str. 117)
"Green tourist" is interested in behaving environmentally responsibly
towards the environment while on vacation. Also, one is ready to pay a
higher price in order to be the user of goods and services obtained by
environmentally responsible tourist agency.
7. Mehmetoglu
(2010)
A tourist who advocates the principle of sustainable development and is
concerned with the issues of sustainability and economic benefits for the
local population of the tourist destination.
8.
Wehrli and others
(2011)
A tourist who is aware of the importance of tourist destinations’
sustainable development and when booking a holiday takes into account
sustainability factor.
9.
Perkins &
Brown (2012)
The real eco-tourist travels guided by the values of the biosphere, on
one’s way supports environmental responsibility and avoids the use of
resources just for entertainment, while taking into account the impact of
that usege on the environment.
4. Proposal for action in implementation of
environmentally responsible tourist
behavior
The impact of tourist behavior on social, economic and
ecological system is essential for tourist destination and
follows all the stages of tourist travel - from its planning,
through selection and realization of the selected packages, as
shown in the Figure 1.
While planning a tourist travel, tourists choose individual
elements of the tourist package tour, such as travel itinerary, or
the path to arrive to the selected travel destinations and
accommodation capacities. Decisions about the elements
mentioned should be based on principles of environmentally
responsible behavior, so that the tourists choose:
• such a product of a tourist agency or a package deal,
consisting of a set of tourist services that are in line with the
concept of sustainable development of tourism in a chosen
tourist destination. This criterion may reduce available tourist
offer and narrow the choice. Since the demand for these
packages is still not large and massive, they cannot be
considered the usual tourist outfit, so agencies often do not
have them in mind when forming advertised arrangements, but
only order and create those individually, if there are interested
tourists. The above situation leads to differentiation and
individualization of tourist offer, which carries a higher price;
• transport by railways, since it has the smallest contribution to
the greenhouse effect compared to road and air transport [19],
which are, when observing the European Union, the most
common choices of tourists. Selection of rail transport reduces
the possibility of going to destinations that are not connected
by rails, as well as tourist destinations that are spatially very
far from the potential tourists’ place of residence;
• accommodation in such facilities which have lower
consumption of water and energy, the so-called eco-efficient
accommodation facilities. The attractiveness to these
properties is present with tourists from Denmark, who are even
willing to allocate more funds for such accommodation. Most
Italian tourists also prefer this type of accommodation, while
tourists from Germany are minority here [1, p. 500]. Observing
from the perspective of mass tourists who focus on the cost of
the service provided, it is unlikely that they will choose such
accommodation facilities, which are often offered at a higher
price.
Also, tourists and their stay at the selected tourist destination
must be accompanied by preservation of the welfare of local
population and the existing ecosystem, from the point of
activity to be performed [1]:
• natural area should not be over-used, in order to avoid the
crowds (skiing in the Alps)
• activities targeted towards party, that lead to consumption of
high amount of energy, such as diving, should be carried out to
a lesser extent;
• use of alcohol should be limited in order not to upset local
population and infringe upon their well-being;
• the differences in culture, social values and religion should
not be highlighted, in order to reduce tensions between the
tourists and residents.
Fig. 1. The impact of the choice of tourism product on environment [1, p. 501]
5. Final consideration
Placing emphasis on the environmental dimension of tourist
trips will allow better control of negative impacts of
aggressive growth of mass tourism trends which they have on
the environment. Further growth in the tourism activities
should be followed by the course of transformation of the
traditional economic Trinity, such as profit, power and prestige
into elements of sustainable economic Trinity - efficiency,
economy and ecology. In order to implement the
aforementioned transformation into practice and lead to
tangible results, it is necessary to include not only participants
of the tourism supply, but also those on the side of tourist
demand, it est tourists. Today there is a mismatch between the
preferences of modern tourists and their motivation for
selecting certain tourism products and services, as well as
expectations from them on one hand and environmental
principles on the other. Therefore, it is necessary to develop
awareness on tourists’ side of the need for ecologically
responsible behavior during tourist visits. However, in
addition, it is necessary and direct tourists to form a group of
eco-tourists, or so-called green tourists who apply such tourist
behavior. Parallel support and implementation of such
behavior will lead to positive long-term effects, both in terms
of natural resources of tourist destinations and their residents,
through minimizing tensions and other social problems. With
regard to environmental and social problems accumulated at
the most famous and most visited tourist destinations, it is
necessary to implement the proposed course of action in a
short period of time, which is possible only through radical
changes on the demand and supply side. It is necessary to
correct common tourist behavior through application of more
rigorous criteria and initiatives in favor of ecology
preservation (such as introduction of taxes, fees, etc.), as well
as the expansion of the tourist offer in terms of a large number
of variants of tourist services, along with satisfying principles
of economy. In this way, obligation for environmentally
responsible behavior will be created for all the tourists, who
will be able to find pro-ecological tourist services in
accordance with their preferences, expectations and purchase
power.
References
[1] Budeanu A. (2007), Sustainable tourist behaviour – a
discussion of opportunities for change. International
Journal of Consumer Studies, 31, 499-508.
[2] Gössling S. (2002), Global environmental consequences
of tourism. Global Environmental Change, 12(4), 283–
302.
[3] UNWTO & UNEP (2008): Climate change and tourism:
Responding to global challenges.
http://www.unwto.org/sustainable/doc/climate2008.pdf,
last accessed: Decembre 20, 2016.
[4] World Wide Fund For Nature (2012). Living Planet
Report. Switzerland, WWF.
[5] European Commission (2004), Feasibility and
Preparatory Study Regarding Multi-stakeholder European
Targeted Action Sustainable Tourism and Transport.
European Commission, DG Enterprise, Hague.
[6] Schmidt H.W. (2002), How Europeans go on holiday,
Eurostat.
[7] Hahn P. (1989), Analyse des Konflikts umwelt, Tu
Berlin, Berlin.
[8] Štetić S. (2009), Značaj I uloga turoperatora za razvoj
održivog turizma, Zbornik radova naučnog skupa:
Savremene tendencije u turizmu, hotelijerstvu i
gastronomiji, Novi Sad: Univerzitet u Novom Sadu,
PMF.
[9] Milenković S. (2009), Monografija: Turizam i ekonomija,
Kragujevac: Univerzitet u Kragujevcu, Ekonomski
fakultet.
[10] Daly E. H. (1999), Beyond growth: the economics of
sustainable development, Beacon Press.
[11] Sharpley R. (2000), Tourism and Sustainable
Development: Exploring the Theoretical Divide. Journal
of Sustainable Tourism, 8(1), 1-19.
[12] Upham P. (2001), A comparison of sustainability theory

88
with UK and European airports policy and practice.
Journal of Environmental Management, 63, 237–248.
[13] Götz K., Loose W., Schmied M., Schubert S. (2002),
Mobility Styles in Leisure Time: Reducing the
Environmental Impacts of Leisure and Tourism Travel.
Öko-Institut e.V, Freiburg.
[14] Martens S., Spaargaren G. (2005), The politics of
sustainable consumption: the case of the Netherlands.
Sustainability: Science, Practice and Policy, 1, 29–42.
[15] Krippendorf J. (1999), Reconciling tourist activities with
nature conservation, Strasbourg: Council of Europe
[16] Juvan E., Dolnicar S. (2016), Measuring
environmentally sustainable tourist behavior, Annals of
Tourism Research, 59, 30-44
[17] Stern P. C. (2000), Toward a coherent theory of
environmentally significant behavior. Journal of Social
Issues, 56(3), 407–424.
[18] Goodwin H., Francis J. (2003), Ethical and responsible
tourism: Consumer trends in UK, Journal of Vacation
Marketing, 9 (3), 271-284
[19] European Commission (2003), Basic Orientations for the
Sustainability of European Tourism. European
Commission, Brussels.
EXPRES 2017 ISBN 978-86-919769-1-0
Seasonal savings of transpired solar collectors B. BOKOR a, L. KAJTÁR a, D. ERYENER b, H. AKHAN b
aBudapest University of Technology and Economics, Department of Building Service and Process Engineering
H-1111 Budapest, Műegyetemrkp. 3-9, Hungary
E-mail: [email protected]
bTrakya University, Engineering Faculty, Department of Mechanical Engineering
TR-22030 Edirne, Ahmet Karadeniz Campus
Abstract
The integration of renewable energy sources into building heat supply systems has been a key target of science for the
past decades. In many cases high set-up costs make payback periods so long that investors lose motivation to build
environmentally friendly HVAC systems. Transpired solar collectors heat up air directly by solar energy, which can
offset a remarkable proportion of ventilation heat demand. Their simple construction results in low first costs and
makes them practically maintenance-free. However, their suitability to certain building types has to be examined to
maximise their effect. Industrial buildings with large empty facades and high fresh air demand are well suitable for the
efficient TSC operation. The aim of the current article is to sum up the energy benefits of TSC systems both in winter
and in summer operation. In winter, alongside with the air heating itself, the TSC reduces the energy consumption by
wall heat recapture and building air destratification, too. In summer, when there is no heating demand in ventilation,
domestic hot water can be preheated with the use of an air-to-water heat exchanger. Moreover, the TSC is useful to
reduce cooling loads from solar radiation, both by daytime passive cooling (roof ventilation) and nocturnal radiant
cooling.
Nomenclature
Abbreviations
DHW domestic hot water
HVAC heating, ventilation, air condition
TSC transpired solar collector
Latin letters
As surface area [m2]
cp,air specific heat capacity of air [kJ/(kg·K)]
IT solar radiation incident on the collector [W/m2]
m˙air,out outgoing airmass flow [kg/s]
Tair,plen plenum air temperature [°C]
Tamb ambient temperature [°C]
Tair,out outgoing air temperature [°C]
Tcol collector temperature [°C]
Greek letters
εhx heat exchange effectiveness [-]
ηcol collector efficiency [-]
Keywords:solar air heating, transpired solar collector, passive cooling, nocturnal radiation, free cooling
1. Introduction Replacing the use of fossil fuels with renewable
energy is one of the most commonplace targets of
today’s energy policy. This process has created a
turnaround in the HVAC equipment market, as
products emerged which stand out with providing
great performance with lower needs of primary
energy. Engineers, builders and end-users face new
developments every year when attending international
fairs, which are often entirely dedicated to systems
based on renewable energy use. Unfortunately, in
many cases, high capital costs and the lack of stately
funding prevent several investors from sustainable
systems. For every green HVAC system predicted
payback periods therefore are crucially important, as
investors tend to consider these as the basis of
decision. Low capital costs and reliable energy
production at the same time are the key factors in the

89
with UK and European airports policy and practice.
Journal of Environmental Management, 63, 237–248.
[13] Götz K., Loose W., Schmied M., Schubert S. (2002),
Mobility Styles in Leisure Time: Reducing the
Environmental Impacts of Leisure and Tourism Travel.
Öko-Institut e.V, Freiburg.
[14] Martens S., Spaargaren G. (2005), The politics of
sustainable consumption: the case of the Netherlands.
Sustainability: Science, Practice and Policy, 1, 29–42.
[15] Krippendorf J. (1999), Reconciling tourist activities with
nature conservation, Strasbourg: Council of Europe
[16] Juvan E., Dolnicar S. (2016), Measuring
environmentally sustainable tourist behavior, Annals of
Tourism Research, 59, 30-44
[17] Stern P. C. (2000), Toward a coherent theory of
environmentally significant behavior. Journal of Social
Issues, 56(3), 407–424.
[18] Goodwin H., Francis J. (2003), Ethical and responsible
tourism: Consumer trends in UK, Journal of Vacation
Marketing, 9 (3), 271-284
[19] European Commission (2003), Basic Orientations for the
Sustainability of European Tourism. European
Commission, Brussels.
EXPRES 2017 ISBN 978-86-919769-1-0
Seasonal savings of transpired solar collectors B. BOKOR a, L. KAJTÁR a, D. ERYENER b, H. AKHAN b
aBudapest University of Technology and Economics, Department of Building Service and Process Engineering
H-1111 Budapest, Műegyetemrkp. 3-9, Hungary
E-mail: [email protected]
bTrakya University, Engineering Faculty, Department of Mechanical Engineering
TR-22030 Edirne, Ahmet Karadeniz Campus
Abstract
The integration of renewable energy sources into building heat supply systems has been a key target of science for the
past decades. In many cases high set-up costs make payback periods so long that investors lose motivation to build
environmentally friendly HVAC systems. Transpired solar collectors heat up air directly by solar energy, which can
offset a remarkable proportion of ventilation heat demand. Their simple construction results in low first costs and
makes them practically maintenance-free. However, their suitability to certain building types has to be examined to
maximise their effect. Industrial buildings with large empty facades and high fresh air demand are well suitable for the
efficient TSC operation. The aim of the current article is to sum up the energy benefits of TSC systems both in winter
and in summer operation. In winter, alongside with the air heating itself, the TSC reduces the energy consumption by
wall heat recapture and building air destratification, too. In summer, when there is no heating demand in ventilation,
domestic hot water can be preheated with the use of an air-to-water heat exchanger. Moreover, the TSC is useful to
reduce cooling loads from solar radiation, both by daytime passive cooling (roof ventilation) and nocturnal radiant
cooling.
Nomenclature
Abbreviations
DHW domestic hot water
HVAC heating, ventilation, air condition
TSC transpired solar collector
Latin letters
As surface area [m2]
cp,air specific heat capacity of air [kJ/(kg·K)]
IT solar radiation incident on the collector [W/m2]
m˙air,out outgoing airmass flow [kg/s]
Tair,plen plenum air temperature [°C]
Tamb ambient temperature [°C]
Tair,out outgoing air temperature [°C]
Tcol collector temperature [°C]
Greek letters
εhx heat exchange effectiveness [-]
ηcol collector efficiency [-]
Keywords:solar air heating, transpired solar collector, passive cooling, nocturnal radiation, free cooling
1. Introduction Replacing the use of fossil fuels with renewable
energy is one of the most commonplace targets of
today’s energy policy. This process has created a
turnaround in the HVAC equipment market, as
products emerged which stand out with providing
great performance with lower needs of primary
energy. Engineers, builders and end-users face new
developments every year when attending international
fairs, which are often entirely dedicated to systems
based on renewable energy use. Unfortunately, in
many cases, high capital costs and the lack of stately
funding prevent several investors from sustainable
systems. For every green HVAC system predicted
payback periods therefore are crucially important, as
investors tend to consider these as the basis of
decision. Low capital costs and reliable energy
production at the same time are the key factors in the
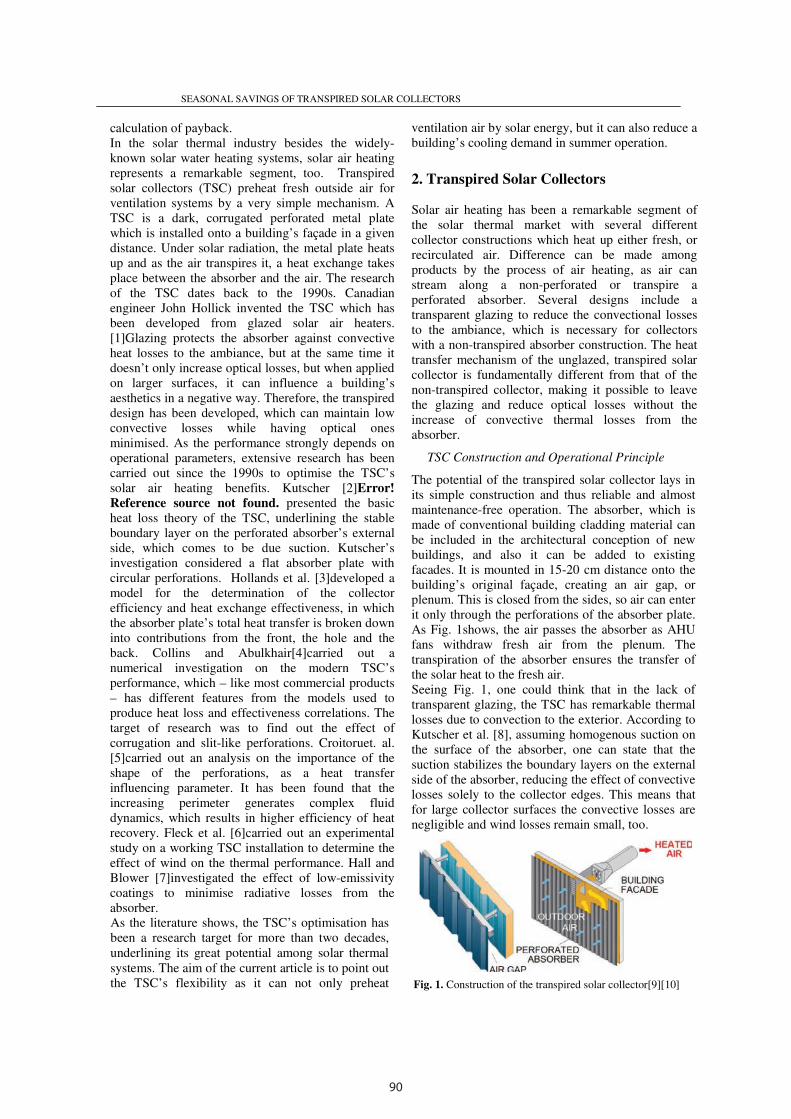
90
SEASONAL SAVINGS OF TRANSPIRED SOLAR COLLECTORS
2
calculation of payback.
In the solar thermal industry besides the widely-
known solar water heating systems, solar air heating
represents a remarkable segment, too. Transpired
solar collectors (TSC) preheat fresh outside air for
ventilation systems by a very simple mechanism. A
TSC is a dark, corrugated perforated metal plate
which is installed onto a building’s façade in a given
distance. Under solar radiation, the metal plate heats
up and as the air transpires it, a heat exchange takes
place between the absorber and the air. The research
of the TSC dates back to the 1990s. Canadian
engineer John Hollick invented the TSC which has
been developed from glazed solar air heaters.
[1]Glazing protects the absorber against convective
heat losses to the ambiance, but at the same time it
doesn’t only increase optical losses, but when applied
on larger surfaces, it can influence a building’s
aesthetics in a negative way. Therefore, the transpired
design has been developed, which can maintain low
convective losses while having optical ones
minimised. As the performance strongly depends on
operational parameters, extensive research has been
carried out since the 1990s to optimise the TSC’s
solar air heating benefits. Kutscher [2]Error!
Reference source not found. presented the basic
heat loss theory of the TSC, underlining the stable
boundary layer on the perforated absorber’s external
side, which comes to be due suction. Kutscher’s
investigation considered a flat absorber plate with
circular perforations. Hollands et al. [3]developed a
model for the determination of the collector
efficiency and heat exchange effectiveness, in which
the absorber plate’s total heat transfer is broken down
into contributions from the front, the hole and the
back. Collins and Abulkhair[4]carried out a
numerical investigation on the modern TSC’s
performance, which – like most commercial products
– has different features from the models used to
produce heat loss and effectiveness correlations. The
target of research was to find out the effect of
corrugation and slit-like perforations. Croitoruet. al.
[5]carried out an analysis on the importance of the
shape of the perforations, as a heat transfer
influencing parameter. It has been found that the
increasing perimeter generates complex fluid
dynamics, which results in higher efficiency of heat
recovery. Fleck et al. [6]carried out an experimental
study on a working TSC installation to determine the
effect of wind on the thermal performance. Hall and
Blower [7]investigated the effect of low-emissivity
coatings to minimise radiative losses from the
absorber. As the literature shows, the TSC’s optimisation has
been a research target for more than two decades,
underlining its great potential among solar thermal
systems. The aim of the current article is to point out
the TSC’s flexibility as it can not only preheat
ventilation air by solar energy, but it can also reduce a
building’s cooling demand in summer operation.
2. Transpired Solar Collectors
Solar air heating has been a remarkable segment of
the solar thermal market with several different
collector constructions which heat up either fresh, or
recirculated air. Difference can be made among
products by the process of air heating, as air can
stream along a non-perforated or transpire a
perforated absorber. Several designs include a
transparent glazing to reduce the convectional losses
to the ambiance, which is necessary for collectors
with a non-transpired absorber construction. The heat
transfer mechanism of the unglazed, transpired solar
collector is fundamentally different from that of the
non-transpired collector, making it possible to leave
the glazing and reduce optical losses without the
increase of convective thermal losses from the
absorber.
TSC Construction and Operational Principle
The potential of the transpired solar collector lays in
its simple construction and thus reliable and almost
maintenance-free operation. The absorber, which is
made of conventional building cladding material can
be included in the architectural conception of new
buildings, and also it can be added to existing
facades. It is mounted in 15-20 cm distance onto the
building’s original façade, creating an air gap, or plenum. This is closed from the sides, so air can enter
it only through the perforations of the absorber plate.
As Fig. 1shows, the air passes the absorber as AHU
fans withdraw fresh air from the plenum. The
transpiration of the absorber ensures the transfer of
the solar heat to the fresh air.
Seeing Fig. 1, one could think that in the lack of
transparent glazing, the TSC has remarkable thermal
losses due to convection to the exterior. According to
Kutscher et al. [8], assuming homogenous suction on
the surface of the absorber, one can state that the
suction stabilizes the boundary layers on the external
side of the absorber, reducing the effect of convective
losses solely to the collector edges. This means that
for large collector surfaces the convective losses are
negligible and wind losses remain small, too.
Fig. 1. Construction of the transpired solar collector[9][10]
SEASONAL SAVINGS OF TRANSPIRED SOLAR COLLECTORS
3
Parameters for Reliable Operation
However, significant convective and wind heat
losses can occur, if the collector is not designed or
operated optimally. Kutscher et al. [11]describe that
to ensure little impact of wind:
• the suction face velocity should be
preferably 0.04-0.05 m/s, but at least 0.02
m/s,
• at least 25 Pa pressure drop is to be obtained
across the perforated plate, and
• the wall should be designed to have uniform
flow through itself.
Fig.2.Temperature rise at different flow rates with variance
of minimal, low and medium wind speeds[13]
Generally speaking, high-flow TSC systems
perform much better than low flow ones, as the
efficiency can reach its highest values when high
flow is cooling the absorber, utilising the most of its
heat. Kumar and Leon [12]laid down a
mathematical model for the description of a TSC’s
thermal performance, in which collector efficiency
is defined as
, ∙ , ∙ ,
∙ (1)
whereas the heat exchange effectiveness is
, (2)
With rising flow the heat exchange effectiveness
drops, as the air cannot reach as high temperatures,
as if lower heat flow would transpire the plate. This
is illustrated inFig.2. However, the collector’s
efficiency increases with rising air flow, because the
absorber is being kept at a lower temperature, reducing all kinds of thermal losses.
In Fig.3 one can see that for a given wind speed the
collector efficiency only depends on the air flow
rate, which underlines the negligible impact of
convective losses depending on ambient
temperature.
A minimum of 25 Pa pressure drop is necessary
across the absorber to avoid the solar heated air
flowing out at regions with negative wind pressure.
So one can reach that the absorber is transpired
evenly and local hot regions do not come to be which
would worsen the collector’s efficiency. Ensuring
this minimal pressure drop speaks for keeping away
from low air-flow rates, too.
Fig.3. Efficiency versus air flow rates for various wind
speeds[13]
Considering these design aspects, it can be stated that
the TSC is generally a system for the preheating of
fresh ventilation air and not a heating system which
has to produce “ready-to-use” end temperatures itself.
Yet preheating reduces the heating demand
remarkably and shrinks the heating period of the
building. After careful design attention is to be paid
on the operation too, as the collector surface has been
defined for a certain fresh air demand, which resulted
in the exact definition of the aforementioned flow
rate in [m3/(m
2·h)]. The system operator has to be
aware of this, as eliminating air handling units or
reducing their air flow leads to the design criteria of
the TSC’s reliable operation not being fulfilled. In
contrast to a solar thermal system with liquid heat
transfer medium circulating in a closed primary
system, in which oversizing leads to higher solar
coverage and lower system efficiency, the beneficial
operation of a TSC system can be quickly made
impossible by oversizing.
3. Sources of TSC Benefits in Winter
For exploiting all the energy benefits a TSC system
can offer one has to know what building type it suits
the most. As due to the transpiration of the absorber,
the TSC heats up fresh ventilation air only, buildings
with high fresh air demand can benefit the most.
Industrial buildings offer large facades with low
glazing proportion, so vast surfaces are available for
TSC setup. The low glazing proportion would result
in low solar heat gain without the use of TSC. Some
technologies such as chemical, automotive and
rubber industries require very high amounts of fresh
ventilation air, which ensure the utilisation of the
solar heated fresh air. Eryener and Akhan [14]
reported on the performance analysis of the first
transpired solar collector installation in Turkey,
which was set up in 2012 on the south-facing wall of
an automotive manufacturing building with a total
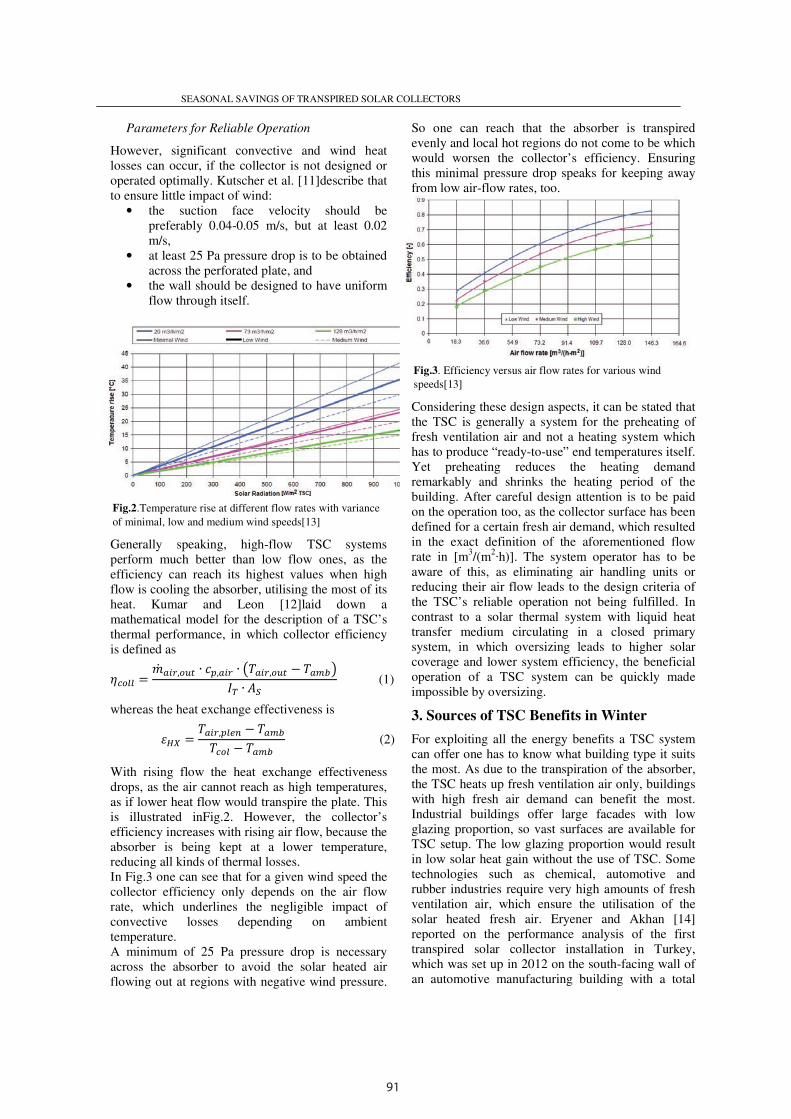
91
SEASONAL SAVINGS OF TRANSPIRED SOLAR COLLECTORS
2
calculation of payback.
In the solar thermal industry besides the widely-
known solar water heating systems, solar air heating
represents a remarkable segment, too. Transpired
solar collectors (TSC) preheat fresh outside air for
ventilation systems by a very simple mechanism. A
TSC is a dark, corrugated perforated metal plate
which is installed onto a building’s façade in a given
distance. Under solar radiation, the metal plate heats
up and as the air transpires it, a heat exchange takes
place between the absorber and the air. The research
of the TSC dates back to the 1990s. Canadian
engineer John Hollick invented the TSC which has
been developed from glazed solar air heaters.
[1]Glazing protects the absorber against convective
heat losses to the ambiance, but at the same time it
doesn’t only increase optical losses, but when applied
on larger surfaces, it can influence a building’s
aesthetics in a negative way. Therefore, the transpired
design has been developed, which can maintain low
convective losses while having optical ones
minimised. As the performance strongly depends on
operational parameters, extensive research has been
carried out since the 1990s to optimise the TSC’s
solar air heating benefits. Kutscher [2]Error!
Reference source not found. presented the basic
heat loss theory of the TSC, underlining the stable
boundary layer on the perforated absorber’s external
side, which comes to be due suction. Kutscher’s
investigation considered a flat absorber plate with
circular perforations. Hollands et al. [3]developed a
model for the determination of the collector
efficiency and heat exchange effectiveness, in which
the absorber plate’s total heat transfer is broken down
into contributions from the front, the hole and the
back. Collins and Abulkhair[4]carried out a
numerical investigation on the modern TSC’s
performance, which – like most commercial products
– has different features from the models used to
produce heat loss and effectiveness correlations. The
target of research was to find out the effect of
corrugation and slit-like perforations. Croitoruet. al.
[5]carried out an analysis on the importance of the
shape of the perforations, as a heat transfer
influencing parameter. It has been found that the
increasing perimeter generates complex fluid
dynamics, which results in higher efficiency of heat
recovery. Fleck et al. [6]carried out an experimental
study on a working TSC installation to determine the
effect of wind on the thermal performance. Hall and
Blower [7]investigated the effect of low-emissivity
coatings to minimise radiative losses from the
absorber. As the literature shows, the TSC’s optimisation has
been a research target for more than two decades,
underlining its great potential among solar thermal
systems. The aim of the current article is to point out
the TSC’s flexibility as it can not only preheat
ventilation air by solar energy, but it can also reduce a
building’s cooling demand in summer operation.
2. Transpired Solar Collectors
Solar air heating has been a remarkable segment of
the solar thermal market with several different
collector constructions which heat up either fresh, or
recirculated air. Difference can be made among
products by the process of air heating, as air can
stream along a non-perforated or transpire a
perforated absorber. Several designs include a
transparent glazing to reduce the convectional losses
to the ambiance, which is necessary for collectors
with a non-transpired absorber construction. The heat
transfer mechanism of the unglazed, transpired solar
collector is fundamentally different from that of the
non-transpired collector, making it possible to leave
the glazing and reduce optical losses without the
increase of convective thermal losses from the
absorber.
TSC Construction and Operational Principle
The potential of the transpired solar collector lays in
its simple construction and thus reliable and almost
maintenance-free operation. The absorber, which is
made of conventional building cladding material can
be included in the architectural conception of new
buildings, and also it can be added to existing
facades. It is mounted in 15-20 cm distance onto the
building’s original façade, creating an air gap, or plenum. This is closed from the sides, so air can enter
it only through the perforations of the absorber plate.
As Fig. 1shows, the air passes the absorber as AHU
fans withdraw fresh air from the plenum. The
transpiration of the absorber ensures the transfer of
the solar heat to the fresh air.
Seeing Fig. 1, one could think that in the lack of
transparent glazing, the TSC has remarkable thermal
losses due to convection to the exterior. According to
Kutscher et al. [8], assuming homogenous suction on
the surface of the absorber, one can state that the
suction stabilizes the boundary layers on the external
side of the absorber, reducing the effect of convective
losses solely to the collector edges. This means that
for large collector surfaces the convective losses are
negligible and wind losses remain small, too.
Fig. 1. Construction of the transpired solar collector[9][10]
SEASONAL SAVINGS OF TRANSPIRED SOLAR COLLECTORS
3
Parameters for Reliable Operation
However, significant convective and wind heat
losses can occur, if the collector is not designed or
operated optimally. Kutscher et al. [11]describe that
to ensure little impact of wind:
• the suction face velocity should be
preferably 0.04-0.05 m/s, but at least 0.02
m/s,
• at least 25 Pa pressure drop is to be obtained
across the perforated plate, and
• the wall should be designed to have uniform
flow through itself.
Fig.2.Temperature rise at different flow rates with variance
of minimal, low and medium wind speeds[13]
Generally speaking, high-flow TSC systems
perform much better than low flow ones, as the
efficiency can reach its highest values when high
flow is cooling the absorber, utilising the most of its
heat. Kumar and Leon [12]laid down a
mathematical model for the description of a TSC’s
thermal performance, in which collector efficiency
is defined as
, ∙ , ∙ ,
∙ (1)
whereas the heat exchange effectiveness is
, (2)
With rising flow the heat exchange effectiveness
drops, as the air cannot reach as high temperatures,
as if lower heat flow would transpire the plate. This
is illustrated inFig.2. However, the collector’s
efficiency increases with rising air flow, because the
absorber is being kept at a lower temperature, reducing all kinds of thermal losses.
In Fig.3 one can see that for a given wind speed the
collector efficiency only depends on the air flow
rate, which underlines the negligible impact of
convective losses depending on ambient
temperature.
A minimum of 25 Pa pressure drop is necessary
across the absorber to avoid the solar heated air
flowing out at regions with negative wind pressure.
So one can reach that the absorber is transpired
evenly and local hot regions do not come to be which
would worsen the collector’s efficiency. Ensuring
this minimal pressure drop speaks for keeping away
from low air-flow rates, too.
Fig.3. Efficiency versus air flow rates for various wind
speeds[13]
Considering these design aspects, it can be stated that
the TSC is generally a system for the preheating of
fresh ventilation air and not a heating system which
has to produce “ready-to-use” end temperatures itself.
Yet preheating reduces the heating demand
remarkably and shrinks the heating period of the
building. After careful design attention is to be paid
on the operation too, as the collector surface has been
defined for a certain fresh air demand, which resulted
in the exact definition of the aforementioned flow
rate in [m3/(m
2·h)]. The system operator has to be
aware of this, as eliminating air handling units or
reducing their air flow leads to the design criteria of
the TSC’s reliable operation not being fulfilled. In
contrast to a solar thermal system with liquid heat
transfer medium circulating in a closed primary
system, in which oversizing leads to higher solar
coverage and lower system efficiency, the beneficial
operation of a TSC system can be quickly made
impossible by oversizing.
3. Sources of TSC Benefits in Winter
For exploiting all the energy benefits a TSC system
can offer one has to know what building type it suits
the most. As due to the transpiration of the absorber,
the TSC heats up fresh ventilation air only, buildings
with high fresh air demand can benefit the most.
Industrial buildings offer large facades with low
glazing proportion, so vast surfaces are available for
TSC setup. The low glazing proportion would result
in low solar heat gain without the use of TSC. Some
technologies such as chemical, automotive and
rubber industries require very high amounts of fresh
ventilation air, which ensure the utilisation of the
solar heated fresh air. Eryener and Akhan [14]
reported on the performance analysis of the first
transpired solar collector installation in Turkey,
which was set up in 2012 on the south-facing wall of
an automotive manufacturing building with a total
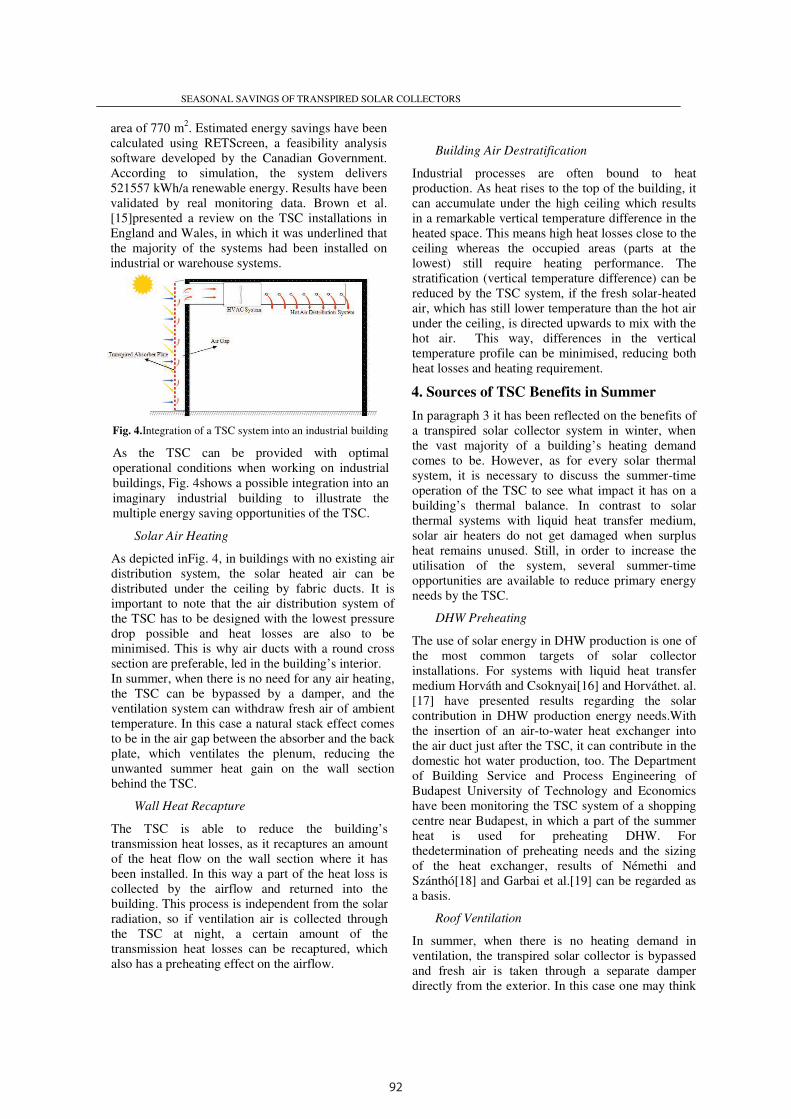
92
SEASONAL SAVINGS OF TRANSPIRED SOLAR COLLECTORS
area of 770 m2. Estimated energy savings have bee
calculated using RETScreen, a feasibility analysis
software developed by the Canadian Government.
According to simulation, the system delivers
521557 kWh/a renewable energy. Results have been
validated by real monitoring data. Brown et al.
[15]presented a review on the TSC installations in
England and Wales, in which it was underlined that
the majority of the systems had been installed on
industrial or warehouse systems.
Fig. 4.Integration of a TSC system into an industrial building
As the TSC can be provided with optimal
operational conditions when working on industrial
buildings, Fig. 4shows a possible integration into an
imaginary industrial building to illustrate the
multiple energy saving opportunities of the TSC.
Solar Air Heating
As depicted inFig. 4, in buildings with no
distribution system, the solar heated air can be
distributed under the ceiling by fabric ducts. It is
important to note that the air distribution system of
the TSC has to be designed with the lowest pressure
drop possible and heat losses are
minimised. This is why air ducts with a round cross
section are preferable, led in the building’s interior.
In summer, when there is no need for any air heating,
the TSC can be bypassed by a damper, and the
ventilation system can withdraw fresh
temperature. In this case a natural stack effect comes
to be in the air gap between the absorber and the back
plate, which ventilates the plenum, reducing the
unwanted summer heat gain on the wall section
behind the TSC.
Wall Heat Recapture
The TSC is able to reduce the building’s
transmission heat losses, as it recaptures an amount
of the heat flow on the wall section where it has
been installed. In this way a part of the heat loss is
collected by the airflow and returned into the
building. This process is independent from the solar
radiation, so if ventilation air is collected through
the TSC at night, a certain amount of the
transmission heat losses can be recaptured, which
also has a preheating effect on the airflow.
SEASONAL SAVINGS OF TRANSPIRED SOLAR COLLECTORS
. Estimated energy savings have been
feasibility analysis
software developed by the Canadian Government.
According to simulation, the system delivers
a renewable energy. Results have been
validated by real monitoring data. Brown et al.
presented a review on the TSC installations in
it was underlined that
the majority of the systems had been installed on
Integration of a TSC system into an industrial building
As the TSC can be provided with optimal
operational conditions when working on industrial
shows a possible integration into an
ry industrial building to illustrate the
multiple energy saving opportunities of the TSC.
, in buildings with no existing air
distribution system, the solar heated air can be
distributed under the ceiling by fabric ducts. It is
important to note that the air distribution system of
the TSC has to be designed with the lowest pressure
drop possible and heat losses are also to be
minimised. This is why air ducts with a round cross
section are preferable, led in the building’s interior.
In summer, when there is no need for any air heating,
the TSC can be bypassed by a damper, and the
ventilation system can withdraw fresh air of ambient
temperature. In this case a natural stack effect comes
to be in the air gap between the absorber and the back
plate, which ventilates the plenum, reducing the
unwanted summer heat gain on the wall section
The TSC is able to reduce the building’s
transmission heat losses, as it recaptures an amount
of the heat flow on the wall section where it has
been installed. In this way a part of the heat loss is
collected by the airflow and returned into the
This process is independent from the solar
radiation, so if ventilation air is collected through
the TSC at night, a certain amount of the
transmission heat losses can be recaptured, which
also has a preheating effect on the airflow.
Building Air Destratification
Industrial processes are often bound to heat
production. As heat rises to the top of the building, it
can accumulate under the high ceiling which results
in a remarkable vertical temperature difference in the
heated space. This means high heat losses close to the
ceiling whereas the occupied areas (parts at the
lowest) still require heating performance. The
stratification (vertical temperature difference) can be
reduced by the TSC system, if the fresh solar
air, which has still lower temperature than the hot air
under the ceiling, is directed upwards to mix with the
hot air. This way, differences in the vertical
temperature profile can be minimised, reducing both
heat losses and heating requirement
4. Sources of TSC Benefits in Summer
In paragraph 3 it has been reflected on the benefits of
a transpired solar collector system in winter, when
the vast majority of a building’s heating demand
comes to be. However, as for every solar thermal
system, it is necessary to discuss the summer
operation of the TSC to see what impact it has on a
building’s thermal balance. In contrast to
thermal systems with liquid heat transfer medium,
solar air heaters do not get damaged when surplus
heat remains unused. Still, in order to increase the
utilisation of the system, several
opportunities are available to reduce primary energy
needs by the TSC.
DHW Preheating
The use of solar energy in DHW production is one of
the most common targets of solar collector
installations. For systems with liquid heat transfer
medium Horváth and Csoknyai[16]
[17] have presented results regarding the solar
contribution in DHW production energy needs.
the insertion of an air-to-water heat exchanger
the air duct just after the TSC, it can contribute in the
domestic hot water production, too. The Department
of Building Service and Process Engineering of
Budapest University of Technology and Economics
have been monitoring the TSC system of a
centre near Budapest, in which a part of the summer
heat is used for preheating DHW. For
thedetermination of preheating needs and the sizing
of the heat exchanger, results of Némethi and
Szánthó[18] and Garbai et al.[19]
a basis.
Roof Ventilation
In summer, when there is no heating demand
ventilation, the transpired solar collector
and fresh air is taken through a separate damper
directly from the exterior. In this case one may think 4
Industrial processes are often bound to heat
production. As heat rises to the top of the building, it
can accumulate under the high ceiling which results
in a remarkable vertical temperature difference in the
heat losses close to the
ceiling whereas the occupied areas (parts at the
lowest) still require heating performance. The
stratification (vertical temperature difference) can be
reduced by the TSC system, if the fresh solar-heated
temperature than the hot air
under the ceiling, is directed upwards to mix with the
hot air. This way, differences in the vertical
temperature profile can be minimised, reducing both
losses and heating requirement.
Sources of TSC Benefits in Summer
it has been reflected on the benefits of
a transpired solar collector system in winter, when
the vast majority of a building’s heating demand
o be. However, as for every solar thermal
necessary to discuss the summer-time
operation of the TSC to see what impact it has on a
In contrast to solar
thermal systems with liquid heat transfer medium,
aters do not get damaged when surplus
heat remains unused. Still, in order to increase the
utilisation of the system, several summer-time
available to reduce primary energy
production is one of
the most common targets of solar collector
For systems with liquid heat transfer
[16] and Horváthet. al.
have presented results regarding the solar
contribution in DHW production energy needs.With
water heat exchanger into
can contribute in the
r production, too. The Department
of Building Service and Process Engineering of
Budapest University of Technology and Economics
been monitoring the TSC system of a shopping
Budapest, in which a part of the summer
ating DHW. For
determination of preheating needs and the sizing
of the heat exchanger, results of Némethi and
can be regarded as
In summer, when there is no heating demand in
transpired solar collector is bypassed
and fresh air is taken through a separate damper
directly from the exterior. In this case one may think
SEASONAL SAVINGS OF TRANSPIRED SOLAR COLLECTORS
5
that the TSC means extra cooling loads through the
building envelope, as it gets hot under solar
radiation. However, this is not the case, as natural
ventilation develops in the air gap between the
perforated absorber and the actual building wall,
decoupling the solar loads from the interior. This
way the TSC significantly reduces the thermal loads
in summer, minimising the cooling energy demand.
In industrial buildings with large roof areas of low
inclination a remarkable amount of the summer
cooling load is solar gain through the roof. Roof
temperatures can reach up to 70-75°C under solar
radiation, if Central-Eastern European conditions
are considered. By applying TSC on the roof, the
natural ventilation through the perforations and in
the plenum can reduce this load significantly by
minimising the heating up of the actual building
roof. To find out its extent, joint co-operation
between Trakya University and Budapest University
of Technology and Economics have been
established. A mathematical model describing the
phenomenon is being developed. To validate this, a
measurement setup of 5 m2 commercially available
TSC is used.
Nocturnal Radiant Cooling
In buildings with heavy structure mass cooling load
can be moderated by night ventilation. In the course
of this, outdoor air is made stream in the building
either in mechanical or natural way. The cooler
outdoor air cools down the building mass to some
extent, reducing the peak air conditioning load of
the following day. However, the highest air-
conditioning loads are to be obtained at locations
where temperatures do not drop enough at night to
realise efficient night ventilation. Hollick[20]
reported on the cooling down of sky-facing TSC
surfaces due to longwave radiation to the sky.
Depending on location and weather conditions, the
surface can cool down 6-20 K below ambient [20].
Low-pitch roofs with TSC can increase the effect of
night ventilation if ambient air is further cooled
when transpiring the cold perforated plate. The
more exact characterisation of this effect is a target
of the co-operation between Trakya University and
Budapest University of Technology and Economics,
too.
5. Conclusions
Transpired solar collectors represent a cost-
effective alternative in solar air heating technology,
due to their low capital costs and almost
maintenance-free operation. To reach optimal
operation and thus low payback periods, it is
essential to design and operate the system in a
conceived manner. This way, the system offers
multiple sources of energy savings, which can make
it particularly attractive for building service
designers, operators and investors.
References
[1] Hollick, JC: Unglazed Solar Wall Air Heaters. Renewable Energy, Vol. 5. Part I. pp. 415-421, 1994
[2] Kutscher CF: An Investigation of Heat Transfer for Air Flow through Low Porosity Perforated Plates. Doctoral thesis, University of Colorado, 1992
[3] Hollands KGT, Van Decker GWE, Brunger AP: Heat-exchange Relations for Unglazed Transpired Solar Collectors with Circular Holes on a Square or Triangular Pitch. Solar Energy Vol.71, No. 1, pp. 33-45, 2001
[4] Collins MR, Abulkhair H: An Evaluation of Heat Transfer and Effectiveness for Unglazed Transpired Solar Air Heaters. Solar Energy 99 (2014) 231-245.
[5] Croitoru CV, Nastase A, Bode FI, Meslem A: Thermodynamic Investigation on an Innovative Unglazed Transpired Solar Collector. Solar Energy 131 (2016) 21-29.
[6] Fleck BA, Meier RM, Matovic MD: A Field Study of the Wind Effects on the Performance of an Unglazed Transpired Solar Collector. Solar Energy Vol. 73, No. 3, pp. 209-216, 2002.
[7] Hall R, Blower J: Low-Emissivity Transpired Solar Collectors. Energy Procedia 91, June 2016, pp 56-63
[8] Kutscher CF, Christensen CB, Barker GM: Unglazed Transpired Solar Collectors: Heat Loss Theory. Journal of Solar Energy Engineering, Vol. 115, August 1993, pp. 182-188.
[9] http://tatproddel.tat.cloud.opentext.com/static_files/Images_new/Construction/about_us/new_panels/envelope/trsiomet-sc-solar-collector-build-up.jpg
[10] http://solarairheating.org/media/transpired-collector.gif
[11] Kutscher CF, Christensen CB, Gawlik K: Letter to the Editor of Solar Energy in response to “A Field Study of the Wind Effects on the Performance of an Unglazed Transpired Solar Collector. Solar Energy 74 (2003) 353-354.
[12] Kumar S, Leon MA: Mathematical Modelling and Thermal Performance Analysis of Unglazed Transpired Solar Collectors. Solar Energy 81 (2007) 62-75.
[13] http://sahwia.org/wp-content/uploads/2013/02/1001-SolarAMark_Conserval_Solar Wall.pdf
[14] Eryener D, Akhan H: The Performance of the First Transpired Solar Collector Installation in Turkey. Energy Procedia 91 (2016) 442-449
[15] Brown C, Perisoglou E, Hall R, Stevenson V: Transpired Solar Collector Installations in Wales and England. Energy Procedia 48 (2014) 18-27.
[16] Horváth M, Csoknyai T: Maximal and Optimal DHW Production with Solar Collectors for Single Family Houses. EXPRES 2015 Subotica, 7th International Symposium on Exploitation of Renewable Energy Sources and Efficiency. Subotica, Serbia, 2015
[17] Horváth M, Hrabovszky-Horváth S, Csoknyai T: Parametric Analysis of Solar Hot Water Production in “Commie-block” Buildings. Energy (IYCE), 2015 5th International Youth Conference on. Pisa, Italy, 2015
[18] Némethi B, Szánthó Z: Measurement Study on Demand of Domestic Hot Water in Residential Buildings; Proceedings of the 2nd IASME/WSEAS International Conference on Energy & Environment, p68-73.; Portorose, Slovenia, 15-17.05.2007.; ISSN:1790-5095
[19] Garbai L, Jasper A, Magyar Z: Probability theory description of domestic hot water and heating demands; Energy and Buildings 75 (2014) p.483-492
[20] Hollick J: Nocturnal Radiation Cooling Tests. Energy Procedia 30 (2012) 930-936.
[21] Petráš D, Lulkovičová O, Takács J, Füri B.: Obnoviteľ nézdroje energiena vykurovanie. In: Vykurovanie rodinných a bytových domov. Bratislava: Jaga, 2005. p. 193 – 217, ISBN 80-8076-012-8.
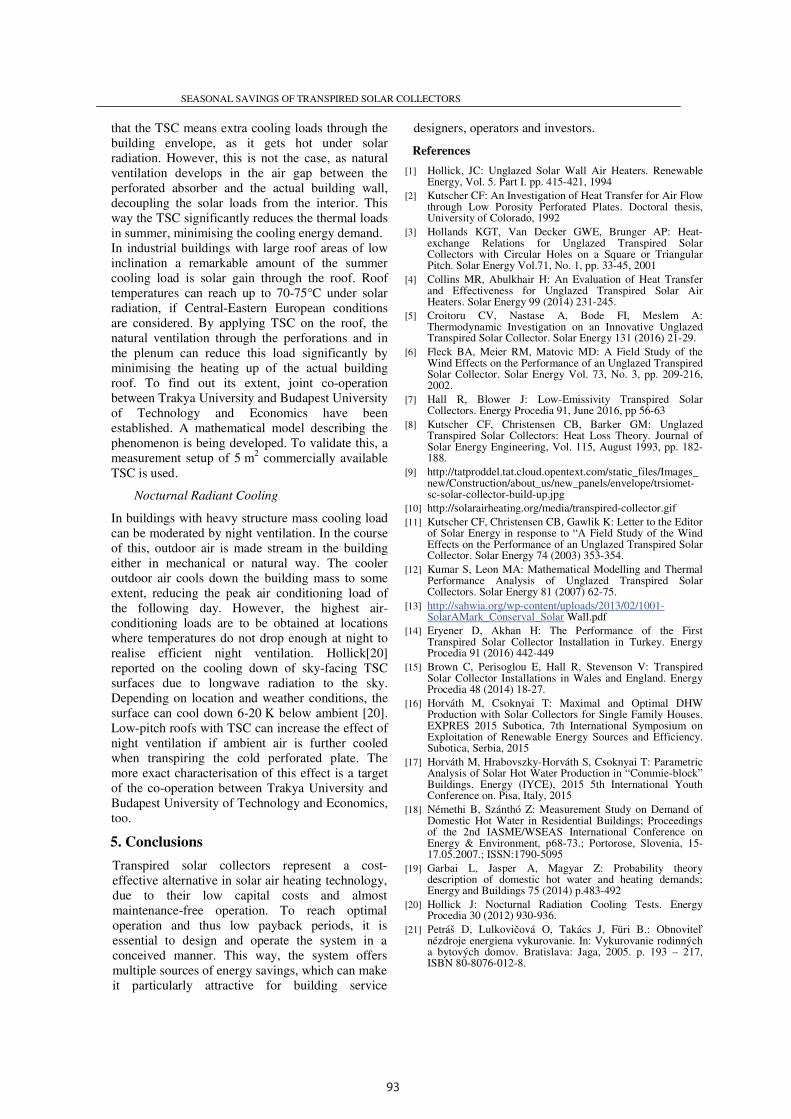
93
SEASONAL SAVINGS OF TRANSPIRED SOLAR COLLECTORS
area of 770 m2. Estimated energy savings have bee
calculated using RETScreen, a feasibility analysis
software developed by the Canadian Government.
According to simulation, the system delivers
521557 kWh/a renewable energy. Results have been
validated by real monitoring data. Brown et al.
[15]presented a review on the TSC installations in
England and Wales, in which it was underlined that
the majority of the systems had been installed on
industrial or warehouse systems.
Fig. 4.Integration of a TSC system into an industrial building
As the TSC can be provided with optimal
operational conditions when working on industrial
buildings, Fig. 4shows a possible integration into an
imaginary industrial building to illustrate the
multiple energy saving opportunities of the TSC.
Solar Air Heating
As depicted inFig. 4, in buildings with no
distribution system, the solar heated air can be
distributed under the ceiling by fabric ducts. It is
important to note that the air distribution system of
the TSC has to be designed with the lowest pressure
drop possible and heat losses are
minimised. This is why air ducts with a round cross
section are preferable, led in the building’s interior.
In summer, when there is no need for any air heating,
the TSC can be bypassed by a damper, and the
ventilation system can withdraw fresh
temperature. In this case a natural stack effect comes
to be in the air gap between the absorber and the back
plate, which ventilates the plenum, reducing the
unwanted summer heat gain on the wall section
behind the TSC.
Wall Heat Recapture
The TSC is able to reduce the building’s
transmission heat losses, as it recaptures an amount
of the heat flow on the wall section where it has
been installed. In this way a part of the heat loss is
collected by the airflow and returned into the
building. This process is independent from the solar
radiation, so if ventilation air is collected through
the TSC at night, a certain amount of the
transmission heat losses can be recaptured, which
also has a preheating effect on the airflow.
SEASONAL SAVINGS OF TRANSPIRED SOLAR COLLECTORS
. Estimated energy savings have been
feasibility analysis
software developed by the Canadian Government.
According to simulation, the system delivers
a renewable energy. Results have been
validated by real monitoring data. Brown et al.
presented a review on the TSC installations in
it was underlined that
the majority of the systems had been installed on
Integration of a TSC system into an industrial building
As the TSC can be provided with optimal
operational conditions when working on industrial
shows a possible integration into an
ry industrial building to illustrate the
multiple energy saving opportunities of the TSC.
, in buildings with no existing air
distribution system, the solar heated air can be
distributed under the ceiling by fabric ducts. It is
important to note that the air distribution system of
the TSC has to be designed with the lowest pressure
drop possible and heat losses are also to be
minimised. This is why air ducts with a round cross
section are preferable, led in the building’s interior.
In summer, when there is no need for any air heating,
the TSC can be bypassed by a damper, and the
ventilation system can withdraw fresh air of ambient
temperature. In this case a natural stack effect comes
to be in the air gap between the absorber and the back
plate, which ventilates the plenum, reducing the
unwanted summer heat gain on the wall section
The TSC is able to reduce the building’s
transmission heat losses, as it recaptures an amount
of the heat flow on the wall section where it has
been installed. In this way a part of the heat loss is
collected by the airflow and returned into the
This process is independent from the solar
radiation, so if ventilation air is collected through
the TSC at night, a certain amount of the
transmission heat losses can be recaptured, which
also has a preheating effect on the airflow.
Building Air Destratification
Industrial processes are often bound to heat
production. As heat rises to the top of the building, it
can accumulate under the high ceiling which results
in a remarkable vertical temperature difference in the
heated space. This means high heat losses close to the
ceiling whereas the occupied areas (parts at the
lowest) still require heating performance. The
stratification (vertical temperature difference) can be
reduced by the TSC system, if the fresh solar
air, which has still lower temperature than the hot air
under the ceiling, is directed upwards to mix with the
hot air. This way, differences in the vertical
temperature profile can be minimised, reducing both
heat losses and heating requirement
4. Sources of TSC Benefits in Summer
In paragraph 3 it has been reflected on the benefits of
a transpired solar collector system in winter, when
the vast majority of a building’s heating demand
comes to be. However, as for every solar thermal
system, it is necessary to discuss the summer
operation of the TSC to see what impact it has on a
building’s thermal balance. In contrast to
thermal systems with liquid heat transfer medium,
solar air heaters do not get damaged when surplus
heat remains unused. Still, in order to increase the
utilisation of the system, several
opportunities are available to reduce primary energy
needs by the TSC.
DHW Preheating
The use of solar energy in DHW production is one of
the most common targets of solar collector
installations. For systems with liquid heat transfer
medium Horváth and Csoknyai[16]
[17] have presented results regarding the solar
contribution in DHW production energy needs.
the insertion of an air-to-water heat exchanger
the air duct just after the TSC, it can contribute in the
domestic hot water production, too. The Department
of Building Service and Process Engineering of
Budapest University of Technology and Economics
have been monitoring the TSC system of a
centre near Budapest, in which a part of the summer
heat is used for preheating DHW. For
thedetermination of preheating needs and the sizing
of the heat exchanger, results of Némethi and
Szánthó[18] and Garbai et al.[19]
a basis.
Roof Ventilation
In summer, when there is no heating demand
ventilation, the transpired solar collector
and fresh air is taken through a separate damper
directly from the exterior. In this case one may think 4
Industrial processes are often bound to heat
production. As heat rises to the top of the building, it
can accumulate under the high ceiling which results
in a remarkable vertical temperature difference in the
heat losses close to the
ceiling whereas the occupied areas (parts at the
lowest) still require heating performance. The
stratification (vertical temperature difference) can be
reduced by the TSC system, if the fresh solar-heated
temperature than the hot air
under the ceiling, is directed upwards to mix with the
hot air. This way, differences in the vertical
temperature profile can be minimised, reducing both
losses and heating requirement.
Sources of TSC Benefits in Summer
it has been reflected on the benefits of
a transpired solar collector system in winter, when
the vast majority of a building’s heating demand
o be. However, as for every solar thermal
necessary to discuss the summer-time
operation of the TSC to see what impact it has on a
In contrast to solar
thermal systems with liquid heat transfer medium,
aters do not get damaged when surplus
heat remains unused. Still, in order to increase the
utilisation of the system, several summer-time
available to reduce primary energy
production is one of
the most common targets of solar collector
For systems with liquid heat transfer
[16] and Horváthet. al.
have presented results regarding the solar
contribution in DHW production energy needs.With
water heat exchanger into
can contribute in the
r production, too. The Department
of Building Service and Process Engineering of
Budapest University of Technology and Economics
been monitoring the TSC system of a shopping
Budapest, in which a part of the summer
ating DHW. For
determination of preheating needs and the sizing
of the heat exchanger, results of Némethi and
can be regarded as
In summer, when there is no heating demand in
transpired solar collector is bypassed
and fresh air is taken through a separate damper
directly from the exterior. In this case one may think
SEASONAL SAVINGS OF TRANSPIRED SOLAR COLLECTORS
5
that the TSC means extra cooling loads through the
building envelope, as it gets hot under solar
radiation. However, this is not the case, as natural
ventilation develops in the air gap between the
perforated absorber and the actual building wall,
decoupling the solar loads from the interior. This
way the TSC significantly reduces the thermal loads
in summer, minimising the cooling energy demand.
In industrial buildings with large roof areas of low
inclination a remarkable amount of the summer
cooling load is solar gain through the roof. Roof
temperatures can reach up to 70-75°C under solar
radiation, if Central-Eastern European conditions
are considered. By applying TSC on the roof, the
natural ventilation through the perforations and in
the plenum can reduce this load significantly by
minimising the heating up of the actual building
roof. To find out its extent, joint co-operation
between Trakya University and Budapest University
of Technology and Economics have been
established. A mathematical model describing the
phenomenon is being developed. To validate this, a
measurement setup of 5 m2 commercially available
TSC is used.
Nocturnal Radiant Cooling
In buildings with heavy structure mass cooling load
can be moderated by night ventilation. In the course
of this, outdoor air is made stream in the building
either in mechanical or natural way. The cooler
outdoor air cools down the building mass to some
extent, reducing the peak air conditioning load of
the following day. However, the highest air-
conditioning loads are to be obtained at locations
where temperatures do not drop enough at night to
realise efficient night ventilation. Hollick[20]
reported on the cooling down of sky-facing TSC
surfaces due to longwave radiation to the sky.
Depending on location and weather conditions, the
surface can cool down 6-20 K below ambient [20].
Low-pitch roofs with TSC can increase the effect of
night ventilation if ambient air is further cooled
when transpiring the cold perforated plate. The
more exact characterisation of this effect is a target
of the co-operation between Trakya University and
Budapest University of Technology and Economics,
too.
5. Conclusions
Transpired solar collectors represent a cost-
effective alternative in solar air heating technology,
due to their low capital costs and almost
maintenance-free operation. To reach optimal
operation and thus low payback periods, it is
essential to design and operate the system in a
conceived manner. This way, the system offers
multiple sources of energy savings, which can make
it particularly attractive for building service
designers, operators and investors.
References
[1] Hollick, JC: Unglazed Solar Wall Air Heaters. Renewable Energy, Vol. 5. Part I. pp. 415-421, 1994
[2] Kutscher CF: An Investigation of Heat Transfer for Air Flow through Low Porosity Perforated Plates. Doctoral thesis, University of Colorado, 1992
[3] Hollands KGT, Van Decker GWE, Brunger AP: Heat-exchange Relations for Unglazed Transpired Solar Collectors with Circular Holes on a Square or Triangular Pitch. Solar Energy Vol.71, No. 1, pp. 33-45, 2001
[4] Collins MR, Abulkhair H: An Evaluation of Heat Transfer and Effectiveness for Unglazed Transpired Solar Air Heaters. Solar Energy 99 (2014) 231-245.
[5] Croitoru CV, Nastase A, Bode FI, Meslem A: Thermodynamic Investigation on an Innovative Unglazed Transpired Solar Collector. Solar Energy 131 (2016) 21-29.
[6] Fleck BA, Meier RM, Matovic MD: A Field Study of the Wind Effects on the Performance of an Unglazed Transpired Solar Collector. Solar Energy Vol. 73, No. 3, pp. 209-216, 2002.
[7] Hall R, Blower J: Low-Emissivity Transpired Solar Collectors. Energy Procedia 91, June 2016, pp 56-63
[8] Kutscher CF, Christensen CB, Barker GM: Unglazed Transpired Solar Collectors: Heat Loss Theory. Journal of Solar Energy Engineering, Vol. 115, August 1993, pp. 182-188.
[9] http://tatproddel.tat.cloud.opentext.com/static_files/Images_new/Construction/about_us/new_panels/envelope/trsiomet-sc-solar-collector-build-up.jpg
[10] http://solarairheating.org/media/transpired-collector.gif
[11] Kutscher CF, Christensen CB, Gawlik K: Letter to the Editor of Solar Energy in response to “A Field Study of the Wind Effects on the Performance of an Unglazed Transpired Solar Collector. Solar Energy 74 (2003) 353-354.
[12] Kumar S, Leon MA: Mathematical Modelling and Thermal Performance Analysis of Unglazed Transpired Solar Collectors. Solar Energy 81 (2007) 62-75.
[13] http://sahwia.org/wp-content/uploads/2013/02/1001-SolarAMark_Conserval_Solar Wall.pdf
[14] Eryener D, Akhan H: The Performance of the First Transpired Solar Collector Installation in Turkey. Energy Procedia 91 (2016) 442-449
[15] Brown C, Perisoglou E, Hall R, Stevenson V: Transpired Solar Collector Installations in Wales and England. Energy Procedia 48 (2014) 18-27.
[16] Horváth M, Csoknyai T: Maximal and Optimal DHW Production with Solar Collectors for Single Family Houses. EXPRES 2015 Subotica, 7th International Symposium on Exploitation of Renewable Energy Sources and Efficiency. Subotica, Serbia, 2015
[17] Horváth M, Hrabovszky-Horváth S, Csoknyai T: Parametric Analysis of Solar Hot Water Production in “Commie-block” Buildings. Energy (IYCE), 2015 5th International Youth Conference on. Pisa, Italy, 2015
[18] Némethi B, Szánthó Z: Measurement Study on Demand of Domestic Hot Water in Residential Buildings; Proceedings of the 2nd IASME/WSEAS International Conference on Energy & Environment, p68-73.; Portorose, Slovenia, 15-17.05.2007.; ISSN:1790-5095
[19] Garbai L, Jasper A, Magyar Z: Probability theory description of domestic hot water and heating demands; Energy and Buildings 75 (2014) p.483-492
[20] Hollick J: Nocturnal Radiation Cooling Tests. Energy Procedia 30 (2012) 930-936.
[21] Petráš D, Lulkovičová O, Takács J, Füri B.: Obnoviteľ nézdroje energiena vykurovanie. In: Vykurovanie rodinných a bytových domov. Bratislava: Jaga, 2005. p. 193 – 217, ISBN 80-8076-012-8.

94
SEASONAL SAVINGS OF TRANSPIRED SOLAR COLLECTORS
6
[22] Petráš D, Lulkovičová O, Takács J, Füri B: Obnoviteľ nézdroje energie pre nízkoteplotné systémy. Bratislava: Jaga Group, s.r.o., 2009. 221 s. ISBN 978-80-8076-075-5
[23] Takács J, Lulkovičová O, Füri B: Helyzetkép a megújuló energiaforrások hasznosítasi lehetöségeiről Szlovákiában In: Magyar Épületgépészet. - ISSN 1215-9913. – vol. 57, 12 (2008), s. 24-27
[24] Nyers J, Tomic S, Nyers Á: Economic Optimum of Thermal Insulating Layer for External Wall of Brick, Acta Polytechnica Hungarica 11: (7) pp. 209-222.
[25] Nyers J., Nyers A.: Hydraulic Analysis of Heat Pump's Heating Circuit using Mathematical Model, 9rd ICCC International Conference, Proceedings-USB, ISBN 978-1-4799-0061-9 pp 349-353, Tihany, Hungary. 04-08. 07. 2013.
Acknowledgements
An international co-operation between Trakya
University and Budapest University of Technology
and Economics to investigate TSC behaviour has
been funded by the “National Talent Program” of the
Hungarian Human Capacities Fund. For the support
that made a research semester at Trakya University
possible, author B. Bokor would thereby like to give
thanks to the Hungarian Ministry of Human
Capacities.
EXPRES 2017
ISBN 978-86-919769-1-0
Circular business model – effects on company’s energy efficiency and renewable energy use
S. TOMIĆ a, D. DELIĆ b, A. STOILJKOVIĆ c
Faculty of Economics, Universityof Novi Sad
24000 Subotica, Segedinski put 9-11, Serbia aE-mail:[email protected] bE-mail:[email protected]
cE-mail:[email protected]
In essence, a circular business model represents a fundamental alternative to linear business model.Circular business model
incorporate circular economy principles. In circular business models resources do not get lost or the loss is minimised. In this
paper, through the explanation of what are circular economy, sustainable business model and subsequently the circular business
model, weindicate how different approaches, archetypes or business model can affects company’s energy efficiency and
renewable energy use.
Key words: linear busiess model, circular business model, waste, energy
1. Introduction
Circularity is an approach which stands in contrast
to the linear, traditional production and consumption
(take – make – consume - dispose) pattern.
Circularity involves the joining up of the value
chain so that end-of-life products are reused as
inputs, and waste is utilized as a resource (material
or energy) wherever possible. Unlike the traditional
linear approach, a circular models (closed-loop,
cradle-to-cradle and similar) seek to respect
planetary boundaries through increasing the share of
renewable or recyclable resources while reducing
the consumption of raw materials and energy.At the
same time, circular models contribute to cutting
emissions and material losses. In order to better
understand circular business models and its effects
on company's resource efficiency, energy efficiency
and renewable energy use, it is necessary to explain
characteristics of linear and circular economy.
Lineareconomy currently predominates. It
is material and energy intensive way of
production; it relies on economies of scale and it
is based on the assumption that natural resources
are available, abundant, easy to source and
cheap to dispose of. But, it is not sustainable,
and in some cases exceeding planetary
boundaries [1].
In the current linear system, around 80%of
materials extracted and used for the production
end up in incinerators, landfill or wastewater [2].
Another financial and economic impact of note
in the linear economy is the associatedenergy
loss whenever materials are discarded
somewhere in the value chain [3].
Opportunities to increase resource effciency
in modern manufacturing processes still exist.
But the gains are largely incremental and

95
SEASONAL SAVINGS OF TRANSPIRED SOLAR COLLECTORS
6
[22] Petráš D, Lulkovičová O, Takács J, Füri B: Obnoviteľ nézdroje energie pre nízkoteplotné systémy. Bratislava: Jaga Group, s.r.o., 2009. 221 s. ISBN 978-80-8076-075-5
[23] Takács J, Lulkovičová O, Füri B: Helyzetkép a megújuló energiaforrások hasznosítasi lehetöségeiről Szlovákiában In: Magyar Épületgépészet. - ISSN 1215-9913. – vol. 57, 12 (2008), s. 24-27
[24] Nyers J, Tomic S, Nyers Á: Economic Optimum of Thermal Insulating Layer for External Wall of Brick, Acta Polytechnica Hungarica 11: (7) pp. 209-222.
[25] Nyers J., Nyers A.: Hydraulic Analysis of Heat Pump's Heating Circuit using Mathematical Model, 9rd ICCC International Conference, Proceedings-USB, ISBN 978-1-4799-0061-9 pp 349-353, Tihany, Hungary. 04-08. 07. 2013.
Acknowledgements
An international co-operation between Trakya
University and Budapest University of Technology
and Economics to investigate TSC behaviour has
been funded by the “National Talent Program” of the
Hungarian Human Capacities Fund. For the support
that made a research semester at Trakya University
possible, author B. Bokor would thereby like to give
thanks to the Hungarian Ministry of Human
Capacities.
EXPRES 2017
ISBN 978-86-919769-1-0
Circular business model – effects on company’s energy efficiency and renewable energy use
S. TOMIĆ a, D. DELIĆ b, A. STOILJKOVIĆ c
Faculty of Economics, Universityof Novi Sad
24000 Subotica, Segedinski put 9-11, Serbia aE-mail:[email protected] bE-mail:[email protected]
cE-mail:[email protected]
In essence, a circular business model represents a fundamental alternative to linear business model.Circular business model
incorporate circular economy principles. In circular business models resources do not get lost or the loss is minimised. In this
paper, through the explanation of what are circular economy, sustainable business model and subsequently the circular business
model, weindicate how different approaches, archetypes or business model can affects company’s energy efficiency and
renewable energy use.
Key words: linear busiess model, circular business model, waste, energy
1. Introduction
Circularity is an approach which stands in contrast
to the linear, traditional production and consumption
(take – make – consume - dispose) pattern.
Circularity involves the joining up of the value
chain so that end-of-life products are reused as
inputs, and waste is utilized as a resource (material
or energy) wherever possible. Unlike the traditional
linear approach, a circular models (closed-loop,
cradle-to-cradle and similar) seek to respect
planetary boundaries through increasing the share of
renewable or recyclable resources while reducing
the consumption of raw materials and energy.At the
same time, circular models contribute to cutting
emissions and material losses. In order to better
understand circular business models and its effects
on company's resource efficiency, energy efficiency
and renewable energy use, it is necessary to explain
characteristics of linear and circular economy.
Lineareconomy currently predominates. It
is material and energy intensive way of
production; it relies on economies of scale and it
is based on the assumption that natural resources
are available, abundant, easy to source and
cheap to dispose of. But, it is not sustainable,
and in some cases exceeding planetary
boundaries [1].
In the current linear system, around 80%of
materials extracted and used for the production
end up in incinerators, landfill or wastewater [2].
Another financial and economic impact of note
in the linear economy is the associatedenergy
loss whenever materials are discarded
somewhere in the value chain [3].
Opportunities to increase resource effciency
in modern manufacturing processes still exist.
But the gains are largely incremental and

96
EXPRES 2017
ISBN 978-86-919769-1-0
insufficient to generate real competitive advantage
for companies. Manufacturers’ margins are being
compressed by slow growth in demand, increasing
costs, and higher price volatility for resources.
Alternative models of productionand
consumption based on ‘circular’ sources of
value,resource reusing and regenerating natural
capital have drawn the attention of businesses around
the world.
The concept of circular economy describes an
economy with closed material loop. The circular
economy refers to an industrial economy that is
restorative, by intention and aims to maintain the
utility of products, components and materials and
retain their value, treating everything (in the
economy) as a valuable resource.
Based on natural principles, the circular
economy takes its insights from living systems as
these have proved adaptable and resilient, and model
the ‘waste is food’ relationship very well. A major
outcome of taking insights from living systems and
applying them to the economy is the notion of
optimising systems rather than components. Circular
economy, and business models within it, seeks to
reduce energy use per unit of output and accelerate
the shift to renewable energy, improving total energy
efficiency and the share of renewables, which should
both increase compared with the linear model [4].
Circular economy can also facilitate business
(companies) to benefit from higher levels of
collaboration throughout the supply chain and new
ways of creating value. Implementation of circular
economy concept may reveal new sources for
revenue generation in companies or result in
innovations which create new business opportunities.
According to European Environment Agency,
key characteristics of a circular economy are: less
input and use of natural resources, increased share of
renewable and recyclable resources and energy,
reduced emissions, fewer material losses/residual. On
the other hand, the enabling factors of a circular
economy are: eco-design, repair, refurbishment and
remanufacture, recycling, economic incentives and
finance, eco-innovation and business models
including for example collaborative consumption,
collaboration and transparency along the value chain
and collaboration between companies whereby the
wastes or by-products of one become a resource for
another(industrial symbiosis).One of the most
powerful enablers of a circular economy is business
model innovation e.g. circular business models that
successfully incorporate circular economy principles
and have direct and lasting effects on the economic
system and environment [5].
The concept of a circular economy is
relatively new, and its overall economic,
environmental and social effects have yet to be
fully assessed. The transition to a circular
economy is a complex process involving
fundamental changes to production-consumption
systems that affect the environment. These
include financing mechanisms, consumer
behaviour, government intervention,
technological, social and business innovation,
and very important – newbusiness models.
2. Sustainable business model
Business model can be defined as a conceptual
tool containing a set of objects, concepts and their
relationships with the objective to express the
business logic of a specific firm[6]or, as a
conceptual tool which can help understand how
firm does business and therefore can be used for
analysis, comparison and performance
assessment, management, and innovation[7].
Many other descriptions and explanations of a
business model could be found in the literature.
For example, business model can be regarded as a
holistic description on how a firm does business,
or how company convert resources and
capabilities into economic value. Also, business
model can be defined as organisational and
financial 'architecture' of a business or the
rationale of how an organization creates, delivers
and captures value. As it is mentioned at the begging, linear
business model is not sustainable. Therefore, the
short explanation on what sustainable business
model is, will be given. Sustainable business
models capture economic, social and
environmental value for a wide range of
stakeholders or aim to balance economic, social
and ecological needs. Sustainable business model
is a 'business model that creates competitive
advantage through superior customer value and
contributes to a sustainable development of the
company and society' [8]. Sustainable business
model can help embed sustainability into business
purpose and processes (existing industrial models),
and serve as a key driver of competitive
advantage.There are eight sustainable business
model archetypes, divided into three groups:
EXPRES 2017
ISBN 978-86-919769-1-0
Fig.1 Sustainable business model archetype[9]
Giving the context of the title, the focus of this
paper, will be on the first (technological) group and
three archetypes: (1) maximise material and energy
efficiency, (2) create value from ‘waste’ and (3)
substitute with renewables and natural processes.
(1) Sustainable business model archetype
maximise material and energy efficiency means’ do
more with fewer resources’, generate less waste,
emissions and pollution and reduce costs through the
optimised use of resources - material and energy.
Sustainable business model archetype ’maximise
material and energy efficiency’ includes: low carbon
manufacturing solutions, lean manufacturing, additive
manufacturing, dematerialisation (of
products/packaging), increased funcionality of
products, etc. [10].
Maximizing material productivity, resource
efficiency and waste reduction is a response to acute
resource constraints and energy price increase. This
archetype seeks to mitigate environmental impact of
industry by reducing the demand for energy and other
resources, reducing waste and emissions and
contributing to system-wide reduction of resource
consumption.Positive contribution to society and
environment, is achieved through a minimised
environmental footprint.
(2) Sustainable business model archetype
create value from ‘waste’ includes circular
economy, closed loop model, cradle-to-cradle
approach, industrial symbiosis, reuse,
remanufacture, recycle, extended producer
responsibility,etc. Within this model archetype the
concept of ’waste’ is eliminated by turning
existing waste streams into useful and valuable
input (to other production) [11].
Economic and environmental costs are
reduced through reusing material, and turning
waste into value – waste valorization either as a
material input or energy. Positive contribution to
society and environment is accomplished through
reduced footprint, reduced waste and reduced
virgin material use.
This second archetype is distinct from the first
efficiency archetype, in a sense that it seeks to
identify and create new value from what is
currently perceived as wasterather than seeking to
reduce waste to minimum. This approach is based
on similarities with the natural world where all
’waste’ products become food for another species.
One of the examplesfor sustainable business
model archetype create value from 'waste' is
industrial symbiosis which is process orientated
solution turning waste outputs from one process
into inputs for another process or product line.
Through industrial symbiosis, companies could
Sustainable business model
archetypes
Technological group
3.substitute with renewables and
natural processes
2. create value from 'waste'
1. maximise material and
energy efficiency
Social group
4. deliver functionality,
rather than ownership
5. adopt a stewardship role
6. encourage sufficiency
Organisational group
7. re-purpose the business for
society/environment
8. develop scale-up solutions
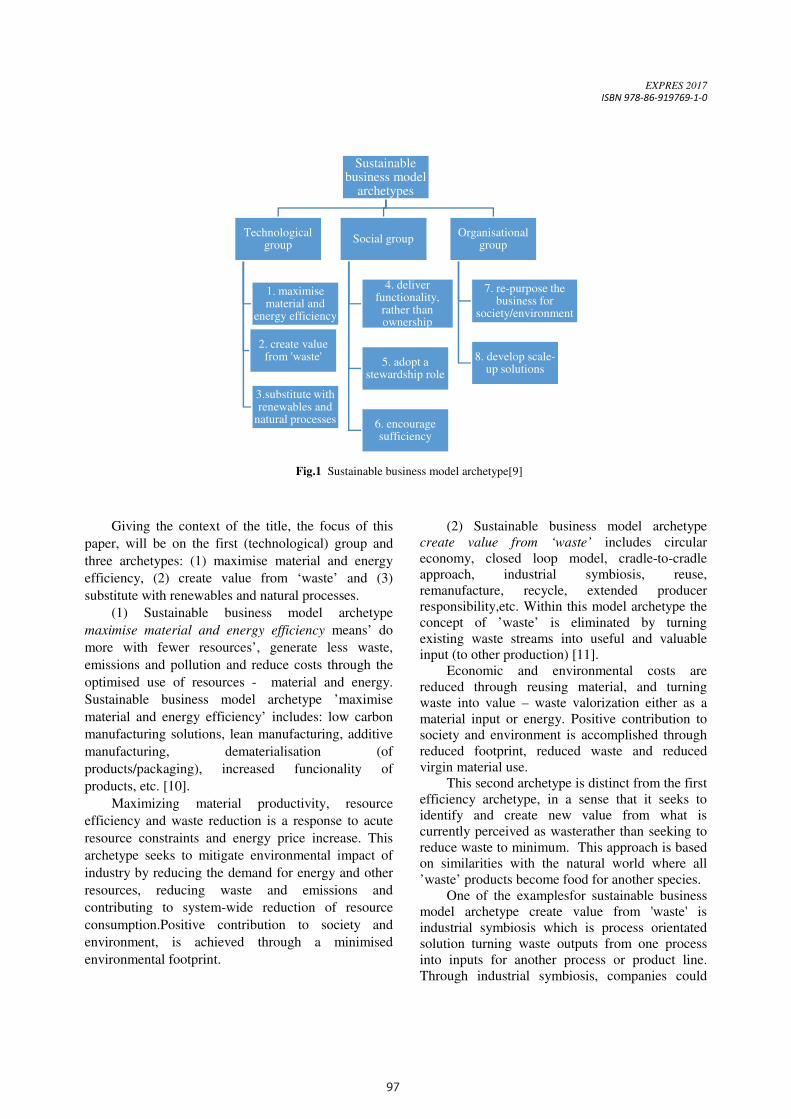
97
EXPRES 2017
ISBN 978-86-919769-1-0
insufficient to generate real competitive advantage
for companies. Manufacturers’ margins are being
compressed by slow growth in demand, increasing
costs, and higher price volatility for resources.
Alternative models of productionand
consumption based on ‘circular’ sources of
value,resource reusing and regenerating natural
capital have drawn the attention of businesses around
the world.
The concept of circular economy describes an
economy with closed material loop. The circular
economy refers to an industrial economy that is
restorative, by intention and aims to maintain the
utility of products, components and materials and
retain their value, treating everything (in the
economy) as a valuable resource.
Based on natural principles, the circular
economy takes its insights from living systems as
these have proved adaptable and resilient, and model
the ‘waste is food’ relationship very well. A major
outcome of taking insights from living systems and
applying them to the economy is the notion of
optimising systems rather than components. Circular
economy, and business models within it, seeks to
reduce energy use per unit of output and accelerate
the shift to renewable energy, improving total energy
efficiency and the share of renewables, which should
both increase compared with the linear model [4].
Circular economy can also facilitate business
(companies) to benefit from higher levels of
collaboration throughout the supply chain and new
ways of creating value. Implementation of circular
economy concept may reveal new sources for
revenue generation in companies or result in
innovations which create new business opportunities.
According to European Environment Agency,
key characteristics of a circular economy are: less
input and use of natural resources, increased share of
renewable and recyclable resources and energy,
reduced emissions, fewer material losses/residual. On
the other hand, the enabling factors of a circular
economy are: eco-design, repair, refurbishment and
remanufacture, recycling, economic incentives and
finance, eco-innovation and business models
including for example collaborative consumption,
collaboration and transparency along the value chain
and collaboration between companies whereby the
wastes or by-products of one become a resource for
another(industrial symbiosis).One of the most
powerful enablers of a circular economy is business
model innovation e.g. circular business models that
successfully incorporate circular economy principles
and have direct and lasting effects on the economic
system and environment [5].
The concept of a circular economy is
relatively new, and its overall economic,
environmental and social effects have yet to be
fully assessed. The transition to a circular
economy is a complex process involving
fundamental changes to production-consumption
systems that affect the environment. These
include financing mechanisms, consumer
behaviour, government intervention,
technological, social and business innovation,
and very important – newbusiness models.
2. Sustainable business model
Business model can be defined as a conceptual
tool containing a set of objects, concepts and their
relationships with the objective to express the
business logic of a specific firm[6]or, as a
conceptual tool which can help understand how
firm does business and therefore can be used for
analysis, comparison and performance
assessment, management, and innovation[7].
Many other descriptions and explanations of a
business model could be found in the literature.
For example, business model can be regarded as a
holistic description on how a firm does business,
or how company convert resources and
capabilities into economic value. Also, business
model can be defined as organisational and
financial 'architecture' of a business or the
rationale of how an organization creates, delivers
and captures value. As it is mentioned at the begging, linear
business model is not sustainable. Therefore, the
short explanation on what sustainable business
model is, will be given. Sustainable business
models capture economic, social and
environmental value for a wide range of
stakeholders or aim to balance economic, social
and ecological needs. Sustainable business model
is a 'business model that creates competitive
advantage through superior customer value and
contributes to a sustainable development of the
company and society' [8]. Sustainable business
model can help embed sustainability into business
purpose and processes (existing industrial models),
and serve as a key driver of competitive
advantage.There are eight sustainable business
model archetypes, divided into three groups:
EXPRES 2017
ISBN 978-86-919769-1-0
Fig.1 Sustainable business model archetype[9]
Giving the context of the title, the focus of this
paper, will be on the first (technological) group and
three archetypes: (1) maximise material and energy
efficiency, (2) create value from ‘waste’ and (3)
substitute with renewables and natural processes.
(1) Sustainable business model archetype
maximise material and energy efficiency means’ do
more with fewer resources’, generate less waste,
emissions and pollution and reduce costs through the
optimised use of resources - material and energy.
Sustainable business model archetype ’maximise
material and energy efficiency’ includes: low carbon
manufacturing solutions, lean manufacturing, additive
manufacturing, dematerialisation (of
products/packaging), increased funcionality of
products, etc. [10].
Maximizing material productivity, resource
efficiency and waste reduction is a response to acute
resource constraints and energy price increase. This
archetype seeks to mitigate environmental impact of
industry by reducing the demand for energy and other
resources, reducing waste and emissions and
contributing to system-wide reduction of resource
consumption.Positive contribution to society and
environment, is achieved through a minimised
environmental footprint.
(2) Sustainable business model archetype
create value from ‘waste’ includes circular
economy, closed loop model, cradle-to-cradle
approach, industrial symbiosis, reuse,
remanufacture, recycle, extended producer
responsibility,etc. Within this model archetype the
concept of ’waste’ is eliminated by turning
existing waste streams into useful and valuable
input (to other production) [11].
Economic and environmental costs are
reduced through reusing material, and turning
waste into value – waste valorization either as a
material input or energy. Positive contribution to
society and environment is accomplished through
reduced footprint, reduced waste and reduced
virgin material use.
This second archetype is distinct from the first
efficiency archetype, in a sense that it seeks to
identify and create new value from what is
currently perceived as wasterather than seeking to
reduce waste to minimum. This approach is based
on similarities with the natural world where all
’waste’ products become food for another species.
One of the examplesfor sustainable business
model archetype create value from 'waste' is
industrial symbiosis which is process orientated
solution turning waste outputs from one process
into inputs for another process or product line.
Through industrial symbiosis, companies could
Sustainable business model
archetypes
Technological group
3.substitute with renewables and
natural processes
2. create value from 'waste'
1. maximise material and
energy efficiency
Social group
4. deliver functionality,
rather than ownership
5. adopt a stewardship role
6. encourage sufficiency
Organisational group
7. re-purpose the business for
society/environment
8. develop scale-up solutions

98
EXPRES 2017
ISBN 978-86-919769-1-0
improve energy efficiency and/or renewable energy
use by turning by-products and production waste
(leftovers) into energy. For example, coffee chaf,
which has always been treated as a waste, could be
used as a biomass for energy production; chocolate
and sugar confectionary waste, through anaerobic
digestion could be turned into biogas. The same
applies to wastewaters and by-products from the
brewing process, sugar, oil production, etc. [12].
Known as waste-as-a-resource business model,
industrial symbiosis isaiming to use waste as a
resource in order to promote cross-sector and cross-
cycle links by creating markets for secondary raw
materials. These can reduce the use of energy and
materials during production and use, and also
facilitate locally clustered activities to prevent by-
products from becoming wastes. Positive economic
effects can arise from the availability of cheaper
materials diverted from waste as an alternative to
virgin materials, including avoiding the costs of
waste disposal and capturing the residual economic
value of existing material streams. Positive
environmental effects can be measured as a net
reduction in environmental pressure from waste
disposal and the production of virgin materials [13].
Also, closed-loop business models are the
representatives of the above mention archetype, and
include products and processes designed in a manner
that enables waste at the end of the use phase of a
product to be used to create new value. Cradle-to-
cradle approach is based on the idea of a closed loop
technical nutrient cycle with a biological open-loop
cycle.
(3) Sustainable business model archetype
substitute with renewables and natural processes
includes, among others, move from non-renewable to
renewable energy sources, solar and wind-power based
energy innovations, blue economy, biomimicry, slow
manufacturing, etc. Value creation and delivery within
this archetype is achieved by innovation in products
and production process design by introducing
renewable resources and energy and conceiving new
solutions by mimicking natural systems. New value
networks are based on renewable resource supply and
energy systems, new partnership to deliver holistic
’nature inspired’ solutions. This archetype seeks to
reduce environmental impact of industry by
substitution with renewable resources and natural
processes to create significantly more environmentally
benign materials and industrial (production) processes,
local renewable energy solutions, etc [14].
3. Circular business model
The special attention in this paper will be given to
circular business model as a subcategory of
sustainable business models which fit in an
economic system of restorative or closed material
loops. Circular business model does not need to
close material loops by itself (within its internal
system boundaries), but can also be part of a
system of business models which together close a
material loop in order to be called circular.Circular
business model is the rationale of how an
organization creates, delivers and captures value
with and within closed material loops.
Within circular business model, companies
utilize (internally and/or externally) material and
energy flows including waste and by-products to
reduce the systems virgin material and energy
input as well as the waste emission output from
the system as a whole.To implement circular
economy approach, companies often require new
business models. Closing material loops often
affects multiple, if not all aspects of their current
business models. Notable changes include
different products or services, different
(relationships with) customers, different
production processes and different revenue
models, sometimes including other types of
values than profit.
Fig. 2 Circular business models [15]
Circular business modelsinclude[16]:
EXPRES 2017
ISBN 978-86-919769-1-0
1. Closed loop recycling - using recycled
products as raw materials to manufacture new
products;
2. Downcycling - turning materials from one or
more used products into a new product with lower
quality;
3. Upcycling - turning materials from one or
more used products into a new product, implying an
improvement in quality;
4. Industrial symbiosis - sharing services,
utilities and by-products among industries to improve
resource efficiency;
5. Collection services - Providing a service to
collect old or used products.
On a general level, the most important identified
drivers for business to consider circular business
models are[17]:
1. Economic losses and structural waste. The current
economy is surprisingly wasteful in its model of
value creation. In Europe, material recycling and
waste-based energy recovery captures only 5 percent
of the original raw material value;
2. Price and supply risks. Recently, many companies
have begun to notice that a linear system increases
their exposure to risks, most notably volatile resource
prices and supply disruptions;
3. Natural systems degradation;
4. Regulatory trends;
5. Advances in technology;
6. Acceptance of alternative business models. Circular business model aims to link up all
material and energy flows in an infinite process circle
in order to use resources most efficiently and ideally
don’t create any waste. Through this circular approach,
the sustainability of a whole business network can be
driven. Circular business model offers business
opportunities in terms of cost benefits, brand value,
resource efficiency, strategic opportunities or new
revenue streams, supports the idea of a circular
economy by driving a system level design shift from a
linear to a circular system, reduces environmental
externalities, balancing out the value creation for
business, society and environment [18].
Implementation of circular business model can
prevent value loss in processing. For example, in the
production of consumer goods, significant volumes
of materials are commonly lost during processing.
The Food and Agriculture Organisation estimates
that 8-12% of total food inputs are lost in the
processing stage. There is further potential for
circularity in industrial food processing, where waste
is mostly created as a by-product, such as brewer’s
spent grains in beer-making or orange peel in
juice production [19].
However, it is important to mention that
linear model remains to have other strengths in
today’s business environment and changing to a
circular economy also comes with barriers,
obstacles and costs which should be regarded as
weaknesses or threats. Before starting to design
circular business model, it is importanat to take
into account several things. Due to practical
reasons (limitations), both 100% linear and 100%
circular economies or business models do not
exist. No matters how efficient companies
(industries) can be, there will always be a need
for a minimum amount of natural resources and a
minimum level of waste too. Also, many risks or
barriers to implement a circular business model
should not be neglected and underestimated.
Transition to circular business model often
increase complexity of company’s organisation
and management, ‘creates’ a need for new
information on materials, components, products,
processes, for new ways of collaboration within
company’s units or with other partners.
4. Conclusion
Today’s resource-intensive economies and
companies are confronted with an uncertain supply
of (critical) resources, due to scarcities on the
market, increased governmental intervention,
increased damage to global ecosystems. Responses
to environmental megatrends will necessarily need
to be in parallel with economic and social change.
One of the features of a route to a sustainable
economy might be a closed-loop, circularbusiness
model where nothing is allowed to be wasted or
discarded into environment (waste is treated as
resource).
Linear business models have proven to have
limited potential. Current linear economic model
of take – make – consume-dispose, relies on large
quantities of easily accessible resources and energy
is opposite to a circular model in which planetary
boundaries are respected through resource
conservation and by maximising the use of
resources already available within the economy.
Companies are rethinking and redesigning
their products and employing new design, new
materials and new circular business models.
Circular business models keep materials in the
economy and also enable companies to do so.The
term ‘circular economy’ denotes an industrial

99
EXPRES 2017
ISBN 978-86-919769-1-0
improve energy efficiency and/or renewable energy
use by turning by-products and production waste
(leftovers) into energy. For example, coffee chaf,
which has always been treated as a waste, could be
used as a biomass for energy production; chocolate
and sugar confectionary waste, through anaerobic
digestion could be turned into biogas. The same
applies to wastewaters and by-products from the
brewing process, sugar, oil production, etc. [12].
Known as waste-as-a-resource business model,
industrial symbiosis isaiming to use waste as a
resource in order to promote cross-sector and cross-
cycle links by creating markets for secondary raw
materials. These can reduce the use of energy and
materials during production and use, and also
facilitate locally clustered activities to prevent by-
products from becoming wastes. Positive economic
effects can arise from the availability of cheaper
materials diverted from waste as an alternative to
virgin materials, including avoiding the costs of
waste disposal and capturing the residual economic
value of existing material streams. Positive
environmental effects can be measured as a net
reduction in environmental pressure from waste
disposal and the production of virgin materials [13].
Also, closed-loop business models are the
representatives of the above mention archetype, and
include products and processes designed in a manner
that enables waste at the end of the use phase of a
product to be used to create new value. Cradle-to-
cradle approach is based on the idea of a closed loop
technical nutrient cycle with a biological open-loop
cycle.
(3) Sustainable business model archetype
substitute with renewables and natural processes
includes, among others, move from non-renewable to
renewable energy sources, solar and wind-power based
energy innovations, blue economy, biomimicry, slow
manufacturing, etc. Value creation and delivery within
this archetype is achieved by innovation in products
and production process design by introducing
renewable resources and energy and conceiving new
solutions by mimicking natural systems. New value
networks are based on renewable resource supply and
energy systems, new partnership to deliver holistic
’nature inspired’ solutions. This archetype seeks to
reduce environmental impact of industry by
substitution with renewable resources and natural
processes to create significantly more environmentally
benign materials and industrial (production) processes,
local renewable energy solutions, etc [14].
3. Circular business model
The special attention in this paper will be given to
circular business model as a subcategory of
sustainable business models which fit in an
economic system of restorative or closed material
loops. Circular business model does not need to
close material loops by itself (within its internal
system boundaries), but can also be part of a
system of business models which together close a
material loop in order to be called circular.Circular
business model is the rationale of how an
organization creates, delivers and captures value
with and within closed material loops.
Within circular business model, companies
utilize (internally and/or externally) material and
energy flows including waste and by-products to
reduce the systems virgin material and energy
input as well as the waste emission output from
the system as a whole.To implement circular
economy approach, companies often require new
business models. Closing material loops often
affects multiple, if not all aspects of their current
business models. Notable changes include
different products or services, different
(relationships with) customers, different
production processes and different revenue
models, sometimes including other types of
values than profit.
Fig. 2 Circular business models [15]
Circular business modelsinclude[16]:
EXPRES 2017
ISBN 978-86-919769-1-0
1. Closed loop recycling - using recycled
products as raw materials to manufacture new
products;
2. Downcycling - turning materials from one or
more used products into a new product with lower
quality;
3. Upcycling - turning materials from one or
more used products into a new product, implying an
improvement in quality;
4. Industrial symbiosis - sharing services,
utilities and by-products among industries to improve
resource efficiency;
5. Collection services - Providing a service to
collect old or used products.
On a general level, the most important identified
drivers for business to consider circular business
models are[17]:
1. Economic losses and structural waste. The current
economy is surprisingly wasteful in its model of
value creation. In Europe, material recycling and
waste-based energy recovery captures only 5 percent
of the original raw material value;
2. Price and supply risks. Recently, many companies
have begun to notice that a linear system increases
their exposure to risks, most notably volatile resource
prices and supply disruptions;
3. Natural systems degradation;
4. Regulatory trends;
5. Advances in technology;
6. Acceptance of alternative business models. Circular business model aims to link up all
material and energy flows in an infinite process circle
in order to use resources most efficiently and ideally
don’t create any waste. Through this circular approach,
the sustainability of a whole business network can be
driven. Circular business model offers business
opportunities in terms of cost benefits, brand value,
resource efficiency, strategic opportunities or new
revenue streams, supports the idea of a circular
economy by driving a system level design shift from a
linear to a circular system, reduces environmental
externalities, balancing out the value creation for
business, society and environment [18].
Implementation of circular business model can
prevent value loss in processing. For example, in the
production of consumer goods, significant volumes
of materials are commonly lost during processing.
The Food and Agriculture Organisation estimates
that 8-12% of total food inputs are lost in the
processing stage. There is further potential for
circularity in industrial food processing, where waste
is mostly created as a by-product, such as brewer’s
spent grains in beer-making or orange peel in
juice production [19].
However, it is important to mention that
linear model remains to have other strengths in
today’s business environment and changing to a
circular economy also comes with barriers,
obstacles and costs which should be regarded as
weaknesses or threats. Before starting to design
circular business model, it is importanat to take
into account several things. Due to practical
reasons (limitations), both 100% linear and 100%
circular economies or business models do not
exist. No matters how efficient companies
(industries) can be, there will always be a need
for a minimum amount of natural resources and a
minimum level of waste too. Also, many risks or
barriers to implement a circular business model
should not be neglected and underestimated.
Transition to circular business model often
increase complexity of company’s organisation
and management, ‘creates’ a need for new
information on materials, components, products,
processes, for new ways of collaboration within
company’s units or with other partners.
4. Conclusion
Today’s resource-intensive economies and
companies are confronted with an uncertain supply
of (critical) resources, due to scarcities on the
market, increased governmental intervention,
increased damage to global ecosystems. Responses
to environmental megatrends will necessarily need
to be in parallel with economic and social change.
One of the features of a route to a sustainable
economy might be a closed-loop, circularbusiness
model where nothing is allowed to be wasted or
discarded into environment (waste is treated as
resource).
Linear business models have proven to have
limited potential. Current linear economic model
of take – make – consume-dispose, relies on large
quantities of easily accessible resources and energy
is opposite to a circular model in which planetary
boundaries are respected through resource
conservation and by maximising the use of
resources already available within the economy.
Companies are rethinking and redesigning
their products and employing new design, new
materials and new circular business models.
Circular business models keep materials in the
economy and also enable companies to do so.The
term ‘circular economy’ denotes an industrial

100
EXPRES 2017
ISBN 978-86-919769-1-0
economy that is restorative by intention and design.
Because it extracts value, in form of material or
energy, from what are otherwise wasted resources,
modern circular business models are inherently more
productive than linear.
A circular economycould offer a platform for
innovative approaches, such as technologies and new
business models to create more economic value from
fewer natural resources.
References
[1] European Environment Agency (2016): Circular
economy in Europe - Developing the knowledge base.
http://www.eea.europa.eu/publications/circular-
economy-in-europe/at_download/file
[2] Ellen McArthur Foundation (2013) Towards Circular
Economy 2 – Opportunities for the consumer goods
sector.
https://www.ellenmacarthurfoundation.org/assets/downloads
/publications/TCE_Report-2013.pdf
[3] Ellen McArthur Foundation (2013) Towards Circular
Economy 2 – Opportunities for the consumer goods
sector.
https://www.ellenmacarthurfoundation.org/assets/downloads
/publications/TCE_Report-2013.pdf
[4] Ellen McArthur Foundation (2013) Towards Circular
Economy 2 – Opportunities for the consumer goods
sector.
https://www.ellenmacarthurfoundation.org/assets/downloads
/publications/TCE_Report-2013.pdf
[5] European Environment Agency (2016): Circular
economy in Europe - Developing the knowledge base.
http://www.eea.europa.eu/publications/circular-
economy-in-europe/at_download/file
[6]http://aisel.aisnet.org/cgi/viewcontent.cgi?article=3016&c
ontext=cais
[7] Bocken N.M.P., Short S.W., Rana P., Evans S. (2014), A
literature and practice review to develop sustainable
business model archetypes. Journal of Cleaner
Production, 65, 42-56
[8] Lüdeke-Freund, F. (2010). Towards a conceptual
framework of ‘business models for sustainability’ Paper
presented at theERSCP-EMSU conference, Delft
[9] Bocken N.M.P., Short S.W., Rana P., Evans S. (2014),
A literature and practice review to develop sustainable
business model archetypes. Journal of Cleaner
Production, 65, 42-56
[10] Bocken N.M.P., Short S.W., Rana P., Evans S. (2014),
A literature and practice review to develop sustainable
business model archetypes. Journal of Cleaner
Production, 65, 42-56
[11] Bocken N.M.P., Short S.W., Rana P., Evans S.
(2014), A literature and practice review to develop
sustainable business model archetypes. Journal of
Cleaner Production, 65, 42-56
[12] Tomić S., Delić D. (2016), Effects of Industrial
Symbiosis on Company’s Energy Efficiency and
Renewable Energy Use, Proceedings of the 8th
International Symposium on Exploitation of
Renewable Energy Sources, 96-100
[13] European Environment Agency (2016): Circular
economy in Europe - Developing the knowledge
base.
http://www.eea.europa.eu/publications/circular-
economy-in-europe/at_download/file
[14] Bocken N.M.P., Short S.W., Rana P., Evans S.
(2014), A literature and practice review to develop
sustainable business model archetypes. Journal of
Cleaner Production, 65, 42-56
[15]https://www.forumforthefuture.org/sites/default/file
s/Card%20deck.pdf
[16]https://www.forumforthefuture.org/sites/default/file
s/Infographic.pdf
[17] Ellen McArthur Foundation (2015) Towards
Circular Economy: Business rationale for an
Accelerated Transition
https://www.ellenmacarthurfoundation.org/assets/downl
oads/TCE_Ellen-MacArthur-Foundation_9-Dec-
2015.pdf
[18]https://www.forumforthefuture.org/sites/default/file
s/Infographic.pdf
[19] Ellen McArthur Foundation (2013) Towards
Circular Economy 2 – Opportunities for the
consumer goods sector.
https://www.ellenmacarthurfoundation.org/assets/d
ownloads/publications/TCE_Report-2013.pdf
[20] Nyers J.: COP and Economic Analysis of the Heat
Recovery from Waste Water using Heat Pumps,
International J. Acta Polytechnica Hungarica Vol.
13, No. 5, 2016.
DOI: 10.12700/APH.13.5.2016.5.8.
EXPRES 2017 ISBN 978-86-919769-1-0
The development of plastic rainwater tank by creating a construction which can be economically produced under domestic circumstances
A. NAGY a, B. DUDINSZKY b , A. SZEKRÉNYES c
Department of Building Services and Process Engineering, Faculty of Mechanical Engineering,
Budapest University of Technology and Economics, Budapest, Hungary aE-mail: [email protected] bE-mail: [email protected]
Calculations and analysis have been made concerning a rainwater storage tank family scheduled for approximately a 50 years
lifespan. These tanks bear 4, 5 and 6 m3 nominal cubic capacity, they are of standing cylindric make lowered under the
surface and inside under atmospheric pressure they are loaded.
Keywords: Plastic tank, strength and stability, reinforcement of plastic tank
1. Introduction
The aim is to manufacture economically an
average series of a rainwater storage tank family
expected to be operating reliably for
approximately a 50 years lifespan. These tanks
bear 4, 5 and 6 m3 nominal cubic capacity, they
are of standing cylindric make lowered under the
surface and inside they are under atmospheric
pressure [1].
2. Examining the strength and the
stiffness of a plastic rainwater storage
tank located under the surface The constructional sketch of the rainwater
storage tank under the surface constituting the
subject of our examination can be seen on figure 1. together with the operating external loadings
and the geometric characteristics in use and their
marks.Influential bearing forces:
• The hydrostatic test pressure preceding the placement of the tank under the ground in case of a cylinder with D = 1900 mm
diameter and H = 1600; 1900; 2300 mm
height ;
• The external pressure of the ground
occurring in radial direction in the empty
condition of the tank following the
lowering of the tank under the ground;
• The hydrostatic pressure caused by the
ground water effecting the bottom of the
tank in empty condition;
• In case of the lid the loading caused by the
concentrated force mog effecting the lid of
the man-hole and by the ground (ptf) over
it;
• In empty condition the drifting of the tank
to the surface caused by ground water.
2.1. Examining the stability of the
cylindric shell
In the empty condition of the tank the external
dividing loading (deriving from ground pressure)
effecting the shell of the spherical cylinder
having DdiameterH high SH thickness of its wall
changes according to figure 2.
As figure 2. shows the ground pressure having
radial direction and making an effect along the
length of the shell indicates a change of linear
characteristic. When making calculations we
used the average value of the radial pressure.
Assuming only radial pressure (N1 = 0) the
numerical value of the critical external pressure
(pkrit) which results in losing the stability of the
shell of the cylinder having H = 1600 mm;
1900 mm; 2300 mm height; D = 1900 mm
diameter, SH = 10 mm thickness of the wall,
MPaE 247=∞
characteristic of elasticity, is
given by the Windenburg-Trilling-theory
outlined below:

101
EXPRES 2017
ISBN 978-86-919769-1-0
economy that is restorative by intention and design.
Because it extracts value, in form of material or
energy, from what are otherwise wasted resources,
modern circular business models are inherently more
productive than linear.
A circular economycould offer a platform for
innovative approaches, such as technologies and new
business models to create more economic value from
fewer natural resources.
References
[1] European Environment Agency (2016): Circular
economy in Europe - Developing the knowledge base.
http://www.eea.europa.eu/publications/circular-
economy-in-europe/at_download/file
[2] Ellen McArthur Foundation (2013) Towards Circular
Economy 2 – Opportunities for the consumer goods
sector.
https://www.ellenmacarthurfoundation.org/assets/downloads
/publications/TCE_Report-2013.pdf
[3] Ellen McArthur Foundation (2013) Towards Circular
Economy 2 – Opportunities for the consumer goods
sector.
https://www.ellenmacarthurfoundation.org/assets/downloads
/publications/TCE_Report-2013.pdf
[4] Ellen McArthur Foundation (2013) Towards Circular
Economy 2 – Opportunities for the consumer goods
sector.
https://www.ellenmacarthurfoundation.org/assets/downloads
/publications/TCE_Report-2013.pdf
[5] European Environment Agency (2016): Circular
economy in Europe - Developing the knowledge base.
http://www.eea.europa.eu/publications/circular-
economy-in-europe/at_download/file
[6]http://aisel.aisnet.org/cgi/viewcontent.cgi?article=3016&c
ontext=cais
[7] Bocken N.M.P., Short S.W., Rana P., Evans S. (2014), A
literature and practice review to develop sustainable
business model archetypes. Journal of Cleaner
Production, 65, 42-56
[8] Lüdeke-Freund, F. (2010). Towards a conceptual
framework of ‘business models for sustainability’ Paper
presented at theERSCP-EMSU conference, Delft
[9] Bocken N.M.P., Short S.W., Rana P., Evans S. (2014),
A literature and practice review to develop sustainable
business model archetypes. Journal of Cleaner
Production, 65, 42-56
[10] Bocken N.M.P., Short S.W., Rana P., Evans S. (2014),
A literature and practice review to develop sustainable
business model archetypes. Journal of Cleaner
Production, 65, 42-56
[11] Bocken N.M.P., Short S.W., Rana P., Evans S.
(2014), A literature and practice review to develop
sustainable business model archetypes. Journal of
Cleaner Production, 65, 42-56
[12] Tomić S., Delić D. (2016), Effects of Industrial
Symbiosis on Company’s Energy Efficiency and
Renewable Energy Use, Proceedings of the 8th
International Symposium on Exploitation of
Renewable Energy Sources, 96-100
[13] European Environment Agency (2016): Circular
economy in Europe - Developing the knowledge
base.
http://www.eea.europa.eu/publications/circular-
economy-in-europe/at_download/file
[14] Bocken N.M.P., Short S.W., Rana P., Evans S.
(2014), A literature and practice review to develop
sustainable business model archetypes. Journal of
Cleaner Production, 65, 42-56
[15]https://www.forumforthefuture.org/sites/default/file
s/Card%20deck.pdf
[16]https://www.forumforthefuture.org/sites/default/file
s/Infographic.pdf
[17] Ellen McArthur Foundation (2015) Towards
Circular Economy: Business rationale for an
Accelerated Transition
https://www.ellenmacarthurfoundation.org/assets/downl
oads/TCE_Ellen-MacArthur-Foundation_9-Dec-
2015.pdf
[18]https://www.forumforthefuture.org/sites/default/file
s/Infographic.pdf
[19] Ellen McArthur Foundation (2013) Towards
Circular Economy 2 – Opportunities for the
consumer goods sector.
https://www.ellenmacarthurfoundation.org/assets/d
ownloads/publications/TCE_Report-2013.pdf
[20] Nyers J.: COP and Economic Analysis of the Heat
Recovery from Waste Water using Heat Pumps,
International J. Acta Polytechnica Hungarica Vol.
13, No. 5, 2016.
DOI: 10.12700/APH.13.5.2016.5.8.
EXPRES 2017 ISBN 978-86-919769-1-0
The development of plastic rainwater tank by creating a construction which can be economically produced under domestic circumstances
A. NAGY a, B. DUDINSZKY b , A. SZEKRÉNYES c
Department of Building Services and Process Engineering, Faculty of Mechanical Engineering,
Budapest University of Technology and Economics, Budapest, Hungary aE-mail: [email protected] bE-mail: [email protected]
Calculations and analysis have been made concerning a rainwater storage tank family scheduled for approximately a 50 years
lifespan. These tanks bear 4, 5 and 6 m3 nominal cubic capacity, they are of standing cylindric make lowered under the
surface and inside under atmospheric pressure they are loaded.
Keywords: Plastic tank, strength and stability, reinforcement of plastic tank
1. Introduction
The aim is to manufacture economically an
average series of a rainwater storage tank family
expected to be operating reliably for
approximately a 50 years lifespan. These tanks
bear 4, 5 and 6 m3 nominal cubic capacity, they
are of standing cylindric make lowered under the
surface and inside they are under atmospheric
pressure [1].
2. Examining the strength and the
stiffness of a plastic rainwater storage
tank located under the surface The constructional sketch of the rainwater
storage tank under the surface constituting the
subject of our examination can be seen on figure 1. together with the operating external loadings
and the geometric characteristics in use and their
marks.Influential bearing forces:
• The hydrostatic test pressure preceding the placement of the tank under the ground in case of a cylinder with D = 1900 mm
diameter and H = 1600; 1900; 2300 mm
height ;
• The external pressure of the ground
occurring in radial direction in the empty
condition of the tank following the
lowering of the tank under the ground;
• The hydrostatic pressure caused by the
ground water effecting the bottom of the
tank in empty condition;
• In case of the lid the loading caused by the
concentrated force mog effecting the lid of
the man-hole and by the ground (ptf) over
it;
• In empty condition the drifting of the tank
to the surface caused by ground water.
2.1. Examining the stability of the
cylindric shell
In the empty condition of the tank the external
dividing loading (deriving from ground pressure)
effecting the shell of the spherical cylinder
having DdiameterH high SH thickness of its wall
changes according to figure 2.
As figure 2. shows the ground pressure having
radial direction and making an effect along the
length of the shell indicates a change of linear
characteristic. When making calculations we
used the average value of the radial pressure.
Assuming only radial pressure (N1 = 0) the
numerical value of the critical external pressure
(pkrit) which results in losing the stability of the
shell of the cylinder having H = 1600 mm;
1900 mm; 2300 mm height; D = 1900 mm
diameter, SH = 10 mm thickness of the wall,
MPaE 247=∞
characteristic of elasticity, is
given by the Windenburg-Trilling-theory
outlined below:
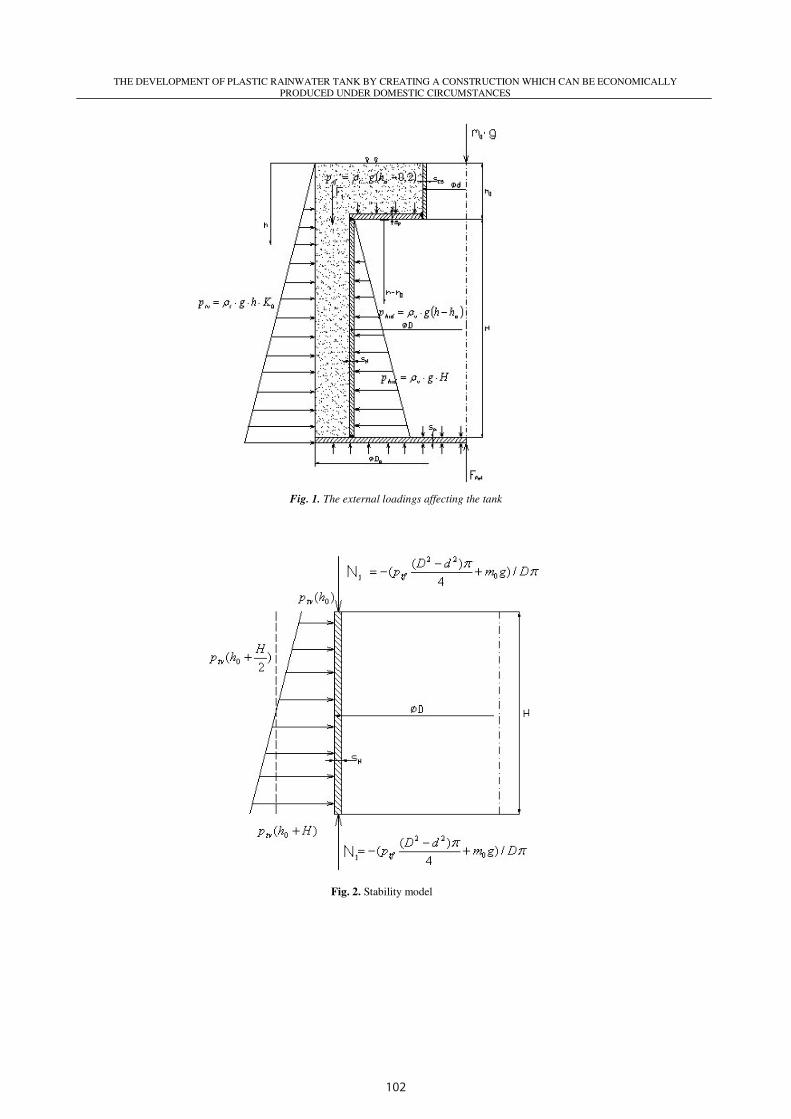
102
THE DEVELOPMENT OF PLASTIC RAINWATER TANK BY CREATING A CONSTRUCTION WHICH CAN BE ECONOMICALLY
PRODUCED UNDER DOMESTIC CIRCUMSTANCES
Fig. 2. Stability model
Fig. 1. The external loadings affecting the tank
THE DEVELOPMENT OF PLASTIC RAINWATER TANK BY CREATING A CONSTRUCTION WHICH CAN BE ECONOMICALLY
PRODUCED UNDER DOMESTIC CIRCUMSTANCES
2
1
2
5
45,0
6,2
−
=
∞
D
S
D
H
D
SE
p
H
H
krit
(1)
Assuming only hydrostatic external pressure (N1
≠ 0) the value of the critical external pressure can
be determined by the Ebner-theory shown below
[2,3].
2
5
6,2
=∞
D
S
H
DEp H
krit (2)
The calculations made based onthe above
relations indicate that the examined cylindric
shells having SH = 10 mm thickness of the wall
are not suitable for bearing the externalgauge
pressure (the horizontal component of the ground
pressure).
A possible reinforcing method of the examined
plastic(PP)cylindric shell can be seen on Figure
3., here the cylinder having Vh = 4 m3 useful
capacity, H = 1600 mm height, D = 1900 mm
diameter is stiffened by 8 radial trusses having
12=bs mm thickness of the wall, 200=fb
mm width and also by four annuli (Z = 4 pieces)
which are 320=∆H mm far from each other,
sized Z = Ø 1900 / Ø 1300 mm, being 12=bs
mm thick. The advantage of the above mentioned
stiffening frame is that it fulfills its duty by being
joined loosely to the shell of the cylinder to be
stiffened without welding, too.
2.2.Examining the whole construction by
finite element method Based on the previous calculations the permanent
geometry of the tank took shape, and by using it
we completed the entire finite element model
which isdemonstrated on Figure 4. In the solving
process we covered the tank being stiffened from
inside and outside with 5335 pieces of SHELL
type finite element. During the calculations we
took into considerations the ground pressure
which effects the shell of the tank in horizontal
direction as well as the load of the ground over
the lid and the central positioned, concentrated
mass powerm0g effecting the man-hole. The
results of the calculations concerning the tank
having Vh= 4 m3useful capacity are demonstrated
on Figures 5. and 6. In case ofh0 = 500 mm
ground covering the influential deformation of
the tank arises on the lid between the stiffening
and supporting trusses , of which numerical value
is f fmax = 15 mm independent of the useful
capacity . While the maximum reduced strain
arises at the junction of the radial external
stiffening truss on the lid and the edge of the
plate, of which value is 8max ≅redσ MPa
independent of the useful capacity. Thus the
calculated values of the influential move and
strain correspond to the relevant specifications
regarding stiffness and strength.
Fig 3. The sketch of the stiffening frame
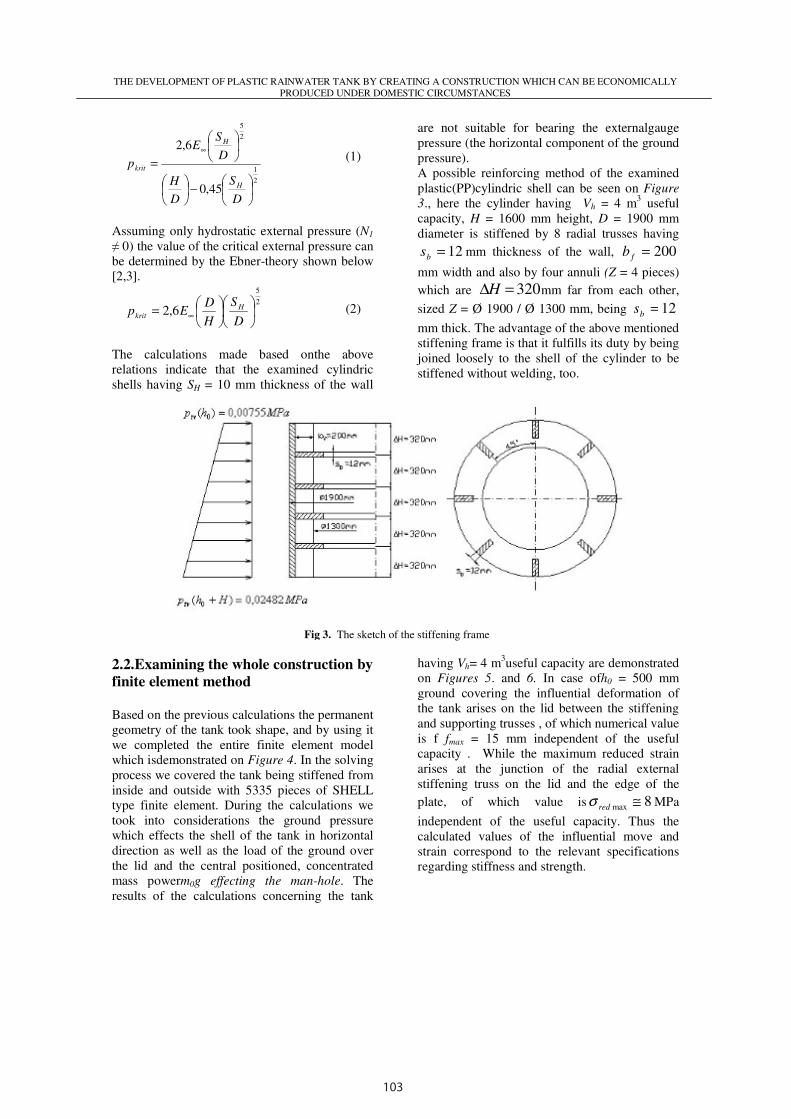
103
THE DEVELOPMENT OF PLASTIC RAINWATER TANK BY CREATING A CONSTRUCTION WHICH CAN BE ECONOMICALLY
PRODUCED UNDER DOMESTIC CIRCUMSTANCES
Fig. 2. Stability model
Fig. 1. The external loadings affecting the tank
THE DEVELOPMENT OF PLASTIC RAINWATER TANK BY CREATING A CONSTRUCTION WHICH CAN BE ECONOMICALLY
PRODUCED UNDER DOMESTIC CIRCUMSTANCES
2
1
2
5
45,0
6,2
−
=
∞
D
S
D
H
D
SE
p
H
H
krit
(1)
Assuming only hydrostatic external pressure (N1
≠ 0) the value of the critical external pressure can
be determined by the Ebner-theory shown below
[2,3].
2
5
6,2
=∞
D
S
H
DEp H
krit (2)
The calculations made based onthe above
relations indicate that the examined cylindric
shells having SH = 10 mm thickness of the wall
are not suitable for bearing the externalgauge
pressure (the horizontal component of the ground
pressure).
A possible reinforcing method of the examined
plastic(PP)cylindric shell can be seen on Figure
3., here the cylinder having Vh = 4 m3 useful
capacity, H = 1600 mm height, D = 1900 mm
diameter is stiffened by 8 radial trusses having
12=bs mm thickness of the wall, 200=fb
mm width and also by four annuli (Z = 4 pieces)
which are 320=∆H mm far from each other,
sized Z = Ø 1900 / Ø 1300 mm, being 12=bs
mm thick. The advantage of the above mentioned
stiffening frame is that it fulfills its duty by being
joined loosely to the shell of the cylinder to be
stiffened without welding, too.
2.2.Examining the whole construction by
finite element method Based on the previous calculations the permanent
geometry of the tank took shape, and by using it
we completed the entire finite element model
which isdemonstrated on Figure 4. In the solving
process we covered the tank being stiffened from
inside and outside with 5335 pieces of SHELL
type finite element. During the calculations we
took into considerations the ground pressure
which effects the shell of the tank in horizontal
direction as well as the load of the ground over
the lid and the central positioned, concentrated
mass powerm0g effecting the man-hole. The
results of the calculations concerning the tank
having Vh= 4 m3useful capacity are demonstrated
on Figures 5. and 6. In case ofh0 = 500 mm
ground covering the influential deformation of
the tank arises on the lid between the stiffening
and supporting trusses , of which numerical value
is f fmax = 15 mm independent of the useful
capacity . While the maximum reduced strain
arises at the junction of the radial external
stiffening truss on the lid and the edge of the
plate, of which value is 8max ≅redσ MPa
independent of the useful capacity. Thus the
calculated values of the influential move and
strain correspond to the relevant specifications
regarding stiffness and strength.
Fig 3. The sketch of the stiffening frame
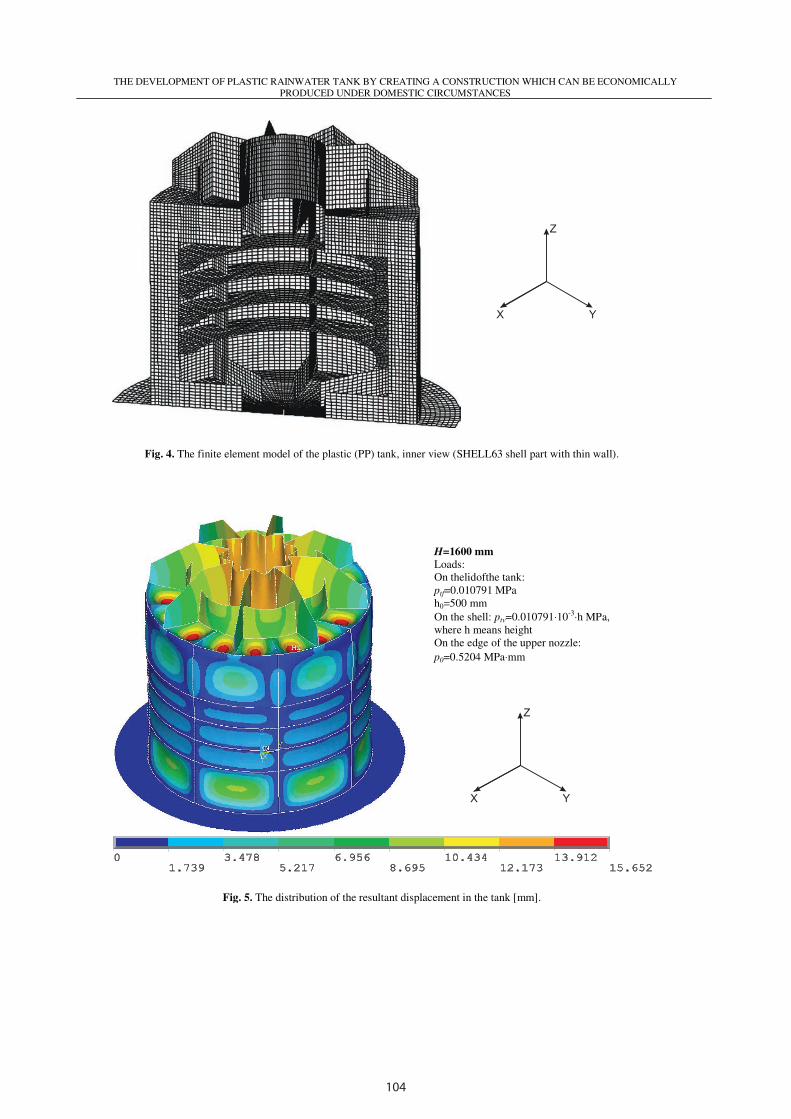
104
THE DEVELOPMENT OF PLASTIC RAINWATER TANK BY CREATING A CONSTRUCTION WHICH CAN BE ECONOMICALLY
PRODUCED UNDER DOMESTIC CIRCUMSTANCES
H=1600 mm
Loads:
On thelidofthe tank:
ptf=0.010791 MPa
h0=500 mm
On the shell: ptv=0.010791⋅10-3⋅h MPa,
where h means height
On the edge of the upper nozzle:
p0=0.5204 MPa⋅mm
Fig. 5. The distribution of the resultant displacement in the tank [mm].
Fig. 4. The finite element model of the plastic (PP) tank, inner view (SHELL63 shell part with thin wall).
THE DEVELOPMENT OF PLASTIC RAINWATER TANK BY CREATING A CONSTRUCTION WHICH CAN BE ECONOMICALLY
PRODUCED UNDER DOMESTIC CIRCUMSTANCES
3. Conclusion
Calculations and analysis have been made
concerning a rainwater storage tank family
scheduled for approximately a 50 yearslifespan.
These tanks bear 4, 5 and 6 m3 nominal cubic
capacity, they are of standing cylindric make
lowered under the surface and inside under
atmospheric pressure they are dynamically
loaded.
Examinations have shown that it is needed to
increase the thickness of the wall significantly
compared to the earlier applied solution so that
the tank in its most dangerous condition (without
water, empty condition) could endure the
external loading caused by surrounding soil.
However, this increase of the thickness of the
wall puts the cost-efficiency and the salebility of
the product at risk. In order to solve the problem
we have prepared a simulation on computer, we
have completed a finite element model and by
using it we have managed to develop in several
steps a material-saving, stiffening construction.
The most essential element of the solution is the
internal stiffening basket structure, which is
suitable to support radially the cylindric shell as
well as to reinforce the lid of the tank further.
The developed basket structure can be
manufactured economically and relatively simply
and it makes its stiffening effect while put in the
inner space before the lid of the tank is
permanently welded on the tank. Calculations
have proved that by applying the stiffening
basket we can save approximately 50 % of the
material used compared to the traditional
construction.
We have not found any solution in the technical
literature for stiffening plastic tanks operating
under the ground with basket structure, which
indicates the originality of our developed
solution
In the process of planning we modeled the
hydrostatic test pressure as well which precedes
the placement of the tank in the ground. We
specified the change of the form and the strain
which develop at the dangerous intersection of
the tank (at the junction of the cylindric shell and
the bottom of the tank) deriving from the
hydrostatic loading. . When calculating the
changes of forms and strains in specifying the
allowable values we took into account the time
dependent processes and their effects which
occur during the prescribed 50 years’ lifespan.
In the process of planning we also examined the
effect of the humidity of the ground on stability.
It was decided that independent of the useful
capacity during the building in a special concrete
base was needed in order to avoid the danger of
H=1600 mm
Loads:
On thelidofthe tank:
ptf=0.010791 MPa
h0=500 mm
On the shell:
ptv=0.010791⋅10-3⋅h
MPa, where h means height
On the edge of the upper nozzle:
p0=0.5204 MPa⋅mm
Fig. 6. The distribution of the HMH-type equivalentstress in the tank [MPa].
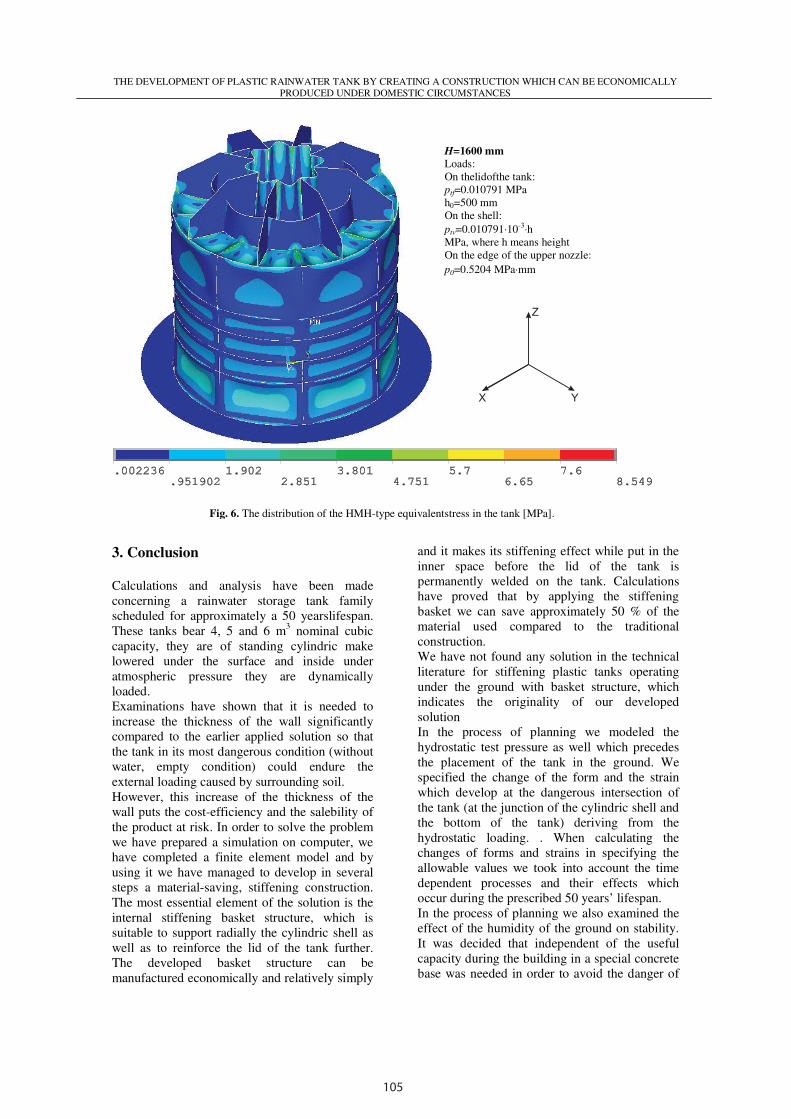
105
THE DEVELOPMENT OF PLASTIC RAINWATER TANK BY CREATING A CONSTRUCTION WHICH CAN BE ECONOMICALLY
PRODUCED UNDER DOMESTIC CIRCUMSTANCES
H=1600 mm
Loads:
On thelidofthe tank:
ptf=0.010791 MPa
h0=500 mm
On the shell: ptv=0.010791⋅10-3⋅h MPa,
where h means height
On the edge of the upper nozzle:
p0=0.5204 MPa⋅mm
Fig. 5. The distribution of the resultant displacement in the tank [mm].
Fig. 4. The finite element model of the plastic (PP) tank, inner view (SHELL63 shell part with thin wall).
THE DEVELOPMENT OF PLASTIC RAINWATER TANK BY CREATING A CONSTRUCTION WHICH CAN BE ECONOMICALLY
PRODUCED UNDER DOMESTIC CIRCUMSTANCES
3. Conclusion
Calculations and analysis have been made
concerning a rainwater storage tank family
scheduled for approximately a 50 yearslifespan.
These tanks bear 4, 5 and 6 m3 nominal cubic
capacity, they are of standing cylindric make
lowered under the surface and inside under
atmospheric pressure they are dynamically
loaded.
Examinations have shown that it is needed to
increase the thickness of the wall significantly
compared to the earlier applied solution so that
the tank in its most dangerous condition (without
water, empty condition) could endure the
external loading caused by surrounding soil.
However, this increase of the thickness of the
wall puts the cost-efficiency and the salebility of
the product at risk. In order to solve the problem
we have prepared a simulation on computer, we
have completed a finite element model and by
using it we have managed to develop in several
steps a material-saving, stiffening construction.
The most essential element of the solution is the
internal stiffening basket structure, which is
suitable to support radially the cylindric shell as
well as to reinforce the lid of the tank further.
The developed basket structure can be
manufactured economically and relatively simply
and it makes its stiffening effect while put in the
inner space before the lid of the tank is
permanently welded on the tank. Calculations
have proved that by applying the stiffening
basket we can save approximately 50 % of the
material used compared to the traditional
construction.
We have not found any solution in the technical
literature for stiffening plastic tanks operating
under the ground with basket structure, which
indicates the originality of our developed
solution
In the process of planning we modeled the
hydrostatic test pressure as well which precedes
the placement of the tank in the ground. We
specified the change of the form and the strain
which develop at the dangerous intersection of
the tank (at the junction of the cylindric shell and
the bottom of the tank) deriving from the
hydrostatic loading. . When calculating the
changes of forms and strains in specifying the
allowable values we took into account the time
dependent processes and their effects which
occur during the prescribed 50 years’ lifespan.
In the process of planning we also examined the
effect of the humidity of the ground on stability.
It was decided that independent of the useful
capacity during the building in a special concrete
base was needed in order to avoid the danger of
H=1600 mm
Loads:
On thelidofthe tank:
ptf=0.010791 MPa
h0=500 mm
On the shell:
ptv=0.010791⋅10-3⋅h
MPa, where h means height
On the edge of the upper nozzle:
p0=0.5204 MPa⋅mm
Fig. 6. The distribution of the HMH-type equivalentstress in the tank [MPa].

106
THE DEVELOPMENT OF PLASTIC RAINWATER TANK BY CREATING A CONSTRUCTION WHICH CAN BE ECONOMICALLY
PRODUCED UNDER DOMESTIC CIRCUMSTANCES
the possible drifting up and to be able to load the
bottom of the tank further.
The finished so-called inner stiffening basket
construction, now being suitable as for strength
as well meets the relevant specifications of the
DIN 1989-3 norm in every aspect.
The joinings of the tanks fit in to the connecting
demands of the other parts of the systems (that
are the reduced bringing in of the rainwater from
the filter, the drainage towards the utilization
under pressure, the installation of the electric
energy cables of the cistern pump, the installation
of the replenishment of drinking water, the
installation of a level measuring instrument and
sensors, overflow drainage) which make use of
rainwater.
References [1] J. Powell: Engineering with Polymers AGRU
Kunststofftechnik GmbH Austria, Bad Hall, (2009).
[2] Girkman, K: Flachentragwerke . Springer-Verlag, Wien (1974)
[3] Ebner, H.: Theoretische und experimentelle Untersuchungüber das Einbeulen Zylindrischen Tanks durch Unterdruck. Stahlbau 21, 153 (1952)
[4] Nyers J, Tomic S, Nyers Á: Economic Optimum of Thermal Insulating Layer for External Wall of Brick, Acta Polytechnica Hungarica 11: (7) pp. 209-222.
[5] Nyers J., Nyers A.: Hydraulic Analysis of Heat Pump's Heating Circuit using Mathematical Model, 9rd ICCC International Conference, Proceedings-USB, ISBN 978-1-4799-0061-9 pp 349-353, Tihany, Hungary. 04-08. 07. 2013.
EXPRES 2017 ISBN 978-86-919769-1-0
Geothermal heating of public buildings in downtown Zalaegerszeg
J. KONTRA
a, L. GARBAI
a, J. SZANYI
b
aBudapest University of Technology and Economics, Műegyetemrakpart 3., 1111 Budapest
E-mail:[email protected]
bUniversity of Szeged, Hungary
In Hungary, district heating works on gas basis unbalanced; thermal water is rarely used in town heating. In Zalaegerszeg, there is
no district heating grid at all. Public buildings of the town are heated with individual gas boilers being rather outdated. After
scrapping, it is advisable to switch over to a new geothermal district heating system in public buildings – in the first stage. The
thermal water basis is available, we plan to deepen new thermal wells and a district heating grid shall be constructed. Low-level of
operational costs of heat supply can be guaranteed.
Keywords: district heating, geothermal district heating system, public buildings, thermal wells
1. Present thermal energy consumption of
the institutions of the downtown local
government
Condition of heat generating sources
The local government has defined the institutions
having heat supply systems with individual centers at
present. These institutions apply exclusively gas as
energy carrier for covering their thermal needs.
Location of these institutions can be seen on map no.
1. Typically, these institutions are situated in
downtown, but some lie relatively far away, yet, they
are major consumers.
These institutions include:
• educational establishments including also
nursery schools and kindergartens,
• social and health care establishments,
• cultural institutions.
Gas heating evaluation (boilers)
On the heat source side of the building heating
systems operating currently, we find outdated gas
boilers.
Heating appliances are obsolete.
They are evaluated in terms of the following two main
aspects:
a.) modernity status,
b.) wear and tear, physical aging.
Modernity status
Considering present state of gas heating, only
condensing heating technology can be regarded as
modern where heating technological efficiency may
reach 108-109%. Boilers with efficiency lower than
this are not suitable (FÉG-VESTALE, KOMFORT,
ÉTI). Among the public buildings reviewed, only the
headquarters of the municipality has a modern boiler.
Consumption of all the others is disproportionately
high; they do not meet the Hungarian energy-political
targets as they operate with expensive imported gas,
just for quoting a reason (see the images attached).
Wear and tear, physical aging
All boilers – except for two pieces – are in worn out
condition also physically. Some appliances have been
operating for 25-35 years, they often need cost-
intensive repairs, and their low efficiency goes with
high consumption. Their estimated remaining useful
life is 0 to 1 year. All this justifies their disassembly.
As high-rank energy-political target, a renewable
energy based reconstruction, namely geothermics shall
be realized.
Present state of heat generators of these
institutions
A characteristic feature of heat generators of some
heat consumers is a gas-burning boiler house, one in
each institution. In the only case of the cinema,
heating is provided by outdated steam boilers aged
over 30 years and working with light fuel oil or gas
oil.
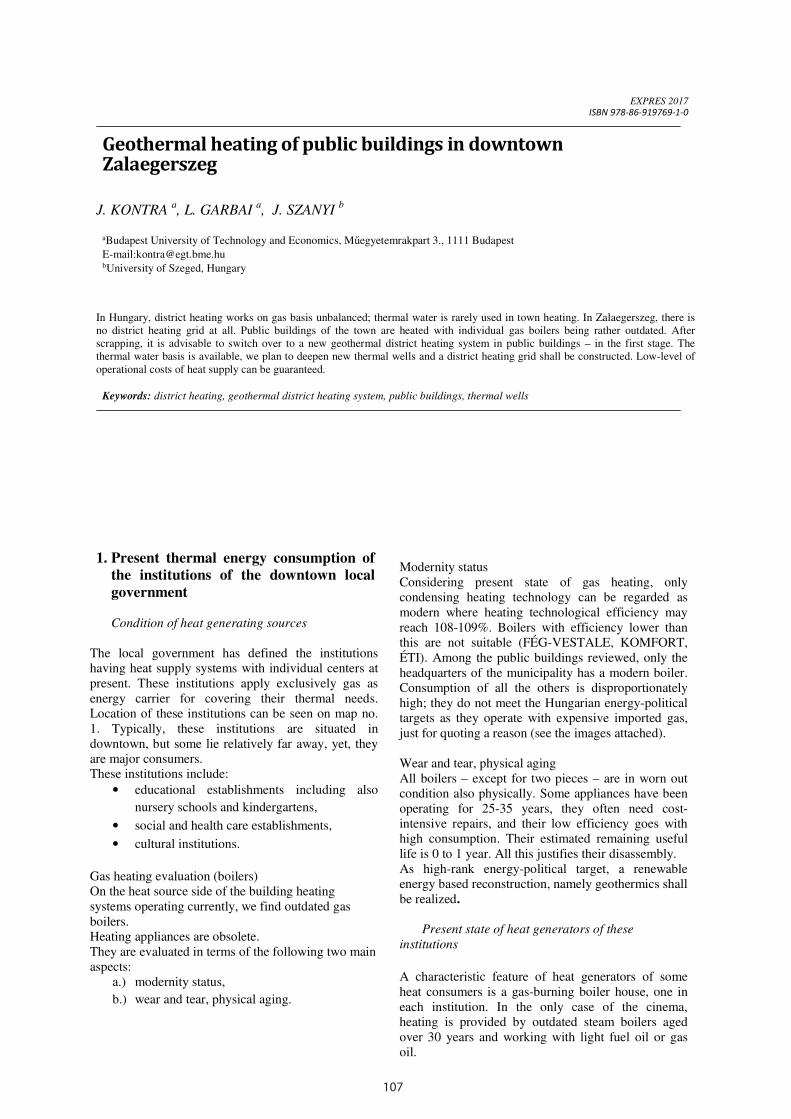
107
THE DEVELOPMENT OF PLASTIC RAINWATER TANK BY CREATING A CONSTRUCTION WHICH CAN BE ECONOMICALLY
PRODUCED UNDER DOMESTIC CIRCUMSTANCES
the possible drifting up and to be able to load the
bottom of the tank further.
The finished so-called inner stiffening basket
construction, now being suitable as for strength
as well meets the relevant specifications of the
DIN 1989-3 norm in every aspect.
The joinings of the tanks fit in to the connecting
demands of the other parts of the systems (that
are the reduced bringing in of the rainwater from
the filter, the drainage towards the utilization
under pressure, the installation of the electric
energy cables of the cistern pump, the installation
of the replenishment of drinking water, the
installation of a level measuring instrument and
sensors, overflow drainage) which make use of
rainwater.
References [1] J. Powell: Engineering with Polymers AGRU
Kunststofftechnik GmbH Austria, Bad Hall, (2009).
[2] Girkman, K: Flachentragwerke . Springer-Verlag, Wien (1974)
[3] Ebner, H.: Theoretische und experimentelle Untersuchungüber das Einbeulen Zylindrischen Tanks durch Unterdruck. Stahlbau 21, 153 (1952)
[4] Nyers J, Tomic S, Nyers Á: Economic Optimum of Thermal Insulating Layer for External Wall of Brick, Acta Polytechnica Hungarica 11: (7) pp. 209-222.
[5] Nyers J., Nyers A.: Hydraulic Analysis of Heat Pump's Heating Circuit using Mathematical Model, 9rd ICCC International Conference, Proceedings-USB, ISBN 978-1-4799-0061-9 pp 349-353, Tihany, Hungary. 04-08. 07. 2013.
EXPRES 2017 ISBN 978-86-919769-1-0
Geothermal heating of public buildings in downtown Zalaegerszeg
J. KONTRA
a, L. GARBAI
a, J. SZANYI
b
aBudapest University of Technology and Economics, Műegyetemrakpart 3., 1111 Budapest
E-mail:[email protected]
bUniversity of Szeged, Hungary
In Hungary, district heating works on gas basis unbalanced; thermal water is rarely used in town heating. In Zalaegerszeg, there is
no district heating grid at all. Public buildings of the town are heated with individual gas boilers being rather outdated. After
scrapping, it is advisable to switch over to a new geothermal district heating system in public buildings – in the first stage. The
thermal water basis is available, we plan to deepen new thermal wells and a district heating grid shall be constructed. Low-level of
operational costs of heat supply can be guaranteed.
Keywords: district heating, geothermal district heating system, public buildings, thermal wells
1. Present thermal energy consumption of
the institutions of the downtown local
government
Condition of heat generating sources
The local government has defined the institutions
having heat supply systems with individual centers at
present. These institutions apply exclusively gas as
energy carrier for covering their thermal needs.
Location of these institutions can be seen on map no.
1. Typically, these institutions are situated in
downtown, but some lie relatively far away, yet, they
are major consumers.
These institutions include:
• educational establishments including also
nursery schools and kindergartens,
• social and health care establishments,
• cultural institutions.
Gas heating evaluation (boilers)
On the heat source side of the building heating
systems operating currently, we find outdated gas
boilers.
Heating appliances are obsolete.
They are evaluated in terms of the following two main
aspects:
a.) modernity status,
b.) wear and tear, physical aging.
Modernity status
Considering present state of gas heating, only
condensing heating technology can be regarded as
modern where heating technological efficiency may
reach 108-109%. Boilers with efficiency lower than
this are not suitable (FÉG-VESTALE, KOMFORT,
ÉTI). Among the public buildings reviewed, only the
headquarters of the municipality has a modern boiler.
Consumption of all the others is disproportionately
high; they do not meet the Hungarian energy-political
targets as they operate with expensive imported gas,
just for quoting a reason (see the images attached).
Wear and tear, physical aging
All boilers – except for two pieces – are in worn out
condition also physically. Some appliances have been
operating for 25-35 years, they often need cost-
intensive repairs, and their low efficiency goes with
high consumption. Their estimated remaining useful
life is 0 to 1 year. All this justifies their disassembly.
As high-rank energy-political target, a renewable
energy based reconstruction, namely geothermics shall
be realized.
Present state of heat generators of these
institutions
A characteristic feature of heat generators of some
heat consumers is a gas-burning boiler house, one in
each institution. In the only case of the cinema,
heating is provided by outdated steam boilers aged
over 30 years and working with light fuel oil or gas
oil.

108
GEOTHERMAL HEATING OF PUBLIC BUILDINGS IN DOWNTOWN ZALAEGERSZEG
2. Foreseeable design of the proposed new
geothermal heat source
In the first stage of the development, public buildings
marked red on the map (ones defined by the
municipality) are designated for geothermal heat
supply. Additional buildings identified by us during
our on-site review (marked blue) will also join the
geothermal heat supply.
The district heat supply system is radially arranged.
On the heat source side, there are 3 wells (marked T1,
T2, T3) from where thermal water is transferred to the
thermal water complex [primary side]. Here starts the
district heat supply grid, filled up with soft water of
varying mass flow, and goes to the individual
buildings. The recipient thermal centers may be
designed as direct thermal centers during the future
design process.
The cooled down thermal water comes to the injection
well, while also the heat supply of the nearby two
secondary schools can be solved by the cooled down
water using heat pumps.
3. Proposal for thermal water supply of
the swimming pool of the town
For heat supply and thermal water supply of the
swimming pool of the town we suggest boring a new
thermal well – independently of the geothermal
district heat supply of the town. Practically, this
thermal well would utilize the thermal water of the
Upper Pannon layer, just like to the well at Aqua-Park
marked ZG-3. This means that expectedly it would
yield 40 to 45°C thermal water with a bottom
deepness of about 900 to 950 m. This thermal water
may be suitable to heat the sports and leisure pools
and maintain their temperature as well as to supply the
fill–discharge system of the warm water pools
directly. Of course, this thermal water can be used
also for heating the swimming pool building and for
domestic hot water supply – possibly supported by
heat pump.
Usage of CH-dry wells
Based on the experience obtained in thermal water
utilization in Hungary, transformation of dry
hydrocarbon wells into thermal water production is
not successful and economical in all cases because
state and tubing of the well may cause
problems;
subsequent filter tubing results in strong
choking;
production is possible with compressor-
supported artificial exploitation only (e.g. in
Kiskunmajsa), diving pumps cannot be
applied.
Due to these risk factors, usage of abandoned
hydrocarbon wells is not recommended.
Locations of the new thermal wells proposed
On the map, we propose two locations for establishing
new wells:
- Békeliget and
- the area between the shopping center and
railways.
Optimum distance of these well locations and
convenient situation of the thermal water complex
justify this selection. However, the precise well
locations will be defined based on deep-going
thermal water geological, seismological and other.
4. Estimated investment costs of stage I
Decrease of expenses (cost reduction)
Heating demand of consumers varies with weather
and time within a day. These variations can be
controlled. Outdated equipment pieces are manually
controlled, but changes in heat demand can be
controlled manually with considerable inaccuracy
only, leading to wasting operation. Expenses can only
be reduced by controllability of the internal
temperature of consumers. Control of internal
temperature depending on weather and time of day
can be realized with central control valves or
thermostatic valves mounted to the heating panels. Via
control on the consumer side, the circulated thermal
water quantity can be changed, and this way, a
thermal water consumption corresponding to changes
of weather and times of day can be realized. Instead of
choke and mix control of pumps used for thermal
water transport, significant energy saving can be
attained by changing revolutions controlled by
frequency changer.
After optimizing internal temperature and thermal
water quantity circulated, control of water quantity
exploited from the thermal well is the next task. In the
case of a positive well, it can be solved by a control
valve while in the case of mechanical exploitation, it
is possible by changing number of revolutions of the
drowned pump. In this case, we propose control of
revolutions of drowned pumps.
GEOTHERMAL HEATING OF PUBLIC BUILDINGS IN DOWNTOWN ZALAEGERSZEG
Heating with varying volume flow instead of constant
volume flow results in reduction of thermal water and
energy consumption. For comparison, we give here
annual water quantity circulated in a 90/70°C system
controlled alone by quality (constant volume flow)
and controlled alone by quantity (varying volume
flow) for one unit of heat output demand (1,000 kW)
when thermal water temperature is 95°C. While in a
system of constant volume flow, the circulated water
quantity is annually 47,300 cubic meters, in a system
of varying volume flow, 33,800 cubic meters pro year
are sufficient, and this means almost 30% saving.
For performing control tasks, freely programmable
controllers (PLCs, DDCs) can be applied, enabling
implementation of monitoring systems.
Fig. 1.Plannedgridtrack and wellschema
5. Design of a district heating grid based on
geothermal energy
District heat supply is an important sector of
energetics industry both in Europe and in Hungary.
650 thousand flats constructed with prefabricated
technology in the past decades are heated with
district heat. Grid-based utilities play essential role in
settlements. Among utility grids, district heating
systems represent the most complex technology.
They are equipment-intensive, their investments and
operation are expensive, while their role is important
in energetics because they allow realizing co-
generation of heat and electricity and they ideally
facilitate utilization of renewable energy carriers and
fulfil guidelines formulated in energy policy of the
European Union. Unfortunately, in Hungary, thermal
water based district heat supply operates in about ten
settlements only. In the next years, we expect changes
in this field and hope that an increasing number of
settlements will utilize thermodynamic and economic
advantages of thermal water. Geological capabilities
of Zalaegerszeg and its region provide excellent
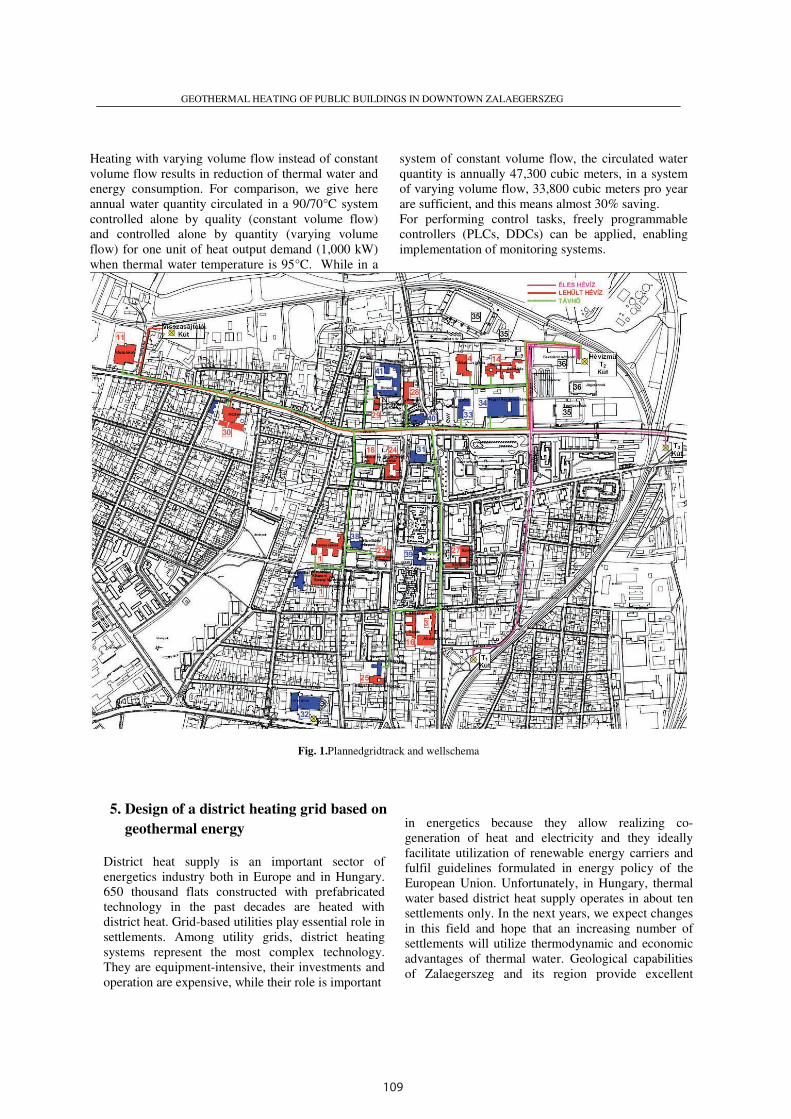
109
GEOTHERMAL HEATING OF PUBLIC BUILDINGS IN DOWNTOWN ZALAEGERSZEG
2. Foreseeable design of the proposed new
geothermal heat source
In the first stage of the development, public buildings
marked red on the map (ones defined by the
municipality) are designated for geothermal heat
supply. Additional buildings identified by us during
our on-site review (marked blue) will also join the
geothermal heat supply.
The district heat supply system is radially arranged.
On the heat source side, there are 3 wells (marked T1,
T2, T3) from where thermal water is transferred to the
thermal water complex [primary side]. Here starts the
district heat supply grid, filled up with soft water of
varying mass flow, and goes to the individual
buildings. The recipient thermal centers may be
designed as direct thermal centers during the future
design process.
The cooled down thermal water comes to the injection
well, while also the heat supply of the nearby two
secondary schools can be solved by the cooled down
water using heat pumps.
3. Proposal for thermal water supply of
the swimming pool of the town
For heat supply and thermal water supply of the
swimming pool of the town we suggest boring a new
thermal well – independently of the geothermal
district heat supply of the town. Practically, this
thermal well would utilize the thermal water of the
Upper Pannon layer, just like to the well at Aqua-Park
marked ZG-3. This means that expectedly it would
yield 40 to 45°C thermal water with a bottom
deepness of about 900 to 950 m. This thermal water
may be suitable to heat the sports and leisure pools
and maintain their temperature as well as to supply the
fill–discharge system of the warm water pools
directly. Of course, this thermal water can be used
also for heating the swimming pool building and for
domestic hot water supply – possibly supported by
heat pump.
Usage of CH-dry wells
Based on the experience obtained in thermal water
utilization in Hungary, transformation of dry
hydrocarbon wells into thermal water production is
not successful and economical in all cases because
state and tubing of the well may cause
problems;
subsequent filter tubing results in strong
choking;
production is possible with compressor-
supported artificial exploitation only (e.g. in
Kiskunmajsa), diving pumps cannot be
applied.
Due to these risk factors, usage of abandoned
hydrocarbon wells is not recommended.
Locations of the new thermal wells proposed
On the map, we propose two locations for establishing
new wells:
- Békeliget and
- the area between the shopping center and
railways.
Optimum distance of these well locations and
convenient situation of the thermal water complex
justify this selection. However, the precise well
locations will be defined based on deep-going
thermal water geological, seismological and other.
4. Estimated investment costs of stage I
Decrease of expenses (cost reduction)
Heating demand of consumers varies with weather
and time within a day. These variations can be
controlled. Outdated equipment pieces are manually
controlled, but changes in heat demand can be
controlled manually with considerable inaccuracy
only, leading to wasting operation. Expenses can only
be reduced by controllability of the internal
temperature of consumers. Control of internal
temperature depending on weather and time of day
can be realized with central control valves or
thermostatic valves mounted to the heating panels. Via
control on the consumer side, the circulated thermal
water quantity can be changed, and this way, a
thermal water consumption corresponding to changes
of weather and times of day can be realized. Instead of
choke and mix control of pumps used for thermal
water transport, significant energy saving can be
attained by changing revolutions controlled by
frequency changer.
After optimizing internal temperature and thermal
water quantity circulated, control of water quantity
exploited from the thermal well is the next task. In the
case of a positive well, it can be solved by a control
valve while in the case of mechanical exploitation, it
is possible by changing number of revolutions of the
drowned pump. In this case, we propose control of
revolutions of drowned pumps.
GEOTHERMAL HEATING OF PUBLIC BUILDINGS IN DOWNTOWN ZALAEGERSZEG
Heating with varying volume flow instead of constant
volume flow results in reduction of thermal water and
energy consumption. For comparison, we give here
annual water quantity circulated in a 90/70°C system
controlled alone by quality (constant volume flow)
and controlled alone by quantity (varying volume
flow) for one unit of heat output demand (1,000 kW)
when thermal water temperature is 95°C. While in a
system of constant volume flow, the circulated water
quantity is annually 47,300 cubic meters, in a system
of varying volume flow, 33,800 cubic meters pro year
are sufficient, and this means almost 30% saving.
For performing control tasks, freely programmable
controllers (PLCs, DDCs) can be applied, enabling
implementation of monitoring systems.
Fig. 1.Plannedgridtrack and wellschema
5. Design of a district heating grid based on
geothermal energy
District heat supply is an important sector of
energetics industry both in Europe and in Hungary.
650 thousand flats constructed with prefabricated
technology in the past decades are heated with
district heat. Grid-based utilities play essential role in
settlements. Among utility grids, district heating
systems represent the most complex technology.
They are equipment-intensive, their investments and
operation are expensive, while their role is important
in energetics because they allow realizing co-
generation of heat and electricity and they ideally
facilitate utilization of renewable energy carriers and
fulfil guidelines formulated in energy policy of the
European Union. Unfortunately, in Hungary, thermal
water based district heat supply operates in about ten
settlements only. In the next years, we expect changes
in this field and hope that an increasing number of
settlements will utilize thermodynamic and economic
advantages of thermal water. Geological capabilities
of Zalaegerszeg and its region provide excellent

110
4
GEOTHERMAL HEATING OF PUBLIC BUILDINGS IN DOWNTOWN ZALAEGERSZEG
opportunities for utilizing geothermal energy as well
as for generating high-enthalpy thermal water.
Economic utilization of thermal water and expansion
of its application by a wide range of consumers may
be allowed by constructing a district heating system.
Economic optimization of establishing and operating
district heating systems may reduce costs of district
heating considerably. Optimization of construction
means definition of optimum tube diameters.
Grid planning
We propose a pipeline track system of radial topology
that can be constructed in multiple stages. We have
dimensioned the grid and pipeline diameters so that
they cover also demands of the second stage. The grid
will be designed for the reviewed number of
consumers based on the specified heat demands. We
regard temperature of the exploited thermal water to be
85 to 90 °C and, based on it, we construct an indirect
system of district heating grid of a primary temperature
drop of 80-50 °C. Usually, consumers are placed in a
separate heat center, and we reckon with convertibility
of the existing thermal centers. Basedon experience,
heat centers and secondary systems are exaggerated,
and the previous temperature drop of 90-70°C can be
replaced by a temperature drop of 70-55°C.
Fundamental formulas applied within calculations:
• Mass flow:
m = − .
Temperature values in the formula: = 80° and = 50 °.
• Volume flow:
= .
• Flow rate:
v =
.
• Reynolds number:
= ∙ .
• Coefficient of pipe friction:
Coefficient of pipe friction λ is calculated within
iteration steps by the help of Colebrook-White
relation because flow occurs in the range called
transient zone.
1√ = −2 ∙ 3,7 ∙
+ 2,51√ .
• Specific resistance:
= + 8 ∙
∙ .
• Pressure drop based on the hydraulic Ohm’s law:
Δp = ∙ .
References
[1] Garbai L., Kontra J.: Zalaegerszegváros geotermális alapú távhő
ellátása (Geothermal sourced district heat supply of town
Zalaegerszeg) (study), Budapest, 2015
[2] Kontra J., Varga J.: Távhő Cselekvési Terv Geotermális
energetikai fejezete (District Heat Action Plan, Section
Geothermal Energetics) Budapest, 2013
[3] Kontra J.: Lakitelek Népfőiskola geotermális energia hasznosítási
és épület rekonstrukciós tervezésés tanulmány (Geothermal
energy utilization and building reconstruction plan and study of
Lakitelek College) Budapest, 2012
[4] Nyers J.: COP and Economic Analysis of the Heat
Recovery from Waste Water using Heat Pumps,
International J. Acta Polytechnica Hungarica Vol. 13, No.
5, 2016. DOI: 10.12700/APH.13.5.2016.5.8.
[5] Kurčová M., Ehrenwald P.: Possibility Cooperation of
Space Heating System with Heat Pump, 8th International
Symposium on Exploitation of Renewable Energy
Sources, EXPRES 2016, Subotica, Serbia, Proceedings
pp. 52-56, ISBN 978-86-919769-0-3.
[6] Nyers J.: A new analytical method for defining the
pump's power optimum of a water-to-water heat pump
heating system using COP, I J Thermal Science, pp 324.
2016, online. DOI 10.2298/TSCI161110324N
[7] Zuza Straková, Ján Takács: The Mechanical Ventilation
for Large-Area Buildings of Engineering Industry, 8th
International Symposium on Exploitation of Renewable
Energy Sources, EXPRES 2016, Subotica, Serbia,
Proceedings pp. 41-45, ISBN 978-86-919769-0-3.
[8] Belo B. Füri: Experimental Measurements with Methanol
filled vertical Thermo-siphon for receiving Energy of
Environment, Symposium EXPRES 2016, Subotica,
Serbia, Proceedings pp. 20-24, ISBN 978-86-919769-0-
3.
THERMAL COMFORT TESTS USING THERMAL MANIKINS EXPRES 2017 ISBN 978-86-919769-1-0
Thermal comfort tests using thermal manikin BALÁZS CAKÓ
PhD Student
Breuer Marcell Doctorial School, University of Pécs, Faculty of Engineering and Information Technology
Department of Mechanical Engineering at University of Pécs, Faculty of Engineering and Information Technology
2 Boszorkány u.,H-7626 Pécs Hungary
E-mail:[email protected]
Keywords:thermal manikin, comfort theory, thermal comfort, test chamber
1. Introduction People spend almost 90% of their lives indoors,
therefore it is essential that designedinteriors should
provide comfortable circumstances where one can
feel fine and is capable of achieving optimal
performance both in terms of physical and mental
work. Comfort theory as a scientific field of research
has been given priority amongst research areas only in
the past few decades. Research showsthat physical
parameters such as air temperature, humidity, air
velocity and temperature of the surface that human
thermal sensation of the enclosed interior play
significant role in the development of human thermal
sensation. Obviously, other parameters such as air
movement, noise, lighting and a variety of radiations
(ionization, solar radiation, vibration)also contributeto
the achievement of optimal well-being. In my
research, I mainly study thermal comfort, i.e.the
impacts of temperature, humidity and air movement
on human well-being. Human thermal sensation or
thermal comfort is defined by ASHRAE (1981) 55-81
standard as follows: "Pleasant thermal sensation is a
state of mind expressing satisfaction in terms of
thermal environment."
2. An Overview of Comfort Theory
One’s satisfaction in terms of thermal environment is
determined by the heat and mass transfer between the
body and the environment, which is greatly
influenced by the activity being done, the
environment and clothing. The activity has a great
impact on the heat production, heat loss and heat
control of a human body. Mass transport largely
depends on air temperature, its spatial and temporal
distribution and change, the medium radiation of the
ambient surfaces, as well as the partial pressure of
water vapour in air and air speed. In addition, is
depends on the thermal insulation of clothing and the
way affects evaporation.
Human body develops heat in four ways: convection
(32-35%), radiation (42-44%), evaporation (21-26%),
and conduction (breathing) (2-4%). Their extent
highly depends on the temperature of the human
body, the surrounding air and surfaces, which is
illustrated in the following diagram.
Fig. 1. Correlation between temperature and heat loss
If, for sake of interpretation, the temperature of the
human body is considered constant and independent
of outside temperature, it can be seen that when the
outside temperature increases, dry heat loss is
reduced, while wet heat loss increasesin order the
0
20
40
60
80
100
120
140
160
10 20 30
Heat
loss
[W]
Temperature [°C]
Total heat loss= dry+wet
Dry heat loss= radiation+convection
Heat loss by radiation Heat loss by Convection
Wet heat loss= evaporation + breathing Heat loss by evaporation
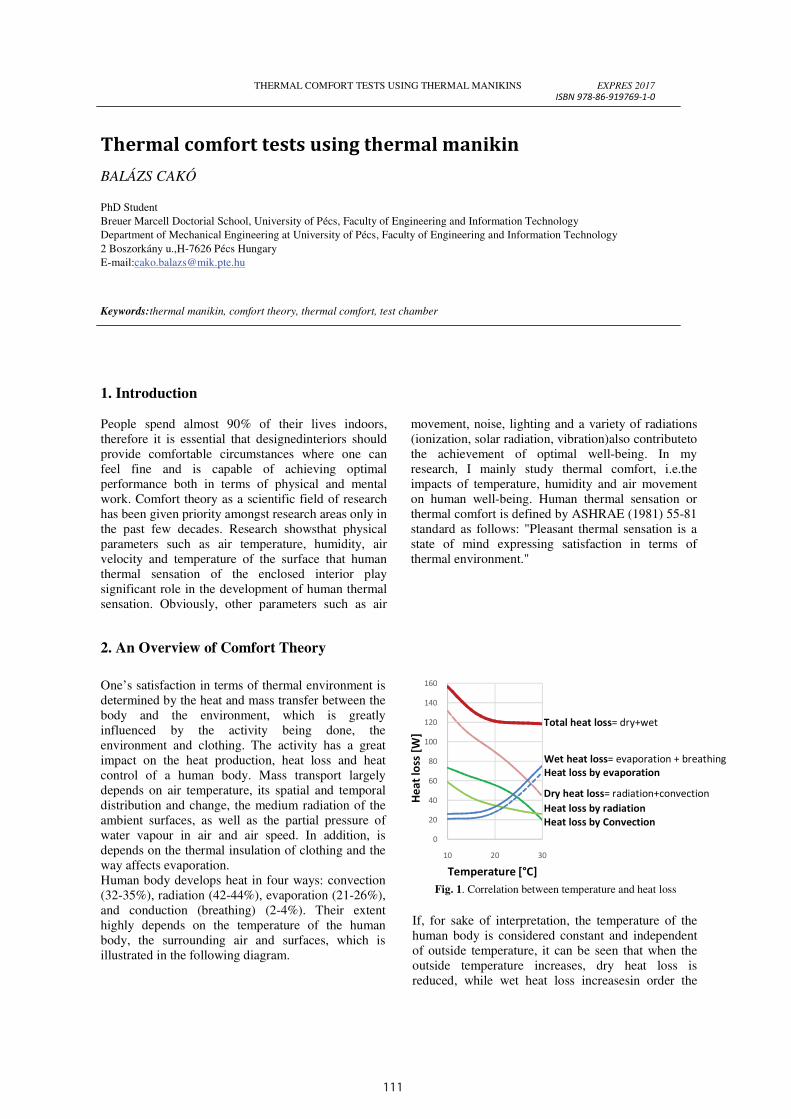
111
4
GEOTHERMAL HEATING OF PUBLIC BUILDINGS IN DOWNTOWN ZALAEGERSZEG
opportunities for utilizing geothermal energy as well
as for generating high-enthalpy thermal water.
Economic utilization of thermal water and expansion
of its application by a wide range of consumers may
be allowed by constructing a district heating system.
Economic optimization of establishing and operating
district heating systems may reduce costs of district
heating considerably. Optimization of construction
means definition of optimum tube diameters.
Grid planning
We propose a pipeline track system of radial topology
that can be constructed in multiple stages. We have
dimensioned the grid and pipeline diameters so that
they cover also demands of the second stage. The grid
will be designed for the reviewed number of
consumers based on the specified heat demands. We
regard temperature of the exploited thermal water to be
85 to 90 °C and, based on it, we construct an indirect
system of district heating grid of a primary temperature
drop of 80-50 °C. Usually, consumers are placed in a
separate heat center, and we reckon with convertibility
of the existing thermal centers. Basedon experience,
heat centers and secondary systems are exaggerated,
and the previous temperature drop of 90-70°C can be
replaced by a temperature drop of 70-55°C.
Fundamental formulas applied within calculations:
• Mass flow:
m = − .
Temperature values in the formula: = 80° and = 50 °.
• Volume flow:
= .
• Flow rate:
v =
.
• Reynolds number:
= ∙ .
• Coefficient of pipe friction:
Coefficient of pipe friction λ is calculated within
iteration steps by the help of Colebrook-White
relation because flow occurs in the range called
transient zone.
1√ = −2 ∙ 3,7 ∙
+ 2,51√ .
• Specific resistance:
= + 8 ∙
∙ .
• Pressure drop based on the hydraulic Ohm’s law:
Δp = ∙ .
References
[1] Garbai L., Kontra J.: Zalaegerszegváros geotermális alapú távhő
ellátása (Geothermal sourced district heat supply of town
Zalaegerszeg) (study), Budapest, 2015
[2] Kontra J., Varga J.: Távhő Cselekvési Terv Geotermális
energetikai fejezete (District Heat Action Plan, Section
Geothermal Energetics) Budapest, 2013
[3] Kontra J.: Lakitelek Népfőiskola geotermális energia hasznosítási
és épület rekonstrukciós tervezésés tanulmány (Geothermal
energy utilization and building reconstruction plan and study of
Lakitelek College) Budapest, 2012
[4] Nyers J.: COP and Economic Analysis of the Heat
Recovery from Waste Water using Heat Pumps,
International J. Acta Polytechnica Hungarica Vol. 13, No.
5, 2016. DOI: 10.12700/APH.13.5.2016.5.8.
[5] Kurčová M., Ehrenwald P.: Possibility Cooperation of
Space Heating System with Heat Pump, 8th International
Symposium on Exploitation of Renewable Energy
Sources, EXPRES 2016, Subotica, Serbia, Proceedings
pp. 52-56, ISBN 978-86-919769-0-3.
[6] Nyers J.: A new analytical method for defining the
pump's power optimum of a water-to-water heat pump
heating system using COP, I J Thermal Science, pp 324.
2016, online. DOI 10.2298/TSCI161110324N
[7] Zuza Straková, Ján Takács: The Mechanical Ventilation
for Large-Area Buildings of Engineering Industry, 8th
International Symposium on Exploitation of Renewable
Energy Sources, EXPRES 2016, Subotica, Serbia,
Proceedings pp. 41-45, ISBN 978-86-919769-0-3.
[8] Belo B. Füri: Experimental Measurements with Methanol
filled vertical Thermo-siphon for receiving Energy of
Environment, Symposium EXPRES 2016, Subotica,
Serbia, Proceedings pp. 20-24, ISBN 978-86-919769-0-
3.
THERMAL COMFORT TESTS USING THERMAL MANIKINS EXPRES 2017 ISBN 978-86-919769-1-0
Thermal comfort tests using thermal manikin BALÁZS CAKÓ
PhD Student
Breuer Marcell Doctorial School, University of Pécs, Faculty of Engineering and Information Technology
Department of Mechanical Engineering at University of Pécs, Faculty of Engineering and Information Technology
2 Boszorkány u.,H-7626 Pécs Hungary
E-mail:[email protected]
Keywords:thermal manikin, comfort theory, thermal comfort, test chamber
1. Introduction People spend almost 90% of their lives indoors,
therefore it is essential that designedinteriors should
provide comfortable circumstances where one can
feel fine and is capable of achieving optimal
performance both in terms of physical and mental
work. Comfort theory as a scientific field of research
has been given priority amongst research areas only in
the past few decades. Research showsthat physical
parameters such as air temperature, humidity, air
velocity and temperature of the surface that human
thermal sensation of the enclosed interior play
significant role in the development of human thermal
sensation. Obviously, other parameters such as air
movement, noise, lighting and a variety of radiations
(ionization, solar radiation, vibration)also contributeto
the achievement of optimal well-being. In my
research, I mainly study thermal comfort, i.e.the
impacts of temperature, humidity and air movement
on human well-being. Human thermal sensation or
thermal comfort is defined by ASHRAE (1981) 55-81
standard as follows: "Pleasant thermal sensation is a
state of mind expressing satisfaction in terms of
thermal environment."
2. An Overview of Comfort Theory
One’s satisfaction in terms of thermal environment is
determined by the heat and mass transfer between the
body and the environment, which is greatly
influenced by the activity being done, the
environment and clothing. The activity has a great
impact on the heat production, heat loss and heat
control of a human body. Mass transport largely
depends on air temperature, its spatial and temporal
distribution and change, the medium radiation of the
ambient surfaces, as well as the partial pressure of
water vapour in air and air speed. In addition, is
depends on the thermal insulation of clothing and the
way affects evaporation.
Human body develops heat in four ways: convection
(32-35%), radiation (42-44%), evaporation (21-26%),
and conduction (breathing) (2-4%). Their extent
highly depends on the temperature of the human
body, the surrounding air and surfaces, which is
illustrated in the following diagram.
Fig. 1. Correlation between temperature and heat loss
If, for sake of interpretation, the temperature of the
human body is considered constant and independent
of outside temperature, it can be seen that when the
outside temperature increases, dry heat loss is
reduced, while wet heat loss increasesin order the
0
20
40
60
80
100
120
140
160
10 20 30
Heat
loss
[W]
Temperature [°C]
Total heat loss= dry+wet
Dry heat loss= radiation+convection
Heat loss by radiation Heat loss by Convection
Wet heat loss= evaporation + breathing Heat loss by evaporation

112
THERMAL COMFORT TESTS USING THERMAL MANIKINS
body could lose the heat produced during metabolic
processes. One of the tools of the in-depth assessment
of these effects is a thermal manikin.
research conducted with thermal manikins does not
usually include test done with perspiring manikins,
and the available literature do not address
sufficient detail. Therefore, my aim is
3. Background
Thermal manikins were originally developed for
US military to test protective clothing,
thermal sensation research was carried out with
Instead of subjective judgment, thermal manikin
offered a better, more accurate optionto conduct further
comfort-theory tests and applications in
medicine. The historical background of m
that at we carried out thermal comfort studies led by
Zoltán Magyar at the University of Pécs, Faculty of
Engineering and Information Technology
the following) with a thermal manikin currently owned
by the Budapest University of Technology and
Economics. Utilizing the research conducted
education, I carried outradiation asymmetry
measured the thermal capacity of various
practice classes.
Fig. 2. Segments of
thethermal manikin
The thermal manikin used for the research
assembled by Swedish professionals at the
Architecturein the 1980s. This manikin later
Department of Building Engineering at the Budapest
University of Technology, the University of Pécs was
the Department of Mechanical Engineering
University of Pécs, Faculty of Engineering and
Information Technology received it in 2010 for
research purposes, where a new, state of the art data
logger and software for processing was installed in it
The thermal manikin is a model made up of a thermal
The test chamber used in the tests is found at
THERMAL COMFORT TESTS USING THERMAL MANIKINS ISBN 978-86
produced during metabolic
depth assessment
thermal manikin. Currently,
conducted with thermal manikins does not
include test done with perspiring manikins,
the available literature do not address this topic in
, my aim is to expand
knowledge on thermal comfort, particularly due to
evaporation. The research aims to explore the
combined effects of the factors
comfort, and to complement the current evidence
earlier researches. The expected result is a
algorithm for designing thermal comfort, which
could be included in the relevant standards
originally developed for the
test protective clothing, and later
carried out with them.
hermal manikins
tionto conduct further
applications in human
The historical background of my research is
carried out thermal comfort studies led by dr.
University of Pécs, Faculty of
Engineering and Information Technology (UPFEIT in
currently owned
by the Budapest University of Technology and
he research conducted there in
radiation asymmetry tests and
various during test
The thermal manikin used for the research was
professionals at the Institute of
later got to the
at the Budapest
, the University of Pécs was
the Department of Mechanical Engineering at
University of Pécs, Faculty of Engineering and
Information Technology received it in 2010 for
, where a new, state of the art data
was installed in it.
made up of a thermal
test body, a control unit, data logger and
display carrying outdata processing and display
test body was developed from a plastic dummy that has
the same dimensions as those of an average adult.The
body is a fiberglass reinforced polyester shell,
items providing mechanical support
cavities of it, as well as the pipes required for
the flat cables leading to each body part
the manikin was divided into 18 segments
wires were recessed in the surface of
(section). An aluminium layer of 0.4 mm average
thickness was applied on the
insulation layer by using metal spraying technology,
order to achieve a more uniform temperature
distribution on the whole surface.
testing is to measure the electrical power needed to
maintain the required surface temperature of the heated
body part.
Fig. 3. Thethermal manikinduring testing
The test chamber used in the tests is found at Department of Mechanical Engineering at University
EXPRES 2017 86-919769-1-0
thermal comfort, particularly due to
evaporation. The research aims to explore the
affecting thermal
complement the current evidence of
. The expected result is a refined
thermal comfort, which later
be included in the relevant standards.
control unit, data logger and a computer
carrying outdata processing and display.The
test body was developed from a plastic dummy that has
the same dimensions as those of an average adult.The
fiberglass reinforced polyester shell, and the
items providing mechanical support were fitted into the
pipes required for hiding
body part. The surface of
segments, and heating
wires were recessed in the surface of each body part
An aluminium layer of 0.4 mm average
e plastic electrical
etal spraying technology, in
to achieve a more uniform temperature
. The principle of
testing is to measure the electrical power needed to
maintain the required surface temperature of the heated
during testing
Department of Mechanical Engineering at University
THERMAL COMFORT TESTS USING THERMAL MANIKINS
of Pécs, Faculty of Engineering and Information
Technology, ant it is a chamber developed in
accordance with the requirements of the relevant
standards and literature for thermal comfort tests, as
4. Previous experiences
A number of problems resented themselves during t
research, industrial orders and the labor
including the maintenance of the existing thermal
manikin, which is quite complicated due to
structural design. In addition, during the
arecurring demand to carry out test breaking down
individual parts of the body
segmentse.g.:when gloves and other complex
clothing were tested. The given surfaces of the test
chamber werealso required to be divided
sub-surfaces of markedly different temperature
to carry out thermal sensation tests modelling ordinary
buildings (radiators located under the windows
test software developed by UPFEITfor the previous
dummy also proved to be difficult, data processing
required a lot of subsequent work and very large
amounts of data had to be used. In view of t
5. The proposedchamber and manikin
The design of the proposed test chamber
from that of the current one. Surfaces are going to be
divided to a number of surface elements that
controlled independently. My further aim
opportunity to realise all possible air
feasible in a space of that in orderto be able to test how
different air conduction systems affect thermal comfort
In addition, my goal is to create a test chamber
humidity can be controlled. The chamber and the wire
networks are going to be designed to be suitable for
medical research (operating room, occupational
tests, etc.). The development of surfaces providing
markedly different surface temperature
complicated by using traditional surface heating and
cooling fields, and the transition of surface temperature
would be not marked enough.For these reasons we
rejected the systems applying water
approach, Peltier modules might offer a solution
advantage of them is that they can heat and cool, the
change can be easily solved without using
are characterized by rapid response, so they might
be used in different shock tests. The surface of the
chamber will be divided to 250x250 mm surface
sections, the surface will be made ofsome material of
good thermal conductivity; the first idea is to apply
copper, which may change depending on
resources available.
THERMAL COMFORT TESTS USING THERMAL MANIKINS ISBN 978-86
of Pécs, Faculty of Engineering and Information
Technology, ant it is a chamber developed in
accordance with the requirements of the relevant
standards and literature for thermal comfort tests, as
well as for measuring the performance of heat emitters.
The chamber is 4 m long, 3.5 m wide and 2.9 m high.
Every surface of the test chamber
cooled separately, thereby it is suitable to perform
radiation asymmetry and comfort tests as well
resented themselves during the
research, industrial orders and the laboratory tests,
existing thermal
which is quite complicated due to its
during the tests, it was
o carry out test breaking down the
individual parts of the body to further
gloves and other complex items of
given surfaces of the test
divided further into
temperature in order
to carry out thermal sensation tests modelling ordinary
the windows). The
for the previous
, data processing
and very large
In view of these
experiences, may aim is to develop a
thermal manikin and testchamberthan the one used
before, and apply them for thermal comfort
Fig. 4. Software carrying out the tests
nikin
chamber differs greatly
Surfaces are going to be
elements that can be
aim is to provide
all possible air conduction
be able to test how
thermal comfort.
chamber where
. The chamber and the wire
designed to be suitable for
occupational health
opment of surfaces providing
surface temperature is too
traditional surface heating and
surface temperature
For these reasons we
applying water. As a first
modules might offer a solution. The
heat and cool, the
ing valves. They
so they might also
n different shock tests. The surface of the
250x250 mm surface
made ofsome material of
; the first idea is to apply
depending on the financial
Fig. 5. Conceptional development of surface treatment
The Peltier modules will be fixed on the
surface, then heat sinks will be mounted on them
The backside of the module will be
order to provide uniform distribution of the surface
temperature,the copper surface
wallpapered or painted. A specific software is
going to control the Peltier modules
During the development of thermal manikin
surface of the manikin will be divided to more
segments than that of the earlier one, andour
to create a manikin that is able to evaporat
perspire. While developingthe final concept
going to usemy past experiences and
colleagueswith medical background
controlling testing is going to be developed in a
way that both the collection and evaluation of data
would be carried out easier than
EXPRES 2017 86-919769-1-0
well as for measuring the performance of heat emitters.
The chamber is 4 m long, 3.5 m wide and 2.9 m high.
can be heated and
ly, thereby it is suitable to perform
tests as well.
, may aim is to develop a more advanced
than the one used
thermal comfort tests.
Software carrying out the tests
development of surface treatment
modules will be fixed on the copper
s will be mounted on them.
ckside of the module will be insulated. In
distribution of the surface
copper surface will be either
A specific software is
modules.
During the development of thermal manikin, the
surface of the manikin will be divided to more
earlier one, andour aim is
able to evaporate, and
final concept, I am
past experiences and involve
al background. The software
going to be developed in a
both the collection and evaluation of data
easier than before.
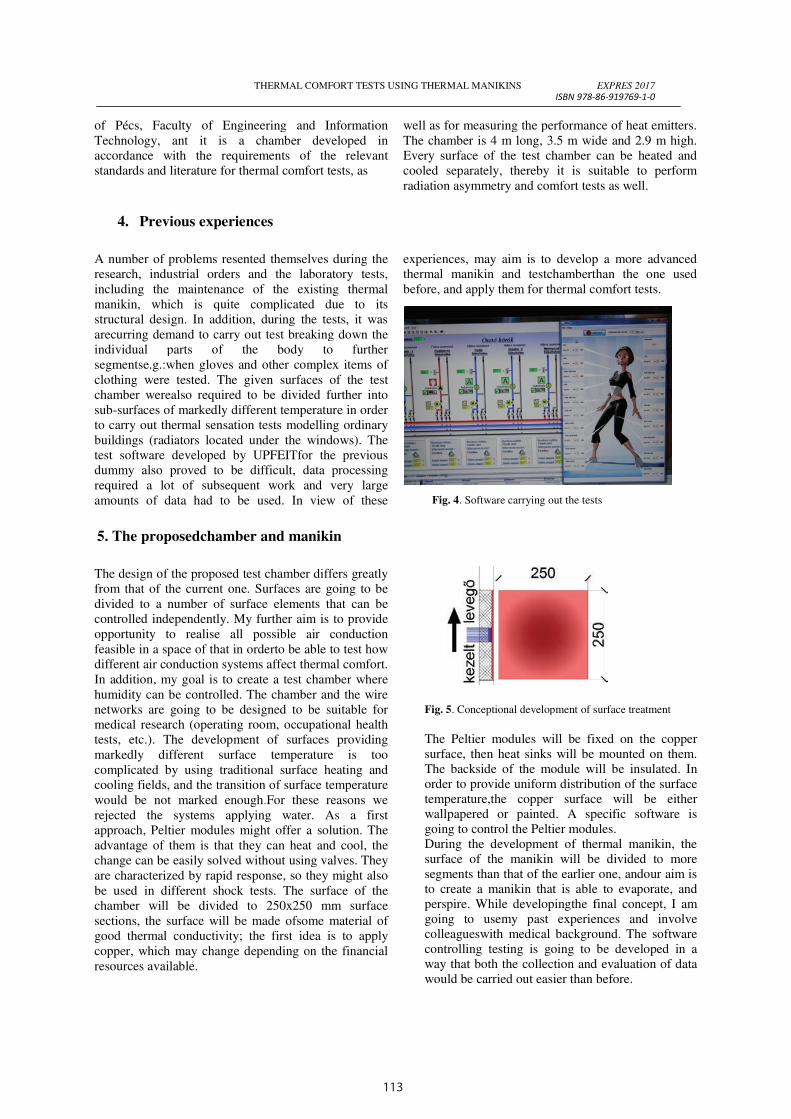
113
THERMAL COMFORT TESTS USING THERMAL MANIKINS
body could lose the heat produced during metabolic
processes. One of the tools of the in-depth assessment
of these effects is a thermal manikin.
research conducted with thermal manikins does not
usually include test done with perspiring manikins,
and the available literature do not address
sufficient detail. Therefore, my aim is
3. Background
Thermal manikins were originally developed for
US military to test protective clothing,
thermal sensation research was carried out with
Instead of subjective judgment, thermal manikin
offered a better, more accurate optionto conduct further
comfort-theory tests and applications in
medicine. The historical background of m
that at we carried out thermal comfort studies led by
Zoltán Magyar at the University of Pécs, Faculty of
Engineering and Information Technology
the following) with a thermal manikin currently owned
by the Budapest University of Technology and
Economics. Utilizing the research conducted
education, I carried outradiation asymmetry
measured the thermal capacity of various
practice classes.
Fig. 2. Segments of
thethermal manikin
The thermal manikin used for the research
assembled by Swedish professionals at the
Architecturein the 1980s. This manikin later
Department of Building Engineering at the Budapest
University of Technology, the University of Pécs was
the Department of Mechanical Engineering
University of Pécs, Faculty of Engineering and
Information Technology received it in 2010 for
research purposes, where a new, state of the art data
logger and software for processing was installed in it
The thermal manikin is a model made up of a thermal
The test chamber used in the tests is found at
THERMAL COMFORT TESTS USING THERMAL MANIKINS ISBN 978-86
produced during metabolic
depth assessment
thermal manikin. Currently,
conducted with thermal manikins does not
include test done with perspiring manikins,
the available literature do not address this topic in
, my aim is to expand
knowledge on thermal comfort, particularly due to
evaporation. The research aims to explore the
combined effects of the factors
comfort, and to complement the current evidence
earlier researches. The expected result is a
algorithm for designing thermal comfort, which
could be included in the relevant standards
originally developed for the
test protective clothing, and later
carried out with them.
hermal manikins
tionto conduct further
applications in human
The historical background of my research is
carried out thermal comfort studies led by dr.
University of Pécs, Faculty of
Engineering and Information Technology (UPFEIT in
currently owned
by the Budapest University of Technology and
he research conducted there in
radiation asymmetry tests and
various during test
The thermal manikin used for the research was
professionals at the Institute of
later got to the
at the Budapest
, the University of Pécs was
the Department of Mechanical Engineering at
University of Pécs, Faculty of Engineering and
Information Technology received it in 2010 for
, where a new, state of the art data
was installed in it.
made up of a thermal
test body, a control unit, data logger and
display carrying outdata processing and display
test body was developed from a plastic dummy that has
the same dimensions as those of an average adult.The
body is a fiberglass reinforced polyester shell,
items providing mechanical support
cavities of it, as well as the pipes required for
the flat cables leading to each body part
the manikin was divided into 18 segments
wires were recessed in the surface of
(section). An aluminium layer of 0.4 mm average
thickness was applied on the
insulation layer by using metal spraying technology,
order to achieve a more uniform temperature
distribution on the whole surface.
testing is to measure the electrical power needed to
maintain the required surface temperature of the heated
body part.
Fig. 3. Thethermal manikinduring testing
The test chamber used in the tests is found at Department of Mechanical Engineering at University
EXPRES 2017 86-919769-1-0
thermal comfort, particularly due to
evaporation. The research aims to explore the
affecting thermal
complement the current evidence of
. The expected result is a refined
thermal comfort, which later
be included in the relevant standards.
control unit, data logger and a computer
carrying outdata processing and display.The
test body was developed from a plastic dummy that has
the same dimensions as those of an average adult.The
fiberglass reinforced polyester shell, and the
items providing mechanical support were fitted into the
pipes required for hiding
body part. The surface of
segments, and heating
wires were recessed in the surface of each body part
An aluminium layer of 0.4 mm average
e plastic electrical
etal spraying technology, in
to achieve a more uniform temperature
. The principle of
testing is to measure the electrical power needed to
maintain the required surface temperature of the heated
during testing
Department of Mechanical Engineering at University
THERMAL COMFORT TESTS USING THERMAL MANIKINS
of Pécs, Faculty of Engineering and Information
Technology, ant it is a chamber developed in
accordance with the requirements of the relevant
standards and literature for thermal comfort tests, as
4. Previous experiences
A number of problems resented themselves during t
research, industrial orders and the labor
including the maintenance of the existing thermal
manikin, which is quite complicated due to
structural design. In addition, during the
arecurring demand to carry out test breaking down
individual parts of the body
segmentse.g.:when gloves and other complex
clothing were tested. The given surfaces of the test
chamber werealso required to be divided
sub-surfaces of markedly different temperature
to carry out thermal sensation tests modelling ordinary
buildings (radiators located under the windows
test software developed by UPFEITfor the previous
dummy also proved to be difficult, data processing
required a lot of subsequent work and very large
amounts of data had to be used. In view of t
5. The proposedchamber and manikin
The design of the proposed test chamber
from that of the current one. Surfaces are going to be
divided to a number of surface elements that
controlled independently. My further aim
opportunity to realise all possible air
feasible in a space of that in orderto be able to test how
different air conduction systems affect thermal comfort
In addition, my goal is to create a test chamber
humidity can be controlled. The chamber and the wire
networks are going to be designed to be suitable for
medical research (operating room, occupational
tests, etc.). The development of surfaces providing
markedly different surface temperature
complicated by using traditional surface heating and
cooling fields, and the transition of surface temperature
would be not marked enough.For these reasons we
rejected the systems applying water
approach, Peltier modules might offer a solution
advantage of them is that they can heat and cool, the
change can be easily solved without using
are characterized by rapid response, so they might
be used in different shock tests. The surface of the
chamber will be divided to 250x250 mm surface
sections, the surface will be made ofsome material of
good thermal conductivity; the first idea is to apply
copper, which may change depending on
resources available.
THERMAL COMFORT TESTS USING THERMAL MANIKINS ISBN 978-86
of Pécs, Faculty of Engineering and Information
Technology, ant it is a chamber developed in
accordance with the requirements of the relevant
standards and literature for thermal comfort tests, as
well as for measuring the performance of heat emitters.
The chamber is 4 m long, 3.5 m wide and 2.9 m high.
Every surface of the test chamber
cooled separately, thereby it is suitable to perform
radiation asymmetry and comfort tests as well
resented themselves during the
research, industrial orders and the laboratory tests,
existing thermal
which is quite complicated due to its
during the tests, it was
o carry out test breaking down the
individual parts of the body to further
gloves and other complex items of
given surfaces of the test
divided further into
temperature in order
to carry out thermal sensation tests modelling ordinary
the windows). The
for the previous
, data processing
and very large
In view of these
experiences, may aim is to develop a
thermal manikin and testchamberthan the one used
before, and apply them for thermal comfort
Fig. 4. Software carrying out the tests
nikin
chamber differs greatly
Surfaces are going to be
elements that can be
aim is to provide
all possible air conduction
be able to test how
thermal comfort.
chamber where
. The chamber and the wire
designed to be suitable for
occupational health
opment of surfaces providing
surface temperature is too
traditional surface heating and
surface temperature
For these reasons we
applying water. As a first
modules might offer a solution. The
heat and cool, the
ing valves. They
so they might also
n different shock tests. The surface of the
250x250 mm surface
made ofsome material of
; the first idea is to apply
depending on the financial
Fig. 5. Conceptional development of surface treatment
The Peltier modules will be fixed on the
surface, then heat sinks will be mounted on them
The backside of the module will be
order to provide uniform distribution of the surface
temperature,the copper surface
wallpapered or painted. A specific software is
going to control the Peltier modules
During the development of thermal manikin
surface of the manikin will be divided to more
segments than that of the earlier one, andour
to create a manikin that is able to evaporat
perspire. While developingthe final concept
going to usemy past experiences and
colleagueswith medical background
controlling testing is going to be developed in a
way that both the collection and evaluation of data
would be carried out easier than
EXPRES 2017 86-919769-1-0
well as for measuring the performance of heat emitters.
The chamber is 4 m long, 3.5 m wide and 2.9 m high.
can be heated and
ly, thereby it is suitable to perform
tests as well.
, may aim is to develop a more advanced
than the one used
thermal comfort tests.
Software carrying out the tests
development of surface treatment
modules will be fixed on the copper
s will be mounted on them.
ckside of the module will be insulated. In
distribution of the surface
copper surface will be either
A specific software is
modules.
During the development of thermal manikin, the
surface of the manikin will be divided to more
earlier one, andour aim is
able to evaporate, and
final concept, I am
past experiences and involve
al background. The software
going to be developed in a
both the collection and evaluation of data
easier than before.

114
THERMAL COMFORT TESTS USING THERMAL MANIKINS EXPRES 2017
ISBN 978-86-919769-1-0
6. Objectives
My primary aim is to study the boundary
conditions of thermal spaces aiming to meet the
thermal comfort needs in the space studied within
the confines of people - buildings - comfort –
energy relations, as well as to establish a design
algorithm for this, which can be applied more
easily than the existing ones. The algorithm is
expected to be made of* empirical, multifactorial
correlations, thereby it is going to be difficult to
perform the calculations manually, therefore I am
going to develop a simulation program for
dimensioning. I am going to apply the following
research methods:
• Laboratory and simulation tests are going to be
carried out in different temperature conditions
• The factors influencing thermal comfort are
going to be studied by modelling winter and
summer conditions.
• The tests are going to be performed at various
ambient temperatures, and their respective heat
losses are going to be measured by the thermal
manikin.
• I am going to study the evaporative heat loss of
the body surface by evaporation and their
effect on thermal sensation.
• The tests are going to be carried out for various
kinds of clothing.
7. Methods
1. Laboratory test with live subjects: a subjective
thermal sensation tests by live subjects, involving
students, completing comfort tests.
2. Laboratory tests with a manikin: evaporation and
heat loss tests by using a thermal manikin in the
test chamber of the heat engineering laboratory.
8. Acknowledgement
The financial background of my studies has
beenprovided by the EU tender project called
EFOP-3.6.1-16-2016-00004 Extensive
improvements at the University of Pécs in order to
implement smart specialization, Smart engineering
solutions serving health promotion - thermal
comfort. My research has been carried out under the
supervision of Mrs. Eördögh Dr. Márta Mária
project supervisor from the Faculty of Engineering
and Information Technology of University of Pécs,
and under the guidance of Dr. László Fülöp.
References
[1] Révai, T., Magyar, Z., Bánhidi, L., Lenkovics, L., Laborc, Gy.
(2011): Don kanyarban viselt katonaruhába öltöztetett műemberen
végzett hőérzeti mérések. Sereg Szemle, 2011 (3).
[2] Magyar, Z., Ambrus, Cs. (2011): Sugárzási hőmérséklet
aszimmetria vizsgálata thermal manikinrel. Magyar
Épületgépészet, 60 (6) pp.1-5.
[3] Magyar, Z. (2011): Measurements with Thermal Manikin.
Instalatorul, Romania. 2011 (8).
[4] Bánhidi, L., Kajtár L. (2000): Komfortelmélet