Exports of carbon and nitrogen from river basins in Canada`s Atlantic Provinces
10
GLOBAL BIOGEOCHEMICAL CYCLES, VOL. 8, NO. 4, PAGES 441-450, DECEMBER 1994 Exports of carbon and nitrogen from river basins in Canada's Atlantic Provinces T.A. Clair Ecosystem Science Division, Environment Canada, Sackville,New Brunswick,Canada T.L. Pollock Ecosystem Science Division, Environment Canada, Moncton, New Brunswick, Canada J.M. Ehrman Ecosystem Science Division, Environment Canada,Sackville, New Brunswick,Canada Abstract. The lossof carbon and organic nitrogen from the terrestrial ecosystem via streams and rivers is dependent on a number of factors such as basin vegetation, geography, geology, climate,andhydrology. We studied the exportof dissolved carbon and nitrogen from26 rivers varying in size from45 to 92,500 km 2 located in Atlantic Canada. Twenty-fourof the basins studied were free of significant anthropogenic activity and were covered with coniferous and mixed hardwood forests. Our results showed that total organic carbon loss from the region,normalized for area, was approximately 29 kg ha- • yr -•, whileinorganic C was considerably lower at 4.3 kg ha -• yr 4. We developed predictive statistical models using totalprecipitation, basinsize, andbasinslope to predict the exportof organic carbon and nitrogen. Our results suggest that increases in regional precipitation will mostlikely increase the lossof organic carbon and nitrogen from terrestrial systems.We alsofoundthat inorganic carbon and nitrogen were not influenced by precipitation. Inorganic carbon seemed more influenced by geology,and inorganic nitrogen seemed more influenced by basinslope. Introduction Understanding the globalcarbon cyclehasbecome more important because changes in atmospheric carbon dioxide and methane maybe modifying theplanet's climate. Atmospheric carbon concentration is controlled by a number of inputs and outputs many of which are currently poorly quantified. Because of this shortcoming, modelswhich describe carbon movement from sources to sinks on the planetcannot be used to accurately predict variations in the greenhouse effect [International Panel on Climate Change (IPCC), 1992; Sarmiento andSundquist, 1992]. Improving knowledge of the various portions of carbon budgets, including naturalsinks and sources, is necessary to produce educated decisions regarding CO2 emission controls. The transfer of dissolved matterfrom terrestrial ecosys- tems to sediments via rivers andstreams is an important link in global geochemical cycles [Holland, 1984]. Natural biological and geochemical activities in soils and bedrock, as well as Copyright 1994by the American Geophysical Union. Paper number 94GB02311 0886-6236/94/94GB-02311 $10.00 anthropogenic activities, are responsible for the composition of stream andriver water which eventually reaches estuaries and the ocean. The sources, pathways, and quantities of the transported matter will differ from basin to basin because of the different types of terrestrial ecosystems that exist and the various hydrological andclimatic processes thatoccurin them. In terrestrial and wetland ecosystems, plants takeup CO2 from the atmosphere to produce biomass. As plantsdie, or shedleavesand needles, this organicmatter collects in soils. In well-aerated anddrainedsoils, it is thought that mostof the organic matter is eventually fully decomposed to CO2 or methane, producing a stable equilibrium, though the dataare subjectto large potential errors [Crill, 1991]. In poorly drained soils,especially wetlands, incomplete organic decom- position occurring dueto less efficient anaerobic decomposition results in the accumulation of carbon in soils. A portion of this carbon becomes peat, while the remainder is transported as aquaticorganiccarbon(AOC) from soils into streams and rivers by hydrological processes. Eventually, AOC is either converted to CO2in the water column or precipitates into lake and oceansediments where it is either buried or biologically converted to CO2 or methane. Freshwater inorganic carbon is usually measured as alkalinity and is a product of bedrockmineral weathering, aquatic biological respiration, and equilibrium with the 441
Transcript of Exports of carbon and nitrogen from river basins in Canada`s Atlantic Provinces
GLOBAL BIOGEOCHEMICAL CYCLES, VOL. 8, NO. 4, PAGES 441-450, DECEMBER 1994
Exports of carbon and nitrogen from river basins in Canada's Atlantic Provinces
T.A. Clair
Ecosystem Science Division, Environment Canada, Sackville, New Brunswick,Canada
T.L. Pollock
Ecosystem Science Division, Environment Canada, Moncton, New Brunswick, Canada
J.M. Ehrman
Ecosystem Science Division, Environment Canada, Sackville, New Brunswick,Canada
Abstract. The loss of carbon and organic nitrogen from the terrestrial ecosystem via streams and rivers is dependent on a number of factors such as basin vegetation, geography, geology, climate, and hydrology. We studied the export of dissolved carbon and nitrogen from 26 rivers varying in size from 45 to 92,500 km 2 located in Atlantic Canada. Twenty-four of the basins studied were free of significant anthropogenic activity and were covered with coniferous and mixed hardwood forests. Our results showed that
total organic carbon loss from the region, normalized for area, was approximately 29 kg ha- • yr -•, while inorganic C was considerably lower at 4.3 kg ha -• yr 4. We developed predictive statistical models using total precipitation, basin size, and basin slope to predict the export of organic carbon and nitrogen. Our results suggest that increases in regional precipitation will most likely increase the loss of organic carbon and nitrogen from terrestrial systems. We also found that inorganic carbon and nitrogen were not influenced by precipitation. Inorganic carbon seemed more influenced by geology, and inorganic nitrogen seemed more influenced by basin slope.
Introduction
Understanding the global carbon cycle has become more important because changes in atmospheric carbon dioxide and methane may be modifying the planet's climate. Atmospheric carbon concentration is controlled by a number of inputs and outputs many of which are currently poorly quantified. Because of this shortcoming, models which describe carbon movement from sources to sinks on the planet cannot be used to accurately predict variations in the greenhouse effect [International Panel on Climate Change (IPCC), 1992; Sarmiento and Sundquist, 1992]. Improving knowledge of the various portions of carbon budgets, including natural sinks and sources, is necessary to produce educated decisions regarding CO2 emission controls.
The transfer of dissolved matter from terrestrial ecosys- tems to sediments via rivers and streams is an important link in global geochemical cycles [Holland, 1984]. Natural biological and geochemical activities in soils and bedrock, as well as
Copyright 1994 by the American Geophysical Union.
Paper number 94GB02311 0886-6236/94/94GB-02311 $10.00
anthropogenic activities, are responsible for the composition of stream and river water which eventually reaches estuaries and the ocean. The sources, pathways, and quantities of the transported matter will differ from basin to basin because of the different types of terrestrial ecosystems that exist and the various hydrological and climatic processes that occur in them.
In terrestrial and wetland ecosystems, plants take up CO2 from the atmosphere to produce biomass. As plants die, or shed leaves and needles, this organic matter collects in soils. In well-aerated and drained soils, it is thought that most of the organic matter is eventually fully decomposed to CO2 or methane, producing a stable equilibrium, though the data are subject to large potential errors [Crill, 1991]. In poorly drained soils, especially wetlands, incomplete organic decom- position occurring due to less efficient anaerobic decomposition results in the accumulation of carbon in soils. A portion of this carbon becomes peat, while the remainder is transported as aquatic organic carbon (AOC) from soils into streams and rivers by hydrological processes. Eventually, AOC is either converted to CO2 in the water column or precipitates into lake and ocean sediments where it is either buried or biologically converted to CO2 or methane.
Freshwater inorganic carbon is usually measured as alkalinity and is a product of bedrock mineral weathering, aquatic biological respiration, and equilibrium with the
441
442 CLAIR ET AL.: CARBON AND NITROGEN EXPORT FROM CANADIAN RIVERS
atmosphere. It is also transported in river water and can end up in ocean and lake sediments. In certain parts of the world, inorganic C can be the major form of carbon measured in water [Telang et al., 1991]. Depending on conditions, inorganic carbon can be taken up by biota, chemically complexed, or lost to the atmosphere.
How much carbon is exported from terrestrial ecosystems and what controls its transfer are still poorly known. Degens et al. [1991] and Telang et al. [1991] have summarized work assessing carbon losses from the Amazon, the Bramaputra, and a number of the larger northern hemisphere rivers. Though important in providing a rough estimate of carbon losses, their studies cannot easily be used to try to understand the underlying factors which control the carbon exports nor can they be used to estimate losses from areas with large numbers of smaller basins which may be controlled by different environmental conditions. For example, AOC values from neighboring streams in Atlantic Canada can range from 3 to 30 mg L '• .
Meybeck [1993] has also shown that different biomes tend to export different amounts of carbon. He showed that basins located in wet temperate and wet boreal regions tend to export higher dissolved inorganic carbon and organic carbon amounts than tundra or savannah ecosystems and are only exceeded in relative contributions by tropical wetlands. Understanding the underlying causes of these differences could be used to see how changes in climatic variables would change the transfer of C from terrestrial to aquatic ecosystems.
Nitrogen is usually chemically related to organic carbon and is often a limiting nutrient, so.that its loss from ecosystems can significantly reduce biological productivity and thus may impact on further organic matter generation in basins [Tatum, 1991]. Though not strictly a greenhouse gas, changes in terrestrial and freshwater nitrogen budgets may therefore have important climatic consequences by modifying the carbon cycle.
Two major forms of nitrogen are commonly measured in freshwaters, organic and inorganic, the former incorporated into biota or humic substances and the latter as nitrate (NO3-) or ammonium (NH4+). Though both inorganic forms are generally quite low in undisturbed ecosystems, NO3' can often be measured in the freshwaters of Atlantic Canada, while NH4 + rarely is, as it is quickly consumed by plants or is oxidized to NO3-. Ammonium will therefore no longer be considered in this study.
The losses of carbon and nitrogen from basins should be related to a number of biogeographical and climatic factors. Basin vegetation and physiography, geology, rainfall and hydrological routing have been shown to influence freshwater C and N concentrations [Rasmussen et al., 1989; Eckhardt and Moore, 1990]. Rasmussen et al. [1989] found weak but significant correlations between water color, which is often used as a surrogate for AOC, and a number of watershed characteristics such as drainage ratios, watershed slope, and lake depth. Eckhardt and Moore [1990] found similar relation- ships between dissolved organic C concentrations and wetland composition of the basins.
The purpose of this paper is to evaluate the environmental factors which control basin losses of carbon and nitrogen by the hydrological pathway. We do this by producing statistical models using environmental variables which are measured independently of runoff in order to better understand the climatic and geographical phenomena which may be at work. We also compare our export results with other results reported in the literature to place our findings in a global perspective.
Area and Methods
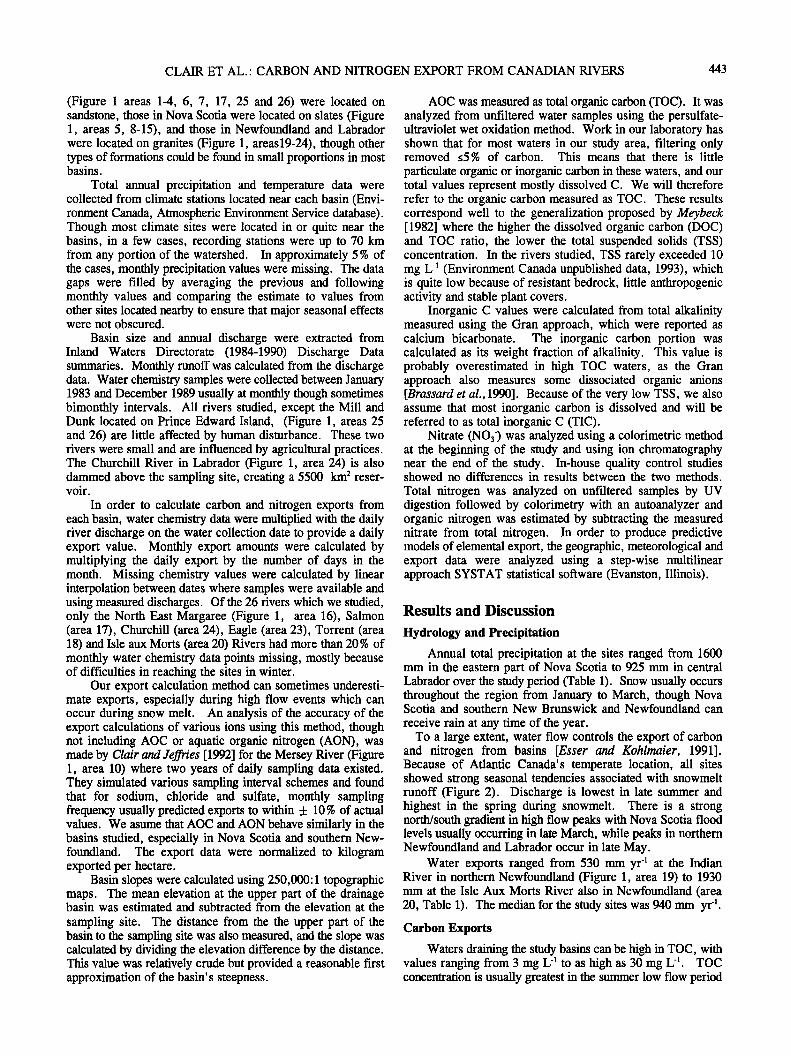
As part of Environment Canada's acid precipitation monitoring network, monthly water sampling was carried out at 26 rivers from January 1983 to December 1989, most of which were located in relatively undisturbed areas throughout the Atlantic Provinces of Canada (Figure 1). The sites were chosen because historical water quantity and quality data existed and they covered much of the region's area and most of its major land types. They were also continuously gauged and visited at regular intervals by trained technicians.
The region is composed of four provinces (New Bruns- wick, Nova Scotia, Newfoundland (including Labrador), and Prince Edward Island) and occupies over 540,000 km 2 in area at the extreme NE portion of North America. Bedrock in the region is diverse, ranging from evaporite deposits in parts of Nova Scotia and Newfoundland to Precambrian granites in Labrador. Shale and sandstones are also commonly found. In many instances, river basins cross several types of bedrock with widely varying weathering potentials [Energy, Mines, and Resources Canada (EMR), 1991]. As the region was recently glaciated, its soils are often thin and poorly drained and often produce little groundwater, especially in Nova Scotia, New- foundland and Labrador.
In order to assess the ability of basins to release inorganic carbon, they were located on regional geological maps [Geo- logical Survey of Canada (GSC), 1967; Mineral Resources Division, 1975; New Brunswick Natural Resources, 1979; Nova Scotia Natural Resources, 1985]. Analysis of the basins showed that most of them contained less than 1% carbonate
bedrock. Exceptions were the Margaree and Torrent Rivers where approximately 25% of the basins were carbonate (Figure 1, areas 16 and 18). Most of the basins in New Brunswick, Prince Edward Island and some in Nova Scotia
Figure 1. Locations of study basins.
CLAIR ET AL.: CARBON AND NITROGEN EXPORT FROM CANADIAN RIVERS 443
(Figure 1 areas 1-4, 6, 7, 17, 25 and 26) were located on sandstone, those in Nova Scotia were located on slates (Figure 1, areas 5, 8-15), and those in Newfoundland and Labrador were located on granites (Figure 1, areas19-24), though other types of formations could be found in small proportions in most basins.
Total annual precipitation and temperature data were collected from climate stations located near each basin (Envi- ronment Canada, Atmospheric Environment Service database). Though most climate sites were located in or quite near the basins, in a few cases, recording stations were up to 70 km from any portion of the watershed. In approximately 5 % of the cases, monthly precipitation values were missing. The data gaps were filled by averaging the previous and following monthly values and comparing the estimate to values from other sites located nearby to ensure that major seasonal effects were not obscured.
Basin size and annual discharge were extracted from Inland Waters Directorate (1984-1990) Discharge Data summaries. Monthly runoff was calculated from the discharge data. Water chemistry samples were collected between January 1983 and December 1989 usually at monthly though sometimes bimonthly intervals. All rivers studied, except the Mill and Dunk located on Prince Edward Island, (Figure 1, areas 25 and 26) are little affected by human disturbance. These two rivers were small and are influenced by agricultural practices. The Churchill River in Labrador (Figure 1, area 24) is also dammed above the sampling site, creating a 5500 km 2 reser- voir.
In order to calculate carbon and nitrogen exports from each basin, water chemistry data were multiplied with the daily river discharge on the water collection date to provide a daily export value. Monthly export amounts were calculated by multiplying the daily export by the number of days in the month. Missing chemistry values were calculated by linear interpolation between dates where samples were available and using measured discharges. Of the 26 rivers which we studied, only the North East Margaree (Figure 1, area 16), Salmon (area 17), Churchill (area 24), Eagle (area 23), Torrent (area 18) and Isle aux Morts (area 20) Rivers had more than 20 % of monthly water chemistry data points missing, mostly because of difficulties in reaching the sites in winter.
Our export calculation method can sometimes underesti- mate exports, especially during high flow events which can occur during snow melt. An analysis of the accuracy of the export calculations of various ions using this method, though not including AOC or aquatic organic nitrogen (AON), was made by Clair and Jeffn'es [1992] for the Mersey River (Figure 1, area 10) where two years of daily sampling data existed. They simulated various sampling interval schemes and found that for sodium, chloride and sulfate, monthly sampling frequency usually predicted exports to within + 10% of actual values. We asume that AOC and AON behave similarly in the basins studied, especially in Nova Scotia and southern New- foundland. The export data were normalized to kilogram exported per hectare.
Basin slopes were calculated using 250,000:1 topographic maps. The mean elevation at the upper part of the drainage basin was estimated and subtracted from the elevation at the
sampling site. The distance from the the upper part of the basin to the sampling site was also measured, and the slope was calculated by dividing the elevation difference by the distance. This value was relatively crude but provided a reasonable first approximation of the basin's steepness.
AOC was measured as total organic carbon (TOC). It was analyzed from unfiltered water samples using the persulfate- ultraviolet wet oxidation method. Work in our laboratory has shown that for most waters in our study area, filtering only removed •5 % of carbon. This means that there is little
particulate organic or inorganic carbon in these waters, and our total values represent mostly dissolved C. We will therefore refer to the organic carbon measured as TOC. These results correspond well to the generalization proposed by Meybeck [1982] where the higher the dissolved organic carbon (DOC) and TOC ratio, the lower the total suspended solids (TSS) concentration. In the rivers studied, TSS rarely exceeded 10 mg L -• (Environment Canada unpublished data, 1993), which is quite low because of resistant bedrock, little anthropogenic activity and stable plant covers.
Inorganic C values were calculated from total alkalinity measured using the Gran approach, which were reported as calcium bicarbonate. The inorganic carbon portion was calculated as its weight fraction of alkalinity. This value is probably overestimated in high TOC waters, as the Gran approach also measures some dissociated organic anions [Brassard et al., 1990]. Because of the very low TSS, we also assume that most inorganic carbon is dissolved and will be referred to as total inorganic C (TIC).
Nitrate (NO3-) was analyzed using a colorimetric method at the beginning of the study and using ion chromatography near the end of the study. In-house quality control studies showed no differences in results between the two methods.
Total nitrogen was analyzed on unfiltered samples by UV digestion followed by colorimetry with an autoanalyzer and organic nitrogen was estimated by subtracting the measured nitrate from total nitrogen. In order to produce predictive models of elemental export, the geographic, meteorological and export data were analyzed using a step-wise multilinear approach SYSTAT statistical software (Evanston, Illinois).
Results and Discussion
Hydrology and Precipitation
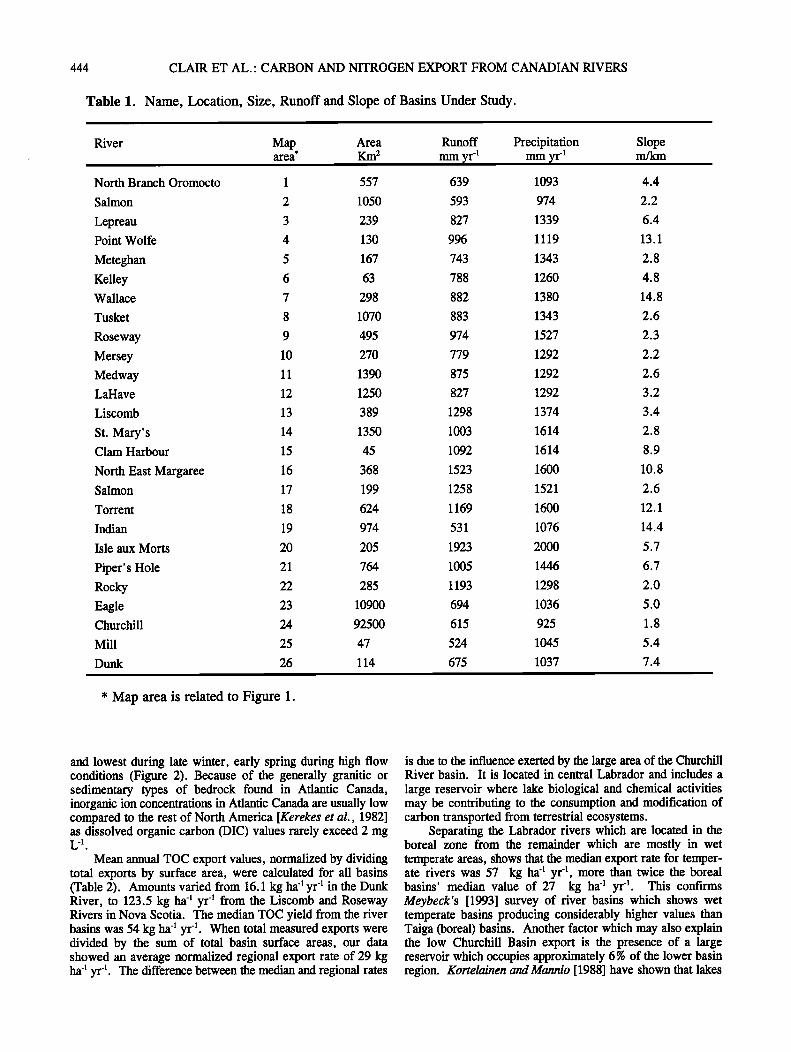
Annual total precipitation at the sites ranged from 1600 mm in the eastern part of Nova Scotia to 925 mm in central Labrador over the study period (Table 1). Snow usually occurs throughout the region from January to March, though Nova Scotia and southern New Brunswick and Newfoundland can
receive rain at any time of the year. To a large extent, water flow controls the export of carbon
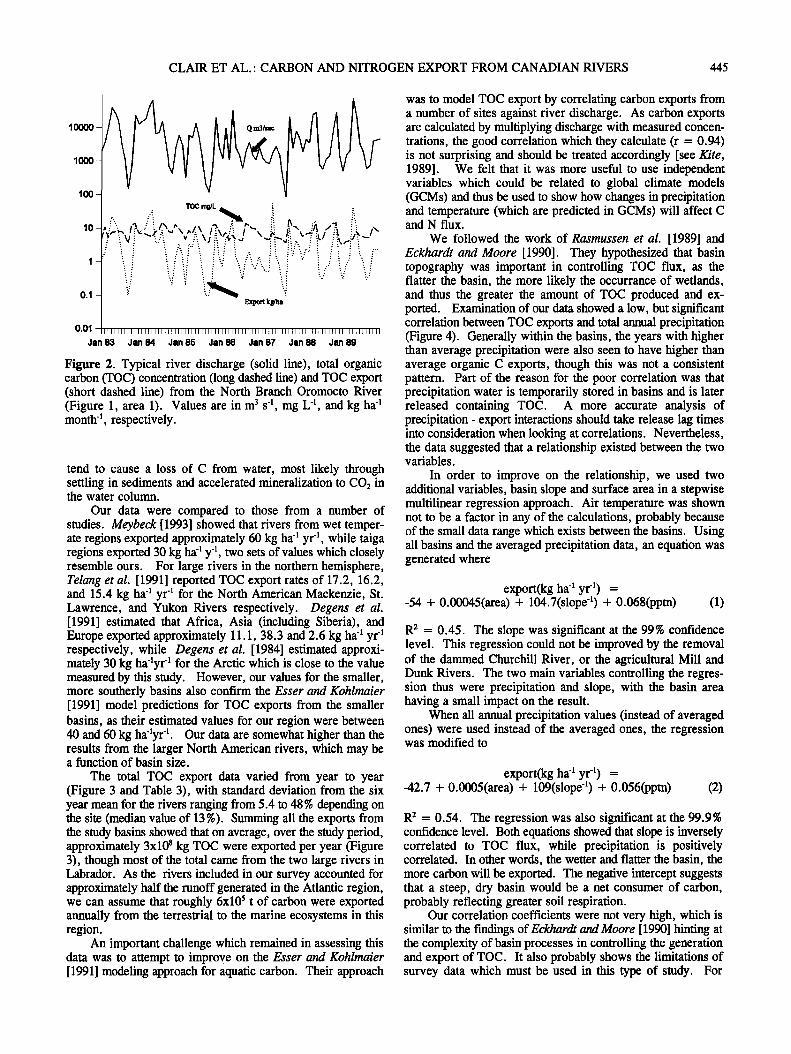
and nitrogen from basins [Esser and Kohlmaier, 1991]. Because of Atlantic Canada's temperate location, all sites showed strong seasonal tendencies associated with snowmelt runoff (Figure 2). Discharge is lowest in late summer and highest in the spring during snowmelt. There is a strong north/south gradient in high flow peaks with Nova Scotia flood levels usually occurring in late March, while peaks in northern Newfoundland and Labrador occur in late May.
Water exports ranged from 530 mm yr '• at the Indian River in northern Newfoundland (Figure 1, area 19) to 1930 mm at the Isle Aux Morts River also in Newfoundland (area 20, Table 1). The median for the study sites was 940 mm yr 4.
Carbon Exports
Waters draining the study basins can be high in TOC, with values ranging from 3 mg L -• to as high as 30 mg L 4. TOC concentration is usually greatest in the summer low flow period
444 CLAIR ET AL.: CARBON AND NITROGEN EXPORT FROM CANADIAN RIVERS
Table 1. Name, Location, Size, Runoff and Slope of Basins Under Study.
River Map Area Runoff area* Km 2 mm yr 4
North Branch Oromocto 1 557 639
Salmon 2 1050 593
Lepreau 3 239 827 Point Wolfe 4 130 996
Meteghan 5 167 743 Kelley 6 63 788 Wallace 7 298 882
Tusket 8 1070 883
Roseway 9 495 974
Mersey 10 270 779 Medway 11 1390 875 LaHave 12 1250 827
Liscomb 13 389 1298
St. Mary's 14 1350 1003 Clam Harbour 15 45 1092
North East Margaree 16 368 1523 Salmon 17 199 1258
Torrent 18 624 1169
Indian 19 974 531
Isle aux Morts 20 205 1923
Piper's Hole 21 764 1005 Rocky 22 285 1193 Eagle 23 10900 694 Churchill 24 92500 615
Mill 25 47 524
Dunk 26 114 675
Precipitation Slope mm yr 4 m/km
1093 4.4
974 2.2
1339 6.4
1119 13.1
1343 2.8
1260 4.8
1380 14.8
1343 2.6
1527 2.3
1292 2.2
1292 2.6
1292 3.2
1374 3.4
1614 2.8
1614 8.9
1600 10.8
1521 2.6
1600 12.1
1076 14.4
2000 5.7
1446 6.7
1298 2.0
1036 5.0
925 1.8
1045 5.4
1037 7.4
* Map area is related to Figure 1.
and lowest during late winter, early spring during high flow conditions (Figure 2). Because of the generally granitic or sedimentary types of bedrock found in Atlantic Canada, inorganic ion concentrations in Atlantic Canada are usually low compared to the rest of North America [Kerekes et al., 1982] as dissolved organic carbon (DIC) values rarely exceed 2 mg C -1 '
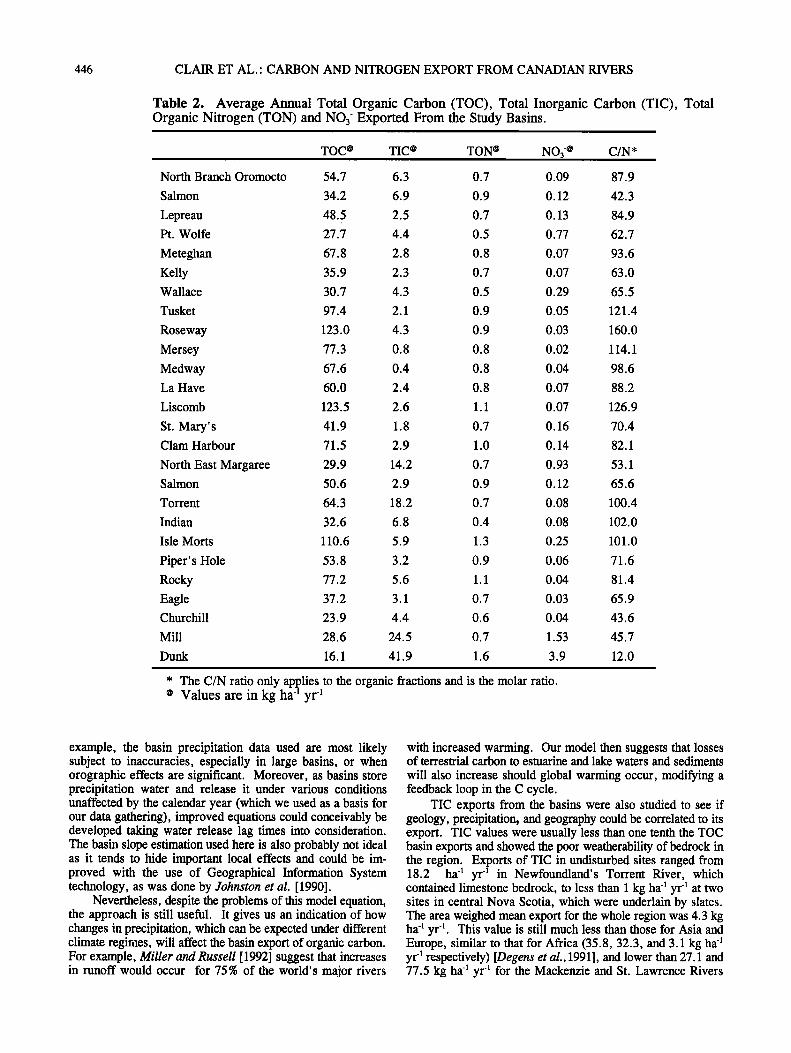
Mean annual TOC export values, normalized by dividing total exports by surface area, were calculated for all basins (Table 2). Amounts varied from 16.1 kg ha 4 yr 4 in the Dunk River, to 123.5 kg ha 4 yr 4 from the Liscomb and Roseway Rivers in Nova Scotia. The median TOC yield from the river basins was 54 kg ha 4 yr 4. When total measured exports were divided by the sum of total basin surface areas, our data showed an average normalized regional export rate of 29 kg ha 4 yr 4. The difference between the median and regional rates
is due to the influence exerted by the large area of the Churchill River basin. It is located in central Labrador and includes a
large reservoir where lake biological and chemical activities may be contributing to the consumption and modification of carbon transported from terrestrial ecosystems.
Separating the Labrador rivers which are located in the boreal zone from the remainder which are mostly in wet temperate areas, shows that the median export rate for temper- ate rivers was 57 kg ha 4 yr 4, more than twice the boreal basins' median value of 27 kg ha 4 yr 4. This confirms Meybeck's [1993] survey of river basins which shows wet temperate basins producing considerably higher values than Taiga (boreal) basins. Another factor which may also explain the low Churchill Basin export is the presence of a large reservoir which occupies approximately 6 % of the lower basin region. Kortelainen and Mannio [1988] have shown that lakes
CLAIR ET AL.: CARBON AND NITROGEN EXPORT FROM CANADIAN RIVERS 445
10000
1000
100 -
10-
1 -
0.1 I
0.01
Jan 83 Jan 84 Jan 85 Jan 86 Jan 87 Jan 88 Jan 89
Figure 2. Typical river discharge (solid line), total organic carbon (TOC) concentration (long dashed line) and TOC export (short dashed line) from the North Branch Oromocto River (Figure 1, area 1). Values are in m 3 s -i, mg L -1, and kg ha -1 month -i , respectively.
tend to cause a loss of C from water, most likely through settling in sediments and accelerated mineralization to CO2 in the water column.
Our data were compared to those from a number of studies. Meybeck [1993] showed that rivers from wet temper- ate regions exported approximately 60 kg ha -1 yr -1, while taiga regions exported 30 kg ha -1 y-i, two sets of values which closely resemble ours. For large rivers in the northern hemisphere, Telang et al. [1991] reported TOC export rates of 17.2, 16.2, and 15.4 kg ha -1 yr -1 for the North American Mackenzie, St. Lawrence, and Yukon Rivers respectively. Degens et al. [1991] estimated that Africa, Asia (including Siberia), and Europe exported approximately 11.1, 38.3 and 2.6 kg ha -1 yr -1 respectively, while Degens et al. [1984] estimated approxi- mately 30 kg ha-lyr 'l for the Arctic which is close to the value measured by this study. However, our values for the smaller, more southerly basins also confirm the Esser and Kohlrnaier [1991] model predictions for TOC exports from the smaller basins, as their estimated values for our region were between 40 and 60 kg ha'lyr -1. Our data are somewhat higher than the results from the larger North American rivers, which may be a function of basin size.
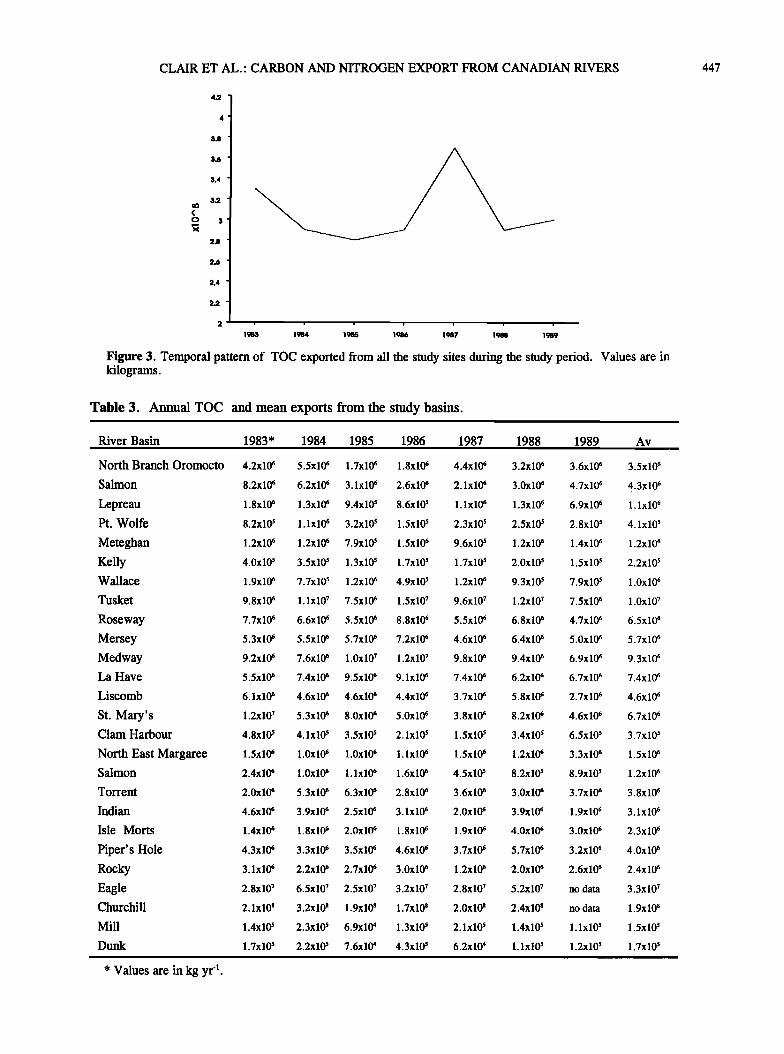
The total TOC export data varied from year to year (Figure 3 and Table 3), with standard deviation from the six year mean for the rivers ranging from 5.4 to 48 % depending on the site (median value of 13 %). Summing all the exports from the study basins showed that on average, over the stud)' period, approximately 3x10⁸ kg TOC were exported per year (Figure 3), though most of the total came from the two large rivers in Labrador. As the rivers included in our survey accounted for approximately half the runoff generated in the Atlantic region, we can assume that roughly 6x10⁵ t of carbon were exported annually from the terrestrial to the marine ecosystems in this region.
An important challenge which remained in assessing this data was to attempt to improve on the Esser and Kohlrnaier [1991] modeling approach for aquatic carbon. Their approach
was to model TOC export by correlating carbon exports from a number of sites against river discharge. As carbon exports are calculated by multiplying discharge with measured concen- trations, the good correlation which they calculate (r = 0.94) is not surprising and should be treated accordingly [see Kite, 1989]. We felt that it was more useful to use independent variables which could be related to global climate models (GCMs) and thus be used to show how changes in precipitation and temperature (which are predicted in GCMs) will affect C and N flux.
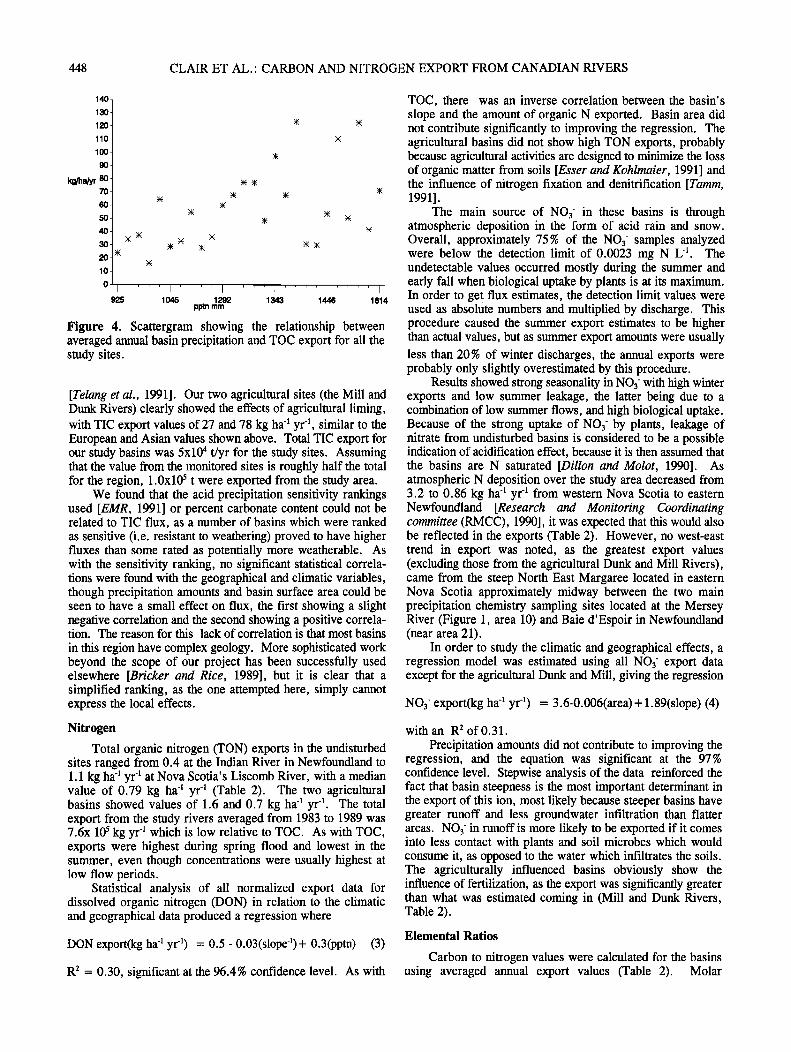
We followed the work of Rasmussen et al. [1989] and Eckhardt and Moore [1990]. They hypothesized that basin topography was important in controlling TOC flux, as the flatter the basin, the more likely the occurrance of wetlands, and thus the greater the amount of TOC produced and ex- ported. Examination of our data showed a low, but significant correlation between TOC exports and total annual precipitation (Figure 4). Generally within the basins, the years with higher than average precipitation were also seen to have higher than average organic C exports, though this was not a consistent pattern. Part of the reason for the poor correlation was that precipitation water is temporarily stored in basins and is later released containing TOC. A more accurate analysis of precipitation - export interactions should take release lag times into consideration when looking at correlations. Nevertheless, the data suggested that a relationship existed between the two variables.
In order to improve on the relationship, we used two additional variables, basin slope and surface area in a stepwise multilinear regression approach. Air temperature was shown not to be a factor in any of the calculations, probably because of the small data range which exists between the basins. Using all basins and the averaged precipitation data, an equation was generated where
export(kg ha -1 yr -1) = -54 + 0.00045(area) + 104.7(slope -1) + 0.068(pptn) (1)
R 2 = 0.45. The slope was significant at the 99% confidence level. This regression could not be improved by the removal of the dammed Churchill River, or the agricultural Mill and Dunk Rivers. The two main variables controlling the regres- sion thus were precipitation and slope, with the basin area having a small impact on the result.
When all annual precipitation values (instead of averaged ones) were used instead of the averaged ones, the regression was modified to
export(kg ha -• yr -•) = -42.7 + 0.0005(area) + 109(slope -1) + 0.056(pptn) (2)
R: = 0.54. The regression was also significant at the 99.9% confidence level. Both equations showed that slope is inversely correlated to TOC flux, while precipitation is positively correlated. In other words, the wetter and flatter the basin, the more carbon will be exported. The negative intercept suggests that a steep, dry basin would be a net consumer of carbon, probably reflecting greater soil respiration.
Our correlation coefficients were not very high, which is similar to the findings of Eckhardt and Moore [1990] hinting at the complexity of basin processes in controlling the generation and export of TOC. It also probably shows the limitations of survey data which must be used in this type of study. For
446 CLAIR ET AL.: CARBON AND NITROGEN EXPORT FROM CANADIAN RIVERS
Table 2. Average Annual Total Organic Carbon (TOC), Total Inorganic Carbon (TIC), Total Organic Nitrogen (TON) and NO 3- Exported From the Study Basins.
TOC • TIC • TON • NO3 -@ C/N*
North Branch Oromocto 54.7 6.3 0.7 0.09 87.9
Salmon 34.2 6.9 0.9 0.12 42.3
Lepreau 48.5 2.5 0.7 0.13 84.9 Pt. Wolfe 27.7 4.4 0.5 0.77 62.7
Meteghan 67.8 2.8 0.8 0.07 93.6
Kelly 35.9 2.3 0.7 0.07 63.0 Wallace 30.7 4.3 0.5 0.29 65.5
Tusket 97.4 2.1 0.9 0.05 121.4
Roseway 123.0 4.3 0.9 0.03 160.0
Mersey 77.3 0.8 0.8 0.02 114.1
Medway 67.6 0.4 0.8 0.04 98.6 La Have 60.0 2.4 0.8 0.07 88.2
Liscomb 123.5 2.6 1.1 0.07 126.9
St. Mary's 41.9 1.8 0.7 0.16 70.4 Clam Harbour 71.5 2.9 1.0 0.14 82.1
North East Margaree 29.9 14.2 0.7 0.93 53.1 Salmon 50.6 2.9 0.9 0.12 65.6
Torrent 64.3 18.2 0.7 0.08 100.4
Indian 32.6 6.8 0.4 0.08 102.0
Isle Morts 110.6 5.9 1.3 0.25 101.0
Piper' s Hole 53.8 3.2 0.9 0.06 71.6
Rocky 77.2 5.6 1.1 0.04 81.4
Eagle 37.2 3.1 0.7 0.03 65.9 Churchill 23.9 4.4 0.6 0.04 43.6
Mill 28.6 24.5 0.7 1.53 45.7
Dunk 16.1 41.9 1.6 3.9 12.0
* The C/N ratio only applies to the organic fractions and is the molar ratio. • Values are in kg ha -1 yr '1
example, the basin precipitation data used are most likely subject to inaccuracies, especially in large basins, or when orographic effects are significant. Moreover, as basins store precipitation water and release it under various conditions unaffected by the calendar year (which we used as a basis for our data gathering), improved equations could conceivably be developed taking water release lag times into consideration. The basin slope estimation used here is also probably not ideal as it tends to hide important local effects and could be im- proved with the use of Geographical Information System technology, as was done by Johnston et al. [1990].
Nevertheless, despite the problems of this model equation, the approach is still useful. It gives us an indication of how changes in precipitation, which can be expected under different climate reginaes, will affect the basin export of organic carbon. For example, Miller and Russell [ 1992] suggest that increases in runoff would occur for 75 % of the world's major rivers
with increased warming. Our model then suggests that losses of terrestrial carbon to estuarine and lake waters and sediments
will also increase should global warming occur, modifying a feedback loop in the C cycle.
TIC exports from the basins were also studied to see if geology, precipitation, and geography could be correlated to its export. TIC values were usually less than one tenth the TOC basin exports and showed the poor weatherability of bedrock in the region. Exports of TIC in undisturbed sites ranged from 18.2 ha -1 yr -1 in Newfoundland's Torrent River, which contained limestone bedrock, to less than 1 kg ha -• yr -• at two sites in central Nova Scotia, which were underlain by slates. The area weighed mean export for the whole region was 4.3 kg ha -1 yr -1. This value is still much less than those for Asia and Europe, similar to that for Africa (35.8, 32.3, and 3.1 kg ha -1 yr -1 respectively) [Degens et al.,1991], and lower than 27.1 and 77.5 kg ha -1 yr '1 for the Mackenzie and St. Lawrence Rivers
CLAIR ET AL.' CARBON AND NITROGEN EXPORT FROM CANADIAN RIVERS 447
4.2
3.8
3.6
3.4
3.2
2.8
2.6
2.4
2.2
1903 1904 1905 1986 1987 1988 19B9
Figure 3. Temporal pattern of TOC exported from all the study sites during the study period. Values are in kilograms.
Table 3. Annual TOC and mean exports from the study basins.
River Basin 1983' 1984 1985 1986 1987 1988 1989 Av
North Branch Oromocto 4.2x10 6 5.5x10 6 1.7x10 • 1.8x10 • 4.4x10 • 3.2x10 • 3.6x10 6 3.5x10 •
Salmon 8.2x10 • 6.2x10 • 3.1x10 • 2.6x10 6 2.1x10 • 3.0x10 • 4.7x10 • 4.3x10 •
Lepreau 1.8x10 6 1.3x10 • 9.4x10 s 8.6x10 s 1.1x10 • 1.3x10 • 6.9x10 • 1.1x10 6 Pt. Wolfe 8.2x10 s 1.1x10 • 3.2x10 s 1.5x10 s 2.3x10 s 2.5x10 s 2.8x10 s 4.1x10 s
Meteghan 1.2x10 • 1.2x10 • 7.9x10 s 1.5x10 • 9.6x10 s 1.2x10 6 1.4x10 • 1.2x10 •
Kelly 4.0x10 s 3.5x10 5 !.3x10 s 1.7x10 5 1.7x10 s 2.0x10 s 1.5x10 s 2.2x10 s Wallace 1.9x10 • 7.7x10 s 1.2x10 • 4.9x10 s 1.2x10 6 9.3x10 s 7.9x10 s 1.0x10 •
Tusket 9.8x10 • 1.1x10 7 7.5x10 • 1.5x10 7 9.6x10 7 1.2x10 7 7.5x10 • 1.0x10 7
Roseway 7.7x10 6 6.6x10 • 5.5x10 • 8.8x10 • 5.5x10 • 6.8x10 6 4.7x10 • 6.5x10 •
Mersey 5.3x10 • 5.5x10 • 5.7x10 6 7.2x10 • 4.6x10 • 6.4x10 • 5.0x10 • 5.7x10 6
Medway 9.2x10 • 7.6x10 • 1.0x10 7 1.2x10 7 9.8x10 • 9.4x10 • 6.9x10 6 9.3x10 • La Have 5.5x10 • 7.4x10 • 9.5x10 • 9.1x10 6 7.4x10 • 6.2x10 • 6.7x10 • 7.4x10 •
Liscomb 6.1x10 6 4.6x10 • 4.6x10 • 4.4x10 • 3.7x10 • 5.8x10 6 2.7x10 • 4.6x10 •
St. Mary's 1.2x10 7 5.3x10 • 8.0x10 • 5.0x10 6 3.8x10 • 8.2x10 • 4.6x10 • 6.7x10 • Clam Harbour 4.8x10 s 4.1x10 s 3.5x10 s 2.1x10 s 1.5x10 s 3.4x10 s 6.5x10 s 3.7x10 s
North East Margaree 1.5x10 6 1.0x10 • 1.0x10 • 1.1x10 • 1.5x10 • 1.2x10 6 3.3x10 • 1.5x10 • Salmon 2.4x10 • 1.0x10 • 1.1x10 6 1.6x10 • 4.5x10 s 8.2x10 s 8.9x10 s 1.2x10 •
Torrent 2.0x10 • 5.3x10 • 6.3x10 6 2.8x10 • 3.6x10 • 3.0x10 • 3.7x10 • 3.8x10 6
Indian 4.6x10 • 3.9x10 • 2.5x10 • 3.1x10 • 2.0x10 6 3.9x10 • 1.9x10 • 3.1x10 •
Isle Morts 1.4x10 • 1.8x10 6 2.0x10 • 1.8x10 • 1.9x10 • 4.0x10 • 3.0x10 6 2.3x10 •
Piper' s Hole 4.3x10 • 3.3x10 • 3.5x10 • 4.6x10 6 3.7x10 • 5.7x10 • 3.2x10 • 4.0x10 •
Rocky 3.1x10 6 2.2x10 • 2.7x10 • 3.0x10 • 1.2x10 • 2.0x10 6 2.6x10 • 2.4x10 •
Eagle 2.8x10 7 6.5x10 7 2.5x10 7 3.2x10 7 2.8x10 7 5.2x10 7 no data 3.3x10 7 Churchill 2.1x10 a 3.2x10 a 1.9x10 a 1.7x10 a 2.0x10 a 2.4x10 a no data 1.9x10 a
Mill 1.4x10 s 2.3x10 s 6.9x10 4 1.3x10 s 2.1x10 s 1.4x10 s 1.1x10 s 1.5x10 s
Dunk 1.7x10 s 2.2x10 s 7.6x10 4 4.3x10 s 6.2x10 n 1.1x10 s 1.2x10 s 1.7x10 s
* Values are in kg yr '•.
448 CLAIR ET AL.' CARBON AND NITROGEN EXPORT FROM CANADIAN RIVERS
140
130
120
110
100
90
kg/ha/yr 80 70
60
20
10
0
925 1045 1292 1343 1446 1614 pptn mm
Figure 4. Scattergram showing the relationship between averaged annual basin precipitation and TOC export for all the study sites.
[Telang et al., 1991]. Our two agricultural sites (the Mill and Dunk Rivers) clearly showed the effects of agricultural liming, with TIC export values of 27 and 78 kg ha 4 yr 4, similar to the European and Asian values shown above. Total TIC export for our study basins was 5x10 4 t/yr for the study sites. Assuming that the value from the monitored sites is roughly half the total for the region, 1.0x10⁵ t were exported from the study area.
We found that the acid precipitation sensitivity rankings used [EMR, 1991] or percent carbonate content could not be related to TIC flux, as a number of basins which were ranked as sensitive (i.e. resistant to weathering) proved to have higher fluxes than some rated as potentially more weatherable. As with the sensitivity ranking, no significant statistical correla- tions were found with the geographical and climatic variables, though precipitation amounts and basin surface area could be seen to have a small effect on flux, the first showing a slight negative correlation and the second showing a positive correla- tion. The reason for this lack of correlation is that most basins
in this region have complex geology. More sophisticated work beyond the scope of our project has been successfully used elsewhere [Bricker and Rice, 1989], but it is clear that a simplified ranking, as the one attempted here, simply cannot express the local effects.
TOC, there was an inverse correlation between the basin's slope and the amount of organic N exported. Basin area did not contribute significantly to improving the regression. The agricultural basins did not show high TON exports, probably because agricultural activities are designed to minimize the loss of organic matter from soils [Esser and Kohlmaier, 1991] and the influence of nitrogen fixation and denitrification [Tamm, 1991].
The main source of NO3- in these basins is through atmospheric deposition in the form of acid rain and snow. Overall, approximately 75% of the NO3- samples analyzed were below the detection limit of 0.0023 mg N L 4. The undetectable values occurred mostly during the summer and early fall when biological uptake by plants is at its maximum. In order to get flux estimates, the detection limit values were used as absolute numbers and multiplied by discharge. This procedure caused the summer export estimates to be higher than actual values, but as summer export amounts were usually
less than 20% of winter discharges, the annual exports were probably only slightly overestimated by this procedure.
Results showed strong seasonality in NO3- with high winter exports and low summer leakage, the latter being due to a combination of low summer flows, and high biological uptake. Because of the strong uptake of NO 3- by plants, leakage of nitrate from undisturbed basins is considered to be a possible indication of acidification effect, because it is then assumed that the basins are N saturated [Dillon and Molot, 1990]. As atmospheric N deposition over the study area decreased from 3.2 to 0.86 kg ha 4 yr 4 from western Nova Scotia to eastern Newfoundland [Research and Monitoring Coordinating committee (RMCC), 1990], it was expected that this would also be reflected in the exports (Table 2). However, no west-east trend in export was noted, as the greatest export values (excluding those from the agricultural Dunk and Mill Rivers), came from the steep North East Margaree located in eastern Nova Scotia approximately midway between the two main precipitation chemistry sampling sites located at the Mersey River (Figure 1, area 10) and Baie d'Espoir in Newfoundland (near area 21).
In order to study the climatic and geographical effects, a regression model was estimated using all NO 3- export data except for the agricultural Dunk and Mill, giving the regression
NO3-export(kg ha -• yr 4) = 3.6-0.006(area)+ 1.89(slope) (4)
Nitrogen
Total organic nitrogen (TON) exports in the undisturbed sites ranged from 0.4 at the Indian River in Newfoundland to 1.1 kg ha -1 yr -1 at Nova Scotia's Liscomb River, with a median value of 0.79 kg ha 4 yr 4 (Table 2). The two agricultural basins showed values of 1.6 and 0.7 kg ha 4 yr -1. The total export from the study rivers averaged from 1983 to 1989 was 7.6x 10⁵ kg yr -• which is low relative to TOC. As with TOC, exports were highest during spring flood and lowest in the summer, even though concentrations were usually highest at low flow periods.
Statistical analysis of all normalized export data for dissolved organic nitrogen (DON) in relation to the climatic and geographical data produced a regression where
DON export(kg ha -1 yr 4) = 0.5 - 0.03(slope -1) + 0.3(pptn) (3)
R 2 -- 0.30, significant at the 96.4 % confidence level. As with
with an R 2 of 0.31.
Precipitation amounts did not contribute to improving the regression, and the equation was significant at the 97% confidence level. Stepwise analysis of the data reinforced the fact that basin steepness is the most important determinant in the export of this ion, most likely because steeper basins have greater runoff and less groundwater infiltration than flatter areas. NO3- in runoff is more likely to be exported if it comes into less contact with plants and soil microbes which would consume it, as opposed to the water which infiltrates the soils. The agriculturally influenced basins obviously show the influence of fertilization, as the export was significantly greater than what was estimated coming in (Mill and Dunk Rivers, Table 2).
Elemental Ratios
Carbon to nitrogen values were calculated for the basins using averaged annual export values (Table 2). Molar
CLAIR ET AL.: CARBON AND NITROGEN EXPORT FROM CANADIAN RIVERS 449
carbon/nitrogen (C/N) ratios ranged from 12 in the agricultural Dunk River to 159 for Nova Scotia's Roseway River with an overall mean of 85.3 for the non-agricultural basins. These data were compared to those summarized by Steelink [1985] from a large number of studies. Steelinck's summary shows most values ranging from 100 to 10 with his median value being near 40. Meybeck [1982] reports much lower values (20), while Urban et al. [1989] show values ranging from 20 to 80 for a stream in Minnesota.
The Churchill River which drains a large reservoir has a C/N value of 43.6, similar to lake values. However, the Salmon and Margaree Rivers with values of 42.3 and 53.1 cannot be as easily explained. It can also be seen that the ratios from the agricultural basins are lower than those for most other basins (45.7 and 12.0), reflecting the importance of human activities in affecting water chemistry.
The high C/N ratios are an indication of the importance of terrestrially derived humic substances in these rivers, as compared to lower values which would be found in lakes or large rivers containing phytoplankton and emergent vegetation constantly exuding materials into the water column. Another point should be made that the low values from this study can probably be understood by realizing that most of the organic carbon measured is dissolved instead of particulate. Aquatic particulate organic matter generally has a low C/N (-- 10-15), while terrestrial plant matter has a value near 69 [Meybeck, 1982]. Our data suggest that the origin of much of our C is from terrestrial plants from which more N has been removed by bacterial action. More work, especially on determining the effects of vegetation types and presence of lakes and reservoirs, should be done to better understand the elemental composition of the material being exported from basins.
The significance of this ratio lies in biological availability of the organic matter. The greater the relative nitrogen composition, the greater its suitability to decomposers. The higher the ratio, the less likely the material will be used by microbes and fungi, and the more likely it is to become incorporated into lake and estuarine sediments.
Conclusions
Because the water sampling program was designed to take advantage of the presence of pristine environments, we were unable to study the role of agriculture and urban development in generating elemental exports as only two small agricultural basins were monitored. Esser and Kohlmaier [1991] show that agricultural site contributions of organic C and N tends to be less than from natural systems, because the latter are managed to retain C. However, the material which does escape from agricultural soils tends to be higher in nitrogen and reflects the nature of the plant material growing and the effect of fertiliza- tion. We did not address the importance and effects of urban developments on basin exports.
The fate of elements exported by terrestrial basins was beyond the scope of this study. However, Ittekot and Haake [1990] suggests that the terrestrially derived carbon contribu- tion to ocean sediments may be as great as the marine autotro- phic carbon generation. Ittekot and Laane [1991] also show that in temperate regions, approximately 40% of particulate C is potentially biologically labile. This suggests that 60 % of the carbon exported from rivers into estuaries and continental shelves could be tied up in sediments and subject to the long- term processes occurring there.
Our work also did not explore the role of lakes and reservoirs in modifying carbon exports from basins. Lakes are known to retain sediment carbon which has precipitated from overlying waters [Kortelainen and Mannio, 1988], and a number of studies exist which attempt to measure deposition rates, as well as sediment carbon concentrations. Their role as terrestrial carbon sinks has only been slightly explored [Meybeck, 1993] and should be looked at more closely.
There exists considerable controversy regarding the importance of various carbon sinks on the planet. The goal of this work was to attempt to understand what controls one portion of the carbon transfer system. Loss of terrestrial C and N via rivers is unidirectional with the only feedback to terres- trial ecosystems being the production of CO2 by bacterial decomposition returning to the atmosphere. The C and N which are tied up in sediments are lost to the global system, as least for the short term (hundred's to thousand's of years).
Though the study was based on a relatively small portion of the Earth's surface, the basins we studied were useful in helping us understand the environmental variables which control the exports of organic C and N in most of the temperate or boreal zone. Based on data collected from relatively undisturbed ecosystems, we developed statistical relationships explaining the relative importance of precipitation, basin slope, and surface area which should be relevant to other regions. It would be useful to find data from basins located in continental
and warmer sites to refine our approach to allow more accurate algorithms to be calculated. Using these and other improved models, the effect of precipitation and tectonic changes at the Earth's surface on the loss of terrestrial C and N into
freshwaters and eventually estuaries will be predicted more accurately.
These data also show the large seasonal and year to year variations in C exports in our region (Figures 2 and 3) which must be taken into account when attempting to calculate the importance of riverine C and N fluxes into estuaries and lakes. These cycles and annual differences should be further explored with most large river systems to understand potential variations in terrestrial contributions to global budgets.
Acknowledgments. The authors thank the field and laboratory staff of Environment Canada-Atlantic Region for their efforts in collecting and analyzing the thousands of samples and data points needed for this study. K. Higuchi continually encour- aged us in this work. P. Whitfield reviewed the manuscript and made a large number of constructive comments.
References
Brassard, P., J.R. Kramer, and P.V. Collins, Discrete affinity spectrum and ANC determination using linear programming, Environ. Sci. Technol., 24, 195-20!, 1990.
Bricker, O.P., and K.C. Rice, Acidic deposition to streams, Environ. Sci. Technol., 23, 379-385, 1989.
Clair, T.A., and D.S. Jeffries, Calculations of variable concentrations and exports from the Mersey River at Kejimkujik National Park in Nova Scotia, in Science and the Management of Protected Areas, Devel. in Landscape Manag. and Urban Planning, edited by J.H.M. Willison, S. Bondrup- Nielsen, C. Drysdale, T.B. Herman, N.W.P. Munro and T.L. Pollock (eds), no. 7, Elsevier, New York,, pp. 4!7-423, 1992.
Crill, P.M., Seasonal patterns of methane uptake and carbon
450 CLAIR ET AL.: CARBON AND NITROGEN EXPORT FROM CANADIAN RIVERS
dioxide release by a temperate woodland soil, Global Biogeochent. Cycles, 5, 319-334,
Degens, E.T., S. Kempe, and V. Ittekot, Monitoring carbon in world rivers, Environntent, 26, 29-33, 1984.
Degens, E.T., S. Kempe and J.E. Richey, Summary: biogeochemistry of major world rivers. in Biogeochentistry of Major World Rivers, edited by E.T. Degens, S. Kempe, and J.E. Richey, pp. 323-347, John Wiley, New York, 1991.
Dillon, P.J., and L.A. Molot, The role of ammonium and nitrate in the acidification of lakes and forested catchments, Biogeochentistry, 11, 23-43, 1990.
Eckhardt, B.W., and T.R. Moore, Controls on dissolved organic carbon concentrations in streams, southern Qu6bec, Can. J. Fish. Aquat. Sci., 4Z 1537-1544, 1990.
Energy, Mines and Resources Canada (EMR), The potential of soils and bedrock to reduce the acidity of atmospheric deposition, Map in National Atlas of Canada, 5th ed., Ottawa, Ont., 1991.
Esser, G. and G.H. Kohlmaier, Modelling terrestrial sources of nitrogen, phosphorus, sulphur and organic carbon to rivers. in Biogeochemistry of Major World Rivers, edited by E.T. Degens, S. Kempe, and J.E. Richey, pp.297-322, John Wiley, New York, 1991.
Geological Survey of Canada, Geology of the Island of Newfoundland, Scale 1:1,000,000, Map 12311A, Ottawa, Ont., 1967.
Holland, H.D. The Chemical Evolution of the Atmosphere and Oceans, 582pp, Princeton University Press, Princeton, N.J., 1984.
International Panel on Climate Change, Climate Change: the IPCC scientific assessment, edited by J.T. Houghton, G.J. Jenkins, and J.J. Ephraums, 365 pp., Cambridge University Press, New York, 1992.
Ittekot, V., and B. Haake, The terrestrial link in the removal of organic carbon in the sea. in Facets of modern biogeochentistry, edited by V. Ittekot, S. Kempe, W. Michaelis, and A. Spitzy, pp.318-325, Springer-Verlag, New York, 1990.
Ittekkot, V., and R.W.P.M. Laane, Fate of riverine particulate organic matter, in Biogeochemistry of Major World Rivers edited by E.T. Degens, S. Kempe, and J.E. Richey, pp. 233- 243, John Wiley, New York, 1991.
Johnston, C.A., N.E. Detenbeck, and G.J. Niemi, The cumulative effect of wetlands on stream water quality and quantity: a landscape approach, Biogeochentistry, 10, 105-141, 1990.
Kerekes, J., G. Howell, S. Beauchamps, and T.L. Pollock, Characterization of three lake basins sensitive to acid
precipitation in Central Nova Scotia, Int. Rev. Gesanttent. Hydrobiol., 67, 679-694, 1982.
Kite, G., Some statistical observations, Water Resour. Bull., 25, 483-490, 1989.
Kortelainen, P., and J. Mannio, Natural and anthropogenic acidity sources for Finish lakes, Water Air Soil Pollut., 42, 341-352, 1988.
Meybeck, M., Carbon, nitrogen and phosphorus transport by world rivers, Ant. J. Sci.,282, 401-450, 1982.
Meybeck, M., Riverine transport of atmospheric carbon: Sources, global typology and budget, Water Air Soil Pollut., 70, 443- 463, 1993.
Miller, J.R., and G.L. Russell, The impact of global warming on river runoff, J. Geophys. Res., 97, 2757-2764, 1992.
Mineral Resources Division (MRD), Geological map of Labrador, Newfoundland and Labrador Scale 1:1,000,000, Dep. of Mines, Agric. and Resour., St. John's, Newfoundland, 1975.
New Brunswick Natural Resources, Geological map of New Brunswick, Map N.R. 1, scale 1:500,000, Dept. of Natural Resources, Fredericton, 1979.
Nova Scotia Natural Resources, Geological map of Nova Scotia, Map MCR 37, scale 1:500,000 Nova Scotia Dept. of Mines and Energy, Halifax, 1985.
Research Monitoring Coordinating Committee (RMCC), The 1990 Canadian long-range transport of air pollutants and acid deposition assessment report, 3, Atmospheric sciences, Fed./Prov. RMCC, Atmos. Environ. Ser., Environ. Can., Downsview, Ont., 1990.
Rasmussen, J.B., L. Godbout, and M. Schallenberg, The humic content of lake water and its relationship to watershed and lake morphometry, Limnol. Oceanogr. 34, 1336-1343, 1989.
Sarmiento, J.L., and E.T. Sundquist, Revised budget for the oceanic uptake of anthropogenic carbon dioxide, Nature, 356, 589-593, 1992.
Steelink, C., Elemental analyses of humic substances, in Huntic Substances in Soil, Sediment, and Water, edited by G.R. Aiken, D.M. McKnight, R.L. Wershaw, and P. MacCarthy, pp. 457- 476, John Wiley, New York, 1985.
Tamm, C.O., Nitrogen in Terrestrial Ecosystents, 116 pp., Springer-Verlag, New York, 1991.
Telang, S.A., R. Pocklington, A.S. Naidu, E.A. Romankevich, I.I. Gitelson, and M.I. Gladyshev, Carbon and mineral transport in major North American, Russian Arctic, and Siberian rivers: The St. Lawrence, the Mackenzie, the Yukon, the Arctic Alaskan rivers, the Arctic basin rivers in the Soviet Union and the Yenisei. in Biogeochemistry of Major World Rivers, edited by E.T. Degens, S. Kempe and J.E. Richey, pp. 75-114, John Wiley, New York, 1991.
Urban, N.R., S.E. Bayley, and S.J. Eisentreich, Export of dissolved organic carbon and acidity from peatlands, Water Resour. Res., 25, 1619-1628, 1989.
T.A. Clair, Ecosystem Science Branch, Environment Canada- Atlantic Region, P.O. Box 1590, Sackville, New Brunswick, Canada, E0A 3C0. (e-mail clairt@holmes . bed. ns . doe. ca)
T.L. Pollock, Ecosystem Science Branch, Environment Canada- Atlantic Region, 310 Baig Blvd, Moncton, New Brunswick, Canada, E1E 1E1.
J.M. Ehrman, Ecosystem Science Branch, Environment Canada-Atlantic Region, P.O. Box 1590, Sackville, New Brunswick, Canada, E0A 3C0. (email [email protected])
(Received February 15, 1994; revised August 31; accepted September 1, 1994.)