Exploring HbA1c variation between Australian diabetes centres
17
RESEARCH ARTICLE Exploring HbA1c variation between Australian diabetes centres: The impact of centre-level and patient-level factors Matthew Quigley ID 1 , Arul Earnest 1 , Naomi Szwarcbard ID 1 , Natalie Wischer 1,2 , Sofianos Andrikopoulos 1,3 , Sally Green 1 , Sophia Zoungas ID 1,4 * 1 School Public Health and Preventive Medicine, Monash University, Melbourne, Victoria, Australia, 2 National Association of Diabetes Centres, Sydney, New South Wales Australia, 3 Australian Diabetes Society, Sydney, New South Wales, Australia, 4 Diabetes and Vascular Medicine Unit, Monash Health, Clayton, Melbourne, Victoria, Australia * [email protected] Abstract Background Increasing global diabetes incidence has profound implications for health systems and for people living with diabetes. Guidelines have established clinical targets but there may be variation in clinical outcomes including HbA1c, based on location and practice size. Investi- gating this variation may help identify factors amenable to systemic improvement interven- tions. The aims of this study were to identify centre-specific and patient-specific factors associated with variation in HbA1c levels and to determine how these associations contrib- ute to variation in performance across diabetes centres. Methods This cross-sectional study analysed data for 5,872 people with type 1 (n = 1,729) or type 2 (n = 4,143) diabetes mellitus collected through the Australian National Diabetes Audit (ANDA). A linear mixed-effects model examined centre-level and patient-level factors asso- ciated with variation in HbA1c levels. Results Mean age was: 43±17 years (type 1), 64±13 (type 2); median disease duration: 18 years (10,29) (type 1), 12 years (6,20) (type 2); female: 52% (type 1), 45% (type 2). For people with type 1 diabetes, volume of patients was associated with increases in HbA1c (p = 0.019). For people with type 2 diabetes, type of centre was associated with reduction in HbA1c (p <0.001), but location and patient volume were not. Associated patient-level factors associated with increases in HbA1c included past hyperglycaemic emergencies (type 1 and type 2, p<0.001) and Aboriginal and Torres Strait Islander status (type 2, p<0.001). Being a non-smoker was associated with reductions in HbA1c (type 1 and type 2, p<0.001). PLOS ONE PLOS ONE | https://doi.org/10.1371/journal.pone.0263511 February 4, 2022 1 / 17 a1111111111 a1111111111 a1111111111 a1111111111 a1111111111 OPEN ACCESS Citation: Quigley M, Earnest A, Szwarcbard N, Wischer N, Andrikopoulos S, Green S, et al. (2022) Exploring HbA1c variation between Australian diabetes centres: The impact of centre-level and patient-level factors. PLoS ONE 17(2): e0263511. https://doi.org/10.1371/journal.pone.0263511 Editor: Spencer D. Proctor, University of Alberta, CANADA Received: May 2, 2021 Accepted: January 20, 2022 Published: February 4, 2022 Peer Review History: PLOS recognizes the benefits of transparency in the peer review process; therefore, we enable the publication of all of the content of peer review and author responses alongside final, published articles. The editorial history of this article is available here: https://doi.org/10.1371/journal.pone.0263511 Copyright: © 2022 Quigley et al. This is an open access article distributed under the terms of the Creative Commons Attribution License, which permits unrestricted use, distribution, and reproduction in any medium, provided the original author and source are credited. Data Availability Statement: The datasets used and/or analysed during the current study are securely housed at the School of Public Health and Preventive Medicine, Monash University,
-
Upload
khangminh22 -
Category
Documents
-
view
5 -
download
0
Transcript of Exploring HbA1c variation between Australian diabetes centres
RESEARCH ARTICLE
Exploring HbA1c variation between Australian
diabetes centres: The impact of centre-level
and patient-level factors
Matthew QuigleyID1, Arul Earnest1, Naomi SzwarcbardID
1, Natalie Wischer1,2,
Sofianos Andrikopoulos1,3, Sally Green1, Sophia ZoungasID1,4*
1 School Public Health and Preventive Medicine, Monash University, Melbourne, Victoria, Australia,
2 National Association of Diabetes Centres, Sydney, New South Wales Australia, 3 Australian Diabetes
Society, Sydney, New South Wales, Australia, 4 Diabetes and Vascular Medicine Unit, Monash Health,
Clayton, Melbourne, Victoria, Australia
Abstract
Background
Increasing global diabetes incidence has profound implications for health systems and for
people living with diabetes. Guidelines have established clinical targets but there may be
variation in clinical outcomes including HbA1c, based on location and practice size. Investi-
gating this variation may help identify factors amenable to systemic improvement interven-
tions. The aims of this study were to identify centre-specific and patient-specific factors
associated with variation in HbA1c levels and to determine how these associations contrib-
ute to variation in performance across diabetes centres.
Methods
This cross-sectional study analysed data for 5,872 people with type 1 (n = 1,729) or type 2
(n = 4,143) diabetes mellitus collected through the Australian National Diabetes Audit
(ANDA). A linear mixed-effects model examined centre-level and patient-level factors asso-
ciated with variation in HbA1c levels.
Results
Mean age was: 43±17 years (type 1), 64±13 (type 2); median disease duration: 18 years
(10,29) (type 1), 12 years (6,20) (type 2); female: 52% (type 1), 45% (type 2). For people
with type 1 diabetes, volume of patients was associated with increases in HbA1c (p =
0.019). For people with type 2 diabetes, type of centre was associated with reduction in
HbA1c (p <0.001), but location and patient volume were not. Associated patient-level factors
associated with increases in HbA1c included past hyperglycaemic emergencies (type 1 and
type 2, p<0.001) and Aboriginal and Torres Strait Islander status (type 2, p<0.001). Being a
non-smoker was associated with reductions in HbA1c (type 1 and type 2, p<0.001).
PLOS ONE
PLOS ONE | https://doi.org/10.1371/journal.pone.0263511 February 4, 2022 1 / 17
a1111111111
a1111111111
a1111111111
a1111111111
a1111111111
OPEN ACCESS
Citation: Quigley M, Earnest A, Szwarcbard N,
Wischer N, Andrikopoulos S, Green S, et al. (2022)
Exploring HbA1c variation between Australian
diabetes centres: The impact of centre-level and
patient-level factors. PLoS ONE 17(2): e0263511.
https://doi.org/10.1371/journal.pone.0263511
Editor: Spencer D. Proctor, University of Alberta,
CANADA
Received: May 2, 2021
Accepted: January 20, 2022
Published: February 4, 2022
Peer Review History: PLOS recognizes the
benefits of transparency in the peer review
process; therefore, we enable the publication of
all of the content of peer review and author
responses alongside final, published articles. The
editorial history of this article is available here:
https://doi.org/10.1371/journal.pone.0263511
Copyright: © 2022 Quigley et al. This is an open
access article distributed under the terms of the
Creative Commons Attribution License, which
permits unrestricted use, distribution, and
reproduction in any medium, provided the original
author and source are credited.
Data Availability Statement: The datasets used
and/or analysed during the current study are
securely housed at the School of Public Health and
Preventive Medicine, Monash University,

Conclusions
Centre-level and patient-level factors were associated with variation in HbA1c, but patient-
level factors had greater impact. Interventions targeting patient-level factors conducted at a
centre level including sick-day management, smoking cessation programs and culturally
appropriate diabetes education for and Aboriginal and Torres Strait Islander peoples may
be more important for improving glycaemic control than targeting factors related to the Cen-
tre itself.
Introduction
Globally the rising incidence of diabetes is increasing the burden for patients and healthcare
systems, in terms of both resource allocation and healthcare utilisation [1]. In addition, people
with diabetes face added financial burden and the complexity of living with a chronic condi-
tion that often includes concomitant complications including psychological distress, retinopa-
thy, neuropathy, nephropathy, amputation and increased risk of cardiovascular disease [2–4].
Optimal diabetes control requires people to self-manage multiple disease-influencing factors.
These factors include diet, physical activity and long-term maintenance of blood glucose levels
[5,6].
HbA1c (haemoglobin A1c), is the amount of glycated haemoglobin present in the blood,
which increases with higher blood glucose levels. Measured by a blood test, HbA1C is com-
monly used as a measure of average glucose control over the few months prior to testing [7].
While self-blood glucose monitoring (SBGM) is used as a part of day to day self-management,
HbA1c is the gold standard for evaluating overall diabetes control [8,9] with the literature rec-
ommending a HbA1c target of<7.0% (53 mmol/mol) for most people with diabetes [8,10–
14].
In the UK and Australia, the following annual care practices are recommended for all peo-
ple with diabetes: HbA1c; blood pressure (BP) monitoring; serum cholesterol; urine albumin/
creatinine ratio; foot risk surveillance; body mass index (BMI); smoking history; and digital
retinal screening [15–19]. In Australia, whether or not these practices are being routinely
delivered is measured by the Australian National Diabetes Audit (ANDA), an annual cross-
sectional benchmarking activity of the National Association of Diabetes Centres (NADC),
which documents the proportion of Australian people living with diabetes who a) receive these
care practices and b) meet treatment targets.
Recent work from the UK suggests variation in practice and outcomes between diabetes
centres, with the variation only partially explained by patient demographics [15]. However,
treatment targets by locality appeared worse for people with type 1 diabetes and were not asso-
ciated with patient demographics [15]. Similar differences by location have also been reported
in Canada [20], the United States [21], and the Netherlands [22].
In Australia, ANDA has consistently shown mean HbA1c to be well above target for people
with type 1 or type 2 diabetes [23–25]. Given the established links between elevated HbA1c
and the risk of development of diabetes complications [4,26], lowering of HbA1c is an impor-
tant marker of improvements in glucose control. Risk adjustment for patient-level factors out-
side the control of clinicians (such as age, duration of diabetes, or number of diabetes
complications) has partially explained variation in outcomes such as HbA1c and blood pres-
sure [27]. However, factors contributing to variation in HbA1c by type of diabetes centre or
PLOS ONE Exploring HbA1c variation
PLOS ONE | https://doi.org/10.1371/journal.pone.0263511 February 4, 2022 2 / 17
Melbourne, Australia. The data are not publicly
available due to the inadvertent risk of identifying a
participating diabetes centre (for example where
there are limited numbers of participating sites
within a given geographical area). Any requests for
data should be directed to the ANDA Secretariat at
[email protected]. Any such requests will be
forwarded to the ANDA Scientific Advisory
Committee for consideration.
Funding: The authors received no specific funding
for this work.
Competing interests: Sally Green is employed by
Monash University and receives funding from the
National Health and Medical Research Council
(NHMRC), the Medical Research Future Fund
(MRFF) and the Victorian Department of Health and
Human Services. She has no declaration of interest
specific to the research reported in this paper.
Sophia Zoungas reports financial activities outside
the submitted work including: Eli Lilly Australia Ltd
– Participation in Steering Committee (CVOT) 2019
& 2021 on behalf of Monash University – payment
to institution; Boehringer-Ingelheim – Participation
in Advisory Board, expert committees or
educational meeting 2019 on behalf of Monash
University – payment to institution; MSD Australia -
Participation in Advisory Board, expert committees
or educational meeting 2019 & 2020 on behalf of
Monash University – payment to institution;
AstraZeneca – Participation in Advisory Board,
expert committees or educational meeting 2017,
2018, 2019, 2020 & 2021 on behalf of Monash
University – payment to institution; Novo Nordisk -
Participation in Advisory Board, expert committees
or educational meeting 2016, 2018, 2019 & 2020
on behalf of Monash University – payment to
institution; Sanofi – Participation in Advisory Board,
expert committees or educational meeting 2018 on
behalf of Monash University – payment to
institution. This does not alter her adherence to
PLOS ONE policies on sharing data and materials.
The other authors declare no relevant declarations
of interest with regards to this manuscript.
Abbreviations: HbA1c, haemoglobin A1c; SBGM,
self-blood glucose monitoring; BP, blood pressure;
BMI, body mass index; ANDA, Australian National
Diabetes Audit; NADC, National Association of
Diabetes Centres; GDM, Gestational Diabetes
Mellitus; CoE, Centre of Excellence; eGFR,
estimated Glomerular Filtration Rate; CKD-Epi,
Chronic Kidney Disease-Epidemiology; DKA,
diabetic ketoacidosis; HHS, hyperosmolar
hyperglycaemic state; CABG, coronary artery
bypass grafting; LDL, low-density lipoprotein; HDL,
high-density lipoprotein; SES, socioeconomic
status; SEIFA, Socio-Economic Indexes for Areas.

location (metropolitan or regional) have not been explored. Identifying these factors may help
inform the development and use of targeted interventions to help reduce such variation, with
subsequent improvements in diabetes care and clinical outcomes.
Aims and hypothesis
The aims of this study were to i) identify the centre-specific factors and patient-specific factors
associated with variation in HbA1c levels, and ii) determine how these associations contribute
to variation in performance for this clinical indicator across diabetes centres in Australia.
It was also hypothesised that different centre-specific factors and patient-specific factors are
associated with variation in HbA1c for type 1 and type 2 diabetes.
Methods
ANDA administration and data collection
This was a cross-sectional study, with data collected during standard ANDA clinical audit. As
per the ANDA protocol, the ANDA Secretariat invited diabetes centres in primary, secondary
or tertiary care centres and specialist endocrinologists in private practice to participate in the
ANDA collection. Participation was entirely voluntary and all contact and correspondence
with participating centres/specialist endocrinologists occurred through the ANDA Secretariat.
Other members of the ANDA team were blinded to the identity of individual sites, which were
assigned a site code by the ANDA Secretariat [28].
During a four-week period in May-June 2019, de-identified data were collected for all con-
secutive patients presenting to one of 80 NADC-registered diabetes centres across Australia,
using the standardised ANDA data collection form (S1 File). Use of this standardised form
allowed collection of a minimum dataset that is congruent with similar international diabetes
databases [28]. The data was collected during routine clinical consultations and involved
review of the clinical record and pathology results where available. The data entry form was
available to participating diabetes centres as a paper collection form, REDCap secure electronic
data collection or secure data extraction from in-house databases. Where there were uncer-
tainties regarding the data (such as extreme or illogical values), the ANDA data management
team contacted the participating diabetes centre for clarification with erroneous data being
removed from the dataset prior to analysis.
Ethics approval and consent to participate
ANDA has received Human Research Ethics approval as an ongoing low risk clinical quality
benchmarking activity, to use doubly de-identified data (participating site and individual
patient) for research purposes (Monash Health Human Research Ethics Committee (HREC
Reference number: HREC/17/MonH/123)). Verbal consent is obtained by the health practi-
tioner at the time of clinical visit, where the purpose of the research is explained and partici-
pants are made aware that only deidentified information will be collected and used for
research purposes. This research is carried out in accordance with the National Health and
Medical Research Council (NHMRC) National Statement on Ethical Conduct in Human
Research 2007 –updated 2018, and is pursuant with the low risk requirements therein [29].
Participants
All people aged over 18 with type 1 or type 2 diabetes who presented to a participating diabetes
centre and who had data for the dependent variable (HbA1c percentage) were included in this
study. Participating ANDA collection centres primarily treat adults with type 1 or type 2
PLOS ONE Exploring HbA1c variation
PLOS ONE | https://doi.org/10.1371/journal.pone.0263511 February 4, 2022 3 / 17

diabetes. As such, paediatric cases (i.e. <18 years of age) and people with Gestational Diabetes
Mellitus (GDM) or unknown diabetes type were excluded.
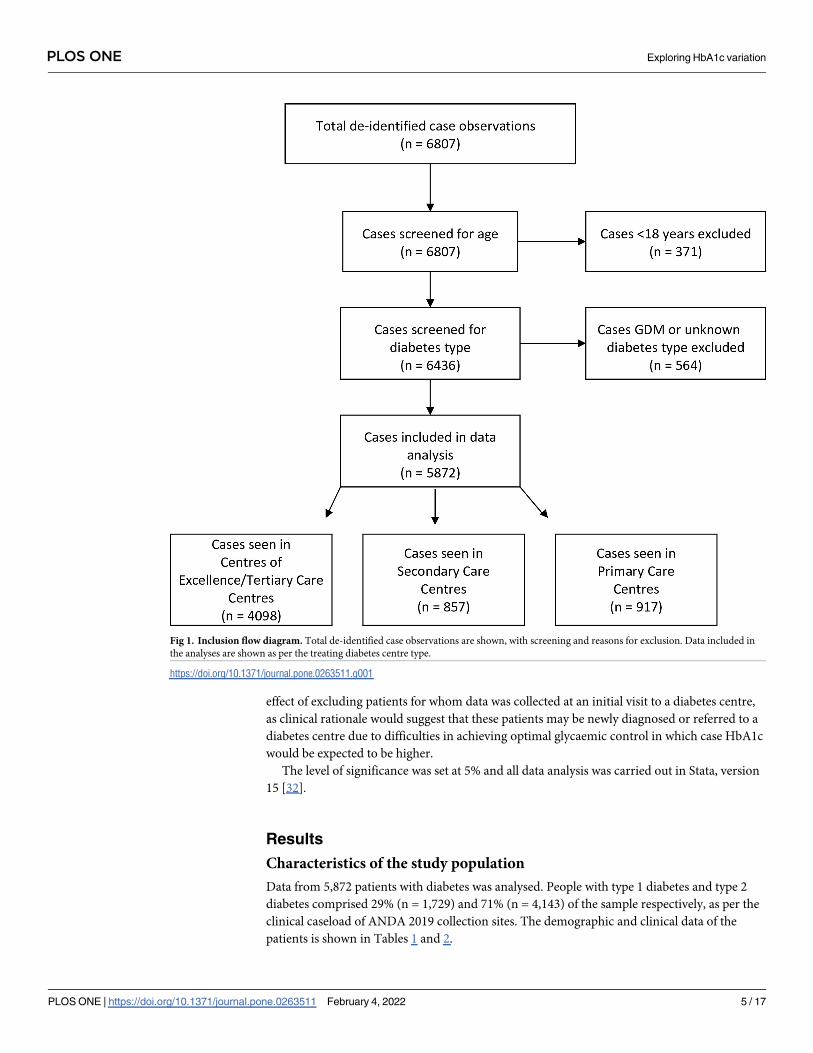
There were 79 participating diabetes centres with eligible patients; these included a mix of
Centres of Excellence (CoEs) (n = 5), Tertiary Diabetes Centres (n = 36), Secondary Care Dia-
betes Centres (n = 18) and Primary Care Diabetes Centres (n = 20), as defined by the NADC.
All Centres of Excellence are Tertiary Diabetes Centres, but are also recognised for clinical,
research, education, service advocacy and policy leadership. Centres of Excellence and Tertiary
Diabetes Centres offer a suite of diabetes services with full time medical and allied health staff
including endocrinologists, diabetes educators, psychologists, dieticians and podiatrists. Sec-
ondary Care Diabetes Centres employ a range of full/part time diabetes staff including a clini-
cal lead, diabetes educators and dieticians, but may not employ an endocrinologist or other
specialist staff. Primary Care Diabetes Centres employ diabetes educators and liaise with gen-
eral practitioners. Due to the similarities between CoEs and Tertiary Diabetes Centres and the
low numbers of CoEs, these centre categories were combined for analysis. Included cases and
reasons for exclusion are shown in Fig 1. This research was reviewed by members of the
ANDA Scientific Advisory Committee as per standard ANDA protocol [23].
Variables
The dependent variable in the modelling was HbA1c percentage. Centre-level covariates were
centre location (regional/metropolitan), centre type (Centres of Excellence and Tertiary Care
Centres, or Secondary Care Centres, or Primary Care Centres) and number of patients. Con-
tinuous patient-level covariates were diabetes disease duration in years, the total number of
glucose-lowering treatments and estimated Glomerular Filtration Rate (eGFR) (calculated
according to the Chronic Kidney Disease Epidemiology (CKD-Epi) formula detailed by Levey
et al. [30]). Categorical patient-level covariates were sex (male or female), Aboriginal or Torres
Strait Islander status (yes/no), smoking status (yes/no), occurrence of severe hypoglycaemic
episodes (yes/no), occurrence of recorded hyperglycaemic emergencies including diabetic
ketoacidosis (DKA) and hyperosmolar hyperglycaemic state (HHS) (yes/no), occurrence of
stroke or cardiovascular incidents including myocardial infarction, coronary artery bypass
grafting (CABG)/angioplasty, or congestive cardiac failure (yes/no), the presence of any diabe-
tes complications including retinopathy, peripheral neuropathy, ulceration, peripheral vascu-
lar disease, amputation, blindness, sexual dysfunction and end stage renal disease (yes/no),
liver disease status (mild/moderate or severe/not applicable), age category (18–39 years, 40–59
years, 60–79 years and>80 years), and body mass index (calculated in kg/m2 and categorised
according to guidelines from the World Health Organization [31]:<18.5 (underweight); 18.5–
24.9 (healthy); 25–29.9 (overweight) and >30 (obese)).
Statistical analysis
A linear mixed effects model was used to identify factors associated with variation in HbA1c
levels including the relative contribution of centre-level factors and patient-level factors. This
was achieved by specifying a random intercept term for centre and fixed effects terms for all
patient-level covariates. Univariate modelling was carried out to determine the most signifi-
cant variables to include in the final models. Based on the most significant variable identified
in the univariate analysis, we used the likelihood ratio test to evaluate whether the inclusion of
the next most significant variable helped improve the fit of the model, and this was done
sequentially until all potential variables were evaluated.
Separate models for type 1 and type 2 diabetes were developed as clinical rationale and pre-
vious studies suggested that different factors may contribute. Sensitivity analyses examined the
PLOS ONE Exploring HbA1c variation
PLOS ONE | https://doi.org/10.1371/journal.pone.0263511 February 4, 2022 4 / 17
effect of excluding patients for whom data was collected at an initial visit to a diabetes centre,
as clinical rationale would suggest that these patients may be newly diagnosed or referred to a
diabetes centre due to difficulties in achieving optimal glycaemic control in which case HbA1c
would be expected to be higher.
The level of significance was set at 5% and all data analysis was carried out in Stata, version
15 [32].
Results
Characteristics of the study population
Data from 5,872 patients with diabetes was analysed. People with type 1 diabetes and type 2
diabetes comprised 29% (n = 1,729) and 71% (n = 4,143) of the sample respectively, as per the
clinical caseload of ANDA 2019 collection sites. The demographic and clinical data of the
patients is shown in Tables 1 and 2.
Fig 1. Inclusion flow diagram. Total de-identified case observations are shown, with screening and reasons for exclusion. Data included in
the analyses are shown as per the treating diabetes centre type.
https://doi.org/10.1371/journal.pone.0263511.g001
PLOS ONE Exploring HbA1c variation
PLOS ONE | https://doi.org/10.1371/journal.pone.0263511 February 4, 2022 5 / 17

Factors contributing to variation in HbA1c
Mixed effects modelling results—type 1 diabetes. A higher volume of patients within
each centre was associated with higher HbA1c levels among patients with type 1 diabetes. Cen-
tre location (regional/metropolitan) or centre type did not significantly contribute to variation
in HbA1c (both p>0.05, Table 3).
Patient-level factors associated with higher HbA1c levels in type 1 diabetes included prior
recorded hyperglycaemic emergency episodes, presence of diabetes complications and higher
eGFR (all p< 0.01, Table 3). Patient-level factors associated with lower HbA1c levels in type 1
diabetes included non-smoking status and longer diabetes duration (all p< = 0.001, as shown
in Table 3).
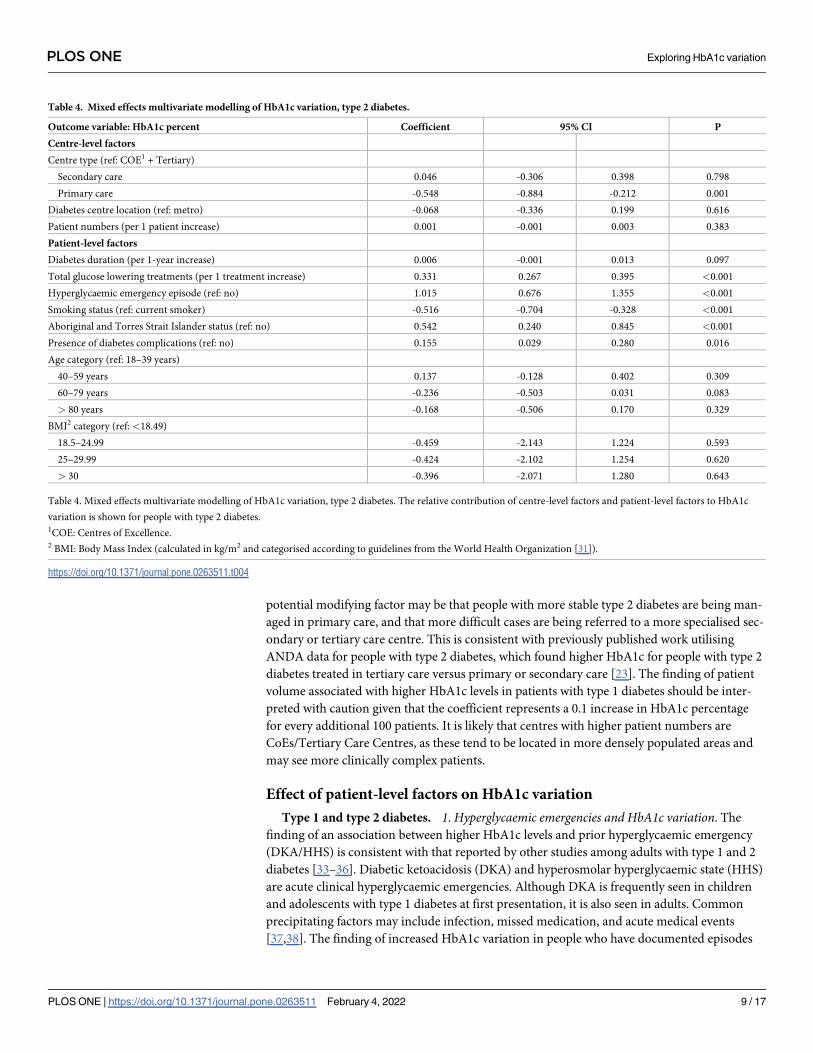
Mixed effects modelling results—type 2 diabetes. Being seen in a primary care centre
was associated with lower HbA1c levels among people with type 2 diabetes (p = 0.001,
Table 4). However, patient volume or centre location (regional/metropolitan) did not signifi-
cantly contribute to variation in HbA1c (Table 4).
Patient-level factors associated with higher HbA1c levels in type 2 diabetes included the
presence of diabetes complications (p = 0.016, Table 3), prior recorded hyperglycaemic
Table 1. Patient demographic and clinical variables–type 1 diabetes.
Demographic and clinical variables—type 1 Diabetes
N = 1,729 (% of total sample) 29.44
Age in years (mean, SD) 43±17
Disease duration in years (median, IQR) 18 (10,29)
Weight in kg (mean, SD) 80.65±18.83
Height in metres (mean, SD) 1.70±0.11
BMI1 (mean, SD) 27.81±6.67
Lipids -Total cholesterol in mmol/L (mean, SD) 4.65±1.08
Lipids–LDL2 cholesterol in mmol/L (mean, SD) 2.54±0.89
Lipids–HDL3 cholesterol in mmol/L (mean, SD) 1.51±0.46
Lipids—triglycerides in mmol/L (mean, SD) 1.27±1.02
Blood pressure—systolic in mmHg (mean, SD) 128.50±16.50
HbA1c % (mean, SD) 8.4±1.7
HbA1c mmol/mol (mean, SD) 68±19
Sex
Female (%) 51.89
Male (%) 48.11
Smoking Status
Smoking–current (%) 14.15
Smoking–past (%) 22.19
Smoking–never (%) 63.66
Aboriginal and Torres Strait Islander Peoples
No (%) 97.43
Yes (%) 2.57
Table 1. Patient demographic and clinical variables–type 1 Diabetes. Characteristics of the sample with type 1
diabetes are shown.1BMI: Body Mass Index (calculated in kg/m2 and categorised according to guidelines from the World Health
Organization [25]).2LDL: Low-density lipoprotein.3HDL: High-density lipoprotein.
https://doi.org/10.1371/journal.pone.0263511.t001
PLOS ONE Exploring HbA1c variation
PLOS ONE | https://doi.org/10.1371/journal.pone.0263511 February 4, 2022 6 / 17

emergency episodes, Aboriginal and Torres Strait Islander status, and the number of glucose-
lowering agents used (all p<0.001, Table 3). The only patient-level factor associated with lower
HbA1c levels in type 2 diabetes was non-smoking status (i.e., being a non-smoker) (p<0.05,
Table 4).
To identify the contribution of centre-level effects, the model for type 2 diabetes was exam-
ined both with and without the centre-level factors included. The addition of centre-level fac-
tors reduced the random intercept estimate from 0.265 to 0.185 (95% CI: 0.114 to 0.300)
indicating that the variation in HbA1c not accounted for was substantively reduced by the
addition of the centre-level factors.
Sensitivity analyses. ANDA collects a minimal cross-sectional dataset at one point each
year. As such, the frequency of visits was not collected. However, whether the visit at which
data was collected was an initial or subsequent visit was recorded. Clinical rationale suggested
that HbA1c would likely be higher in people presenting to a health service for the first time,
either because they had been recently diagnosed or referred to a specialist centre. In sensitivity
analyses that excluded patients for whom data was collected at an initial visit to a diabetes cen-
tre, the same centre- and patient-level factors contributed to HbA1c variation. However, the
Table 2. Patient demographic and clinical variables–type 2 diabetes.
Demographic and clinical variables—type 2 Diabetes
N = 4,143 (% of total sample) 70.56
Age in years (mean, SD) 64±13
Disease duration in years (median, IQR) 12 (6,20)
Weight in kg (mean, SD) 94.08±23.5
Height in metres (mean, SD) 1.68±0.10
BMI1 (mean, SD) 33.34±7.80
Lipids -Total cholesterol in mmol/L (mean, SD) 4.20±1.21
Lipids–LDL2 cholesterol in mmol/L (mean, SD) 2.16±0.94
Lipids–HDL3 cholesterol in mmol/L (mean, SD) 1.15±0.39
Lipids—triglycerides in mmol/L (mean, SD) 2.24±2.21
Blood pressure—systolic in mmHg (mean, SD) 133.01±17.50
HbA1c % (mean, SD) 8.1±1.8
HbA1c mmol/mol (mean, SD) 65±20
Sex
Female (%) 45.31
Male (%) 54.69
Smoking Status
Smoking–current (%) 11.49
Smoking–past (%) 35.81
Smoking–never (%) 52.71
Aboriginal and Torres Strait Islander Peoples
No (%) 95.09
Yes (%) 4.91
Table 2. Patient demographic and clinical variables–type 2 Diabetes. Characteristics of the sample with type 2
diabetes are shown.1BMI: Body Mass Index (calculated in kg/m2 and categorised according to guidelines from the World Health
Organization [25]).2LDL: Low-density lipoprotein.3HDL: High-density lipoprotein.
https://doi.org/10.1371/journal.pone.0263511.t002
PLOS ONE Exploring HbA1c variation
PLOS ONE | https://doi.org/10.1371/journal.pone.0263511 February 4, 2022 7 / 17

magnitude of the effect was slightly smaller for the centre-level factors (Table 5 in S2 File &
Table 6 in S3 File)
Discussion
This study aimed to identify the centre-level and patient-level factors associated with variation
in HbA1c levels for patients with type 1 and type 2 diabetes. Only 2 centre-level factors i.e.
patient volume and centre type were found to be significantly associated with variation in
HbA1c levels. In contrast, many more patient-level factors were associated with variation in
HbA1c including past hyperglycaemic events, smoking status, and Aboriginal and Torres
Strait Islander status. These results suggest that greater improvements in HbA1c may be
achieved by targeting patient-level factors rather than centre-level factors.
Effect of centre-level factors on HbA1c variation
We were surprised that diabetes centre location was not associated with variation in HbA1c
levels, in contrast to the findings from other countries [15,20–22]. This may, in part, reflect the
higher concentration of ANDA collection sites in larger cities and a limited number of remote
diabetes centres in the sample. The contribution of diabetes centre type to HbA1c variation in
people with type 2 diabetes is an unexpected finding. This finding may likely be modified by
another factor not controlled for in our model, such as socio-economic status. Another
Table 3. Mixed effects multivariate modelling of variation in HbA1c, type 1 diabetes.
Outcome variable: HbA1c percent Coefficient 95% CI P
Centre-level factors
Centre type (ref: COE1 + Tertiary)
Secondary care -0.071 -0.347 0.205 0.616
Primary care 0.561 -0.002 1.125 0.051
Diabetes centre location (ref: metro) 0.067 -0.144 0.277 0.533
Patient numbers (per 10 patient increase) 0.010 0.000 0.002 0.019
Patient-level factors
Diabetes duration (per 1-year increase) -0.013 -0.021 -0.005 0.001
eGFR2 (per 1 mL/min/1.73m2 increase) 0.007 0.003 0.012 0.002
Presence of diabetes complications (ref: no) 0.502 0.279 0.725 <0.001
Smoking status (ref: current smoker) -0.606 -0.883 -0.328 <0.001
Hyperglycaemic emergency episode (ref: no) 0.623 0.420 0.827 <0.001
Age category (ref: 18–39 years)
40–59 years 0.162 -0.081 0.405 0.191
60–79 years 0.148 -0.173 0.469 0.367
> 80 years 0.476 -0.389 1.341 0.281
BMI3 category (ref: <18.49)
18.5–24.99 -0.471 -1.177 0.235 0.191
25–29.99 -0.661 -1.368 0.046 0.067
> 30 -0.709 -1.421 0.003 0.051
Table 3. Mixed effects multivariate modelling of variation in HbA1c, type 1 diabetes. The relative contribution of centre-level factors and patient-level factors to HbA1c
variation is shown for people with type 1 diabetes.1COE: Centres of Excellence.2eGFR: estimated Glomerular Filtration Rate (eGFR) (calculated according to the CKD-Epi formula detailed by Levey et al. [30]).3 BMI: Body Mass Index (calculated in kg/m2 and categorised according to guidelines from the World Health Organization [31]).
https://doi.org/10.1371/journal.pone.0263511.t003
PLOS ONE Exploring HbA1c variation
PLOS ONE | https://doi.org/10.1371/journal.pone.0263511 February 4, 2022 8 / 17
potential modifying factor may be that people with more stable type 2 diabetes are being man-
aged in primary care, and that more difficult cases are being referred to a more specialised sec-
ondary or tertiary care centre. This is consistent with previously published work utilising
ANDA data for people with type 2 diabetes, which found higher HbA1c for people with type 2
diabetes treated in tertiary care versus primary or secondary care [23]. The finding of patient
volume associated with higher HbA1c levels in patients with type 1 diabetes should be inter-
preted with caution given that the coefficient represents a 0.1 increase in HbA1c percentage
for every additional 100 patients. It is likely that centres with higher patient numbers are
CoEs/Tertiary Care Centres, as these tend to be located in more densely populated areas and
may see more clinically complex patients.
Effect of patient-level factors on HbA1c variation
Type 1 and type 2 diabetes. 1. Hyperglycaemic emergencies and HbA1c variation. The
finding of an association between higher HbA1c levels and prior hyperglycaemic emergency
(DKA/HHS) is consistent with that reported by other studies among adults with type 1 and 2
diabetes [33–36]. Diabetic ketoacidosis (DKA) and hyperosmolar hyperglycaemic state (HHS)
are acute clinical hyperglycaemic emergencies. Although DKA is frequently seen in children
and adolescents with type 1 diabetes at first presentation, it is also seen in adults. Common
precipitating factors may include infection, missed medication, and acute medical events
[37,38]. The finding of increased HbA1c variation in people who have documented episodes
Table 4. Mixed effects multivariate modelling of HbA1c variation, type 2 diabetes.
Outcome variable: HbA1c percent Coefficient 95% CI P
Centre-level factors
Centre type (ref: COE1 + Tertiary)
Secondary care 0.046 -0.306 0.398 0.798
Primary care -0.548 -0.884 -0.212 0.001
Diabetes centre location (ref: metro) -0.068 -0.336 0.199 0.616
Patient numbers (per 1 patient increase) 0.001 -0.001 0.003 0.383
Patient-level factors
Diabetes duration (per 1-year increase) 0.006 -0.001 0.013 0.097
Total glucose lowering treatments (per 1 treatment increase) 0.331 0.267 0.395 <0.001
Hyperglycaemic emergency episode (ref: no) 1.015 0.676 1.355 <0.001
Smoking status (ref: current smoker) -0.516 -0.704 -0.328 <0.001
Aboriginal and Torres Strait Islander status (ref: no) 0.542 0.240 0.845 <0.001
Presence of diabetes complications (ref: no) 0.155 0.029 0.280 0.016
Age category (ref: 18–39 years)
40–59 years 0.137 -0.128 0.402 0.309
60–79 years -0.236 -0.503 0.031 0.083
> 80 years -0.168 -0.506 0.170 0.329
BMI2 category (ref: <18.49)
18.5–24.99 -0.459 -2.143 1.224 0.593
25–29.99 -0.424 -2.102 1.254 0.620
> 30 -0.396 -2.071 1.280 0.643
Table 4. Mixed effects multivariate modelling of HbA1c variation, type 2 diabetes. The relative contribution of centre-level factors and patient-level factors to HbA1c
variation is shown for people with type 2 diabetes.1COE: Centres of Excellence.2 BMI: Body Mass Index (calculated in kg/m2 and categorised according to guidelines from the World Health Organization [31]).
https://doi.org/10.1371/journal.pone.0263511.t004
PLOS ONE Exploring HbA1c variation
PLOS ONE | https://doi.org/10.1371/journal.pone.0263511 February 4, 2022 9 / 17

of DKA or HHS is not surprising due to the hyperglycaemia associated with these states, but
this finding emphasises the importance of regular blood glusose monitoring and education for
those with higher HbA1c. Higher body mass index, low socioeconomic status or lower levels
of health literacy may also lead to difficulties in preventing hyperglycaemia [38].
Given that the reported mortality of HHS is between 10 and 20%, effective prevention and
treatment are essential, especially as diagnosis may be delayed due to the absence of ketoacido-
sis [39]. While our results reflect people who have sought emergency medical care to treat
hyperglcaemia in the previous 12 months, it is likely that there are cases self-treated by individ-
uals without emergeny intervention and some individuals experiencing multiple hyperglycae-
mic emergencies in any 12 month period. People living with diabetes may also not be aware of
sick day mangement protocols to manage hyperglycaemic states before they become medical
emergencies [40].
Our finding highlights the need for clinical systems to Identify patients who are at risk of,
or who have experienced DKA or HHS, so that appropriate intensification of treatment and
sick day management education can occur. Such education should be delivered at a centre-
level for patients at risk, to enable effective self-medication during periods of hyperglycaemia
and subsequently reduce the incidence of hyperglycaemic emergencies.
2. The presence of diabetes complications and HbA1c variation. The presence of diabetes
complications was associated with higher HbA1c levels irrespective of diabetes type. As per the
ANDA data collection form (S 1), diabetes complications were defined as the presence of any
of the following: retinopathy, peripheral neuropathy, ulceration, peripheral vascular disease,
amputation, blindness, sexual dysfunction or end stage renal disease, categorised as a binary
variable (yes/no). The landmark Diabetes Control and Complications Trial (DCCT) and the
long-term follow up Epidemiology of Diabetes Interventions and Complications (EDIC) study
found reduced complications in people with type 1 diabetes who had intensive glycaemic con-
trol [4,26]. It is likely that the occurrence of diabetes complications is preceded by extended
periods of suboptimal glycaemic control. Additionally, it is possible that as people with diabe-
tes develop diabetes complications, clinical effort may be targeted towards minimising the
day-to-day impact of the diabetes complications, rather than on achieving or maintaining
ideal glycaemic control. Given the association between the presence of diabetes complications
and HbA1c variation, it would be helpful to explore the relationship between HbA1c variation
and individual complications with longitudinal data in a larger sample.
3. Smoking status and Hba1c variation. The association shown in our results between smok-
ing status and variation in HbA1c levels for people with type 1 or type 2 diabetes is consistent
with work that demonstrates poorer overall glycaemic control and higher HbA1c levels for
people who smoke [41,42].
While smoking rates in the ANDA sample are similar to those in the general population,
the harmful effects of smoking on diabetes complications cannot be overstated, especially
when combined with hyperglycaemia [43,44]. Clinical management guidelines recommend
that smoking status in people with diabetes should be assessed at every clinical visit, with
advice and referral offered to those who do smoke [45,46]. Recent work has highlighted the
safety and effectiveness of pharmacological and behavioural change techniques for smoking
cessation in people who are motivated to quit [43,47].
Stopping smoking is often a gradual process, with multiple attempts and involves conscious
decisions to change behaviour [48]. This process can be aided by smoking cessation programs
that use a mixture of pharmacological therapies and behaviour change techniques [43,49]. For
smoking cessation, successful interventions use behaviour change techniques including goal
setting, tobacco use assessment, action planning and restructuring of the environment [50]. It
is possible that the successful adoption of behaviour change strategies by people with diabetes
PLOS ONE Exploring HbA1c variation
PLOS ONE | https://doi.org/10.1371/journal.pone.0263511 February 4, 2022 10 / 17
to facilitate stopping smoking may also transfer to other lifestyle factors that affect HbA1c,
such as nutrition and physical activity.
The fact that similar reductions in HbA1C variation were seen for non-smokers in the
ANDA sample regardless of diabetes type further supports the strong push towards promotion
of smoking cessation programs as both a prevention and management strategy for people with
diabetes, especially given the cost-effectiveness of such programs in people with diabetes [51].
Type 1 diabetes
1. eGFR and HbA1c variation. Although statistically significant, the finding of eGFR
being associated with small increases in HbA1c for people with type 1 diabetes should be inter-
preted with caution, given the low magnitude of the coefficient. Clinically, we would suggest
that increased blood glucose monitoring may be beneficial for these patients to help manage
diurnal blood glucose variability.
Type 2 diabetes
1. Aboriginal and Torres Strait Islander status and HbA1c variation. Our finding of
increases in HbA1c in Aboriginal and Torres Strait Islander peoples with type 2 diabetes is
consistent with other work describing poorer diabetes outcomes in this population. While
Aboriginal and Torres Strait Islander peoples comprise approximately 3% of the population of
Australia, there are well documented disparities in health access and health outcomes com-
pared to non-Indigenous Australians [52,53]. There is a higher prevalence of type 2 diabetes,
and the associated complications are major contributors to increased mortality and a lower life
expectancy among Aboriginal and Torres Strait Islander peoples [52,54]. While some Aborigi-
nal and Torres Strait Islander peoples live in remote areas with less stable access to health care
and medication, higher HbA1c levels may reflect a lack of engagement due to centres not pro-
viding culturally appropriate health care [53,55]. Given that approximately half of Aboriginal
and Torres Strait Islander peoples live in urban communities, consideration should be given to
the implementation of codeveloped resources and culturally and linguistically appropriate dia-
betes education programs that have shown community acceptance, rather than relying on
standard methods of delivery. [54,56–60].
Delivery of culturally and linguistically appropriate diabetes education programs will also
involve education of health care professionals to ensure that the diabetes care and education
offered can be tailored to the specific cultural needs of the recipients. Design of programs to
educate healthcare professionals at a diabetes centre level should also involve collaboration
with Aboriginal and Torres Strait Islander healthcare workers to ensure that the training is rel-
evant to the communities that healthcare professionals service. Due to the disparities in diabe-
tes outcomes for this group of people living with diabetes, future work should examine the
impact of culturally appropriate education for both healthcare providers and the people that
they treat.
2. Glucose-lowering medications and HbA1c variation. The association between
increasing numbers of glucose-lowering medications and increases in HbA1c variation for
people with type 2 diabetes may seem counterintuitive. However, this is reflective of clinical
practice where despite intensification of treatment and multiple pharmacological agents, some
patients do not see clinically significant declines in HbA1c [61]. It may be that patients who
require multiple glucose-lowering agents have progressive disease and hence hyperglycaemia
is more difficult to manage [7,62]. This is consistent with current treatment algorithms that
are reactive and suggests a more proactive approach to the management of type 2 diabetes,
PLOS ONE Exploring HbA1c variation
PLOS ONE | https://doi.org/10.1371/journal.pone.0263511 February 4, 2022 11 / 17

with intensive multifactorial interventions including lifestyle and pharmacological changes
required to see reductions in HbA1c [63].
Previous work has also shown that clinical inertia leads to the delay of treatment intensifica-
tion in people with type 2 diabetes and contributes to delays in starting treatment with insulin
[64]. While insulin is included as a glucose-lowering treatment in the ANDA data collection
form, details of treatment intensification or the date of initiation are not collected, due to the
nature of the minimal dataset. Clinical inertia may be playing a part in this sample, with some
patients being prescribed further oral antihyperglycaemic medications, leading to delayed ini-
tiation with insulin. As such, multifaceted education to healthcare providers would likely be
necessary to ameliorate this clinical inertia [64,65].
Strengths and limitations
Strengths of this study include the number of patient level factors collected via a standardised
data collection form as part of routine clinical audit practice and the participation of a broad
cross-section of primary, secondary and tertiary care Australian diabetes centres, which are
reflective of clinical practice. As such, this sample is likely to be representative of the clinical
population seen in Australia.
A limitation is the inability to undertake further analysis related to centre-specific factors as
we were restricted to the data routinely collected in the ANDA. Such centre-specific factors
might include an adjustment for the number and type of specialist staff, funding model, or the
impact of socioeconomic status (SES). While we could adjust for socio-economic disadvantage
as per the Australian Bureau of Statistics Socio-Economic Indexes for Areas (SEIFA), this
would be by the location of the diabetes centre, not location of individual patients. Given the
wide geographical catchment area of many diabetes centres in Australia and the considerable
variability in individual patient SES within these catchment areas, it is unlikely that such analy-
sis would substantively add to our understanding.
A further limitation is that the diabetes centres were classified by their category within the
NADC category model. These NADC categories of centre type represent the wide variety of
diabetes centres across Australia, where people living with diabetes are treated in a range of
primary, secondary and tertiary care settings. While providing an overview of the structure
and the range of staff typically employed at each centre, discrete data about the numbers of
staff, staff to patient ratio and model of care at each site is not collected as part of ANDA.
Future research may be helpful in elucidating the association of these factors with clinical out-
comes. Finally, due to the cross-sectional nature of the data, it was not possible to infer
causality.
While the sample includes a higher percentage of people with type 1 diabetes than in the
general community, it is important to remember that the sample reflects the clinical caseload
of diabetes centres across Australia collected during routine clinical audit in a defined time-
frame. While people with type 1 diabetes are often seen in diabetes centres for continuing care,
it is likely that people with type 2 diabetes who have more stable control may be under the care
of general practitioners and not specialised diabetes centres [23].
Conclusion
Our results suggest that programs run at a centre-level but targeting patient-level factors rather
than centre factors themselves may be more beneficial in reducing variation in HbA1c. These
programs might include greater education about managing sick days to prevent hyperglycae-
mic emergencies, smoking cessation programs and the use of culturally and linguistically
appropriate diabetes education programs for Aboriginal and Torres Strait Islander peoples
PLOS ONE Exploring HbA1c variation
PLOS ONE | https://doi.org/10.1371/journal.pone.0263511 February 4, 2022 12 / 17

with diabetes. Given the mandated changes in healthcare delivery in many countries as a result
of COVID-19, developers of such programs should consider making these programs available
via virtual mediums to encourage uptake. Further research to identify other centre-level factors
may aid in the development of future models to optimise clinical outcomes in diabetes centres.
In particular, qualitative research may be helpful to understand the experience and context of
contemporary diabetes care in a range of diabetes centres in both metropolitan and regional
settings.
Supporting information
S1 File. ANDA data collection form 2019. Supplied by Australian National Diabetes Audit
(ANDA), Monash University, Melbourne, Australia.
(DOCX)
S2 File. Sensitivity analysis, Table 5. Sensitivity analysis, type 1 diabetes, excluding patients
for whom the recorded visit was an initial visit. The relative contribution of centre-level factors
and patient-level factors to HbA1c variation is shown for people with type 1 diabetes. 1COE:
Centres of Excellence. 2eGFR: estimated Glomerular Filtration Rate (eGFR) (calculated
according to the CKD-Epi formula detailed by Levey et al. [30]). 3 BMI: Body Mass Index (cal-
culated in kg/m2 and categorised according to guidelines from the World Health Organization
[31]).
(DOCX)
S3 File. Sensitivity analysis, Table 6. Sensitivity analysis, type 2 diabetes, excluding patients
for whom the recorded visit was an initial visit. The relative contribution of centre-level factors
and patient-level factors to HbA1c variation is shown for people with type 2 diabetes. 1COE:
Centres of Excellence. 2 BMI: Body Mass Index (calculated in kg/m2 and categorised according
to guidelines from the World Health Organization [31]).
(DOCX)
Author Contributions
Conceptualization: Matthew Quigley, Arul Earnest, Sally Green, Sophia Zoungas.
Data curation: Matthew Quigley.
Formal analysis: Matthew Quigley, Arul Earnest.
Investigation: Matthew Quigley, Naomi Szwarcbard, Natalie Wischer, Sofianos
Andrikopoulos.
Methodology: Arul Earnest, Sally Green, Sophia Zoungas.
Project administration: Natalie Wischer, Sofianos Andrikopoulos.
Supervision: Arul Earnest, Sally Green, Sophia Zoungas.
Visualization: Matthew Quigley.
Writing – original draft: Matthew Quigley.
Writing – review & editing: Matthew Quigley, Arul Earnest, Naomi Szwarcbard, Natalie
Wischer, Sofianos Andrikopoulos, Sally Green, Sophia Zoungas.
PLOS ONE Exploring HbA1c variation
PLOS ONE | https://doi.org/10.1371/journal.pone.0263511 February 4, 2022 13 / 17

References1. Cho N, Shaw J, Karuranga S, Huang Y, da Rocha Fernandes J, Ohlrogge A, et al. IDF Diabetes Atlas:
Global estimates of diabetes prevalence for 2017 and projections for 2045. Diabetes Research and
Clinical Practice. 2018; 138:271–81. https://doi.org/10.1016/j.diabres.2018.02.023 PMID: 29496507
2. Liebl A, Khunti K, Orozco-Beltran D, Yale J-F. Health economic evaluation of type 2 diabetes mellitus: a
clinical practice focused review. Clinical Medicine Insights: Endocrinology and Diabetes. 2015; 8:
CMED. S20906. https://doi.org/10.4137/CMED.S20906 PMID: 25861233
3. Fowler MJ. Microvascular and macrovascular complications of diabetes. Clinical Diabetes. 2008; 26
(2):77–82.
4. Nathan DM. Long-term complications of diabetes mellitus. New England Journal of Medicine. 1993; 328
(23):1676–85. https://doi.org/10.1056/NEJM199306103282306 PMID: 8487827
5. Al-Goblan AS, Al-Alfi MA, Khan MZ. Mechanism linking diabetes mellitus and obesity. Diabetes, Meta-
bolic Syndrome and Obesity: Targets and Therapy. 2014; 7:587. https://doi.org/10.2147/DMSO.
S67400 PMID: 25506234
6. Ahola AJ, Groop PH. Barriers to self-management of diabetes. Diabetic Medicine. 2013; 30(4):413–20.
https://doi.org/10.1111/dme.12105 PMID: 23278342
7. Jeppsson J-O, Kobold U, Barr J, Finke A, Hoelzel W, Hoshino T, et al. Approved IFCC reference
method for the measurement of HbA1c in human blood. Clinical Chemistry and Laboratory Medicine.
2002; 40(1):78–89. https://doi.org/10.1515/CCLM.2002.016 PMID: 11916276
8. Rohlfing CL, Wiedmeyer H-M, Little RR, England JD, Tennill A, Goldstein DE. Defining the relationship
between plasma glucose and HbA1c: analysis of glucose profiles and HbA1c in the Diabetes Control
and Complications Trial. Diabetes Care. 2002; 25(2):275–8. https://doi.org/10.2337/diacare.25.2.275
PMID: 11815495
9. Wei N, Zheng H, Nathan DM. Empirically establishing blood glucose targets to achieve HbA1c goals.
Diabetes Care. 2014; 37(4):1048–51. https://doi.org/10.2337/dc13-2173 PMID: 24513588
10. Zoungas S, Chalmers J, Ninomiya T, Li Q, Cooper M, Colagiuri S, et al. ADVANCE Collaborative Group
Association of HbA1c levels with vascular complications and death in patients with type 2 diabetes: evi-
dence of glycaemic thresholds. Diabetologia. 2012; 55:636–43. https://doi.org/10.1007/s00125-011-
2404-1 PMID: 22186981
11. Davidson JA. Treatment of the patient with diabetes: importance of maintaining target HbA1c levels.
Current Medical Research and Opinion. 2004; 20(12):1919–27. https://doi.org/10.1185/
030079904X6291 PMID: 15701210
12. Association AD. 6. Glycemic targets: standards of medical care in diabetes—2018. Diabetes Care.
2018; 41(Supplement 1):S55–S64. https://doi.org/10.2337/dc18-S006 PMID: 29222377
13. Passarella P, Kiseleva TA, Valeeva FV, Gosmanov AR. Hypertension Management in Diabetes: 2018
Update. Diabetes Spectrum. 2018; 31(3):218–24. https://doi.org/10.2337/ds17-0085 PMID: 30140137
14. Gunton JE, Cheung NW, Davis TME, Zoungas S, Colagiuri S. A new blood glucose management algo-
rithm for type 2 diabetes: a position statement of the Australian Diabetes Society. Medical Journal of
Australia. 2014; 201(11):650–3. https://doi.org/10.5694/mja14.01187 PMID: 25495309
15. NHS. National Diabetes Audit Report 1—Care Processes and Treatment Targets 2018–19, Short
Report. In: Digital N, editor.: NHS Digital; 2019.
16. Home P, Mant J, Diaz J, Turner C. Management of type 2 diabetes: summary of updated NICE guid-
ance. BMJ. 2008; 336(7656):1306–8. https://doi.org/10.1136/bmj.39560.442095.AD PMID: 18535074
17. RACGP. What should be evaluated yearly? Melbourne, Australia: Royal Australian College of General
Practitioners; 2019.
18. DoH. Australian National Diabetes Strategy 2016–2020. In: Health AGDo, editor. Canberra, Australia:
Commonwealth of Australia; 2015.
19. Health AGDo. Australian National Diabetes strategy 2021–2030. In: Do Health, editor. Canberra: Aus-
tralian government; 2021.
20. Gamble J-M, Butalia S. Medical practice variations in diabetes mellitus. Medical Practice Variations.
2016:1–40.
21. Arday DR, Fleming BB, Keller DK, Pendergrass PW, Vaughn RJ, Turpin JM, et al. Variation in diabetes
care among states: do patient characteristics matter? Diabetes Care. 2002; 25(12):2230–7. https://doi.
org/10.2337/diacare.25.12.2230 PMID: 12453966
22. Cho YY, Sidorenkov G, Denig P. Role of patient and practice characteristics in variance of treatment
quality in type 2 diabetes between general practices. PloS one. 2016; 11(11):e0166012. https://doi.org/
10.1371/journal.pone.0166012 PMID: 27806107
PLOS ONE Exploring HbA1c variation
PLOS ONE | https://doi.org/10.1371/journal.pone.0263511 February 4, 2022 14 / 17

23. Xiang AS, Szwarcbard N, Gasevic D, Earnest A, Pease A, Andrikopoulos S, et al. Trends in glycaemic
control and drug use in males and females with type 2 diabetes: Results of the Australian National Dia-
betes Audit from 2013 to 2019. Diabetes, Obesity and Metabolism. 2021; 23(12):2603–13. https://doi.
org/10.1111/dom.14506 PMID: 34338406
24. Pease A, Earnest A, Ranasinha S, Nanayakkara N, Liew D, Wischer N, et al. Burden of cardiovascular
risk factors and disease among patients with type 1 diabetes: results of the Australian National Diabetes
Audit (ANDA). Cardiovascular Diabetology. 2018; 17(1):77. https://doi.org/10.1186/s12933-018-0726-8
PMID: 29859534
25. Nanayakkara N, Ranasinha S, Gadowski AM, Davis WA, Flack JR, Wischer N, et al. Age-related differ-
ences in glycaemic control, cardiovascular disease risk factors and treatment in patients with type 2 dia-
betes: a cross-sectional study from the Australian National Diabetes Audit. BMJ Open. 2018; 8(8):
e020677. https://doi.org/10.1136/bmjopen-2017-020677 PMID: 30121593
26. Nathan DM, Group DER. The diabetes control and complications trial/epidemiology of diabetes inter-
ventions and complications study at 30 years: overview. Diabetes Care. 2014; 37(1):9–16. https://doi.
org/10.2337/dc13-2112 PMID: 24356592
27. Danek E, Earnest A, Wischer N, Andrikopoulos S, Pease A, Nanayakkara N, et al. Risk-adjustment of
diabetes health outcomes improves the accuracy of performance benchmarking. Scientific Reports.
2018; 8(1):10261. https://doi.org/10.1038/s41598-018-28101-w PMID: 29980691
28. DOH. Australian National Diabetes Audit (ANDA) Protocol: Australian Government Department of
Health; 2019 [updated 24/10/2019. Available from: https://www.monash.edu/medicine/anda/
governance.
29. NHMRC. The National Statement on Ethical Conduct in Human Research. Canberra, Australia:
National Health and Medical Research Council; 2007 (Updated 2018).
30. Levey AS, Stevens LA, Schmid CH, Zhang YL, Castro AF, Feldman HI, et al. A new equation to esti-
mate glomerular filtration rate. Annals of Internal Medicine. 2009; 150(9):604–12. https://doi.org/10.
7326/0003-4819-150-9-200905050-00006 PMID: 19414839
31. WHO. Mean Body Mass Index (BMI): World Health Organization; 2020 [Available from: https://www.
who.int/gho/ncd/risk_factors/bmi_text/en/.
32. Statacorp. Stata Statistical Software: Release 15. College Station, TX: StataCorp LLC; 2019.
33. Barski L, Nevzorov R, Jotkowitz A, Rabaev E, Zektser M, Zeller L, et al. Comparison of diabetic ketoaci-
dosis in patients with type-1 and type-2 diabetes mellitus. The American Journal of the Medical Sci-
ences. 2013; 345(4):326–30. https://doi.org/10.1097/MAJ.0b013e31827424ab PMID: 23377164
34. Zhu B, Bu L, Zhang M, Gusdon AM, Zheng L, Rampersad S, et al. HbA 1c as a Screening tool for Keto-
sis in Patients with Type 2 Diabetes Mellitus. Scientific Reports. 2016; 6:39687. https://doi.org/10.1038/
srep39687 PMID: 28009017
35. Butalia S, Johnson J, Ghali W, Rabi D. Clinical and socio-demographic factors associated with diabetic
ketoacidosis hospitalization in adults with Type 1 diabetes. Diabetic Medicine. 2013; 30(5):567–73.
https://doi.org/10.1111/dme.12127 PMID: 23323955
36. Weinstock RS, Xing D, Maahs DM, Michels A, Rickels MR, Peters AL, et al. Severe hypoglycemia and
diabetic ketoacidosis in adults with type 1 diabetes: results from the T1D Exchange clinic registry. The
Journal of Clinical Endocrinology & Metabolism. 2013; 98(8):3411–9. https://doi.org/10.1210/jc.2013-
1589 PMID: 23760624
37. Kitabchi AE, Umpierrez GE, Miles JM, Fisher JN. Hyperglycemic crises in adult patients with diabetes.
Diabetes Care. 2009; 32(7):1335–43. https://doi.org/10.2337/dc09-9032 PMID: 19564476
38. Funnell MM, Brown TL, Childs BP, Haas LB, Hosey GM, Jensen B, et al. National standards for diabe-
tes self-management education. Diabetes Care. 2008; 31(Supplement 1):S97–S104. https://doi.org/10.
2337/dc08-S097 PMID: 18165344
39. Pasquel FJ, Umpierrez GE. Hyperosmolar hyperglycemic state: a historic review of the clinical presen-
tation, diagnosis, and treatment. Diabetes Care. 2014; 37(11):3124–31. https://doi.org/10.2337/dc14-
0984 PMID: 25342831
40. Ilkowitz JT, Choi S, Rinke ML, Vandervoot K, Heptulla RA. Pediatric type 1 diabetes: reducing admis-
sion rates for diabetes ketoacidosis. Quality management in health care. 2016; 25(4):231. https://doi.
org/10.1097/QMH.0000000000000109 PMID: 27749721
41. Kar D, Gillies C, Zaccardi F, Webb D, Seidu S, Tesfaye S, et al. Relationship of cardiometabolic param-
eters in non-smokers, current smokers, and quitters in diabetes: a systematic review and meta-analysis.
Cardiovascular diabetology. 2016; 15(1):1–15.
42. Szwarcbard N VM, Earnest A, et al. The association of smoking status on glycaemic control, metabolic
profile and diabetic complications–Results of the Australian National Diabetes Audit (ANDA). Journal of
PLOS ONE Exploring HbA1c variation
PLOS ONE | https://doi.org/10.1371/journal.pone.0263511 February 4, 2022 15 / 17
Diabetes and Its Complications. 2020. https://doi.org/10.1016/j.jdiacomp.2020.107626 PMID:
32527672
43. Campagna D, Alamo A, Di Pino A, Russo C, Calogero A, Purrello F, et al. Smoking and diabetes: dan-
gerous liaisons and confusing relationships. Diabetology & metabolic syndrome. 2019; 11(1):1–12.
https://doi.org/10.1186/s13098-019-0482-2 PMID: 31666811
44. Śliwińska-MossońM, Milnerowicz H. The impact of smoking on the development of diabetes and its
complications. Diabetes and Vascular Disease Research. 2017; 14(4):265–76. https://doi.org/10.1177/
1479164117701876 PMID: 28393534
45. Haire-Joshu D, Glasgow RE, Tibbs TL. Smoking and diabetes. Diabetes care. 2004; 27:S74. https://
doi.org/10.2337/diacare.27.2007.s74 PMID: 14693932
46. RACGP. Supporting smoking cessation: A guide for health professionals Melbourne, Australia: Royal
Australian College of General Practitioners; 2021 [Available from: https://www.racgp.org.au/clinical-
resources/clinical-guidelines/key-racgp-guidelines/view-all-racgp-guidelines/supporting-smoking-
cessation.
47. Hartmann-Boyce J, Chepkin SC, Ye W, Bullen C, Lancaster T. Nicotine replacement therapy versus
control for smoking cessation. Cochrane Database of Systematic Reviews. 2018(5). https://doi.org/10.
1002/14651858.CD000146.pub5 PMID: 29852054
48. Caponnetto P, Polosa R. Common predictors of smoking cessation in clinical practice. Respiratory
medicine. 2008; 102(8):1182–92. https://doi.org/10.1016/j.rmed.2008.02.017 PMID: 18586479
49. Steliga MA, editor Smoking cessation in clinical practice: How to get patients to stop. Seminars in tho-
racic and cardiovascular surgery; 2018: Elsevier.
50. Moafa I, Hoving C, van den Borne B, Jafer M. Identifying Behavior Change Techniques Used in
Tobacco Cessation Interventions by Oral Health Professionals and Their Relation to Intervention
Effects—A Review of the Scientific Literature. International journal of environmental research and public
health. 2021; 18(14):7481. https://doi.org/10.3390/ijerph18147481 PMID: 34299931
51. Siegel KR, Ali MK, Zhou X, Ng BP, Jawanda S, Proia K, et al. Cost-effectiveness of interventions to
manage diabetes: has the evidence changed since 2008? Diabetes Care. 2020; 43(7):1557–92. https://
doi.org/10.2337/dci20-0017 PMID: 33534729
52. Martin DD, Jones TW, Davis EA, Shephard MD, Freeman H, Maguire GP, et al. Point-of-care testing of
HbA1c and blood glucose in a remote Aboriginal Australian community. Medical journal of Australia.
2005; 182(10):524–7.
53. AIHW. Australia’s Health 2018. In: Welfare AIoHa, editor. AUS221 ed. Canberra, Australia: Australian
Institute of Health and Welfare; 2018.
54. Johnson DR, McDermott RA, Clifton PM, D’Onise K, Taylor SM, Preece CL, et al. Characteristics of
Indigenous adults with poorly controlled diabetes in north Queensland: implications for services. BMC
Public Health. 2015; 15(1):325.
55. Bailie J, Schierhout G, Laycock A, Kelaher M, Percival N, O’Donoghue L, et al. Determinants of access
to chronic illness care: a mixed-methods evaluation of a national multifaceted chronic disease package
for Indigenous Australians. BMJ open. 2015; 5(11):e008103. https://doi.org/10.1136/bmjopen-2015-
008103 PMID: 26614617
56. Pyett P, Waples-Crowe P, Van Der Sterren A. Engaging with Aboriginal communities in an urban con-
text: some practical suggestions for public health researchers. Australian and New Zealand Journal of
Public Health. 2009; 33(1):51–4. https://doi.org/10.1111/j.1753-6405.2009.00338.x PMID: 19236359
57. Pyett P, Waples-Crowe P, van der Sterren A. Challenging our own practices in Indigenous health pro-
motion and research. Health Promotion Journal of Australia. 2008; 19(3):179–83. https://doi.org/10.
1071/he08179 PMID: 19053933
58. Browne J, D’Amico E, Thorpe S, Mitchell C. Feltman: evaluating the acceptability of a diabetes educa-
tion tool for Aboriginal health workers. Australian Journal of Primary Health. 2014; 20(4):319–22.
https://doi.org/10.1071/PY14040 PMID: 25033700
59. Xu H, Geros C, Turner E, Egan M, Cocotis K, Mitchell C, et al. Feltman: evaluating the utilisation of an
Aboriginal diabetes education tool by health professionals. Australian Journal of Primary Health. 2019;
24(6):496–501.
60. Allen J, Mohatt GV, Rasmus SM, Hazel KL, Thomas L, Lindley S. The tools to understand: Community
as co-researcher on culture-specific protective factors for Alaska Natives. Journal of Prevention & Inter-
vention in the Community. 2006; 32(1–2):41–59. https://doi.org/10.1300/J005v32n01_04 PMID:
17000601
61. McGovern AP, Dennis JM, Shields BM, Hattersley AT, Pearson ER, Jones AG. What to do with diabe-
tes therapies when HbA1c lowering is inadequate: add, switch, or continue? A MASTERMIND study.
BMC Medicine. 2019; 17(1):79. https://doi.org/10.1186/s12916-019-1307-8 PMID: 30979373
PLOS ONE Exploring HbA1c variation
PLOS ONE | https://doi.org/10.1371/journal.pone.0263511 February 4, 2022 16 / 17
62. Group UPDS. Intensive blood-glucose control with sulphonylureas or insulin compared with conven-
tional treatment and risk of complications in patients with type 2 diabetes (UKPDS 33). The lancet.
1998; 352(9131):837–53.
63. Del Prato S, Penno G, Miccoli R. Changing the treatment paradigm for type 2 diabetes. Diabetes Care.
2009; 32(suppl 2):S217–S22. https://doi.org/10.2337/dc09-S314 PMID: 19875555
64. Okemah J, Peng J, Quiñones M. Addressing clinical inertia in type 2 diabetes mellitus: a review.
Advances in therapy. 2018; 35(11):1735–45. https://doi.org/10.1007/s12325-018-0819-5 PMID:
30374807
65. Reach G, Pechtner V, Gentilella R, Corcos A, Ceriello A. Clinical inertia and its impact on treatment
intensification in people with type 2 diabetes mellitus. Diabetes & metabolism. 2017; 43(6):501–11.
https://doi.org/10.1016/j.diabet.2017.06.003 PMID: 28754263
PLOS ONE Exploring HbA1c variation
PLOS ONE | https://doi.org/10.1371/journal.pone.0263511 February 4, 2022 17 / 17