Gas permeability of hollow fiber membranes in a gas-liquid system
Journal of
www.elsevier.com/locate/yjsbi
Journal of Structural Biology 157 (2007) 534–544
StructuralBiology
Exploring gas permeability of cellular membranes and membranechannels with molecular dynamics
Yi Wang a, Jordi Cohen a,d, Walter F. Boron b, Klaus Schulten a,d, Emad Tajkhorshid a,c,*
a Theoretical and Computational Biophysics Group, Beckman Institute, University of Illinois at Urbana-Champaign, Urbana, IL 61801, USAb Department of Cellular and Molecular Physiology, Yale University School of Medicine, New Haven, CT 06520, USA
c Department of Biochemistry, University of Illinois at Urbana-Champaign, Urbana, IL 61801, USAd Department of Physics, University of Illinois at Urbana-Champaign, Urbana, IL 61801, USA
Received 12 August 2006; received in revised form 28 October 2006; accepted 3 November 2006Available online 4 January 2007
Abstract
Aquaporins are a family of membrane proteins specialized in rapid water conduction across biological membranes. Whether thesechannels also conduct gas molecules and the physiological significance of this potential function have not been well understood. Herewe report 140 ns of molecular dynamics simulations of membrane-embedded AQP1 and of a pure POPE bilayer addressing these ques-tions. The permeability of AQP1 to two types of gas molecules, O2 and CO2, was investigated using two complementary methods, name-ly, explicit gas diffusion simulation and implicit ligand sampling. The simulations show that the central (tetrameric) pore of AQP1 can bereadily used by either gas molecule to permeate the channel. The two approaches produced similar free energy profiles associated withgas permeation through the central pore: a �0.4 to �1.7 kcal/mol energy well in the middle, and a 3.6–4.6 kcal/mol energy barrier in theperiplasmic vestibule. The barrier appears to be mainly due to a dense cluster of water molecules anchored in the periplasmic mouth ofthe central pore by four aspartate residues. Water pores show a very low permeability to O2, but may contribute to the overall perme-ation of CO2 due to its more hydrophilic nature. Although the central pore of AQP1 is found to be gas permeable, the pure POPE bilayerprovides a much larger cross-sectional area, thus exhibiting a much lower free energy barrier for CO2 and O2 permeation. As such, gasconduction through AQP1 may only be physiologically relevant either in membranes of low gas permeability, or in cells where a majorfraction of the cellular membrane is occupied by AQPs.� 2006 Elsevier Inc. All rights reserved.
Keywords: Aquaporin; AQP1; Gas permeability; O2; CO2; Free energy profile; Gas channels
1. Introduction
Aquaporins (AQPs) are a family of membrane channels(Preston et al., 1992; Heymann and Engel, 1999; de Grootand Grubmuller, 2005; Agre et al., 1998; Agre, 2006; Borg-nia et al., 1999; Fujiyoshi et al., 2002; Hohmann et al.,2001) that, through modulating the water permeability ofbiological membranes, play a significant role in waterhomeostasis in living cells (Agre and Kozono, 2003; Deenand van Os, 1998; Li and Verkman, 2001; King and Agre,2004; Agre et al., 2004). AQPs organize as tetramers in the
1047-8477/$ - see front matter � 2006 Elsevier Inc. All rights reserved.
doi:10.1016/j.jsb.2006.11.008
* Corresponding author.E-mail address: [email protected] (E. Tajkhorshid).
membrane, with each monomer forming a functionallyindependent water pore (Tajkhorshid et al., 2002; de Grootand Grubmuller, 2001). The function of a fifth pore, the‘‘central pore’’, which is located at the center of the fourmonomers, remains unclear. Due to their structural sim-plicity and the approachable timescale of their basic func-tion, e.g., water conduction, AQPs have been investigatedextensively with molecular dynamics (MD) simulations(Tornroth-Horsefield et al., 2006; Tajkhorshid et al.,2002, 2003, 2005a,b; Jensen et al., 2001, 2003; Zhu et al.,2001, 2004; de Groot and Grubmuller, 2001, 2005; Gray-son et al., 2003). These studies have significantly contribut-ed to our understanding of the molecular basis of theirfunction and selectivity. A particularly intriguing propertyof AQPs is their ability to block protons (Pohl et al., 2001;

Y. Wang et al. / Journal of Structural Biology 157 (2007) 534–544 535
Saparov et al., 2005) while allowing water to pass, a prob-lem that has attracted much attention from theoreticalstudies (Burykin and Warshel, 2004; Chakrabarti et al.,2004; Tajkhorshid et al., 2002; de Groot et al., 2003; Ilanet al., 2004; de Groot and Grubmuller, 2005; Jensenet al., 2003; Burykin and Warshel, 2003).
Water permeation is by far the best characterized physio-logical role of AQPs, however, they also participate in otherdiverse cellular functions. Permeabilities of other small sub-strates in AQPs have been reported for glycerol (Borgnia andAgre, 2001; Grayson et al., 2003; Heller et al., 1980), urea(Borgnia et al., 1999), nitrate (Ikeda et al., 2002), arsenite(Liu et al., 2002) and even ions (Yool and Weinstein,2002). Furthermore, some AQPs have been suspected to par-ticipate in gas conduction across cellular membranes (Hanbaet al., 2004; Nakhoul et al., 1998; Herrera et al., 2006; Cooperand Boron, 1998; Endeward et al., 2006; Cooper et al., 2002;Blank and Ehmke, 2003; Terashima and Ono, 2002; Uehleinet al., 2003; Prasad et al., 1998). For instance, a recent studyon tobacco aquaporin NtAQP1 has suggested that NtAQP1not only facilitates CO2 permeation when expressed in Xeno-
pus oocytes, but also has a significant function in photosyn-thesis and in stomatal opening (Uehlein et al., 2003).Another study on Xenopus oocytes has shown that the CO2
permeability is increased by about 40% when AQP1 isexpressed (Nakhoul et al., 1998; Cooper and Boron, 1998).AQP1 reconstituted in proteoliposomes has been found toincrease both water and CO2 permeabilities markedly (Pra-sad et al., 1998). However, as lipid membranes are oftengas-permeable, characterizing the gas permeability of AQPsis a challenging experimental problem (Verkman, 2002;Fang et al., 2002; Yang et al., 2000). Moreover, the pathwaythrough which gas molecules might permeate AQPs cannotbe identified directly through presently available experimen-tal methods. Therefore, it is of great interest as well as impor-tance to further explore the gas permeability of thesemembrane channels using computational methodologies.A recent simulation study has employed umbrella samplingto calculate the energetics associated with CO2 permeationthrough AQP1 (Hub and de Groot, 2006).
To shed light on the gas permeability of AQP1 and onits physiological relevance, we performed a total of140 ns MD simulations on a membrane-embedded AQP1
Table 1The four systems investigated using explicit gas diffusion simulations
System teq(ns) Neq Klw
POPE-CO2 23 25 4.0 ± 0.1POPE-O2 15 16 4.7 ± 0.2AQP1-CO2 30 1 n/aAQP1-O2 26 3 n/a
n/a, not applicable.The equilibration time (teq) and the number of permeation events during equilibare shown for POPE-CO2 and POPE-O2. Gas diffusion coefficients (D) in watcentral pore of AQP1 (D) are shown for AQP1-CO2 and AQP1-O2. The sipermeation events (Np) are also listed. Numbers in parenthesis are permeationrespectively. Klw was not calculated for the AQP1/bilayer systems due to the
tetramer, as well as on pure POPE bilayers. Using two dif-ferent methodologies, namely explicit gas diffusion simula-
tion and implicit ligand sampling (Cohen et al., 2006), wehave analyzed potential pathways for permeation of O2
and CO2 through AQP1, and calculated the associatedenergetics. In the gas diffusion simulations, 100 CO2 orO2 molecules were initially placed in water on both sidesof the membrane and allowed to move freely. The implicitligand sampling, on the other hand, predicts the PMFpurely based on simulations of membrane-embeddedAQP1 in the absence of explicit gas molecules. Althoughthe two methods work through disparate mechanisms, theyhave yielded similar results. The PMFs associated with gaspermeation revealed a �0.4 to �1.7 kcal/mol energy well inthe middle of the AQP1 central pore, and an energy barrierof 3.6–4.6 kcal/mol in the periplasmic entrance. Our resultssuggest that the hydrophobic central pore of AQP1 isindeed permeable to both CO2 and O2. Compared withthe well-characterized water pores, the central pore ofAQPs is poorly understood, and it remains a long-standingquestion whether it has any physiological importance. Oursimulations suggest that the AQP1 central pore provides apotential pathway for gas permeation, and that this path-way can play a physiological role either in membranes withlow intrinsic gas permeabilities, or when a major fractionof the membrane is occupied by AQPs.
2. Methods
2.1. Explicit gas diffusion simulations
Explicit gas diffusion simulations were performed onan AQP1 tetramer embedded in a POPE bilayer, with100 CO2 or O2 molecules initially placed in the watersolution. Control simulations were performed on purePOPE bilayers without AQP1. Altogether, four systems,AQP1-CO2, AQP1-O2, POPE-CO2 and POPE-O2, wereinvestigated using two types of simulations, equilibriumsimulations and induced pressure simulations, asdescribed below and summarized in Table 1. The firsttwo systems consisted of a membrane-embedded AQP1tetramer, while the last two were composed of purePOPE bilayers.
D (10�5 cm2/s) tp (ns) Np
1.80 ± 0.01 10 2032.14 ± 0.01 10 2581.43 ± 0.09 10 80(6,4)2.39 ± 0.06 10 83(1,6)
rations (Neq) are listed. Partition coefficients between lipids and water (Klw)er are listed for POPE-CO2 and POPE-O2; gas diffusion coefficients in themulation time for induced pressure simulations (tp) and the number ofevents through the monomeric water pores and the central pore of AQP1,inhomogeneity of the membrane composition.

536 Y. Wang et al. / Journal of Structural Biology 157 (2007) 534–544
2.1.1. Modeling
A 100 · 100 A2 POPE bilayer patch was initially builtusing VMD’s membrane plugin (Humphrey et al., 1996).Two 20-A layers of water were then added using the solvateplugin of VMD (Humphrey et al., 1996) to fully hydratethe system; 15 sodium and 15 chloride ions were thenadded using VMD’s autoionize plugin (Humphrey et al.,1996), generating a 50 mM ionic concentration. After5000 steps of minimization, the lipid tails were ‘‘melted’’over the course of a 500 ps of constant temperature(310 K) simulation, in which only the lipid tails wereallowed to move freely while the rest of the system wasfixed. Another 500 ps simulation was then performed underconstant temperature (310 K) and constant pressure(1 atm) conditions with all the atoms free to move. Usingthe last 100 ps of this simulation, we calculated the free vol-ume inside lipids along the membrane normal, with VMD’svolmap plugin (Humphrey et al., 1996). The equilibratedPOPE bilayer was then used to build the POPE-CO2 andPOPE-O2 systems, where 100 CO2 or O2 molecules wereinitially placed in the bulk region among water moleculeson both sides of the membrane. The AQP1-CO2 andAQP1-O2 systems were built in a similar fashion, withthe POPE-AQP1 structure taken from a 450 ps equilibra-tion performed by Zhu et al. (2001, 2004). During the
Fig. 1. Side (left panels) and top (right panels) views of the systems AQP1-COhave a similar cross-sectional area, with the membrane normal along the z-axrepresentation.
equilibration of POPE-AQP1 (Zhu et al., 2001; Zhuet al., 2004), a constraint on the H-bond between the guan-idinium group and the backbone oxygen of Arg197 wasused to prevent the flipping of the side chain which wouldblock the channel (Wang et al., 2005; Jiang et al., 2006).This constraint was kept in our explicit gas diffusion simu-lations. The final systems: POPE-CO2 (82,989 atoms),POPE-O2 (82,889 atoms), AQP1-CO2 (81,065 atoms) andAQP1-O2 (81,052 atoms) share a similar cross-sectionalarea, with the membrane normal along the z-axis.
2.1.2. Equilibrium simulationsAll the four systems were first minimized for 5000 steps.
As shown in Table 1, POPE-CO2 and POPE-O2 were thenequilibrated at constant temperature for 23 ns and 15 ns,respectively; AQP1-CO2 and AQP1-O2 were equilibratedunder constant temperature and constant pressure condi-tions for 30 ns and 26 ns, respectively. Fig. 1 shows snap-shots of the AQP1-CO2 and POPE-CO2 systems after 500ps of equilibration.
2.1.3. Induced pressure simulations
After the first 10 ns of equilibrium simulation in eachsystem, we applied a force of 20 pN on the center of massof every gas molecule along the �z direction in a 10 ns ‘‘in-
2 (a,b) and POPE-CO2 (c,d) after 500 ps of equilibration. The two systemsis. CO2 molecules, initially placed in the bulk region, are drawn in vdW

Fig. 2. Partition of gas molecules into the membrane during the explicitgas diffusion simulations. (a) Number of gas molecules inside the POPEbilayer over time (POPE-CO2: black, POPE-O2: green). The lipid–waterinterface is defined as the average position of phosphorus atoms of thePOPE monolayers. (b) Lateral (solid lines) and traversal (dashed lines)diffusion coefficients of gas molecules (CO2: black, O2: green) in POPE.The percentage of free volume along the membrane normal in the POPEbilayer is shown in blue. Statistical errors of the diffusion coefficients aresmaller than 0.2 · 10�5 cm2/s at the lipid headgroup region, and smallerthan 0.1 · 10�5 cm2/s elsewhere. (c) Free energy profiles calculated usingexplicit gas diffusion simulations (exp) and implicit ligand sampling (imp).Statistical errors of the PMFs (exp) are smaller than 0.25 kcal/mol at thelipid headgroup region, and smaller than 0.18 kcal/mol elsewhere; thestatistical error for PMF (imp) is smaller than 0.25 kcal/mol at all points.In both (b) and (c), z = 0 is defined as the mid-point of the phosphorusplanes of the two POPE monolayers.
Y. Wang et al. / Journal of Structural Biology 157 (2007) 534–544 537
duced pressure’’ simulation (Table 1). Previous simulations(Zhu et al., 2002, 2004) had shown that such an externalforce can generate an effect equivalent to a concentrationgradient across the membrane, favoring the diffusion ofgas molecules in one direction. Using the force applied inour simulations, a pressure difference of �20 MPa was gen-erated across the membrane.
2.1.4. Free energy profile calculation
The free energy profile associated with gas permeationwas calculated from equilibrium simulations using the rela-tion (Marrink and Berendsen, 1994):
DGðzÞ ¼ �RT lnCðzÞCbulk
ð1Þ
where R is the gas constant, T is the temperature, Cbulk is theconcentration of gas molecules in bulk water, and C(z) is theconcentration of gas molecules in each 1 A thick layer paral-lel to the xy plane along the z-axis. For AQP1-CO2 andAQP1-O2, C(z) is the gas concentration inside the centralpore, except in the bulk water region (z P 29 A orz 6 �26 A), where gas concentration in the entire layerwas calculated and then normalized according to the areaof an AQP1 tetramer (50 nm2). This normalization ensuresthat our calculated PMF corresponds to a definite densityof AQP1 (1 AQP1 per 50 nm2 of bilayer). As a result, by com-paring the PMFs for AQP1 and POPE, we can directly deter-mine whether replacing a patch of lipids by AQP1 willincrease or decrease the transmembrane barrier to gaspermeation.
2.1.5. Diffusion coefficient calculation
The gas diffusion coefficient D was calculated from theslope of the mean square displacement against time usingthe relationship
hðrðt þ DtÞ � rðtÞÞ2i ¼ 2dDDt ð2Þwhere r is the coordinates of gas molecules, d is the dimen-sion, and Dt is an arbitrary time interval. As gas moleculesmay travel through regions with different diffusion coeffi-cients in the chosen time interval, we are limited to small val-ues for Dt (here Dt = 5 ps), so that D best represents the local
gas diffusion coefficient in the region it is calculated for(Marrink and Berendsen, 1994; Shinoda et al., 2004). Indetermining D from the slope of the mean square displace-ment against time, the first 2 ps was disregarded, in orderto ensure that the calculated diffusion coefficient is not con-taminated by the velocity correlation of gas molecules. Thetime origin t was shifted to make use of the entire trajectoryand improve statistics. A resolution of 2 A was used to com-pute gas diffusion coefficients in lipid bilayers.
Both the free energy profile and diffusion coefficientsmust be calculated after the system reaches equilibrium.The gas density of the lipid bilayer becomes a naturalindicator for the state of the system; since we put all100 gas molecules in bulk water at the beginning of sim-ulations, the system is approximately at equilibrium
when the net flux of gas molecules across the lipid–waterinterfaces is zero, and the number of gas molecules insidethe lipid bilayer remains constant. Using this indicator,both the POPE-CO2 and POPE-O2 simulations are inequilibrium during their last 5 ns of equilibration(Fig. 2a). For the AQP1-embedded membranes, weallowed for a longer equilibration time and discardedthe first 10 ns of the simulation. We then investigatedthe convergence of the PMFs calculated using theremaining data. The PMFs calculated using the last 20,15 and 10 ns of the simulations were rather similar forthe system AQP1-CO2 (data not shown). Therefore, wechose to use the last 20 ns for the analysis, in order tomaximize our sampling. As for AQP1-O2, we resortedto a better equilibrated system by using the last 10 nssimulation, except for the periplasmic part of the central

538 Y. Wang et al. / Journal of Structural Biology 157 (2007) 534–544
pore (16 A 6 z 6 29 A), where we used the last 16 ns dueto a limited sampling in this region.
2.2. Implicit ligand sampling
Implicit ligand sampling is a method to infer the 3DPMF of a weakly interacting ligand, based purely on anequilibrium simulation of the ligand-free system. Thismethod overcomes the problem of low sampling causedby the slow diffusion of explicit ligands exploring a proteinand has proven useful in finding gas migration pathways inproteins (Cohen et al., 2005, 2006). Multiple conformationsof an imaginary ligand molecule are placed at every pointof a grid, on top of an equilibrium trajectory of a simulatedprotein system. At each time step, and for each ligand posi-tion and orientation, the protein–ligand interactions arecomputed. These interaction energies are then used toreconstruct the PMF of placing the ligand at any pointinside the protein using a perturbative approach, asdescribed in detail in Cohen et al. (2006).
In order to compute the PMFs, equilibrium simulationsof pure POPE and membrane-embedded AQP1 in theabsence of gas molecules were performed for 1 and 5 ns,respectively. The simulation protocols are identical withthose used in explicit gas diffusion simulations, except thatthe temperature was set to 300 K, and the H-bond con-straint on Arg197 was not applied. For each of the two sys-tems, a 3D PMF map at 1 A resolution was computed,using the volmap feature of VMD (Humphrey et al.,1996) with a chargeless model for O2 (Table S1). For thelipid bilayer and bulk water regions, the projected PMFsalong the z-axis, F(z), were then calculated from the 3DPMF map, using the formula:
F ðzÞ ¼ �RT lnXLx ;Ly
x;y¼0
e�F ðx;y;zÞ=RT
LxLyð3Þ
where F(x,y,z) is the local 3D PMF computed by implicitligand sampling, and Lx and Ly are the dimensions of thePMF map in units of A. In the case of AQP1, the calcula-tion is the same as in Eq. (3), except that the summationswere performed over restricted cross-sectional areas, in or-der to isolate the targeted gas channels. The resulting PMFwas then shifted by �RT ln(LxLy/A0), where LxLy is thearea of the summation, and A0 is roughly the area occupiedby an AQP1 tetramer (A0 = 50 nm2). This is done so thatour absolute values of the PMF can be compared withthose from explicit gas diffusion simulations. To compareour PMFs with experiments or other simulations, onewould simply shift our barriers by the term �RT ln(A0/A1), where A1 is the cross-sectional area of the system beingused for comparison.
2.3. Error analysis
For the explicit gas diffusion simulations, the statisticalerrors in the calculation of a variable X were estimated
by dividing the trajectory into two sub-trajectories of thesame length. X was then calculated using each sub-trajecto-ry. We used the quantity stdðX Þ=
ffiffiffi2p
as a measure of thestatistical error on X in our calculation using the entire tra-jectory. For the implicit ligand sampling, the estimatederror depends on both the measured PMF and the numberof independent simulation snapshots used to compute it,and was calculated as described in Cohen et al. (2006).
2.4. MD simulation protocols
For all simulations, the program NAMD 2.6 (Phillipset al., 2005) and the CHARMM27 parameter set (Schlenk-rich et al., 1996; MacKerell et al., 1998) were used. Parame-ters for CO2 or O2 were taken from the literature (Harris andYung, 1995; Schlenkrich et al., 1996; MacKerell et al., 1998)and are listed in Supplemental material (Table S1). Assum-ing periodic boundary conditions, the Particle Mesh Ewald(PME) method (Darden et al., 1993) with a grid density ofat least 1/A3 was employed for computation of long-rangeelectrostatic forces. All simulations were performed withtime steps of 1, 2, and 4 fs for bonded, non-bonded andPME calculation, respectively. A Langevin piston (Felleret al., 1995) was employed to maintain the pressure at1 atm in constant pressure simulations. Langevin dynamicswas used to keep the temperature constant at 310 K (damp-ing coefficient 5 ps�1), except in the implicit ligand sampling,where the temperature was set to 300 K. During inducedpressure simulations, gas molecules were not coupled tothe temperature bath, and counter forces were applied toCa atoms of AQP1 and/or heavy atoms of the POPE bilayerto prevent net translocation of the system along the directionof external force. The total counter force on the membranewas equal to the total external force applied on gas mole-cules. In the AQP1-CO2 and AQP1-O2 systems, the counterforce was distributed between the protein and the lipidsaccording to the ratio of their areas in the membrane.
3. Results and discussion
3.1. Gas diffusion in POPE bilayer
Free energy profiles associated with gas permeationthrough POPE are shown in Fig. 2c. In general, the bilayerhas a rather ‘‘flat’’ free energy profile for both CO2 and O2,with the largest energy barrier being 1.4 kcal/mol and1.9 kcal/mol, respectively. Such a profile allows gas mole-cules to readily diffuse through the lipid bilayer, a behaviorobserved in our simulations and reflected in the number ofpermeation events during the equilibrium simulations; onthe average one permeation event per nanosecond wasobserved for both CO2 and O2 (Table 1). As shown inFig. 2c, the PMFs calculated using explicit gas diffusion sim-ulations and implicit ligand sampling are in very good agree-ment. An energy well of�1.0 kcal/mol for CO2 and�1.3 to�1.5 kcal/mol for O2 is located at the bilayer center, whilea small barrier of 0.1–0.4 kcal/mol for CO2 and 0.1–
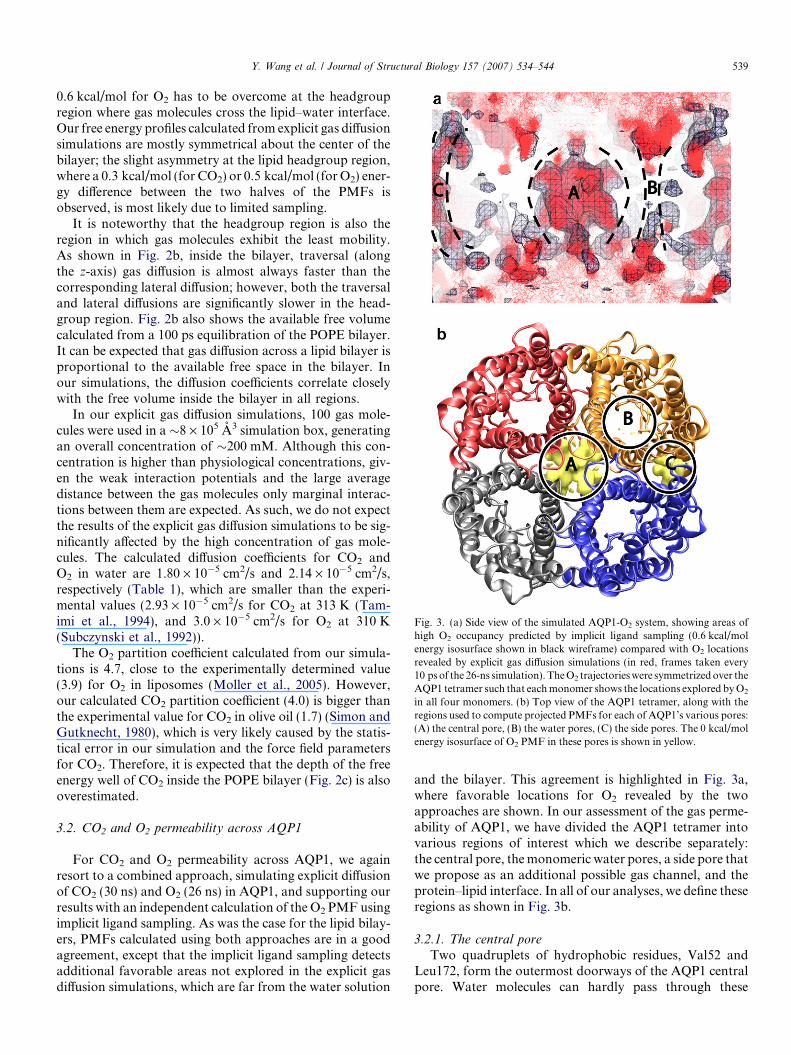
Fig. 3. (a) Side view of the simulated AQP1-O2 system, showing areas ofhigh O2 occupancy predicted by implicit ligand sampling (0.6 kcal/molenergy isosurface shown in black wireframe) compared with O2 locationsrevealed by explicit gas diffusion simulations (in red, frames taken every10 ps of the 26-ns simulation). The O2 trajectories were symmetrized over theAQP1 tetramer such that each monomer shows the locations explored by O2
in all four monomers. (b) Top view of the AQP1 tetramer, along with theregions used to compute projected PMFs for each of AQP1’s various pores:(A) the central pore, (B) the water pores, (C) the side pores. The 0 kcal/molenergy isosurface of O2 PMF in these pores is shown in yellow.
Y. Wang et al. / Journal of Structural Biology 157 (2007) 534–544 539
0.6 kcal/mol for O2 has to be overcome at the headgroupregion where gas molecules cross the lipid–water interface.Our free energy profiles calculated from explicit gas diffusionsimulations are mostly symmetrical about the center of thebilayer; the slight asymmetry at the lipid headgroup region,where a 0.3 kcal/mol (for CO2) or 0.5 kcal/mol (for O2) ener-gy difference between the two halves of the PMFs isobserved, is most likely due to limited sampling.
It is noteworthy that the headgroup region is also theregion in which gas molecules exhibit the least mobility.As shown in Fig. 2b, inside the bilayer, traversal (alongthe z-axis) gas diffusion is almost always faster than thecorresponding lateral diffusion; however, both the traversaland lateral diffusions are significantly slower in the head-group region. Fig. 2b also shows the available free volumecalculated from a 100 ps equilibration of the POPE bilayer.It can be expected that gas diffusion across a lipid bilayer isproportional to the available free space in the bilayer. Inour simulations, the diffusion coefficients correlate closelywith the free volume inside the bilayer in all regions.
In our explicit gas diffusion simulations, 100 gas mole-cules were used in a �8 · 105 A3 simulation box, generatingan overall concentration of �200 mM. Although this con-centration is higher than physiological concentrations, giv-en the weak interaction potentials and the large averagedistance between the gas molecules only marginal interac-tions between them are expected. As such, we do not expectthe results of the explicit gas diffusion simulations to be sig-nificantly affected by the high concentration of gas mole-cules. The calculated diffusion coefficients for CO2 andO2 in water are 1.80 · 10�5 cm2/s and 2.14 · 10�5 cm2/s,respectively (Table 1), which are smaller than the experi-mental values (2.93 · 10�5 cm2/s for CO2 at 313 K (Tam-imi et al., 1994), and 3.0 · 10�5 cm2/s for O2 at 310 K(Subczynski et al., 1992)).
The O2 partition coefficient calculated from our simula-tions is 4.7, close to the experimentally determined value(3.9) for O2 in liposomes (Moller et al., 2005). However,our calculated CO2 partition coefficient (4.0) is bigger thanthe experimental value for CO2 in olive oil (1.7) (Simon andGutknecht, 1980), which is very likely caused by the statis-tical error in our simulation and the force field parametersfor CO2. Therefore, it is expected that the depth of the freeenergy well of CO2 inside the POPE bilayer (Fig. 2c) is alsooverestimated.
3.2. CO2 and O2 permeability across AQP1
For CO2 and O2 permeability across AQP1, we againresort to a combined approach, simulating explicit diffusionof CO2 (30 ns) and O2 (26 ns) in AQP1, and supporting ourresults with an independent calculation of the O2 PMF usingimplicit ligand sampling. As was the case for the lipid bilay-ers, PMFs calculated using both approaches are in a goodagreement, except that the implicit ligand sampling detectsadditional favorable areas not explored in the explicit gasdiffusion simulations, which are far from the water solution
and the bilayer. This agreement is highlighted in Fig. 3a,where favorable locations for O2 revealed by the twoapproaches are shown. In our assessment of the gas perme-ability of AQP1, we have divided the AQP1 tetramer intovarious regions of interest which we describe separately:the central pore, the monomeric water pores, a side pore thatwe propose as an additional possible gas channel, and theprotein–lipid interface. In all of our analyses, we define theseregions as shown in Fig. 3b.
3.2.1. The central pore
Two quadruplets of hydrophobic residues, Val52 andLeu172, form the outermost doorways of the AQP1 centralpore. Water molecules can hardly pass through these

Fig. 5. (a) PMFs associated with gas permeation through the AQP1central pore, calculated from the explicit gas diffusion simulations (exp),and implicit ligand sampling (imp). The dotted lines correspond to thePMFs of gas molecules in water of the same area as the central pore. (b)O2 PMF calculated by implicit ligand sampling for regions shown in
540 Y. Wang et al. / Journal of Structural Biology 157 (2007) 534–544
residues and were kept away from the inside of the pore dur-ing our simulations, a behavior also revealed by other MDstudies (Zhu et al., 2001; Yu et al., 2006). For gas molecules,however, the purely hydrophobic, empty central pore pro-vides an ideal reservoir. At the end of the explicit gas diffu-sion simulations, 8 CO2 and 5 O2 molecules, respectively,were found inside the central pore, as seen in Fig. 4a and b.
As shown in Fig. 5a, PMFs calculated from both theexplicit gas diffusion simulations and the implicit ligandsampling suggest that the central pore is the most favorablelocation for both CO2 and O2. However, a more favorablecentral pore for O2 with a �1.7 kcal/mol energy well waspredicted by implicit ligand sampling, compared to a�0.4 kcal/mol energy well revealed by the explicit gas diffu-sion simulations. This difference is probably caused by thelimited timescale of our explicit gas diffusion simulations:while the gas distribution between the water and lipid phas-es is well equilibrated, the gas molecules need longer timeto reach an equilibrated population inside the protein. Thisis especially true given that the central pore is capped byareas of relatively high energy barriers, and that the flowof gas molecules across the central pore was low comparedto the gas population inside the central pore during thecourse of the explicit gas diffusion simulations.
According to our PMFs, the major barrier of the centralpore to gas permeation is about 3.6–4.6 kcal/mol, locatedat the periplasmic side of the central pore
Fig. 4. (a and b) Accumulation of gas molecules inside the central pore ofAQP1. At the end of the equilibrium simulations, eight CO2 (a) and fiveO2 (b) were found in the central pore, respectively. Only three AQP1monomers are shown, with the front monomer being removed for clarity.Residues Val52 and Leu172, which form the outermost doorways of thehydrophobic central pore, are highlighted in licorice representation. (c)Snapshot showing CO2 in one of the monomeric water pores duringequilibrium simulations. Water and CO2 molecules are shown in vdWrepresentation. Arg197 at the SF (see text) and Asn194 and Asn78 fromthe NPA motifs are shown in Licorice representation.
Fig. 3, along with the PMF in the POPE bilayer. The PMFs werecomputed relative to a value of 0 kcal/mol for O2 in vacuum. In both (a)and (b) z = 0 is defined as the center of Asn78 and Asn194 of the NPAmotifs. All PMFs were calculated assuming a density of 1 AQP1 per50 nm2 of bilayer, as described in Section 2. Statistical errors for CO2
PMF (exp) and O2 PMF (exp) are less than 0.4 kcal/mol except at theenergy barriers, where due to limited sampling, the statistical errors cannotbe calculated using the same formula mentioned in Section 2. The upperbound error of the PMF (imp) is +0.25 kcal/mol, the lower bound errorsare �0.25, �0.6, �1.7 kcal/mol, respectively, for PMF values below 4, 6,and 8 kcal/mol (Cohen et al., 2006).
(13 A 6 z 6 19 A). This barrier, consistently found by bothour approaches, as well as by another study (Hub and deGroot, 2006), surprisingly, does not correspond to a regionthat is sterically blocked directly by the protein. As shownin Fig. 6a, this barrier is located above the region of max-imum protein contraction where the four hydrophobic res-idues Val52 reside; rather, it corresponds to a region that ispopulated solely by water. We have created a volumetricmap of the local occupancy of water, as shown inFig. 6b. It is clear that the barrier corresponds to a denselayer of water molecules surrounded by four aspartate(Asp50) residues (Fig. 6c). With a higher density than thebulk water, this water layer reduces the chance of gas mol-ecules to access the central pore. If these aspartate residueswill be mutated to neutral residues, e.g., alanines or aspar-agines, the strong electrostatic effects of the quadrupletsmay be eliminated and a less dense water structure couldbe expected, which might result in a better gas-conductivecentral pore of AQP1. Simulations of these mutants arecurrently underway.
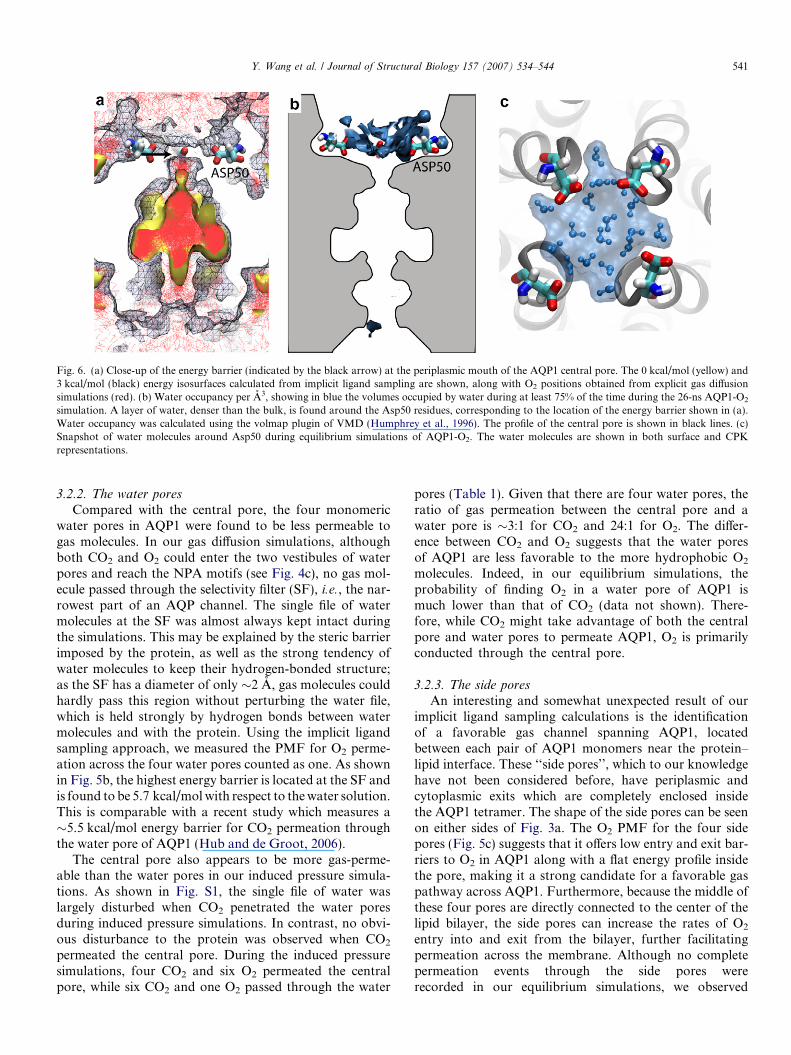
Fig. 6. (a) Close-up of the energy barrier (indicated by the black arrow) at the periplasmic mouth of the AQP1 central pore. The 0 kcal/mol (yellow) and3 kcal/mol (black) energy isosurfaces calculated from implicit ligand sampling are shown, along with O2 positions obtained from explicit gas diffusionsimulations (red). (b) Water occupancy per A3, showing in blue the volumes occupied by water during at least 75% of the time during the 26-ns AQP1-O2
simulation. A layer of water, denser than the bulk, is found around the Asp50 residues, corresponding to the location of the energy barrier shown in (a).Water occupancy was calculated using the volmap plugin of VMD (Humphrey et al., 1996). The profile of the central pore is shown in black lines. (c)Snapshot of water molecules around Asp50 during equilibrium simulations of AQP1-O2. The water molecules are shown in both surface and CPKrepresentations.
Y. Wang et al. / Journal of Structural Biology 157 (2007) 534–544 541
3.2.2. The water pores
Compared with the central pore, the four monomericwater pores in AQP1 were found to be less permeable togas molecules. In our gas diffusion simulations, althoughboth CO2 and O2 could enter the two vestibules of waterpores and reach the NPA motifs (see Fig. 4c), no gas mol-ecule passed through the selectivity filter (SF), i.e., the nar-rowest part of an AQP channel. The single file of watermolecules at the SF was almost always kept intact duringthe simulations. This may be explained by the steric barrierimposed by the protein, as well as the strong tendency ofwater molecules to keep their hydrogen-bonded structure;as the SF has a diameter of only �2 A, gas molecules couldhardly pass this region without perturbing the water file,which is held strongly by hydrogen bonds between watermolecules and with the protein. Using the implicit ligandsampling approach, we measured the PMF for O2 perme-ation across the four water pores counted as one. As shownin Fig. 5b, the highest energy barrier is located at the SF andis found to be 5.7 kcal/mol with respect to the water solution.This is comparable with a recent study which measures a�5.5 kcal/mol energy barrier for CO2 permeation throughthe water pore of AQP1 (Hub and de Groot, 2006).
The central pore also appears to be more gas-perme-able than the water pores in our induced pressure simula-tions. As shown in Fig. S1, the single file of water waslargely disturbed when CO2 penetrated the water poresduring induced pressure simulations. In contrast, no obvi-ous disturbance to the protein was observed when CO2
permeated the central pore. During the induced pressuresimulations, four CO2 and six O2 permeated the centralpore, while six CO2 and one O2 passed through the water
pores (Table 1). Given that there are four water pores, theratio of gas permeation between the central pore and awater pore is �3:1 for CO2 and 24:1 for O2. The differ-ence between CO2 and O2 suggests that the water poresof AQP1 are less favorable to the more hydrophobic O2
molecules. Indeed, in our equilibrium simulations, theprobability of finding O2 in a water pore of AQP1 ismuch lower than that of CO2 (data not shown). There-fore, while CO2 might take advantage of both the centralpore and water pores to permeate AQP1, O2 is primarilyconducted through the central pore.
3.2.3. The side pores
An interesting and somewhat unexpected result of ourimplicit ligand sampling calculations is the identificationof a favorable gas channel spanning AQP1, locatedbetween each pair of AQP1 monomers near the protein–lipid interface. These ‘‘side pores’’, which to our knowledgehave not been considered before, have periplasmic andcytoplasmic exits which are completely enclosed insidethe AQP1 tetramer. The shape of the side pores can be seenon either sides of Fig. 3a. The O2 PMF for the four sidepores (Fig. 5c) suggests that it offers low entry and exit bar-riers to O2 in AQP1 along with a flat energy profile insidethe pore, making it a strong candidate for a favorable gaspathway across AQP1. Furthermore, because the middle ofthese four pores are directly connected to the center of thelipid bilayer, the side pores can increase the rates of O2
entry into and exit from the bilayer, further facilitatingpermeation across the membrane. Although no completepermeation events through the side pores wererecorded in our equilibrium simulations, we observed

542 Y. Wang et al. / Journal of Structural Biology 157 (2007) 534–544
several half-permeation events where gas molecules enteredor exited the bilayer center via these side pores.
3.2.4. Protein–lipid interface
According to both explicit gas diffusion simulations andimplicit ligand sampling, the interfacial region between theAQP1 tetramer and the lipid bilayer has an increased affinityfor O2 as compared to the rest of the bilayer. Because ofAQP1’s uneven hydrophobic surface inside the bilayer, thepacking with the lipids is not optimal, leaving plenty of roomfor small hydrophobic molecules. However, our 3D PMFmap for O2 indicates that the gas density in this region islocalized in many disconnected pockets around the protein,and there is no single continuous pathway connecting thesides of the membrane. For this reason, while the protein–lipid interface may possibly store O2, it does not necessarilyconduct it well. As the lipids do not migrate or diffuse at thetimescales probed by either of our analyses, the PMFs weobserved may not be accurate and the possibility of gas per-meation at the protein–lipid interface cannot be completelydiscounted. However, we consider high-throughput O2
migration in this region to be unlikely on the basis of ourcomputations.
3.2.5. AQP1 compared with POPE
Our free energy profiles revealed a higher energy barrierfor gas permeation across AQP1 than a patch of POPEbilayer with the similar area. Besides the PMFs, one cancompare the gas permeabilities of AQP1 and POPE in arather straightforward way. As shown in Table 1, on aver-age one permeation per nanosecond is observed for POPE-CO2 and POPE-O2 during equilibrium simulations, whilefew permeation events were recorded for AQP1-CO2 andAQP1-O2. The number of gas permeation events naturallyreflects the gas permeability of the system. However, betterstatistics are required to meaningfully compare the AQP1-embedded membrane with the pure POPE bilayer. Thiswas achieved by induced pressure simulations, in whichgas molecules were forced to cross the membrane by anexternal force, and the number of gas permeation eventswas increased by approximately an order of magnitude,allowing us to compare the gas-permeability of the twotypes of membranes directly. As shown in Table 1, 203CO2 and 258 O2 permeation events were observed for purePOPE bilayers, while for the AQP1-embedded membranes,the number is 80 and 83, respectively. Since all the four sys-tems share a similar xy area, the insertion of AQP1 into thePOPE bilayer has clearly reduced the total gas permeabilityof the membrane.
4. Conclusions
We have studied the gas permeability of AQP1 by per-forming MD simulations on a membrane-embedded AQP1tetramer as well as on pure lipid bilayers. Two differentapproaches were used to calculate the free energy profilesassociated with gas permeation through AQP1 and yielded
consistent results. In general, AQP1 appears to be less gas-permeable than a patch of POPE bilayer with a similar area.However, the central pore of AQP1 is found to be permeableto both CO2 and O2 with a favorable energy well of �0.4 to�1.7 kcal/mol at the center and a 3.6–4.6 kcal/mol barrieron the periplasmic side. It is noteworthy that this barrier,revealed by both of our approaches, is not directly causedby the protein, but rather by a dense layer of water molecules‘‘anchored’’ at the periplasmic mouth of the central pore byfour aspartate residues.
Both the gas diffusion simulations and the implicitligand sampling method suggest that the monomeric waterpore of AQP1 is less gas-permeable than the central pore,likely due to the strong hydrogen bonds between the pro-tein and water molecules inside the channel. A somewhatunexpected discovery is the identification of ‘‘side pores’’located in between AQP1 monomers, which may facilitategas conduction across the membrane. However, due to thefluctuation of the protein, these side channels might not bepermanently open. It is therefore of interest and impor-tance to further investigate the role of these side pores ingas conduction mediated by AQPs.
Our simulations suggest that aside from its conventionalrole as a water channel, AQP1 might provide a pathway forsmall, neutral gas molecules across the cellular membrane.However, compared with a patch of pure POPE bilayerwith a similar area, AQP1 is less permeable to CO2 andO2. Therefore, gas conduction through AQP1 may be ofphysiological importance only in membranes with lowintrinsic gas permeability or where a major fraction ofthe surface area of the membrane is occupied by AQPs.
Acknowledgments
The work was supported by grants from NIH (P41-RR05969, R01-GM067887). The authors gladly acknowl-edge supercomputer time provided by NCSA and PSCthrough the Large Resource Allocation Committee(MCA93S028). All molecular images are made withVMD (Humphrey et al., 1996).
Appendix A. Supplementary data
Supplementary data associated with this article can befound, in the online version, at doi:10.1016/j.jsb.2006.11.008.
References
Agre, P., 2006. The aquaporin water channels. Proc. Am. Thorac. Soc. 3,5–13.
Agre, P., Kozono, D., 2003. Aquaporin water channels: molecularmechanisms for human diseases. FEBS Lett. 555, 72–78.
Agre, P., Bonhivers, M., Borgnia, M.J., 1998. The aquaporins, blueprintsfor cellular plumbing systems. J. Biol. Chem. 273, 14659–14662.
Agre, P., Nielsen, S., Ottersen, O.P., 2004. Towards a molecularunderstanding of water homeostasis in the brain. Neuroscience 129,849–850.
Y. Wang et al. / Journal of Structural Biology 157 (2007) 534–544 543
Blank, M., Ehmke, H., 2003. Aquaporin-1 and HCO�3 –Cl� transporter-mediated transport of CO2 across the human erythrocyte membrane. J.Physiol. 550, 419–429.
Borgnia, M.J., Agre, P., 2001. Reconstitution and functional comparisonof purified GlpF and AqpZ, the glycerol and water channels fromEscherichia coli. Proc. Natl. Acad. Sci. USA 98, 2888–2893.
Borgnia, M., Nielsen, S., Engel, A., Agre, P., 1999. Cellular and molecularbiology of the aquaporin water channels. Annu. Rev. Biochem. 68, 425–458.
Burykin, A., Warshel, A., 2003. What really prevents proton transportthrough aquaporin? Charge self-energy versus proton wire proposals.Biophys. J. 85, 3696–3706.
Burykin, A., Warshel, A., 2004. On the origin of the electrostaticbarrier for proton transport in aquaporin. FEBS Lett. 570,41–46.
Chakrabarti, N., Tajkhorshid, E., Roux, B., Pomes, R., 2004. Molecularbasis of proton blockage in aquaporins. Structure 12, 65–74.
Cohen, J., Kim, K., King, P., Seibert, M., Schulten, K., 2005. Finding gasdiffusion pathways in proteins: Application to O2 and H2 transport inCpI [FeFe]-hydrogenase and the role of packing defects. Structure 13,1321–1329.
Cohen, J., Arkhipov, A., Braun, R., Schulten, K., 2006. Imaging themigration pathways for O2, CO, NO, and Xe inside myoglobin.Biophys. J. 91, 1844–1857.
Cooper, G., Boron, W., 1998. Effect of PCMBS on CO2 permeability ofXenopus Oocytes expressing aquaporin 1 or its C189S mutant. Am. J.Physiol. 275, C1481–C1486.
Cooper, G., Zhou, Y., Bouyer, P., Grichtchenko, I., Boron, W.,2002. Transport of volatile solutes through AQP1. J. Physiol.542, 17–29.
Darden, T., York, D., Pedersen, L., 1993. Particle mesh Ewald. An Nlog(N)method for Ewald sums in large systems. J. Chem. Phys. 98, 10089–10092.
Deen, P.M.T., van Os, C.H., 1998. Epithelial aquaporins. Curr. Opin. CellBiol. 10, 435–442.
de Groot, B.L., Grubmuller, H., 2001. Water permeation across biologicalmembranes: Mechanism and dynamics of aquaporin-1 and GlpF.Science 294, 2353–2357.
de Groot, B.L., Grubmuller, H., 2005. The dynamics and energetics ofwater permeation and proton exclusion in aquaporins. Curr. Opin.Struct. Biol. 15, 1–8.
de Groot, B.L., Frigato, T., Helms, V., Grubmuller, H., 2003. Themechanism of proton exclusion in the aquaporin-1 water channel. J.Mol. Biol. 333, 279–293.
Endeward, V., Musa-Aziz, R., Cooper, G., Chen, L., Pelletier, M., Virkki,L., Supuran, C., King, L., Boron, W., Gros, G., 2006. Evidence thatAquaporin 1 is a major pathway for CO2 transport across the humanerythrocyte membrane. FASEB J. 20, 1971–1984.
Fang, X., Yang, B., Matthay, M., Verkman, A., 2002. Evidence againstaquaporin-1-dependent CO2 permeability in lung and kidney. J.Physiol. 542, 63–69.
Feller, S.E., Zhang, Y.H., Pastor, R.W., Brooks, B.R., 1995. Constantpressure molecular dynamics simulation – the Langevin pistonmethod. J. Chem. Phys. 103, 4613–4621.
Fujiyoshi, Y., Mitsuoka, K., de Groot, B.L., Philippsen, A., Grubmuller,H., Agre, P., Engel, A., 2002. Structure and function of waterchannels. Curr. Opin. Struct. Biol. 12, 509–515.
Grayson, P., Tajkhorshid, E., Schulten, K., 2003. Mechanisms ofselectivity in channels and enzymes studied with interactive moleculardynamics. Biophys. J. 85, 36–48.
Hanba, Y.T., Shibasaka, M., Hayashi, Y., Hayakawa, T., Kasamo, K.,Terashima, I., Katsuhara, M., 2004. Overexpression of the barleyaquaporin HvPIP2;1 increases internal CO2 conductance and CO2
assimilation in the leaves of transgenic rice plants. Plant Cell Physiol. 45,521–529.
Harris, J., Yung, K., 1995. Carbon dioxide’s liquid–vapor coexistencecurve and critical properties as predicted by a simple molecular model.J. Phys. Chem. 99, 12021–12024.
Heller, K.B., Lin, E.C., Wilson, T.H., 1980. Substrate specificity andtransport properties of the glycerol facilitator of Escherichia coli. J.Bacteriol. 144, 274–278.
Herrera, M., Hong, N.J., Garvin, J.L., 2006. Aquaporin-1 transports NOacross cell membranes. Hypertension 48, 157–164.
Heymann, J.B., Engel, A., 1999. Aquaporins: Phylogeny, structure, andphysiology of water channels. News Physio. Sci. 14, 187–193.
Hohmann, S., Nielsen, S., Agre, P., 2001. Aquaporins. Academic Press,San Diego.
Hub, J.S., de Groot, B.L., 2006. Does CO2 permeate through Aquaporin-1? Biophys. J. 91, 842–848.
Humphrey, W., Dalke, A., Schulten, K., 1996. VMD - Visual MolecularDynamics. J. Mol. Graphics 14, 33–38.
Ikeda, M., Beitz, E., Kozono, D., Guggino, W.B., Agre, P., Yasui, M.,2002. Characterization of aquaporin-6 as a nitrate channel inmammalian cells. Requirement of pore-lining residue threonine 63. J.Biol. Chem. 277, 39873–39879.
Ilan, B., Tajkhorshid, E., Schulten, K., Voth, G.A., 2004. The mechanismof proton exclusion in aquaporin channels. Proteins: Struct. Funct.Bioinf. 55, 223–228.
Jensen, M.Ø., Tajkhorshid, E., Schulten, K., 2001. The mechanism ofglycerol conduction in aquaglyceroporins. Structure 9, 1083–1093.
Jensen, M.Ø., Tajkhorshid, E., Schulten, K., 2003. Electrostatic tuning ofpermeation and selectivity in aquaporin water channels. Biophys. J. 85,2884–2899.
Jiang, J., Daniels, B., Fu, D., 2006. Crystal structure of aqpz tetramerreveals two distinct arg-189 conformations associated with waterpermeation through the narrowest constriction of the water-conduct-ing channel. J. Biol. Chem. 281, 454–460.
King, L., Agre, P., 2004. From structure to disease: The evolving tale ofaquaporin biology. Nat. Rev. Mol. Cell Biol. 5, 687–698.
Li, J., Verkman, A.S., 2001. Impaired hearing in mice lacking aquaporin-4water channels. J. Biol. Chem. 276, 31233–31237.
Liu, Z., Shen, J., Carbrey, J.M., Mukhopadhyay, R., Agre, P., Rosen,B.P., 2002. Arsenite transport by mammalian aquaglyceroporinsAQP7 and AQP9. Proc. Natl. Acad. Sci. USA 99, 6053–6058.
MacKerell Jr., A.D., Bashford, D., Bellott, M., et al., 1998. All-atomempirical potential for molecular modeling and dynamics studies ofproteins. J. Phys. Chem. B 102, 3586–3616.
Marrink, S., Berendsen, H., 1994. Simulation of water transport through alipid membrane. J. Phys. Chem. 98, 4155–4168.
Moller, M., Botti, H., Batthyany, C., Rubbo, H., Radi, R., Denicola, A.,2005. Direct measurement of nitric oxide and oxygen partitioning intoliposomes and low density lipoprotein. J. Biol. Chem. 280, 8850–8854.
Nakhoul, N., Davis, B., Romero, M., Boron, W., 1998. Effect ofexpressing the water channel aquaporin-1 on the CO2 permeabilityof Xenopus oocytes. Am. J. Physiol. 274, C543–C548.
Phillips, J.C., Braun, R., Wang, W., Gumbart, J., Tajkhorshid, E.,Villa, E., Chipot, C., Skeel, R.D., Kale, L., Schulten, K., 2005.Scalable molecular dynamics with NAMD. J. Comp. Chem. 26,1781–1802.
Pohl, P., Saparov, S.M., Borgnia, M.J., Agre, P., 2001. Highly selectivewater channel activity measured by voltage clamp: Analysis of planarlipid bilayers reconstituted with purified AqpZ. Proc. Natl. Acad. Sci.USA 98, 9624–9629.
Prasad, G.V.T., Coury, L.A., Finn, F., Zeidel, M.L., 1998. Reconstitutedaquaporin 1 water channels transport CO2 across membranes. J. Biol.Chem. 273, 33123–33126.
Preston, G.M., Carroll, T.P., Guggino, W.B., Agre, P., 1992. Appearanceof water channels in Xenopus oocytes expressing red cell CHIP28protein. Science 256, 385–387.
Saparov, S., Tsunoda, S., Pohl, P., 2005. Proton exclusion by anaquaglyceroprotein: a voltage clamp study. Biol. Cell 97, 545–550.
Schlenkrich, M., Brickmann, J., MacKerell Jr., A.D., Karplus, M., 1996.Empirical potential energy function for phospholipids: Criteria forparameter optimization and applications. In: Merz, K.M., Roux, B.(Eds.), Biological Membranes: A Molecular Perspective from Com-putation and Experiment. Birkhauser, Boston, pp. 31–81.

544 Y. Wang et al. / Journal of Structural Biology 157 (2007) 534–544
Shinoda, W., Mikami, M., Baba, T., Hato, M., 2004. Molecular dynamicsstudy on the effects of chain branching on the physical properties oflipid bilayers: 2. permeability. J. Phys. Chem. 108, 9346–9356.
Simon, S.A., Gutknecht, J., 1980. Solubility of carbon dioxide in lipidbilayer membranes and organic solvents. Biochim. Biophys. Acta 596,352–358.
Subczynski, W., Hopwood, L., Hyde, J., 1992. Is the mammalian cell plasmamembrane a barrier to oxygen transport? J. Gen. Physiol. 100, 69–87.
Tajkhorshid, E., Nollert, P., Jensen, M.Ø., Miercke, L.J.W., O’Connell, J.,Stroud, R.M., Schulten, K., 2002. Control of the selectivity of theaquaporin water channel family by global orientational tuning. Science296, 525–530.
Tajkhorshid, E., Aksimentiev, A., Balabin, I., Gao, M., Isralewitz, B.,Phillips, J.C., Zhu, K., Schulten, F., 2003. Large scale simulation ofprotein mechanics and function. In: Richards, F.M., Eisenberg, D.S.,Kuriyan, J. (Eds.), Advances in Protein Chemistry, vol. 66. ElsevierAcademic Press, New York, pp. 195–247.
Tajkhorshid, E., Cohen, J., Aksimentiev, A., Sotomayor, M., Schulten,K., 2005a. Towards understanding membrane channels. In: Martinac,B., Kubalski, A. (Eds.), Bacterial Ion Channels and Their EukaryoticHomologues. ASM Press, Washington, DC, pp. 153–190.
Tajkhorshid, E., Zhu, F., Schulten, K., 2005b. Kinetic theory andsimulation of single-channel water transport. In: Yip, S. (Ed.),Handbook of Materials Modeling, Methods and Models, vol. I.Springer, Netherlands, pp. 1797–1822.
Tamimi, A., Rinker, E.B., Sandall, O.C., 1994. Diffusion coefficients forhydrogen sulfide, carbon dioxide, and nitrous oxide in water over thetemperature range 293–368 K. J. Chem. Eng. Data 39, 330–332.
Terashima, I., Ono, K., 2002. Effects of HgCl2 on CO2 dependence ofleaf photosynthesis: Evidence indicating involvement of aquaporins
in CO2 diffusion across the plasma membrane. Plant Cell Physiol.43, 70–78.
Tornroth-Horsefield, S., Wang, Y., Hedfalk, K., Johanson, U., Karlsson,M., Tajkhorshid, E., Neutze, R., Kjellbom, P., 2006. Structuralmechanism of plant aquaporin gating. Nature 439, 688–694.
Uehlein, N., Lovisolo, C., Siefritz, F., Kaldenhoff, R., 2003. The tobaccoaquaporin NtAQP1 is a membrane CO2 pore with physiologicalfunctions. Nature 425, 734–737.
Verkman, A., 2002. Does aquaporin-1 pass gas? An opposing view. J.Physiol. 542, 31.
Wang, Y., Schulten, K., Tajkhorshid, E., 2005. What makes an aquaporina glycerol channel: A comparative study of AqpZ and GlpF. Structure13, 1107–1118.
Yang, B., Fukuda, N., van Hoek, A., Matthay, M.A., Ma, T., Verkman,A.S., 2000. Carbon dioxide permeability of aquaporin-1 measured inerythrocytes and lung of aquaporin-1 null mice and in reconstitutedproteoliposomes. J. Biol. Chem. 275, 2682–2692.
Yool, A.J., Weinstein, A.M., 2002. New roles for old holes: Ion channelfunction in aquaporin-1. News Physio. Sci. 17, 68–72.
Yu, J., Yool, A.J., Schulten, K., Tajkhorshid, E., 2006. Mechanism ofgating and ion conductivity of a possible tetrameric pore in Aquapo-rin-1. Structure 14, 1411–1423.
Zhu, F., Tajkhorshid, E., Schulten, K., 2001. Molecular dynamicsstudy of aquaporin-1 water channel in a lipid bilayer. FEBS Lett.504, 212–218.
Zhu, F., Tajkhorshid, E., Schulten, K., 2002. Pressure-induced watertransport in membrane channels studied by molecular dynamics.Biophys. J. 83, 154–160.
Zhu, F., Tajkhorshid, E., Schulten, K., 2004. Theory and simulation ofwater permeation in aquaporin-1. Biophys. J. 86, 50–57.
Copyright © 2022 FDOKUMEN