Exploring alternate specifications to explain agency-level effects in placement decisions regarding...
16
Please cite this article in press as: Chabot, M., et al. Exploring alternate specifications to explain agency-level effects in placement decisions regarding aboriginal children: Further analysis of the Canadian Incidence Study of Reported Child Abuse and Neglect Part B. Child Abuse & Neglect (2012), http://dx.doi.org/10.1016/j.chiabu.2012.10.002 ARTICLE IN PRESS G Model CHIABU-2489; No. of Pages 16 Child Abuse & Neglect xxx (2012) xxx–xxx Contents lists available at SciVerse ScienceDirect Child Abuse & Neglect Exploring alternate specifications to explain agency-level effects in placement decisions regarding aboriginal children: Further analysis of the Canadian Incidence Study of Reported Child Abuse and Neglect Part B Martin Chabot a,∗ , Barbara Fallon b , Lil Tonmyr c , Bruce MacLaurin d , John Fluke e , Cindy Blackstock f,g a Centre for Research on Children and Families, McGill University, Suite 106, Wilson Hall, 3506 University Street, Montreal, Quebec, Canada H3A 2A7 b Factor-Inwentash Faculty of Social Work, University of Toronto, 246 Bloor Street West, Toronto, Ontario, Canada M5S 1V4 c Public Health Agency of Canada, 200 Eglantine Driveway, A.L. 1910D, Ottawa, Ontario, Canada K1A 0K9 d Faculty of Social Work, University of Calgary, 2500 University Dr. NW, Calgary, Alberta, Canada T2N 1N4 e Child Protective Services Research Center, American Humane Association, and Kempe Center for the Prevention and Treatment of Child Abuse and Neglect, University of Colorado, 13123 East 16th Avenue, B390 Aurora, CO 80045, USA f First Nations Child and Family Caring Society of Canada, Suite 302, 251 Bank Street, Ottawa, Ontario, Canada K2P 1X3 g Faculty of Extension, University of Alberta, 10230 Jasper Ave, Edmonton, Alberta, Canada T5J 4P6 a r t i c l e i n f o Article history: Received 30 May 2012 Received in revised form 16 October 2012 Accepted 18 October 2012 Available online xxx Keywords: Child welfare Child protection Child maltreatment Placement in out-of-home care Aboriginal Disproportionality Over-representation a b s t r a c t Objective: This paper builds upon the analyses presented in two companion papers (Fluke et al., 2010; Fallon et al., in this issue) using data from the 1998 and 2003 cycles of the Canadian Incidence Study of Reported Child Abuse and Neglect (CIS-1998 and CIS-2003) to examine the influence of clinical and organizational characteristics on the decision to place a child in out-of-home care at the conclusion of a child maltreatment investigation. This paper explores various model specifications to explain the effect of an agency-level factor, proportion of Aboriginal reports, which emerged as a stable and significant factor through the two data collection cycles. It addresses the issue of data comparability between the two cycles and explores various re-specifications and descriptive analyses of reported models to evaluate their solidity with regards to the sampling schemes and the precise contribution of a multi-level specification. Methods: The decision to place a child in out-of-home care was examined using data from the CIS-2003. This child welfare dataset collected information about the results of nearly 12,000 child maltreatment investigations as well as a description of the characteristics of the workers and organization responsible for conducting those investigations. Multi- level statistical models were developed using MPlus software, which can accommodate dichotomous outcome variables and are more reflective of decision-making in child welfare. The models are thus multi-level binary logistic regressions. Results: Final models revealed that two agency-level variables, ‘Education degree of major- ity of workers’ and ‘Degree of centralization in the agency’ clarify the nature of the effect of ‘Proportion of Aboriginal reports’, a stable, key second level predictor of the placement deci- sion. The comparability of the effect of this agency-level variable across the 1998 and 2003 cycles becomes further evident through this analysis. By using a unified database including both cycles and various specifications of models, the comparability was found to be robust, in addition to clarifying the precise contribution of a multi-level specification. Funding source: SSHRC Partnership Grant (# 895-2011-1015). ∗ Corresponding author. 0145-2134/$ – see front matter © 2012 Elsevier Ltd. All rights reserved. http://dx.doi.org/10.1016/j.chiabu.2012.10.002
Transcript of Exploring alternate specifications to explain agency-level effects in placement decisions regarding...

G ModelC
EpoN
MJa
b
c
d
e
Uf
g
a
ARRAA
KCCCPADO
0h
ARTICLE IN PRESSHIABU-2489; No. of Pages 16
Child Abuse & Neglect xxx (2012) xxx– xxx
Contents lists available at SciVerse ScienceDirect
Child Abuse & Neglect
xploring alternate specifications to explain agency-level effects inlacement decisions regarding aboriginal children: Further analysisf the Canadian Incidence Study of Reported Child Abuse andeglect Part B�
artin Chabota,∗, Barbara Fallonb, Lil Tonmyrc, Bruce MacLaurind,ohn Flukee, Cindy Blackstockf,g
Centre for Research on Children and Families, McGill University, Suite 106, Wilson Hall, 3506 University Street, Montreal, Quebec, Canada H3A 2A7Factor-Inwentash Faculty of Social Work, University of Toronto, 246 Bloor Street West, Toronto, Ontario, Canada M5S 1V4Public Health Agency of Canada, 200 Eglantine Driveway, A.L. 1910D, Ottawa, Ontario, Canada K1A 0K9Faculty of Social Work, University of Calgary, 2500 University Dr. NW, Calgary, Alberta, Canada T2N 1N4Child Protective Services Research Center, American Humane Association, and Kempe Center for the Prevention and Treatment of Child Abuse and Neglect,niversity of Colorado, 13123 East 16th Avenue, B390 Aurora, CO 80045, USAFirst Nations Child and Family Caring Society of Canada, Suite 302, 251 Bank Street, Ottawa, Ontario, Canada K2P 1X3Faculty of Extension, University of Alberta, 10230 Jasper Ave, Edmonton, Alberta, Canada T5J 4P6
r t i c l e i n f o
rticle history:eceived 30 May 2012eceived in revised form 16 October 2012ccepted 18 October 2012vailable online xxx
eywords:hild welfarehild protectionhild maltreatmentlacement in out-of-home careboriginalisproportionalityver-representation
a b s t r a c t
Objective: This paper builds upon the analyses presented in two companion papers (Flukeet al., 2010; Fallon et al., in this issue) using data from the 1998 and 2003 cycles of theCanadian Incidence Study of Reported Child Abuse and Neglect (CIS-1998 and CIS-2003) toexamine the influence of clinical and organizational characteristics on the decision to placea child in out-of-home care at the conclusion of a child maltreatment investigation. Thispaper explores various model specifications to explain the effect of an agency-level factor,proportion of Aboriginal reports, which emerged as a stable and significant factor throughthe two data collection cycles. It addresses the issue of data comparability between the twocycles and explores various re-specifications and descriptive analyses of reported modelsto evaluate their solidity with regards to the sampling schemes and the precise contributionof a multi-level specification.Methods: The decision to place a child in out-of-home care was examined using data fromthe CIS-2003. This child welfare dataset collected information about the results of nearly12,000 child maltreatment investigations as well as a description of the characteristicsof the workers and organization responsible for conducting those investigations. Multi-level statistical models were developed using MPlus software, which can accommodatedichotomous outcome variables and are more reflective of decision-making in child welfare.
Please cite this article in press as: Chabot, M., et al. Exploring alternate specifications to explain agency-level effects inplacement decisions regarding aboriginal children: Further analysis of the Canadian Incidence Study of Reported ChildAbuse and Neglect Part B. Child Abuse & Neglect (2012), http://dx.doi.org/10.1016/j.chiabu.2012.10.002
The models are thus multi-level binary logistic regressions.Results: Final models revealed that two agency-level variables, ‘Education degree of major-ity of workers’ and ‘Degree of centralization in the agency’ clarify the nature of the effect of‘Proportion of Aboriginal reports’, a stable, key second level predictor of the placement deci-sion. The comparability of the effect of this agency-level variable across the 1998 and 2003cycles becomes further evident through this analysis. By using a unified database includingboth cycles and various specifications of models, the comparability was found to be robust,in addition to clarifying the precise contribution of a multi-level specification.
� Funding source: SSHRC Partnership Grant (# 895-2011-1015).∗ Corresponding author.
145-2134/$ – see front matter © 2012 Elsevier Ltd. All rights reserved.ttp://dx.doi.org/10.1016/j.chiabu.2012.10.002

G Model
ARTICLE IN PRESSCHIABU-2489; No. of Pages 162 M. Chabot et al. / Child Abuse & Neglect xxx (2012) xxx– xxx
Conclusions: This third paper in a series establishes the ‘Proportion of Aboriginal reports’received by the child welfare agency as an important agency level predictor associatedwith a child’s likelihood of being placed in the Canadian child protection system. Whilethe more complex models give support to the notion that unequal resources subtend thoseresults, more analyses are needed to confirm this hypothesis. Unequal resources for agen-cies with larger Aboriginal caseloads may explain the persistence of the results. Thesefindings suggest that specific resource constraints related to worker education may beexplanatory.
© 2012 Elsevier Ltd. All rights reserved.
Introduction
This paper expands on two previous studies that examined the contribution of organizational factors to short-termservice dispositions using data from the 2003 cycle of the Canadian Incidence Study of Reported Child Abuse and Neglect(CIS-2003) (Fallon et al., in this issue), and the 1998 cycle (CIS-1998) (Fluke, Chabot, Fallon, MacLaurin, & Blackstock, 2010).Both analyses found that the single agency level factor contributing to the likelihood of a child being placed in out-of-homecare was the proportion of reports to the agency coming from Aboriginal children. The higher the proportion of Aboriginalchildren investigated by the agency, the more likely a child was to be placed in out-of-home care. Unlike the 1998 analyses,the 2003 study found that the Aboriginal status of the child remained statistically significant in the first level variables,even when controlling for the clinical concerns of the investigation. In this study, we explored the CIS-2003 data further byusing information from the Organizational Questionnaire completed for the 57 sampled agencies in 2003 which containeda larger set of measured contextual factors. The purpose of this analysis was to better explain the nature of the effect ofthe proportion of Aboriginal reports on placement decisions in the presence of other contextual organizational variablesavailable in the CIS-2003.
The previous two papers focused on finding the best model to highlight the crucial role of organizational factors in thedecision to place a child in the 1998 and 2003 cycles of the CIS, with the proportion of Aboriginal reports received by a childwelfare agency appearing as a consistently strong, contextual, predictor. The present paper addresses four related sets ofissues concerning the model specifications obtained through statistical testing. First, taking the final model presented inFallon et al. (in this issue), it explores various re-specifications in order to explain the functional link between the proportionof Aboriginal reports as a contextual variable and formal placement. Secondly, the issue of over-specification of models inthe present context of a stratified sampling scheme is addressed. A third objective of this study is to review the comparabilityof the two cycles which in turn is used to illustrate the specific contribution of a multi-level specification. Finally, certainimportant aspects of the models are highlighted and explored using descriptive means in order to further explore therelationship between clinical level variables and agency level variables.
Literature review
Over-representation of Aboriginal children in Canadian child welfare
The chronic over-representation of Aboriginal children in Canada has been well documented (Royal Commission onAboriginal Peoples, 1996; Trocmé, Knoke, & Blackstock, 2004), and yet research on the factors contributing to the over-representation has been limited. The most reliable source of data on Aboriginal children in Canada comes from the CanadianIncidence Study of Reported Child Abuse and Neglect (CIS) (Public Health Agency of Canada (PHAC), 2010; Trocmé et al., 2001,2005). This cross-sectional study, conducted in five year cycles, collects data on child welfare reports to the point of casedisposition. In 2003, 17% of substantiated Aboriginal children were placed in formal child welfare care following investigationcompared to six percent of non-Aboriginal children. In addition, 11% of Aboriginal children were placed in informal kinshipcare while four percent of non-Aboriginal children were placed informally (Trocmé et al., 2005). In 2003, the rate of formalchild welfare placement for Aboriginal children varied by provincial and territorial jurisdiction ranging from nine percentin Ontario (Fallon et al., 2005) to 23% in Alberta (MacLaurin et al., 2005) and the Northwest Territories (MacLaurin, Trocmé,& Fallon, 2006). Based on national census data for 2008, while six percent of children in Canada were Aboriginal, Aboriginalchildren made up 22% of substantiated reports of child maltreatment in Canada (Trocmé et al., 2010). In 2008, for every1,000 First Nations children living in the geographic areas served by sampled agencies, there were 140.6 child maltreatmentrelated investigations in 2008; for every 1,000 non-Aboriginal children living in the geographic areas served by sampledagencies, there were 33.5 investigations in 2008 (Sinha, Trocmé, Fallon, MacLaurin, Fast, & Prokop, 2011).
Please cite this article in press as: Chabot, M., et al. Exploring alternate specifications to explain agency-level effects inplacement decisions regarding aboriginal children: Further analysis of the Canadian Incidence Study of Reported ChildAbuse and Neglect Part B. Child Abuse & Neglect (2012), http://dx.doi.org/10.1016/j.chiabu.2012.10.002
Previous research from the CIS suggests that case characteristics such as child maltreatment type, child functioning andharm levels do not account for the significant over-representation of Aboriginal children in care (Trocmé et al., 2004). Casefactors that have been demonstrated to be strongly related to all decision points in the over-representation of Aboriginalchildren in the child welfare system are Aboriginal status, poverty, poor housing and substance misuse (Trocmé et al., 2004,

G Model
C
2(oarta
R
ecsdMa2aaOaF
acaiJ
I
icri
a22(t(bevpiochr
dsp(sw2
ARTICLE IN PRESSHIABU-2489; No. of Pages 16
M. Chabot et al. / Child Abuse & Neglect xxx (2012) xxx– xxx 3
005). These factors, when coupled with inequitable resources for First Nations children resident on reserves Blackstock2011) have resulted in the over-representation of Aboriginal children in the Canadian child welfare system (Auditor Generalf Canada, 2008; Loxley et al., 2005; Standing Committee on Public Accounts, 2009). There are over 100 First Nations childnd family service agencies in Canada providing a range of child welfare services on reserves and some provide services offeserve as well. For on reserve service delivery, the agencies are required by the Federal Government to operate accordingo provincial/territorial child welfare laws and are funded by the federal government. For off reserve service delivery thegencies follow provincial/territorial child welfare laws and receive their funding from the provinces/territories as well.
acial over-representation in United States child welfare
Data from American Indian and Alaskan Natives child welfare programs operated by tribal agencies is not collected byither the National Child Abuse and Neglect Data System or Adoption and Foster Care Analysis and Reporting System dataollection programs, so information regarding disparities among American Indian and Alaskan Natives is limited to thoseerved by state and county agencies. There is emerging evidence that American Indian and Alaskan Native in the US areisproportionately represented among child welfare reports, investigations, and out-of-home placements (Carter, 2010;agruder & Shaw, 2008; Olesnavage, Preston, Sorrells, & Tadgerson, 2010; Richardson, 2008; Texas Department of Family
nd Protective Services, 2010). Carter (2010) identifies the proportion of urban Native-American children in foster care at%, despite representing only 1% of the population. They are also more likely to be identified for caregiver risk factors suchs mental health issues and substance abuse. Even when non-Aboriginal caregivers are found to have greater substancebuse issues than their Native-American counterparts, Native-American children are still more likely to be taken into care.lesnavage et al. (2010) pinpointed failures in the American Child Welfare system to identify Native-American childrennd families early enough in the child protection process and an overall lack of culturally appropriate service provision.urthermore, they noted insufficient efforts to connect with Aboriginal leaders and promote reunification with families.
Regional data presented by the Texas Health and Human Services Commission (2006) demonstrate that American Indiannd Alaskan Native American children are more likely to be removed from their homes than Anglo children and Hispanichildren (Texas Health and Human Services Commission, 2006; Texas Department of Family and Protective Services, 2010)nd less likely to be reunited with their families (Wells, Merritt, & Briggs, 2009). Data analysis has shown a significantnteraction between poverty and neglect as contributing factors to Child Protective Services involvement (Drake, Lee, &onson-Reid, 2009; Texas Health and Human Services Commission, 2006).
mpact of organizational and worker factors on child welfare decisions
It has been suggested that workers’ personal attitudes may partially explain the variation in child welfare decision-makingn meeting the best interests of the child. Arad-Davidzon and Benbenishty (2008) found that child protection workers could beharacterized as either “pro-removal” or “anti-removal”. Pro-removal attitudes were associated with assessments of higherisk and more intrusive interventions while anti-removal attitudes were associated with decisions to use family-basednterventions (Arad-Davidzon & Benbenishty, 2008).
A number of studies have examined service outcomes experienced by clients and the presumed influence of worker char-cteristics, including ethnicity and education (Ryan, Garnier, Zyphur, & Zhai, 2006), ethnicity and gender (Woldeguiorguis,003), ethnicity and political ideology (Jayaratne, Faller, Ortega, & Vandervort, 2008), and ethnicity and worker age (Surbeck,003). In one of the few multivariate analyses examining client outcomes that included worker characteristics, Ryan et al.2006) found that when controlling for the clinical concerns of the case, White workers with a MSW degree were more likelyo achieve family reunification for Hispanic children than African American caseworkers (Ryan et al., 2006). Jayaratne et al.2008) found African American caseworkers more likely than White workers to believe that race should be considered inoth general and placement decisions and agreed more often with placing children in single-parent families. Smith (2006)xamined factors influencing permanency decisions made by child welfare workers and reported that a higher proportion ofisible minority respondents recommended reunification in a case of an African American caregiver with three children whoresented with mental health problems, compared to non-minority respondents. Focus group research with professionals
nvolved in the child welfare process found that workers did not clearly recognize the impact of culture and race on theirwn process of assessing risk or family assessment when examining the over-representation of African and Native Americanhildren involved with child welfare (Harris & Hacket, 2008). Other studies however report that race and racial bias do notave a clear influence upon child welfare decision-making at intake (Howell, 2008); Drake et al. (2011) concluded that higherisk rather than bias was the major factor driving racial disproportionality in the United States.
There is no consensus on whether the type of education and professional orientation has a strong influence upon workerecisions. Studies have reported some differences in decision-making related to professional orientation and placement deci-ions (Britner & Mossler, 2002), professional orientation and definitions of child maltreatment (Shdaimah, 2009), professionalositions and level of risk (Schuerman, Rossi, & Budde, 1999), educational degree and definitions of sibling maltreatment
Please cite this article in press as: Chabot, M., et al. Exploring alternate specifications to explain agency-level effects inplacement decisions regarding aboriginal children: Further analysis of the Canadian Incidence Study of Reported ChildAbuse and Neglect Part B. Child Abuse & Neglect (2012), http://dx.doi.org/10.1016/j.chiabu.2012.10.002
Kominkiewicz, 2004), and worker education and family reunification (Smith, 2006). Other research suggests that profes-ional status did not have a direct impact upon the placement decision (Benbenishty, Segev, & Surkis, 2002), and that thereas great similarity in decisions made by respondents with a social work degree or other educational backgrounds (Howell,
008).

G Model
ARTICLE IN PRESSCHIABU-2489; No. of Pages 164 M. Chabot et al. / Child Abuse & Neglect xxx (2012) xxx– xxx
In addition to educational experience, professional experience may influence the decision-making process. Novice work-ers’ previous experience in a child welfare setting has been found to moderate anxiety about agency protocols and processeshowever anxiety was not clearly connected to decision making (Csiernik, Smith, Dewar, Dromgole, & O’Neill, 2010). A studyof novice and expert child protection workers, reported that the level of professional experience influenced risk assess-ments (Drury-Hudson, 1999), however consensus has not been reached on this point (Howell, 2008; Smith, 2006; Sullivan,Whitehead, Leschied, Chiodo, & Hurley, 2008). Worker age, as well as experience, may influence decision-making withyounger workers making more interventionist decisions (Lazar, 2006; Rossi, Schuerman, & Budde, 1999).
Select studies have examined the influence of organizational factors on child protection decisions. In a cross-sectionalstudy, Ashton (2007) examined the impact of organizational factors on the reporting decisions of child protection socialworkers. Agency variables found to influence reporting included the presence of an expressed mandate to report, workerinvolvement in decision-making, and the combination of an expressed mandate and negative sanctions for failing to report,however agency size did not influence reporting. Hollingsworth, Bybee, Johnson, and Swick (2010) reported that caseworkersin private and public agencies differed on their perception of parental risk factors (mental illness and substance abuse),however, other work has found that workers from four service types took very similar approaches to assessment andintervention (Darlington, Healy, & Feeney, 2010).
Alternatively, the variation in child welfare decisions has also been attributed to the jurisdiction in which the investigationoccurs as opposed to worker differences within a jurisdiction. Studies by Rossi et al. (1999) and Schuerman et al. (1999)examined decision-making among groups of child protection experts and workers, and reported differences in decisions forrespondents in the states of Michigan, New York, and Texas. Decision-making also varied in a sample of child welfare workersfrom three European countries (Denmark, Iceland and Norway), as workers’ decisions were seen to reflect national childwelfare perspectives and priorities (Grinde, 2007). There is some evidence in the literature that suggests that interventionstandards vary by neighborhood or jurisdiction (Giovannoni & Becerra, 1979; Johnson & L’Esperance, 1984; Wolock, 1982).Social workers rating a vignette were significantly more likely to make a decision to refer a case for ongoing services withlimited information in high and low risk areas, than in medium risk areas (Craft & Bettin, 1991). Agencies located in high-riskareas were less likely to open an investigation with the same clinical issues than agencies in lower risk areas (Giovannoni &Becerra, 1979).
Few studies are able to empirically account for organizational factors even when examining service decisions (Grasso& Epstein, 1988; Hoagwood, 1997; Yoo, 2002). Organizations serve diverse populations, but studies examining differencesin worker and organizational characteristics have not controlled for differences in the population served. Relevant clinicalfactors are not consistently taken into consideration. Dissimilarities in clinical factors may explain divergent case dispositionsfor different groups. The decision to provide ongoing services after a child maltreatment investigation has serious resourceimplications. In a fiscally constrained child welfare service environment, decisions regarding the targeting and deploymentof scarce resources needs to be better understood particularly with respect to over-represented groups such as Indigenouschildren (Blackstock, 2009). This article is an attempt to illuminate this question in a principled way.
Methods
The CIS-2003’s primary objective was to produce a national estimate of the incidence of child maltreatment in Canada in2003. Using a multi-stage sampling design, a representative sample of 57 child welfare agencies, including 8 First Nationschild and family service agencies, was selected from 400 child welfare service areas in Canada. A stratified cluster samplingdesign was used first to select a representative sample of child welfare offices and then to sample cases within theseoffices. Quebec investigations did not provide enough information to be included in this analysis. Cases opened for serviceat the randomly selected sites between October 1st and December 31st 2008 were eligible for inclusion. Three months wasconsidered to be the optimum period to maintain participation and compliance with study procedures. Only children in thehousehold for whom maltreatment was alleged or suspected during the investigation were included in the final sample.
Data collection instruments
The information was collected using a three-page data collection instrument. Data collected included: Aboriginal heritageof the child and caregiver (s), type of abuse and neglect investigated; level of substantiation and duration of maltreatment;physical and emotional harm to the child; functioning concerns for the children and their caregivers; income source; housinginformation, and information about short-term service dispositions.
The CIS-2003 study collected information about the participating child welfare workers. Workers were asked their age,caseload size, educational degree, and years of experience in social services and child protection. They were also askedto identify any additional training they had received in the course of their child protection experience. Fifty-seven sites
Please cite this article in press as: Chabot, M., et al. Exploring alternate specifications to explain agency-level effects inplacement decisions regarding aboriginal children: Further analysis of the Canadian Incidence Study of Reported ChildAbuse and Neglect Part B. Child Abuse & Neglect (2012), http://dx.doi.org/10.1016/j.chiabu.2012.10.002
completed an Organizational Questionnaire that included questions about the structure of the organization, organizationalmorale, staffing vacancies, and whether the organization had recently experienced a child fatality or had conducted a high-profile case; this questionnaire is used to derive contextual variables to enrich the final model presented in Fallon et al. (inthis issue).
G Model
C
S
ItF(wbFvo
M
O
gpc
L
tsrvo
tt
TV
ARTICLE IN PRESSHIABU-2489; No. of Pages 16
M. Chabot et al. / Child Abuse & Neglect xxx (2012) xxx– xxx 5
tudy sample
Only those child maltreatment investigations from the CIS-2003 sample where the worker had completed a Workernformation Form were selected. Nine-hundred and thirty-six investigating workers yielded a sample of 11, 562 child mal-reatment investigations in 57 child welfare agencies. Eighty-seven percent of workers completed a Worker Informationorm (n = 819). The sub-sample for this study was made up of investigations that remained open for ongoing servicesn = 2,059 investigations, 57 agencies), in order to examine predictors of placement in out-of-home care. Investigationsith the exposure to domestic violence as the primary concern for the investigation were excluded from this analysis
ecause service dispositions for these investigations differed significantly from other maltreatment types (Black, Trocmé,allon, & MacLaurin, 2008). For example, children involved in substantiated investigations that involve exposure to domesticiolence with another form of substantiated maltreatment are almost four times more likely than investigations involvingnly exposure to domestic violence to be placed in a child welfare setting.
easures
utcome variable: formal placement versus no formal placement
Workers were asked to indicate the category that best described the placement decision for the investigation. The cate-ories included: no placement required; placement is being considered; informal placement; foster placement; group homelacement; and residential/secure treatment center. The decision to place a child was coded as a dichotomous variable, withategories foster placement, group home placement, and residential/secure treatment center coded as one.
evel one and level two variables
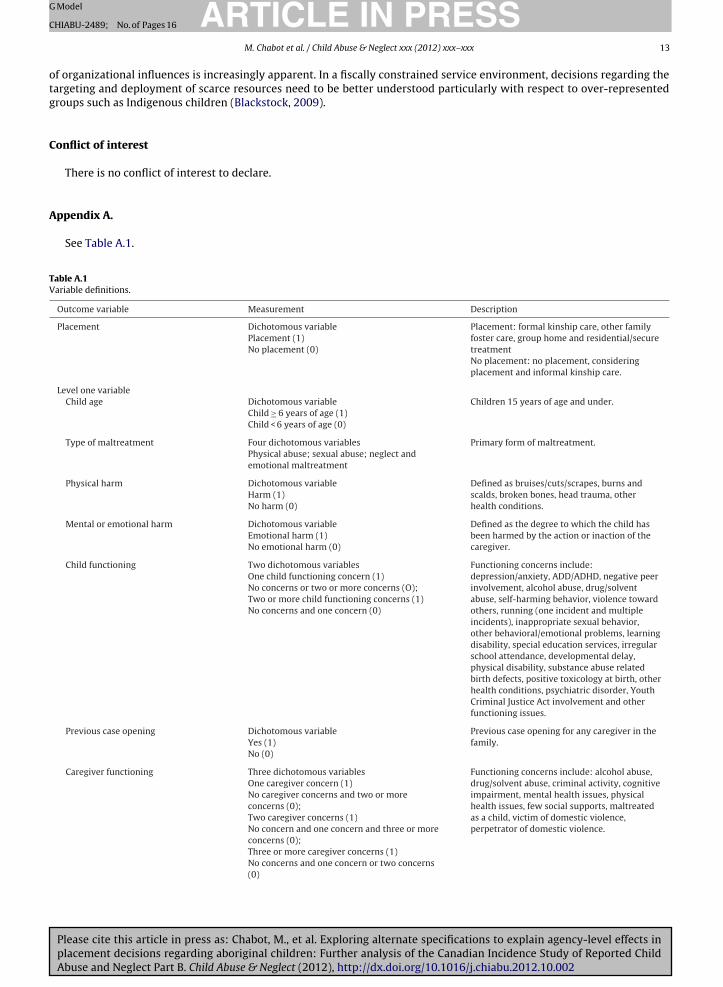
Key clinical variables representing an ecological model of child maltreatment were included in the model to determinehe relative contribution of clinical variables and variables that, in principle, should be extraneous to the case disposition,pecifically worker and organizational variables. Clinical variables were chosen based on empirical literature on factorselated to child maltreatment or risk of child maltreatment. Worker and organizational variables that impact services pro-ided to children and families by child welfare agencies were selected based on theoretical literature. A table presenting theperational definitions and codes used in the analysis is provided in Appendix A.
Please cite this article in press as: Chabot, M., et al. Exploring alternate specifications to explain agency-level effects inplacement decisions regarding aboriginal children: Further analysis of the Canadian Incidence Study of Reported ChildAbuse and Neglect Part B. Child Abuse & Neglect (2012), http://dx.doi.org/10.1016/j.chiabu.2012.10.002
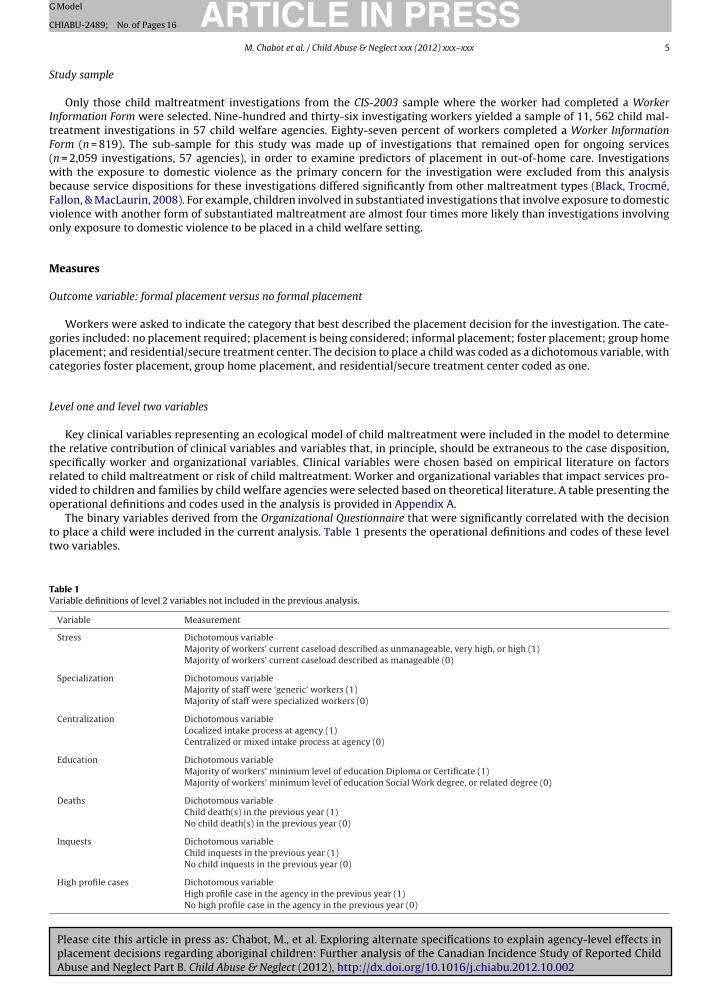
The binary variables derived from the Organizational Questionnaire that were significantly correlated with the decisiono place a child were included in the current analysis. Table 1 presents the operational definitions and codes of these levelwo variables.
able 1ariable definitions of level 2 variables not included in the previous analysis.
Variable Measurement
Stress Dichotomous variableMajority of workers’ current caseload described as unmanageable, very high, or high (1)Majority of workers’ current caseload described as manageable (0)
Specialization Dichotomous variableMajority of staff were ‘generic’ workers (1)Majority of staff were specialized workers (0)
Centralization Dichotomous variableLocalized intake process at agency (1)Centralized or mixed intake process at agency (0)
Education Dichotomous variableMajority of workers’ minimum level of education Diploma or Certificate (1)Majority of workers’ minimum level of education Social Work degree, or related degree (0)
Deaths Dichotomous variableChild death(s) in the previous year (1)No child death(s) in the previous year (0)
Inquests Dichotomous variableChild inquests in the previous year (1)No child inquests in the previous year (0)
High profile cases Dichotomous variableHigh profile case in the agency in the previous year (1)No high profile case in the agency in the previous year (0)

ARTICLE IN PRESSG Model
CHIABU-2489; No. of Pages 16
6 M. Chabot et al. / Child Abuse & Neglect xxx (2012) xxx– xxx
Table 2Model A (parsimonious level one and parsimonious level two) – CIS-2003 (n = 2,059 investigations, 57 agencies).
Estimate S.E. Est./S.E. P-Value Odds ratio 95% Confidence interval
Physical harm 0.703 0.158 4.458 0.000 2.02 1.48 2.75Emotional harm 0.422 0.124 3.396 0.001 1.53 1.20 1.94Household level of cooperation −0.898 0.148 −6.064 0.000 0.41 0.30 0.54Aboriginal Status 0.623 0.160 3.887 0.000 1.86 1.36 2.55
Level 2Proportion of Aboriginal reports (45%) 0.795 0.301 2.641 0.008 2.21 1.23 3.99
Table 3Model B (parsimonious level one and parsimonious level two) – CIS-2003 (n = 2,059 investigations, 57 agencies).
Estimate S.E. Est./S.E. P-Value Odds ratio 95% Confidence interval
Physical harm 0.656 0.16 4.103 0.000 1.93 1.41 2.64Emotional harm 0.362 0.126 2.881 0.004 1.44 1.12 1.84Household level of cooperation −0.979 0.147 −6.661 0.000 0.38 0.28 0.50Aboriginal status 0.557 0.156 3.566 0.000 1.75 1.29 2.37
Level 2Proportion of Aboriginal reports (45%) 0.843 0.317 2.661 0.008 2.32 1.25 4.32Minimum education 0.572 0.296 1.932 0.053 1.77 0.99 3.17
Table 4Model C (parsimonious level one and parsimonious level two) – CIS-2003 (n = 2,059 investigations, 57 agencies).
Estimate S.E. Est./S.E. P-Value Odds ratio 95% Confidence interval
Physical harm 0.675 0.161 4.192 0.000 1.96 1.43 2.69Emotional harm 0.355 0.127 2.8 0.005 1.43 1.11 1.83Household level of cooperation −0.936 0.149 −6.266 0.000 0.39 0.29 0.53Aboriginal status 0.603 0.156 3.868 0.000 1.83 1.35 2.48
Level 2Proportion of Aboriginal reports (45%) 1.189 0.298 3.985 0.000 3.28 1.83 5.89
Degree of centralization −0.004 0.251 −0.014 0.989 1.00 0.61 1.63Analysis plan
Through multi-level logistic regressions, the previous two studies (Fallon et al., in this issue; Fluke et al., 2010) establishedthat agency-level variables and the proportion of Aboriginal reports influenced the likelihood of a child being placed. In thispaper, we use the final model presented in the analysis of the 2003 cycle (Fallon et al., in this issue) as a starting point(Table 2), and embed it in the contextual factors measured by agency-level binary variables derived from the OrganizationalQuestionnaire of the CIS-2003. The continuous variable proportion of Aboriginal reports was transformed into a binaryvariable using a cut-point value of 45%. This value was arrived upon based on a number of factors the most important beingthe comparability between the univariate effect of the variable in the 1998 and 2003 cycles. The statistical software MPlus5 (Muthén & Muthén, 1998–2007) is used to estimate two-level logistic regression models, as in the previous studies.
Improvement of model specification by the addition of relevant factors is always an objective in statistical modeling. Bydefinition, a multilevel analysis implies the presence of nesting of lower-level units (Bickel, 2007). However, it is important tonote that whether the researcher acknowledges the presence of nesting or not, the associated dependency in the dependentvariable within group, measured by intraclass correlation, will affect the analysis by biasing the results. The estimation ofa multilevel model takes the nesting effect into account, leading to more robust estimates. It also allows the introductionof explanatory variables both at higher levels and as cross-level interactions (Snijders & Bosker, 1999). By explaining partof the between group variation, relevant higher-level variables in the model can diminish the intraclass correlation. Thisin effect leads to an effective conditional intraclass correlation of the dependent variable that can be substantially lower,consequently providing more powerful models (Bickel, 2007).
The first objective was to examine the influence of the contextual factors measured by agency-level contextual variablesderived from the Organizational Questionnaire of the CIS-2003 on the effect of the proportion of Aboriginal reports on thedecision to place a child. In order to do so, each of the seven new variables was added to Model A one by one (Model Band Model C show significant findings) and possible moderator effects were retained (Tables 3 and 4). These agency-levelcontextual variables and their interactions with the Proportion of Aboriginal reports (PAR) were then included for a more
Please cite this article in press as: Chabot, M., et al. Exploring alternate specifications to explain agency-level effects inplacement decisions regarding aboriginal children: Further analysis of the Canadian Incidence Study of Reported ChildAbuse and Neglect Part B. Child Abuse & Neglect (2012), http://dx.doi.org/10.1016/j.chiabu.2012.10.002
complex re-specification of our final model (Table 5). Cross-level interaction terms were not included to avoid over-fittingand colinearity problems, given the number of agency-level variables already present and the limited second-level samplesize (n = 57).

ARTICLE IN PRESSG Model
CHIABU-2489; No. of Pages 16
M. Chabot et al. / Child Abuse & Neglect xxx (2012) xxx– xxx 7
Table 5Model D (parsimonious level one and interactions) – CIS-2003 (n = 2,059 investigations, 57 agencies).
Estimate S.E. Est./S.E. P-Value Odds ratio 95% Confidenceinterval
Physical harm 0.627 0.164 3.816 0.000 1.87 1.36 2.58Emotional harm 0.322 0.129 2.499 0.012 1.38 1.07 1.78Household level of cooperation −0.981 0.151 −6.502 0.000 0.37 0.28 0.50Aboriginal status 0.564 0.157 3.605 0.000 1.76 1.29 2.39
Level 2Proportion of Aboriginal reports (45%) 0.140 0.533 0.263 0.793 1.15 0.40 3.27Minimum education 0.441 0.402 1.095 0.273 1.55 0.71 3.42Degree of centralization 0.031 0.309 0.101 0.919 1.03 0.56 1.89Proportion of Aboriginal reports × minimum education 1.004 0.680 1.476 0.140 2.73 0.72 10.35Proportion of Aboriginal reports × degree of centralization 1.488 0.796 1.870 0.061 4.43 0.93 21.08Proportion of Aboriginal reports × degree of
centralization × minimum education−1.647 0.933 −1.765 0.078 0.19 0.03 1.20
0%
10%
20%
30%
40%
50%
60%
Socia l Work Degree
Diploma So cia l Work Degree
Diploma
% p
lace
men
t at a
genc
y
Localized
Centralized
F
twp
otmm
Fr
PAR <45% PAR >45%
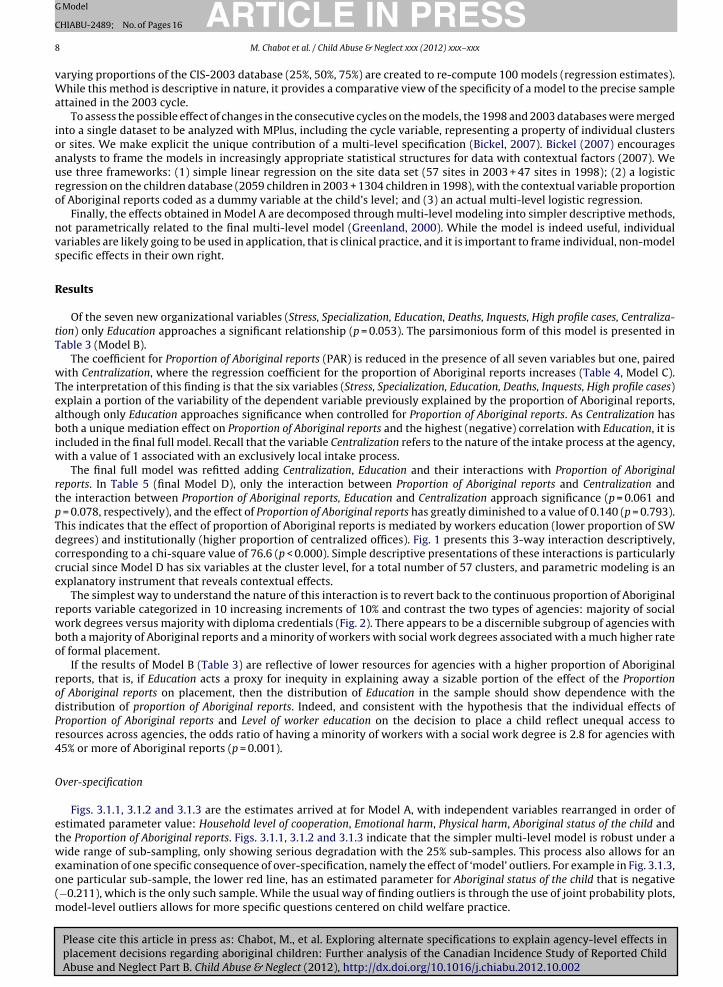
ig. 1. Proportion of placements by Three Agency-level Variables: binary proportion of Aboriginal reports (PAR), level of education and centralization.
Fig. 1 presents these interactions descriptively. To further assess the nature of the interactions included in the analysis, twoypes of agencies were contrasted based on the two minimum levels of education categories (majority of workers with socialork degrees and majority of workers with diplomas or certificates). The proportion of placements and the continuous pro-ortion of Aboriginal reports variable were examined, comparing the two categories of minimum level of education (Fig. 2).
A second set of analyses was conducted to examine over-specification. There are only 57 units contributing to variation
Please cite this article in press as: Chabot, M., et al. Exploring alternate specifications to explain agency-level effects inplacement decisions regarding aboriginal children: Further analysis of the Canadian Incidence Study of Reported ChildAbuse and Neglect Part B. Child Abuse & Neglect (2012), http://dx.doi.org/10.1016/j.chiabu.2012.10.002
n placement at the agency level in the 2003 cycle, and the specific shape of the relationship expressed by a model is specifico the sample obtained. Rather than including all variable combinations to create a full set of models and comparing sub-
odels of increasing complexity, a simple naive resampling method was used to portray over-specification of our mainodel (Model A) by the imposition of three arbitrary sub-sampling schemes: for a model, 100 random samples of three
0%
10%
20%
30%
40%
50%
60%
70%
Socia l Work Degree
No So cial Work Degree
ig. 2. Proportion of placements for two types of agencies: majority of social work degrees versus majority with lesser degree, by proportion of Aboriginaleports (PAR).
G Model
ARTICLE IN PRESSCHIABU-2489; No. of Pages 168 M. Chabot et al. / Child Abuse & Neglect xxx (2012) xxx– xxx
varying proportions of the CIS-2003 database (25%, 50%, 75%) are created to re-compute 100 models (regression estimates).While this method is descriptive in nature, it provides a comparative view of the specificity of a model to the precise sampleattained in the 2003 cycle.
To assess the possible effect of changes in the consecutive cycles on the models, the 1998 and 2003 databases were mergedinto a single dataset to be analyzed with MPlus, including the cycle variable, representing a property of individual clustersor sites. We make explicit the unique contribution of a multi-level specification (Bickel, 2007). Bickel (2007) encouragesanalysts to frame the models in increasingly appropriate statistical structures for data with contextual factors (2007). Weuse three frameworks: (1) simple linear regression on the site data set (57 sites in 2003 + 47 sites in 1998); (2) a logisticregression on the children database (2059 children in 2003 + 1304 children in 1998), with the contextual variable proportionof Aboriginal reports coded as a dummy variable at the child’s level; and (3) an actual multi-level logistic regression.
Finally, the effects obtained in Model A are decomposed through multi-level modeling into simpler descriptive methods,not parametrically related to the final multi-level model (Greenland, 2000). While the model is indeed useful, individualvariables are likely going to be used in application, that is clinical practice, and it is important to frame individual, non-modelspecific effects in their own right.
Results
Of the seven new organizational variables (Stress, Specialization, Education, Deaths, Inquests, High profile cases, Centraliza-tion) only Education approaches a significant relationship (p = 0.053). The parsimonious form of this model is presented inTable 3 (Model B).
The coefficient for Proportion of Aboriginal reports (PAR) is reduced in the presence of all seven variables but one, pairedwith Centralization, where the regression coefficient for the proportion of Aboriginal reports increases (Table 4, Model C).The interpretation of this finding is that the six variables (Stress, Specialization, Education, Deaths, Inquests, High profile cases)explain a portion of the variability of the dependent variable previously explained by the proportion of Aboriginal reports,although only Education approaches significance when controlled for Proportion of Aboriginal reports. As Centralization hasboth a unique mediation effect on Proportion of Aboriginal reports and the highest (negative) correlation with Education, it isincluded in the final full model. Recall that the variable Centralization refers to the nature of the intake process at the agency,with a value of 1 associated with an exclusively local intake process.
The final full model was refitted adding Centralization, Education and their interactions with Proportion of Aboriginalreports. In Table 5 (final Model D), only the interaction between Proportion of Aboriginal reports and Centralization andthe interaction between Proportion of Aboriginal reports, Education and Centralization approach significance (p = 0.061 andp = 0.078, respectively), and the effect of Proportion of Aboriginal reports has greatly diminished to a value of 0.140 (p = 0.793).This indicates that the effect of proportion of Aboriginal reports is mediated by workers education (lower proportion of SWdegrees) and institutionally (higher proportion of centralized offices). Fig. 1 presents this 3-way interaction descriptively,corresponding to a chi-square value of 76.6 (p < 0.000). Simple descriptive presentations of these interactions is particularlycrucial since Model D has six variables at the cluster level, for a total number of 57 clusters, and parametric modeling is anexplanatory instrument that reveals contextual effects.
The simplest way to understand the nature of this interaction is to revert back to the continuous proportion of Aboriginalreports variable categorized in 10 increasing increments of 10% and contrast the two types of agencies: majority of socialwork degrees versus majority with diploma credentials (Fig. 2). There appears to be a discernible subgroup of agencies withboth a majority of Aboriginal reports and a minority of workers with social work degrees associated with a much higher rateof formal placement.
If the results of Model B (Table 3) are reflective of lower resources for agencies with a higher proportion of Aboriginalreports, that is, if Education acts a proxy for inequity in explaining away a sizable portion of the effect of the Proportionof Aboriginal reports on placement, then the distribution of Education in the sample should show dependence with thedistribution of proportion of Aboriginal reports. Indeed, and consistent with the hypothesis that the individual effects ofProportion of Aboriginal reports and Level of worker education on the decision to place a child reflect unequal access toresources across agencies, the odds ratio of having a minority of workers with a social work degree is 2.8 for agencies with45% or more of Aboriginal reports (p = 0.001).
Over-specification
Figs. 3.1.1, 3.1.2 and 3.1.3 are the estimates arrived at for Model A, with independent variables rearranged in order ofestimated parameter value: Household level of cooperation, Emotional harm, Physical harm, Aboriginal status of the child andthe Proportion of Aboriginal reports. Figs. 3.1.1, 3.1.2 and 3.1.3 indicate that the simpler multi-level model is robust under awide range of sub-sampling, only showing serious degradation with the 25% sub-samples. This process also allows for an
Please cite this article in press as: Chabot, M., et al. Exploring alternate specifications to explain agency-level effects inplacement decisions regarding aboriginal children: Further analysis of the Canadian Incidence Study of Reported ChildAbuse and Neglect Part B. Child Abuse & Neglect (2012), http://dx.doi.org/10.1016/j.chiabu.2012.10.002
examination of one specific consequence of over-specification, namely the effect of ‘model’ outliers. For example in Fig. 3.1.3,one particular sub-sample, the lower red line, has an estimated parameter for Aboriginal status of the child that is negative(−0.211), which is the only such sample. While the usual way of finding outliers is through the use of joint probability plots,model-level outliers allows for more specific questions centered on child welfare practice.

ARTICLE IN PRESSG Model
CHIABU-2489; No. of Pages 16
M. Chabot et al. / Child Abuse & Neglect xxx (2012) xxx– xxx 9
-0. 936 House hold Level of Coo per a�on
0.396 Emo�onal Harm
0.577 Child Aboriginal Status
0.705 Phy sical Harm
1.139 Propor�o n of Aboriginal Reports
-1.5
-1
-0.5
0
0.5
1
1.5
2
Es�m
ated
Par
amet
er V
alue
Fig. 3.1.1. Model A: estimated parameter values on 100 random samples of 75% of the sample.
-0. 936 House hold Level of Coo per a�on
0.396 Emo�onalHarm
0.577 Child Aboriginal Status
0.705 Phy sical Harm
1.139 Propor�onof Aborigin al
Reports
-1.5
-1
-0.5
0
0.5
1
1.5
2
Es�m
ated
Par
amet
er V
alue
s
Fig. 3.1.2. Model A: estimated parameter values on 100 random samples of 50% of the sample.
-0. 936 House hold Level of Coo per a�on
0.396 Emo�onal Harm
0.577 Child Aboriginal Status
0.705 Phy sical Harm
1.139 Propor�o n of Aboriginal Reports
-1.5
-1
-0.5
0
0.5
1
1.5
2
2.5
Es�m
ated
Par
amet
er V
alue
s
C
dc
-2
Fig. 3.1.3. Model A: estimated parameter values on 100 random samples of 25% of the sample.
omparison of cycles and multi-level specification
Please cite this article in press as: Chabot, M., et al. Exploring alternate specifications to explain agency-level effects inplacement decisions regarding aboriginal children: Further analysis of the Canadian Incidence Study of Reported ChildAbuse and Neglect Part B. Child Abuse & Neglect (2012), http://dx.doi.org/10.1016/j.chiabu.2012.10.002
Fig. 4.1 shows the regression coefficient estimates for the continuous proportion of Aboriginal reports, while Fig. 4.2isplays the regression coefficient estimates for our binary proportion of Aboriginal reports variable. Both figures show theoefficients for the proportion of Aboriginal reports in relation to cycle in three contextual models: linear regressions at

ARTICLE IN PRESSG Model
CHIABU-2489; No. of Pages 16
10 M. Chabot et al. / Child Abuse & Neglect xxx (2012) xxx– xxx
-0.5
0.0
0.5
1.0
1.5
2.0
sites sites
≥ 5%
placement
children chi ldren
≥ 5%
placement
structural struc tural
≥ 5%
placement
regre
ssio
n c
oef
fici
ent
cycle
continuous
PAR
Fig. 4.1. Regression coefficient estimates for the proportion of Aboriginal reports (continuous) in relation to cycle (2003 vs 1998).
the agency level; logistic regressions at the child level; and multilevel logistic regressions, along with standard errors bars.Each model is also estimated on the sub-sample consisting of agencies with at least 5% of formal placement. All coefficientsfor proportion of Aboriginal reports are significant (p < 0.05), and all those for Cycle are non-significant except for simplechildren model in Fig. 4.2 (p = 0.047).
Visual inspection of these figures reinforces Bickel’s (2007) conclusion that the main imports of multi-level specificationare, in order: correct estimation of standard errors, and better individual parameters. Comparison of Figs. 4.1 and 4.2 supportthe inter-comparability of the two versions of our main second-level variable Proportion of Aboriginal reports (20% cut point,used in Fluke et al., 2010) and Proportion of Aboriginal reports (45% cut point), and also the strength of its effect on placement,irrespective of cycle.
Descriptive effects
Fig. 5.1 reports different odds ratios of formal placement for first level variables of Model A: Household Level of Cooperation,Emotional Harm, Physical Harm and Child Aboriginal Status which are inversed to have odds ratios on a common scale. In allgraphs, the blue columns represent the simple odds ratios. The red and green columns in Fig. 5.1 depict the odds ratios for
Please cite this article in press as: Chabot, M., et al. Exploring alternate specifications to explain agency-level effects inplacement decisions regarding aboriginal children: Further analysis of the Canadian Incidence Study of Reported ChildAbuse and Neglect Part B. Child Abuse & Neglect (2012), http://dx.doi.org/10.1016/j.chiabu.2012.10.002
the same variable, controlling for their respective Proportion of Aboriginal reports (45%) (PAR45) groups (For interpretationof the references to color in this sentence, the reader is referred to the web version of the article.). Figs. 5.2 and 5.3 separatethe two groups and adds a comparison estimate. The green columns in these two graphs show the ratios of odds ratios for
-0.5
0.0
0.5
1.0
1.5
2.0
sites sites
≥ 5%
placement
children chi ldren
≥ 5%
placement
structural struc tural
≥ 5%
placement
regre
ssio
n c
oef
fici
ent
cycle
binary PAR
Fig. 4.2. Regression coefficient estimates for the proportion of Aboriginal reports (binary) in relation to cycle (2003 vs 1998).

ARTICLE IN PRESSG Model
CHIABU-2489; No. of Pages 16
M. Chabot et al. / Child Abuse & Neglect xxx (2012) xxx– xxx 11
0123456789
10
Household Level of
Coopera�on
Emo�onal Harm
Physical Harm Child Abor iginal
Status
Odds Ra�o
PAR < 45%
PAR > 45%
Fig. 5.1. Odds ratios for first level variables controlling for proportion of Aboriginal reports (45%).
0
1
2
3
4
5
6
7
8
9
Household Le vel of Coopera�on
Emo�onal Harm Physical Harm Child Abor iginal Status
Odds Ra�o
Odds Ra�o for PAR < 45%
Ra�o of Odds Ra�o for Placement to Odds Ra�o Controlling for PAR < 45%
Fig. 5.2. Odds ratio for first level controlling for proportion of Aboriginal reports (<45%).
0
1
2
3
4
5
6
7
8
9
10
Household Level of
Coopera�on
Emo�onal Harm
Physical Harm Child Abor iginal Status
Odds Ra�o
Odds Ra�o for PAR > 45%
Ra�o of Odds Ra�o for Placement to Odds Ra�o Controlling for PAR > 45%
pi
sptA
Fig. 5.3. Odds ratio for first level controlling for proportion of Aboriginal reports (>45%).
lacement for each variable to the odds ratio of their respective PAR45 group (For interpretation of the references to colorn this sentence, the reader is referred to the web version of the article.).
It is evident from these figures that there are complex interactions between the first level variables and the primaryecond-level variable Proportion of Aboriginal reports (45% cut point). The level of cooperation during the investigation inarticular shows diverging behavior across groups: it is more important for the Proportion of Aboriginal reports for the lesshan 45% Proportion of Aboriginal reports group, while this relationship is reversed for the more than 45% Proportion of
Please cite this article in press as: Chabot, M., et al. Exploring alternate specifications to explain agency-level effects inplacement decisions regarding aboriginal children: Further analysis of the Canadian Incidence Study of Reported ChildAbuse and Neglect Part B. Child Abuse & Neglect (2012), http://dx.doi.org/10.1016/j.chiabu.2012.10.002
boriginal reports group.

G Model
ARTICLE IN PRESSCHIABU-2489; No. of Pages 1612 M. Chabot et al. / Child Abuse & Neglect xxx (2012) xxx– xxx
Discussion
This paper’s objective was to explore the finding from two previous studies which indicated that the Proportion of Aborig-inal reports in agencies contributed to the placement of children in out-of-home care at the conclusion of the investigation.It undertook a series of converging methodological analyses to investigate the nature, strength and generalizability of thefinding.
First, a set of site level variables available for the 2003 cycle of the CIS was used to re-specify the final model of the 2003paper (Fallon et al., in this issue). The goal was to investigate the nature of the strong second-level effect of Proportion ofAboriginal reports on a decision to place a child in out-of-home care, which was a finding that was similar in both the 1998and 2003 cycles. By including two new agency level variables that can reasonably be thought to reflect resource limitationsto examine the impact on the Proportion of Aboriginal reports in the same regression, it provides further support for the role ofunderfunding in higher rates of formal placements in the Canadian child welfare system, and indicates possible avenues forfurther research. An agency with access to more workers with a formal social work education may reduce the likelihood thata child will be placed in out-of-home care at the conclusion of the investigation. Similarly, a centralized intake model whichis likely an indicator of a standardized approach to investigating child maltreatment-related concerns may also reduce thelikelihood of out-of-home placement in the presence of large Aboriginal caseloads.
Ideally, direct measures of the funding for agencies should also be used to estimate these relationships. In the CIS,these data were not collected because of the size and complexity of the study. Demonstrating the interaction betweeneducation and degree of centralization with the Proportion of Aboriginal Reports provided some clarification, it also revealedthe complexity of interaction effects between predictors, and the associated difficulty of applying findings in the field.
The second issue investigated, also focused on the effect of Proportion of Aboriginal reports on the placement decision,was the comparability of model results between the 1998 and 2003 cycles of the CIS. By using a unified database includingboth cycles and various specifications of models, it found the comparability to be robust, in addition to clarifying the precisecontribution of a multi-level specification.
A final goal was to establish that the fit of the final model from the CIS-2003 data (Table 2) was not overly dependent onthe specific sample obtained. The final model maintains the findings even under the most restrictive resampling scheme of25% of the sample. As it is highly problematic to incorporate the weighting of data in complex models for a complex samplingstructure such as that of the CIS, such resampling analyses offer a simple if partial way to guard against the ever presentdanger of a limited ability to generalize results.
Limitations
Although the CIS is a rich source of data for understanding families and children referred to the Canadian child welfaresystem, there are several limitations to the design of this study that should be considered. Quebec investigations are notincluded. The data are cross sectional and can only describe the placement decision at the end of the child maltreatmentinvestigation. How long a child remains in out-of-home care or the clinical appropriateness of the decision are considerationsthat cannot be addressed using these data. We did not control for the non-independence of siblings in the sample, althoughthe robustness of the findings using the resampling technique is a strong indication that this is not an issue.
A number of variables are constructed from ratings reported by the investigating workers which are not independentlyverified. Cases included in the CIS represent only children reported to a child welfare authority for a maltreatment concernand not children who may be maltreated and identified only to the police or known to a community member who does notreport. The study is carefully designed to measure key aspects of a child maltreatment investigation, but not organizationalmeasures. Therefore the organization measures used in this analysis are limited.
Implications
Recent empirical evidence, as a result of increasingly sophisticated multi-level statistical analysis systems that can accountfor organizational differences, has demonstrated that the characteristics of organizations do impact service dispositions(Fallon & Trocmé, 2011; Fluke et al., 2010; Fallon, 2005; Glisson & Green, 2006; Glisson, 2010; Littell & Tajima, 2000;Ryan et al., 2006; Yoo & Brooks, 2005). Multi-level or hierarchical linear modeling requires the researcher to hypothesizemediating mechanisms at one level that influence a change to a variable at another level (Raudenbush & Bryk, 2002). However,current statistical models accounting for organizational variance tend to reflect the availability of certain organizationalmeasures rather than a deliberate strategy to test the importance of organizational characteristics and the direction ofthat influence. Better specification of the organizational level variables in accord with a decision making framework forhypotheses formation (Baumann, Dalgleish, Fluke, & Kern, 2011) is likely to yield more explanatory results.
It is important to contextualize the findings of this study not only for the implications of Aboriginal status and its role atthe individual level and organizational level in North American child welfare systems but also as a reminder of an important
Please cite this article in press as: Chabot, M., et al. Exploring alternate specifications to explain agency-level effects inplacement decisions regarding aboriginal children: Further analysis of the Canadian Incidence Study of Reported ChildAbuse and Neglect Part B. Child Abuse & Neglect (2012), http://dx.doi.org/10.1016/j.chiabu.2012.10.002
question that remains unaddressed in the field of child welfare: what are the important organizational theoretical domainsto consider when understanding the influence of organizations? What are the measures that can be used to best characterizethese domains? There is a need for complex, standardized measures of organizations representing each of the theoreticalperspectives. As the empirical analytical techniques become available, the importance of understanding the exact nature
G Model
C
otg
C
A
TV
ARTICLE IN PRESSHIABU-2489; No. of Pages 16
M. Chabot et al. / Child Abuse & Neglect xxx (2012) xxx– xxx 13
f organizational influences is increasingly apparent. In a fiscally constrained service environment, decisions regarding theargeting and deployment of scarce resources need to be better understood particularly with respect to over-representedroups such as Indigenous children (Blackstock, 2009).
onflict of interest
There is no conflict of interest to declare.
ppendix A.
See Table A.1.
able A.1ariable definitions.
Outcome variable Measurement Description
Placement Dichotomous variablePlacement (1)No placement (0)
Placement: formal kinship care, other familyfoster care, group home and residential/securetreatmentNo placement: no placement, consideringplacement and informal kinship care.
Level one variableChild age Dichotomous variable
Child ≥ 6 years of age (1)Child < 6 years of age (0)
Children 15 years of age and under.
Type of maltreatment Four dichotomous variablesPhysical abuse; sexual abuse; neglect andemotional maltreatment
Primary form of maltreatment.
Physical harm Dichotomous variableHarm (1)No harm (0)
Defined as bruises/cuts/scrapes, burns andscalds, broken bones, head trauma, otherhealth conditions.
Mental or emotional harm Dichotomous variableEmotional harm (1)No emotional harm (0)
Defined as the degree to which the child hasbeen harmed by the action or inaction of thecaregiver.
Child functioning Two dichotomous variablesOne child functioning concern (1)No concerns or two or more concerns (O);Two or more child functioning concerns (1)No concerns and one concern (0)
Functioning concerns include:depression/anxiety, ADD/ADHD, negative peerinvolvement, alcohol abuse, drug/solventabuse, self-harming behavior, violence towardothers, running (one incident and multipleincidents), inappropriate sexual behavior,other behavioral/emotional problems, learningdisability, special education services, irregularschool attendance, developmental delay,physical disability, substance abuse relatedbirth defects, positive toxicology at birth, otherhealth conditions, psychiatric disorder, YouthCriminal Justice Act involvement and otherfunctioning issues.
Previous case opening Dichotomous variableYes (1)No (0)
Previous case opening for any caregiver in thefamily.
Caregiver functioning Three dichotomous variablesOne caregiver concern (1)No caregiver concerns and two or moreconcerns (0);Two caregiver concerns (1)No concern and one concern and three or moreconcerns (0);Three or more caregiver concerns (1)
Functioning concerns include: alcohol abuse,drug/solvent abuse, criminal activity, cognitiveimpairment, mental health issues, physicalhealth issues, few social supports, maltreatedas a child, victim of domestic violence,perpetrator of domestic violence.
Please cite this article in press as: Chabot, M., et al. Exploring alternate specifications to explain agency-level effects inplacement decisions regarding aboriginal children: Further analysis of the Canadian Incidence Study of Reported ChildAbuse and Neglect Part B. Child Abuse & Neglect (2012), http://dx.doi.org/10.1016/j.chiabu.2012.10.002
No concerns and one concern or two concerns(0)

ARTICLE IN PRESSG Model
CHIABU-2489; No. of Pages 16
14 M. Chabot et al. / Child Abuse & Neglect xxx (2012) xxx– xxx
Table A.1 (Continued )
Outcome variable Measurement Description
Income source Two dichotomous variablesPart time employment (1)All other situations (0);Benefits (including social assistance) (1)All other types of employment (0)
Primary sources of income included: full timeemployment, part time employment, multiplejobs, seasonal, employment insurance, socialassistance, other benefits, no reliable source ofincome and unknown income source. Caregiversources of income were combined to reflectthe primary income source for the household.
Number of moves Two dichotomous variablesOne move (1)No moves or two or more moves (0);Two or more moves (1)One move or no moves (0)
Number of moves reflects the number ofmoves the household had experienced in thepast 12 months.
Household level of cooperation Dichotomous variableCooperative (1)Not cooperative (0)
Household level of cooperation reflects thelevel of cooperation with the investigation bythe caregivers. If one caregiver was deemednot cooperative then the household level ofcooperation was not cooperative.
Aboriginal status of child Dichotomous variableAboriginal (First Nations Status, First Nationsnon status, Metis, Inuit or other) (1)Not Aboriginal (0)
Worker indicated if the child was notAboriginal, First Nations status, First Nationsnon status, Métis, Inuit or other Aboriginal
Level 2 variableWorker position Majority of investigations in the sample
conducted by intake workers (51%) (1);Majority of investigations in the sample wereconducted by other than intake workers (0)
Worker position refers to a worker whoperforms only an intake function; otherworkers perform investigation functions inaddition to ongoing family and/or child casesor other responsibilities.
Location of organization Investigations from Metropolitan agencies (1)Mixed urban rural and rural agencies (0)
Location of the organization responsible forconducting the investigation.
Staffing vacancies Investigations with no unfilled staffingpositions (1)Unfilled staffing positions (0)
Agencies reported whether there were anyunfilled staffing positions.
Proportion of Aboriginal reports Agencies with forty-five percent or moreinvestigations involving Aboriginal caregivers(1)Agencies with less than twenty percent ofinvestigations involving Aboriginal caregivers(0)
The number of investigations involvingAboriginal children from each agency wasdetermined. The choice of cut-off point forproportion of Aboriginal reports was arrived inthe following manner. Ten individual modelswere fitted for the 1998 and 2003 datasets,with Aboriginal status as the only first levelvariable, and 10 different proportion ofAboriginal reports (PAR), from 10% (PAR10) to100% (PAR100), as sole second level variable.Fig. 2 displays regression parameters forAboriginal status and proportion of Aboriginalreports; by inspection of the figure, PAR45appears as optimal value for both the 1998 and
2003 cycles.References
Arad-Davidzon, B., & Benbenishty, R. (2008). The role of workers’ attitudes and parent and child wishes in child protection workers’ assessments andrecommendation regarding removal and reunification. Children and Youth Services Review, 30, 107–121.
Ashton, V. (2007). The impact of organizational environment on the likelihood that social workers will report child maltreatment. Journal of Aggression,Maltreatment & Trauma, 15(1), 1–18.
Auditor General of Canada. (2008). Chapter 4—First Nations Child and Family Services Program—Indian and Northern Affairs Canada.Report of the Auditor General of Canada to the House of Commons. Ottawa: Office of the Auditor General of Canada. Retrieved fromhttp://www.oag-bvg.gc.ca/internet/docs/aud ch oag 200805 04 e.pdf
Baumann, D. J., Dalgleish, L., Fluke, J., & Kern, H. K. (2011). The decision making ecology. Denver: American Humane Association.Benbenishty, R., Segev, D., & Surkis, T. (2002). Information-search and decision-making by professionals and nonprofessionals in cases of alleged child-abuse
and maltreatment. Journal of Social Service Research, 28(3), 1–18.Bickel. (2007). Multilevel analysis for applied research: It’s just regression!. NY: The Guilford Press.
Please cite this article in press as: Chabot, M., et al. Exploring alternate specifications to explain agency-level effects inplacement decisions regarding aboriginal children: Further analysis of the Canadian Incidence Study of Reported ChildAbuse and Neglect Part B. Child Abuse & Neglect (2012), http://dx.doi.org/10.1016/j.chiabu.2012.10.002
Black, T., Trocmé, N., Fallon, B., & MacLaurin, B. (2008). The Canadian child welfare system response to exposure to domestic violence investigations. ChildAbuse & Neglect, 32(3), 393–404.
Blackstock, C. (2009). After the apology why are so many First Nations children still in foster care? A summary of the research on ethnic over-representationand structural bias. Children Australia, 34(1), 22–31.

G Model
C
B
B
C
CC
D
D
D
D
F
F
F
F
F
GG
G
GGGH
HH
H
J
JK
LL
L
M
M
MMO
PRR
RRR
SSS
S
S
ARTICLE IN PRESSHIABU-2489; No. of Pages 16
M. Chabot et al. / Child Abuse & Neglect xxx (2012) xxx– xxx 15
lackstock, C. (2011). Why if Canada wins, Canadians lose: The Canadian Human Rights Tribunal on First Nations Child Welfare. Children and Youth ServicesReview, 33(2011), 187–194.
ritner, P. A., & Mossler, D. G. (2002). Professionals’ decision-making about out-of-home placements following instances of child abuse. Child Abuse &Neglect, 26(4), 317–326.
arter, V. (2010). Factors predicting placement of urban American Indian/Alaskan natives into out-of-home care. Children and Youth Services Review, 32,657–663.
raft, J. L., & Bettin, C. A. (1991). Case factor selection in physical abuse investigations. Journal of Social Service Research, 14(3), 107–123.siernik, R., Smith, C., Dewar, J., Dromgole, L., & O’Neill, A. (2010). Supporting new workers in a child welfare agency: An exploratory study. Journal of
Workplace Behavioral Health, 25(3), 218–232.arlington, Y., Healy, K., & Feeney, J. A. (2010). Approaches to assessment and intervention across four types of child and family welfare services. Children
and Youth Services Review, 32, 356–364.rake, B., Lee, S. M., & Jonson-Reid, M. (2009). Race and child maltreatment reporting: Are Blacks overrepresented? Child and Youth Services Review, 31,
309–316.rake, B., Jolley, J. M., Lanier, P., Fluke, J., Barth, R. P., & Jonson-Reid, M. (2011). Racial bias in child protection? A comparison of competing explanations
using national data. Pediatrics, 127(3), 471–478.rury-Hudson, J. (1999). Decision making in child protection: The use of theoretical, empirical, and procedural knowledge by novices and experts and
implications for fieldwork placement. British Journal of Social Work, 29, 147–169.allon, B. (2005). Factors driving case dispositions in child welfare services: Challenging conventional wisdom about the importance of organizations and workers.
Thesis submitted in conformity with the requirements for the degree of Doctor of Philosophy, Faculty of Social Work, University of Toronto.allon, B., Chabot, M., Fluke, J., Blackstock, C., MacLaurin, B., & Tonmyr, L. Placement decisions and disparities among Aboriginal children: Further anal-
ysis of the Canadian Incidence Study of Reported Child Abuse, Neglect Part A: Comparisons of the 1998, 2003, surveys. Child Abuse & Neglect,http://dx.doi.org/10.1016/j.chiabu.2012.10.001, in this issue.
allon, B., & Trocmé, N. (2011). Factors associated with the decision to provide ongoing services: Are worker characteristics and organization geographiclocation important? In K. Kufefdt, & B. McKenzie (Eds.), Child welfare: Connecting research, policy, and practice. Waterloo, ON: Wilfred Laurier UniversityPress.
allon, B., Trocmé, N., MacLaurin, B., Knoke, D., Black, T., Daciuk, J., & Felstiner, C. (2005). Ontario Incidence Study of Reported Child Abuse and Neglect (OIS-2003):Major findings report. Toronto: Centre of Excellence for Child Welfare.
luke, J., Chabot, M., Fallon, B., MacLaurin, B., & Blackstock, C. (2010). Placement decisions and disparities among Aboriginal groups: An application of thedecision making ecology through multi-level analysis. Child Abuse & Neglect, 34(1), 57–69.
iovannoni, J., & Becerra, R. (1979). Defining child abuse. New York: The Free Press.lisson, C. (2010). Organizational climate and service outcomes in child welfare agencies. In M. B. Webb, K. Dowd, B. J. Harden, J. Landsverk, & M. F. Testa
(Eds.), Child welfare and child well-being: New perspectives from the National Survey of Child and Adolescent Well-being (2nd edition, pp. 378–406). NewYork: Oxford University Press.
lisson, C., & Green, P. (2006). The effects of organizational culture and climate on the access to mental health care in child welfare and juvenile justicesystems. Administration and Policy in Mental Health and Mental Health Services Research, 33(4), 433–448.
rasso, A., & Epstein, I. (1988). Management by measurement: Organizational dilemmas and opportunities. Administration in Social Work, 11(3–4), 89–100.reenland, S. (2000). Principles of multilevel modelling. International Journal of Epidemiology, 29, 158–167.rinde, T. V. (2007). Nordic child welfare services: Variations in norms, attitudes and practice. Journal of Children’s Services, 2(4), 44–58.arris, M. S., & Hacket, W. (2008). Decision points in child welfare: An action research model to address disproportionality. Children and Youth Services
Review, 30, 199–215.oagwood, K. (1997). Interpreting nullity: The Fort Bragg experiment—A comparative success or failure? American Psychologist, 52, 546–550.ollingsworth, L. D., Bybee, D., Johnson, E. I., & Swick, D. C. (2010). A comparison of caseworker characteristics in public and private foster care agencies.
Children and Youth Services Review, 32, 578–584.owell, M. L. (2008). Decisions with good intentions: Substance use allegations and child protective services screening decisions. Journal of Public Child
Welfare, 2(3), 293–316.ayaratne, S., Faller, K. C., Ortega, R. M., & Vandervort, F. (2008). African American and white child welfare workers’ attitudes towards policies involving
race and sexual orientation. Children and Youth Services Review, 30(8), 955–966.ohnson, W., & L’Esperance, J. (1984). Predicting the recurrence of child abuse. Social Work Research and Abstracts, 20(2), 21–26.ominkiewicz, F. B. (2004). The relationship of child protection service caseworker discipline-specific education and definition of sibling abuse: An
institutional hiring impact study. Journal of Human Behavior in the Social Environment, 9(1), 69–82.azar, A. (2006). Determinants of child protection officers’ decisions in emergency situations: An experimental study. Child Youth Care Forum, 35, 263–276.ittell, J. H., & Tajima, E. A. (2000). A multilevel model of client participation in intensive family preservation services. Social Service Review, 74(3),
405–435.oxley, J., De Riviere, L., Prakash, T., Blackstock, C., Wien, F., & Thomas Prokop, S. (2005). Wen: de: The journey continues. Ottawa: First Nations Child and
Family Caring Society of Canada.acLaurin, B., Trocmé, N., & Fallon, B. (2006). Northwest Territories Incidence Study of Reported Child Abuse and Neglect – 2003 (NWTIS-2003): Major findings
report. Calgary, AB: Faculty of Social Work, University of Calgary.acLaurin, B., Trocmé, N., Fallon, B., McCormick, M., Pitman, L., Forest, N., Banks, J., Shangreaux, C., & Perrault, E. (2005). Alberta Incidence Study of Reported
Child Abuse and Neglect – 2003 (AIS-2003): Major findings report. Calgary, AB: Faculty of Social Work, University of Calgary.agruder, J., & Shaw, T. (2008). Children ever in care: An examination of cumulative disproportionality. Child Welfare, 87(2), 169–187.uthén, L. K., & Muthén, B. O. (1998–2007). Mplus user’s guide (5th edition). Los Angeles, CA: Muthén & Muthén.lesnavage, M., Preston, M., Sorrells, A., & Tadgerson, S. (2010). Disproportionate minority contact of American Indians/Alaska Natives in the child welfare
system of Michigan. The Michigan Bar Journal, 89(1), 31–35.ublic Health Agency of Canada (PHAC). (2010). Canadian Incidence Study of Reported Child Abuse and Neglect 2008: Major findings. Ottawa: PHAC.audenbush, S. W., & Bryk, A. S. (2002). Hierarchical linear models: Applications and data analysis methods (2nd edition). Newbury Park, CA: Sage.ichardson, B. (2008). Comparative analysis of two community-based efforts designed to impact disproportionality. Child Welfare: Journal of Policy, Practice,
and Program, 87(2), 297–317.ossi, P. H., Schuerman, J., & Budde, S. (1999). Understanding decisions about child maltreatment. Evaluation Review, 23(6), 579–598.oyal Commission on Aboriginal Peoples. (1996). Report of the Royal Commission on Aboriginal Peoples. Ottawa, ON: Indian and Northern Affairs Canada.yan, J. P., Garnier, P., Zyphur, M., & Zhai, F. (2006). Testing the effects of caseworker characteristics in child welfare. Children and Youth Services Review,
29(9), 993–1006.chuerman, J., Rossi, P. H., & Budde, S. (1999). Decisions on placement and family preservation. Evaluation Review, 23(6), 599–618.hdaimah, C. (2009). Rescuing children and punishing poor families: Housing related decisions. Journal of Sociology & Social Welfare, 36(3), 33–57.inha, V., Trocmé, N., Fallon, B., MacLaurin, B., Fast, E., Prokop, S. T., Petti, T., Kozlowski, A., Black, T., Weightman, P., Bennett, M., Formsma, J., Brascoupe, P.,
Please cite this article in press as: Chabot, M., et al. Exploring alternate specifications to explain agency-level effects inplacement decisions regarding aboriginal children: Further analysis of the Canadian Incidence Study of Reported ChildAbuse and Neglect Part B. Child Abuse & Neglect (2012), http://dx.doi.org/10.1016/j.chiabu.2012.10.002
O’Brien, S., Flette, E., Gray, R., Lucas, L., Hoey, S., Levi, J., Montgomery, H. M., & Richard, K. (2011). Kiskisik Awasisak: Remember the children. Understandingthe overrepresentation of First Nations children in the child welfare system. Ontario: Assembly of First Nations.
mith, B. D. (2006). An examination of contextual factors that influence permanency decisions in the public child welfare system. Unpublished Doctoraldissertation, School of Social Work, Howard University, Washington, DC.
nijders, T. A. B., & Bosker, R. J. (1999). Multilevel analysis: An introduction to basic and advanced multilevel modeling. London: Sage Publications.
G Model
ARTICLE IN PRESSCHIABU-2489; No. of Pages 1616 M. Chabot et al. / Child Abuse & Neglect xxx (2012) xxx– xxx
Standing Committee on Public Accounts. (2009). Chapter 4: First Nations child and family services program – Indian and NorthernAffairs Canada of the May 2008 report of the Auditor General: Report of the Standing Committee on Public Accounts. Retrieved fromhttp://www.fncaringsociety.com/docs/402 PACP Rpt07-e.pdf
Sullivan, C., Whitehead, P. C., Leschied, A. W., Chiodo, D., & Hurley, D. (2008). Perception of risk among child protection workers. Children and Youth ServicesReview, 30(7), 699–704.
Surbeck, B. C. (2003). An investigation of racial partiality in child welfare assessments of attachment. American Journal of Orthopsychiatry, 73(1), 13–23.Texas Department of Family and Protective Services. (2010). Disproportionality in child protective services: The preliminary results of statewide reform efforts
in Texas. Texas: Department of Family and Protective Services.Texas Health and Human Services Commission. (2006). Disproportionality in child protective services: Statewide reform effort begins with examination of the
problem. Texas: Department of Family and Protective Services.Trocmé, N., Fallon, B., MacLaurin, B., Daciuk, J., Felstiner, C., Black, T., Tonmyr, L., Blackstock, C., Barter, K., Turcotte, D., & Cloutier, R. (2005). Canadian
Incidence Study of Reported Child Abuse and Neglect, 2003: Major findings. Ottawa: Minister of Public Works and Government Services Canada.Trocmé, N., Fallon, B., MacLaurin, B., Sinha, V., Black, T., Fast, E., Felstiner, C., Hélie, S., Turcotte, D., Weightman, P., Douglas, J., & Holroyd, J. (2010). Chapter
5: Characteristics of children and families. In PHAC (Ed.), Canadian Incidence Study of Reported Child Abuse, 2008: Major findings (Cat: HP5-1/2008E, pp.36–43). Ottawa: Public Health Agency of Canada.
Trocmé, N., Knoke, D., & Blackstock, C. (2004). Pathways to the overrepresentation of Aboriginal children in Canada’s child welfare system. Social ServiceReview, 74(4), 577–600.
Trocmé, N., MacLaurin, B., Fallon, B., Daciuk, J., Billingsley, D., Tourigny, M., Mayer, M., Wright, J., Barter, K., Burford, G., Hornick, J., Sullivan, R., & McKenzie,B. (2001). The Canadian Incidence Study of Reported Child Abuse and Neglect: Final report. Ottawa, Ontario: Minister of Public Works and GovernmentServices Canada.
Wells, S. J., Merrit, L. M., & Briggs, H. E. (2009). Bias, racism and evidence based practice: The case for more focused development of the child welfareevidence. Children and Youth Service Review, 31(11), 1160–1171.
Woldeguiorguis, I. M. (2003). Racism and sexism in child welfare: Effects on women of color as mothers and practitioners. Child Welfare, 82(2), 273–288.
Please cite this article in press as: Chabot, M., et al. Exploring alternate specifications to explain agency-level effects inplacement decisions regarding aboriginal children: Further analysis of the Canadian Incidence Study of Reported ChildAbuse and Neglect Part B. Child Abuse & Neglect (2012), http://dx.doi.org/10.1016/j.chiabu.2012.10.002
Wolock, I. (1982). Community characteristics in child abuse and neglect cases. Social Work Research and Abstracts, 18(2), 9–15.Yoo, J. (2002). The relationship between organizational variables and client outcomes: A case study in child welfare. Administration in Social Work, 26(2),
39–61.Yoo, J., & Brooks, D. (2005). The role of organizational variables in predicting service effectiveness: An analysis of a multilevel model. Research on Social
Work Practice, 15, 267–277.