The Impact of Brand Relationships on Corporate Brand ... - MDPI
Upload
khangminh22Category
view
0download
0
Exploration of Digital Brand Building with Facebook advertisements: A Digital Deep-dive
Dissertation submitted in part fulfilment of the requirements for the degree of MBA in Marketing at Dublin Business School
Student Name: Nida Naaz Student Id: 10379490
Supervisor: Dr. Chantal Ladias
MBA (Marketing) January, 2019

Declaration
I, Nida Naaz, declare that this research is my original work and that it has never
been presented to any institution or university for the award of Degree or
Diploma. In addition, I have referenced correctly all literature and sources used in
this work and this work is fully compliant with the Dublin Business School’s
academic honesty policy.
Signed:
Date: _06-01-2019_______

Acknowledgment
Firstly, I would like to express my sincere gratitude to my advisor supervisor Dr.
Chantal Ladias for the continuous support of my dissertation, for her patience,
motivation, enthusiasm, and immense knowledge. Her guidance helped me all the
time in doing research and writing of this dissertation. I could not have imagined
having a better supervisor and mentor for my dissertation.
I would also like to say a heartfelt thank you to my family and friends for always
believing in me and encouraging me to follow my dreams.
Lastly, I would like to thank all the participants who participated in the survey.

Abstract
With the advent of digital age, engaging customers on social networking sites has become an
essential marketing activity of companies. Facebook has recently gained enormous popularity
for marketing communications. Vast use of Facebook around the globe has made it an
important advertising platform, where businesses place their ads to reach their prospective
customers. This is probably because Facebook allows an organization to target specific
customer and promoting their product or services through effective advertisements. Facebook
especially describes itself as the perfect marketing tool because its developers have created an
advertising system which allows businesses to use the information of each Facebook user for
targeted advertising. Despite the current boom of Facebook for marketing, this study reveals
that how Facebook advertising is part of the trust building relationship between the consumer
and a Nestle India Ltd. This case study, through a questionnaire survey of 103 respondents who
follow Nescafe Fb brand pg, analyses that how Nestle India Ltd optimizes Facebook platform to
engage Indian customers for Nescafe. The gap between brand identity and brand image of
Nescafe in India is investigated. The results shows that to engage maximum customers the
content should be more customized and rendered to be directed to the users' needs and desire.
The results also delineate that customer participation leads to customer engagement, which in
turn plays a crucial role in generating E-word of mouth. Practical implications are suggested for
Nescafe using Facebook as a social marketing tool and areas for future research identified.

Table of Contents
Chapter 1: Introduction ......................................................................................................... 9
1.1 Research Background ................................................................................................... 9
1.2 Aims for the Proposed Research ................................................................................. 10
1.3 Significance of the study ............................................................................................. 11
1.4 Company Overview (Nestle India Ltd) ......................................................................... 12
1.5 Nescafe ...................................................................................................................... 13
1.6 Research Limitation .................................................................................................... 13
1.7 Dissertation roadmap ................................................................................................. 14
Chapter 2: Literature Review .............................................................................................. 16
2.1 Introduction ............................................................................................................... 16
2.2 Digital Marketing ........................................................................................................ 16
2.3 Social Media Marketing in India .................................................................................. 19
2.4 Facebook Marketing ................................................................................................... 25
2.5 Nescafe ...................................................................................................................... 36
2.6 The Online Consumer Decision Journey ...................................................................... 44
2.6.1. The Linear Model .................................................................................................... 45
2.6.2. The Easy-to-Convince consumer ............................................................................. 46
2.7. Conclusion ................................................................................................................. 47
Chapter 3: Research Methodology ....................................................................................... 48
3.1 Introduction ............................................................................................................... 48
3.2 Research Onion .......................................................................................................... 49
3.3 Research Philosophy................................................................................................... 50
3.4 Research approach ..................................................................................................... 51
3.5 Research Strategy ....................................................................................................... 54
3.6 Research Choices ........................................................................................................ 56
3.7 Time Horizon .............................................................................................................. 56
3.8 Data Collection Method .............................................................................................. 57
3.9 Data Analysis Procedures ........................................................................................... 60
3.10 Research Ethics ......................................................................................................... 62
3.11 Summary .................................................................................................................. 64
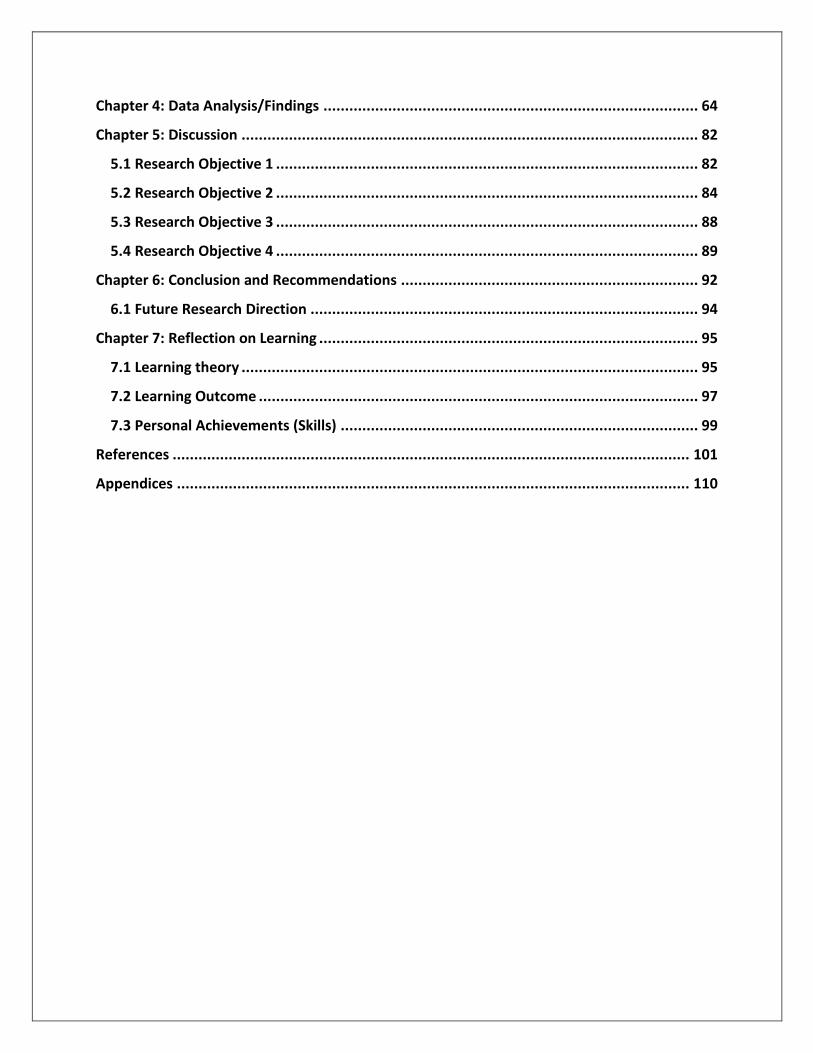
Chapter 4: Data Analysis/Findings ....................................................................................... 64
Chapter 5: Discussion .......................................................................................................... 82
5.1 Research Objective 1 .................................................................................................. 82
5.2 Research Objective 2 .................................................................................................. 84
5.3 Research Objective 3 .................................................................................................. 88
5.4 Research Objective 4 .................................................................................................. 89
Chapter 6: Conclusion and Recommendations ..................................................................... 92
6.1 Future Research Direction .......................................................................................... 94
Chapter 7: Reflection on Learning ........................................................................................ 95
7.1 Learning theory .......................................................................................................... 95
7.2 Learning Outcome ...................................................................................................... 97
7.3 Personal Achievements (Skills) ................................................................................... 99
References ........................................................................................................................ 101
Appendices ....................................................................................................................... 110

Table of Figures
Fig 1: India internet users and penetration..................................................................... 13
Fig 2: Time spent on the internet...................................................................................15
Fig 3: N-REL framework for SMM...................................................................................17
Fig 4: Social network penetration in India........................................................................22
Fig 5: Facebook users in India.........................................................................................23
Fig 6: Goal to reach large number of audience..................................................................27
Fig 7: Facebook demographics........................................................................................28
Fig 8: Annoying actions brands take on Social Media........................................................28
Fig 9: Facebook global engagement................................................................................30
Fig 10: Nescafe............................................................................................................32
Fig 11: Brand Resonance Pyramid...................................................................................34
Fig 12: PESO media model............................................................................................38
Fig 13: The Linear Model......................................................................................... .....40
Fig 14: Easy-to-convince consumer model........................................................................40
Fig 15: The research onion...................................................................................... .......44
Fig 16: Deductive Vs. Inductive approach.........................................................................46
Fig 17: How often do you see Nescafe ads on your Fb page? Q1..........................................60
Fig 18: Do you find Nescafe post up to date on Nescafe Facebook Page? Q2........................60
Fig 19: Are the numbers of likes, a sign of quality posts for you? Q3....................................61
Fig 20: Would Nescafe Fb brand page influence your buying decisions? Q4...........................62
Fig 21: What words come to mind when you think of Nescafe? Q5.......................................63
Fig 23: How would you consider Nescafe? Q6....................................................................64
Fig 24: How likely are you to recommend Nescafe to a friend or colleague? Q7.....................65

Fig 25: Do you interact on Nescafe Fb Brand Page? Q8......................................................66
Fig 26: How do you interact with Nescafe on Nescafe Fb Brand Page? Q9..............................66
Fig 27: What type of Nescafe posts are you most likely to share? Q10..................................67
Fig 28: How often are you sharing Nescafe posts? Q11......................................................68
Fig 29: How satisfied are you with Nescafe ads on Fb? Q12................................................69
Fig 30: Do you receive Nescafe social ads on your private Fb page? Q13..............................69
Fig 31: How satisfied are you with the regularity of posting Nescafe ads on Facebook?.........70
Fig 32: Do you feel attached with Nescafe when they are interacting with you on Facebook?
Q15............................................................................................................................71
Fig 33: From your point of view, how important is the quality of the ad? Q16.......................72
Fig 34: Which of the following do you rather liked in Nescafe ads? Q17...............................73
Fig 35: Have you ever suggested something to Nescafe through Facebook? Q18...................73
Fig 36: What main reason will make you to follow Nescafe Fb Page? Q19.............................74
Fig 37: Overall, how satisfied are you with Nescafe? Q20...................................................75
Fig 38: Kolb's experiential learning style...........................................................................92

Chapter 1: Introduction
1.1 Research Background
In today’s 21th century, technologies are becoming a much bigger importance. In people's
Everyday life lots of things are controlled with the help of technologies (Alalwan, Rana,
Algharabat and Tarhini, 2016). In the Indian context, utilization of social media platforms has
grown exponentially, and this idea can be supported by the fact that internet users in India has
crossed 302 million as on Dec 2017. (Ken Research, 2017). Social media giants consider India as
a large lucrative market because the active number of social media user is approximately 106
million. India ranks as one of the top 3 countries where number of Facebook users are over 100
million (Ken Research, 2016).Advancement in information and communication technology in
India has transformed the marketing model. Instead of having a sales maximisation approach,
businesses are increasingly adopting a more personalised and client focused marketing
approach with the aid of digital media. A large (81%) of the marketers consider Facebook as
the most potent platform for promoting and marketing their brands closely followed by Twitter
and YouTube. (Ken Research, 2017).
Worldwide there are more than 1.5 million brand pages and the number is still growing every
day (Jeanjean, 2017). Every second social media user is following a brand (Van Belleghem,
Eenhuizen and Vers, 2016). Because of these facts it is not wondering that companies and
organizations using social media platforms to attract new users who can be potential customers
(Luarn, Lin and Chiu, 2015). The communication effect of Facebook brand pages with a wide
range of users is a chance for organisations and a big possibility to become more popular and
successful. For managers of all kind of companies this is a big challenge (Vries, Gensler and
Leeflang, 2012). With help of social media and technology market dynamics are changing. They

can threaten competitive positions of companies and influence their sales increase. (Alalwan et.
al., 2016).
Recent years Customer engagement and retention is a big challenge for organizations, as,
marketing practices of firms are influenced dramatically due to social media emergence and
conventional marketing practices are no more highly influential (Fournier & Avery, 2011;
Hennig-Thurau, Hofacker, & Bloching, 2013). It is very crucial for firms now to update and
understand the social media marketing (Hennig-Thurau et al., 2013). Social media awareness
and engagement has augmented the marketing efforts, as social media connections are
affecting the purchase decisions of the customers. So, the engagement of customers on online
social media has opened a point of interest and concern for marketers (Hoffman & Fodor,
2010). Businesses really are waking up to the fact that solid longterm customer relationships
are the most valuable assets they have. To understand their customers, organizations are using
more sophisticated and powerful technologies to solute the problems, building engagement
while managing customer experience. Customer experiences drive the overall brand/firm
success and failure through online social media connection (Aggarwal, 2004; Li et al., 2006).
1.2 Aims for the Proposed Research
A research aim and objective is considered to be most important aspect of the research which
provides direction to investigate the variables under the study.
This research will focus on Nescafe in India, a product of Nestle India Ltd.
A. Aim:

The aim of this research is to explore that how Facebook advertising is part of the trust
building relationship between the consumer and a Nestle India Ltd.
B. Objective:
The research objectives are as follows:
Research Objective 1: To analyze how Nescafe optimizes facebook platform to engage Indian
customers.
Research Objective 2: To evaluate the gap between brand identity and brand image in India for
Nescafe.
Research Objective 3: To identify the consumer action response on the Nescafe Fb brand page.
Research Objective 4: Examine how Facebook users engage with Nescafe social ads on their
private Facebook account?
C. Research Question:
In an era of ubiquitous advertising what aspects of Facebook advertising are important to
engage customers and build trust among Indian customers for Nescafe.
1.3 Significance of the study
As advertising on Facebook is a rapidly growing trend within social media marketing. It is
considered by many businesses as a cost-effective strategy to employ when communicating
with consumers (Nelson-Field et al., 2012), consequently the Facebook platform provides
benefits to both consumers and businesses. This study provides way that how Facebook
advertisements engage consumers. As, Customers are becoming more and more a value

creator and not only a receiver. The most important factor which influences the behavior of
consumers towards firm, brand and product posts on Facebook is the content. Consumers are
more addressed with posts which were not just commercial and which include emotional parts.
Multisensory and interactive posts which contain photos are most likely to receive any kind of
feedback, as likes, comments and shares.
Secondly, the most important significance of this study is to understand the gap between brand
identity and brand image of Nescafe. Now a day, company faces a challenge when trying to
build a brand is to make sure that its identity matches its image as closely as possible. A
negative gap between brand identity and brand image means a company is out of touch
with market sentiment, which can make offering services or products more difficult and can
even result in a loss of value on the company’s books. This study will be beneficial for the
scholars and researcher in the future to provide new ideas with respect to Facebook
advertising.
1.4 Company Overview (Nestle India Ltd)
NESTLE India is a subsidiary of NESTLE S.A. of Switzerland. Nestle is the largest food and
beverage company in the world. It has more than 2000 brands ranging from global icons to
local favourites, and present in 191 countries around the world. Nestle is one of the biggest
fast-moving consumer goods (FMCG) company in India with 10 billion turnover in 2017. The
FMCG industry is the fourth largest sector in the Indian economy. NESTLE has been a partner in
India's growth for over a century now and has built a very special relationship of trust and
commitment with the people of India. Nestle India Ltd that sells multiple brands like NESCAFE,
BAR-ONE, MILKYBAR, KIT KAT, MILKMAID, MAGGI, and NESTEA from last more than 100 years.

1.5 Nescafe
Nescafe, a leader and pioneering brand of instant coffee owned by Nestle. Over the past 80
years, Nescafe has grown on the commitment to a promise- to maximize the enjoyment and
ease of preparing a cup of coffee. Out of the 10 billion revenue of Nestle, 14% comes from
Nescafe which is a flagship brand. Nescafe supported by a pipeline full of breakthrough
innovation and a strong commitment towards enhancing the coffee experience for their
consumers. The world’s leading coffee brand ‘Nescafe’ has been sold in more than 182
countries across the globe. Nescafe with a 37 rank has become one of the most popular global
brands (Interbrand, 2018). Nescafe has 37M followers on its Facebook brand page, India. Its
longevity has been built on connecting with new customers and on earning and retaining their
trust.
1.6 Research Limitation
The first limitation will be the limited number of respondents. The research population is much
targeted and questionnaires for the quantitative part have been sent to a highly specific
sample. The result of the survey up to some extent depends on the mood of the respondents at
the time when they were filling the questionnaire. In addition, the researcher did not have
access to all the scholarly articles because some articles are paid and they were expensive to
buy. Getting information about the company is troublesome in light of the fact that it is
confidential.
Because of a limited time which is 3 months the research is strictly quantitative. There was
insufficient time to engage in any qualitative analysis. If the researcher was given more time,

then both qualitative and quantitative data would have been utilized in a complementing
manner.
1.7 Dissertation roadmap
The dissertation has been organized into seven main chapters including learner’s reflections.
The dissertation roadmap below summarises the purpose of every chapter.
Chapter 1: Introduction
This chapter provides a background to the social media, facebook advertisement and customer
engagement through Facebook advertisements in India. The overall aim, objectives are also
discussed in this chapter. It also covered the research background, the significance of the
research, and the company Nestle. Additionally, the research limitation is explored in this
chapter.
Chapter 2: The Literature Review
This chapter illustrates digital marketing in India, Social Media Marketing and its trends,
Facebook Marketing and its strategies, Brand image, Brand identity, Nescafe Facebook
strategies, and Online customer decision journey. Additionally, this chapter will demonstrate
the application of these different models in the marketplace, critically reviewing the impact of
each approach. Furthermore, the chapter explores the different model of online customer
decision journey. For this chapter, the researcher has read previous research papers, books,
articles, and blogs.
Chapter 3: Research Methodology and Methods
In this chapter, research methodology and methods will be outlined and discussed.
Additionally, the process that led to the selection of a quantitative method for the research is
explained. The details of quantitative data collection to the research will also be presented in
this section.
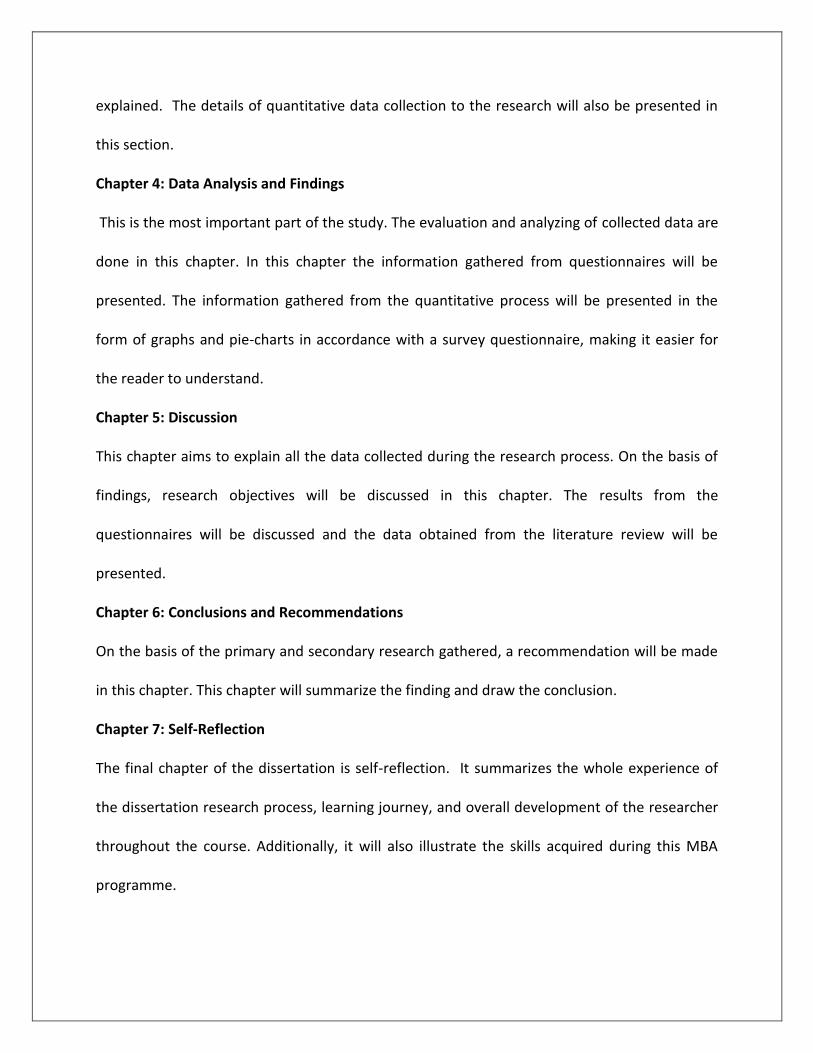
Chapter 4: Data Analysis and Findings
This is the most important part of the study. The evaluation and analyzing of collected data are
done in this chapter. In this chapter the information gathered from questionnaires will be
presented. The information gathered from the quantitative process will be presented in the
form of graphs and pie-charts in accordance with a survey questionnaire, making it easier for
the reader to understand.
Chapter 5: Discussion
This chapter aims to explain all the data collected during the research process. On the basis of
findings, research objectives will be discussed in this chapter. The results from the
questionnaires will be discussed and the data obtained from the literature review will be
presented.
Chapter 6: Conclusions and Recommendations
On the basis of the primary and secondary research gathered, a recommendation will be made
in this chapter. This chapter will summarize the finding and draw the conclusion.
Chapter 7: Self-Reflection
The final chapter of the dissertation is self-reflection. It summarizes the whole experience of
the dissertation research process, learning journey, and overall development of the researcher
throughout the course. Additionally, it will also illustrate the skills acquired during this MBA
programme.

Chapter 2: Literature Review
2.1 Introduction
With the world rapidly shifting from analogue to the digital world, the digital marketing world in
India becoming one of the vital aspects in the business industry. People are becoming more and
more consumers of the digital world through devices such as laptops, Smartphone, tablets and
other data generating devices. These digitized consumers are the inspiration behind the
companies digitizing their marketing and business strategies. So in order to get a deep outline
of the topic, numerous sources have been utilized in this literature review. This chapter of
literature review will address the academic theories by past researchers so as to formulate the
research objectives and research questions. This chapter is again divided into five sections. The
first section addresses the emergence of Digital marketing in India. The second section focuses
entirely on social media marketing in India and its strategies. The third section will focus on
Facebook marketing and its strategies in today’s world. The fourth section will concentrate on
the Nescafe India, brand image and brand identity. The last chapter plays a fundamental part in
perceiving the online consumer decision journey.
2.2 Digital Marketing
The digital world is an ever-growing source of leisure, news social interaction, as well as
consumers. Consumers are now uncovered not just to what the business says about the
product however what the media, relatives, friends, etc., are saying. Additionally, the
customers are further probable to trust them. People need a product they will trust, companies
that apprehend them, personalized communications and relevant offers changed to their needs
and preferences (Bird, 2007). The digitalization becomes a part of our day by day schedules and

is transforming the conventional ways by which buyers and business connect with each other
(Chanda et al., 2018).
Digital marketing is a term used to depict the integrated marketing services used to attract,
engage and convert customers online. Digital marketing uses different channels such as content
marketing, influencer marketing, SEO (Search Engine Optimization), social media and online
advertising to help brands connect with customers and uncover the performance of marketing
programs progressively(Oden L., 2017).The main elements of digital marketing includes: Online
advertising, Email Marketing ,Social Media, Text Messaging , Affiliate Marketing, Search Engine
Optimization (SEO) and Pay Per Click (PPC).
2.2.1 Digital Marketing in India
India is emerging as one of the fastest developing economies on the global landscape. Digital
Marketing started to get visible around 2010 in India. With the entrance of e-Commerce players
like Snapdeal & Flipkart, the digital marketing arena began to pick. The opportunities for growth
of businesses are incredible, specifically for digital marketing. It isn’t only an assumption that in
the coming years, digital marketers will be enormous in demand, but an analysis that is entirely
based on facts. The emergence of digital marketing in the marketing strategies of businesses is
quite recent and primarily focused on acquiring more customers (Octane Research, 2017). The
survey by Times Internet and DMAasia reveals that even though the medium of marketing has
turned digital, the three basic principles of a successful marketing campaign remain the same.
These principles range are engagement with Customer, leading the market through ideas and
the obtaining appropriate Returns on Investment (ROI).
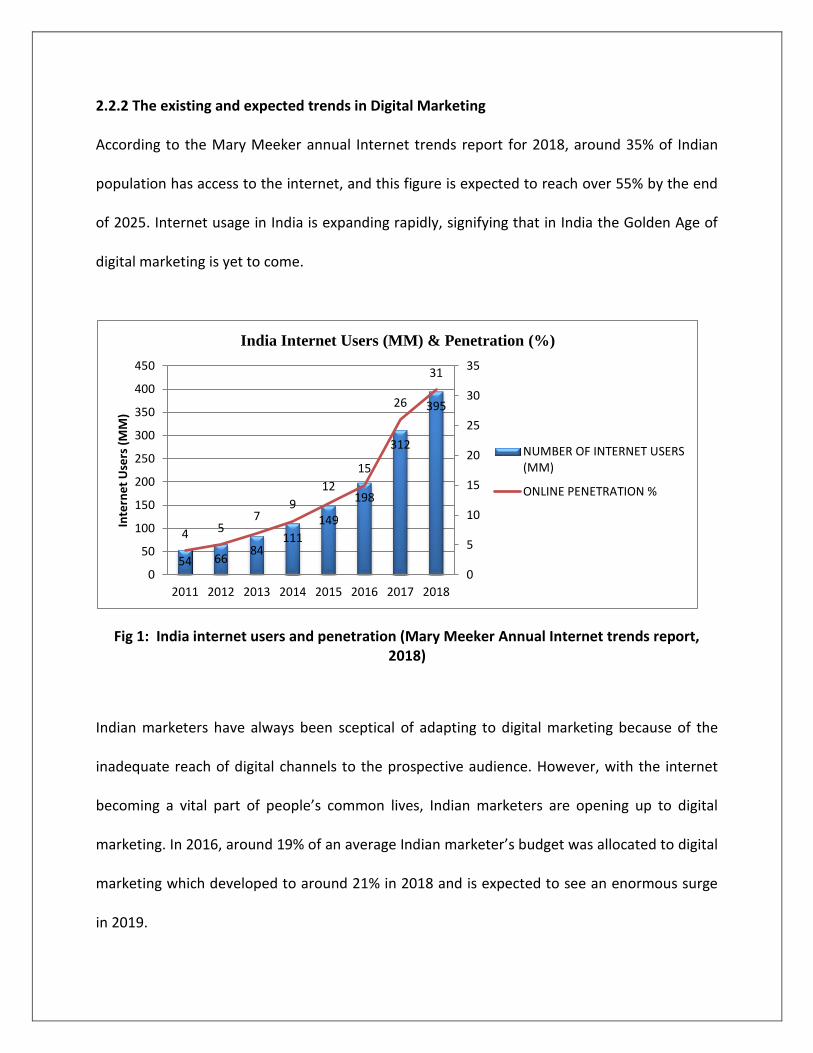
2.2.2 The existing and expected trends in Digital Marketing
According to the Mary Meeker annual Internet trends report for 2018, around 35% of Indian
population has access to the internet, and this figure is expected to reach over 55% by the end
of 2025. Internet usage in India is expanding rapidly, signifying that in India the Golden Age of
digital marketing is yet to come.
Fig 1: India internet users and penetration (Mary Meeker Annual Internet trends report, 2018)
Indian marketers have always been sceptical of adapting to digital marketing because of the
inadequate reach of digital channels to the prospective audience. However, with the internet
becoming a vital part of people’s common lives, Indian marketers are opening up to digital
marketing. In 2016, around 19% of an average Indian marketer’s budget was allocated to digital
marketing which developed to around 21% in 2018 and is expected to see an enormous surge
in 2019.
54 6684
111
149
198
312
395
4 57
9
12
15
26
31
0
5
10
15
20
25
30
35
0
50
100
150
200
250
300
350
400
450
2011 2012 2013 2014 2015 2016 2017 2018
Inte
rne
t U
sers
(M
M)
India Internet Users (MM) & Penetration (%)
NUMBER OF INTERNET USERS(MM)
ONLINE PENETRATION %
2.3 Social Media Marketing in India
Social media marketing, or SMM, is a form of internet marketing which includes creating and
sharing content on social media networks in order to accomplish your marketing and branding
goals. Social media marketing includes activities like videos, posting text and image updates,
and other content that drives audience engagement, as well as paid social media advertising
(Van den Bulte & Wuyts, 2014).
Social media has revolutionized the people communicate and share information in today’s
society and is used by millions of people. The largest social media websites attract over 1
million visitors monthly. It is estimated that 17% of the total India internet time is now spent on
social marketing websites. Social media now reach one of every four persons worldwide
(eMarketer, 2017). Currently, marketers invest 22% of all marketing communications to digital
media and this percentage is expected to grow to 27% by 2019 (Hernandez, 2014; Vranica,
2016).
2.3.1 Time spent on Social Media
Indian’s are one of the leading nations when it comes to the time spent on social media, says a
research report from Techinasia.com.

Fig 2: Time spent on the internet (Techinasia.com, 2017)
Indians spend around 4.4 hours in a day on the internet through their laptop/desktops and 3.1
hours through their cell phones. With such a lot of time being spent on the internet, it turns
into a huge platform for using digital marketing. Many brands are shifting their marketing
budgets towards digital marketing. This shift will undoubtedly happen more in the coming
years. As more and more companies/brands work towards digital marketing, the industry is
bound to grow at a significant rate.
2.3.2 Social Media Marketing Strategy
Social Media Marketing Strategy (SMMS) is an integrated means and set of actions by which an
organization or company expects to achieve its marketing objectives and meet the
requirements of its target market through the utilization of social media tools and capabilities
(Gil-Or, 2010; Palmer & Koenig-Lewis, 2013). Basically, SMMS deals with plans and choices
around the firms’ target market, marketing mix, and social media mix. In this sense, social
media marketing strategic actions (SMMA) contains the marketing actions, activities, behaviors

or tactics within the social media mix for a given SMMS. Although social media as tools are
ubiquitous nowadays within marketers’ world, integrating social media into the marketing mix
is yet an issue among brands (Niessing, 2014).
Among the limited available studies related with SMMS, Mergel (2016) classifies social media
tactics based on observed social media adoption in the public service sector. Another example
is the study by Constantinides (2016), who proposes a classification of the role of social media
applications, based on how corporations can use social media as part of their marketing
strategy tools portfolio. His methodology expands on the types of social media applications and
their relation to marketing objectives. In the specific area of SMMS among Small and medium
enterprises (SMEs), Pentina and Koh (2017) explore the emerging patterns and develop a
taxonomy of SMMS in general SMEs dependant on cluster analysis of SMM tool and usage
(reason or objective, employed tactic, and benefit).
N-REL: a framework for SMMS
N-REL (Networking, Representation, Engagement, Listening-in) framework, a comprehensive
framework that explains how companies develop their social media marketing strategic
decision process, and how they translate and deploy their SMM strategy into strategic actions.
N-REL framework has been developed from synthesis of theories, concepts and best practices
on SMM and SMMS literature. This framework enables the mapping of actions to the different
SMMS (i.e., strategic plans, decisions, objectives, etc.) in which the actions are subsumed. The
framework is mainly derived from Constantinides’ (2016; 2017) and Mergel’s (2016)

classifications, as well as Andzulis (2017), Saravanakumar and SuganthaLakshmi (2017), Pentina
and Koh (2016), and Lorenzo-Romero et al. (2017).
SMM strategies and activities allude to decisions on the following three areas:
1. Market segmentation, targeting and positioning.
2. Marketing mix based positioning.
3. Social media mix.
Fig 3: N-REL (Networking, Representation, Engagement, Listening-in) framework for SMM
(Constantinides, 2017)
Following the discussion from the previous section on social media marketing strategy, Fig. 3
depicts the conceptual framework for social media marketing strategies and the categorization
of the corresponding strategic actions. There are three fundamentals implicit allotments of
strategy here. First is the firms’ strategic decisions and planning; second, the tactical plans, or

operationalization of strategy within the social media mix; third, the implementation of
strategic decisions by firms into actions in the form of content creation in different social media
platforms. Firms define their SMM tactics following those decisions and plans on the target
market, marketing mix, and the marketing objectives. In this context, SMM strategies are
activities related to networking goals of the social media mix context- e.g. activities that
encourage discussions about brands or companies and connect firms with their audience. Thus,
SMM strategies incorporate the choice of social media applications or tools. Then, after
planning and decisions, the company can perform their strategic actions in the social media
they choose.
There are three main categories of SMM actions: representation, engagement, and listening-in.
1. Representation: covers social media activities focusing on the delivery of marketing
communications related to the company profile and information about products.
1.1 Public relations: marketing communications aiming to earn public understanding and
acceptance (Hollensen, 2017).
1.2 Promotion and sales: including advertising, sales promotion, and direct marketing for
marketing communication and commercial sales purposes.
2. Engagement: or value-added proposition covers the marketing activities that focus on
interaction with customers, add value for them and generate benefits for the company:
customer-relationship management, one-to-one marketing, customer empowerment,
and personalization of information, customer support, product customization, or
customer loyalty programs (Müller-Lankenau, Wehmeyer, and Klein, 2017). It is further
divided into subtypes of action

2.1 Engaging the online opinion leaders, key influencers, and personalities to influence
customers. For instance, brand engagement with social media personalities or brand
advocates (Constantinides, 2016, 2017).
2.2 Personalizing user/customer experience and allowing for product/service
customization. These activities aim at strengthening ties between customers and
companies by offering users the possibility to personalize their online experiences or
customize their products (Constantinides, 2016, 2017).
2.3 Engaging customers are a part of product/service development and innovation
processes. These actions aim at engaging customers as a source of feedback, creativity
and innovation for product or service development. Another way to incorporate
customer knowledge and creativity is to engage them in product customization.
2.4 Engaging customers in suggestions to take action for participatory promotion. Action
in this category focuses on engaging customers in the promotion process by
participating in competitions, quizzes or contests. One example of this type of actions is
the provision of incentives for customers to share contents about their experiences with
the product or service (Parent, Plangger, & Bal, 2016).
2.5 Engaging with competitors in social media. This type of engagement refers to how
brands and companies intentionally connect with their competitors in social media with
the main goal of, although not limited to, competitive analysis (e.g. Bianchi & Andrews,
2015).
2.6 Customer support. In the social media context, actions within this category aim to
proactively engage customers to post their feedback and concerns in social media

applications related with the pre- or post-sales process (e.g. Andzulis, Panagopoulos, &
Rapp, 2017; Lorenzo-Romero et al., 2015).
3. Listening-in: activities enable a passive way of social media engagement that aims at market
research and intelligence, such as analytics of social media contents and conversations – share
of voice, sentiment, gaps, trends, opportunities, etc. – as well as the identification of relevant
actors and influencers.
3.1 Market intelligence: Market intelligence includes listening-in actions, which aim at
monitoring the voices of customer or audiences. Marketing research is crucial to the selection
of target markets and to the development of a value proposition (Slater & Olson, 2016).
This framework opens the path for the study of the effect of firm/brand-generated content
from marketing actions on consumer behavior. Furthermore, the marketing impact on
consumer behavior induces a feedback loop back into the firm’s marketing strategic decision
process. In this regard, market intelligence actions through social media help gather feedback
and make necessary adjustments to the strategic decisions. As stated earlier, the strategic
decisions of the company, their market segmentation, marketing and positioning, and
marketing mix orientations must drive the various SMM actions of the company in order to
accomplish an effective SMMS that fulfils the marketing goals of the company.
2.4 Facebook Marketing
Facebook is continually growing and showing more and more possibilities through the various
Facilities it promotes. Facebook provides a simple platform that can be accessed from almost
anywhere in the world, to fulfill the social needs of people. It can also be used for organizations
to advertise their products and staying in contact with their customers. The average Facebook

user spends 700 minutes per month online, averaging 130 Facebook friends (Branckaute, 2016).
Facebook took first place for the most viewed site (Clark, 2017); thus it is an everyday
occurrence for users to sign into Facebook. Facebook is the best approach to stay connected
24/7with the ability to sign in through computers, laptops, iPads and mobile devices, and is
considered by many organizations as a cost-effective strategy to utilize when communicating
with customers (Nelson-Field et al., 2017), therefore, the Facebook platform gives advantages
to both customers and organizations. In India, with an undreamt 100 million individuals and a
more regularly visited website than Google, Facebook ensures more than friend requests but
also acts as an excellent marketing tool for businesses. Facebook is an innovation allowing the
nation to publish instantly and economically on the internet. It supports live discussion on a
huge range of topics, with not only friends but businesses and consumers. It enables consumers
to promote their purchases or air their complaints and business owners to receive feedback
about their products or services. Popular Facebook tools through which marketing objectives
can be achieved are:
• Facebook profile: A strong profile of an organization can be established on Facebook with its
vision and mission statement stated and clearly defined.
• Facebook groups: This is the most important aspects that can be used to attract consumers:
the name of the group, the group topic, and a picture of the group.
• Business/Fan pages: Fans will receive updates from the organization as a company can
regularly post information on the business/fan page on upcoming events, articles, games, blogs,
podcasts, videos, and links.
• Sharing events: The organization can advertise their upcoming events on Facebook.
• Social ads and polls: Social ads can be put on Facebook according to the age, sex, location,
workplaces and education level of the users. Polls can likewise be organized on Facebook to
obtain valuable feedback from users.
• Facebook messages can be customized and sent to individual users.
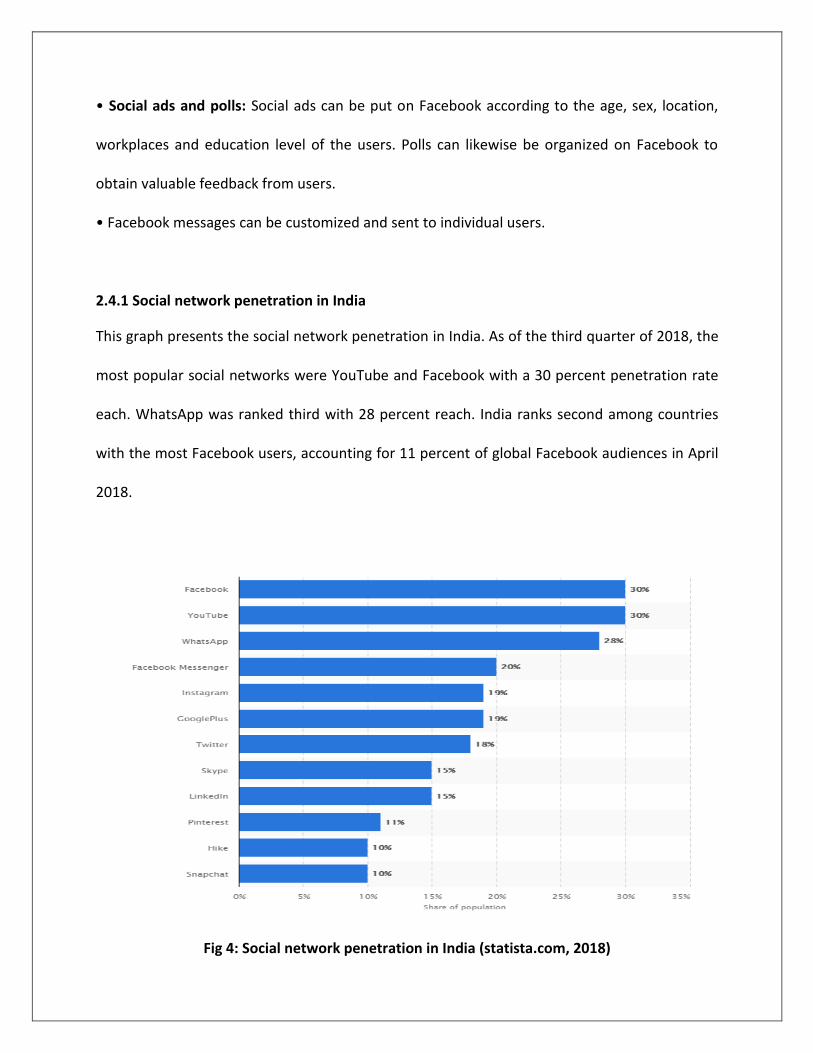
2.4.1 Social network penetration in India
This graph presents the social network penetration in India. As of the third quarter of 2018, the
most popular social networks were YouTube and Facebook with a 30 percent penetration rate
each. WhatsApp was ranked third with 28 percent reach. India ranks second among countries
with the most Facebook users, accounting for 11 percent of global Facebook audiences in April
2018.
Fig 4: Social network penetration in India (statista.com, 2018)

2.4.2 Facebook users in India
According to eMarketer’s social network users forecast 2017, 234.9 million people in India will
log on to Facebook regularly in 2019, equating to 69.9% of social network users and 42.6% of
internet users. eMarketer expects user growth to continue throughout the forecast period,
increasing 20.0% this year. By 2021, 70.1% of social network users in India will access Facebook
at least once per month.
Fig 5: Facebook users in India (emarketer.com, 2017)
2.4.2 Advertising and Facebook
As social networks services are becoming the main platform for social activities, more than 37%
of online advertisements appear on social network sites (Dunay P, & Krueger R, 2017).
Numerous organizations are exploiting the new online tools in order to achieve fast and
efficient information on consumers need and preferences. Indeed, there is a wide dispersion of

advertising messages mediated by social networks. Thanks to the wide number of users, and
above all to the possibility of a simple access to their profile many companies have started to
use Facebook in order to develop new efficient marketing strategies, by creating pages or
groups devoted to their brand (Hemsley S, 2016). For effective social networking advertising,
there are two primary requirements, the first being that links in the social network are focused
to the targeted advertisements. The second requirement is that social information can be easily
incorporated with existing targeting methods to predict response rates (Business week, 2017).
By having an association with Facebook, organizations can access the millions of eyes, wants,
needs and wallets signing on to the Social Network on a daily basis. Advertising through social
media can be one of the most targeted and cheapest forms of advertising. Organizations have
to come to realize that their customers are now to be found in this domain and this
necessitates their becoming comfortable within this space in order to stay relevant. However,
with an ever increasing number of organizations finding this new advertising technique, it will
become harder to cut through and many organizations are fighting to be heard. So although
Social Networking provides a large scope for marketing, the ever-increasing competition makes
obtaining recognition difficult: nonetheless, it can be achieved via the implementation of an
intelligent strategy.
2.4.3 Facebook Targeting
Facebook has come up with a new approach that may make a big difference to banner
advertisements and Click through Rates - targeting. Facebook will allow targeting based on
demographic profiles and interests that users reveal about themselves on their Fb pages. The
more targeting options that are available to a social network, the more probable they are to be

able to get better prices. Targeting can make a huge difference regarding the amount of traffic
they bring to a Facebook. It has tried to make it quite simple to target the desired audience. In
fact, selecting a target audience is focused to the Facebook self-serve platform. People can be
targeted by location, age, relationship status, and interests. The development of Facebook’s
targeted adverts brought a new aspect to Facebook advertising and has changed users’
perception of banner ads, from annoying irrelevant adverts with low click-through rates to
more relevant adverts personalized to each individual's desires. What Facebook has to offer a
business is something that every organization looks for when advertising their products,
personalized marketing.
2.4.4 Benefits from Facebook Marketing
According to Edelman (2017), customers are currently switching to a usage of social networks
and are spending much more time with online marketing than with any other marketing
channel. Facebook allows organizations to connect with many more individuals and much more
often than the companies would be able to approach through phone calls, emails, or meetings
(Luke, 2016). One of the fundamental advantages of social networking for organizations is,
therefore, lower marketing costs in terms of financial and personnel. With the economic
downturn, many organizations are trying to discover ways to reduce spending, and social
networking sites are the way for them to market their businesses and reduce their costs. Costs
of communication have fallen radically with Facebook and other social networking sites,
creating opportunities for organizations to communicate directly, quickly and consistently with
millions of individual customers (Mize, 2016; Palmer & Koenig-Lewis, 2017).

Additionally, the emergence of Facebook as a marketing platform has introduced a new era of
personalized and directed advertising. Facebook advertising has consequently grown in
popularity. Yang et al. (2016) reported that the onset of targeting ads, specifically toward
demographics (age, sex, education, and so on), and tighter restrictions on ad quality has turned
Facebook advertising into a viable traffic builder and advertising option for small and large
organizations. Because of its high number of active users as well as the level of each user’s
activity on this social networking website, Facebook is considered an appealing platform for
Internet marketing specialists and online advertisers (Francisco, 2017). From a financial point of
view, Facebook offers a thorough and competitive tariff system, charging
advertisers for a per-click or a per-impression model.
2.4.5 Concerns and Risks Associated with Facebook Marketing
The concept of social ads has improved the importance of marketing by exploring the links
among Facebook users (Goldenberg et al., 2014; Janusz, 2016; Treadaway & Smith, 2017).
(O’Malley Palmer & Koenig-Lewis, 2009) indicated that according to one research, 62% of
Generation Y users have accessed a brand or fan community on Facebook, and 49% have joined
in a community where they can usually check for releases, sale promotions, and opinions.
However, the same research showed that only 21% checked ads and 37% never checked any
ads. In fact, individuals use Facebook to socialize and rarely think about buying something when
they log into their Facebook account. Organizations might create a group page where they can
arrange a direct connection with a community of people linked by one common interest.
However, according to (Croft, 2014; Hitwise, 2016; Palmer & Koenig-Lewis, 2017), community
members feel a sense of ownership among the community, and they might refuse companies

to invade their own space. Indeed, Eley and Tilley (2016) suggested that users value privacy and
fear social networking sites can reveal those attributes, which are to be shared with selected
friends and not with the larger online community. Alternatively, a study conducted by Fogel and
Nehmad (2017) indicated that users were greater risk takers than those who did not participate
in social networking.
2.4.6 Facebook Strategies
Facebook marketing strategy has to be unique. There’s an ocean of potential customers
organizations can reach on Facebook. According to Sproutsocial, Facebook strategies are as
follows:
1. Reach out to a large number of audiences
Building campaigns on Facebook, adjust perfectly into the inbound marketing. Whether trying to
attract brand new audiences at the top of the funnel, engage them in the middle or convert them
at the bottom, Facebook Ads can, and should, be utilized with an inbound marketing perspective.
The main goal is to reach out to a large number of audiences. TOF (Top of funnel), MOF (Middle
of funnel) and BOF (Bottom of funnel).

Fig 6: Goal to reach large number of audience (Sproutsocial.com, 2018)
2. Study the Facebook Demographics
Demographics are key to any marketing strategy. On Facebook, nearly 2.15 billion people
scrolling through their feeds every day, so it’s important to know whom the organization needs
to reach and how. As the graph represents the number of Facebook users across India as of
January 2018, broken down by age and gender. The highest numbers of male and female
Facebook users during the measured period were between 18 and 24 years old and amounted
to about 73.8 million and 23.4 million.
Fig 7: Facebook demographics (Sproutsocial.com, 2018)
3. Choose & Schedule the Facebook Content

With Facebook Stories, Live, image and videos posts, the brand’s content strategy has endless
opportunities. It’s about the quality of content and what the audience should come to expect
from the Facebook Business Page.
Fig 8: Annoying actions brands take on Social Media (Sproutsocial.com, 2018)
4. Determine the Facebook Ads Strategy
On Facebook, there are more than 4 million advertisers with just an average click-through rate
of 1.9%. Organizations are effectively building the brand and showcase it perfectly with ads.
5. Aim for Higher Brand Awareness
Facebook ad campaigns are focused on two things:
1. Cost Effective
2. Relevant
Facebook ad has to be relevant. At first, organizations see what works best to build awareness.
However, relevance is crucial toward great Facebook ads.
6. Engage with the Audience

Facebook is built as a network to converse, discuss and share content. Organizations don’t wait
for audience to interact first.
7. Post at the Best Time on Facebook
Facebook is one of the most difficult social networks to use for organic content. Again,
algorithms make it a challenge for organizations trying to find optimal posting times.
• Noon and 2 p.m. on Wednesday and 1 to 2 p.m. on Thursday are highly engaged times
on Facebook.
• Saturday is the minimum engaged day of the week.
• Thursday is the highly recommended day to post
• The minimum recommended times include early mornings and late nights.
Fig 9: Facebook global engagement (Sproutsocial.com, 2018)

8. Track & Analyze Your Facebook Marketing Strategy
A successful Facebook marketing strategy needs to be analyzed regularly.
2.5 Nescafe
Nescafe, a leader and pioneering brand of instant coffee owned by Nestle. Over the past 80
years, Nescafe has grown on the commitment to a promise- to maximize the enjoyment and
ease of preparing a cup of coffee. Of the 10 billion revenue from Nestle India, its 14% comes
from Nescafe which is a flagship brand. Nescafe supported by a pipeline full of breakthrough
innovation and a strong commitment towards enhancing the coffee experience for their
consumers. The world’s leading coffee brand ‘Nescafe’ has been sold in more than 182
countries across the globe. Nescafe with a 37 rank has become one of the most popular global
brands (Interbrand, 2018). Its longevity has been built on connecting with new customers and
on earning and retaining their trust.
Nescafe’s brand profile
Mission: Nescafe is dedicated to making great tasting coffees to enjoy every day.
Slogan: “It all starts with a Nescafe” which highlights the opportunities that can be triggered by
or around a cup of Nescafe.
Nescafe Positioning: “1 coffee cup, 1 good feeling”
Nescafe has positioned itself as a product differentiator to gain competitive Advantage. The
superior value and satisfaction that Nescafe customer gets from high-quality beans and aroma
is its image differentiating strategy.

2.5.1 Brand Identity
Brand identity is a way company aims to identify or position itself or its product or service in the
minds of the consumer. A brand identity stems from a company’s mission, brand value
proposition, long-term goals, competitive position on the market, and relevance to the values
and interests of the target audience. The aim of providing brands with identities is to get
customers to like them and see them as being unique in some way. By doing so, branding will
succeed in generating the desired brand image. Although the image is important, it is an
identity that should drive the brand. The identity and personality of the brand give its
consistency and longevity.
However, there is a real danger in assuming that the image marketers want customers for the
brand will be the same as the identity marketers trying to project as this might not always be
the case. This difference between identity and image is called ‘Perception Gap’. So companies
take utmost care when building a brand to ensure that the brand image matches its identity.
Nescafe has its identity campaign (“It all starts with a Nescafe”), and brand visual identity
“REDvolution”, globally in the year 2014. The focus of REDvolution (red mug) was to give the
brand a modern twist especially in the online arena. The REDvolution campaign had the
purpose of gaining more Nescafe fans among the younger crowd. Nescafe focused on the
emotional aspect of their instant coffee in their marketing efforts. For example

Fig 10: Nescafe (Nestle.in)
2.5.2 Brand Image
Brand image is the way the consumer actually perceives the visual and verbal expressions of a
brand, which leads to the psychological or emotional associations that a brand aspires to
maintain in the mind of the consumer. Keller (1993) defined a brand image as “Perceptions
about a brand as reflected by the brand associations held in consumer memory.” The better the
brand image, the more positive the attitude toward the branded product and its characteristics.
The brand image helps a consumer in recognizing his/her needs and wants regarding the brand
and distinguishes the brand from other competitors.
Nescafe has a strong brand history, having been established in India for more than 70 years.
The association Nescafe shares with its parent company Nestle and its diversity of coffee
products of different flavors also strengthen its image as a truly international brand. The
continuous use of the brand logo and its signature red mug since its introduction creates a
sense of timelessness. Nescafe pitches itself as a brand for the Everyman who enjoys
connecting with people. The brand radiates a sincere and comforting “coffee-next-door” image,
as a companion for all the moments.

In order to build a strong brand image for Nescafe, marketers has shape how customers think
and feel about the brand. They build the right type of experiences around the brand so that
customers have specific, positive thoughts, feelings, beliefs, opinions and perceptions about it.
So to build a strong brand, Keller Brand resonance pyramid comes in a role.
2.5.3 The brand resonance pyramid
The customer-based brand equity (CBBE) model has been extended to address more specifically
how brands should be built in terms of consumer knowledge structures (Keller 2001). The
brand resonance model also views the brand building as an ascending, sequential series of
steps, from bottom to top. The steps are as below:
1. Ensuring identification of the brand with customers and an association of the brand in
customers’ minds with a specific product class or need.
2. Establishing the totality of brand meaning in the minds of customers by linking a host of
tangible and intangible brand associations
3. Eliciting the proper customer responses in terms of brand-related judgment and feelings
4. Converting customers’ brand response to create an intense, active loyalty relationship
between customers and the brand.

Fig 11: Brand Resonance Pyramid (Keller k. L., 2001)
According to the Brand Resonance Pyramid, incorporating the four steps involves establishing
six “brand building blocks” with customers. These brand building blocks can be assembled in
terms of a brand pyramid. The model emphasises the duality of brands—the stages of brand
building is the left-hand side of the pyramid, whereas the emotional route is the right-hand
side. The creation of significant brand equity requires reaching the top of the brand resonance
pyramid, which occurs only if the right building blocks that is; emotional routes are put into
place.
1. Brand salience is how easily and often customers think of the brand under various
purchase. Nescafe resonates strongly and clearly among consumers, who specifically
identify the brand as an instant coffee brand.
2. Brand performance is how well the product or service meets customers’ functional
needs. Nescafe is dedicated to producing quality coffee that can be enjoyed anytime, by

anyone. Nescafe products can be found almost anywhere in India, at supermarkets,
convenience stores, school canteens, and vending machines. Nescafe makes quality
coffee affordable for everyone.
3. Brand imagery depicts the extrinsic properties of the product or service, including the
ways in which the brand endeavours to meet customers’ psychological or social needs.
Nescafe pitches itself as a brand for every customer who enjoys connecting with people.
4. Brand judgments focus on customers’ own opinions and evaluations.
5. Brand feelings are customers’ emotional responses and reactions regarding the brand.
6. Brand resonance refers to the nature of the relationship customers have with the brand
and the extent to which they feel they’re ‘in sync’ with the brand.
2.5.4 Nescafe Social media marketing strategy in India
The core essence of Nescafe’s social media communication is about cementing its position as
the drink that gets consumer started in the morning. Their tagline “It all starts with a Nescafe”
is the foundation of their social media updates. Digital media offers a number of streams for
Nestle to market Nescafe. These various platforms also help Nescafe to meet a number of
marketing objectives, right from creating awareness and brand building to driving conversions
and cultivating brand loyalty.
1. Build strong communities through content marketing
Nestle is creating user-centric content that brings actual value to consumers’ lives. Nescafe by
creating informative content like friendship, Chasing your dreams and morning coffee drive
conversation among your consumers and build strong communities result into the loyal
customer base.
2. Strengthen digital presence through social media
Facebook is one of the biggest avenues for digital marketing. Nescafe has also used Facebook to
get deeper insights into consumer behavior. Nescafe India Facebook fan page has 37 M
followers. However, the consumers aren’t using only Facebook. Digital marketing for Nescafe
has integrated over various channels to have the maximum impact. This includes ads which play
before a Youtube video, Instagram posts, promotions through Twitter, and much more.
3. Facebook Posts
Nescafe maintains an active Facebook profile, with creative posts based on friendship, morning
coffee, and relationships that attract a large number of comments and shares. Nescafe has 37M
followers on its Fb page. Nescafe also has a very large, vibrant community on Facebook who
engages with the brand by writing reviews on their page and interacting with their posts. The
Nescafe used Facebook video ads to drive awareness and sales of Nescafe 3 in 1 amongst young
adults in India, resulting in a 14% higher sales uplift than TV (Facebook Business, 2017).
4. Consistently engage with an audience to encourage brand loyalty of Nescafe
Nestle always aimed towards establishing Nescafe as a constant presence in the consumers’
lives. Through shareable content, helpful information and meaningful interaction, Nescafe
continue to stay relevant at all times. This helps consumer’s recall Nescafe at the time of
making a purchase decision.
5. Widen consumer base through Influencer Marketing
Influencer marketing is proving to be one of the most important digital marketing trends for
Nescafe. Through the use of influencers, Nescafe taps into their huge number of followers and
increase consumer awareness of your products.

2.5.5. PESO Media Model
PESO (Paid, Earned, Shared, and Owned media) is a useful tool for planning how an
organization uses different forms of media to achieve its goals and execute an integrated
campaign.
1. Paid Media
It describes promotional content a company creates but is distributed or promoted by another
person, commonly to an audience the other party owns.
2. Earned Media
Word-of-mouth marketing, customer-submitted reviews, and posts about the brand are all
examples of earned media. Earned media is content about the business that others created and
distributed. Earned media can be measured in mentions (Likes) or share of voice. Example:
Nescafe Post on Nescafe Fb fan page “Start big by dreaming big and stay started with the fuel to
chase the dreams” got 24,000 likes and 13,000 shares.
3. Shared Media
When Nescafe post on Facebook, Pinterest, or similar, they are sharing content. Shared media
describes content which the business creates that is distributed to an audience and Nescafe
business developed via a platform that someone else owns or controls. Shared media is
measured by the number of followers on that fan page.
4. Owned Media
Nescafe blog is one of the most common examples of owned media. Nestle creates Nescafe
blog, controls the platform on which the posts and videos are published, and builds the
audience who will see the posts and videos. Owned media is measured by site traffic.

Fig 12: PESO media model (Spin Sucks.com, 2016)
2.6 The Online Consumer Decision Journey
The consumer decision journey has developed from the beginning of brand building. To
successfully build brands today, marketers should have a strong understanding of the new way
to purchase. The digital brand ecosystem and the sheer volume of behavioral insight data
available have changed things dramatically. A consumer decision journey map provides a visual
representation of the audience, what they need and where they are in relation to making a final
purchase. Additionally, it breaks down what content or information they need and what moves
them to the next stage of the journey. A buyer’s journey can usually be broken down into a few
basic stages.

The first stage is awareness. At this stage, potential customers are looking at their options and
surveying what could potentially solve their problem or fulfill their needs. The next stage is
consideration. At this stage, consumers are considering and comparing a bunch of potential
products or services. Finally, there is a decision stage. It is also where the potential consumer
makes a decision to purchase. These stages are the core of the consumer’s journey. Here is an
in-depth look at two effective online consumer decision journey maps that should be able to
meet any business’ needs.
2.6.1. The Linear Model
The linear consumer journey model divided into five stages: awareness, consideration,
purchase, service, and loyalty with relevant content ideas distributed across the path. The
map highlights touchpoints, which are specific elements of the customer’s interaction with
a business. What’s helpful about this visualization is the differentiation given between
physical versus digital touchpoints and unmanaged versus managed touchpoints. Every day,
people form impressions of brands from touch points, for example, advertisements,
conversations with family and friends, news reports, and product experiences. The
expansion of media and products requires marketers to discover new approaches to get
their brands included in the initial-consideration-set that consumers develop as they begin
their decision journey.
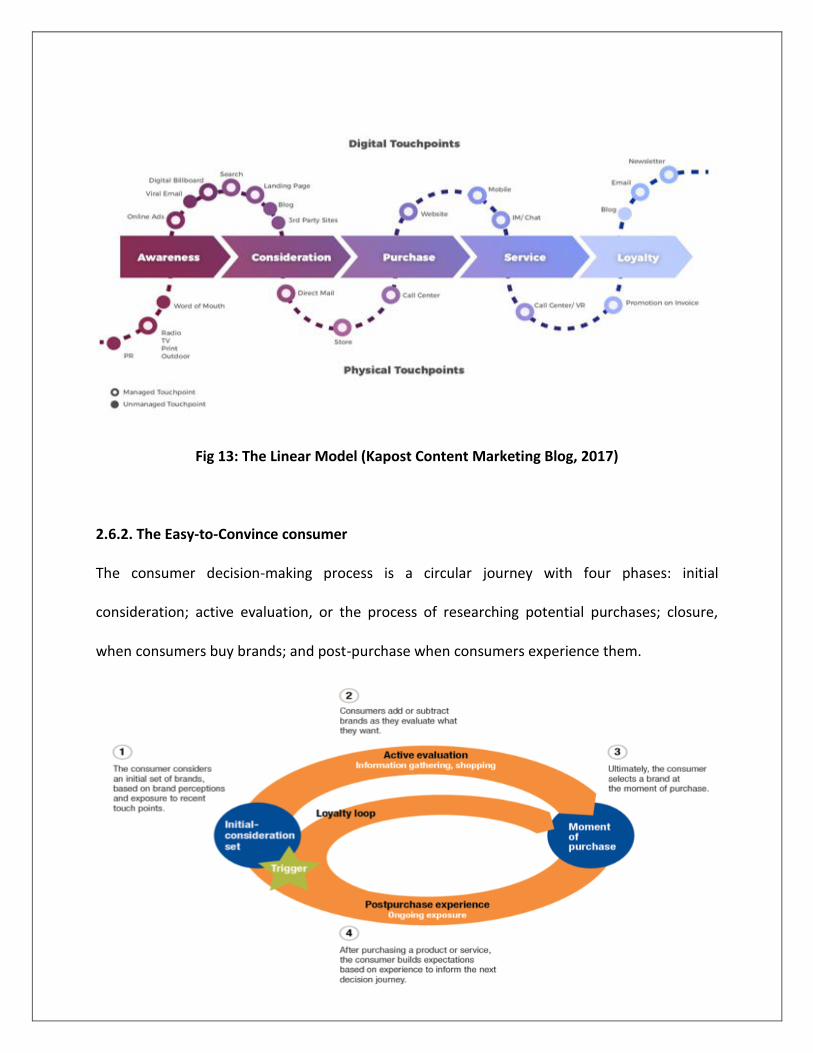
Fig 13: The Linear Model (Kapost Content Marketing Blog, 2017)
2.6.2. The Easy-to-Convince consumer
The consumer decision-making process is a circular journey with four phases: initial
consideration; active evaluation, or the process of researching potential purchases; closure,
when consumers buy brands; and post-purchase when consumers experience them.

Fig 14: Easy-to-convince consumer model (Court David, 2009)
The consumer decision journey contains four steps:
1. In an initial consideration set, the consumer considers an initial set of brands based on brand
perceptions and exposure to recent touch points.
2. The consumer participates in active evaluation where they add or subtract brands as they
evaluate what they want.
3. It involves the moment of purchase where the consumer selects a brand.
4. The consumer evaluates his/her post-purchase experience, the consumer builds expectations
base on experience to inform the next decision journey.
Lastly, if the post-purchase experience is positive then the brand has done its job and has a
potential for the consumer to enter the loyalty loop. The loyalty loop is what marketers strive
for, so they can make lifetime value from a specific consumer. Once loyalty is achieved it sends
the customer back around the circular model, where they end up back at step three which is the
moment of purchase. It’s a continuous process around the circular model.
2.7. Conclusion
The literature review offers several valuable contributions to the literature on digital
engagement and social media advertising. People advance theory on digital engagement by
giving insight into engagement with social media platforms (Facebook, Twitter, YouTube,
LinkedIn, Instagram, etc). Initially, Facebook ads interfered with the content experience and
were regarded to be essentially ineffective, while now, advertisements attempt to engage with
users, Facebook changed their advertisement product and started offering social ads, in order
to increase relevance. Nescafe also uses social media marketing strategies to register their

brand in the customer mind. Business today is being changed from a transactional relationship
to a social relationship. It is now more critical than ever that successful organizations use
Engagement Marketing principles to plan for successfully engaging their prospects and
customers before, during and after their purchase cycle, and that the reason for this
engagement is high-quality and relevant information. The literature review also focuses on the
online consumer journey and it states that the consumer decision journey has evolved from the
early days of brand building. To successfully build brands today, marketers have a strong
understanding of the new path to purchase and brand has to be consistent in communication
and experience.
Chapter 3: Research Methodology
3.1 Introduction
Research in common parlance alludes to a search for knowledge. Redman and Mory define
research as a “systematized effort to gain new knowledge.” Research methodology can be
defined as, giving a clear-cut idea on what methods or process the researcher is will use in his
or her research to achieve research objectives. In order to plan for the whole research process
at a right point of time and to propel the research work in the right direction, carefully chosen
research methodology is extremely critical. Starting from selecting the topic and carrying out
the whole research work till recommendations; research methodology drives the researcher
and keeps them on the right track. The entire research plan depends on the concept of the right
methodology.
Further, through methodology the external environment establishes the research by giving an
in-depth idea on setting the right research objective, followed by literature point of view, based

on that chosen analysis through questionnaires or interviews findings will be obtained and
finally concluded message by this research. On the other hand from the methodology, the
internal environment establishes by understanding and identifying the right type of research,
strategy, philosophy, time horizon, approaches, followed by right procedures and techniques
dependent on his or her research work. Research methodology acts as the nerve center
because the entire research is bounded by it and to perform a good research work, the internal
and external environment needs to pursue the right methodology process.
3.2 Research Onion
The research onion was developed by Saunders et al. (2009). It shows the stages that must be
covered when developing a research strategy. When viewed from the outside, each layer of the
onion describes a more detailed stage of the research process (Saunders et al., 2009). The
research onion gives an effective progression through which a research methodology can be
designed. Its usefulness lies in its versatility for almost any type of research methodology and
can be used in a variety of contexts (Bryman, 2012). The researcher works their way from the
layers on the outside to the inside; starting by deciding the philosophy, contemplating
approaches to the theory development, selecting the methodology, choosing the research
strategy, picking the time horizon and then, eventually progressing to the last step, the data
collection and analysis , as shown in the Fig . This is exactly how this section is structured.
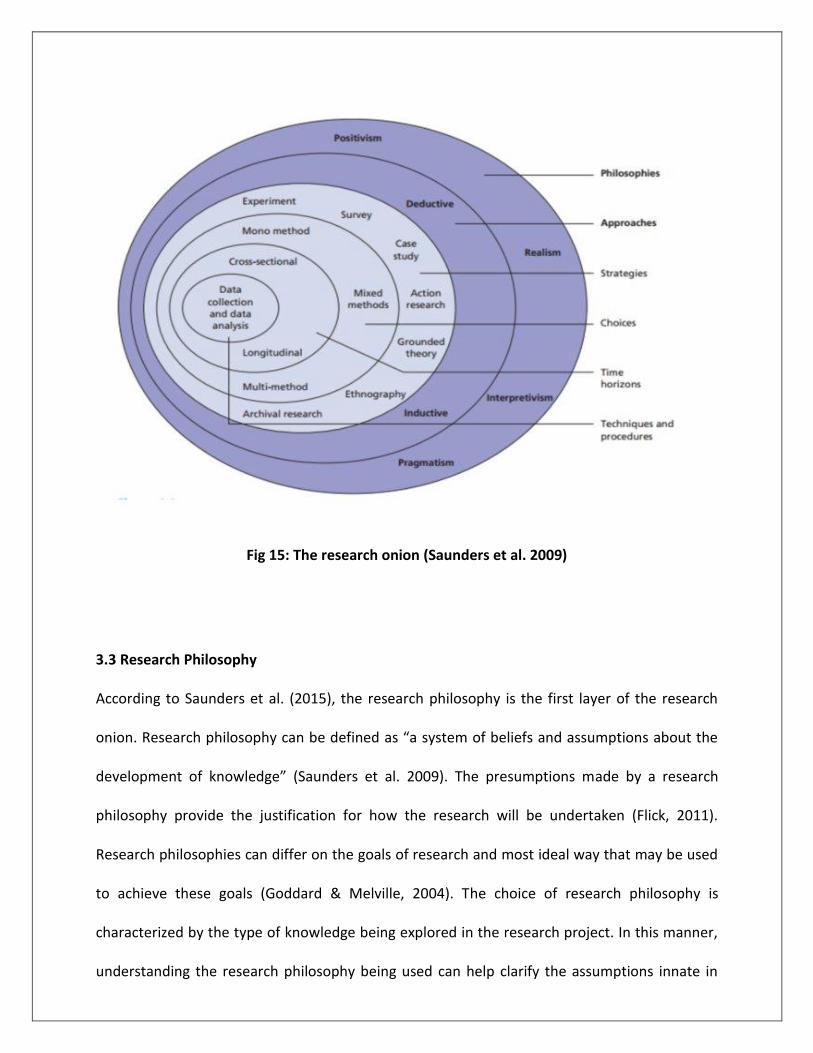
Fig 15: The research onion (Saunders et al. 2009)
3.3 Research Philosophy
According to Saunders et al. (2015), the research philosophy is the first layer of the research
onion. Research philosophy can be defined as “a system of beliefs and assumptions about the
development of knowledge” (Saunders et al. 2009). The presumptions made by a research
philosophy provide the justification for how the research will be undertaken (Flick, 2011).
Research philosophies can differ on the goals of research and most ideal way that may be used
to achieve these goals (Goddard & Melville, 2004). The choice of research philosophy is
characterized by the type of knowledge being explored in the research project. In this manner,
understanding the research philosophy being used can help clarify the assumptions innate in

the research process and how this fits the methodology being utilized. The research philosophy
will reflect the researcher important assumptions and these assumptions serve as a base for
the research strategy. There are four main research philosophies:
1. Pragmatism
2. Positivism
3. Realism
4. Interpretivism
The research philosophy which is used for this study is positivism. Positivism implies that the
“researcher is independent of and neither affects nor is affected by the subject of the research”
(Remenyi et al. 1998). Positivism adheres to the view that just “factual” knowledge gained
through observation (the senses), including measurement, is trustworthy. Positivist researchers
are probably using a highly structured methodology in order to encourage replication (Gill and
Johnson 2010). As a positivist researcher, a researcher is restricted to data collection and
interpretation in an objective way. In this dissertation, research findings are usually observable
and quantifiable. As a positivist researcher, a researcher would also try to stay unbiased and
isolates from the research and data in order to avoid influencing the findings. This means that a
researcher would undertake research, as far as possible, in a value-free way. For positivists, this
is a conceivable position, because of the measurable, quantifiable data that they gather.
3.4 Research approach
As per Saunders et al. (2015), the research approach is the ‘second layer of the research onion’
that a researcher must ‘peel off’ when designing the research methodology. Further, Saunders

et al. (2015) contend that a study can either take an inductive or deductive approach depending
on how the study uses a theory.
Fig 16: Deductive Vs. Inductive approach (Saunders et al. 2009)
Both these approaches are different, as a deductive approach is related with positivism and
inductive approach is related with interpretive. According to Burney (2008), a well staring of a
research study means the study has half completed. Thus, it is essential for the researchers to
concentrate on the correct approach to resolve any problem. On the basis of this, both
deductive and inductive method must be understood only as a tool that supports the final
Observation Theory
Pattern Hypothesis
Tentative Hypothesis Observation
Theory Confirmation

choice of the research approach. Deductive research approach means the establishment of
appropriate theories or hypothesis to resolve the research problem and after establishment,
tests out these theories or hypothesis with the use of empirical observation (Burney, 2008). The
steps of deductive research approach are theory, hypothesis, observation, and confirmation. In
this approach, various arguments are used to give adequate reasoning for a particular fact and
these arguments are based on definite law, rules, and regulations. On the other hand, the
inductive research approach is used to overcome the limitation of deductive research
approach. Burney (2008) has defined inductive research approach as the process in which the
more specific concepts are analyzed in a general way. In an inductive approach, researchers do
not require a predetermined theory in order to conduct the research thus it provides more
flexibility to the researchers. This approach includes the following steps: observation, pattern,
tentative hypothesis and theory. In order to give inductive arguments, it is essential to use
observe collected facts and information. It additionally helps in developing alternative
clarifications of what is going on. It is based on the bottom-up approach. It is always possible to
use both deductive and inductive research approach to calculate adequate and logical results.
Both the approaches can be combined perfectly within the same piece of research, to add
several advantages. Reasoning gained through deductive research approach is based on
objective and follows causation. On the other hand, reasoning, collected through inductive
research is based on a subjective approach with some definite meaning. The research approach
selected for the purposes of this study is deductive. A deductive approach has been used for
quantitative research. Indeed, Researcher has collected data through survey and moreover, the
aim is to move from theory to data and explain the relationship between variables (Creswell, J.
2009; Gill, J. and Johnson, P. 2010).

3.5 Research Strategy
The primary objective of the research strategy is to enable the researcher to answer the
research question and achieve the research objectives. The options available to the researcher
have grown over the years due to the advancements in technology (Creswell, 2014, p. 12). The
different types of research strategies that Saunders and Lewis (2018, pp. 119-127) describe are
experiment, survey, case study, action research, grounded theory, ethnography, archival
research and narrative inquiry.
Although each of the strategies can be used for different types of research, some of them more
evidently fit in the deductive approach, others to an inductive or abductive approach. Saunders
and Lewis (2018, p. 127) further point out that these strategies are not mutually exclusive, and
it is perfectly normal to combine research strategies.
This thesis focuses on using a survey research strategy which helps the researcher to collect
data in a structured way from a sizeable population. The most widely recognized technique for
collecting data using a survey strategy, the questionnaire is used in this thesis. The use of this
survey method fortifies the positivist approach of the researcher to remain impartial and
detached from the research. Also, this type of data could allow an extensive number of data
collections and, an easy analysis/comparison to draw valuable findings and conclusions
(Saunders et al., 2009). The survey method offers several advantages and a few drawbacks.
The use of the internet for a survey can give access to people and groups that would be difficult
to reach through different channels (Wright, 2005). Yun and Trumbo (2000) further recommend
that internet-based surveys save time for researchers by enabling them to simultaneously reach
a large number of individuals with similar qualities, in spite of the way that they could be
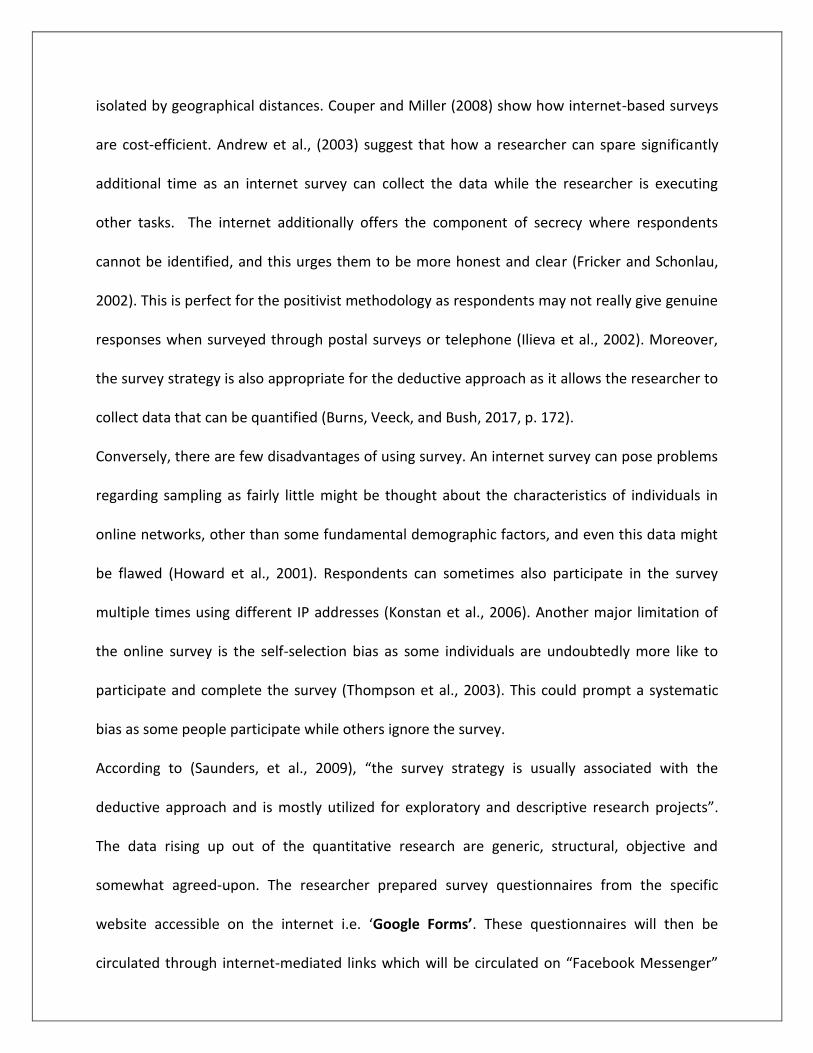
isolated by geographical distances. Couper and Miller (2008) show how internet-based surveys
are cost-efficient. Andrew et al., (2003) suggest that how a researcher can spare significantly
additional time as an internet survey can collect the data while the researcher is executing
other tasks. The internet additionally offers the component of secrecy where respondents
cannot be identified, and this urges them to be more honest and clear (Fricker and Schonlau,
2002). This is perfect for the positivist methodology as respondents may not really give genuine
responses when surveyed through postal surveys or telephone (Ilieva et al., 2002). Moreover,
the survey strategy is also appropriate for the deductive approach as it allows the researcher to
collect data that can be quantified (Burns, Veeck, and Bush, 2017, p. 172).
Conversely, there are few disadvantages of using survey. An internet survey can pose problems
regarding sampling as fairly little might be thought about the characteristics of individuals in
online networks, other than some fundamental demographic factors, and even this data might
be flawed (Howard et al., 2001). Respondents can sometimes also participate in the survey
multiple times using different IP addresses (Konstan et al., 2006). Another major limitation of
the online survey is the self-selection bias as some individuals are undoubtedly more like to
participate and complete the survey (Thompson et al., 2003). This could prompt a systematic
bias as some people participate while others ignore the survey.
According to (Saunders, et al., 2009), “the survey strategy is usually associated with the
deductive approach and is mostly utilized for exploratory and descriptive research projects”.
The data rising up out of the quantitative research are generic, structural, objective and
somewhat agreed-upon. The researcher prepared survey questionnaires from the specific
website accessible on the internet i.e. ‘Google Forms’. These questionnaires will then be
circulated through internet-mediated links which will be circulated on “Facebook Messenger”

to the target audience. The Survey is for the Indian audience who follows the Nescafe Fb brand
page. The researcher used the information collected in through the quantitative data to answer
the specific research question.
3.6 Research Choices
The fourth layer of research onion is research choices. Having identified the research strategy,
the subsequent stage is identifying the research choices. The research choices are classified into
three: mono-method, mixed methods and multi-method (Saunders et al., 2009). Mono-
methods are utilized where the study uses one data gathering technique that relates to the
analysis, while multi-methods are utilized where the researcher combines one two or more
techniques of data collection and analysis, either quantitative such as questionnaires and
experiments or qualitative such as focus group and interviews (Teddlie and Tashakkori, 2009).
Mixed-methods generally include the combination of both qualitative and quantitative data
collection techniques such as interviews and questionnaires, which are done either sequentially
or parallel (Saunders et al., 2009). In this thesis, a multi-methods choice was utilized because
the study combined both primary data from questionnaires and secondary data from a
literature review which was analyzed using quantitative procedures of analysis.
3.7 Time Horizon
The research onion characterizes the time horizon as the fifth step in identifying the research
methods (Saunders et al., 2015). Research can be done in two different ways: longitudinal or
cross-sectional (Saunders and Lewis, 2018, p. 128). Longitudinal alludes to undertaking a study

at an extended period (Rindfleisch et al., 2008). Due to the fact that they measure the same
sample units of a population repeatedly over a period of time, they are often called ‘movies’ of
the population (Burns et al., 2017, p. 99). While cross-sectional alludes to analyzing the
phenomenon at a definite point in time. When research has time constraints, the researcher
generally opts for cross-sectional research. Data is collected from participants at only one time
period and due to this, it’s often described as a ‘snapshot’ of the population (Burns et al., 2017,
p. 99). As a researcher, in this study, is faced with time and access limitations, a cross-sectional
design has been adopted by employing a survey strategy and using a questionnaire to obtain
quantitative data.
3.8 Data Collection Method
Data collection method can be characterized as a process through which both primary and
secondary data is collected. Some important data collection methods are interviews,
questionnaires, observational, experiments etc.
3.8.1 Data and Sources
The data has been collected by means of a questionnaire designed on ‘Google Forms’. The term
‘questionnaire’ alludes to all methods of data collection in which every potential respondent is
asked to answer the similar set of questions in the similar order (Hague et al., 2015, p. 137).
Questionnaires are seen as an incredible method for collecting data as they help the researcher
to achieve an extensive number of respondents in a cost-effective way (Singh, 2014). Saunders
and Lewis (2017, p. 128) further point out that the data collected by questionnaires are
regularly utilized either for explanatory or descriptive research studies and the data is usually

analysed statistically. Furthermore, this study collected secondary data from official data and
statistics and analysis of former case studies. This blend of primary and secondary data as well
as data from various sources is defined as ‘triangulation’ (Saunders et al., 2009:154). For this
study, triangulation is used because it enhances the validity and reliability of findings given that
data from various sources enhance the dependability and credibility of the inferences made.
Moreover, the shortcomings of one method are supplemented by the other. For example,
primary data is collected for this particular research gives the researcher more control of the
research process and addresses specific issues while secondary data is cost effective, efficient in
terms of effort and time and cannot be manipulated by the researcher (Kumar, 2011).
The survey was distributed and collected online during the period 24th November 2018 to 21st
December 2018. The questionnaire for this study is created in one of the most simple and
frequently used online forms - Google Forms. Google Forms is a well-known tool for creation of
online questionnaires and surveys. This tool was a venue of choice for this research paper
because of its easy-to-use interface and simplified way of visualizing the outcomes. The short
description was integrated into the form to explain the purpose and expected outcomes. The
questionnaire also includes consent sheet and cover letter that explained the nature and
purpose of the research. The seven kinds of questions set forward by Saunders and Lewis
(2018, p. 140) were analysed before selecting the suitable ones for this study. The
questionnaire used a combination of list, multiple choice, matrix style close-ended questions
and a range of rating scales. It was additionally ensure that no respondents filled the survey
twice by clicking on an option while creating the survey. It will not allow the respondents to
participate in the survey more than once. The complete questionnaire is available in Appendix
1.

Burns, Veeck and Bush (2017, p. 236) recommend that despite the fact the questionnaires are a
proficient method to collect quantitative data from a large sample, it is important to ensure
that it collects the precise data expected to answer the research question and achieve the
research objectives. The questions were thus drafted in way that they would be understood
and interpreted by respondents in the way the researcher wanted them to be understood and
interpreted. It was also ensured that the terminology used was extremely simple and reflected
the language the respondents use in a regular dialogue. Furthermore, they were structured in a
way that would provide the researcher with enough data to answer the research question and
meet all the research objectives, ensuring ‘content validity’ (Saunders and Lewis, 2018, p.144).
It was also ensure the questionnaire would measure precisely what the researcher wanted to
and not something different than what’s expected thus ensuring ‘builds legitimacy'.
3.8.2 Sampling
According to Saunders, a sampling method reduces the amount of data you need to collect by
considering only data from a subgroup rather than all possible cases. It is important to have a
group of individuals who can participate in the survey and be able to represent the total target
population. This group is called a “sample”. Determining the right kind and number of
participants in a sample group, also known as sampling, is one of the fundamental steps in
conducting surveys.
Survey sampling is divided into two broad categories: probability-based sampling (also referred
as ‘random sampling’) and non-probability sampling. A probability-based sample is one in which
the participants are selected using some sort of probabilistic mechanism, and where the
probability with which each member of the frame population could have been chosen into the

sample is known. The sampling probabilities do not really need to be equal for each member
from the sampling frame. Types of probability sample include Simple random sampling (SRS),
Stratified random sampling, Cluster sampling, Systematic sampling etc.
The non-probability sample is also called a convenience sample, occur when either the
probability that each unit or respondent included in the sample can’t be determined, or it is left
up over each individual to choose to participate in the survey. Non-probability-based samples
often require much less time and effort, and thus usually are less costly to generate, but
generally, they do not support the statistical inference. Types of Non-probability sample include
Quota sampling, Snowball sampling, Judgement sampling etc.
For this study, a researcher has opted a simple random sample technique. Selecting such
samples had a great contribution in addressing the objectives and research question. Total 103
participants were recruited for the survey. The chosen participants were Indian and already
follows Nescafe Fb brand page (India), who have encouraged greater insights into the research
question and its related viewpoints. One of the great advantages of simple random sampling is
the ease of assembling the sample. It is also considered as a reasonable method for selecting a
sample from a given population since each member has given equal opportunities of being
selected. This method is less biased compared to other methods and it is easier in drawing a
conclusion.
3.9 Data Analysis Procedures
It is vital to analyze the collected data with the goal that the research is completed in a
powerful way. Data analysis is the most significant part of any research. Marshall and
Rossman(1999) describe data analysis as the process of bringing order, structure, and meaning

to the mass of collected data. Data analysis summarizes collected data. It includes the
interpretation of data gathered using analytical and logical reasoning to determine patterns,
relationships or trends. Data analysis comprises of examining, categorizing, tabulating, or
otherwise recombining the evidence to address the underlying recommendation of a study (Yin,
1994). The researcher relied on experience and the literature to present the analysis using
various interpretations. Schostak and Schostak (2008) are the two methods used to analyze
data, namely qualitative and quantitative. As this study is quantitative so data analysis is done
accordingly. The quantitative data referred to the recorded data of the structured
questionnaire and were presented according to the various sections and subsections of the
questionnaires. After the respondents finished their online surveys, the data analysis program
that is incorporated into the Google forms website was used to analyze the data. The analyzed
data were then downloaded after which they were exposed to further analysis using statistical
data analysis. The results from primary data were coded into quantitative form and analyzed
simultaneously with the secondary data. The quantitative data were presented in either pie-
charts or by means of graph charts. That is to present data visually for a quick understanding.
Each presentation of data provided an indication of numerical scores and percentages
according to related categories in order to provide an overview of the particular grouping of
data. Secondly, the visual presentation of data (tables, charts, and graphics) in numbers and
percentages enabled the researcher to offer an analytical description and interpretation of data
by means of descriptive statistical procedures.

3.10 Research Ethics
Ethics are broadly the set of rules, written and unwritten, that governs our expectations of our
own and others’ behaviour. Ethical considerations in research are critical. Ethics are the norms
or standards for conduct that differentiate between right and wrong. They help to decide the
distinction between acceptable and unacceptable practices. In a research context, this can
relate to doing research in a responsible manner that meets the requirements of the law,
policies, procedures, guidelines, and code of conduct (Saunders & Lewis, 2018).
Ethical standards are important because they avoid the fabrication or falsifying of data and
therefore, promote the pursuit of knowledge and truth which is the essential goal of research.
Ethical behaviour is also critical for collaborative work because it supports an environment of
trust, accountability, and mutual respect among researchers. This is particularly important
when considering issues identified with data sharing, co-authorship, copyright guidelines,
confidentiality, and numerous different issues. Researchers should likewise adhere to ethical
standards in order for the public to support and believe in the research.
There are various key phrases that describe the system of ethical protections that the
contemporary social and restorative research foundation have made to try to protect better the
rights of their research participants. The principle of voluntary participation requires that
individual not be constrained into taking part in research. This is particularly applicable where
researchers had previously relied on 'captive audiences' for their subjects -- prisons,
universities, and places like that. Firmly identified with the notion of voluntary participation is
the requirement of informed consent. Basically, this means that prospective research
participants must be fully informed about the procedures and risks engaged in research and
must give their consent to participate. Ethical standards additionally require that researchers
not put participants in a situation where they might be at risk of harm as a result of their
participation. Harm can be characterized as both physical and psychological. There are two
measures that are applied in order to help protect the privacy of research participants. Almost
all research guarantees the participants’ confidentiality - they are assured that identifying data
will not be made accessible to anyone who is not directly involved in the study. The stricter
standard is the principle of anonymity which basically implies that the participant will remain
anonymous throughout the study -- even to the researchers themselves. Clearly, the anonymity
standard is a stronger guarantee of privacy, but it is sometimes difficult to accomplish,
especially in circumstances where participants have to be measured at multiple time points
(e.g., a pre-post study).
This dissertation included quantitative research which deals with participants’ information.
There is probably more risk of emotional/professional harm or confidentiality/anonymity loss
to participants. Following are the ethical consideration taking while doing research.
1. The researcher had sent information sheet and consent form (see appendix 1) along
with survey questionnaire, to provide participants sufficient information about the
research and look for their availability/consent for the research.
2. All participants were aware of the topic of the study, the aim and about the people who
were going to have access to the data. Nobody has been compelled to participate and
each respondent had the freedom to withdraw from the study at any point of time.
3. All respondents had the choice to participate or not and data have remained
confidential.

4. During the data analysis and Interpretation, the researcher has ensured the accuracy
and legitimacy of the data. The researcher has avoided falsification of the data
collected.
3.11 Summary
The researcher has made efforts to emphasize every single detail of the study in an effective
way. The research methodology used in this study has been recognized. This study uses a
positivism philosophy and an inductive approach. The research strategy used is a cross-
sectional survey using a multi-method research choice. Both primary (survey questionnaire
involving 103 participants who are already on Nescafe Fb brand page (India) and they are
selected through simple random sampling strategy) and secondary (academic journals, books,
and articles) sources of data were used. The reasons for choosing each of these methods were
explained along with the strengths and weaknesses of the alternative methods. The research
methodology has helped the researcher to complete the quantitative study and answer the
selected research objectives and research question to the highest standards.
Chapter 4: Data Analysis/Findings
This chapter will illustrate the findings of primary and secondary research, including the analysis
of quantitative data obtained throughout the study. There were 20 questions in a survey and
was created using Google Forms. Overall the researcher planned to get at least 150 people to
answer the survey. Only 103 individuals actually participated in answering the questionnaire. All

individuals who participated in the survey follows Nescafe (India) Fb brand page. The
researcher found the individuals on the Nescafe (India) Fb brand page and used Facebook
Messenger to distribute the survey. All the questions are designed in such a way that it can
meet the research objectives. The data will be presented in pie-chart and graph format and
show exactly how each question was answered by each respondent. The researcher will only
present the analyzed data and does not plan to draw any conclusions or suggestions during this
chapter. The full survey can be found in Appendix 1.
Que 1: How often do you see Nescafe ads on your Fb page?
As this survey is only for the individuals who follow Nescafe Fb brand page (India). The purpose
of this question was to identify the ads frequency of Nescafe on respondents Fb page. As the
result below shows that the percentage of respondents who always sees Nescafe ads on Fb
page is 19.4% which is lower as compared to the respondents who see ads occasionally that is
54.4% and 26.2 % of respondents sees the Nescafe ads very often.
Fig 17: How often do you see Nescafe ads on your Fb page?

Que 2: Do you find Nescafe post up to date on Nescafe Facebook Page?
This question was framed in order to identify the Nescafe customer engagement on Facebook.
As shown below that 59.2% of respondents find the Nescafe post up to date while 40.8%
doesn’t find it up to date.
Fig 18: Do you find Nescafe post up to date on Nescafe Facebook Page?
Que 3: Are the numbers of likes, a sign of quality posts for you?
This question is to identify the respondents’ perception about the likes on the Nescafe posts.
The result shows 47.6% respondents believe that the numbers of likes are the sign of quality
post, 21.4% doesn’t agree and 31.1 % were not sure.

Fig 19: Are the numbers of likes, a sign of quality posts for you?
Que 4: Would Nescafe Fb brand page influence your buying decisions?
This question was created in order to identify the effect of Nescafe Fb brand page on the
respondents’ perception of the brand and would it influence their buying decision. As the result
below states that 27.2% respondents’ buying decision were always influenced through Nescafe
Fb brand page, 32% were occasionally influenced and 19.4% respondents’ were never
influenced their buying decision through Nescafe Fb brand page.
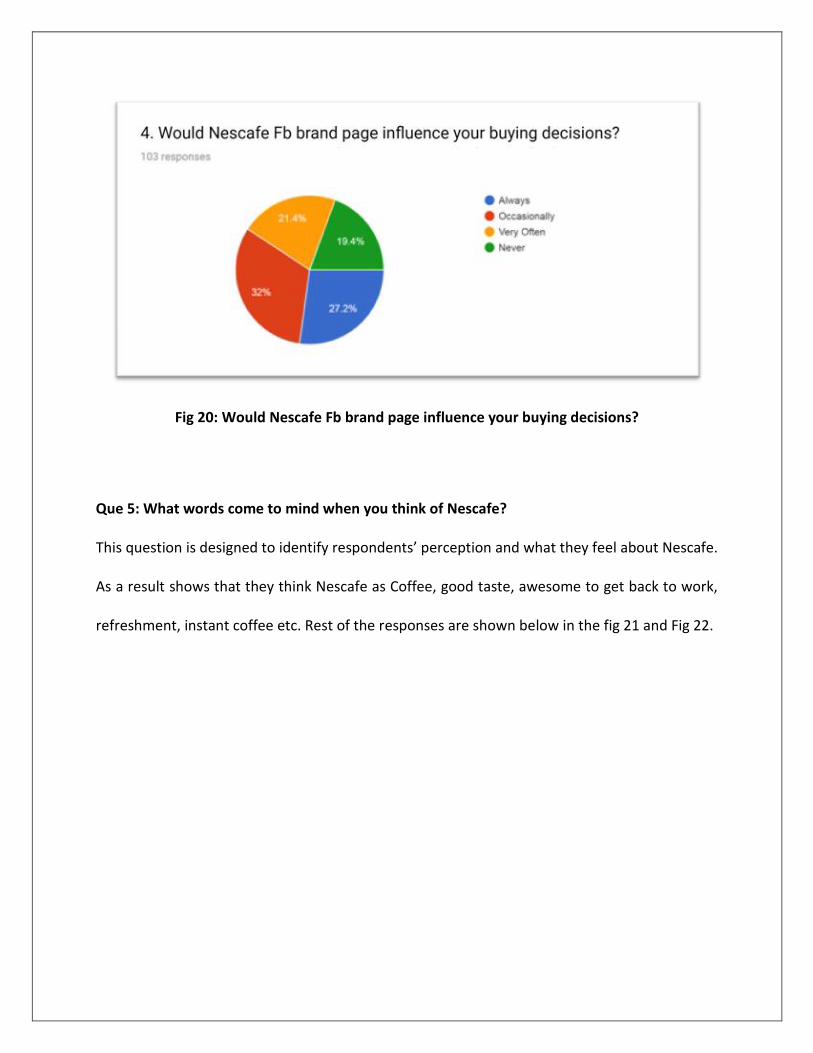
Fig 20: Would Nescafe Fb brand page influence your buying decisions?
Que 5: What words come to mind when you think of Nescafe?
This question is designed to identify respondents’ perception and what they feel about Nescafe.
As a result shows that they think Nescafe as Coffee, good taste, awesome to get back to work,
refreshment, instant coffee etc. Rest of the responses are shown below in the fig 21 and Fig 22.

Fig 21: What words come to mind when you think of Nescafe?
Fig 22: What words come to mind when you think of Nescafe?

Que 6: How would you consider Nescafe?
This question is designed to identify the brand image of Nescafe in respondents’ mind. Between
the options of a spirit of youth, romantic, bitter taste, breakup, best brand in category and
chilling with friends; many people choose chilling with friends. Around 37.9 % think that
Nescafe as better taste, 26.2 % respond Nescafe as chilling with friends , 16.5 % believe that
Nescafe as Romantic and 4.5% rated as best friend in category.
Fig 23: How would you consider Nescafe?
Que 7: How likely are you to recommend Nescafe to a friend or colleague?
This question is designed to identify customer loyalty towards Nescafe. For this question, it was
asked to recommend Nescafe to a friend or colleague (rating on a scale 1-10: 1= Not at all likely,
10= extremely likely). 47.6% will highly recommend Nescafe, 39.8% will moderately
recommend and 12.6 % were not at all likely recommend Nescafe to a friend or colleague.

Fig 24: How likely are you to recommend Nescafe to a friend or colleague?
Que 8: Do you interact on Nescafe Fb Brand Page?
The purpose of this question was to identify if people who follow Nescafe Fb brand page were
actively engaged with Nescafe or not. The pie-chart below states that 35.9% of respondents
interact with Nescafe on its Fb page and rest 64.1% doesn’t interact. These interactions include
activity such as liking a Nescafe post, commenting on a page, asking a question and sharing a
post.

Fig 25: Do you interact on Nescafe Fb Brand Page?
Que 9: How do you interact with Nescafe on Nescafe Fb Brand Page?
This question is designed in such a way to identify how respondents like to interact with
Nescafe on Nescafe Fb brand page. 51.5% of people who answered the survey interact with
brands by liking their publications (Posts, ads etc.), 9.7% by sharing the posts, 14.6% by
commenting the publications, 24.3 % doesn’t interact with brands.

Fig 26: How do you interact with Nescafe on Nescafe Fb Brand Page?
Que 10: What type of Nescafe posts are you most likely to share?
This question was framed in order to identify what types of Nescafe posts on Facebook
consumers respond to the most. It is found that 35% of respondents’ like to share picture post,
23.3% of respondents’ share video post and the highest 39.8% doesn’t share any post.
Fig 27: What type of Nescafe posts are you most likely to share?

Que 11: How often are you sharing Nescafe posts?
Among the respondents who share Nescafe posts, 17.5% share it at least once per month,
16.5% share it at least once per week, and 7.8% share it at least once per day. 58.3% declare
they never share Nescafe posts, which is the highest amongst all.
Fig 28: How often are you sharing Nescafe posts?
Que 12: How satisfied are you with Nescafe ads on Fb?
This question is designed to identify how impactful the Nescafe ads on Fb . As a result states
that 35.9% of respondents’ are satisfied with the Nescafe ads on Fb, 11.7% are very satisfied,
and 42.7% are neutral about the Nescafe ads. 9.7% responded that they are not satisfied with
Nescafe ads on Facebook.

Fig 29: How satisfied are you with Nescafe ads on Fb?
Que 13: Do you receive Nescafe social ads on your private Fb page?
This question focuses on to identify how actively respondents’ were engaged for Nescafe
through Nescafe ads on their Fb page. As the pie-chart signifies that highest 63.4% of
respondents’ share that they do not receive Nescafe ads on their private Fb page and 36.6%
people received the Nescafe social ads on their Fb page.

Fig 30: Do you receive Nescafe social ads on your private Fb page?
Que 14: How satisfied are you with the regularity of posting Nescafe ads on Facebook?
For this question, it was asked to rate the regularity of posting Nescafe ads on Facebook (rating
on a scale 1-10: 1= Not satisfied, 10= extremely satisfied). 29.7% respondents are extremely
satisfied, 47.6% of respondents are moderately satisfied and 22.8% were not satisfied with the
regularity of posting of Nescafe ads.

Fig 31: How satisfied are you with the regularity of posting Nescafe ads on Facebook?
Que 15: Do you feel attached with Nescafe when they are interacting with you on Facebook?
This question is to identify the customer engagement of Nescafe via facebook. 69.7% of the
respondents feel absolutely more engaged when Nescafe interacts with them on Facebook
whereas 30.3% don’t feel engaged.

Fig 32: Do you feel attached with Nescafe when they are interacting with you on Facebook?
Que 16: From your point of view, how important is the quality of the ad?
For this question, it was asked to rate the quality of Nescafe ads on Facebook (rating on a scale
1-10: 1 = Not at all important, 10 = extremely important). As the graph below suggests 47.5%
people who answered the survey rated quality of the ad as extremely important, 40.6% rated as
moderately important and 12% rated as not at all important.

Fig 33: From your point of view, how important is the quality of the ad?
Que 17: Which of the following do you rather liked in Nescafe ads?
This question aimed to find out the respondents’ perception about the Nescafe ads. As a result
shows it’s a mixed response. 37.6% of the respondents answered they prefer high- quality
content posts, 20.8% of them prefer the regularity of posting, and 30.7% consider both
activities as important.

Fig 34: Which of the following do you rather liked in Nescafe ads?
Que 18: Have you ever suggested something to Nescafe through Facebook?
This question aimed to identify that people who follow Nescafe Fb brand page do actively
engage with Nescafe. As a result signifies that 69.6% of respondents’ doesn’t suggest something
to Nescafe on Facebook whereas 30.4% of respondents’ suggested.
Fig 35: Have you ever suggested something to Nescafe through Facebook?

Que 19: What main reason will make you to follow Nescafe Fb Page?
33.7% of the respondents’ follow Nescafe Fb page because of the high quality content of the
posts, 16.8% and 29.7% respondents’ follows because of its regularity of posting and relevant
content.
Fig 36: What main reason will make you to follow Nescafe Fb Page?
Que 20: Overall, how satisfied are you with Nescafe?
This question was aimed to find out the overall perception of Nescafe on respondents’ mind.
35.3% of people who answered the survey were very satisfied with Nescafe, 48% were satisfied,
10.7 % of people were neutral and the rest 5.8% were not satisfied.
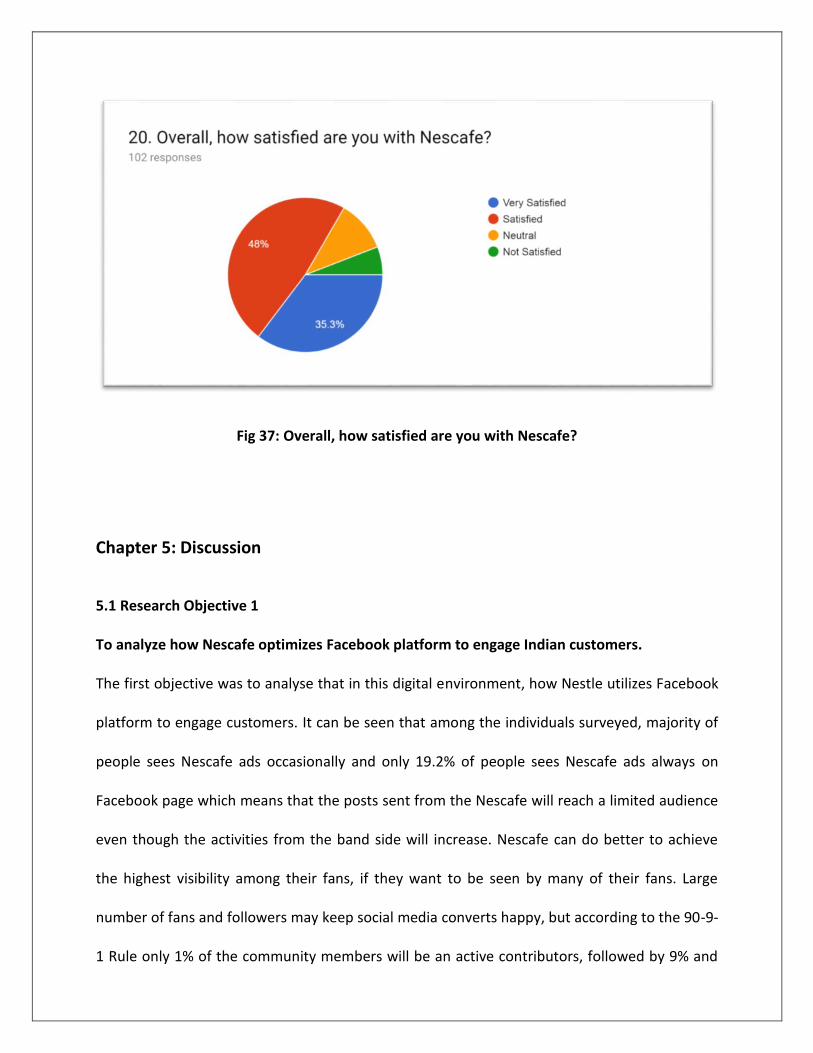
Fig 37: Overall, how satisfied are you with Nescafe?
Chapter 5: Discussion
5.1 Research Objective 1
To analyze how Nescafe optimizes Facebook platform to engage Indian customers.
The first objective was to analyse that in this digital environment, how Nestle utilizes Facebook
platform to engage customers. It can be seen that among the individuals surveyed, majority of
people sees Nescafe ads occasionally and only 19.2% of people sees Nescafe ads always on
Facebook page which means that the posts sent from the Nescafe will reach a limited audience
even though the activities from the band side will increase. Nescafe can do better to achieve
the highest visibility among their fans, if they want to be seen by many of their fans. Large
number of fans and followers may keep social media converts happy, but according to the 90-9-
1 Rule only 1% of the community members will be an active contributors, followed by 9% and

the rest 90% “lurkes” only who will consume content, but do not take actions with it ( Nielsen J.
2016).
Secondly, more than half of people found the Nescafe post up to date which means that
Nescafe brand strategy moderately keep a focus on content and engaging with fans via content
quality. As shown in the findings that 59.2% respondents rated Nescafe ads up to date. They
have focus on creating dialogue between company and fans, fostering relationship that way,
which works very well for their audience.
Thirdly, almost half of the people surveyed found the number of likes, a sign of quality post. For
brands, post Likes are still valuable - they define how far brand reach will go and help to
indicate audience response, which Facebook can then measure and take into account
when assessing Page performance. But, considering that having lots of Posts Likes
doesn’t necessarily mean their message is getting through. It’s the engagement on the
posts that really defines the reach and response. Generating engagement with the
content they post is the best way to reach the most amount of people, build interest
and engagement, and generate brand awareness, leading to more authentic Page Likes.
From the literature review it was observed that the Like was once a crucial currency of
Facebook- evidence of the popularity, and importance- getting people to like the brand
Page might inflate their vanity stats, but it won’t necessarily mean that more peop le are
going to see more of the content, something that they definitely want to be aiming for.
Because ultimately, interaction = engagement = a measurable sign of interest in the
brand.

Lastly, according to the result obtained from primary data some people may or may not
influenced their purchase decision by the Nescafe Fb brand page it means that it totally
based on how to engage customers which is based on creating a consistent brand persona
and engaging in conversations with their diverse audience. Therefore Nescafe created a friendly
environment, easily starting casual conversations. As mentioned in the literature review about
online customer journey. Getting cut through is a key challenge for marketers today since there
are so many online influences on purchase from search engines and social networks and
from media sites to personal blogs. So, to be effective in influencing purchase today, brands
need to intimately understand the footprint of their brand communications and how
this relates to consumer purchase decision-making.
To conclude, the researcher simply state that engagement with audience is important and
Nescafe optimises Facebook well to engage Indian customers. But there is scope for Nescafe to
engage more number of audiences effectively on their Nescafe Fb brand page. Additionally
researcher identified the following more or less identical goals to engage more number of
audiences for Nescafe: Listen in order to Understand Consumers, Involve and Engage with
Audience in order to create and sustain a Relationship between Brand and Consumers, Support
or Build Relationships by having a Dialogue with Consumers, and Build a Brand Persona.
5.2 Research Objective 2
To evaluate the gap between brand identity and brand image in India for Nescafe.

The second objective was to analyze the gap between brand identity and brand image which
means that the brand image Nestle marketers want customers for the Nescafe will be the same
as the identity marketers trying to project or not. This difference between brand identity and
brand image is called ‘Perception Gap’.
In the survey of Nescafe, the researcher has found out that most of our respondents say that
when they first see the “Nescafe” the first thing come to their mind that its refreshing, good
taste, friendship, awesome to get back to work, quality, best coffee, coffee that is perfect etc.
Majority of the sample share positive feedback about Nescafe and they connect Nescafe with
work, friendship, relaxation. It means that they perceive Nescafe as same as the company
wants to portray it. In the survey, the question number 6 is that “How would you consider
Nescafe" So, in the survey result researcher found that around 11.7% of people find Nescafe as
a Spirit of Youth where 16.5% find itself Romantic. 37.9% feel as a Better taste where 2.9% of
people found itself as a Breakup sign. 4.9% people see itself as a Best friend in Category and
26.2% found Nescafe as an opportunity to Chilling with Friends.
Brand Identity is defined by the way the brand speaks and behaves, as well as the associations
it creates in consumer’s minds. In order to achieve memorable and distinct brand Identity,
brands were assigning human personality characteristics to a brand which enables stronger and
more emotional associations to the brand. Nescafe’s brand Identity indicates emotional
associations towards coffee. Coffee cheers up, brings a good time, relaxation and company in
people's lives. The casual and friendly conversations encourage fans to share personal
moments or opinions, these experiences anchor the brand personality, which in return
generates its emotional character and associations in consumers’ mind (Posts taken from
Facebook, March/April 2012). Nescafe went back to their core, unique and historic values to

bring Brand’s Identity online. For example, Nescafe created a brand persona which is friendly,
warm, down to earth, seemingly sincere and honest, someone with whom can have a nice chat
while drinking coffee. Another personality dimension which Nescafe applied is excitement,
related to qualities such as friendly, youth and energy. These have been achieved through the
images of the posts, which send positive and cheerful vibe metaphors supporting with words
having positive connotations: Hugs, smile, celebrate, better tomorrow, a weekend, place to
enjoy, Mondays should be Fun days, celebrate, Nescafe break, funny, etc.
In the survey question, 7 is that “how likely do you recommend a brand to a friend” Researcher
found that 47.6% will highly recommend Nescafe, 39.8% will moderately recommend and 12.6
% were not at all likely recommend Nescafe to a friend or colleague. As per the literature
review discussed earlier brand loyalty is the most important reason why people recommend a
brand. Word of mouth recommendations has always been placed higher in importance over
product descriptions and advertisements. People like to know about the kind of experience
customers have had with the brand and product, before they invest their money in it. So
according to the survey results the majority of respondents recommend Nescafe to a friend, it
shows that they have trust and good experience with Nescafe. People are more likely to
recommend a brand when they have a great experience with a brand and are satisfied with the
purchase. When people accept a brand to their social networking cycle, it means they accept
the brand into their personal sphere; the brand becomes a virtual “friend” on individuals’ social
networks space. The brand is one of the community members with whom fans are connected
with, in a stronger or weaker manner depending on the time and effort invested in the
relationship. The micro-interactions on social networks bring utility and value into people's
everyday life. However, brands cannot assume that the bond is strong enough to sustain a long-

term relationship without delivering value or content that benefits the brand alone. Value
exchange creates loyalty and ensures continued engagement with the brand in the social
sphere. In the sense of making brand advocates of the consumers, the value created by the
exchange might even inspire them to share it with others and thus increase brand value. Social
experience consists of relationships, sharing lived experiences, connecting people, evoking
feelings, positive values created within context. The sum of those micro-interactions is the key
to build a brand relevance to consumers’ lives. To understand what values to bring to the
audience, Nestle takes some steps back and simply look how relationships are build between
people and to find important moment and meaning taken from everyday life. The opportunity
for companies to connect with the audience comes from understanding what value is in a
person’s life. In the branding context, it means that companies have to provide values to
consumers instead of showing product features, artificial product lines. Apart from that, as per
the literature review, the strong aspect of Nescafe’s social media brand strategy is along with
highly engaging and quality content it is also important to build consistent and distinguished
brand identity through visual brand elements deep red background color with the white script
as their trademark. The red mug is a brand symbol that appears as a strong visual recognition
aid that helps to differentiate the brand in consumers’ minds.
So the overall finding of the survey about the ultimate brand identity of Nescafe is mostly
friendship, which concludes that the brand identity matched with the result of the survey which
researcher has found out that the Nescafe has the brand image of friendship, joy, etc. It means
that Nescafe brand image the customer perceives is same as the Nescafe brand identity which
marketers trying to project.

5.3 Research Objective 3
To identify the consumer action response on the Nescafe Fb brand page
Consumer action response is any action consumer takes on the Facebook Page or one of the
posts. The most common examples are comments, likes, and shares. Consumer action response
on the Nescafe Fb brand page is one kind of engagement which matters because it can help
extend organic reach. First, engagement helps boost the News Feed placement based on the
Facebook algorithm. And second, likes and shares expose the posts to the audience’s extended
network. Finally, engagement also indicates that the audience is, well, engaged.
This research objective is to identify the customer action response that is, how consumer
prefers to interact on the Nescafe Fb brand page. As the survey shows that majority of people
don’t like to interact on Fb page and the people who interact usually uses ‘like’ as a customer
action response and some people like to comment and very fewer people share on the Nescafe
Fb brand page. “Like” is an approach to give positive feedback or to connect with things they
care about on Facebook. People can like content that their friends post to give them feedback
or like a Page that they want to connect with on Facebook. But, shares are more indicative of
an effective Facebook community and will result in greater ROI(return on investment) from
Facebook efforts.
Many people don’t like to share the post but if they do they share the picture posts. Almost
half of the consumers who surveyed are neutral and 35.9% are satisfied with the Nescafe ads
on Facebook. Today it is difficult than ever to capture the attention of the audience so creating
highly shareable content must be important to any Facebook marketing strategy. To ensure
regular engagement with users, Nescafe needs to work on their content and develop a clear
publishing strategy. According to Choi, a brand on Facebook is in fact no different from friends.

“Brands compete for the same space in the newsfeed as the friends,” he says, also mentioned
that it is important to keep the content engaging, so people will share. For Nescafe, Knowing
when to post engaging content is an important part of any strategy. In fact, previous researches
showed that engagement rates for Facebook posts are 18% higher on Thursday and Fridays.
Facebook’s own research reveals that posts of around a couple of lines get 60% more likes,
comments, and shares than ones that are more than 250 characters. So Nescafe has to keep
the content short and simple but make sure it is highly engaging and shareable.
As per the data analysis, it has been identified that most of the people don’t interact on
Nescafe Fb page. As per literature review, some reasons why people are not liking or
commenting on Fb post are passive lurkers, laziness, not more interested in the brand, irritating
Facebook notification etc. So to engage more number of customers actively Nescafe should
post relevant and high-quality content, posting frequencies and engage them in some contest.
Apart from this, the customer uses mostly “Like” as a customer response action which is good
for Nescafe. But, sharing the post of Nescafe should be encouraged because as share is
generally more indicative of quality content than alike and is indicative of a quality fan. Shares
have a higher word of mouth value than likes, Shares increase reach directly to potential fans
that may have similar values with the high-quality share.
5.4 Research Objective 4
Examine how Facebook users engage with Nescafe social ads on their private Facebook
account?
As per the survey, only 36% of people receive the Nescafe social ads on their facebook page
and almost half of the people don’t received Nescafe ads. Nearly 60% of people suggested that

they feel attached when Nescafe interacted with them and high-quality content of Nescafe on
Facebook is the most important thing they like on Nescafe ads. Nearly half of the people are
satisfied with the Nescafe. As mentioned in the literature review and as per data analysis,
Nescafe engaging with their audience through the content by creating deliberate values,
gathering a community around the content. Through the content, the brand communicates
values and so defines the brand Nescafe itself. Moreover, a Nescafe ad is created around the
content. Therefore it is important to create interactive content, which provides visitors with a
chance to immerse themselves in the Nescafe brand's values and messages. Topics which are
appealing to the audience, storytelling, and attention-grabbing headlines invite people to
interact with the Nescafe and provide further opportunities to build a closer relationship.
Nestle is using different strategies to communicate Nescafe brand content. Nescafe social
media branding strategy does not focus on creating deep and powerful content instead it
focuses on creating a friendly digital environment that is attractive and casual, empowering
interactive communication by sharing experience related with Nescafe. On Facebook, Nescafe
takes an opportunity to develop a brand association with “coffee” and emphasizes on their
emotional benefits such as “fun, joy and relaxation”, which helps to create a warm and friendly
atmosphere. If fans are interested to know more about Nescafe heritage, values Interactive
content provides an audience with a chance to immerse in site content. Nescafe created
content that is powerful, interactive with many different stories to tell and providing news at
the same time keeping brand’s cultural values in tune within context. Nescafe following own
social media strategy which is based on creating a consistent brand Persona and engaging in
conversations with their diverse audience. The meaning of the brand could be constructed by
each of the users based on their personal experience and beliefs, which allows consumers to

own brand by influencing brand identity and personality differently than it was defined by the
business. Safko and Brake (2010) support this thought, that audience will determine what the
brand means to them and what value it has in their lives. For instants, Nescafe understands the
importance for people to have a sense of emotional involvement and need to support self-
esteem by contributing by responding with own content. When Nescafe leveraging power of
the fans generated content and invites them to participate into conversation Brand community
theory supports that shared product experiences will lead to stronger social bonding among
community members that enable the continued existence of the community.
One of the main social media characteristics is two -way dialogue based on customers’
participation in the conversation. The academic literature within the field of social media
stresses the importance of dialogue: “In the era of the social web, branding is the dialogue you
have with your customers and potential customers” Weber (2009). Academics continue stating
that dialogue and direct engagement creates a meaningful and loyal relationship and in doing
so, the brand becomes stronger. This leads to the belief that Facebook pages were particularly
good for companies to interact with their consumers in a new and different way in order to
strengthen a brand position. Academics continue stating that dialogue and direct engagement
creates meaningful and loyal relationships, and in doing so, the brand becomes stronger.
In order for organizations to be able to create a deep and trusting relationship with consumers
using social media communication channels, it is an essential condition that they renounce total
control over their brand and instead actively participate in conversations with consumers
(Bergsli M. 2010). Even though academics argue that the dialogue based communication is
necessary in order to strengthen a brand position on social media, this depends on the
companies understanding of the brand position and willingness to maintain control over the

brand. In the branding context it means that along with providing branded content and creating
a unique brand persona, companies have to participate in the conversations and constantly
interact with the audience in order to control conversations and to shape brand image in
consumer minds. Besides having a direct dialogue with consumers, it is important to build a
trusting and deep relationship in order to give to brand page members a feeling of belonging, as
well as to preserve their affiliation.
Chapter 6: Conclusion and Recommendations
Considering the results of the survey and the findings of the literature review, it has to be
stated that despite Nescafe Facebook’s marketing major focus on their ad system, all users are
not aware of Nescafe ads in Facebook. Users do not want to be exposed to ads in social
networks because one of the benefits of these networks is to escape from the overflow of ads
on other sites. However, if Nestle follow the new rules for social network marketing, Facebook
can be an effective marketing tool for branding and for building a relationship with customers.
Facebook provide an ideal platform to communicate with users and interact with them to gain
more information about their interests, preferences, needs, wants and demands. Facebook
marketing is not about advertisements interrupting neither users nor hard selling techniques
and it is crucial not to control the content published by users. Users use Facebook to stay in
contact with friends and companies need to be careful of how much commercial content they
provide. The most important element of Facebook is the relationship with friends in an indirect
or direct manner. Further, friends have the most influence over one another because as per the
literature review the most essential source of information is the profiles of friends and

acquaintances and one important reason to follow fan page is friends’ recommendations.
Despite the findings that Nescafe pages, and groups have the highest potential to be used as an
information source before a purchase decision, pages should in the future become the
preferred choice because organization can engage large number of audience. A major focus is
going to be placed on Fan page because users have an interest in organisations and there are
indications that users are more likely to purchase products from brands they are fans of. From
an organization perspective, the focus on brand pages should be encouraged as they are free
and so the risk is minimal.
For Nescafe ads on Facebook, Nestle provide interesting and entertaining content and to be
authentic and transparent in order to persuade users to share content with their friends and to
invite them to become fans. Despite the finding that the majority of users do not actively
contribute to Nescafe Fan pg, interaction between the user and Nescafe should be encouraged
through incentives to gain access to their opinions, interests and experiences. Moreover, in the
marketing communication studies the message to be conveyed are more customized, and
rendered to be directed to the users' needs and desires. These facts illustrate the power the
social networks have in the cyber age. Another contribution of the Facebook to the marketing
studies shows itself in the relation between the brand and the customers. In the marketing
studies on social media the brands get closer with their customers and they have the
opportunity to get all kinds of responses either positive or negative. As a matter of fact the
customers who join the Facebook pg of the brands (Nescafe Fb pg) are observed to be the
"voluntary representatives" of the brands nowadays. This situation pushes the brands to leave
behind the conventional marketing understanding based on one-way communication and

strengthens the brand. That’s why Facebook advertising are part of the trust building
relationship between the consumer and Nestle India ltd.
As a result, relying on the content analysis and the findings of the survey on digital
brand building through Facebook advertisements, the number of the people sharing and liking
the Nescafe advertisements, and what kind of comments have been made about the Nescafe
and the advertisement are essential to be given importance. Negative or positive comments
and the sharing of the Nescafe ads virally in Facebook may depend on the followings: the
previous positive experiences of the user as to the Nescafe, the type of the Nescafe ads (press
advertisement or video) the creativeness of the Nescafe ads, the noticeability, the type of the
product, the tendency and needs of the intended audience, whether they have amusing
contents, or culture specific features, and whether the person sharing the advertisement in the
social media is knowledgeable, experienced and reliable.
6.1 Future Research Direction
According the results of Nielsen's study in 2017 four fifth of the active users utilise the
social networks and the blogs. The brands give place to the social media in advertising
strategies because of their extensive range of access, the cost effectiveness, and intended
advertising as well as the fact that the users spend more time in online media. This situation
results in the increases of the investment rates made for marketing and advertising studies.
Particularly, the researches based on India, which is one of the countries where Facebook is
used at most can be adopted to the other countries in the future. More detailed and specific
data can be reached by broadening the scope in this issue. Also, the expectant researches on
digital brand building through Facebook advertising can be elaborated by covering the social
networks such as YouTube, blogs, Instagram, LinkedIn etc. and may be deepened based upon a

single brand or the comparison of rival firms. It is believed that the effect of digital brand
building will be observed more influentially in the practices of marketing strategies in cyber era.
Chapter 7: Reflection on Learning
“Critical reflection is an important part of any learning process. Without reflection, learning
becomes only an activity” Jackie Geristine (2015)
In this chapter, I will give an overview of the learning I have gained from both this dissertation
and the MBA in Marketing. This chapter will highlight the key learning methods received
through my time in Dublin Business School. This chapter will also highlight learning theories and
learning outcomes.
7.1 Learning theory
Learning is the “process that results in a relatively enduring change in an individual or persons”
(Alexander et al, 2008). According to Winn (1991), learning is a dynamic procedure whereby the
people skills and knowledge are different when compared before to after learning.
Learning theories are conceptual frameworks which serve to explain how people learn.
Understanding how knowledge is developed enables people to shape the methodological
delivery of their subject content to match the theoretical frameworks, supporting how
knowledge is developed. Besides, attending to the way people learn can be used to encourage
effective teaching practices, enabling teachers to improve their practice, and eventually
enhance the quality of the learners’ experience (Macleod and Golby, 2006). Over the years,

academics have proposed a number of theories to describe and explain the learning process -
these can be grouped into four broad categories:
1. Behaviorism
2. Cognitivism
3. Constructivism
4. Connectivism
1. Behaviorism
The behavioral approach is the behavior view that generally assumes that the result of learning
is the change in behavior and emphasizes the impacts of internal events on a person. In the
behaviorist approach, they believed that individuals have no free will and that the environment
an individual is placed in determines their behavior. They believe that people are born with a
clean slate and that behaviors can be learned from the environment.
2. Cognitivism
The cognitive theory focuses on the inner activities of the mind. The cognitive theory states that
knowledge is learned and the changes in knowledge make the changes in behavior possible.
Both the behavioral and cognitive theory believe that reinforcement is important in learning
but for different reasons. The behaviorist suggests that reinforcement strengthens responses
but cognitive suggest that reinforcement is a source of feedback about what is likely to happen
if behaviors are repeated or changed. The cognitive approach suggests an important element in
the learning process is the knowledge an individual has towards a situation. Cognitive theorist
believes that the information people already know determines what people will perceive, learn,
remember and forget.

3. Constructivism
The constructivism learning theory is defined as how learners or individuals construct
knowledge from previous experiences. Constructivism is often associated with a pedagogic
approach that often promotes learning or learning by doing. Constructing is also known as the
meaning for learning because constructivism focuses on the individual thinking about learning.
The constructivist theory contends that individuals can generate knowledge from interactions
between experiences and ideas.
4. Social & Cultural theory
The social and cultural theory is based on how individuals functioning are related to cultural,
institutional and historical context. The Socio-cultural theory is known as the combining theory
in psychology because it discussed the important contributions society makes on individual
development and cognitive views. The theory suggested that learning occurs between the
interactions of people.
7.2 Learning Outcome
Kolb's learning theory (1984) sets out four particular learning styles, which depend on a four-
stage learning cycle. Kolb clarifies that different people normally prefer a specific single
different learning style. Various factors influence an individual’s preferred style. For instance,
educational experiences, social environment, or the basic cognitive structure of the person.
Kolb's experiential learning style theory is commonly represented by a four-stage learning cycle
in which the learner touches all the bases:

Fig 38: Kolb's experiential learning style (1984)
1. Concrete Experience: another experience or situation is encountered, or a
reinterpretation of existing experience.
2. Reflective Observation: of specific importance are any inconsistencies between
experience and understanding.
3. Abstract Conceptualization: reflection offers rise to a new idea or a change of an
existing abstract concept.
4. Active Experimentation: the learner applies their idea(s) to the world around them to
perceive what happens.

Kolb’s states that effective learning is seen when a person progresses through a cycle of four
stages. Among the different learning styles of Kolb's model, the "diverge" style would best
characterize my learning style. I have dependably been a person who wants to investigate and
acquire more knowledge, enthusiasm, insights, and determination. I am particularly extremely
enthusiastic about learning things that relate to my area of interest and my future professional
aspirations. Born and raised in India, I completed my bachelor’s in pharmacy from Nagpur. I
have never composed a dissertation and such a compelling piece of the academic article since
then, I examined how challenging this would have been, and I have to admit, it was a significant
learning experience. During this particular period of the dissertation, I realized an extraordinary
change in my characteristics as a researcher and my viewpoint towards planning, organizing
and analyzing tasks. I have dependably been a thinker, however all throughout my coursework;
I have significantly honed my critical analysis skills. Rather than concentrating on proposed
meanings or biographical background, I have figured out how to continuously ask "why" on
many different levels. I challenge myself to dig into the text as deeply as possible and unpack
every detail to develop a satisfying close read.
7.3 Personal Achievements (Skills)
1. Marketing Skills: Every people have their own perspectives and aim in life. As I have
experience in sales and I always wanted to build my career in marketing. I find
Marketing to be a very dynamic and creativity-based field. Additionally, marketing is a
fast-growing discipline, enveloping a wide area of activities within the community.
Marketing is the invisible force that moves the modern business world forward. I truly
feel that MBA in marketing, mainly dissertation has provided me with advanced

marketing and branding knowledge and skills to facilitate my employment and
subsequent career development in Business and marketing management.
2. Analytical Skills: Throughout my course and dissertation I have learned to tackle new
ideas, sorting information, and discovering creative solutions. All of this can’t be
accomplished without the guidance and support of my lectures and supervisor.
3. Time management: It is one of the most important skills which I learned throughout the
dissertation. As there is limited time for dissertation, I have planned and prioritize the
things accordingly so that I can complete it on time in an effective way.

References
Books
Burns, A. and Bush, R. (2016). Marketing research. 8th ed. Upper Saddle River, N.J: Pearson
Education, pp.47-69.
Carter, B. and Levy, J. (2011). Facebook Marketing. 3rd ed. United States of America: Que
Publishing, pp.113-137.
Chaffey, D. and Smith, P.(2017). Digital marketing excellence: planning, optimizing and
integrating online marketing. 5th ed. Abingdon publishing, pp.196-231.
Cijo, M. and Gul, E. (2015). Facebook Marketing Strategies. 1st ed.pp.76-95.
Evans, L. (2011). Social Media Marketing. 4th ed. United States of America: Que Publishing,
pp.213-236.
Kolb, B. (2018). Marketing research. 2nd ed. London Sage Publications 2018.
Kolter, P., Keller, K., Goodman, M. and Hansen, T. (2016). Marketing Management. 3rd ed. UK:
Pearson Education, pp.424-452.
Kotler, P., Kartajaya, H. and Setiawan, I. (2017). Marketing 4.0. Hoboken, New Jersey: John
Wiley & Sons, Inc., pp. 123-145.
Rosenbaum-Elliott, R. (2018). Strategic brand management. 4th ed. S.l.: Oxford Univ Press,
pp.97-113.

Saunders, M., Lewis, P. and Thornhill, A. (2016). Research methods for business students. 5th
ed. Harlow (Essex): Pearson, pp.46-132.
Temporal, P. (2001). Branding in Asia. 1st ed. Singapore: Wiley Publication, pp.56-78.
Tuten and Tracy, L. (2014). Social media marketing. 3rd ed. London Sage Publications, pp.37-65.
Wertime, K. and Fenwick, I., 2011. DigiMarketing: The essential guide to new media and digital
marketing. John Wiley & Sons.
Articles/Journals
Ananda, A.S. Hernández-García, Á and Lamberti, L.,2016. N-REL: A comprehensive framework of
social media marketing strategic actions for marketing organizations. Journal of Innovation &
Knowledge, 1(3), pp.170-180[Accessed 23 Oct. 2018].
Balakrishnan, B.K., Dahnil, M.I. and Yi, W.J., 2014. The impact of social media marketing
medium toward purchase intention and brand loyalty among generation Y. Procedia-Social and
Behavioral Sciences, 148, pp.177-185 [Accessed 29 Oct. 2018].
Bhardwaj, D.and Bharadwaj, S.S., 2017, June. Understanding the Impact of Social Media on
Marketing Strategies of Organizations in India. In Proceedings of the 2017 ACM SIGMIS
Conference on Computers and People Research (pp. 105-108). ACM [Accessed 5 Nov. 2018].
Chaffey, D., 2016. Global social media research summary 2016. Smart Insights: Social Media
Marketing [Accessed 15 Nov. 2018].
De Chernatony, L. (1995). Strategic brand management or tactical branding?. Journal of Brand
Management, 3(2), pp.76-77.
Dehghani, M. and Tumer, M., 2015. A research on effectiveness of Facebook advertising on
enhancing purchase intention of consumers. Computers in Human Behavior, 49, pp.597-600
[Accessed 20 Oct. 2018].
Felix, R., Rauschnabel, P.A. and Hinsch, C., 2017. Elements of strategic social media marketing:
A holistic framework. Journal of Business Research, 70, pp.118-126.[Accessed 1 Nov. 2018].
Godey, B., Manthiou, A., Pederzoli, D., Rokka, J., Aiello, G., Donvito, R. and Singh, R., 2016.
Social media marketing efforts of luxury brands: Influence on brand equity and consumer
behavior. Journal of business research, 69(12), pp.5833-5841,[Accessed 8 Oct. 2018].
Godey, B., Manthiou, A., Pederzoli, D., Rokka, J., Aiello, G., Donvito, R. and Singh, R., 2016.
Social media marketing efforts of luxury brands: Influence on brand equity and consumer
behavior. Journal of business research, 69(12), pp.5833-5841,[Accessed 18 Oct. 2018].
Hollensen, S. and Raman, A., 2014.Social Media Marketing. Marketing Canada-Journal
[Accessed 25 Oct. 2018].
Islam, M.J.U., 2016. Using Facebook brand communities to engage customers: a new
perspective of relationship marketing. PEOPLE: International Journal of Social Sciences, 2(1)
[Accessed 7 Nov. 2018].
Kannan, P.K., 2017. Digital marketing: A framework, review and research agenda. International
Journal of Research in Marketing, 34(1), pp.22-45 [Accessed 06 Nov. 2018].
Kaur, H., 2016. A Systematic Review on the Field of Digital Marketing. International Journal Of
Technology And Computing, 2(12), pp.539-543 [Accessed 11 Nov. 2018].

Krebs, F., Lubascher, B., Moers, T., Schaap, P. and Spanakis, G., 2017. Social Emotion Mining
Techniques for Facebook Posts Reaction Prediction. arXiv preprint arXiv:1712.03249 [Accessed
1 Nov. 2018].
Kumar, Y. and Singh, S., 2017. Recent Adavencement in the field of Digital Marketing: A Review
[Accessed 19 Oct. 2018].
Öztamur, D. and Karakadılar, İ.S., 2017. Exploring the role of social media for SMEs: as a new
marketing strategy tool for the firm performance perspective. Procedia-Social and behavioral
sciences, 150, pp.511-520 [Accessed 24 Oct. 2018].
Packer, R., 2013. Social media marketing. The Art of Conversational Sales. WSI [Accessed 04
Nov. 2018].
Paul, P., Bhuimali, A., Aithal, P.S. and Bhowmick, S., 2018. Business Information Sciences
emphasizing Digital Marketing as an emerging field of Business & IT: A Study of Indian Private
Universities [Accessed 19 Oct. 2018].
Pikas, B. and Sorrentino, G., 2017. The effectiveness of online advertising: consumer’s
perceptions of ads on Facebook, Twitter and YouTube. Journal of Applied Business and
Economics, 16(4), pp.70-81 [Accessed 22 Oct. 2018].
Ramprathap, K., Rajaram, S., Sriram, V.P. and Ahamed, S.I., 2017. THE IMPACT OF SOCIAL
MEDIA MARKETING ON CONSUMER BEHAVIOR AND BRAND [Accessed 30 Oct. 2018].
Ramsaran-Fowdar, R.R. and Fowdar, S., 2016. The implications of Facebook marketing for
organizations. Contemporary Management Research, 9(1) [Accessed 27 Oct. 2018].

Richardson, P.S., Choong, P. and Parker, M., 2016. Social Media Marketing Strategy: Theory and
Research Propositions. Journal of Marketing Development and Competitiveness, 10(2), p.24
[Accessed 03 Nov. 2018].
Roberts, K.K., 2018. Privacy and perceptions: How Facebook advertising affects its users. The
Elon Journal of Undergraduate Research in Communications, 1(1), pp.24-34 [Accessed 2 Nov.
2018].
Shaikh, N., Siddiqui, M.E., Vasatkar, K., Jagtap, Y. and Sankpal, L.J., 2016. Social media
marketing. International Research Journal of Engineering and Technology, 3(6), pp.870-872.
[Accessed 26 Oct. 2018].
Srinivas, P., Priya, K. and Pinky, M., 2018. TRAVEL FROM TRADITIONAL MARKETING TO DIGITIAL
MRKETING. Journal of Commerce Journal ofCommerce, p.229 [Accessed 15 Oct. 2018].
Stelzner, M., 2014. 2014 social media marketing industry report. Social Media Examiner, pp.1-
52 [Accessed 7 Nov. 2018].
Tanha, M.A., 2018. AN INTRODUCTION TO BRAND BUILDING VIA SOCIAL MEDIA. [Accessed 28
Oct. 2018].
Thakkar, M.S.V. and Hanif, K., 2017. Study on the Facebook Habits of Indian
Consumers. Reflections-Journal of Management, 5 [Accessed 15 Nov. 2018].
Zahoor, S.Z. and Qureshi, I.H., 2017. Social Media Marketing and Brand Equity: A Literature
Review. IUP Journal of Marketing Management, 16(1), p.47 [Accessed 04 Nov. 2018].

Zhu, Y.Q. and Chen, H.G., 2015. Social media and human need satisfaction: Implications for
social media marketing. Business horizons, 58(3), pp.335-345 [Accessed 29 Oct. 2018].
Websites
Bhasin, H. (2016). Keller’s Brand equity Model – CBBE Model - Brand Equity Pyramid. [online]
Marketing91. Available at: https://www.marketing91.com/kellers-brand-equity-model/
[Accessed 2 Dec. 2018].
Emarketer.com. (2017). Facebook Users and Penetration in India, 2016-2021 (millions, %
change and % of social network users)-eMarketer. [online] Available at:
https://www.emarketer.com/Chart/Facebook-Users-Penetration-India-2016-2021-millions-
change-of-social-network-users/208640 [Accessed 5 Dec. 2018].
Emarketer.com. (2018). eMarketer Forecasts Strong Growth in Facebook Users in India -
eMarketer. [online] Available at: https://www.emarketer.com/Article/eMarketer-Forecasts-
Strong-Growth-Facebook-Users-India/1016081 [Accessed 7 Dec. 2018].
Forbes. (2018). Nescafe on the Forbes World's Most Valuable Brands List. [online] Available at:
https://www.forbes.com/companies/nescafe/#7502fa345854 [Accessed 4 Dec. 2018].
Forbes.com. (2018). How To Understand Your Customer's Decision Journey. [online] Available
at: https://www.forbes.com/sites/forbesagencycouncil/2017/11/07/how-to-understand-your-
customers-decision-journey/ [Accessed 6 Dec. 2018].
Ghattas, S. (2018). What Is The Future Of Digital Marketing?[online] Forbes. Available at:
https://www.forbes.com/sites/forbesagencycouncil/2018/03/28/what-is-the-future-of-digital-
marketing/#637f7d9c31e3 [Accessed 24 Oct. 2018].
Indian Advertising Media & Marketing News – exchange4media. (2018). Zenith forecasts ad
spends for India in 2018 will close at Rs 62,699cr - Exchange4media. [online] Available at:
https://www.exchange4media.com/marketing-news/zenith-forecasts-ad-spends-for-india-in-
2018-will-close-at-rs-62699cr-93235.html [Accessed 2 Dec. 2018].
Indian Advertising Media & Marketing News – exchange4media. (2018). Nescafé, building the
next generation of coffee lovers: Sunayan Mitra, VP - Marketing & Business Head -
Exchange4media. [online] Available at: https://www.exchange4media.com/marketing-
news/nescafe-building-the-next-generation-of-coffee-lovers-sunayan-mitra-vp-marketing-
business-head-91152.html [Accessed 1 Dec. 2018].
Interbrand.(2018). Best Brands - Interbrand. [online] Available at:
https://www.interbrand.com/best-brands/best-global-brands/2018/ranking/nescafe/
[Accessed 15 Oct. 2018].
McKinsey & Company. (2018). The consumer decision journey. [online] Available at:
https://www.mckinsey.com/business-functions/marketing-and-sales/our-insights/the-
consumer-decision-journey [Accessed 9 Dec. 2018].
Smart Insights. (2018). What is Digital Marketing? A visual summary - Smart Insights. [Online]
Available at: https://www.smartinsights.com/digital-marketing-strategy/what-is-digital-
marketing/ [Accessed 19 Oct. 2018].
The Drum. (2018). Why Nescafe is deepening its ties with Facebook. [online] Available at:
https://www.thedrum.com/news/2016/11/15/why-nescafe-deepening-its-ties-with-facebook
[Accessed 1 Dec. 2018].
Blogs
Kapost Content Marketing Blog. (2018). 6 Different Types of Buyer Journey Maps - Kapost
Content Marketing Blog. [online] Available at: https://marketeer.kapost.com/6-different-types-
of-buyer-journey-maps/ [Accessed 8 Dec. 2018].
Krohe, B. (2018). The Basics for Building the Best Buyer's Journey Map - PowerPost. [online]
PowerPost. Available at: https://www.powerpost.digital/insights/the-basics-for-building-the-
best-buyers-journey-map/ [Accessed 8 Dec. 2018].
Medium. (2018). The Marketing Tunnel vs. The Consumer Decision Journey. What’s next?.
[online] Available at: https://medium.com/@14ideas/the-marketing-tunnel-vs-the-consumer-
decision-journey-whats-next-dc3d36085487 [Accessed 7 Dec. 2018].
PowerPost. (2018). Five Types of Buyer’s Journey Maps - PowerPost. [online] Available at:
https://www.powerpost.digital/insights/five-types-of-buyers-journey-maps/ [Accessed 9 Dec.
2018].
Redalkemi.com. (2018). Future Marketing Trends for 2019 & 2020! - RedAlkemi. [online]
Available at: https://www.redalkemi.com/blog/post/future-trends-in-digital-marketing-for-
2019,[Accessed 12 Oct. 2018].
Salesforce Blog. (2018). Salesforce Releases Digital Advertising 2020 Report - Convergence,
Data, and Measurement Drive Ad Transformation. [online] Available at:
https://www.salesforce.com/blog/2018/01/salesforce-digital-advertising-2020-report.html
[Accessed 16 Oct. 2018].

Stephen Waddington. (2018). PESO explained for marketing and public relations. [online]
Available at: https://wadds.co.uk/blog/peso-for-marketing-and-pr [Accessed 3 Dec. 2018].

Appendices
Appendix 1: Questionnaire
Information sheet and consent form are accompanied with the questionnaire.


Appendix 2: Snapshot of meetings with supervisor
Following are the snapshots of meetings. Total six meetings were conducted.
Fig 1 : Meeting No. 1 (12th Oct’18)
Fig 2 : Meeting No. 2 (18th Oct’18)

Fig 3 : Meeting No. 3 (14th Nov’18)
Fig 4 : Meeting No. 4 (22nd Nov’18)

Fig 5 : Meeting No. 5 (5th Dec’18)
Fig 6 : Meeting No. 6 (12th Dec’18)
Copyright © 2022 FDOKUMEN