Exploiting EST databases for the development and characterization of EST-SSR markers in castor bean...
10
RESEARCH ARTICLE Open Access Exploiting EST databases for the development and characterization of EST-SSR markers in castor bean (Ricinus communis L.) Lijun Qiu 1,3 , Chun Yang 1 , Bo Tian 1 , Jun-Bo Yang 2 , Aizhong Liu 1* Abstract Background: The castor bean (Ricinus communis L.), a monotypic species in the spurge family (Euphorbiaceae, 2n = 20), is an important non-edible oilseed crop widely cultivated in tropical, sub-tropical and temperate countries for its high economic value. Because of the high level of ricinoleic acid (over 85%) in its seed oil, the castor bean seed derivatives are often used in aviation oil, lubricants, nylon, dyes, inks, soaps, adhesive and biodiesel. Due to lack of efficient molecular markers, little is known about the population genetic diversity and the genetic relationships among castor bean germplasm. Efficient and robust molecular markers are increasingly needed for breeding and improving varieties in castor bean. The advent of modern genomics has produced large amounts of publicly available DNA sequence data. In particular, expressed sequence tags (ESTs) provide valuable resources to develop gene-associated SSR markers. Results: In total, 18,928 publicly available non-redundant castor bean EST sequences, representing approximately 17.03 Mb, were evaluated and 7732 SSR sites in 5,122 ESTs were identified by data mining. Castor bean exhibited considerably high frequency of EST-SSRs. We developed and characterized 118 polymorphic EST-SSR markers from 379 primer pairs flanking repeats by screening 24 castor bean samples collected from different countries. A total of 350 alleles were identified from 118 polymorphic SSR loci, ranging from 2-6 per locus (A) with an average of 2.97. The EST-SSR markers developed displayed moderate gene diversity (H e ) with an average of 0.41. Genetic relationships among 24 germplasms were investigated using the genotypes of 350 alleles, showing geographic pattern of genotypes across genetic diversity centers of castor bean. Conclusion: Castor bean EST sequences exhibited considerably high frequency of SSR sites, and were rich resources for developing EST-SSR markers. These EST-SSR markers would be particularly useful for both genetic mapping and population structure analysis, facilitating breeding and crop improvement of castor bean. Background Castor bean (Ricinus communis L., Euphorbiaceae, 2n = 20) is an important non-edible oilseed crop and its seed derivatives are often used in aviation oil, lubricants, nylon, dyes, inks, soaps, adhesive and biodiesel. Among all the vegetable oils, castor bean oil is distinctive due to its high level of ricinoleic acid (over 85%), a fatty acid consisting of 18 carbons, a double bond between C9 and C10, and a hydroxyl group attached to C12. Ricinoleic acid is responsible for castor bean oil interest, with the highest and most stable viscosity index among all the vegetable oils combined with high lubricity, espe- cially under low-temperature conditions. Although it was found that castor bean seeds had been used by peo- ple dating from about 4000 BC [1], it is still an unan- swered question about the origin of castor bean cultivation. Castor bean’s contemporary distribution in the warmer regions is worldwide, although its origin is obscured by wide dissemination in ancient times and the ease and rapidity with which it becomes established. Castor bean is indigenous to southeastern Mediterra- nean Basin, Eastern Africa, and India, and most prob- ably originated in tropical Africa [2,3]. Because of its * Correspondence: [email protected] 1 Key Laboratory of Tropical Forest Ecology, Xishuangbanna Tropical Botanical Garden, Chinese Academy of Sciences, 88 Xuefu Road, Kunming 650223, PR China Full list of author information is available at the end of the article Qiu et al. BMC Plant Biology 2010, 10:278 http://www.biomedcentral.com/1471-2229/10/278 © 2010 Qiu et al; licensee BioMed Central Ltd. This is an Open Access article distributed under the terms of the Creative Commons Attribution License (http://creativecommons.org/licenses/by/2.0), which permits unrestricted use, distribution, and reproduction in any medium, provided the original work is properly cited.
-
Upload
independent -
Category
Documents
-
view
1 -
download
0
Transcript of Exploiting EST databases for the development and characterization of EST-SSR markers in castor bean...

RESEARCH ARTICLE Open Access
Exploiting EST databases for the developmentand characterization of EST-SSR markers incastor bean (Ricinus communis L.)Lijun Qiu1,3, Chun Yang1, Bo Tian1, Jun-Bo Yang2, Aizhong Liu1*
Abstract
Background: The castor bean (Ricinus communis L.), a monotypic species in the spurge family (Euphorbiaceae,2n = 20), is an important non-edible oilseed crop widely cultivated in tropical, sub-tropical and temperatecountries for its high economic value. Because of the high level of ricinoleic acid (over 85%) in its seed oil, thecastor bean seed derivatives are often used in aviation oil, lubricants, nylon, dyes, inks, soaps, adhesive andbiodiesel. Due to lack of efficient molecular markers, little is known about the population genetic diversity and thegenetic relationships among castor bean germplasm. Efficient and robust molecular markers are increasinglyneeded for breeding and improving varieties in castor bean. The advent of modern genomics has produced largeamounts of publicly available DNA sequence data. In particular, expressed sequence tags (ESTs) provide valuableresources to develop gene-associated SSR markers.
Results: In total, 18,928 publicly available non-redundant castor bean EST sequences, representing approximately17.03 Mb, were evaluated and 7732 SSR sites in 5,122 ESTs were identified by data mining. Castor bean exhibitedconsiderably high frequency of EST-SSRs. We developed and characterized 118 polymorphic EST-SSR markers from379 primer pairs flanking repeats by screening 24 castor bean samples collected from different countries. A total of350 alleles were identified from 118 polymorphic SSR loci, ranging from 2-6 per locus (A) with an average of 2.97.The EST-SSR markers developed displayed moderate gene diversity (He) with an average of 0.41. Geneticrelationships among 24 germplasms were investigated using the genotypes of 350 alleles, showing geographicpattern of genotypes across genetic diversity centers of castor bean.
Conclusion: Castor bean EST sequences exhibited considerably high frequency of SSR sites, and were richresources for developing EST-SSR markers. These EST-SSR markers would be particularly useful for both geneticmapping and population structure analysis, facilitating breeding and crop improvement of castor bean.
BackgroundCastor bean (Ricinus communis L., Euphorbiaceae, 2n =20) is an important non-edible oilseed crop and its seedderivatives are often used in aviation oil, lubricants,nylon, dyes, inks, soaps, adhesive and biodiesel. Amongall the vegetable oils, castor bean oil is distinctive due toits high level of ricinoleic acid (over 85%), a fatty acidconsisting of 18 carbons, a double bond between C9and C10, and a hydroxyl group attached to C12.
Ricinoleic acid is responsible for castor bean oil interest,with the highest and most stable viscosity index amongall the vegetable oils combined with high lubricity, espe-cially under low-temperature conditions. Although itwas found that castor bean seeds had been used by peo-ple dating from about 4000 BC [1], it is still an unan-swered question about the origin of castor beancultivation. Castor bean’s contemporary distribution inthe warmer regions is worldwide, although its origin isobscured by wide dissemination in ancient times andthe ease and rapidity with which it becomes established.Castor bean is indigenous to southeastern Mediterra-nean Basin, Eastern Africa, and India, and most prob-ably originated in tropical Africa [2,3]. Because of its
* Correspondence: [email protected] Laboratory of Tropical Forest Ecology, Xishuangbanna Tropical BotanicalGarden, Chinese Academy of Sciences, 88 Xuefu Road, Kunming 650223, PRChinaFull list of author information is available at the end of the article
Qiu et al. BMC Plant Biology 2010, 10:278http://www.biomedcentral.com/1471-2229/10/278
© 2010 Qiu et al; licensee BioMed Central Ltd. This is an Open Access article distributed under the terms of the Creative CommonsAttribution License (http://creativecommons.org/licenses/by/2.0), which permits unrestricted use, distribution, and reproduction inany medium, provided the original work is properly cited.
high economic value, castor bean is widely cultivated intropical, sub-tropical and temperate countries, particu-larly India, China and Brazil [4]. Due to increaseddemand for castor bean in many countries, breedingand improvement of varieties are drawing great atten-tion from breeders [5].Although the genus Ricinus is considered monotypic,
castor bean varies greatly in its growth habit, color offoliage and stems, seed size and oil content [6,7]. Mosttypes are large perennials that often develop into smalltrees in tropical or subtropical areas; however it isusually shorter and smaller and grown annually in areasprone to frost. It is obvious that castor bean exhibitsgreat phenotypic diversity and phenotypic plasticity toenvironmental factors. However, little is known aboutcastor bean’s genetic diversity and the genetic basis ofits phenotypic plasticity. Castor bean is usually consid-ered to be both self- and cross-pollinated by wind, butcontrolled crossing studies suggest that outcrossing is afrequent mode of reproduction [8,9].Germplasm collections constitute one of the world’s
most readily available sources of plant genetic material[10]. The USDA-ARS Plant Genetic Resources Conser-vation Unit (at Griffin, GA, USA) collected and main-tained diverse germplasm resources of castor beanworldwide, which provided valuable germplasms for cas-tor bean breeding and improvement of varieties. Thereis an increasing need for distinguishing the varieties reli-ably, establishing their purity, and fingerprintingreleased varieties, hybrids and the parental lines of cas-tor bean germplasm held in different countries by effi-cient molecular markers during breeding andimprovement of varieties. Most cultivars have low pro-ductivity. The castor bean seed, meanwhile, contains thehighly toxic protein ricin which seriously limits itsusage. The main goal of breeding and improvement ofvarieties to breeders is to develop high-productivity andnontoxic varieties of castor bean. Developing robust andreliable molecular markers associated with traits ofinterest will enhance the breeding program efficiency.Simple sequence repeats (SSRs) or microsatellites
showing extensive length polymorphisms have beenwidely used in DNA fingerprinting, genetic diversity stu-dies, construction of genetic linkage map and breedingapplications [11]. Previous studies of genetic diversitysuggested that SSRs are more informative and robustthan other available molecular marker resources, suchas amplified fragment length polymorphism (AFLP) andrandom amplified polymorphic DNA (RAPD) in castorbean [12,13]. In particular, SSR markers are readilytransferable between laboratories as each locus isdefined by the primer sequence. SSRs can be used notonly for identifying cultivars but also for genetic map-ping and marker-assisted selection [14,15]. Development
of SSR markers specific to castor bean is critical andshould be a priority for assisting in the breeding andimprovement of varieties [5]. The SSR markers of castorbean are, however, very limited to date because thede novo development of SSRs is a costly and time con-suming endeavor [16,17]. The advent of modern geno-mics age has produced large amounts of publiclyavailable DNA sequence data. In particular, theexpressed sequence tags (ESTs) provide a valuableresource for identifying and developing gene-associatedSSR markers. Linkage of EST-SSR markers with desiredcharacters may lead to the identification of genes con-trolling these traits [18]. In addition, EST-SSRs are uni-versal and can be applied in comparative mapping andlinkage map construction [19,20]. Therefore, in recentyears, EST-SSRs have already been developed for variouscrops such as wheat and rice [21-25], barley [26-28],grape [29], tomato [30], sugar cane [19], coffee [31-33],oil palm [34] and rubber tree [35].To our knowledge, there has been no report of devel-
opment of EST-SSR markers in castor bean to date.Therefore, we report our work on EST-SSRs derivedfrom castor bean ESTs in the National Centre of Bioin-formatics Information, USA database, based on (1) thefrequency and distribution of SSRs in castor bean ESTs,(2) the establishment and validation of EST-SSR mar-kers for detection of polymorphism in castor bean, and(3) the assessment of genetic relationships among 24germplasm accessions collected from main diversity cen-ters of castor bean by using EST-SSR markers devel-oped. These rich SSR resources from castor bean ESTdatabase are publicly available and the polymorphicEST-SSR markers reported herein would be particularlyuseful for genetic map-based analyses as well as popula-tion genetic studies, facilitating breeding and cropimprovement of castor bean.
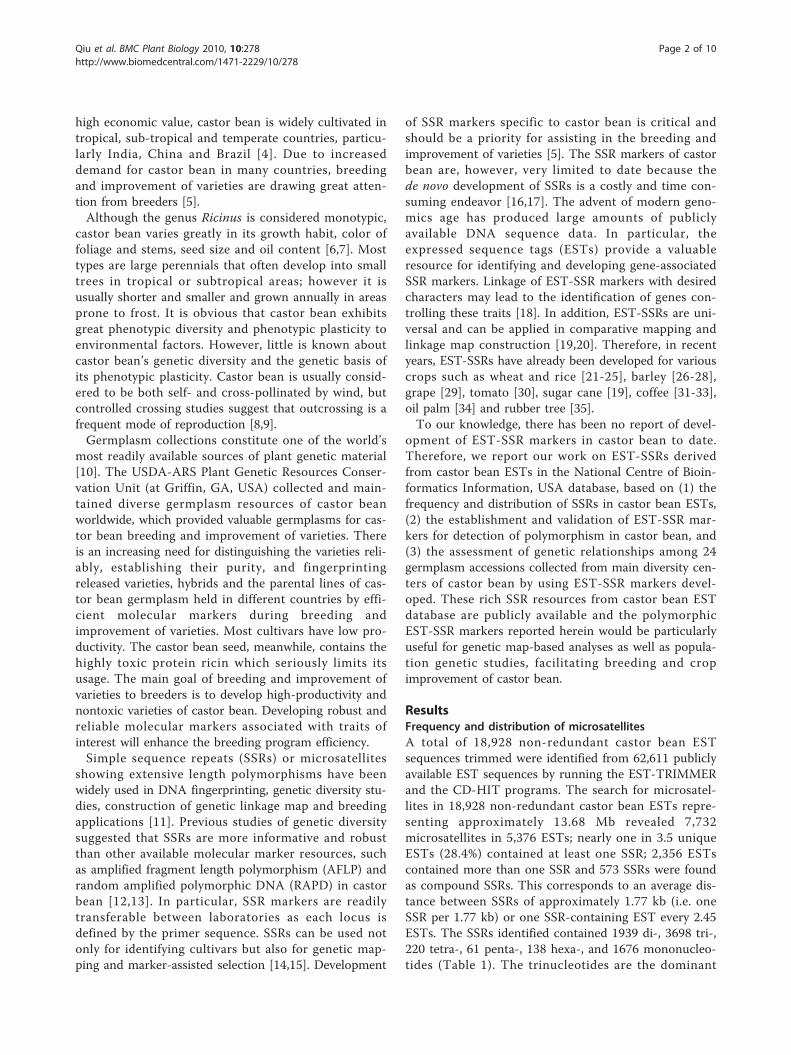
ResultsFrequency and distribution of microsatellitesA total of 18,928 non-redundant castor bean ESTsequences trimmed were identified from 62,611 publiclyavailable EST sequences by running the EST-TRIMMERand the CD-HIT programs. The search for microsatel-lites in 18,928 non-redundant castor bean ESTs repre-senting approximately 13.68 Mb revealed 7,732microsatellites in 5,376 ESTs; nearly one in 3.5 uniqueESTs (28.4%) contained at least one SSR; 2,356 ESTscontained more than one SSR and 573 SSRs were foundas compound SSRs. This corresponds to an average dis-tance between SSRs of approximately 1.77 kb (i.e. oneSSR per 1.77 kb) or one SSR-containing EST every 2.45ESTs. The SSRs identified contained 1939 di-, 3698 tri-,220 tetra-, 61 penta-, 138 hexa-, and 1676 mononucleo-tides (Table 1). The trinucleotides are the dominant
Qiu et al. BMC Plant Biology 2010, 10:278http://www.biomedcentral.com/1471-2229/10/278
Page 2 of 10
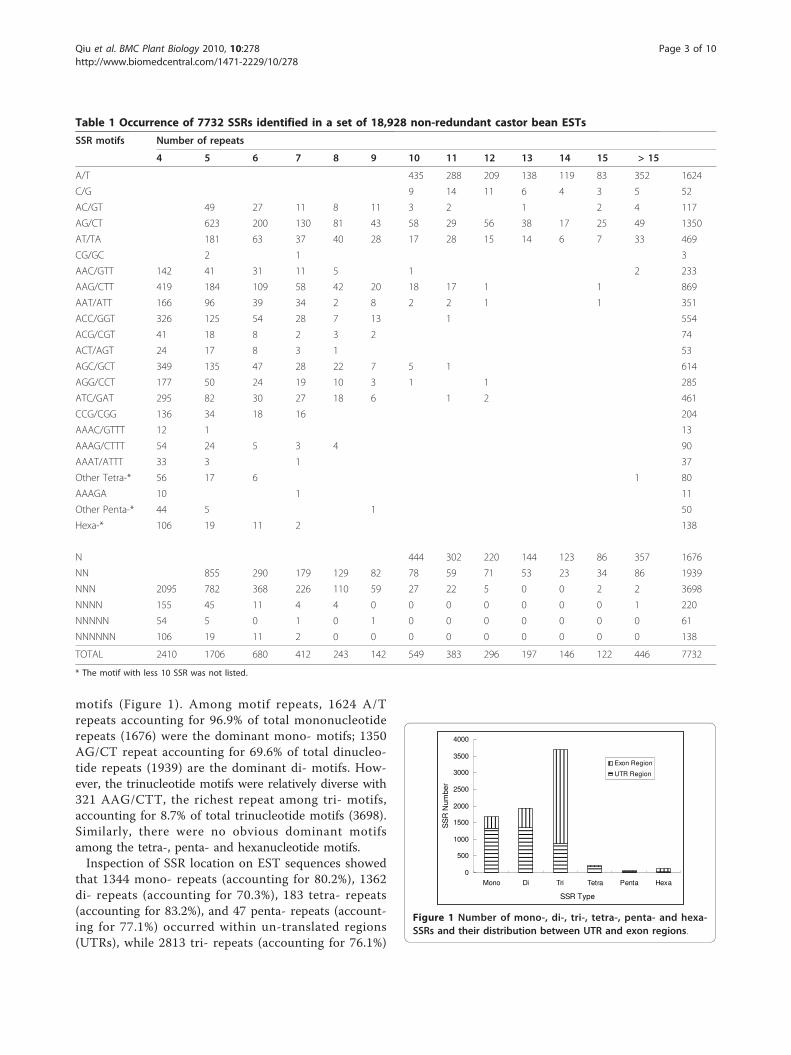
motifs (Figure 1). Among motif repeats, 1624 A/Trepeats accounting for 96.9% of total mononucleotiderepeats (1676) were the dominant mono- motifs; 1350AG/CT repeat accounting for 69.6% of total dinucleo-tide repeats (1939) are the dominant di- motifs. How-ever, the trinucleotide motifs were relatively diverse with321 AAG/CTT, the richest repeat among tri- motifs,accounting for 8.7% of total trinucleotide motifs (3698).Similarly, there were no obvious dominant motifsamong the tetra-, penta- and hexanucleotide motifs.Inspection of SSR location on EST sequences showed
that 1344 mono- repeats (accounting for 80.2%), 1362di- repeats (accounting for 70.3%), 183 tetra- repeats(accounting for 83.2%), and 47 penta- repeats (account-ing for 77.1%) occurred within un-translated regions(UTRs), while 2813 tri- repeats (accounting for 76.1%)
Table 1 Occurrence of 7732 SSRs identified in a set of 18,928 non-redundant castor bean ESTs
SSR motifs Number of repeats
4 5 6 7 8 9 10 11 12 13 14 15 > 15
A/T 435 288 209 138 119 83 352 1624
C/G 9 14 11 6 4 3 5 52
AC/GT 49 27 11 8 11 3 2 1 2 4 117
AG/CT 623 200 130 81 43 58 29 56 38 17 25 49 1350
AT/TA 181 63 37 40 28 17 28 15 14 6 7 33 469
CG/GC 2 1 3
AAC/GTT 142 41 31 11 5 1 2 233
AAG/CTT 419 184 109 58 42 20 18 17 1 1 869
AAT/ATT 166 96 39 34 2 8 2 2 1 1 351
ACC/GGT 326 125 54 28 7 13 1 554
ACG/CGT 41 18 8 2 3 2 74
ACT/AGT 24 17 8 3 1 53
AGC/GCT 349 135 47 28 22 7 5 1 614
AGG/CCT 177 50 24 19 10 3 1 1 285
ATC/GAT 295 82 30 27 18 6 1 2 461
CCG/CGG 136 34 18 16 204
AAAC/GTTT 12 1 13
AAAG/CTTT 54 24 5 3 4 90
AAAT/ATTT 33 3 1 37
Other Tetra-* 56 17 6 1 80
AAAGA 10 1 11
Other Penta-* 44 5 1 50
Hexa-* 106 19 11 2 138
N 444 302 220 144 123 86 357 1676
NN 855 290 179 129 82 78 59 71 53 23 34 86 1939
NNN 2095 782 368 226 110 59 27 22 5 0 0 2 2 3698
NNNN 155 45 11 4 4 0 0 0 0 0 0 0 1 220
NNNNN 54 5 0 1 0 1 0 0 0 0 0 0 0 61
NNNNNN 106 19 11 2 0 0 0 0 0 0 0 0 0 138
TOTAL 2410 1706 680 412 243 142 549 383 296 197 146 122 446 7732
* The motif with less 10 SSR was not listed.
0
500
1000
1500
2000
2500
3000
3500
4000
Mono Di Tri Tetra Penta Hexa
SSR Type
SS
R N
umbe
r
Exon Region
UTR Region
Figure 1 Number of mono-, di-, tri-, tetra-, penta- and hexa-SSRs and their distribution between UTR and exon regions.
Qiu et al. BMC Plant Biology 2010, 10:278http://www.biomedcentral.com/1471-2229/10/278
Page 3 of 10
and 101 hexa- repeats (accounting for 73.2%) occurredwithin expression regions (see Figure 1).
Polymorphism and genera transferability of EST-SSRsmarkersOut of 6056 SSR embedded within 3871 ESTs, exclud-ing 1676 MNRs, primer pairs could be designed for4223 SSR loci (69.7%) by using PRIMER3. The remain-ing sequences contained either too little DNA sequenceflanking the SSR loci or the sequences were inappropri-ate for primer modeling. Three hundred and seventy-nine primer pairs flanking 151 di-nucleotide repeats(DNRs), 185 tri-nucleotide repeats (TNRs), 35 tetra-nucleotide repeats (TeNRs), 4 penta- nucleotide repeats(PNRs) and 4 Hexa-nucleotide repeats (HNRs) wereassayed to test the polymorphism and genera transfer-ability of EST-SSRs in 24 accessions worldwide (seeadditional file 1, Table S1, additional). In 308 (81.2%)cases, PCR products could be amplified with genomicDNA, while for 71 primer pairs PCR completely failed,amplified too weakly, or amplified multiple bands andthe 71 primers were excluded from further analysis (seeadditional file 2 Table S2, additional). In 21 cases, theamplicons obtained were of obviously larger size thanexpected from the EST sequence, probably due to thepresence of introns. The amplification of introns maycause problems, since fragments above 300 bp could notbe scored accurately for small differences in fragmentsize. Additionally, it can be assumed that in severalcases the observed polymorphism is caused by a sizepolymorphism within the intron, which may overshadowa putative polymorphism of the microsatellite. Thus the21 primer pairs containing obvious introns and produ-cing over 300 bp fragments were also excluded fromfurther analyses. One Hundred and sixty-nine primerpairs were monomorphic, covering 56 di- motif loci, 104tri- motif loci and 9 tetra- motif loci. In total, 118 poly-morphic EST-SSR markers from 287 primer pairs were
identified, including 68 di- motif loci, 42 tri- motif lociand 8 tetra- motif loci (see additional file 2, Table S2,additional). The proportion of polymorphic primers was41.1%. The polymorphic proportion of di-, tri-, andtetra- motif loci were 54.8%, 28.8% and 47%, respec-tively. From the 118 loci we identified 350 alleles withan average of 2.97 alleles per locus (Table S3, Figure 2).Of the 350 alleles, 223 alleles were from di- loci with anaverage of 3.28 per locus, 107 alleles were from tri- lociwith an average of 2.49 per locus. Across 118 loci, genediversity (expected heterozygosity, He) ranged from 0.08to 0.78 (mean = 0.41 ± 0.02). Among 68 dinucleotideloci and 42 trinucleotide loci, the mean of He were 0.44and 0.37, respectively. Across dinucleotide and trinu-cleotide loci, dinucleotide SSRs were significantly morepolymorphic than trinucleotide SSRs (nA and He bothP < 0.01; 2-sample t test). Across 118 loci, PIC valuesranged from 0.07 to 0.73 (mean = 0.36 ± 0.02), suggest-ing the EST-SSR markers developed had moderate levelof polymorphism. BLAST analyses showed that 76 ESTsequences from the developed 118 polymorphic SSRmarkers shared significant homology to Arabidopsis loci.The functional annotations of markers developed werelisted in Table S3 (see additional file 3, additional).To test the genera transferability of EST-SSRs identifiedin castor bean to Jatropha curcas and Speranskia canto-nensis, the 308 primer pairs, which could successfullyamplify PCR products in castor bean were tested foramplification of the genomic DNA of J. curcas andS. cantonensis with the same PCR conditions used incastor bean. 155 of 308 (50.2%) primer pairs amplifiedin S. cantonensis, and 74 of 308 (24.0%) primer pairsamplified in J. curcas (see additional file 1, Table S1,additional).
Genetic relationships among germplasmsA dendrogram based on UPGMA Nei-Li’s criteria wasgenerated with five distinct clusters (Figure 3). Cluster I
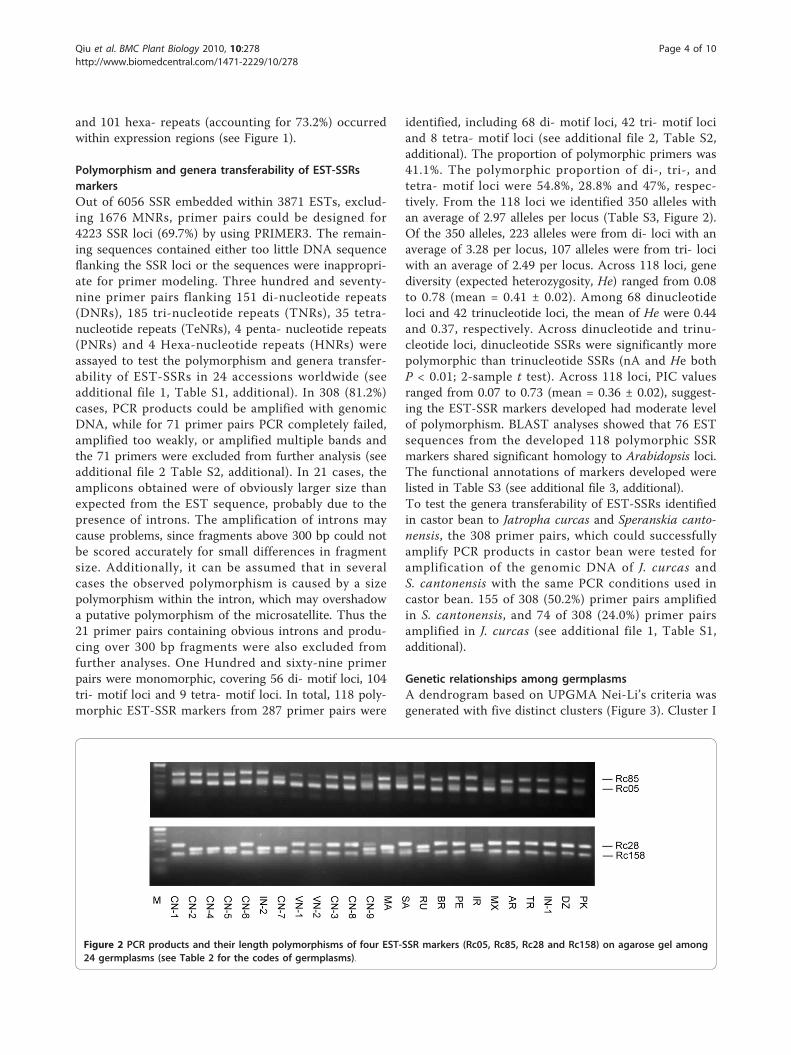
Figure 2 PCR products and their length polymorphisms of four EST-SSR markers (Rc05, Rc85, Rc28 and Rc158) on agarose gel among24 germplasms (see Table 2 for the codes of germplasms).
Qiu et al. BMC Plant Biology 2010, 10:278http://www.biomedcentral.com/1471-2229/10/278
Page 4 of 10
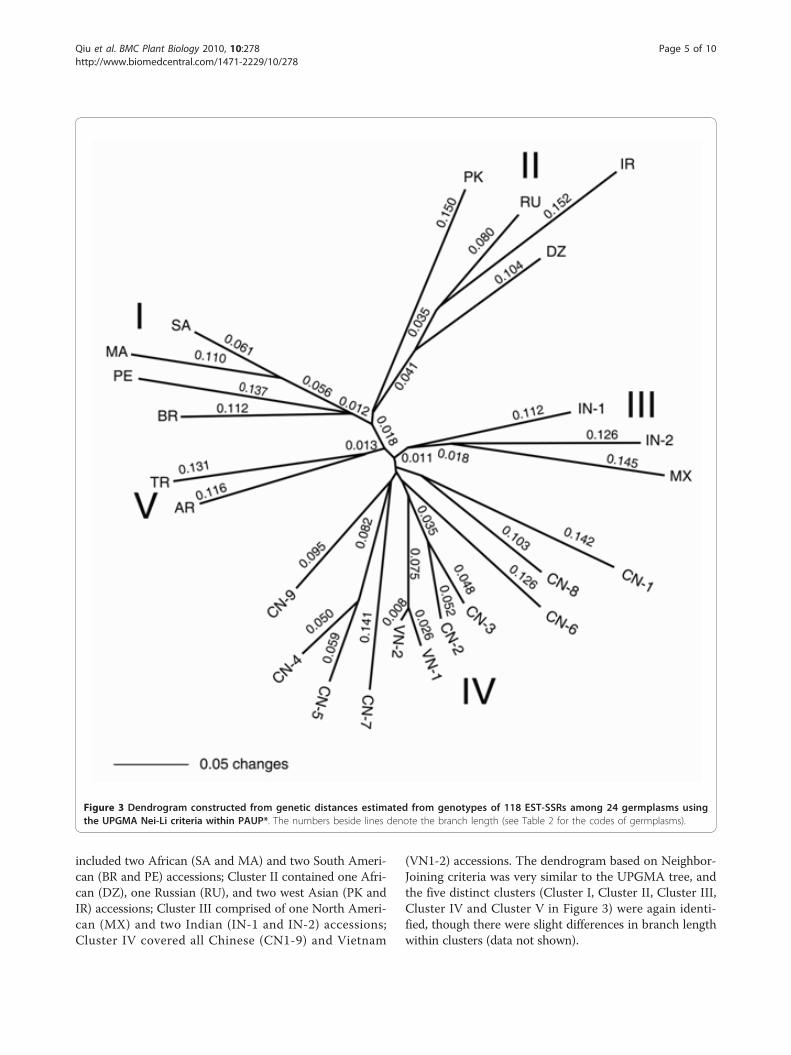
included two African (SA and MA) and two South Ameri-can (BR and PE) accessions; Cluster II contained one Afri-can (DZ), one Russian (RU), and two west Asian (PK andIR) accessions; Cluster III comprised of one North Ameri-can (MX) and two Indian (IN-1 and IN-2) accessions;Cluster IV covered all Chinese (CN1-9) and Vietnam
(VN1-2) accessions. The dendrogram based on Neighbor-Joining criteria was very similar to the UPGMA tree, andthe five distinct clusters (Cluster I, Cluster II, Cluster III,Cluster IV and Cluster V in Figure 3) were again identi-fied, though there were slight differences in branch lengthwithin clusters (data not shown).
Figure 3 Dendrogram constructed from genetic distances estimated from genotypes of 118 EST-SSRs among 24 germplasms usingthe UPGMA Nei-Li criteria within PAUP*. The numbers beside lines denote the branch length (see Table 2 for the codes of germplasms).
Qiu et al. BMC Plant Biology 2010, 10:278http://www.biomedcentral.com/1471-2229/10/278
Page 5 of 10
DiscussionSSR frequency and distributionThe non-redundant EST sequences provided a moreaccurate representation of the densities of SSR motifs inthe transcribed portions of the genome [20,32]. Basedon the 18,928 non-redundant castor EST sequences,7732 SSRs were identified. The overall density of SSRsis one SSR per 1.77 kb, nearly one in 3.5 unique ESTs(23.6%). Using the same cut-off criteria, Ellis and Burkeinspected the frequency of EST-SSRs from 33 plant gen-era and found that the frequency varied from one inevery 5 unique ESTs (21%) to one in every 40 uniqueESTs (2.5%), with a mean frequency of nearly one SSR-ESTs in every 10 unique ESTs (9.0%) [18]. Compared tothe 33 plant genera, castor exhibits considerably highfrequency of EST-SSRs. To further compare the overalldensities of SSRs in castor bean EST sequences withthat reported in other plants, we used the same cut-offcriteria as Cardle et al. [21] with 7, 5, 4 and 4 repeatsfor di-, tri-, tetra- and penta-, respectively, excluding themono-repeats. Correspondingly, we identified 2710 SSRswith one SSR per 5.0 kb (1/5.0kb) EST sequence incastor. This density is higher than that in soybean(1/7.4 kb), maize (1/8.1 kb), tomato (1/11.1 kb), Arabi-dopsis (1/13.83 kb), poplar (1/14.0 kb), and cotton(1/20.0 kb). However, it is lower than that in rice(1/3.4 kb). Similarly, we separately used the same cut-offcriteria as Aggarwal et al. used in coffee [33], Low et al.used in oil palm [34] and Feng et al. used in rubber tree[35], and identified 10,442 (1/1.31 kb), 4,177 (1/3.3 kb)and 3,616 SSRs (1/3.8 kb) respectively, higher than thatin coffee (1/2.16 kb) and oil palm (1/7.7 kb), and lowerthan that in rubber tree (1/3.39 kb). Varshney et al.assumed that the high frequency of SSR in rice ESTsequences may be due to its small genome size [36].The genome size of castor was estimated to be 323 Mb[37]. The high frequency SSR in castor EST sequencesmay be related to its small genome size.Like other plants, A/T is the main mononucleotide
motif in castor bean EST sequence [23]. Among thedinucleotide repeat motifs identified, AG/CT repeats(1350) were the most common in the dataset, account-ing for 69.6% of the total dinucleotide motifs (1939).These results are consistent with the frequency of DNRsidentified in Arabidopsis, rice, soybean, maize, oil palm,coffee, barley, wheat and rubber tree [23,24,27,32,34,35].Kantety et al. suggested that the high level of occurrenceof GA/CT motifs could be due to the high level ofoccurrence of the translated amino acid products of themotifs [38]. The GA/CT motifs are translated into GAG(Glu), AGA (Arg), CUC (Leu) and UCU (Ser). Weinspected the codon usage from 200 ORFs containing44,298 codons in castor bean EST sequences and
detected 10,892 codons for these four amino acids(24.6% of the total codons analyzed), accounting for thatthe four amino acids have a relatively higher frequencythan the amino acids produced by the other dinucleo-tide repeats (data unshown). Thus, Kantety et al.’sassumption was supported in our study. The CG/GC isthe most rare di- repeat in accordance with thatreported in other plants compared [23,24,27,32,34,35].Varshney et al. reported that among cereal species
TNRs were the most frequent (54-78%) followed byDNRs (17.1-40.4%) and TTNRs (3-6%), excluding MNRs[36]. Our results (excluding MNRs) are consistent withcereal species with the most frequent TNRs (61.1%), fol-lowed by DNRs (32.0%), and TTNRs (3.6%). The abun-dance of trimetric SSRs in ESTs was attributed to theabsence of frameshift mutations in coding regions whenthere is length variation in these SSRs [39]. Among thetri- motifs AAG/CTT is the most frequently occurring(23.5%) in castor bean ESTs, followed by AGC/GCT(16.6%), ACC/GGT (15.0%), ATC/GAT (12.5%), AAT/ATT (9.5%). Morgante et al.’s observation that AAG/CTT is predominant and CCG/CGG is relatively raretri- repeats in dicotyledonous plants [23] was confirmed.The mono-, di-, tetra- and penta- repeat loci mainly
occurred within UTR regions, while tri- and hexa-repeat loci occurred mainly within exon regions. Thisseems to be a common feature of EST-SSRs and hasoften been found in other organisms. This could be aresult of selection and evolution, since tri- and hexa-SSRs do not change the coding frame in coding regionswhen there is a SSR length variation, while mono-, di-,tetra- and penta- SSR easily change the coding framewithin coding regions and give rise to negative mutationwhen the SSR length variation occurred.
Polymorphism of EST-SSR markers and generatransferabilityHitherto, little work has been done on the developmentand application of SSR markers in castor bean geneticand breeding studies. We obtained 118 polymorphicEST-SSR markers from 379 primer pairs within 24germplasm sampled with a polymorphic ratio of 41.1%,excluding the null allele primers and those that harborobvious introns. Compared to other plants, the poly-morphic ratio of EST-SSR primers in castor bean is atthe medium level [20]. These polymorphic EST-SSRmarkers derived herein, to our knowledge, are the firstreport on development of genic microsatellite markersin castor bean to date. Using these 118 polymorphicEST-SSR markers, 350 alleles were identified from 24accessions with an average of 2.97 alleles per marker.Allan et al. reported nine genomic SSR markers with anaverage of 0.403 gene diversity (PIC) and an average of
Qiu et al. BMC Plant Biology 2010, 10:278http://www.biomedcentral.com/1471-2229/10/278
Page 6 of 10
3.01 alleles per locus [13]. Bajay et al. developed 12genomic SSR markers with an average of 0.416 genediversity (He) and an average of 3.3 alleles per locus[40]. Our results displayed that the gene diversity (He)and PIC value of the 118 polymorphic markers were0.41 and 0.36, respectively. These results were consistentwith each another, suggesting that SSR locus of castorbean represents a moderate level of gene diversity. Thegene diversity values (He and PIC) reported herein canserve as a guide in selecting the loci that are most likelyto be informative in further castor bean research.As mentioned above, di- and tetra- SSRs mainly
occurred within UTR regions, while tri- SSRs mainlyoccurred within exon regions. Unsurprisingly, di-(54.8%) and tetra- (47%) motif loci presented higherpolymorphic proportions than tri- motif loci (28.8%) incastor bean, suggesting that the SSRs which occurredwithin UTR are more polymorphic than those in exonregions. Across di- and tri- motif loci, di- motif markerspresented significantly higher gene diversity than thoseof the tri- motif markers. These observations showedthat the SSR loci harbored within UTR regions weremore polymorphic than these harbored within exonregions in castor bean.Transferability of EST-SSRs among closely related
genera has been reported in many crops. Ellis and Burkesummarized the transferability of EST-SSRs among planttaxa and exhibited a variation range of EST-SSRs cross-genera transferability from 10% to 80% [18]. Our resultsindicated that castor bean EST-SSRs had a moderatetransfer rate (50.2%) in S. cantonensis and a relativelylower transfer rate (24.0%) in J. curcas. Raji et al.reported the transfer rate of EST-SSR markers devel-oped from Manihot to castor bean was 15% [41]. Thedifferent cross-genera transferability of EST-SSRs maybe related to the evolutionary distance between thethree genera, since castor bean phylogenetically has amore distant relationship with Jatropha than Speranskiaand Manihot [42].
Evaluation of genetic relationships among germplasmsAs mentioned above, castor bean belongs to amonotypic genus with great phenotypic diversity andphenotypic plasticity. Castor bean is a fast-growing andeasily-establishing perennial shrub under various habi-tats, and is widespread throughout tropical and subtro-pical regions and is often found on wastelands today. Itis difficult to establish castor bean’s origin now, thoughit is thought to be native to the southeastern Mediterra-nean Basin, Eastern Africa, and India. According toMoshkin, there are four main centers of genetic variabil-ity viz., Irano-Afghanistan-USSR region, Palestine-SWAsia, India-China and the Arabian Peninsula, each withits own specific plant characteristics [43]. It is an
acceptable view that castor bean landraces collectedfrom South or North America today were most likelyintroduced from Africa or west Asia in early society dueto human activities.Our current research identified five distinct groups
Clusters I-V within 24 samples using the genotypes of350 alleles. Apparently, the five clusters lacked a geo-graphic structure because the two South Americangermplasms (BR and PE) clustered with two Africanmembers (SA and MA) in Cluster I, and the NorthAmerican accession (MX) clustered with two Indian(IN-1 and IN-2) members in Cluster III. However, if weassume that the two South American germplasms (BRand PE) and the one North American germplasm (MX)were introduced from Africa or west Asia, our currentresearch seems to support, in a way, Moshkin’s view[43], namely, Cluster I represents African members,Clusters II and III represent Irano-Afghanistan-USSRand Palestine-SW Asia members, and Clusters IV and Vrepresent India-China members. It is noteworthy thatthe germplasms sampled in the current study is limitedand incomplete. It remains to be determined whetherthis geographic pattern of germplasm group is presentin a more extensive survey of germplasm samples. Allanet al.’s studies [13] did not identify distinct geographicgroups among worldwide germplasms. The possible rea-sons could be that 1) the polymorphic markers used intheir studies were limited, or 2) many castor bean germ-plasms were introduced or multi-introduced across sev-eral continents due to human activities. It may bedifficult to figure out the origin and domestication ofcastor bean without the genotype of the wild castorbean germplasms. Without a doubt, the polymorphicEST-SSR markers developed herein will provide robustgenetic markers for further investigation of the originand evolution of castor bean, though the geographicstructuring of castor bean germplasms detected fromour current study is uncertain.
ConclusionIn summary, the castor bean EST database harboredhighly rich SSR sites and the EST-SSR markers reportedherein exhibited moderate levels of gene diversity. TheseEST-SSR markers should prove useful for both geneticmapping and population structure analysis, facilitatingbreeding and crop improvement of castor bean.
MethodsPlant material and EST retrievalTwenty-four worldwide accessions representing themain germplasms of castor bean from 14 countries wereused to screen the polymorphism of SSR markers devel-oped, and to investigate the genetic diversity of germ-plasms based on the polymorphic SSR markers. Seeds of
Qiu et al. BMC Plant Biology 2010, 10:278http://www.biomedcentral.com/1471-2229/10/278
Page 7 of 10
each accession were obtained from the USDA NationalPlant Germplasm System http://www.ars-grin.gov/npgs/and our collected landraces in China and Vietnam(Table 2). Phylogenetically, the genus Speranskia has acloser relationship with Ricinus than the genus Jatropha[42]. The genomic DNAs of Jatropha curcas and Sper-anskia cantonensis were used to test the cross-generatransferability of EST-SSR markers which can amplifyPCR products using castor bean genomic DNA. Theseeds of accessions were germinated at a greenhouse,and the young leaves were collected for genomic DNAextraction using a CTAB methodology [44].Castor bean EST sequences were obtained via the
ENTREZ search tool of the EST database at the NCBIhttp://www.ncbi.nlm.nih.gov/nucest. A total of 62,611castor bean ESTs originated from different tissues wereavailable for this study on January 1, 2009, including the750 ESTs (GE632454-GE637384) from developing seeds[45], 158 ESTs (AM267320-AM267478) from phloem[46], 4307 ESTs (EV519634-EV523941) from endosperm[47], 4,902 ESTs (AM267321- AM267479) from devel-oping seeds [Kroon et al. released in 2008, unpublished],329 ESTs (CF981112-CF981441) from seed [Cahoon et
al. released in 2003, unpublished], and the 11,633;24,567; 5,619 and 10,346 ESTs (EG690439-EG702071,EG665872-EG690438, EE254600- EE260857, EG656356-EG665871, EE253769-EE254599) from developing seeds,root, flower and leaf, respectively [Melake et al. releasedin 2006, unpublished]. The FASTA-formatted files ofEST sequences were downloaded for further datamining.
Data mining for SSRsIn a preliminary step, polyA and polyT stretches whichcorrespond to polyA-tails in eukaryotic mRNA wereremoved with the help of the EST-trimmer softwarehttp://www.pgrc.ipk-gathersleben.de/misa/download/est-trimmer.pl until no stretch of (T)5 or (A)5 was presentin a range of 50 bp on the 5’- or 3’-end, respectively.EST sequences of less than 100 bp were discarded andsequences larger than 800 bp were clipped at their 3’side to preclude the inclusion of low quality sequences[27]. To remove redundant ESTs, the CD-HIT program[48] was used with a 95% sequence similarity threshold.Then trimmed non-redundant EST sequences werescanned using the MISA (MIcroSAtellite) tool [27] toidentify all SSRs within a set of sequences. We set thescript to identify all possible mono-, di-, tri-, tetra-,penta- and hexanucleotide repeats (MNRs, DNRs,TNRs, TeNRs, PNRs and HNRs) with a minimum of 10,5, 4, 4, 4, and 4 subunits, respectively. The results of theMISA run were transferred to a Microsoft Excel work-sheet for further analyses.To localize the distribution of SSRs on EST sequences,
the ESTscan2 http://www.ch.embnet.org/software/ESTS-can2.html was used to inspect the ratio of SSR distribu-tion on the transcribed regions (TRs) and UTRs.
PCR conditions and separation of microsatellitesPrimer pairs were designed from the flanking sequences,using PRIMER3 software [49] in batch mode via thep3_in.pl and p3_out.pl Perl5 scripts within the MISApackage [27]. To test the polymorphisms of EST-SSRsidentified in castor bean, we randomly selected 379 pri-mer pairs. The target amplicon size was set as 100-300bp, the optimal annealing temperature as 60°C, and theoptimal primer length as 20 bp.PCR primers were developed and an M13 forward
(GGAAACAGCTATGACCAT) was added to the 5’ endof one of each primer pair using OliGO 6.67 (MolecularBiology Insights) to determine which tag would producethe least offensive secondary structures. Inclusion of the5’-tag allows use of a 3rd primer in the PCR (M13F) thatis fluorescently labeled for detection on ABI3730 DNAAnalyzer. M13F primers were labeled with a FAM fluor-escent dye. PCR reactions were carried out in a 10 μlvolumes containing 1x PCR buffer (10 mM Tris-HCl
Table 2 Germplasm accessions used for testingpolymorphism of EST-SSR markers and inspectinggenetic relationships
Code Genbank ID Homology in Arabidopsis
PI 253621 Morocco (MA) From USDA-ARS*
PI 257461 South Africa (SA) From USDA-ARS
PI 257654 Russia (RU) From USDA-ARS
PI 241369 Brazil (BR) From USDA-ARS
PI 215775 Peru (PE) From USDA-ARS
PI 250938 Iran (IR) From USDA-ARS
PI 255238 Mexico (MX) From USDA-ARS
PI 277025 Argentina (AR) From USDA-ARS
PI 167288 Turkey (TR) From USDA-ARS
PI 248961 India (IN-1) From USDA-ARS
PI 258388 Algeria (DZ) From USDA-ARS
PI 250622 Pakistan (PK) From USDA-ARS
CYB03_1-6 Yunnan, China (CN-1) From XTBG Seed Bank
CYN01_2-1 Yunnan, China (CN-2) From XTBG Seed Bank
CYN20_2-20 Yunnan, China (CN-3) From XTBG Seed Bank
CYN21_2-21 Yunnan, China (CN-4) From XTBG Seed Bank
CYN24_2-24 Yunnan, China (CN-5) From XTBG Seed Bank
CYB04_4-1 Yunnan, China (CN-6) From XTBG Seed Bank
INB01_5-6 India (IN-2) From XTBG Seed Bank
CYB05_6-9 Yunnan, China (CN-7) From XTBG Seed Bank
CYSH1_15-1 Shanxi, China (CN-8) From XTBG Seed Bank
CYD3_15-3 Yunnan, China (CN-9) From XTBG Seed Bank
VNBY1 Vietnam (VN-1) From XTBG Seed Bank
VNBH2 Vietnam (VN-2) From XTBG Seed Bank
*USDA-ARS: Plant Genetic Resources Conservation Unit (at Griffin, GA, USA);XTBG: Xishuangbanna Tropical Botanical Gardens (at Menglun, Yunnan, China)
Qiu et al. BMC Plant Biology 2010, 10:278http://www.biomedcentral.com/1471-2229/10/278
Page 8 of 10

pH 8.4, 50 mM KCl, and 2 mM MgCl2), 100 μM eachdNTP, 0.04 μM tag labeled Forward primer, 0.16 μMuniversal dye labeled primer, and 0.2 μM Reverse pri-mer, and 2 U of Taq DNA polymerase. Approximately10 ng of genomic DNA was used in each reaction. Thereagents for PCR amplification were from TAKARABiotechnology (DaLian) CO. LTD.Primers were tested using TOUCHDOWN thermal
cycling programs encompassing a 10° span of annealingtemperatures ranging between 65-55°C, or 60-50°C.Cycling parameters were: an initial denaturing step of3 min at 95°C, followed by ten cycles of 30 s at 94°C,30 s at the highest annealing temperature (annealingtemperature was reduced by 1°C per cycle), 45 s at 72°C, followed by 30 cycles of 30 s at 94°C, 30 s at 55°C(for 65-55°C touchdown range) or 50°C (for 60-50°Ctouchdown range), 45 s at 72°C, and a final extensiontime of 10 min at 72°C. PCR products were initiallyscored for amplification on agarose gels, and successfulPCR products were subsequently sized on an ABI 3730DNA Analyzer, after clean-up with Millipore® 96 wellfilter plate. Genescan 500 ROX size standards (AppliedBiosystems, Foster City, California) were run in eachlane to allow for the accurate determination of fragmentsize, and alleles were called using the GeneMapper soft-ware V4.0 (Applied Biosystems). Ambiguous sampleswere run a second time.The putative functions of identified polymorphic mar-
kers were annotated by BLASTX against the NCBINon-Redundant Protein http://www.ncbi.nlm.nih.gov/RefSeq/. In order to test the cross-genera transferabilityof SSR markers developed from castor bean ESTsequence, all primer pairs producing successful PCRbands using castor bean genomic DNA were testedusing J. curcas and S. cantonensis genomic DNA astemplates.
Statistical analysisThe level of polymorphism per locus (number of alleles,nA, and expected heterozygosity [i.e., gene diversity],He) was calculated using the program GDA [50]. Thepolymorphic information content (PIC) is a tool to mea-sure the informativeness of a given DNA marker. Thuswe calculated the PIC value for each locus using PICcalculator http://www.liv.ac.uk/~kempsj/pic.html.In order to investigate the genetic relationships amonggermplasms using these polymorphic SSR markers iden-tified, we scored these SSR products as the presence (1)and absence (0) of the band, thus generating a binarymatrix. The binary data matrix was transferred to thesoftware PAUP to construct the dendrogram amonggermplasms. The unrooted dengrograms were generatedwith Neighbor-Joining and UPGMA Nei-Li’s criteriawithin PAUP*version 4.0 [51].
Additional material
Additional file 1: Table S1: A summary for the primer sequences of 379EST-SSR markers tested and their PCR amplification using genomic DNAas templates among castor bean, Jatropha curcas and Speranskiacantonensis.doc.
Additional file 2: Table S2: Validation and characterization ofpolymorphic SSR markers derived EST sequences.doc.
Additional file 3: Table S3: Homology with Aradidopsis and functionalannotations of the EST-SSR markers.doc.
AcknowledgementsWe thank Dr Qihui Zhu from University of Georgia for her assistance in SSRmining. We extend many thanks to anonymous reviewers for theirconstructive comments during manuscript review. This work was jointlysupported by NSFC (Grant No.30871548) and the Knowledge InnovationProgram of the Chinese Academy of Sciences (Grant No. KSCX2-YW-G-035-1).
Author details1Key Laboratory of Tropical Forest Ecology, Xishuangbanna Tropical BotanicalGarden, Chinese Academy of Sciences, 88 Xuefu Road, Kunming 650223, PRChina. 2SW China Germplasm Bank of Wild Species, Kunming Institute ofBotany, Chinese Academy of Sciences, Kunming 650204, PR China. 3GraduateUniversity of Chinese Academy of Sciences, Beijing 100039, PR China.
Authors’ contributionsLQ and CY developed and screened the DNA markers, performed molecularand statistical genetic analyses, BT performed data mining analyses andassisted with developing the DNA markers, JBY assisted with molecular andstatistical genetic analyses. AL designed and coordinated the study andassisted with statistical genetic analyses and drafting the manuscript. Allauthors read and approved the final manuscript.
Received: 3 June 2010 Accepted: 16 December 2010Published: 16 December 2010
References1. Hayes WC: The Scepter of Egypt II. Cambridge, Mass. USA: Harvard
University Press; 1953.2. Weiss EA: Castor bean, Sesame, and safflower. London, Leonard Hill; 1971.3. Govaerts R, Frodin DG, Radcliffe-Smith A: World checklist and bibliography
of Euphorbiaceae (with Pandaceae). Trowbridge, Wiltshire, RedwoodBooks Limited; 2000.
4. Atsmon D: Castor. In Oilcrops of the World, Their Breeding and Utilization.Edited by: Robbelen G, Downey RK, Ashri A. New York, McGraw-Hill;1989:438-447.
5. Sujatha M, Reddy TP, Mahasi MJ: Role of biotechnological interventions inthe improvement of castor bean (Ricinus communis L.) and Jatrophacurcas L. Biotechnol Adv 2008, 26:424-435.
6. Weiss EA: Oilseed crops. London, Blackwell; 2000.7. Li FJ, Wang CL, Wang YF, Chen ZQ, Chen MH, Gao LF: Fatty acid
composition of the castor bean seed of nine castor bean hybrids. ChinaOils and Fats 2008, 33:62-64.
8. Meinders HC, Jones MD: Pollen shedding and dispersal in the castorbean plant Ricinus communis L. J Agron 1950, 4:206-209.
9. Brigham RD: Natural outcrossing in dwarf-internode castor bean, Ricinuscommunis L. Crop Sci 1967, 7:353-355.
10. Allard RW, Alvim PDeT, Ashri A, Barton JH: Managing global geneticresources; the U. S. national plant germplasm system: elements of thenational plant germplasm system. Washington DC, The NationalAcademies Press; 1991, 43-86.
11. Gupta PK, Varshney RK: The development and use of microsatellitemarkers for genetic analysis and plant breeding with emphasis onbread wheat. Euphytica 2000, 113:163-185.
12. Chakrabarty SK, Banu SS: Genetic diversity in pistillate lines of castor bean(Ricinus communis). Indian J Agric Sci 1999, 69:729-730.
Qiu et al. BMC Plant Biology 2010, 10:278http://www.biomedcentral.com/1471-2229/10/278
Page 9 of 10
13. Allan G, Williams A, Rabinowicz PD, Chan AP, Ravel J, Keim P: Worldwidegenotyping of castor bean germplasm (Ricinus communis L.) using AFLPsand SSRs. Genet Resour Crop Evol 2008, 55:365-378.
14. Powell W, Morgante M, Andre C, Hanafey M, Vogel J, Tingey S, Rafalski A:The comparison of RFLP, RAPD, AFLP and SSR (microsatellite) markersfor germplasm analysis. Mol Breed 1996, 2:225-238.
15. Collard BCY, Jahufer MZZ, Brouwer JB, Pang ECK: An introduction tomarkers, quantitative trait loci (QTL) mapping and marker-assistedselection for crop improvement: The basic concepts. Euphytica 2005,142:169-196.
16. Zane L, Bargelloni L, Patarnello T: Strategies for microsatellite isolation: areview. Mol Ecol 2002, 11:1-16.
17. Squirrell J, Hollingsworth PM, Woodhead M, Russell J, Lowe AJ, Gibby M,Powell W: How much effort is required to isolate nuclear microsatellitesfrom plants? Mol Ecol 2003, 12:1339-1348.
18. Ellis JR, Burke JM: EST-SSRs as a resource for population genetics analysis.Heredity 2007, 99:125-132.
19. Cordeiro GM, Casu R, McIntyre CL, Manners JM, Henry RJ: Microsatellitemarkers from sugarcane (Saccharum spp.) ESTs cross transferable toerianthus and sorghum. Plant Sci 2001, 160:1115-1123.
20. Varshney RK, Sigmund R, Börner A, Korzum V, Stein N, Sorrells ME,Langridge P, Graner A: Interspecific transferability and comparativemapping of barley EST-SSR markers in wheat, rye and rice. Plant Sci2005, 168:195-202.
21. Cardle L, Ramsay L, Milbourne D, Macaulay M, Marshall D, Waugh R:Computational and experimental characterization of physically clusteredsimple sequence repeats in plants. Genetics 2000, 156:847-854.
22. Tóth G, Gáspári Z, Jurka J: Microsatellites in different eukaryotic genomes:Survey and analysis. Genome Res 2000, 10:967-981.
23. Morgante M, Hanafey M, Powell W: Microsatellites are preferentiallyassociated with nonrepetitive DNA in plant genomes. Nat Genet 2002,30:194-200.
24. Nicot N, Chiquet V, Gandon B, Amilhat L, Legeai F, Leroy P, Bernard M,Sourdille P: Study of simple sequence repeat (SSR) markers from wheatexpressed sequence tags (ESTs). Theor Appl Genet 2004, 109:800-805.
25. Kota R, Varshney RK, Thiel T, Dehmer KJ, Graner A: Generation andcomparison of EST-derived SSRs and SNPs in barley (Houdeum vulgareL.). Hereditas 2001, 135:145-151.
26. Temnykh S, DeClerck G, Lukashova A, Lipovich L, Cartinhour S, McCouch S:Computational and experimental analysis of microsatellites in rice (Oryzasativa L.): Frequency, length variation, transposon associations, andgenetic marker potential. Genome Res 2001, 11:1441-1452.
27. Thiel T, Michalek W, Varshney RK, Graner A: Exploiting EST databases forthe development and characterization of gene-derived SSR-markers inbarley (Hordeum vulgare L.). Theor Appl Genet 2003, 106:411-422.
28. Holton TA, Christopher JT, McClure L, Harker N, Henry RJ: Identification andmapping of polymorphic SSR markers from expressed gene sequencesof barley and wheat. Mol Breed 2002, 9:63-71.
29. Scott KD, Eggler P, Seaton G, Rossetto M, Ablett EM, Lee LS Henry RJ:Analysis of SSRs derived from grape ESTs. Theor Appl Genet 2000,100:723-726.
30. Areshchenkova T, Ganal MW: Comparative analysis of polymorphism andchromosomal location of tomato microsatellite markers isolated fromdifferent sources. Theor Appl Genet 2002, 104:229-235.
31. Bhat PR, Krishnakumar V, Hendre PS, Rajendrakumar P, Varshney RK,Aggarwal RK: Identification and characterization of gene-derived EST-SSRmarkers from robusta coffee variety ‘CxR’ (an interspecific hybrid ofCoffea canephora x Coffea congensis). Mol Ecol Notes 2005, 5:80-83.
32. Poncet V, Rondeau M, Tranchant C, Cayrel A, Hamon S, de Kochko A,Hamon P: SSR mining in coffee tree EST databases: potential use of EST-SSRs as markers for the Coffea genus. Mol Genet Genomics 2006,276:436-449.
33. Aggarwal RK, Hendre PS, Varshney RK, Bhat PR, Krishnakumar V, Singh L:Identification, characterization and utilization of EST-derived genicmicrosatellite markers for genome analyses of coffee and relatedspecies. Theor Appl Genet 2007, 114:359-372.
34. Low ETL, Alias H, Boon SH, Shariff EM, Tan CYA, Ooi LCL, Cheah SC,Raha AR, Wan KL, Singh R: Oil palm (Elaeis guineensis Jacq.) tissue cultureESTs: Identifying genes associated with callogenesis and embryogenesis.BMC Plant Biol 2008, 8:62.
35. Feng SP, Li WG, Huang HS, Wang JY, Wu YT: Development,characterization and cross-species/genera transferability of EST-SSRmarkers for rubber tree (Hevea brasiliensis). Mol Breed 2009, 23:85-97.
36. Varshney RK, Thiel T, Stein N, Langridge P, Graner A: In silico analysis onfrequency and distribution of microsatellites in ESTs of some cerealspecies. Cell Mol Biol Lett 2002, 7:537-546.
37. Arumuganathan K, Earle ED: Nuclear DNA content of some importantplant species. Plant Mol Biol Report 1991, 9:211-215.
38. Kantety RV, La Rota M, Matthews DE, Sorrells ME: Data mining for simplesequence repeats in expressed sequence tags from barley, maize, rice,sorghum and wheat. Plant Mol Biol 2002, 48:501-510.
39. Metzgar D, Bytof J, Wills C: Selection against frame shift mutations limitsmicrosatellite expansion in coding DNA. Genome Res 2000, 10:72-80.
40. Bajay MM, Pinheiro JB, Batista CEA, Nobrega MBM, Zucchi MI: Developmentand characterization markers for castor bean (Ricinus communis L.), animportant oleaginous species for biodiesel production. ConservationGenet Resour 2009, 1:237-239.
41. Raji AA, Anderson VJ, Kolade AO, Ugwu DC, Dixon GA, Ingelbrecht LI:Gene-based microsatellites for cassava (Manihot esculenta Crantz):prevalence, polymorphisms, and cross-taxa utility. BMC Plant Biol 2009,9:118.
42. Wurdack KJ, Hoffmann P, Chase MW: Molecular phylogenetic analysis ofuniovulate Euphorbiaceae (Euphorbiaceae sensu stricto) using plastidrbcL and trnL-F DNA sequences. Am J Bot 2005, 92:1397-1420.
43. Moshkin VA: History and origin of castor bean. In Castor bean. Edited by:Moshkin VA. New Delhi, Oxonian; 1986:6-10.
44. Doyle JJ, Doyle JL: A rapid DNA isolation procedure for small quantitiesof fresh leaf tissue. Phytochem Bull 1987, 19:11-15.
45. van de Loo FJ, Broun P, Turner S, Ville CS: An oleate 12-hydroxylase fromRicinus communis L. is a fatty acyl desaturase homolog. Proc Natl Acad SciUSA 1995, 92:6743-6747.
46. Doering-Saad C, Newbury HJ, Couldridge CE, Bale JS, Pritchard J: Aphloem-enriched cDNA library from Ricinus: insights into phloemfunction. J Exp Bot 2006, 57:3183-3193.
47. Lu C, Wallis JG, Browse J: An analysis of expressed sequence tags ofdeveloping castor bean endosperm using a full-length cDNA library.BMC Plant Biol 2007, 7:42.
48. Li WZ, Godzik A: Cd-hit: a fast program for clustering and comparinglarge sets of protein or nucleotide sequences. Bioinformatics 2006,22:1658-1659 [http://bioinformatics.ljcrf.edu/cd-hi/].
49. Rozen S, Skaletsky HJ: Primer3 on the WWW for general users and forbiologist programmers. Bioinformatics Methods and Protocols: Methods inMolecular Biology Humana Press, Totowa NJ; 2000, 365-386 [http://frodo.wi.mit.edu/primer3/primer3_code.html].
50. Lewis PO, Zaykin D: Genetic data analysis: computer program for theanalysis of allelic data. 2001 [http://lewis.eeb.uconn.edu/lewishome/software.html].
51. Swofford DL: PAUP*: Phylogenetic analysis using parsimony (*and othermethods), Version 4b. Sunderland, MA: Sinauer Associates; 2001.
doi:10.1186/1471-2229-10-278Cite this article as: Qiu et al.: Exploiting EST databases for thedevelopment and characterization of EST-SSR markers in castor bean(Ricinus communis L.). BMC Plant Biology 2010 10:278.
Submit your next manuscript to BioMed Centraland take full advantage of:
• Convenient online submission
• Thorough peer review
• No space constraints or color figure charges
• Immediate publication on acceptance
• Inclusion in PubMed, CAS, Scopus and Google Scholar
• Research which is freely available for redistribution
Submit your manuscript at www.biomedcentral.com/submit
Qiu et al. BMC Plant Biology 2010, 10:278http://www.biomedcentral.com/1471-2229/10/278
Page 10 of 10