Phase relationships in the system K2CO3-CaCO3 at 6 GPa and 900-1450 C
Experimentally Determined Phase Relationsin Hydrous Peridotites to 6�5 GPa and theirConsequences on the Dynamics of SubductionZones
P. FUMAGALLI* AND S. POLI
UNIVERSITA DEGLI STUDI DI MILANO, DIPARTIMENTO DI SCIENZE DELLA TERRA, VIA BOTTICELLI 23,
20133, MILANO, ITALY
RECEIVED FEBRUARY 29, 2004; ACCEPTED OCTOBER 6, 2004ADVANCE ACCESS PUBLICATION DECEMBER 3, 2004
Fluid-saturated subsolidus experiments from 2�0 to 6�5 GPa, and
from 680 to 800�C have been performed on three model peri-
dotites in the system Na2O–CaO–FeO–MgO–Al2O3–SiO2–
H2O (NCFMASH). Amphibole and chlorite coexist up to
2�4 GPa, 700�C. Chlorite persists to 4�2 GPa at 680�C. Starting
from 4�8 GPa, 680�C a 10 A phase structure replaces chlorite in
all compositions. The 10 A phase structure contains significant
Al2O3 (up to 10�53 wt %) deviating from the MgO–SiO2–H2O
10 A phase (MSH 10 A phase). A mixed layered structure (chlor-
ite–MSH 10 A phase) is proposed to account for aluminium
observed. In the Tinaquillo lherzolite amphibole breakdown occurs
via the reaction
amphibole þ olivine � H2O
¼ clinopyroxene þ orthopyroxene þ chlorite:
Thermal stability of chlorite (chlorite þ orthopyroxene ¼ forsterite þgarnet þ H2O) is shifted towards lower temperatures, compared
with the system MASH. Furthermore, the chlorite thermal break-
down is also related to the degenerate reaction
chlorite þ clinopyroxene
¼ olivine þ garnetð� orthopyroxeneÞ þ H2O:
Chlorite and the Al-10 A phase structure contribute significantly to
the water budget in subduction zones in the depth range relevant for
arc magmatism, whereas amphibole-related fluid release is restricted
to the forearc region. Chlorite and Al-10 A phase breakdowns might
explain the occurrence of a double seismic zone by dehydration
embrittlement.
KEY WORDS: amphibole; chlorite; high pressure; peridotites;
subduction zones
INTRODUCTION
Water is transported, released and recycled into the Earth’smantle via subduction processes. Field evidence revealsthe occurrence of extensively hydrated peridotites in avariety of oceanic settings, i.e. fast- and slow-spreadingridges (Frueh-Green et al., 1996; Muller et al., 1997) andpassive continental margins (Boillot et al., 1988); profoundhydrothermal exchange with sea water is expected tooccur not only close to ridge segments and along fracturezones (Constantin, 1999) but possibly also in flexuraldeformation zones at subduction margins (Peacock,2001). Constraints on the distribution of hydrous phasesalong the subducting lithosphere and in the overlyingmantle wedge are crucial in depicting the dynamic evolu-tion of subduction zones.
Amphibole dehydration in variably enriched ultra-mafics has long been held responsible for mass-transfergenerating arc magmatism (Wyllie, 1988; Davies &Stevenson, 1992; Tatsumi & Eggins, 1995), for seismicproperties at the slab–wedge interface, and for variationsin buoyancy forces. Current knowledge on amphibolestability in ultramafic compositions mainly relies onnear-solidus experiments performed by Green (1973),Mysen & Boettcher (1975), Wallace & Green (1991) andNiida & Green (1999), but amphibole compositionalvariations and its phase relationships at temperaturesbelow 920�C are substantially unknown.
*Corresponding author. Telephone: þ390250315588. Fax:
þ390250315597. E-mail: [email protected]
# The Author 2004. Published by Oxford University Press. All
rights reserved. For Permissions, please email: journals.permissions@
oupjournals.org
JOURNAL OF PETROLOGY VOLUME 46 NUMBER 3 PAGES 555–578 2005 doi:10.1093/petrology/egh088 by guest on N
ovember 21, 2015
http://petrology.oxfordjournals.org/D
ownloaded from
More recently, emphasis has been given to antigoritebecause of the large amount of H2O released at its break-down, its notable abundance in a variety of bulk com-positions (including harzburgites), a pressure stabilityexceeding 5 GPa, and, last but not least, because of the pos-sible relations to the presence of double seismic zones insubducting slabs (Yamasaki & Seno, 2003). A consider-able amount of experimental work in the chemical systemsMgO–SiO2–H2O (MSH) and MgO–Al2O3–SiO2–H2O(MASH) has been performed to estimate the maximumstability field of antigorite (Ulmer & Trommsdorff, 1995,1999; Wunder et al., 2001; Bromiley & Pawley, 2003) andto unravel the location of reactions responsible for H2Otransfer from antigorite to dense hydrous magnesiumsilicates (DHMS) such as Phase A (Kawamoto et al.,1996; Ulmer & Trommsdorff, 1999) or the 10 A phase(Pawley & Wood, 1995; Fumagalli et al., 2001).
Similarly, at temperatures exceeding antigorite stabi-lity, the maximum thermal stability of chlorite, the 10 Aphase, and other DHMS at high pressure have beeninvestigated in the model systems MSH and MASH(Staudigel & Schreyer, 1977; Fockenberg, 1995; Pawley& Wood, 1995; Frost, 1999; Pawley, 2003) with the mainpurpose of identifying potential H2O reservoirs for vola-tile transfer to the deep mantle.
Addition of Fe, Ca and Na, approaching natural bulkcompositions involved in subduction processes, results inprofound effects on phase equilibria and stabilities. Ele-ment partitioning between chlorite, amphibole, garnet,pyroxenes, etc. is expected to modify hydrous phasestability as modelled in very simple chemical systems.As an example, solidus and near-solidus experimentsperformed on bulk compositions approaching naturalvariably enriched ultramafic rocks (Wallace & Green,1991) actually suggest that bulk alkali content stronglyinfluences the amphibole stability, which ranges from1�8 GPa to 2�5 GPa on the wet solidus. Furthermore,despite simple rules that can be applied to evaluate therelevance of a specific assemblage in simple chemicalsystems (e.g Mg/Si ratio for the 10 A phase, Fumagalliet al., 2001; Stalder & Ulmer, 2001; Fe–Mg partitioningfor MgMgAl-pumpellyite–sursassite, Artioli et al., 1999;Bromiley & Pawley, 2003), more complex relationshipshold in natural systems containing a large number ofindependent chemical components. Again, the mutualstability of chlorite, DHMS and anhydrous solid solutionsin complex bulk compositions is substantially unknown;it is worth noting that the absence of low-temperaturedata for such compositions also hampers verification ofgeothermobarometers for peridotites in cold tectonicenvironments.
This experimental work aims to unravel subsolidusphase relationships in variably enriched ultramafic com-positions modelled in the system Na2O–CaO–FeO–MASH (NCFMASH). Particular emphasis will be given
to hydrous phases such as chlorites, amphiboles andDHMS and their mutual relations, so as to evaluate anddepict the contribution of the ultramafic portion of theslab to the water budget in subduction zones.
EXPERIMENTAL PROCEDURES
Starting materials
Although the layered structure of the oceanic lithospherehas been widely recognized, sampling of modern oceanfloors and ophiolites suggests rather complex structuraland chemical heterogeneities. Although harzburgites andvariably enriched lherzolites (Baker & Beckett, 1999)represent the most notable upper-mantle lithologies, theoccurrence of layers or veins of pyroxenites is testifiedfrom abyssal dredges, alpine massifs, mantle xenolithsand ophiolites (Hirschmann & Stolper, 1996; Salters &Dick, 2002). A wide compositional range of ultramaficlithologies is, therefore, expected to contribute to the totalwater budget in subduction-zone environments.
Hydrous peridotites have been modelled in the chemi-cal system Na2O–CaO–FeO–MgO–Al2O3–SiO2–H2O(NCFMASH). Three model compositions have beeninvestigated (Table 1): PX, approximating an Hawaiianperidotite nodule that represents an olivine-poorgarnet lherzolite [composition D-66SAL-1 of Mysen &Boettcher (1975)]; LZ, the Tinaquillo lherzolite (Green,1963); HZ, a harzburgite dredged from the ocean floor(Hebert et al., 1983). PX shows a significant content ofbasaltic component and as a result it is enriched in Al2O3,CaO and Na2O, and also has a relatively low XMg value,where XMg ¼ Mg/(Mg þ Fetot). Such a compositionrepresents a useful end-member for the definition ofphase diagrams, allowing a maximum occurrence ofaluminous phases. A similar approach was followed byNiida & Green (1999), who investigated the amphibolemineral chemistry in ultramafic rocks. In particular,the composition referred to by those workers as HPY-40% Ol is comparable with the olivine-poor lherzolitecomposition of this study.
To promote the synthesis at subsolidus conditions, gelshave been prepared following the method of Hamilton &Henderson (1968) using tetraethylorthosilicate (TEOS)as silica source, pure Na–, Ca–, Mg– and Al–nitricsolutions, and ferric benzoate. Gels were fired in a gasmixing furnace at f O2 conditions approaching the FMQ(fayalite–magnetite–quartz) buffer at 1 atm, then seededwith mineral phases expected to be stable in the pressurerange investigated here. Individual seed compositionslargely differ from the stable compositions expected atthe P–T conditions investigated to favour unquestionableidentification of relicts, but the composition of the seedmixture closely reproduces the bulk composition chosento avoid fractionation. Seed mixtures are composed of34�58 wt % natural clinochlore (Val Malenco, Italy),
556
JOURNAL OF PETROLOGY VOLUME 46 NUMBER 3 MARCH 2005 by guest on N
ovember 21, 2015
http://petrology.oxfordjournals.org/D
ownloaded from
7�44 wt % natural pyrope (Dora Maira, Italy), 36�94 wt %synthetic diopside and 21�04 wt % synthetic forsterite(Fo70). Mixtures were added in amounts of 10 wt % in PX,1�26 wt % in LZ and 1 wt % in HZ.
Experimental conditions and apparatus
High-pressure experiments were performed at pressuresranging from 2�0 GPa to 6�5 GPa and temperatures from680�C to 800�C at the Dipartimento di Scienze dellaTerra in Milano, Italy. Pressures up to 3�0 GPa wereinvestigated in piston cylinders, both single stage (up to2�4 GPa) and end loaded (up to 3�0 GPa) using full saltand MgO–salt assemblies, respectively. Temperature wasmeasured by K-type and S-type thermocouples and wasconsidered accurate to �5�C. A Walker-type multianvilapparatus was used for higher pressures using tungstencarbide cubes of 32 mm edge length and 17 mm trunca-tion edge length (TEL), and pressure cells made of pre-fabricated MgO octahedra (containing 5 wt % of Cr2O3)with a 25 mm edge length (25 M). Multianvil pressurecalibration was performed both at room temperature,using the phase transitions Bi I–II, Bi III–V (respectivelyat 2�55 and 7�7 GPa), and, at 1000�C, the coesite–stishovite and CaGeO3 garnet–perovskite transitionsoccurring respectively at 8�7 GPa (Zhang et al., 1996)and 6�1 GPa (Susaki et al., 1985). Pressure uncertainties,which largely depend on the accuracy of the calibrantreaction, were assumed to be �3%. Further details havebeen given by Fumagalli & Poli (1999). Temperature wasmeasured by S-type thermocouples and was consideredaccurate to �20�C without taking into account any effectof pressure on the e.m.f. of the thermocouple.
Gold capsules (outer diameter 3�0 mm, length 3�5 mm)were welded after being loaded with 10–15 mg of seededgel and 10 wt % of distilled water. All runs were at fluid-saturated conditions.
Oxygen fugacity was constrained by adding graphiteto the charges on the basis of the following assumptions:(1) at high-pressure, low-temperature conditions thegraphite-saturated surface in the system C–O–H (i.e.the ‘graphite boundary’) approaches the H2O component(XH2O ¼ 0�99987 at 5 GPa, 700�C, H:O ¼ 2); (2) attemperature conditions below 700�C diffusion of hydro-gen in gold is negligible (Chou, 1986); (3) given therelatively high amount of H2O added to the gels andthe low Fe content of the starting material, redox reac-tions are assumed to have negligible effect on the fluid,therefore the H:O ratio can be safely assumed to be fixedat 2:1. As a result, a mixture of C þ H2O ‘buffers’ thevolatile species in the fluid and H2O activity is calculatedto approach unity (>0�999). Estimates of oxygen fugacitywere calculated by maximizing the XH2O in the fluid(Connolly & Cesare, 1993); experimental oxidation statesat 700�C range from c. FMQ – 1�7 at 3�0 GPa to FMQ þ0�2 at 6�0 GPa.
As experimental temperatures were low, runs lasted upto 2 months (Table 2).
Table 2: Experimental run conditions
Run number Pressure
(GPa)
Temperature
(�C)
Time
(h)
Starting
material
Run
products
Px8 (SS-PC) 2.0 800 1440 PX ol, opx, gar, amp
Px9 (SS-PC) 2.2 700 360 PX ol, cpx, amp, chl
Px11 (SS-PC) 2.4 700 500 PX ol, cpx, amp
Px10 (EL-PC) 2.6 700 500 PX ol, cpx, chl
Px7 (EL-PC) 3.0 800 256.2 PX ol, opx, cpx, gar
Px6 (MA) 4.2 680 271.1 PX ol, gar, cpx, chl
Px2 (MA) 4.6 750 111 PX ol, opx, cpx, gar
Px5 (MA) 4.8 680 151.3 PX ol, gar, cpx, 10 A
Px3 (MA) 5.2 680 170.4 PX ol, gar, cpx, 10 A
Lz1 (SS-PC) 2.2 700 720 LZ ol, amp, chl
Lz4 (SS-PC) 2.4 700 500 LZ ol, amp, chl
Lz3 (EL-PC) 2.6 700 500 LZ ol, opx, cpx, chl
Lz2 (EL-PC) 3.0 750 197 LZ ol, opx, cpx, chl
Lz5 (MA) 6.0 680 175.7 LZ ol, cpx, gar,
10 A, opx
Lz7 (MA) 6.0 750 351 LZ ol, opx, cpx, gar
Lz10 (MA) 6.5 650 168 LZ ol, cpx, gar, 10 A
Lz9 (MA) 6.5 700 479 LZ ol, opx, cpx, gar
Hz3 (SS-PC) 2.2 700 720 HZ ol, amp, opx, chl
Hz2 (MA) 4.2 680 250 HZ ol, opx, cpx, chl
Hz1 (MA) 5.2 680 240 HZ ol, opx, cpx, 10 A
PX, olivine-poor lherzolite; LZ, Tinaquillo lherzolite; HZ,harzburgite; ol, olivine; opx, orthopyroxene; cpx, clinopyr-oxene; chl, chlorite; amp, amphibole; gar, garnet; 10 A,10 A phase; SS-PC, single-stage piston cylinder; EL-PC,end-loaded piston cylinder; MA, multi-anvil.
Table 1: Compositions of starting materials
PX LZ HZ
SiO2 45.41 45.75 45.63
Al2O3 8.26 3.33 1.46
FeO 9.81 7.03 9.62
MgO 27.38 40.59 42.42
CaO 8.32 3.11 0.57
Na2O 0.82 0.19 0.30
Total 100.00 100.00 100.00
XMg 0.83 0.91 0.89
PX, model Hawaiian peridotite nodule (Mysen & Boettcher,1975) with 10% added seed mixture; LZ, model Tinaquillolherzolite (Green, 1963) with 1.26% added seed mixture;HZ, model harzburgite from the ocean floor (Hebert et al.,1983) with 1% added seed mixture.
557
FUMAGALLI AND POLI PHASE RELATIONS IN HYDROUS PERIDOTITES by guest on N
ovember 21, 2015
http://petrology.oxfordjournals.org/D
ownloaded from

Run products were first characterized by X-ray powderdiffraction on a Philips APD 1000 diffractometer andinspected on back-scattered electron (BSE) and second-ary electron images. An ARLK microprobe with sixwavelength-dispersive spectrometers was used for micro-analysis. Beam conditions were set to 15 kV and 20 nA.Silicates were used as standards and data processed witha ZAF correction procedure.
Approach to equilibrium
It is beyond the goal of this work to perform reversalexperiments. The low temperatures investigated do notfavour kinetics and the results of bracketing reactionsare extremely difficult to assess once reactivity of thestarting material is lost (e.g. using a crystal mixture as intraditional bracketing techniques). Furthermore, becausemost phase boundaries are controlled by continuousreactions involving multicomponent solid solutions,recognition of bracketing is nearly impossible in suchcomplex systems, when phase abundance and mineralchemistry vary smoothly.
Although seeds favour crystallization, their behaviourhas to be taken into account to assess the attainment toequilibrium. Textural observations suggest that growthrather than nucleation usually involves seeds. Althoughsome seed relics, especially garnet, are not completelyresorbed, the compositional homogeneity of the growthrims and the sharp boundary between pre-existing seedsof known composition and newly crystallized phasessuggest that the latter phases approach equilibrium.
Systematic and consistent variations in mineral chem-istry in different environmental conditions, as well ascoherent element partitioning, strongly support approachto equilibrium (see below). Mass-balance and chemo-graphic analysis provide constraints against macroscopicfractionation processes in the charge (possibly occurringin fluid-saturated experiments; Schmidt & Ulmer, 2004).
Imaging offers an additional perspective on texturalreadjustment and on interfacial equilibrium (see below).
RESULTS
Phase assemblages
Experimental run details are shown in Table 2. The mostrepresentative data are those obtained in compositionsPX and LZ. The fine-grained features of products in theharzburgite composition together with the extremely lowcontent of Al2O3 and CaO made the microprobe chemi-cal analysis particularly difficult. Data reported for thiscomposition are, therefore, restricted to a preliminarycharacterization of phase assemblages by X-ray powderdiffractometry.
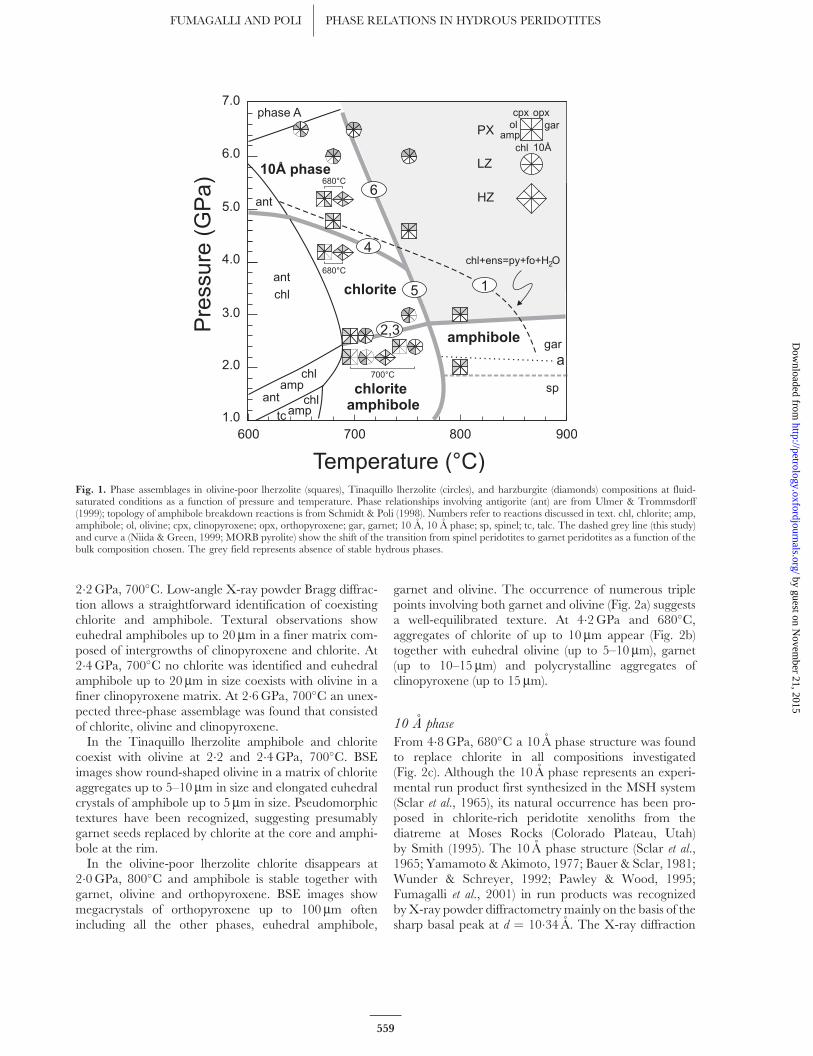
Phase relationships for the three compositions investi-gated are summarized in Fig. 1. Phase boundaries in the
low-temperature region, dominated by the occurrence ofantigorite, are from Ulmer & Trommsdorff (1999). Attemperatures above antigorite stability, phase boundariesfor hydrous phases are drawn schematically as theirdependence on the bulk compositions is unresolved.The spinel–garnet transition represented in Fig. 1(dashed grey line) results from phase assemblagesobserved in one experiment performed on the PXcomposition. Niida & Green (1999), on the basis ofexperiments performed on natural compositions(MORB Pyrolite), located the spinel–garnet transition at2�0 GPa, 1050�C and its extrapolation to lower tempera-tures is represented in Fig. 1 by the dotted curve a. Theabsence of Cr and the relatively low Mg value of theolivine-poor lherzolite composition used in this study(XMg ¼ 0�83) compared with the Niida & Green bulkcomposition (XMg ¼ 0�88) account for the shift of thegarnet-in reaction towards lower pressure: the lack ofCr reduces the stability of spinel and the higher Fe2þ
favours garnet stability at lower pressure (O’Neill, 1981;Gasparik, 1987).
Amphibole and chlorite
The location and dP/dT slope of amphibole breakdownare constrained by experiments presented here, by near-solidus experiments of Green (1973), Milhollen et al.(1974), Mysen & Boettcher (1975), Mengel & Green(1989), Wallace & Green (1991) and Niida & Green(1999), and by the low-temperature topology of theamphibole breakdown reactions summarized by Schmidt& Poli (1998). Although bulk composition is expected toinfluence the location of amphibole breakdown (Wallace& Green, 1991; Niida & Green, 1999) we did not observeany significant shift of amphibole breakdown at 700�Cin PX and LZ. Amphibole pressure stability at highertemperatures is tentatively drawn in Fig. 1 connectingexperimental constraints given here with the locationof amphibole-out on the wet solidus given by Wallace &Green (1991) and Niida & Green (1999). Furthermore,whether a two-pyroxene- or one-pyroxene-bearingassemblage is stable is also dependent on whole-rockbulk composition.
Chlorite breakdown with temperature in Fig. 1 mimicsthe model reaction
clinochlore þ enstatite ¼ forsterite þ pyrope þ H2O
ð1Þ
in the system MASH (Pawley, 2003),and chlorite break-down reactions at lower pressures [see Ulmer &Trommsdorff (1999) for a review], although it will beshown below that clinopyroxene is a major phaseinvolved in chlorite disappearance.
In the olivine-poor lherzolite composition amphiboleand chlorite coexist together with clinopyroxene at
558
JOURNAL OF PETROLOGY VOLUME 46 NUMBER 3 MARCH 2005 by guest on N
ovember 21, 2015
http://petrology.oxfordjournals.org/D
ownloaded from
2�2 GPa, 700�C. Low-angle X-ray powder Bragg diffrac-tion allows a straightforward identification of coexistingchlorite and amphibole. Textural observations showeuhedral amphiboles up to 20mm in a finer matrix com-posed of intergrowths of clinopyroxene and chlorite. At2�4 GPa, 700�C no chlorite was identified and euhedralamphibole up to 20mm in size coexists with olivine in afiner clinopyroxene matrix. At 2�6 GPa, 700�C an unex-pected three-phase assemblage was found that consistedof chlorite, olivine and clinopyroxene.
In the Tinaquillo lherzolite amphibole and chloritecoexist with olivine at 2�2 and 2�4 GPa, 700�C. BSEimages show round-shaped olivine in a matrix of chloriteaggregates up to 5–10mm in size and elongated euhedralcrystals of amphibole up to 5mm in size. Pseudomorphictextures have been recognized, suggesting presumablygarnet seeds replaced by chlorite at the core and amphi-bole at the rim.
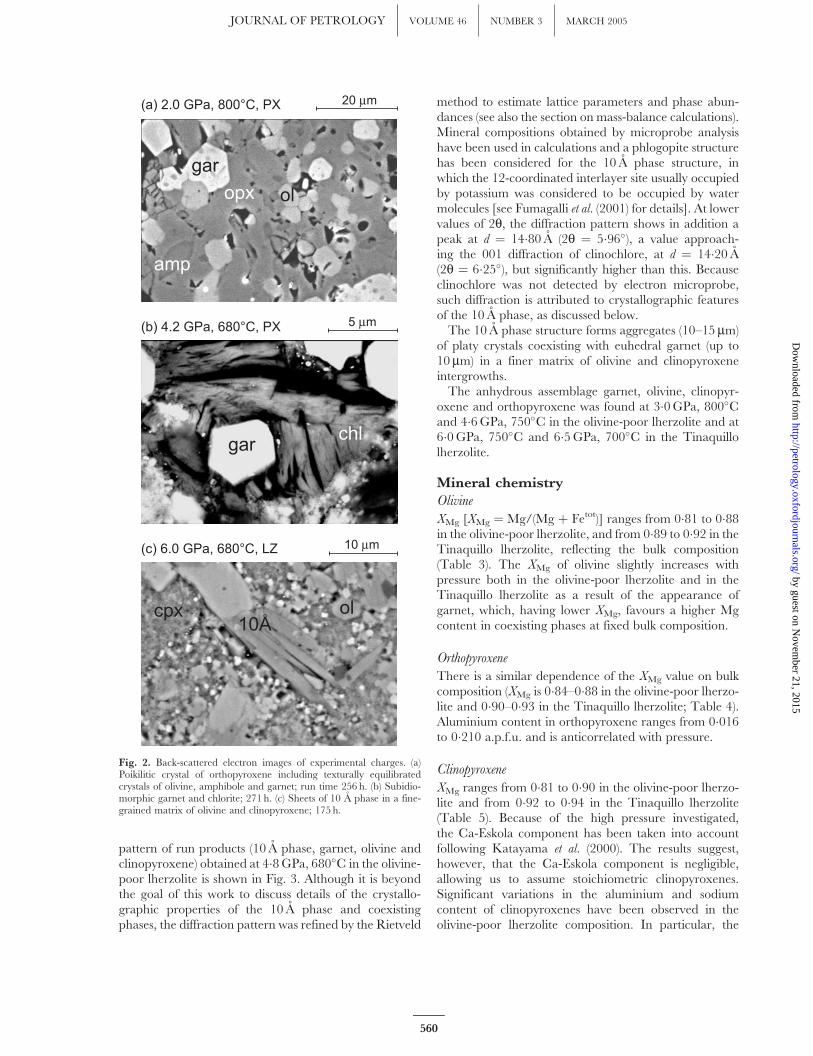
In the olivine-poor lherzolite chlorite disappears at2�0 GPa, 800�C and amphibole is stable together withgarnet, olivine and orthopyroxene. BSE images showmegacrystals of orthopyroxene up to 100mm oftenincluding all the other phases, euhedral amphibole,
garnet and olivine. The occurrence of numerous triplepoints involving both garnet and olivine (Fig. 2a) suggestsa well-equilibrated texture. At 4�2 GPa and 680�C,aggregates of chlorite of up to 10mm appear (Fig. 2b)together with euhedral olivine (up to 5–10mm), garnet(up to 10–15 mm) and polycrystalline aggregates ofclinopyroxene (up to 15 mm).
10 A phase
From 4�8 GPa, 680�C a 10 A phase structure was foundto replace chlorite in all compositions investigated(Fig. 2c). Although the 10 A phase represents an experi-mental run product first synthesized in the MSH system(Sclar et al., 1965), its natural occurrence has been pro-posed in chlorite-rich peridotite xenoliths from thediatreme at Moses Rocks (Colorado Plateau, Utah)by Smith (1995). The 10 A phase structure (Sclar et al.,1965; Yamamoto & Akimoto, 1977; Bauer & Sclar, 1981;Wunder & Schreyer, 1992; Pawley & Wood, 1995;Fumagalli et al., 2001) in run products was recognizedby X-ray powder diffractometry mainly on the basis of thesharp basal peak at d ¼ 10�34 A. The X-ray diffraction
Fig. 1. Phase assemblages in olivine-poor lherzolite (squares), Tinaquillo lherzolite (circles), and harzburgite (diamonds) compositions at fluid-saturated conditions as a function of pressure and temperature. Phase relationships involving antigorite (ant) are from Ulmer & Trommsdorff(1999); topology of amphibole breakdown reactions is from Schmidt & Poli (1998). Numbers refer to reactions discussed in text. chl, chlorite; amp,amphibole; ol, olivine; cpx, clinopyroxene; opx, orthopyroxene; gar, garnet; 10 A, 10 A phase; sp, spinel; tc, talc. The dashed grey line (this study)and curve a (Niida & Green, 1999; MORB pyrolite) show the shift of the transition from spinel peridotites to garnet peridotites as a function of thebulk composition chosen. The grey field represents absence of stable hydrous phases.
559
FUMAGALLI AND POLI PHASE RELATIONS IN HYDROUS PERIDOTITES by guest on N
ovember 21, 2015
http://petrology.oxfordjournals.org/D
ownloaded from
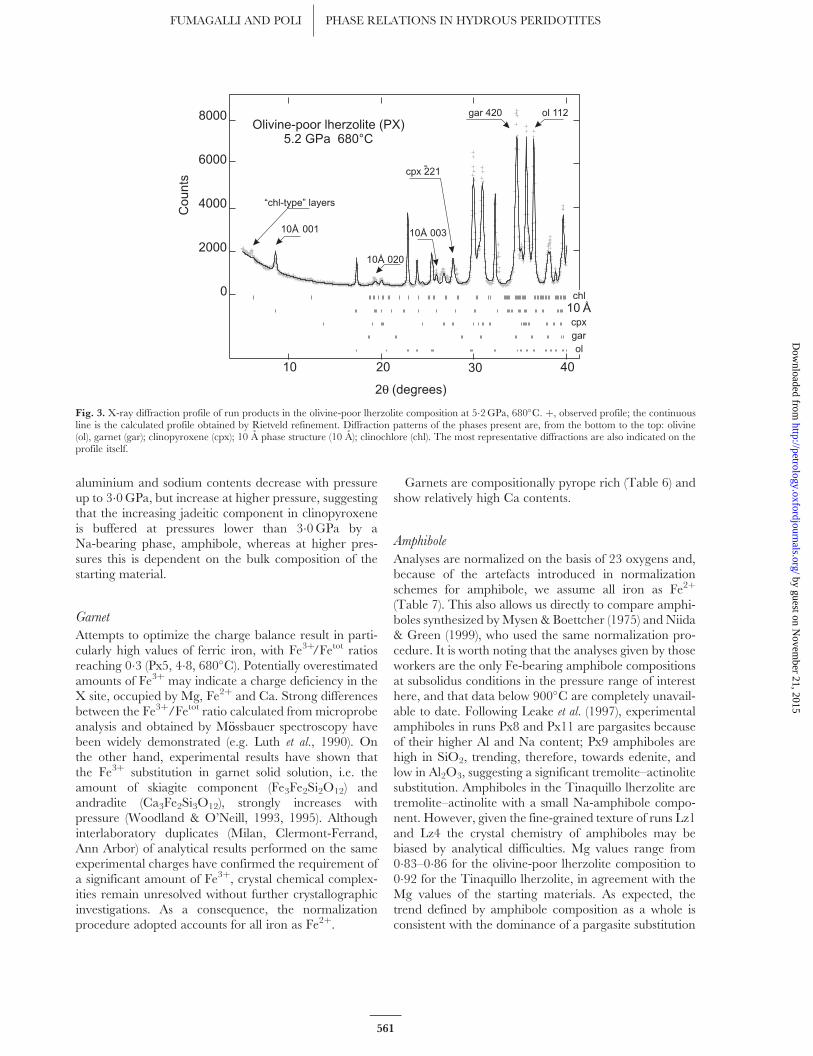
pattern of run products (10 A phase, garnet, olivine andclinopyroxene) obtained at 4�8 GPa, 680�C in the olivine-poor lherzolite is shown in Fig. 3. Although it is beyondthe goal of this work to discuss details of the crystallo-graphic properties of the 10 A phase and coexistingphases, the diffraction pattern was refined by the Rietveld
method to estimate lattice parameters and phase abun-dances (see also the section on mass-balance calculations).Mineral compositions obtained by microprobe analysishave been used in calculations and a phlogopite structurehas been considered for the 10 A phase structure, inwhich the 12-coordinated interlayer site usually occupiedby potassium was considered to be occupied by watermolecules [see Fumagalli et al. (2001) for details]. At lowervalues of 2q, the diffraction pattern shows in addition apeak at d ¼ 14�80 A (2q ¼ 5�96�), a value approach-ing the 001 diffraction of clinochlore, at d ¼ 14�20 A(2q ¼ 6�25�), but significantly higher than this. Becauseclinochlore was not detected by electron microprobe,such diffraction is attributed to crystallographic featuresof the 10 A phase, as discussed below.
The 10 A phase structure forms aggregates (10–15 mm)of platy crystals coexisting with euhedral garnet (up to10 mm) in a finer matrix of olivine and clinopyroxeneintergrowths.
The anhydrous assemblage garnet, olivine, clinopyr-oxene and orthopyroxene was found at 3�0 GPa, 800�Cand 4�6 GPa, 750�C in the olivine-poor lherzolite and at6�0 GPa, 750�C and 6�5 GPa, 700�C in the Tinaquillolherzolite.
Mineral chemistry
Olivine
XMg [XMg ¼ Mg/(Mg þ Fetot)] ranges from 0�81 to 0�88in the olivine-poor lherzolite, and from 0�89 to 0�92 in theTinaquillo lherzolite, reflecting the bulk composition(Table 3). The XMg of olivine slightly increases withpressure both in the olivine-poor lherzolite and in theTinaquillo lherzolite as a result of the appearance ofgarnet, which, having lower XMg, favours a higher Mgcontent in coexisting phases at fixed bulk composition.
Orthopyroxene
There is a similar dependence of the XMg value on bulkcomposition (XMg is 0�84–0�88 in the olivine-poor lherzo-lite and 0�90–0�93 in the Tinaquillo lherzolite; Table 4).Aluminium content in orthopyroxene ranges from 0�016to 0�210 a.p.f.u. and is anticorrelated with pressure.
Clinopyroxene
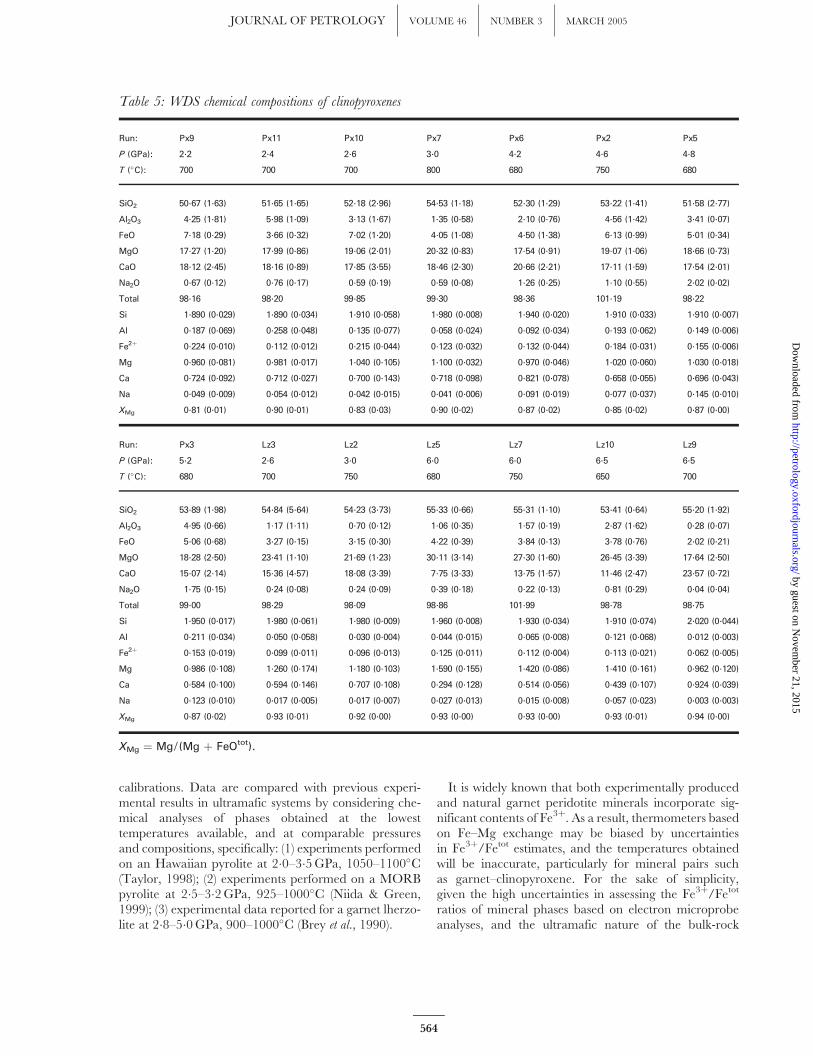
XMg ranges from 0�81 to 0�90 in the olivine-poor lherzo-lite and from 0�92 to 0�94 in the Tinaquillo lherzolite(Table 5). Because of the high pressure investigated,the Ca-Eskola component has been taken into accountfollowing Katayama et al. (2000). The results suggest,however, that the Ca-Eskola component is negligible,allowing us to assume stoichiometric clinopyroxenes.Significant variations in the aluminium and sodiumcontent of clinopyroxenes have been observed in theolivine-poor lherzolite composition. In particular, the
Fig. 2. Back-scattered electron images of experimental charges. (a)Poikilitic crystal of orthopyroxene including texturally equilibratedcrystals of olivine, amphibole and garnet; run time 256 h. (b) Subidio-morphic garnet and chlorite; 271 h. (c) Sheets of 10 A phase in a fine-grained matrix of olivine and clinopyroxene; 175 h.
560
JOURNAL OF PETROLOGY VOLUME 46 NUMBER 3 MARCH 2005 by guest on N
ovember 21, 2015
http://petrology.oxfordjournals.org/D
ownloaded from
aluminium and sodium contents decrease with pressureup to 3�0 GPa, but increase at higher pressure, suggestingthat the increasing jadeitic component in clinopyroxeneis buffered at pressures lower than 3�0 GPa by aNa-bearing phase, amphibole, whereas at higher pres-sures this is dependent on the bulk composition of thestarting material.
Garnet
Attempts to optimize the charge balance result in parti-cularly high values of ferric iron, with Fe3þ/Fetot ratiosreaching 0�3 (Px5, 4�8, 680�C). Potentially overestimatedamounts of Fe3þ may indicate a charge deficiency in theX site, occupied by Mg, Fe2þ and Ca. Strong differencesbetween the Fe3þ/Fetot ratio calculated from microprobeanalysis and obtained by M€oossbauer spectroscopy havebeen widely demonstrated (e.g. Luth et al., 1990). Onthe other hand, experimental results have shown thatthe Fe3þ substitution in garnet solid solution, i.e. theamount of skiagite component (Fe3Fe2Si2O12) andandradite (Ca3Fe2Si3O12), strongly increases withpressure (Woodland & O’Neill, 1993, 1995). Althoughinterlaboratory duplicates (Milan, Clermont-Ferrand,Ann Arbor) of analytical results performed on the sameexperimental charges have confirmed the requirement ofa significant amount of Fe3þ, crystal chemical complex-ities remain unresolved without further crystallographicinvestigations. As a consequence, the normalizationprocedure adopted accounts for all iron as Fe2þ.
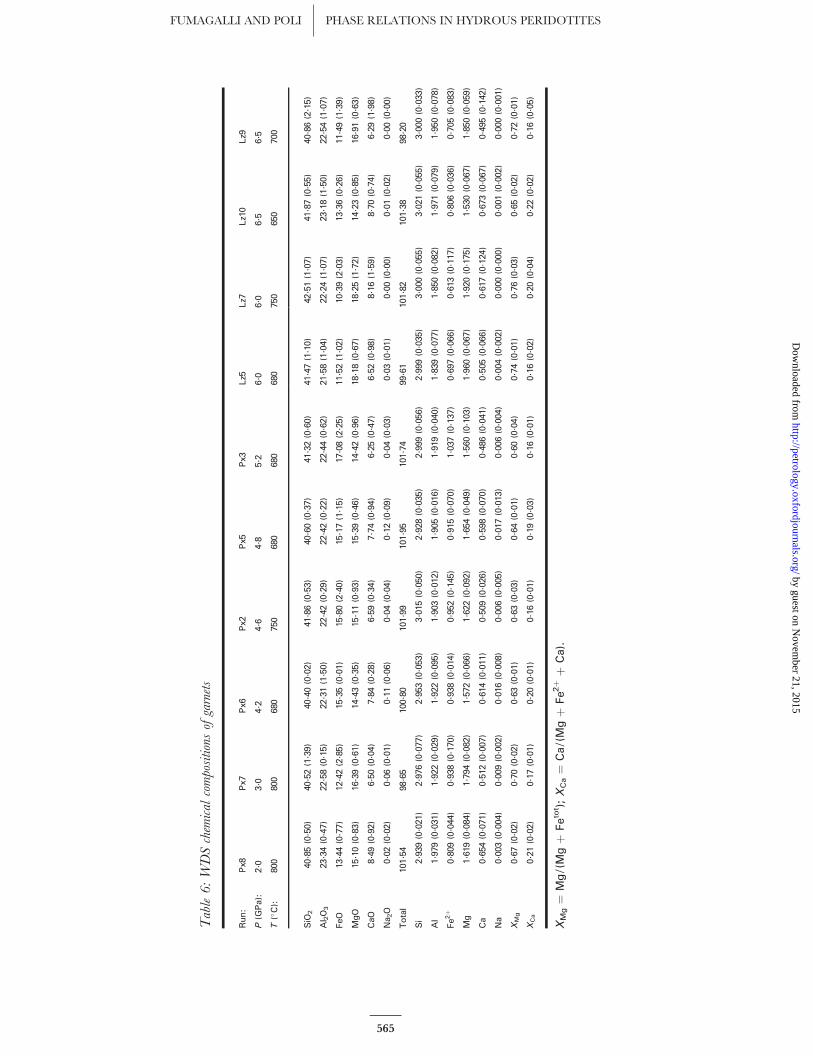
Garnets are compositionally pyrope rich (Table 6) andshow relatively high Ca contents.
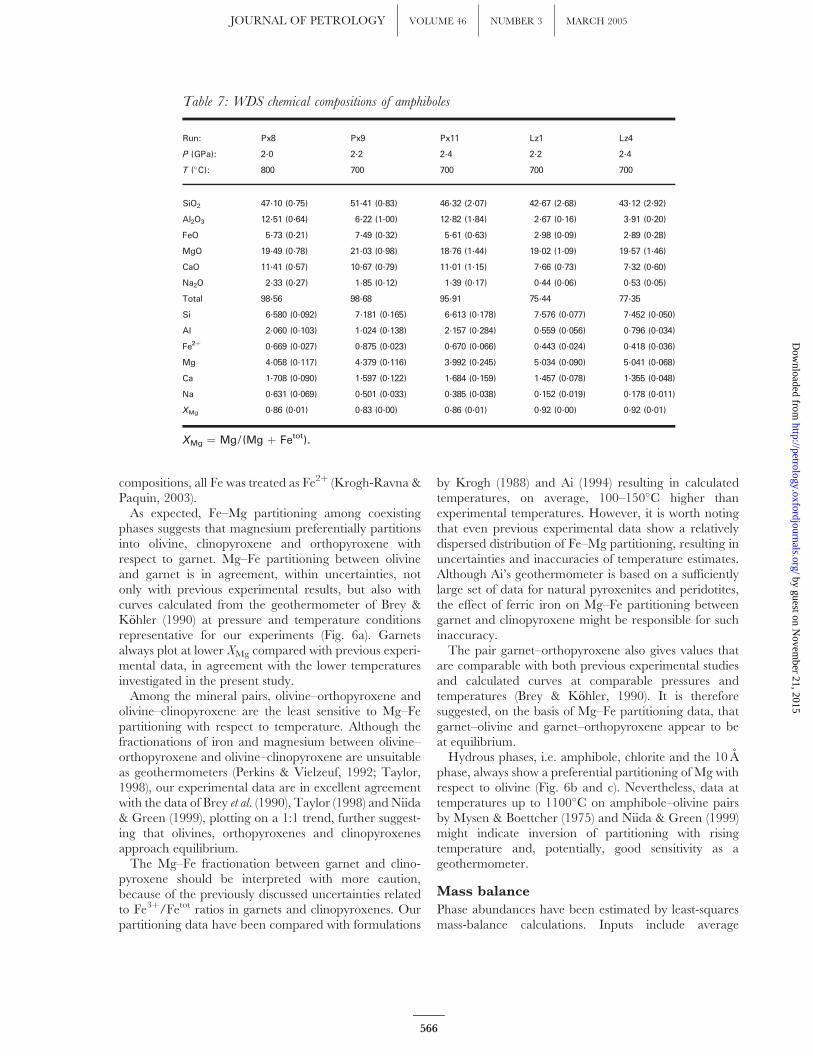
Amphibole
Analyses are normalized on the basis of 23 oxygens and,because of the artefacts introduced in normalizationschemes for amphibole, we assume all iron as Fe2þ
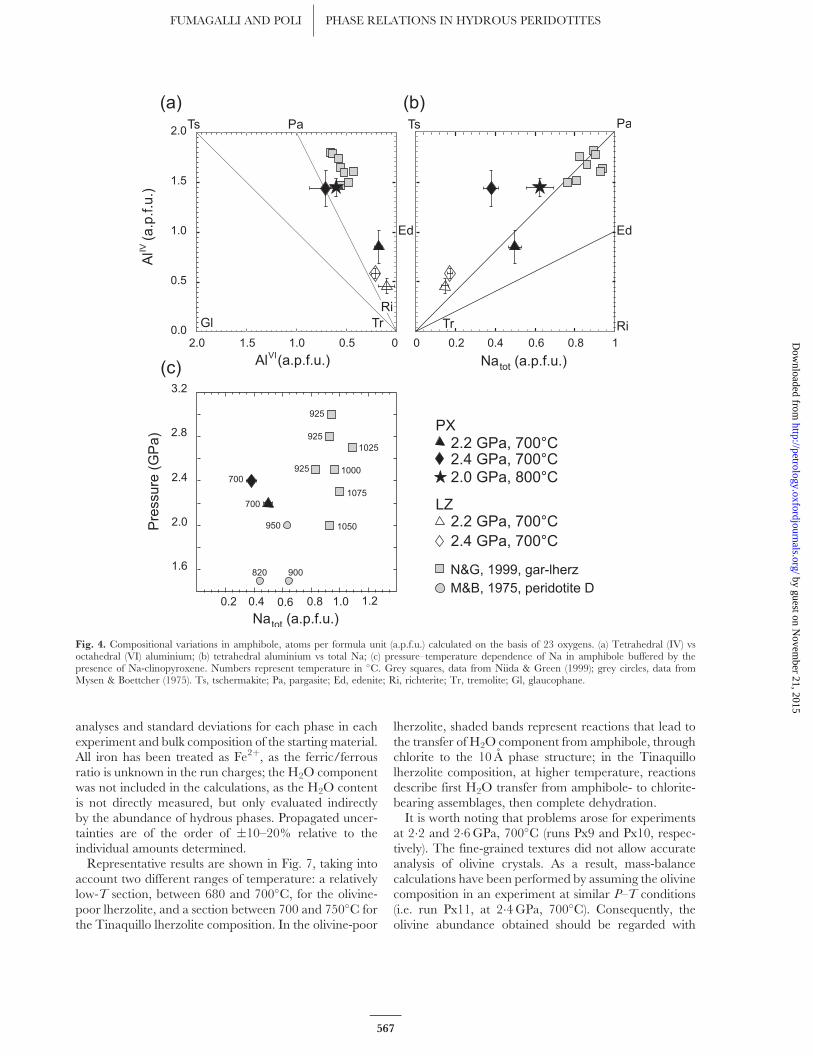
(Table 7). This also allows us directly to compare amphi-boles synthesized by Mysen & Boettcher (1975) and Niida& Green (1999), who used the same normalization pro-cedure. It is worth noting that the analyses given by thoseworkers are the only Fe-bearing amphibole compositionsat subsolidus conditions in the pressure range of interesthere, and that data below 900�C are completely unavail-able to date. Following Leake et al. (1997), experimentalamphiboles in runs Px8 and Px11 are pargasites becauseof their higher Al and Na content; Px9 amphiboles arehigh in SiO2, trending, therefore, towards edenite, andlow in Al2O3, suggesting a significant tremolite–actinolitesubstitution. Amphiboles in the Tinaquillo lherzolite aretremolite–actinolite with a small Na-amphibole compo-nent. However, given the fine-grained texture of runs Lz1and Lz4 the crystal chemistry of amphiboles may bebiased by analytical difficulties. Mg values range from0�83–0�86 for the olivine-poor lherzolite composition to0�92 for the Tinaquillo lherzolite, in agreement with theMg values of the starting materials. As expected, thetrend defined by amphibole composition as a whole isconsistent with the dominance of a pargasite substitution
Fig. 3. X-ray diffraction profile of run products in the olivine-poor lherzolite composition at 5�2 GPa, 680�C. þ, observed profile; the continuousline is the calculated profile obtained by Rietveld refinement. Diffraction patterns of the phases present are, from the bottom to the top: olivine(ol), garnet (gar); clinopyroxene (cpx); 10 A phase structure (10 A); clinochlore (chl). The most representative diffractions are also indicated on theprofile itself.
561
FUMAGALLI AND POLI PHASE RELATIONS IN HYDROUS PERIDOTITES by guest on N
ovember 21, 2015
http://petrology.oxfordjournals.org/D
ownloaded from

(Fig. 4a and b). In Fig. 4c we report the content of totalNa in amphibole coexisting with Na-bearing clinopyrox-ene as a phase buffering Na-exchange vectors. Compar-ison with data previously obtained by Mysen & Boettcher(1975) and Niida & Green (1999) reveals a strong tem-perature dependence of Na content in amphibole and avery modest, if any, pressure dependence. This possiblymodifies at low temperature the schematic arrangementof Na isopleths proposed by Niida & Green (1999).
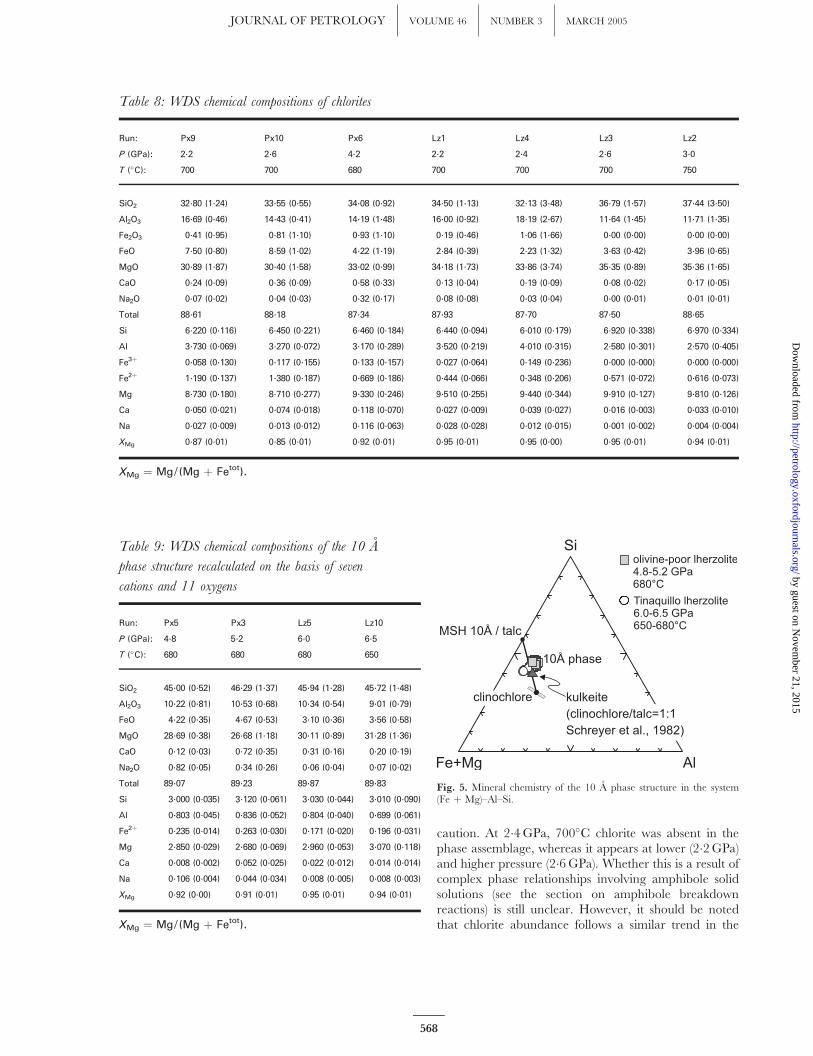
Chlorite
It is compositionally close to clinochlore, with XMg valueranging from 0�85 to 0�92 in the olivine-poor lherzoliteand from 0�94 to 0�95 in the Tinaquillo lherzolite inagreement with the different starting materials (Table 8).The XMg value decreases with pressure up to 3�0 GPa.Although data are limited to the run at 4�2 GPa and680�C, it should be preliminarily noted that an oppositetrend has been observed at higher pressure, when chlorite
Table 3: Wavelength-dispersive (WDS) chemical compositions of olivines
Run: Px8 Px11 Px7 Px6 Px2 Px5 Px3
P (GPa): 2.0 2.4 3.0 4.2 4.6 4.8 5.2
T (�C): 800 700 800 680 750 680 680
SiO2 39.85 (0.75) 39.93 (0.67) 41.39 (0.68) 40.99 (0.97) 41.44 (0.41) 40.69 (0.87) 40.10 (0.02)
Al2O3 0.08 (0.10) 0.15 (0.15) 0.08 (0.03) 0.25 (0.30) 0.13 (0.09) 0.07 (0.02) 0.16 (0.11)
FeO 17.11 (0.57) 18.20 (0.92) 11.33 (1.20) 13.10 (0.24) 14.10 (1.05) 13.43 (0.39) 13.49 (1.72)
MgO 44.74 (1.28) 42.45 (0.87) 48.87 (3.35) 46.29 (1.40) 45.08 (1.51) 47.56 (1.65) 44.31 (0.36)
CaO 0.21 (0.10) 0.26 (0.14) 0.22 (0.08) 0.24 (0.13) 0.23 (0.10) 0.17 (0.01) 0.24 (0.02)
Na2O 0.00 (0.01) 0.01 (0.02) 0.09 (0.02) 0.14 (0.09) 0.02 (0.03) 0.04 (0.04) 0.00 (0.00)
Total 101.99 101.00 101.99 101.00 101.00 101.95 98.30
Si 0.986 (0.028) 1.010 (0.009) 1.000 (0.034) 1.010 (0.025) 1.030 (0.022) 0.993 (0.032) 1.020 (0.016)
Al 0.002 (0.003) 0.005 (0.005) 0.002 (0.001) 0.007 (0.008) 0.004 (0.003) 0.002 (0.000) 0.005 (0.003)
Fe2þ 0.354 (0.010) 0.385 (0.018) 0.229 (0.025) 0.270 (0.005) 0.293 (0.019) 0.274 (0.011) 0.287 (0.032)
Mg 1.650 (0.029) 1.600 (0.017) 1.760 (0.046) 1.700 (0.028) 1.670 (0.026) 1.730 (0.040) 1.680 (0.016)
Ca 0.006 (0.003) 0.007 (0.004) 0.006 (0.002) 0.006 (0.003) 0.006 (0.003) 0.004 (0.000) 0.006 (0.000)
Na 0.000 (0.000) 0.000 (0.001) 0.004 (0.001) 0.007 (0.005) 0.001 (0.001) 0.002 (0.002) 0.000 (0.000)
XMg 0.82 (0.00) 0.81 (0.01) 0.88 (0.01) 0.86 (0.00) 0.85 (0.01) 0.86 (0.01) 0.85 (0.01)
Run: Lz1 Lz4 Lz3 Lz2 Lz5 Lz7 Lz10 Lz9
P (GPa): 2.2 2.4 2.6 3.0 6.0 6.0 6.5 6.5
T (�C) 700 700 700 750 680 750 650 700
SiO2 41.60 (1.81) 41.02 (0.54) 41.25 (0.47) 41.54 (1.14) 40.74 (0.90) 39.73 (0.96) 41.41 (1.28) 41.88 (0.97)
Al2O3 0.12 (0.14) 0.17 (0.22) 0.08 (0.06) 0.10 (0.09) 0.06 (0.02) 0.03 (0.07) 0.11 (0.18) 0.33 (0.46)
FeO 10.20 (0.37) 9.49 (0.31) 11.01 (0.20) 10.28 (0.34) 8.29 (0.24) 18.41 (6.33) 8.53 (0.35) 7.71 (0.42)
MgO 49.97 (1.72) 51.00 (1.12) 49.51 (0.68) 49.89 (0.53) 51.81 (0.58) 43.57 (4.67) 49.79 (1.98) 49.87 (2.02)
CaO 0.10 (0.10) 0.09 (0.10) 0.04 (0.02) 0.07 (0.03) 0.09 (0.04) 0.16 (0.09) 0.12 (0.11) 0.11 (0.11)
Na2O 0.01 (0.01) 0.00 (0.01) 0.01 (0.01) 0.00 (0.00) 0.01 (0.01) 0.00 (0.00) 0.05 (0.06) 0.00 (0.00)
Total 101.99 101.78 101.90 101.89 101.00 101.90 100.00 99.90
Si 1.000 (0.036) 0.982 (0.013) 0.995 (0.008) 1.000 (0.016) 0.976 (0.007) 0.991 (0.007) 1.010 (0.023) 1.020 (0.022)
Al 0.003 (0.004) 0.005 (0.006) 0.002 (0.002) 0.003 (0.002) 0.002 (0.001) 0.001 (0.002) 0.003 (0.005) 0.010 (0.013)
Fe2þ 0.205 (0.011) 0.190 (0.006) 0.222 (0.004) 0.207 (0.007) 0.166 (0.003) 0.384 (0.134) 0.174 (0.009) 0.157 (0.008)
Mg 1.790 (0.037) 1.820 (0.017) 1.780 (0.009) 1.790 (0.015) 1.850 (0.009) 1.620 (0.138) 1.810 (0.024) 1.810 (0.030)
Ca 0.002 (0.003) 0.002 (0.003) 0.001 (0.000) 0.002 (0.001) 0.002 (0.001) 0.004 (0.002) 0.003 (0.003) 0.003 (0.003)
Na 0.000 (0.001) 0.000 (0.000) 0.000 (0.000) 0.000 (0.000) 0.000 (0.000) 0.000 (0.000) 0.002 (0.003) 0.000 (0.000)
XMg 0.90 (0.00) 0.91 (0.00) 0.89 (0.00) 0.90 (0.00) 0.92 (0.00) 0.81 (0.07) 0.91 (0.00) 0.92 (0.01)
XMg ¼ Mg/(Mg þ Fetot). Values in parentheses are the 1s standard deviations.
562
JOURNAL OF PETROLOGY VOLUME 46 NUMBER 3 MARCH 2005 by guest on N
ovember 21, 2015
http://petrology.oxfordjournals.org/D
ownloaded from
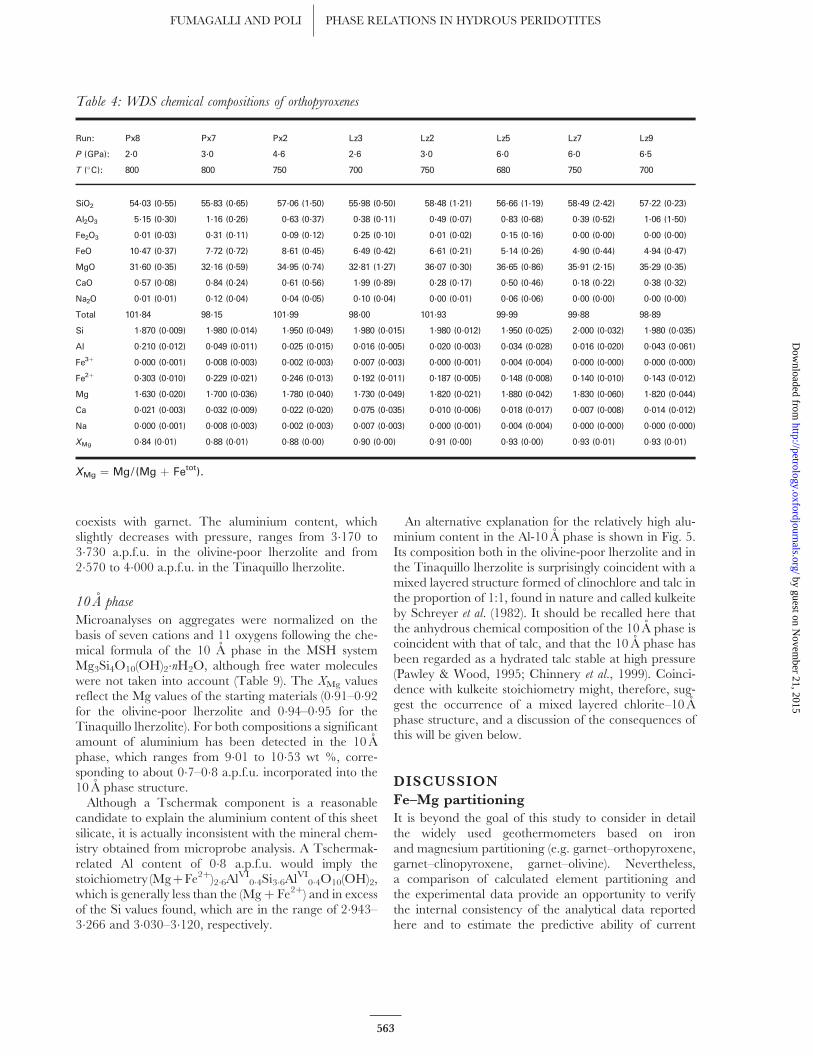
coexists with garnet. The aluminium content, whichslightly decreases with pressure, ranges from 3�170 to3�730 a.p.f.u. in the olivine-poor lherzolite and from2�570 to 4�000 a.p.f.u. in the Tinaquillo lherzolite.
10 A phase
Microanalyses on aggregates were normalized on thebasis of seven cations and 11 oxygens following the che-mical formula of the 10 A phase in the MSH systemMg3Si4O10(OH)2�nH2O, although free water moleculeswere not taken into account (Table 9). The XMg valuesreflect the Mg values of the starting materials (0�91–0�92for the olivine-poor lherzolite and 0�94–0�95 for theTinaquillo lherzolite). For both compositions a significantamount of aluminium has been detected in the 10 Aphase, which ranges from 9�01 to 10�53 wt %, corre-sponding to about 0�7–0�8 a.p.f.u. incorporated into the10 A phase structure.
Although a Tschermak component is a reasonablecandidate to explain the aluminium content of this sheetsilicate, it is actually inconsistent with the mineral chem-istry obtained from microprobe analysis. A Tschermak-related Al content of 0�8 a.p.f.u. would imply thestoichiometry (MgþFe2þ)2�6AlVI
0�4Si3�6AlVI0�4O10(OH)2,
which is generally less than the (Mg þ Fe2þ) and in excessof the Si values found, which are in the range of 2�943–3�266 and 3�030–3�120, respectively.
An alternative explanation for the relatively high alu-minium content in the Al-10 A phase is shown in Fig. 5.Its composition both in the olivine-poor lherzolite and inthe Tinaquillo lherzolite is surprisingly coincident with amixed layered structure formed of clinochlore and talc inthe proportion of 1:1, found in nature and called kulkeiteby Schreyer et al. (1982). It should be recalled here thatthe anhydrous chemical composition of the 10 A phase iscoincident with that of talc, and that the 10 A phase hasbeen regarded as a hydrated talc stable at high pressure(Pawley & Wood, 1995; Chinnery et al., 1999). Coinci-dence with kulkeite stoichiometry might, therefore, sug-gest the occurrence of a mixed layered chlorite–10 Aphase structure, and a discussion of the consequences ofthis will be given below.
DISCUSSION
Fe–Mg partitioning
It is beyond the goal of this study to consider in detailthe widely used geothermometers based on ironand magnesium partitioning (e.g. garnet–orthopyroxene,garnet–clinopyroxene, garnet–olivine). Nevertheless,a comparison of calculated element partitioning andthe experimental data provide an opportunity to verifythe internal consistency of the analytical data reportedhere and to estimate the predictive ability of current
Table 4: WDS chemical compositions of orthopyroxenes
Run: Px8 Px7 Px2 Lz3 Lz2 Lz5 Lz7 Lz9
P (GPa): 2.0 3.0 4.6 2.6 3.0 6.0 6.0 6.5
T (�C): 800 800 750 700 750 680 750 700
SiO2 54.03 (0.55) 55.83 (0.65) 57.06 (1.50) 55.98 (0.50) 58.48 (1.21) 56.66 (1.19) 58.49 (2.42) 57.22 (0.23)
Al2O3 5.15 (0.30) 1.16 (0.26) 0.63 (0.37) 0.38 (0.11) 0.49 (0.07) 0.83 (0.68) 0.39 (0.52) 1.06 (1.50)
Fe2O3 0.01 (0.03) 0.31 (0.11) 0.09 (0.12) 0.25 (0.10) 0.01 (0.02) 0.15 (0.16) 0.00 (0.00) 0.00 (0.00)
FeO 10.47 (0.37) 7.72 (0.72) 8.61 (0.45) 6.49 (0.42) 6.61 (0.21) 5.14 (0.26) 4.90 (0.44) 4.94 (0.47)
MgO 31.60 (0.35) 32.16 (0.59) 34.95 (0.74) 32.81 (1.27) 36.07 (0.30) 36.65 (0.86) 35.91 (2.15) 35.29 (0.35)
CaO 0.57 (0.08) 0.84 (0.24) 0.61 (0.56) 1.99 (0.89) 0.28 (0.17) 0.50 (0.46) 0.18 (0.22) 0.38 (0.32)
Na2O 0.01 (0.01) 0.12 (0.04) 0.04 (0.05) 0.10 (0.04) 0.00 (0.01) 0.06 (0.06) 0.00 (0.00) 0.00 (0.00)
Total 101.84 98.15 101.99 98.00 101.93 99.99 99.88 98.89
Si 1.870 (0.009) 1.980 (0.014) 1.950 (0.049) 1.980 (0.015) 1.980 (0.012) 1.950 (0.025) 2.000 (0.032) 1.980 (0.035)
Al 0.210 (0.012) 0.049 (0.011) 0.025 (0.015) 0.016 (0.005) 0.020 (0.003) 0.034 (0.028) 0.016 (0.020) 0.043 (0.061)
Fe3þ 0.000 (0.001) 0.008 (0.003) 0.002 (0.003) 0.007 (0.003) 0.000 (0.001) 0.004 (0.004) 0.000 (0.000) 0.000 (0.000)
Fe2þ 0.303 (0.010) 0.229 (0.021) 0.246 (0.013) 0.192 (0.011) 0.187 (0.005) 0.148 (0.008) 0.140 (0.010) 0.143 (0.012)
Mg 1.630 (0.020) 1.700 (0.036) 1.780 (0.040) 1.730 (0.049) 1.820 (0.021) 1.880 (0.042) 1.830 (0.060) 1.820 (0.044)
Ca 0.021 (0.003) 0.032 (0.009) 0.022 (0.020) 0.075 (0.035) 0.010 (0.006) 0.018 (0.017) 0.007 (0.008) 0.014 (0.012)
Na 0.000 (0.001) 0.008 (0.003) 0.002 (0.003) 0.007 (0.003) 0.000 (0.001) 0.004 (0.004) 0.000 (0.000) 0.000 (0.000)
XMg 0.84 (0.01) 0.88 (0.01) 0.88 (0.00) 0.90 (0.00) 0.91 (0.00) 0.93 (0.00) 0.93 (0.01) 0.93 (0.01)
XMg ¼ Mg/(Mg þ Fetot).
563
FUMAGALLI AND POLI PHASE RELATIONS IN HYDROUS PERIDOTITES by guest on N
ovember 21, 2015
http://petrology.oxfordjournals.org/D
ownloaded from
calibrations. Data are compared with previous experi-mental results in ultramafic systems by considering che-mical analyses of phases obtained at the lowesttemperatures available, and at comparable pressuresand compositions, specifically: (1) experiments performedon an Hawaiian pyrolite at 2�0–3�5 GPa, 1050–1100�C(Taylor, 1998); (2) experiments performed on a MORBpyrolite at 2�5–3�2 GPa, 925–1000�C (Niida & Green,1999); (3) experimental data reported for a garnet lherzo-lite at 2�8–5�0 GPa, 900–1000�C (Brey et al., 1990).
It is widely known that both experimentally producedand natural garnet peridotite minerals incorporate sig-nificant contents of Fe3þ. As a result, thermometers basedon Fe–Mg exchange may be biased by uncertaintiesin Fe3þ/Fetot estimates, and the temperatures obtainedwill be inaccurate, particularly for mineral pairs suchas garnet–clinopyroxene. For the sake of simplicity,given the high uncertainties in assessing the Fe3þ/Fetot
ratios of mineral phases based on electron microprobeanalyses, and the ultramafic nature of the bulk-rock
Table 5: WDS chemical compositions of clinopyroxenes
Run: Px9 Px11 Px10 Px7 Px6 Px2 Px5
P (GPa): 2.2 2.4 2.6 3.0 4.2 4.6 4.8
T (�C): 700 700 700 800 680 750 680
SiO2 50.67 (1.63) 51.65 (1.65) 52.18 (2.96) 54.53 (1.18) 52.30 (1.29) 53.22 (1.41) 51.58 (2.77)
Al2O3 4.25 (1.81) 5.98 (1.09) 3.13 (1.67) 1.35 (0.58) 2.10 (0.76) 4.56 (1.42) 3.41 (0.07)
FeO 7.18 (0.29) 3.66 (0.32) 7.02 (1.20) 4.05 (1.08) 4.50 (1.38) 6.13 (0.99) 5.01 (0.34)
MgO 17.27 (1.20) 17.99 (0.86) 19.06 (2.01) 20.32 (0.83) 17.54 (0.91) 19.07 (1.06) 18.66 (0.73)
CaO 18.12 (2.45) 18.16 (0.89) 17.85 (3.55) 18.46 (2.30) 20.66 (2.21) 17.11 (1.59) 17.54 (2.01)
Na2O 0.67 (0.12) 0.76 (0.17) 0.59 (0.19) 0.59 (0.08) 1.26 (0.25) 1.10 (0.55) 2.02 (0.02)
Total 98.16 98.20 99.85 99.30 98.36 101.19 98.22
Si 1.890 (0.029) 1.890 (0.034) 1.910 (0.058) 1.980 (0.008) 1.940 (0.020) 1.910 (0.033) 1.910 (0.007)
Al 0.187 (0.069) 0.258 (0.048) 0.135 (0.077) 0.058 (0.024) 0.092 (0.034) 0.193 (0.062) 0.149 (0.006)
Fe2þ 0.224 (0.010) 0.112 (0.012) 0.215 (0.044) 0.123 (0.032) 0.132 (0.044) 0.184 (0.031) 0.155 (0.006)
Mg 0.960 (0.081) 0.981 (0.017) 1.040 (0.105) 1.100 (0.032) 0.970 (0.046) 1.020 (0.060) 1.030 (0.018)
Ca 0.724 (0.092) 0.712 (0.027) 0.700 (0.143) 0.718 (0.098) 0.821 (0.078) 0.658 (0.055) 0.696 (0.043)
Na 0.049 (0.009) 0.054 (0.012) 0.042 (0.015) 0.041 (0.006) 0.091 (0.019) 0.077 (0.037) 0.145 (0.010)
XMg 0.81 (0.01) 0.90 (0.01) 0.83 (0.03) 0.90 (0.02) 0.87 (0.02) 0.85 (0.02) 0.87 (0.00)
Run: Px3 Lz3 Lz2 Lz5 Lz7 Lz10 Lz9
P (GPa): 5.2 2.6 3.0 6.0 6.0 6.5 6.5
T (�C): 680 700 750 680 750 650 700
SiO2 53.89 (1.98) 54.84 (5.64) 54.23 (3.73) 55.33 (0.66) 55.31 (1.10) 53.41 (0.64) 55.20 (1.92)
Al2O3 4.95 (0.66) 1.17 (1.11) 0.70 (0.12) 1.06 (0.35) 1.57 (0.19) 2.87 (1.62) 0.28 (0.07)
FeO 5.06 (0.68) 3.27 (0.15) 3.15 (0.30) 4.22 (0.39) 3.84 (0.13) 3.78 (0.76) 2.02 (0.21)
MgO 18.28 (2.50) 23.41 (1.10) 21.69 (1.23) 30.11 (3.14) 27.30 (1.60) 26.45 (3.39) 17.64 (2.50)
CaO 15.07 (2.14) 15.36 (4.57) 18.08 (3.39) 7.75 (3.33) 13.75 (1.57) 11.46 (2.47) 23.57 (0.72)
Na2O 1.75 (0.15) 0.24 (0.08) 0.24 (0.09) 0.39 (0.18) 0.22 (0.13) 0.81 (0.29) 0.04 (0.04)
Total 99.00 98.29 98.09 98.86 101.99 98.78 98.75
Si 1.950 (0.017) 1.980 (0.061) 1.980 (0.009) 1.960 (0.008) 1.930 (0.034) 1.910 (0.074) 2.020 (0.044)
Al 0.211 (0.034) 0.050 (0.058) 0.030 (0.004) 0.044 (0.015) 0.065 (0.008) 0.121 (0.068) 0.012 (0.003)
Fe2þ 0.153 (0.019) 0.099 (0.011) 0.096 (0.013) 0.125 (0.011) 0.112 (0.004) 0.113 (0.021) 0.062 (0.005)
Mg 0.986 (0.108) 1.260 (0.174) 1.180 (0.103) 1.590 (0.155) 1.420 (0.086) 1.410 (0.161) 0.962 (0.120)
Ca 0.584 (0.100) 0.594 (0.146) 0.707 (0.108) 0.294 (0.128) 0.514 (0.056) 0.439 (0.107) 0.924 (0.039)
Na 0.123 (0.010) 0.017 (0.005) 0.017 (0.007) 0.027 (0.013) 0.015 (0.008) 0.057 (0.023) 0.003 (0.003)
XMg 0.87 (0.02) 0.93 (0.01) 0.92 (0.00) 0.93 (0.00) 0.93 (0.00) 0.93 (0.01) 0.94 (0.00)
XMg ¼ Mg/(Mg þ FeOtot).
564
JOURNAL OF PETROLOGY VOLUME 46 NUMBER 3 MARCH 2005 by guest on N
ovember 21, 2015
http://petrology.oxfordjournals.org/D
ownloaded from
Tab
le6:
WD
Sch
emic
alco
mpo
sition
sof
garn
ets
Run:
Px8
Px7
Px6
Px2
Px5
Px3
Lz5
Lz7
Lz10
Lz9
P(G
Pa):
2.0
3.0
4.2
4.6
4.8
5.2
6.0
6.0
6.5
6.5
T(�C):
800
800
680
750
680
680
680
750
650
700
SiO
240. 85(0. 50)
40. 52(1. 39)
40. 40(0. 02)
41. 86(0. 53)
40. 60(0. 37)
41. 32(0. 60)
41. 47(1. 10)
42. 51(1. 07)
41. 87(0. 55)
40. 86(2. 15)
Al 2O3
23. 34(0. 47)
22. 58(0. 15)
22. 31(1. 50)
22. 42(0. 29)
22. 42(0. 22)
22. 44(0. 62)
21. 58(1. 04)
22. 24(1. 07)
23. 18(1. 50)
22. 54(1. 07)
FeO
13. 44(0. 77)
12. 42(2. 85)
15. 35(0. 01)
15. 80(2. 40)
15. 17(1. 15)
17. 08(2. 25)
11. 52(1. 02)
10. 39(2. 03)
13. 36(0. 26)
11. 49(1. 39)
MgO
15. 10(0. 83)
16. 39(0. 61)
14. 43(0. 35)
15. 11(0. 93)
15. 39(0. 46)
14. 42(0. 96)
18. 18(0. 67)
18. 25(1. 72)
14. 23(0. 85)
16. 91(0. 63)
CaO
8.49
(0. 92)
6.50
(0. 04)
7.84
(0. 28)
6.59
(0. 34)
7.74
(0. 94)
6.25
(0. 47)
6.52
(0. 98)
8.16
(1. 59)
8.70
(0. 74)
6.29
(1. 98)
Na 2O
0.02
(0. 02)
0.06
(0. 01)
0.11
(0. 06)
0.04
(0. 04)
0.12
(0. 09)
0.04
(0. 03)
0.03
(0. 01)
0.00
(0. 00)
0.01
(0. 02)
0.00
(0. 00)
Total
101.54
98. 65
100.80
101.99
101.95
101.74
99. 61
101.82
101.38
98. 20
Si
2.939(0. 021)
2.976(0. 077)
2.953(0. 053)
3.015(0. 050)
2.928(0. 035)
2.999(0. 056)
2.999(0. 035)
3.000(0. 055)
3.021(0. 055)
3.000(0. 033)
Al
1.979(0. 031)
1.922(0. 029)
1.922(0. 095)
1.903(0. 012)
1.905(0. 016)
1.919(0. 040)
1.839(0. 077)
1.850(0. 082)
1.971(0. 079)
1.950(0. 078)
Fe2
þ0.809(0. 044)
0.938(0. 170)
0.938(0. 014)
0.952(0. 145)
0.915(0. 070)
1.037(0. 137)
0.697(0. 066)
0.613(0. 117)
0.806(0. 036)
0.705(0. 083)
Mg
1.619(0. 084)
1.794(0. 082)
1.572(0. 066)
1.622(0. 092)
1.654(0. 049)
1.560(0. 103)
1.960(0. 067)
1.920(0. 175)
1.530(0. 067)
1.850(0. 059)
Ca
0.654(0. 071)
0.512(0. 007)
0.614(0. 011)
0.509(0. 026)
0.598(0. 070)
0.486(0. 041)
0.505(0. 066)
0.617(0. 124)
0.673(0. 067)
0.495(0. 142)
Na
0.003(0. 004)
0.009(0. 002)
0.016(0. 008)
0.006(0. 005)
0.017(0. 013)
0.006(0. 004)
0.004(0. 002)
0.000(0. 000)
0.001(0. 002)
0.000(0. 001)
XMg
0.67
(0. 02)
0.70
(0. 02)
0.63
(0. 01)
0.63
(0. 03)
0.64
(0. 01)
0.60
(0. 04)
0.74
(0. 01)
0.76
(0. 03)
0.65
(0. 02)
0.72
(0. 01)
XCa
0.21
(0. 02)
0.17
(0. 01)
0.20
(0. 01)
0.16
(0. 01)
0.19
(0. 03)
0.16
(0. 01)
0.16
(0. 02)
0.20
(0. 04)
0.22
(0. 02)
0.16
(0. 05)
XMg¼
Mg/(Mgþ
Fetot );XCa¼
Ca/(M
gþ
Fe2
þþ
Ca).
565
FUMAGALLI AND POLI PHASE RELATIONS IN HYDROUS PERIDOTITES by guest on N
ovember 21, 2015
http://petrology.oxfordjournals.org/D
ownloaded from
compositions, all Fe was treated as Fe2þ (Krogh-Ravna &Paquin, 2003).
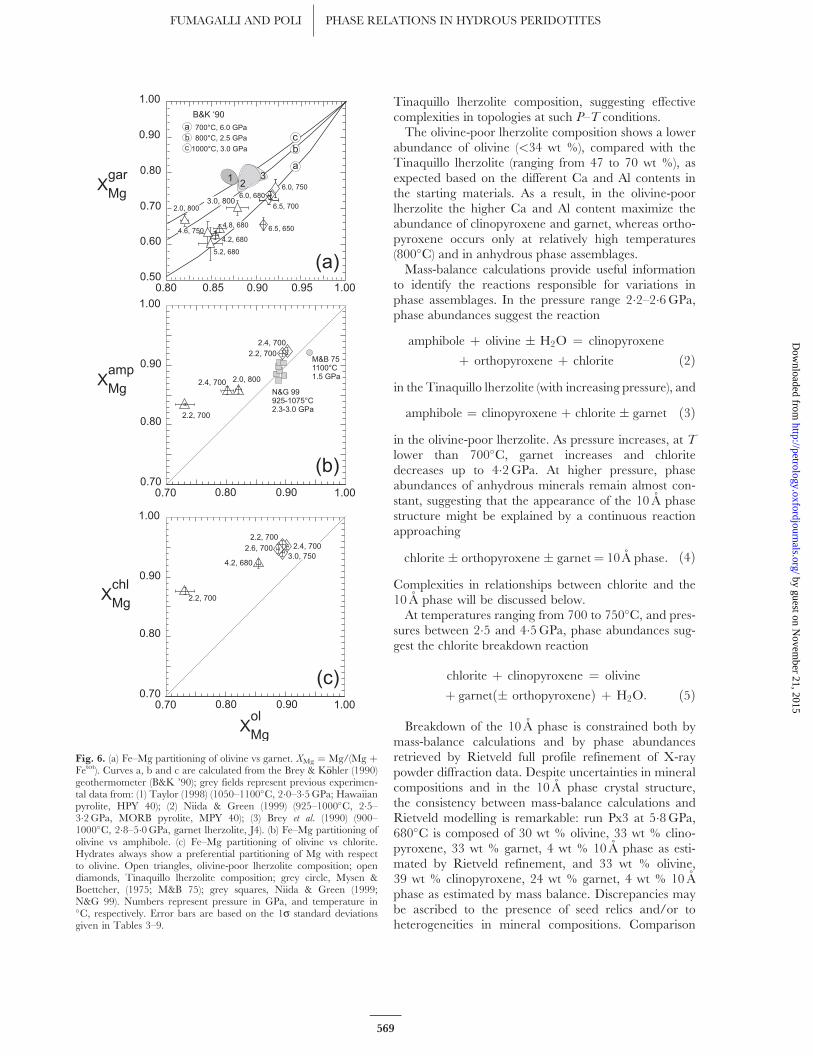
As expected, Fe–Mg partitioning among coexistingphases suggests that magnesium preferentially partitionsinto olivine, clinopyroxene and orthopyroxene withrespect to garnet. Mg–Fe partitioning between olivineand garnet is in agreement, within uncertainties, notonly with previous experimental results, but also withcurves calculated from the geothermometer of Brey &K€oohler (1990) at pressure and temperature conditionsrepresentative for our experiments (Fig. 6a). Garnetsalways plot at lower XMg compared with previous experi-mental data, in agreement with the lower temperaturesinvestigated in the present study.
Among the mineral pairs, olivine–orthopyroxene andolivine–clinopyroxene are the least sensitive to Mg–Fepartitioning with respect to temperature. Although thefractionations of iron and magnesium between olivine–orthopyroxene and olivine–clinopyroxene are unsuitableas geothermometers (Perkins & Vielzeuf, 1992; Taylor,1998), our experimental data are in excellent agreementwith the data of Brey et al. (1990), Taylor (1998) and Niida& Green (1999), plotting on a 1:1 trend, further suggest-ing that olivines, orthopyroxenes and clinopyroxenesapproach equilibrium.
The Mg–Fe fractionation between garnet and clino-pyroxene should be interpreted with more caution,because of the previously discussed uncertainties relatedto Fe3þ/Fetot ratios in garnets and clinopyroxenes. Ourpartitioning data have been compared with formulations
by Krogh (1988) and Ai (1994) resulting in calculatedtemperatures, on average, 100–150�C higher thanexperimental temperatures. However, it is worth notingthat even previous experimental data show a relativelydispersed distribution of Fe–Mg partitioning, resulting inuncertainties and inaccuracies of temperature estimates.Although Ai’s geothermometer is based on a sufficientlylarge set of data for natural pyroxenites and peridotites,the effect of ferric iron on Mg–Fe partitioning betweengarnet and clinopyroxene might be responsible for suchinaccuracy.
The pair garnet–orthopyroxene also gives values thatare comparable with both previous experimental studiesand calculated curves at comparable pressures andtemperatures (Brey & K€oohler, 1990). It is thereforesuggested, on the basis of Mg–Fe partitioning data, thatgarnet–olivine and garnet–orthopyroxene appear to beat equilibrium.
Hydrous phases, i.e. amphibole, chlorite and the 10 Aphase, always show a preferential partitioning of Mg withrespect to olivine (Fig. 6b and c). Nevertheless, data attemperatures up to 1100�C on amphibole–olivine pairsby Mysen & Boettcher (1975) and Niida & Green (1999)might indicate inversion of partitioning with risingtemperature and, potentially, good sensitivity as ageothermometer.
Mass balance
Phase abundances have been estimated by least-squaresmass-balance calculations. Inputs include average
Table 7: WDS chemical compositions of amphiboles
Run: Px8 Px9 Px11 Lz1 Lz4
P (GPa): 2.0 2.2 2.4 2.2 2.4
T (�C): 800 700 700 700 700
SiO2 47.10 (0.75) 51.41 (0.83) 46.32 (2.07) 42.67 (2.68) 43.12 (2.92)
Al2O3 12.51 (0.64) 6.22 (1.00) 12.82 (1.84) 2.67 (0.16) 3.91 (0.20)
FeO 5.73 (0.21) 7.49 (0.32) 5.61 (0.63) 2.98 (0.09) 2.89 (0.28)
MgO 19.49 (0.78) 21.03 (0.98) 18.76 (1.44) 19.02 (1.09) 19.57 (1.46)
CaO 11.41 (0.57) 10.67 (0.79) 11.01 (1.15) 7.66 (0.73) 7.32 (0.60)
Na2O 2.33 (0.27) 1.85 (0.12) 1.39 (0.17) 0.44 (0.06) 0.53 (0.05)
Total 98.56 98.68 95.91 75.44 77.35
Si 6.580 (0.092) 7.181 (0.165) 6.613 (0.178) 7.576 (0.077) 7.452 (0.050)
Al 2.060 (0.103) 1.024 (0.138) 2.157 (0.284) 0.559 (0.056) 0.796 (0.034)
Fe2þ 0.669 (0.027) 0.875 (0.023) 0.670 (0.066) 0.443 (0.024) 0.418 (0.036)
Mg 4.058 (0.117) 4.379 (0.116) 3.992 (0.245) 5.034 (0.090) 5.041 (0.068)
Ca 1.708 (0.090) 1.597 (0.122) 1.684 (0.159) 1.457 (0.078) 1.355 (0.048)
Na 0.631 (0.069) 0.501 (0.033) 0.385 (0.038) 0.152 (0.019) 0.178 (0.011)
XMg 0.86 (0.01) 0.83 (0.00) 0.86 (0.01) 0.92 (0.00) 0.92 (0.01)
XMg ¼ Mg/(Mg þ Fetot).
566
JOURNAL OF PETROLOGY VOLUME 46 NUMBER 3 MARCH 2005 by guest on N
ovember 21, 2015
http://petrology.oxfordjournals.org/D
ownloaded from
analyses and standard deviations for each phase in eachexperiment and bulk composition of the starting material.All iron has been treated as Fe2þ, as the ferric/ferrousratio is unknown in the run charges; the H2O componentwas not included in the calculations, as the H2O contentis not directly measured, but only evaluated indirectlyby the abundance of hydrous phases. Propagated uncer-tainties are of the order of �10–20% relative to theindividual amounts determined.
Representative results are shown in Fig. 7, taking intoaccount two different ranges of temperature: a relativelylow-T section, between 680 and 700�C, for the olivine-poor lherzolite, and a section between 700 and 750�C forthe Tinaquillo lherzolite composition. In the olivine-poor
lherzolite, shaded bands represent reactions that lead tothe transfer of H2O component from amphibole, throughchlorite to the 10 A phase structure; in the Tinaquillolherzolite composition, at higher temperature, reactionsdescribe first H2O transfer from amphibole- to chlorite-bearing assemblages, then complete dehydration.
It is worth noting that problems arose for experimentsat 2�2 and 2�6 GPa, 700�C (runs Px9 and Px10, respec-tively). The fine-grained textures did not allow accurateanalysis of olivine crystals. As a result, mass-balancecalculations have been performed by assuming the olivinecomposition in an experiment at similar P–T conditions(i.e. run Px11, at 2�4 GPa, 700�C). Consequently, theolivine abundance obtained should be regarded with
Fig. 4. Compositional variations in amphibole, atoms per formula unit (a.p.f.u.) calculated on the basis of 23 oxygens. (a) Tetrahedral (IV) vsoctahedral (VI) aluminium; (b) tetrahedral aluminium vs total Na; (c) pressure–temperature dependence of Na in amphibole buffered by thepresence of Na-clinopyroxene. Numbers represent temperature in �C. Grey squares, data from Niida & Green (1999); grey circles, data fromMysen & Boettcher (1975). Ts, tschermakite; Pa, pargasite; Ed, edenite; Ri, richterite; Tr, tremolite; Gl, glaucophane.
567
FUMAGALLI AND POLI PHASE RELATIONS IN HYDROUS PERIDOTITES by guest on N
ovember 21, 2015
http://petrology.oxfordjournals.org/D
ownloaded from
caution. At 2�4 GPa, 700�C chlorite was absent in thephase assemblage, whereas it appears at lower (2�2 GPa)and higher pressure (2�6 GPa). Whether this is a result ofcomplex phase relationships involving amphibole solidsolutions (see the section on amphibole breakdownreactions) is still unclear. However, it should be notedthat chlorite abundance follows a similar trend in the
Table 8: WDS chemical compositions of chlorites
Run: Px9 Px10 Px6 Lz1 Lz4 Lz3 Lz2
P (GPa): 2.2 2.6 4.2 2.2 2.4 2.6 3.0
T (�C): 700 700 680 700 700 700 750
SiO2 32.80 (1.24) 33.55 (0.55) 34.08 (0.92) 34.50 (1.13) 32.13 (3.48) 36.79 (1.57) 37.44 (3.50)
Al2O3 16.69 (0.46) 14.43 (0.41) 14.19 (1.48) 16.00 (0.92) 18.19 (2.67) 11.64 (1.45) 11.71 (1.35)
Fe2O3 0.41 (0.95) 0.81 (1.10) 0.93 (1.10) 0.19 (0.46) 1.06 (1.66) 0.00 (0.00) 0.00 (0.00)
FeO 7.50 (0.80) 8.59 (1.02) 4.22 (1.19) 2.84 (0.39) 2.23 (1.32) 3.63 (0.42) 3.96 (0.65)
MgO 30.89 (1.87) 30.40 (1.58) 33.02 (0.99) 34.18 (1.73) 33.86 (3.74) 35.35 (0.89) 35.36 (1.65)
CaO 0.24 (0.09) 0.36 (0.09) 0.58 (0.33) 0.13 (0.04) 0.19 (0.09) 0.08 (0.02) 0.17 (0.05)
Na2O 0.07 (0.02) 0.04 (0.03) 0.32 (0.17) 0.08 (0.08) 0.03 (0.04) 0.00 (0.01) 0.01 (0.01)
Total 88.61 88.18 87.34 87.93 87.70 87.50 88.65
Si 6.220 (0.116) 6.450 (0.221) 6.460 (0.184) 6.440 (0.094) 6.010 (0.179) 6.920 (0.338) 6.970 (0.334)
Al 3.730 (0.069) 3.270 (0.072) 3.170 (0.289) 3.520 (0.219) 4.010 (0.315) 2.580 (0.301) 2.570 (0.405)
Fe3þ 0.058 (0.130) 0.117 (0.155) 0.133 (0.157) 0.027 (0.064) 0.149 (0.236) 0.000 (0.000) 0.000 (0.000)
Fe2þ 1.190 (0.137) 1.380 (0.187) 0.669 (0.186) 0.444 (0.066) 0.348 (0.206) 0.571 (0.072) 0.616 (0.073)
Mg 8.730 (0.180) 8.710 (0.277) 9.330 (0.246) 9.510 (0.255) 9.440 (0.344) 9.910 (0.127) 9.810 (0.126)
Ca 0.050 (0.021) 0.074 (0.018) 0.118 (0.070) 0.027 (0.009) 0.039 (0.027) 0.016 (0.003) 0.033 (0.010)
Na 0.027 (0.009) 0.013 (0.012) 0.116 (0.063) 0.028 (0.028) 0.012 (0.015) 0.001 (0.002) 0.004 (0.004)
XMg 0.87 (0.01) 0.85 (0.01) 0.92 (0.01) 0.95 (0.01) 0.95 (0.00) 0.95 (0.01) 0.94 (0.01)
XMg ¼ Mg/(Mg þ Fetot).
Table 9: WDS chemical compositions of the 10 A
phase structure recalculated on the basis of seven
cations and 11 oxygens
Run: Px5 Px3 Lz5 Lz10
P (GPa): 4.8 5.2 6.0 6.5
T (�C): 680 680 680 650
SiO2 45.00 (0.52) 46.29 (1.37) 45.94 (1.28) 45.72 (1.48)
Al2O3 10.22 (0.81) 10.53 (0.68) 10.34 (0.54) 9.01 (0.79)
FeO 4.22 (0.35) 4.67 (0.53) 3.10 (0.36) 3.56 (0.58)
MgO 28.69 (0.38) 26.68 (1.18) 30.11 (0.89) 31.28 (1.36)
CaO 0.12 (0.03) 0.72 (0.35) 0.31 (0.16) 0.20 (0.19)
Na2O 0.82 (0.05) 0.34 (0.26) 0.06 (0.04) 0.07 (0.02)
Total 89.07 89.23 89.87 89.83
Si 3.000 (0.035) 3.120 (0.061) 3.030 (0.044) 3.010 (0.090)
Al 0.803 (0.045) 0.836 (0.052) 0.804 (0.040) 0.699 (0.061)
Fe2þ 0.235 (0.014) 0.263 (0.030) 0.171 (0.020) 0.196 (0.031)
Mg 2.850 (0.029) 2.680 (0.069) 2.960 (0.053) 3.070 (0.118)
Ca 0.008 (0.002) 0.052 (0.025) 0.022 (0.012) 0.014 (0.014)
Na 0.106 (0.004) 0.044 (0.034) 0.008 (0.005) 0.008 (0.003)
XMg 0.92 (0.00) 0.91 (0.01) 0.95 (0.01) 0.94 (0.01)
XMg ¼ Mg/(Mg þ Fetot).
Fig. 5. Mineral chemistry of the 10 A phase structure in the system(Fe þ Mg)–Al–Si.
568
JOURNAL OF PETROLOGY VOLUME 46 NUMBER 3 MARCH 2005 by guest on N
ovember 21, 2015
http://petrology.oxfordjournals.org/D
ownloaded from
Tinaquillo lherzolite composition, suggesting effectivecomplexities in topologies at such P–T conditions.
The olivine-poor lherzolite composition shows a lowerabundance of olivine (<34 wt %), compared with theTinaquillo lherzolite (ranging from 47 to 70 wt %), asexpected based on the different Ca and Al contents inthe starting materials. As a result, in the olivine-poorlherzolite the higher Ca and Al content maximize theabundance of clinopyroxene and garnet, whereas ortho-pyroxene occurs only at relatively high temperatures(800�C) and in anhydrous phase assemblages.
Mass-balance calculations provide useful informationto identify the reactions responsible for variations inphase assemblages. In the pressure range 2�2–2�6 GPa,phase abundances suggest the reaction
amphibole þ olivine � H2O ¼ clinopyroxene
þ orthopyroxene þ chlorite ð2Þ
in the Tinaquillo lherzolite (with increasing pressure), and
amphibole ¼ clinopyroxene þ chlorite � garnet ð3Þ
in the olivine-poor lherzolite. As pressure increases, at T
lower than 700�C, garnet increases and chloritedecreases up to 4�2 GPa. At higher pressure, phaseabundances of anhydrous minerals remain almost con-stant, suggesting that the appearance of the 10 A phasestructure might be explained by a continuous reactionapproaching
chlorite � orthopyroxene � garnet ¼ 10 A phase: ð4Þ
Complexities in relationships between chlorite and the10 A phase will be discussed below.
At temperatures ranging from 700 to 750�C, and pres-sures between 2�5 and 4�5 GPa, phase abundances sug-gest the chlorite breakdown reaction
chlorite þ clinopyroxene ¼ olivine
þ garnetð� orthopyroxeneÞ þ H2O: ð5Þ
Breakdown of the 10 A phase is constrained both bymass-balance calculations and by phase abundancesretrieved by Rietveld full profile refinement of X-raypowder diffraction data. Despite uncertainties in mineralcompositions and in the 10 A phase crystal structure,the consistency between mass-balance calculations andRietveld modelling is remarkable: run Px3 at 5�8 GPa,680�C is composed of 30 wt % olivine, 33 wt % clino-pyroxene, 33 wt % garnet, 4 wt % 10 A phase as esti-mated by Rietveld refinement, and 33 wt % olivine,39 wt % clinopyroxene, 24 wt % garnet, 4 wt % 10 Aphase as estimated by mass balance. Discrepancies maybe ascribed to the presence of seed relics and/or toheterogeneities in mineral compositions. Comparison
Fig. 6. (a) Fe–Mg partitioning of olivine vs garnet. XMg ¼ Mg/(Mg þFetot). Curves a, b and c are calculated from the Brey & K€oohler (1990)geothermometer (B&K ’90); grey fields represent previous experimen-tal data from: (1) Taylor (1998) (1050–1100�C, 2�0–3�5 GPa; Hawaiianpyrolite, HPY 40); (2) Niida & Green (1999) (925–1000�C, 2�5–3�2 GPa, MORB pyrolite, MPY 40); (3) Brey et al. (1990) (900–1000�C, 2�8–5�0 GPa, garnet lherzolite, J4). (b) Fe–Mg partitioning ofolivine vs amphibole. (c) Fe–Mg partitioning of olivine vs chlorite.Hydrates always show a preferential partitioning of Mg with respectto olivine. Open triangles, olivine-poor lherzolite composition; opendiamonds, Tinaquillo lherzolite composition; grey circle, Mysen &Boettcher, (1975; M&B 75); grey squares, Niida & Green (1999;N&G 99). Numbers represent pressure in GPa, and temperature in�C, respectively. Error bars are based on the 1s standard deviationsgiven in Tables 3–9.
569
FUMAGALLI AND POLI PHASE RELATIONS IN HYDROUS PERIDOTITES by guest on N
ovember 21, 2015
http://petrology.oxfordjournals.org/D
ownloaded from

between phase proportions in Px3 and Px2 supports thebreakdown reaction for the 10 A phase
10 A phase þ clinopyroxene
¼ garnet þ orthopyroxene þ H2O: ð6Þ
Amphibole breakdown reactions
Chemographic analysis further constrains the amphibolebreakdown reaction at T lower than 700�C. In Fig. 8
phases are projected in the quaternary systemCaO–AlO3/2–SiO2–HO1/2 (CASH) from olivine andthe exchange vectors FeMg�1 and NaAlCa�1Mg�1,to account for Na substitution in both amphibole andclinopyroxene. Phase assemblages are deduced fromexperimentally determined phase assemblages and bythe stability of solid solutions in the pressure rangeconsidered here.
The entire amphibole solid solution tremolite–pargasite is stable to 1�5 GPa ( Jenkins, 1983). As pressureincreases amphibole coexisting with clinopyroxene and
Fig. 7. Abundances of product phases calculated by mass balance as a function of pressure. The grey bands represent the pressure range in whichthe indicated reactions occur. Propagated uncertainties are of the order of 10–20% relative.
570
JOURNAL OF PETROLOGY VOLUME 46 NUMBER 3 MARCH 2005 by guest on N
ovember 21, 2015
http://petrology.oxfordjournals.org/D
ownloaded from
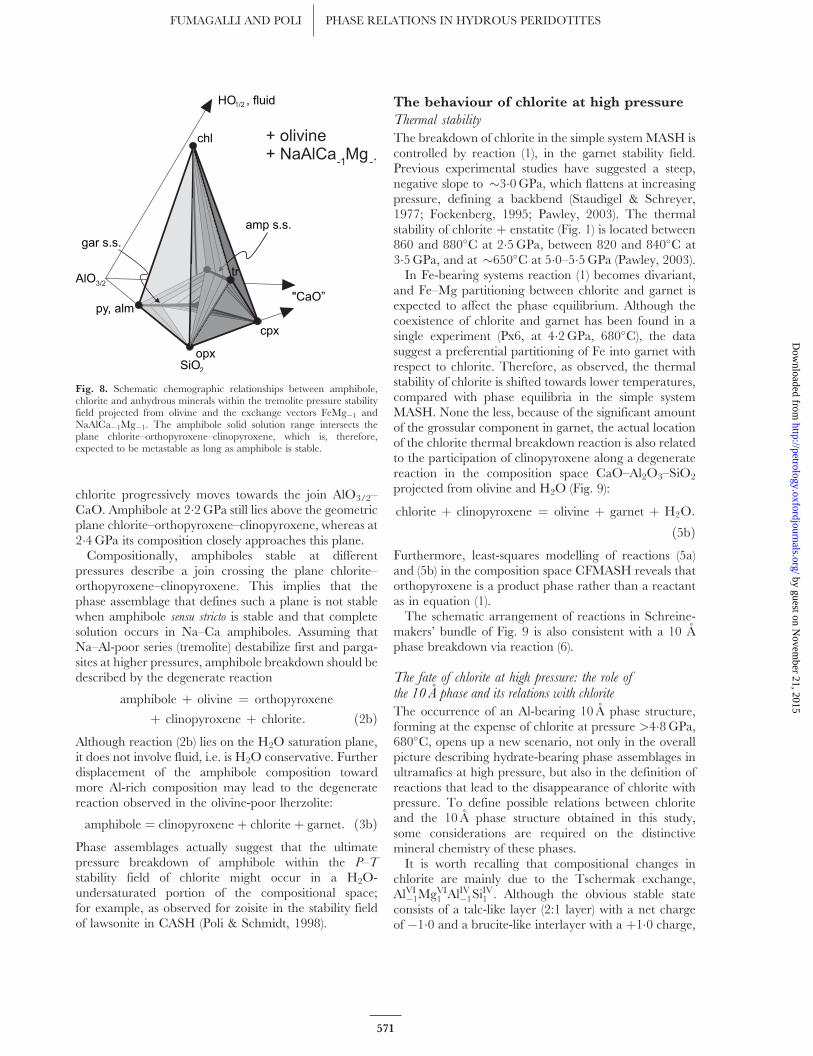
chlorite progressively moves towards the join AlO3/2–CaO. Amphibole at 2�2 GPa still lies above the geometricplane chlorite–orthopyroxene–clinopyroxene, whereas at2�4 GPa its composition closely approaches this plane.
Compositionally, amphiboles stable at differentpressures describe a join crossing the plane chlorite–orthopyroxene–clinopyroxene. This implies that thephase assemblage that defines such a plane is not stablewhen amphibole sensu stricto is stable and that completesolution occurs in Na–Ca amphiboles. Assuming thatNa–Al-poor series (tremolite) destabilize first and parga-sites at higher pressures, amphibole breakdown should bedescribed by the degenerate reaction
amphibole þ olivine ¼ orthopyroxene
þ clinopyroxene þ chlorite: ð2bÞAlthough reaction (2b) lies on the H2O saturation plane,it does not involve fluid, i.e. is H2O conservative. Furtherdisplacement of the amphibole composition towardmore Al-rich composition may lead to the degeneratereaction observed in the olivine-poor lherzolite:
amphibole ¼ clinopyroxene þ chlorite þ garnet: ð3bÞPhase assemblages actually suggest that the ultimatepressure breakdown of amphibole within the P–T
stability field of chlorite might occur in a H2O-undersaturated portion of the compositional space;for example, as observed for zoisite in the stability fieldof lawsonite in CASH (Poli & Schmidt, 1998).
The behaviour of chlorite at high pressure
Thermal stability
The breakdown of chlorite in the simple system MASH iscontrolled by reaction (1), in the garnet stability field.Previous experimental studies have suggested a steep,negative slope to �3�0 GPa, which flattens at increasingpressure, defining a backbend (Staudigel & Schreyer,1977; Fockenberg, 1995; Pawley, 2003). The thermalstability of chlorite þ enstatite (Fig. 1) is located between860 and 880�C at 2�5 GPa, between 820 and 840�C at3�5 GPa, and at �650�C at 5�0–5�5 GPa (Pawley, 2003).
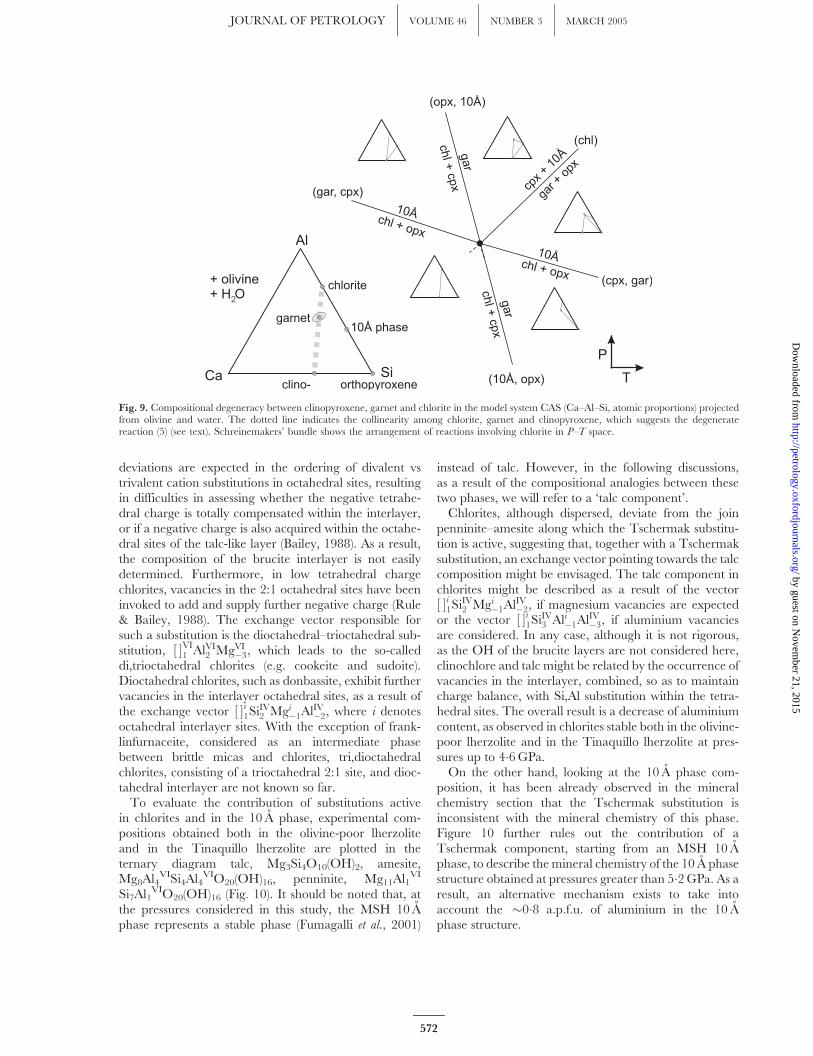
In Fe-bearing systems reaction (1) becomes divariant,and Fe–Mg partitioning between chlorite and garnet isexpected to affect the phase equilibrium. Although thecoexistence of chlorite and garnet has been found in asingle experiment (Px6, at 4�2 GPa, 680�C), the datasuggest a preferential partitioning of Fe into garnet withrespect to chlorite. Therefore, as observed, the thermalstability of chlorite is shifted towards lower temperatures,compared with phase equilibria in the simple systemMASH. None the less, because of the significant amountof the grossular component in garnet, the actual locationof the chlorite thermal breakdown reaction is also relatedto the participation of clinopyroxene along a degeneratereaction in the composition space CaO–Al2O3–SiO2
projected from olivine and H2O (Fig. 9):
chlorite þ clinopyroxene ¼ olivine þ garnet þ H2O:
ð5bÞFurthermore, least-squares modelling of reactions (5a)and (5b) in the composition space CFMASH reveals thatorthopyroxene is a product phase rather than a reactantas in equation (1).
The schematic arrangement of reactions in Schreine-makers’ bundle of Fig. 9 is also consistent with a 10 Aphase breakdown via reaction (6).
The fate of chlorite at high pressure: the role ofthe 10 A phase and its relations with chlorite
The occurrence of an Al-bearing 10 A phase structure,forming at the expense of chlorite at pressure >4�8 GPa,680�C, opens up a new scenario, not only in the overallpicture describing hydrate-bearing phase assemblages inultramafics at high pressure, but also in the definition ofreactions that lead to the disappearance of chlorite withpressure. To define possible relations between chloriteand the 10 A phase structure obtained in this study,some considerations are required on the distinctivemineral chemistry of these phases.
It is worth recalling that compositional changes inchlorite are mainly due to the Tschermak exchange,AlVI
�1MgVI1 AlIV�1SiIV1 . Although the obvious stable state
consists of a talc-like layer (2:1 layer) with a net chargeof �1�0 and a brucite-like interlayer with a þ1�0 charge,
Fig. 8. Schematic chemographic relationships between amphibole,chlorite and anhydrous minerals within the tremolite pressure stabilityfield projected from olivine and the exchange vectors FeMg�1 andNaAlCa�1Mg�1. The amphibole solid solution range intersects theplane chlorite–orthopyroxene–clinopyroxene, which is, therefore,expected to be metastable as long as amphibole is stable.
571
FUMAGALLI AND POLI PHASE RELATIONS IN HYDROUS PERIDOTITES by guest on N
ovember 21, 2015
http://petrology.oxfordjournals.org/D
ownloaded from
deviations are expected in the ordering of divalent vstrivalent cation substitutions in octahedral sites, resultingin difficulties in assessing whether the negative tetrahe-dral charge is totally compensated within the interlayer,or if a negative charge is also acquired within the octahe-dral sites of the talc-like layer (Bailey, 1988). As a result,the composition of the brucite interlayer is not easilydetermined. Furthermore, in low tetrahedral chargechlorites, vacancies in the 2:1 octahedral sites have beeninvoked to add and supply further negative charge (Rule& Bailey, 1988). The exchange vector responsible forsuch a substitution is the dioctahedral–trioctahedral sub-stitution, ½ �VI
1 AlVI2 MgVI
�3, which leads to the so-calleddi,trioctahedral chlorites (e.g. cookeite and sudoite).Dioctahedral chlorites, such as donbassite, exhibit furthervacancies in the interlayer octahedral sites, as a result ofthe exchange vector ½ �i1SiIV2 Mgi
�1AlIV�2, where i denotesoctahedral interlayer sites. With the exception of frank-linfurnaceite, considered as an intermediate phasebetween brittle micas and chlorites, tri,dioctahedralchlorites, consisting of a trioctahedral 2:1 site, and dioc-tahedral interlayer are not known so far.
To evaluate the contribution of substitutions activein chlorites and in the 10 A phase, experimental com-positions obtained both in the olivine-poor lherzoliteand in the Tinaquillo lherzolite are plotted in theternary diagram talc, Mg3Si4O10(OH)2, amesite,Mg8Al4
VISi4Al4VIO20(OH)16, penninite, Mg11Al1
VI
Si7Al1VIO20(OH)16 (Fig. 10). It should be noted that, at
the pressures considered in this study, the MSH 10 Aphase represents a stable phase (Fumagalli et al., 2001)
instead of talc. However, in the following discussions,as a result of the compositional analogies between thesetwo phases, we will refer to a ‘talc component’.
Chlorites, although dispersed, deviate from the joinpenninite–amesite along which the Tschermak substitu-tion is active, suggesting that, together with a Tschermaksubstitution, an exchange vector pointing towards the talccomposition might be envisaged. The talc component inchlorites might be described as a result of the vector½ �i1SiIV2 Mgi
�1AlIV�2, if magnesium vacancies are expectedor the vector ½ �i1SiIV3 Ali�1AlIV�3, if aluminium vacanciesare considered. In any case, although it is not rigorous,as the OH of the brucite layers are not considered here,clinochlore and talc might be related by the occurrence ofvacancies in the interlayer, combined, so as to maintaincharge balance, with Si,Al substitution within the tetra-hedral sites. The overall result is a decrease of aluminiumcontent, as observed in chlorites stable both in the olivine-poor lherzolite and in the Tinaquillo lherzolite at pres-sures up to 4�6 GPa.
On the other hand, looking at the 10 A phase com-position, it has been already observed in the mineralchemistry section that the Tschermak substitution isinconsistent with the mineral chemistry of this phase.Figure 10 further rules out the contribution of aTschermak component, starting from an MSH 10 Aphase, to describe the mineral chemistry of the 10 A phasestructure obtained at pressures greater than 5�2 GPa. As aresult, an alternative mechanism exists to take intoaccount the �0�8 a.p.f.u. of aluminium in the 10 Aphase structure.
Fig. 9. Compositional degeneracy between clinopyroxene, garnet and chlorite in the model system CAS (Ca–Al–Si, atomic proportions) projectedfrom olivine and water. The dotted line indicates the collinearity among chlorite, garnet and clinopyroxene, which suggests the degeneratereaction (5) (see text). Schreinemakers’ bundle shows the arrangement of reactions involving chlorite in P–T space.
572
JOURNAL OF PETROLOGY VOLUME 46 NUMBER 3 MARCH 2005 by guest on N
ovember 21, 2015
http://petrology.oxfordjournals.org/D
ownloaded from
The observed trend in the aluminium content of chlor-ites might be considered as a valid starting point to discussthe 10 A phase. Aluminium in chlorite decreases withincreasing pressure to a minimum limit, below whichthe chlorite structure is no longer stable. A minimumaluminium content requirement is also in agreementwith the minimum interlayer charge on the brucite-typelayer (Nelson & Roy, 1958), used to explain the unfeasi-bility of synthesizing low-Al chlorite. The decrease ofaluminium might be combined with a pressure-depen-dent increase of interlayer vacancies, in accord with theexchange vector ½ �i1SiIV2 Mgi
�1AlIV�2 or ½ �i1SiIV3 Ali�1AlIV�3
(‘talc component’). As a result, the brucite interlayermight be totally ‘removed’ and hydroxyls might beexpected to form water molecules in the interlayer.Such a substitution, if not completely accomplished,leads to compositions that are intermediate between talcwith water in excess (MSH 10 A phase) and chlorite, withthe ‘talc component’ increasing as the reaction occurs.
It is worth noting that a simple intergrowth of twophases (chlorite and MSH 10 A phase), as a result ofpreferential nucleation of MSH 10 A on clinochloreseeds in the starting materials, might be envisaged atfirst sight; however, the homogeneity at the macroscopic
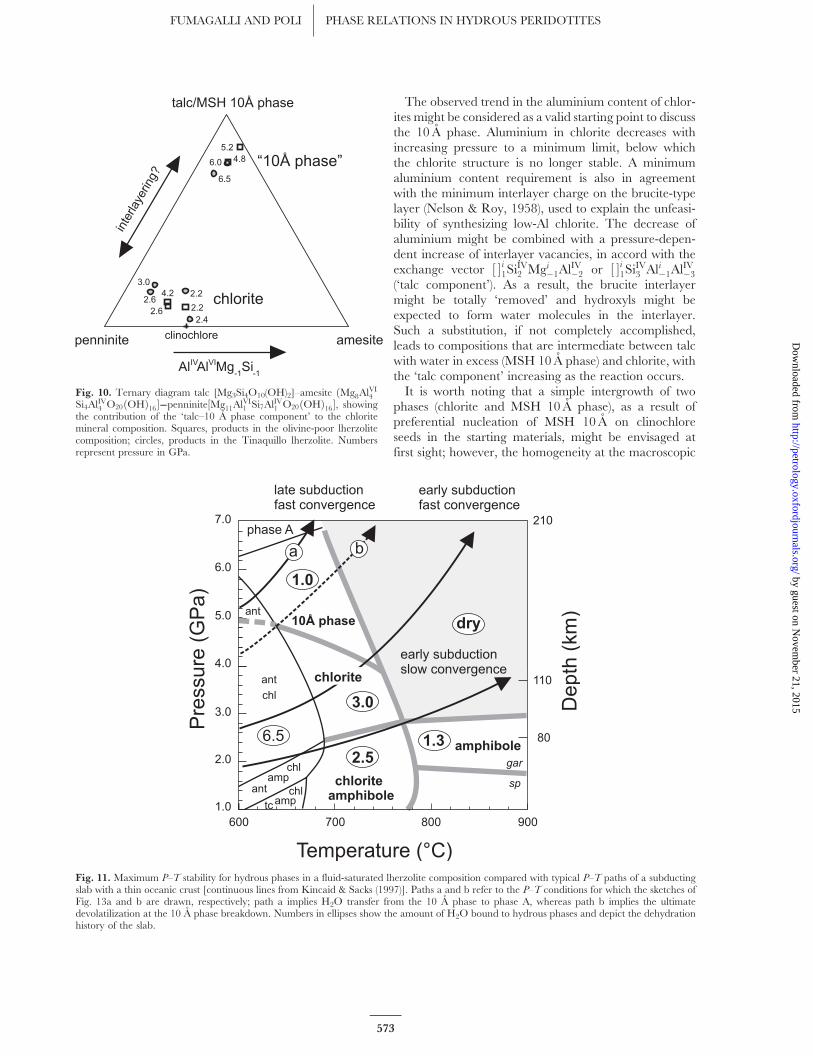
Fig. 10. Ternary diagram talc [Mg3Si4O10(OH)2]–amesite ðMg8AlVI4
Si4AlIV4 O20ðOHÞ16�----penninite½Mg11AlVI1 Si7AlIV1 O20ðOHÞ16�, showing
the contribution of the ‘talc–10 A phase component’ to the chloritemineral composition. Squares, products in the olivine-poor lherzolitecomposition; circles, products in the Tinaquillo lherzolite. Numbersrepresent pressure in GPa.
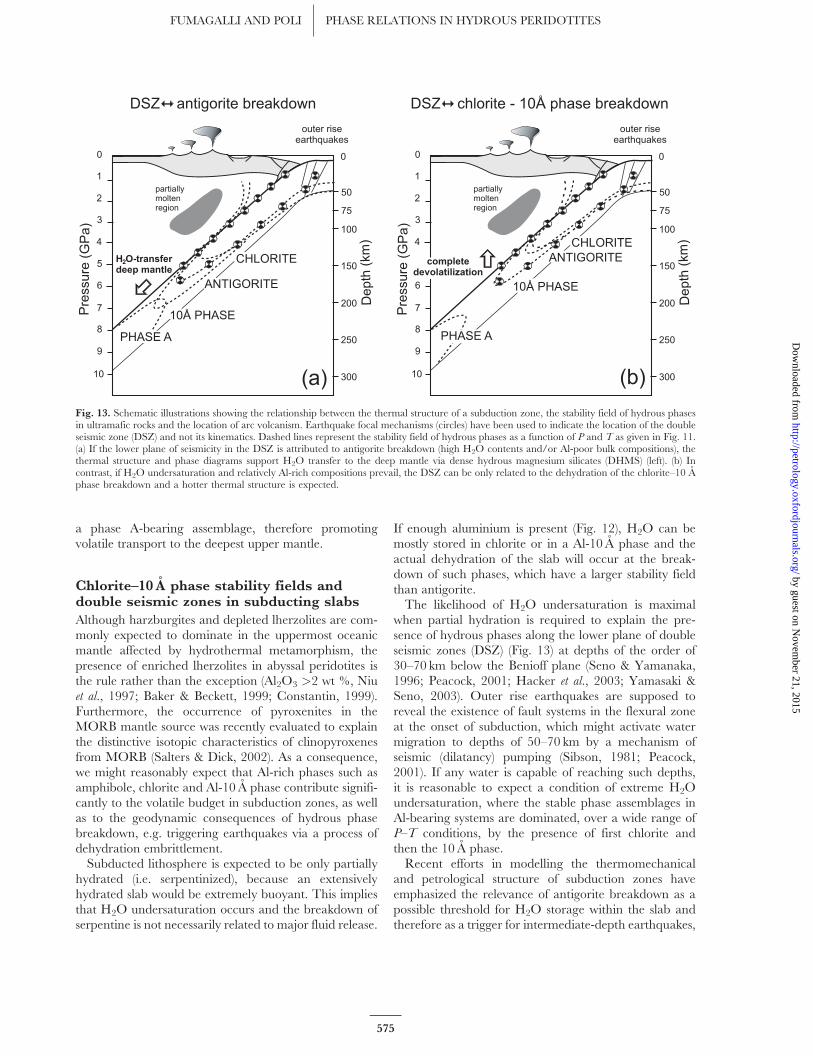
Fig. 11. Maximum P–T stability for hydrous phases in a fluid-saturated lherzolite composition compared with typical P–T paths of a subductingslab with a thin oceanic crust [continuous lines from Kincaid & Sacks (1997)]. Paths a and b refer to the P–T conditions for which the sketches ofFig. 13a and b are drawn, respectively; path a implies H2O transfer from the 10 A phase to phase A, whereas path b implies the ultimatedevolatilization at the 10 A phase breakdown. Numbers in ellipses show the amount of H2O bound to hydrous phases and depict the dehydrationhistory of the slab.
573
FUMAGALLI AND POLI PHASE RELATIONS IN HYDROUS PERIDOTITES by guest on N
ovember 21, 2015
http://petrology.oxfordjournals.org/D
ownloaded from
scale (scanning electron microscope images) and the lackof unequivocal chlorite diffractions in the X-ray pattern,do not corroborate such a hypothesis.
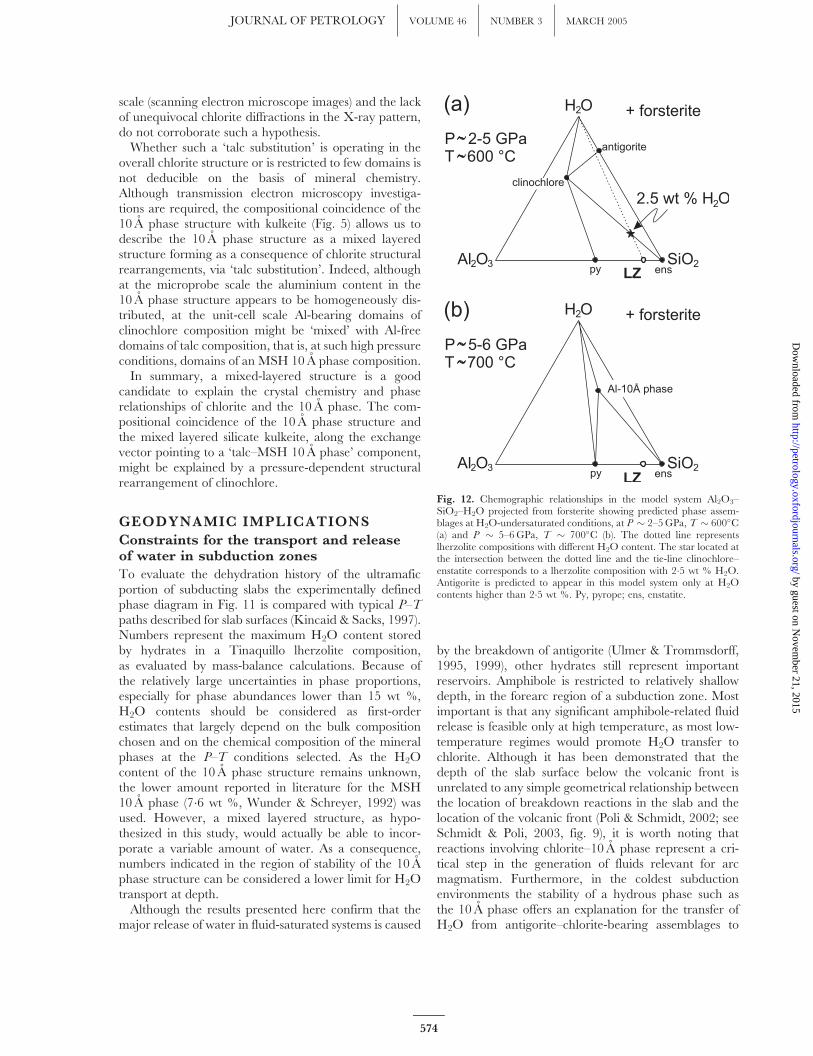
Whether such a ‘talc substitution’ is operating in theoverall chlorite structure or is restricted to few domains isnot deducible on the basis of mineral chemistry.Although transmission electron microscopy investiga-tions are required, the compositional coincidence of the10 A phase structure with kulkeite (Fig. 5) allows us todescribe the 10 A phase structure as a mixed layeredstructure forming as a consequence of chlorite structuralrearrangements, via ‘talc substitution’. Indeed, althoughat the microprobe scale the aluminium content in the10 A phase structure appears to be homogeneously dis-tributed, at the unit-cell scale Al-bearing domains ofclinochlore composition might be ‘mixed’ with Al-freedomains of talc composition, that is, at such high pressureconditions, domains of an MSH 10 A phase composition.
In summary, a mixed-layered structure is a goodcandidate to explain the crystal chemistry and phaserelationships of chlorite and the 10 A phase. The com-positional coincidence of the 10 A phase structure andthe mixed layered silicate kulkeite, along the exchangevector pointing to a ‘talc–MSH 10 A phase’ component,might be explained by a pressure-dependent structuralrearrangement of clinochlore.
GEODYNAMIC IMPLICATIONS
Constraints for the transport and releaseof water in subduction zones
To evaluate the dehydration history of the ultramaficportion of subducting slabs the experimentally definedphase diagram in Fig. 11 is compared with typical P–T
paths described for slab surfaces (Kincaid & Sacks, 1997).Numbers represent the maximum H2O content storedby hydrates in a Tinaquillo lherzolite composition,as evaluated by mass-balance calculations. Because ofthe relatively large uncertainties in phase proportions,especially for phase abundances lower than 15 wt %,H2O contents should be considered as first-orderestimates that largely depend on the bulk compositionchosen and on the chemical composition of the mineralphases at the P–T conditions selected. As the H2Ocontent of the 10 A phase structure remains unknown,the lower amount reported in literature for the MSH10 A phase (7�6 wt %, Wunder & Schreyer, 1992) wasused. However, a mixed layered structure, as hypo-thesized in this study, would actually be able to incor-porate a variable amount of water. As a consequence,numbers indicated in the region of stability of the 10 Aphase structure can be considered a lower limit for H2Otransport at depth.
Although the results presented here confirm that themajor release of water in fluid-saturated systems is caused
by the breakdown of antigorite (Ulmer & Trommsdorff,1995, 1999), other hydrates still represent importantreservoirs. Amphibole is restricted to relatively shallowdepth, in the forearc region of a subduction zone. Mostimportant is that any significant amphibole-related fluidrelease is feasible only at high temperature, as most low-temperature regimes would promote H2O transfer tochlorite. Although it has been demonstrated that thedepth of the slab surface below the volcanic front isunrelated to any simple geometrical relationship betweenthe location of breakdown reactions in the slab and thelocation of the volcanic front (Poli & Schmidt, 2002; seeSchmidt & Poli, 2003, fig. 9), it is worth noting thatreactions involving chlorite–10 A phase represent a cri-tical step in the generation of fluids relevant for arcmagmatism. Furthermore, in the coldest subductionenvironments the stability of a hydrous phase such asthe 10 A phase offers an explanation for the transfer ofH2O from antigorite–chlorite-bearing assemblages to
Fig. 12. Chemographic relationships in the model system Al2O3–SiO2–H2O projected from forsterite showing predicted phase assem-blages at H2O-undersaturated conditions, at P � 2–5 GPa, T � 600�C(a) and P � 5–6 GPa, T � 700�C (b). The dotted line representslherzolite compositions with different H2O content. The star located atthe intersection between the dotted line and the tie-line clinochlore–enstatite corresponds to a lherzolite composition with 2�5 wt % H2O.Antigorite is predicted to appear in this model system only at H2Ocontents higher than 2�5 wt %. Py, pyrope; ens, enstatite.
574
JOURNAL OF PETROLOGY VOLUME 46 NUMBER 3 MARCH 2005 by guest on N
ovember 21, 2015
http://petrology.oxfordjournals.org/D
ownloaded from
a phase A-bearing assemblage, therefore promotingvolatile transport to the deepest upper mantle.
Chlorite–10 A phase stability fields anddouble seismic zones in subducting slabs
Although harzburgites and depleted lherzolites are com-monly expected to dominate in the uppermost oceanicmantle affected by hydrothermal metamorphism, thepresence of enriched lherzolites in abyssal peridotites isthe rule rather than the exception (Al2O3 >2 wt %, Niuet al., 1997; Baker & Beckett, 1999; Constantin, 1999).Furthermore, the occurrence of pyroxenites in theMORB mantle source was recently evaluated to explainthe distinctive isotopic characteristics of clinopyroxenesfrom MORB (Salters & Dick, 2002). As a consequence,we might reasonably expect that Al-rich phases such asamphibole, chlorite and Al-10 A phase contribute signifi-cantly to the volatile budget in subduction zones, as wellas to the geodynamic consequences of hydrous phasebreakdown, e.g. triggering earthquakes via a process ofdehydration embrittlement.
Subducted lithosphere is expected to be only partiallyhydrated (i.e. serpentinized), because an extensivelyhydrated slab would be extremely buoyant. This impliesthat H2O undersaturation occurs and the breakdown ofserpentine is not necessarily related to major fluid release.
If enough aluminium is present (Fig. 12), H2O can bemostly stored in chlorite or in a Al-10 A phase and theactual dehydration of the slab will occur at the break-down of such phases, which have a larger stability fieldthan antigorite.
The likelihood of H2O undersaturation is maximalwhen partial hydration is required to explain the pre-sence of hydrous phases along the lower plane of doubleseismic zones (DSZ) (Fig. 13) at depths of the order of30–70 km below the Benioff plane (Seno & Yamanaka,1996; Peacock, 2001; Hacker et al., 2003; Yamasaki &Seno, 2003). Outer rise earthquakes are supposed toreveal the existence of fault systems in the flexural zoneat the onset of subduction, which might activate watermigration to depths of 50–70 km by a mechanism ofseismic (dilatancy) pumping (Sibson, 1981; Peacock,2001). If any water is capable of reaching such depths,it is reasonable to expect a condition of extreme H2Oundersaturation, where the stable phase assemblages inAl-bearing systems are dominated, over a wide range ofP–T conditions, by the presence of first chlorite andthen the 10 A phase.
Recent efforts in modelling the thermomechanicaland petrological structure of subduction zones haveemphasized the relevance of antigorite breakdown as apossible threshold for H2O storage within the slab andtherefore as a trigger for intermediate-depth earthquakes,
Fig. 13. Schematic illustrations showing the relationship between the thermal structure of a subduction zone, the stability field of hydrous phasesin ultramafic rocks and the location of arc volcanism. Earthquake focal mechanisms (circles) have been used to indicate the location of the doubleseismic zone (DSZ) and not its kinematics. Dashed lines represent the stability field of hydrous phases as a function of P and T as given in Fig. 11.(a) If the lower plane of seismicity in the DSZ is attributed to antigorite breakdown (high H2O contents and/or Al-poor bulk compositions), thethermal structure and phase diagrams support H2O transfer to the deep mantle via dense hydrous magnesium silicates (DHMS) (left). (b) Incontrast, if H2O undersaturation and relatively Al-rich compositions prevail, the DSZ can be only related to the dehydration of the chlorite–10 Aphase breakdown and a hotter thermal structure is expected.
575
FUMAGALLI AND POLI PHASE RELATIONS IN HYDROUS PERIDOTITES by guest on N
ovember 21, 2015
http://petrology.oxfordjournals.org/D
ownloaded from
including earthquakes along the lower plane of doubleseismic zones. If this is the case, the experimentally deter-mined phase relationships presented here would suggestthat the thermal structure of the slab is likely to bepath a in Fig. 11 and H2O transfer to DHMS takesplace (Fig. 13). In contrast, if H2O undersaturation andlherzolitic compositions prevail in the slab, then lowerplane earthquakes should be related to the breakdownof chlorite–10 A phase as the first fluids pulse out of theslab. This second hypothesis necessarily implies a thermalfield incompatible with a petrological link betweenantigorite–chlorite–10 A phase and DHMS (see path bin Fig. 11), and complete devolatilization of ultramaficrocks is expected to occur where the upper and lowerplane of the DSZ join at c. 150–200 km depth (Fig. 13).
ACKNOWLEDGEMENTS
The first version of the manuscript was prepared whileP.F. was a post-doctoral fellow at the Department ofGeological Sciences, University of Michigan, Ann Arbor.Many thanks go to L. Stixrude and C. Lithgow-Bertellonifor enlightening discussions. This experimental work hasbenefited greatly from the support of CNR-IDPA. We aremost indebted to Max W. Schmidt for fruitful discussionson subduction-zone processes and for supporting micro-analysis at Clermont-Ferrand. We thank David H. Greenand Peter Ulmer for their thoughtful reviews. Financialsupport for this study was provided by COFIN andFIRST grants.
REFERENCES
Ai, Y. (1994). A revision of the garnet–clinopyroxene Fe2þ–Mg
exchange geothermometer. Contributions to Mineralogy and Petrology 115,
465–473.
Artioli, G., Fumagalli, P. & Poli, S. (1999). The crystal structure
of Mg8Mg2Al2Al8Si12(O,OH)56 pumpellyite and its relevance in
ultramafic systems at high pressure. American Mineralogist 84,
1906–1914.
Bailey, S. W. (1988). Chlorites; structures and crystal chemistry.
In: Bailey, S. W. (ed.) Hydrous Phyllosilicates (Exclusive of
Micas). Mineralogical Society of America, Reviews in Mineralogy 19,
347–403.
Baker, M. B. & Beckett, J. R. (1999). The origin of abyssal peridotites: a
reinterpretation of constraints based on primary bulk compositions.
Earth and Planetary Science Letters 171, 49–61.
Bauer, J. F. & Sclar, C.B. (1981). The ‘10 A phase’ in the system MgO–
SiO2–H2O. American Mineralogist 66, 576–585.
Boillot, G., Girardeau, J. & Kornprobst, J. (1988). Rifting of the Galicia
margin: crustal thinning and enplacement of mantle rocks on the
seafloor. In: Boillot, G., Winterer, E. L., et al. (eds) Proceedings of the
Ocean Drilling Program, Scientific Results, 103. College Station, TX:
Ocean Drilling Program, pp. 741–756.
Brey, G. P. & K€oohler, T. (1990). Geothermobarometry in four-phase
lherzolites; II, New thermobarometers, and practical assessment of
existing thermobarometers. Journal of Petrology 31, 1353–1378.
Brey, G. P., K€oohler, T. & Nickel, K. G. (1990). Geothermobarometry
in four-phase lherzolites; I, Experimental results from 10 to 60 kbar.
Journal of Petrology 31, 1313–1352.
Bromiley, G. D. & Pawley, A. R. (2003). The stability of antigorite in
the systems MgO–SiO2–H2O (MSH) and MgO–Al2O3–SiO2–H2O
(MASH): the effect of Al3þ substitution on high-pressure stability.
American Mineralogist 88, 99–108.
Chinnery, N. J., Pawley, A. R. & Clark, S. M. (1999). In situ observation
of the formation of 10 A phase from talc þ H2O at mantle pressures
and temperatures. Science 286, 940–942.
Chou, I.-M. (1986). Permeability of precious metals to hydrogen at 2 kb
total pressure and elevated temperatures. American Journal of Science
286, 638–658.
Connolly, J. A. D. & Cesare, B. (1993). C–O–H–S fluid composition
and oxygen fugacity in graphitic metapelites. Journal of Metamorphic
Geology 11, 379–388.
Constantin, M. (1999). Gabbroic intrusions and magmatic metasoma-
tism in harzburgites from the Garrett transform fault: implications
for the nature of the mantle–crust transition at fast-spreading ridges.
Contributions to Mineralogy and Petrology 136, 11–130.
Davies, J. H. & Stevenson, D. J. (1992). Physical model of source
region of subduction zone volcanics. Journal of Geophysical Research
97, 2037–2070.
Fockenberg, T. (1995). New experimental results up to 100 kbar in the
system MgO–Al2O3–SiO2–H2O (MASH): preliminary stability
fields of chlorite chloritoid staurolite MgMgAl-pumpellyite and
pyrope. Bochumer Geologische und Geotechnische Arbeiten 44, 39–44.
Frost, D. J. (1999). The stability of dense hydrous magnesium silicates
in Earth’s transition zone and lower mantle. In: Fei, Y.-W.,
Bertka, C. & Mysen, B. O. (eds) Mantle Petrology: Field Observations
and High Pressure Experimentation: a Tribute to Francis R. (Joe) Boyd.
Geochemical Society, Special Publications 6, 283–296.
Frueh-Green, G. L., Plas, A. & L�eecuyer, C. H. (1996). Petrologic and
stable isotope constraints on hydrothermal alteration and serpenti-
nization of the shallow mantle at Hess Deep (site 895). In: M�eevel, C.,
Gillis, K. M., Allan, J. F. & Meyer, P. S. (eds) Proceedings of the Ocean
Drilling Program, Scientific Results, 147. College Station, TX: Ocean
Drilling Program, pp. 255–291.
Fumagalli, P. & Poli, S. (1999). Phase relationships in hydrous
peridotites at high pressure: preliminary results of multianvil
experiments. Periodico di Mineralogia 68, 275–286.
Fumagalli, P., Stixrude, L., Poli, S. & Snyder, D. (2001). The 10 A
phase: a high-pressure expandable sheet silicate stable during
subduction of hydrated lithosphere. Earth and Planetary Science Letters
186, 125–141.
Gasparik, T. (1987). Orthopyroxene thermobarometry in simple and
complex systems. Contributions to Mineralogy and Petrology 96, 357–370.
Green, D. H. (1963). Alumina content of enstatite in a Venezuelan
high-temperature peridotite. Geological Society of America Bulletin 74,
1397–1401.
Green, D. H. (1973). Experimental melting studies on a model upper
mantle composition at high pressure under water-saturated and
water-undersaturated conditions. Earth and Planetary Science Letters 19,
37–53.
Hacker, B. R., Peacock, S. M., Abers, G. A. & Holloway, S. D. (2003).
Subduction factory 2. Are intermediate-depth earthquakes in
subducting slabs linked to metamorphic dehydration reactions?
Journal of Geophysiscal Research 108, 2030–2046.
Hamilton, D. L. & Henderson, C. M. B. (1968). The preparation of
silicate composition by gelling method. Mineralogical Magazine 36,
832–838.
Hebert, R., Bideau, D. & Hekinian, R. (1983). Ultramafic and mafic
rocks from the Garrett Transform Fault near 13� 300 S on the East
576
JOURNAL OF PETROLOGY VOLUME 46 NUMBER 3 MARCH 2005 by guest on N
ovember 21, 2015
http://petrology.oxfordjournals.org/D
ownloaded from
Pacific Rise: igneous petrology. Earth and Planetary Science Letters 65,
107–125.
Hirschmann, M. M. & Stolper, E. M. (1996). A possible role for garnet
pyroxenite in the origin of the ‘garnet signature’ in MORB.
Contributions to Mineralogy and Petrology 124, 185–208.
Jenkins, D. M. (1983). Stability and composition relations of calcic
amphiboles in ultramafic rocks. Contributions to Mineralogy and Petrology
83, 375–384.
Katayama, I., Parkinson, C. D., Okamoto, K., Nakajima, Y. &
Maruyama, S. (2000). Supersilicic clinopyroxene and silica exsolu-
tion in UHPM eclogite and pelitic gneiss from the Kokchetav Massif,
Kazakhstan. American Mineralogist 85, 1368–1374.
Kawamoto, T., Hervig, R. L. & Holloway, J. R. (1996). Experimental
evidence for a hydrous transition zone in the early Earth’s mantle.
Earth and Planetary Science Letters 143, 587–592.
Kincaid, C. & Sacks, I. S. (1997). Thermal and dynamical evolution of
the upper mantle in subduction zones. Journal of Geophysical Research
102, 12295–12315.
Krogh, E. J. (1988). The garnet–clinopyroxene Fe–Mg geotherm-
ometer; a reinterpretation of existing experimental data. Contributions
to Mineralogy and Petrology 99, 44–48.
Krogh-Ravna, E. J. & Paquin, J. (2003). Thermobarometric
methodologies applicable to eclogites and garnet ultrabasites. In:
Carswell, D. A. & Compagnoni, R. (eds) Ultrahigh Pressure
Metamorphism. European Mineralogical Union Notes in Mineralogy 5,
229–253.
Leake, B. E., Woolley, A. R., Arps, C. E. S., et al. (1997). Nomenclature
of amphiboles; report of the subcommittee on amphiboles of
the International Mineralogical Association, Commission on New
Minerals and Mineral. Canadian Mineralogist 35, 219–246.
Luth, R. W., Virgo, D., Boyd, F. R. & Wood, B. J. (1990). Ferric iron in
mantle-derived garnets; implications for thermobarometry and for
the oxidation state of the mantle. Contributions to Mineralogy and
Petrology 104, 56–72.
Mengel, K. & Green, D. H. (1989). Stability of amphibole and
phlogopite in metasomatized peridotite under water-saturated and
water-undersaturated conditions. In: Ross, J. (ed.) Kimberlites
and Related Rocks. Geological Society of Australia, Special Publications 14,
571–581.
Milhollen, G. K., Irving, A. J. & Wyllie, P. J. (1974). Melting interval
of peridotite with 5�7 per cent water to 30 kbar. Journal of Geology
82, 575–587.
Muller, M. R., Robinson, C. J., Minshull, T. A., White, R. S. &
Bickle, M. J. (1997). Thin crust beneath Ocean Drilling Program
borehole 735B at the Southwest Indian Ridge. Earth and Planetary
Science Letters 148, 93–107.
Mysen, B. O. & Boettcher, A. L. (1975). Melting of a hydrous mantle:
I. Phase relations of natural peridotite at high pressures and
temperatures with controlled activities of water, carbon dioxide, and
hydrogen. Journal of Petrology 16, 520–548.
Nelson, B. W. & Roy, R. (1958). Synthesis of the chlorites and
their structural and chemical constitution. American Mineralogist 43,
707–725.
Niida, K. & Green, D. H. (1999). Stability and chemical com-
position of pargasitic amphibole in MORB pyrolite under upper
mantle conditions. Contributions to Mineralogy and Petrology 135,
18–40.
Niu, Y., Langmuir, C. H. & Kinzler, R. J. (1997). The origin of abyssal
peridotites: a new perspective. Earth and Planetary Science Letters 152,
251–265.
O’Neill, H. S. C. (1981). The transition between spinel lherzolite and
garnet lherzolite, and its use as a geobarometer. Contributions to
Mineralogy and Petrology 77, 185–194.
Pawley, A. (2003). Chlorite stability in mantle peridotite: the reaction
clinochlore plus enstatite ¼ forsterite þ pyrope þ H2O. Contributions
to Mineralogy and Petrology 144, 449–456.
Pawley, A. R. & Wood, B. J. (1995). The high-pressure stability of talc
and 10 A phase: potential storage sites for H2O in subduction zones.
American Mineralogist 80, 998–1003.
Peacock, S. M. (2001). Are the lower planes of double seismic zones
caused by serpentine dehydration in subducting oceanic mantle?
Geology 29, 299–302.
Perkins, D. & Vielzeuf, D. (1992). Experimental investigation of
Fe–Mg distribution between olivine and clinopyroxene; implications
for mixing properties of Fe–Mg in clinopyroxene and garnet–
clinopyroxene thermometry. American Mineralogist 77, 774–783.
Poli, S. & Schmidt, M. W. (1998). The high-pressure stability of zoisite
and phase relationships of zoisite-bearing assemblages. Contributions to
Mineralogy and Petrology 130, 162–175.
Poli, S. & Schmidt, M. W. (2002). Petrology of subducted slabs. Annual
Review of Earth and Planetary Sciences 30, 207–235.
Rule, A. C. & Bailey, S. W. (1988). Refinement of the crystal structure
of a monoclinic ferroan clinochlore. Clays and Clay Minerals 35,
129–138.
Salters, V. J. M. & Dick, H. J. B. (2002). Mineralogy of the mid-
ocean-ridge basalt source from neodymium isotopic composition of
abyssal peridotites. Nature 418, 68–71.
Schmidt, M. W. & Poli, S. (1998). Experimentally based water budgets
for dehydrating slabs and consequences for arc magma generation.
Earth and Planetary Science Letters 163, 361–379.
Schmidt, M. W. & Poli, S. (2003). Generation of mobile components
during oceanic crust subduction. In: Rudnick, R. L. (ed.) Treatise on
Geochemistry, Vol. 3: The Crust. Amsterdam: Elsevier, pp. 567–591.
Schmidt, M. W. & Ulmer, P. (2004). A rocking multi-anvil: elimination
of chemical segregation in fluid-saturated high pressure experiments.
Geochimica et Cosmochimica Acta 68, 1889–1899.
Schreyer, W., Medenbach, O., Abraham, K., Gebert, W. & M€uuller, W. F.
(1982). Kulkeite a new metamorphic phyllosilicate mineral: ordered
1:1 chlorite/talc mixed-layer. Contributions to Mineralogy and Petrology
80, 103–109.
Sclar, C. B., Carrison, L. C. & Schwartz, C. M. (1965). High-pressure
synthesis and stability of a new hydronium-bearing layer silicate in
the system MgO–SiO2–H2O. Transactions of the American Geophysical
Union 46, 184.
Seno, T. & Yamanaka, Y. (1996). Double seismic zones, compressional
deep trench–outer rise events, and superplumes. In: Bebout, G. E.,
Scholl, D. W., Kirby, S. H. & Platt, J. P. (eds) Subduction Top to Bottom.
Geophysical Monograph, American Geophysical Union 96, 347–355.
Sibson, R. H. (1981). Controls on low-stress hydrofracture dilatancy in
thrust, wrench, and normal fault terrains. Nature 289, 655–667.
Smith, D. (1995). Chlorite-rich ultramafic reaction zones in Colorado
Plateau xenoliths: recorders of sub-Moho hydration. Contributions to
Mineralogy and Petrology 121, 185–200.
Stalder, R. & Ulmer, P. (2001). Phase relations of a serpentine
composition between 5 and 14 GPa: significance of clinohumite
and phase E as water carriers into the transition zone. Contributions to
Mineralogy and Petrology 140, 670–679.
Staudigel, H. & Schreyer, W. (1977). The upper thermal stability
of clinochlore, Mg5Al[AlSi3O10](OH)8, at 10–35 kb P(H2O).
Contributions to Mineralogy and Petrology 61, 187–198.
Susaki, J., Akaogi, M., Akimoto, S. & Shimomura, O. (1985). Garnet–
perovskite transformation in CaGeO3: in situ X-ray measurements
using synchrotron radiation. Geophysical Research Letters 12, 729–732.
Tatsumi, Y. & Eggins, S. (1995). Hoffman, P. F., Jeanloz, R. &
Knoll, A. H. (eds) Subduction Zone Magmatism. Blackwell Science,
Oxford, 211 pp.
577
FUMAGALLI AND POLI PHASE RELATIONS IN HYDROUS PERIDOTITES by guest on N
ovember 21, 2015
http://petrology.oxfordjournals.org/D
ownloaded from
Taylor, W. R. (1998). An experimental test of some geothermometer
and geobarometer formulations for upper mantle peridotites with
application to the thermobarometry of fertile lherzolite and garnet
websterite. Neues Jahrbuch f€uur Mineralogie, Abhandlungen 172, 381–408.
Ulmer, P. & Trommsdorff, V. (1995). Serpentine stability to mantle
depths and subduction-related magmatism. Science 268, 858–861.
Ulmer, P. & Trommsdorff, V. (1999). Phase relations of hydrous
mantle subducting to 300 km. In: Fei, Y.-W., Bertka, C. &
Mysen, B. O. (eds) Mantle Petrology: Field Observations and High Pressure
Experimentation: a Tribute to Francis R. ( Joe) Boyd. Geochemical Society,
Special Publications 6, 259–281.
Wallace, M. E. & Green, D. H. (1991). The effect of bulk rock
composition on the stability of amphibole in the upper mantle:
implications for solidus positions and mantle metasomatism.
Mineralogy and Petrology 44, 1–19.
Woodland, A. B. & O’Neill, H. S. C. (1993). Synthesis and stability of
Fe2þ3Fe3þ
2Si3O12 garnet and phase relations with Fe3Al2Si3O12–
Fe2þ3Fe3þ
2Si3O12 solutions. American Mineralogist 78, 1002–1015.
Woodland, A. B. & O’Neill, H. S. C. (1995). Phase relations
between Ca3Fe3þ2Si3O12–Fe2þ
3Fe3þ2Si3O12 garnet and
CaFeSi2O6–Fe2Si2O6 pyroxene solid solutions. Contributions to
Mineralogy and Petrology 121, 87–98.
Wunder, B. & Schreyer, W. (1992). Metastability of the 10 A phase in
the system MgO–SiO2–H2O (MSH). What about hydrous MSH
phases in subduction zones? Journal of Petrology 33, 877–889.
Wunder, B., Wirth, R. & Gottschalk, M. (2001). Antigorite: pressure
and temperature dependence of polysomatism and water content.
European Journal of Mineralogy 13, 485–495.
Wyllie, P. J. (1988). Magma genesis, plate tectonics, and chemical
differentiation of the Earth. Review of Geophysics 26, 370–404.
Yamamoto, K. & Akimoto, S. I. (1977). The system MgO–SiO2–H2O
at high pressures and temperatures—stability field for hydroxyl-
chondrodite, hydroxyl-clinohumite and 10 A phase. American Journal
of Science 277, 288–312.
Yamasaki, T. & Seno, T. (2003). Double seismic zone and dehydration
embrittlement of the subducting slab. Journal of Geophysical Research
108, 2212–2232.
Zhang, J., Li, B., Utsumi, W. & Liebermann, R. C. (1996). In situ X-ray
observations on the coesite–stishovite transition: reversed phase
boundary and kinetics. Physics and Chemistry of Minerals 23, 1–10.
578
JOURNAL OF PETROLOGY VOLUME 46 NUMBER 3 MARCH 2005 by guest on N
ovember 21, 2015
http://petrology.oxfordjournals.org/D
ownloaded from
Copyright © 2022 FDOKUMEN