Experimentally Derived Feasibility of Optical Camera ...
16
HAL Id: hal-02572105 https://hal.archives-ouvertes.fr/hal-02572105 Submitted on 13 May 2020 HAL is a multi-disciplinary open access archive for the deposit and dissemination of sci- entific research documents, whether they are pub- lished or not. The documents may come from teaching and research institutions in France or abroad, or from public or private research centers. L’archive ouverte pluridisciplinaire HAL, est destinée au dépôt et à la diffusion de documents scientifiques de niveau recherche, publiés ou non, émanant des établissements d’enseignement et de recherche français ou étrangers, des laboratoires publics ou privés. Distributed under a Creative Commons Attribution| 4.0 International License Experimentally Derived Feasibility of Optical Camera Communications under Turbulence and Fog Conditions Vicente Matus, Elizabeth Eso, Shivani Rajendra Teli, Rafael Perez-Jimenez, Stanislav Zvanovec To cite this version: Vicente Matus, Elizabeth Eso, Shivani Rajendra Teli, Rafael Perez-Jimenez, Stanislav Zvanovec. Ex- perimentally Derived Feasibility of Optical Camera Communications under Turbulence and Fog Con- ditions. Sensors, MDPI, 2020, 20 (3), pp.757. 10.3390/s20030757. hal-02572105
-
Upload
khangminh22 -
Category
Documents
-
view
1 -
download
0
Transcript of Experimentally Derived Feasibility of Optical Camera ...

HAL Id: hal-02572105https://hal.archives-ouvertes.fr/hal-02572105
Submitted on 13 May 2020
HAL is a multi-disciplinary open accessarchive for the deposit and dissemination of sci-entific research documents, whether they are pub-lished or not. The documents may come fromteaching and research institutions in France orabroad, or from public or private research centers.
L’archive ouverte pluridisciplinaire HAL, estdestinée au dépôt et à la diffusion de documentsscientifiques de niveau recherche, publiés ou non,émanant des établissements d’enseignement et derecherche français ou étrangers, des laboratoirespublics ou privés.
Distributed under a Creative Commons Attribution| 4.0 International License
Experimentally Derived Feasibility of Optical CameraCommunications under Turbulence and Fog ConditionsVicente Matus, Elizabeth Eso, Shivani Rajendra Teli, Rafael Perez-Jimenez,
Stanislav Zvanovec
To cite this version:Vicente Matus, Elizabeth Eso, Shivani Rajendra Teli, Rafael Perez-Jimenez, Stanislav Zvanovec. Ex-perimentally Derived Feasibility of Optical Camera Communications under Turbulence and Fog Con-ditions. Sensors, MDPI, 2020, 20 (3), pp.757. �10.3390/s20030757�. �hal-02572105�

sensors
Article
Experimentally Derived Feasibility of Optical CameraCommunications under Turbulence and FogConditions
Vicente Matus 1,* , Elizabeth Eso 2 , Shivani Rajendra Teli 3 , Rafael Perez-Jimenez 1 andStanislav Zvanovec 3
1 Institute for Technological Development and Innovation in Communications, Universidad de Las Palmas deGran Canaria, 35001 Las Palmas, Spain; [email protected]
2 Optical Communications Research Group, Northumbria University, Newcastle-upon-Tyne NE1 7RU, UK;[email protected]
3 Department of Electromagnetic Field, Faculty of Electrical Engineering, Czech Technical University inPrague, Technicka, 16627 Prague, Czech Republic; [email protected] (S.R.T.); [email protected] (S.Z.)
* Correspondence: [email protected]
Received: 30 November 2019; Accepted: 28 January 2020; Published: 30 January 2020
Abstract: Optical camera communications (OCC) research field has grown recently, aided byubiquitous digital cameras; however, atmospheric conditions can restrict their feasibility in outdoorscenarios. In this work, we studied an experimental OCC system under environmental phenomenaemulated in a laboratory chamber. We found that the heat-induced turbulence does not affect oursystem significantly, while the attenuation caused by fog does decrease the signal quality. For thisreason, a novel strategy is proposed, using the camera’s built-in amplifier to overcome the opticalpower loss and to decrease the quantization noise induced by the analog-digital converter of thecamera. The signal quality has been evaluated using the Pearson’s correlation coefficient with respectto a reference template signal, along with the signal-to-noise ratio that has been empirically evaluated.The amplification mechanism introduced allows our system to receive the OCC signal under heavyfog by gradually increasing the camera gain up to 16 dB, for meteorological visibility values down to10 m, with a correlation coefficient of 0.9 with respect to clear conditions.
Keywords: optical camera communications (OCC); CMOS image sensor; rolling shutter; fogattenuation; heat-induced turbulence; meteorological visibility; refractive index structure parameter
1. Introduction
Digital cameras are ubiquitous consumer electronics and are being explored to deliver extracapabilities beyond traditional photography and video. A new optical communication techniqueusing cameras as receivers has been studied in the IEEE 802.15 SG7a within the framework of opticalwireless communications and considered as a candidate of IEEE 802.15.7r1, which is called OpticalCamera Communication (OCC). OCC has been investigated as one of the Visible Light Communication(VLC) schemes [1]. OCC implemented within internet of things (IoT) environments provides multiplefunctionalities of vision, data communications, localization and motion detection (MD) [2,3] usedin various IoT-based network applications including device-to-device communications [4], mobileatto-cells [5], vehicular communications [6–8], and smart cities, offices, and homes (SCOH) [9].
The majority of new generation smart devices have built-in Complementary Metal-Oxide-Semiconductor (CMOS) image sensors, providing the ability to capture photos and videos [10,11].The strategy behind using a CMOS camera for OCC is that the image sensor performs an acquisitionmechanism known as Rolling Shutter (RS), in which it sequentially integrates light on rows of pixels [12]
Sensors 2020, 20, 757; doi:10.3390/s20030757 www.mdpi.com/journal/sensors

Sensors 2020, 20, 757 2 of 15
starting the scanning of each line with a delay with respect to the previous one. In other words, thetimings of the line-wise scanning make the imaging sensor to capture different windows of time of theoptical signal coming from a Light Emitting Diode (LED) transmitter (Tx). Then, each line of the imagecan hold a distinct portion of information.
The use of LEDs available in SCOH’s lighting infrastructures, along with optical receivers, formaking VLC systems is particularly challenging in outdoor environments. The potential applications ofOCC in these scenarios are related to the creation and improvement of communication networks for thevehicular and pedestrian infrastructures [13], where a large number of LED lights and CMOS camerascan be found. The desirable distance coverage of the different services that can take advantage of OCCranges from a few meters for hand-held receiver devices based on smartphones, and tens of meters forvehicular networks that support Intelligent Transportation Systems (ITS). The achievable link distancein OCC depends partly on the signal-to-noise ratio (SNR) at the receiver, which in turn depends on thetransmitted power, the attenuation caused by the channel, the optical lens array of the camera andvarious sources of noise and interference. In the case of RS-based systems, the maximum link distanceis also restricted by the number of lines of pixels covered by the transmitter. For this, the geometry ofthe transmitting surface, as well as the image forming lens array configuration, determine the imagearea in pixels [14]. The modulation and packet scheme may have an impact on the maximum linkdistance if the image frames must contain a number of visible symbols for demodulation. Dependingon the case of application, the LED and camera-based transceivers can either have static or mobilepositions and orientations, making mobility support essential, which relies on the effective detectionof the pixels that have an SNR level suitable for demodulation.
The vehicular VLC (VVLC) are a significant application case with challenging conditions ofrelative position and motion between nodes. An analysis based on a comparison of VVLC with radiofrequency (RF) vehicle-to-vehicle (V2V) links in terms of channel time variation was proposed in [15].It was shown that the VVLC links have much slower channel time variation as compared to RF V2Vlinks. On the other hand, the VVLC investigation in [16] obtained link duration for VVLC betweenneighboring vehicles are more than 5 s while in certain other cases the average link duration can beup to 15 s. The safety regulations in [17,18] provide the speed limits and inter-vehicle distance indifferent weather conditions for the estimation of the desired distance of coverage. Table 1 shows thespeed limit based on the European Commission regarding mobility and transport standards, whichmay vary slightly from one European country to the other. The inter-vehicle distances outlined havebeen calculated based on the 2 s driving rule for good to bad weather conditions, according to theGovernment of Ireland, which recommends that a driver maintains a minimum of two seconds apartform the leading vehicle for good weather conditions, which is doubled to four seconds in bad weather.
Table 1. Inter-vehicle distances based on the weather condition based on regulations in [17,18].
Speed Limits [km/h] Inter-Vehicle Distance [m]Weather condition Motor ways Rural roads Motor ways Rural roadsGood weather 120–130 80–90 67–72 44-50Bad weather (VM = 50 m) 50 50 56 56
The performance of intensity-modulation and direct-detection method employed byLED-to-Photodiode (PD) VLC [9,19], is highly restricted by external light sources such as sunlight,public lighting, and signaling. Moreover, weather conditions, such as the presence of fog, or hightemperatures, cause substantial optical distortions [20]. Addressing these challenges, authors in [21]derived a path-loss model for PD-to-LED VLC using Mie’s theory and simulating rain and fogconditions in a vehicular VLC setting. They determined the maximum achievable distances as afunction of the desired bit-error-ratio (BER) using pulse amplitude modulation (PAM). They foundthat, for a 32-PAM system, the maximum distance achievable for the desired BER of 10−6 is reducedfrom 72.21 m in clear weather, to 69.13 m in rainy conditions, and 52.85 m and 25.93 m in foggyconditions of different densities. The same Mie’s theory is also used in [22] to evaluate a PD-based

Sensors 2020, 20, 757 3 of 15
VLC link under maritime fog conditions. Scattering and phase functions are derived, as well as thespectrum of the attenuation of optical signals for different distances. In [23], the authors experimentedwith a LED-to-PD VLC link of 1 m distance based on a single 1 W red LED and multiple PDs attachedto a Fresnel lens under dense fog conditions in a laboratory chamber. The lens allows them to maintaina 25 dB signal-to-noise ratio (SNR) varying the optical gain it provides to compensate the attenuationdue to the fog presence.
Atmospheric turbulence, and oceanic turbulence in the case of Underwater Wireless OpticalCommunication (UWOC), has been extensively studied. Guo et al. introduced the traditionallognormal model into a simulated VLC link for ITS [24]. The authors proved that VLC wavelengthsin ITS performed worse than longer ones (e.g., 1550 nm), which is straightforward, taking intoaccount that the turbulence measured by Rytov’s variance has a dependence on the wavelength. Inthe case of UWOC, in which the use of visible-range wavelengths is mandatory due to the waterabsorption spectrum, Kolmogorov’s turbulence spectrum is substituted by Nikishov’s [25]. Thisturbulence spectrum fits better with the experimental measurements since it takes into account notonly temperature but salinity variations.
Although the impact of turbulence has been characterized for classical optical detectors, its effecton OCC systems has not been adequately addressed yet. Works addressing channel characterizationin outdoor OCC links [20] are still scarce compared to the amount of research on PD-based VLC. Inthe previous work [26], we evaluated the feasibility of a global shutter-based OCC link under fogconditions by the success rate of bits of vehicular link experimentally tested with a red brake light anda digital reflex camera. For a modulation index of 75%, the system showed high reliability under densefog conditions up to a meteorological visibility of 20 m.
The contribution of this paper is to experimentally derive the feasibility of OCC in emulatedoutdoor conditions of fog and heat-induced turbulence using commercially available LEDs andcameras. This work is the first to report an experimental investigation on the effects of such conditionson an RS-based system. The experiments carried out for this work were done using a laboratorychamber, and the conditions emulated were of heat-induced turbulence and the presence of fog in theair. The refractive index structure parameter (C2
n) [27] is used to estimate the level of turbulence andthe meteorological visibility (VM) as a measure of the level of fog. The fog experiments are especiallyrelevant because we utilize the camera’s built-in amplifier to overcome the fog attenuation and mitigatethe relative contribution of the quantization noise induced by the analog-to-digital conversion stage,ensuring an improvement of the signal quality without increasing the exposure time, and, thus,keeping a high bandwidth.
This paper is structured as follows. Section 2 describes the used methodology, includingthe channel modeling, the model for the meteorological phenomena studied, and it presents theexperimental design. Section 3 presents the experimental setup, describing the laboratory chamberand the OCC system employed. Section 4 shows the obtained results for heat-induced turbulence andfog experiments and performs an in-depth discussion. Finally, conclusions are drawn in Section 5.
2. Methodology
In this section, we describe the relevant processes involved in the CMOS camera mechanism ofacquisition in RS-based OCC employed by our system and derive the analytical tools used for theevaluation of its performance in the experimental setting.
2.1. Channel Modelling
In CMOS image sensors, the red-green-blue (RGB) light from a Bayer filter impinges the subpixels.These entities are integrated by PDs and their driving circuit and are grouped by rows connectedin parallel to amplifiers and analog/digital converter (ADC) units that are shared by columns. Theoutput of these hardware blocks are image matrices that are sent to the camera digital signal processor(DSP), where data is compressed and delivered to the user as a media file. The sensor performs

Sensors 2020, 20, 757 4 of 15
RS acquisition, in which the start and end of the exposure of each row of pixels are determined bythe circuit’s fixed row-shift time (trs) and the software-defined exposure time (texp) [28]. The timeparameters and circuitry mentioned are shown in Figure 1. Since trs is fixed, in order to increase thedata rate, texp must be set as low as possible to make the sensor capture the highest diversity of states ofthe transmitter within each frame. The received power PRx(t) at a camera coming from a Lambertianlight source of order m and transmitted power PTx(t) can be expressed as
PRx(t) = PTx(t) ·m + 1
2π· cosm θ
Alens cos Ψd2 , (1)
where θ and Ψ are the emission and incident angles, respectively, Alens is the area of the camera’sexternal lens, and d is the link span. From the RS mechanism shown in Figure 1, we can express theenergy Ei captured by the ith row as
Ei =∫ i·trs+texp
i·trs
PRx(t)
∑vj ∑h
k Mj,kdt, (2)
where h (columns), v (rows) are the dimensions of the image sensor, and M[v×h] is the mask of pixelswhere the source shape is projected. From the integral limits, it can be derived that the bandwidth ofthe Rx system decreases with the augment of the exposure time. In other words, the longer is texp, themore lines are simultaneously exposed, and the received signal is integrated in longer and less diversetime windows. For this reason, frames in OCC have to be acquired within short periods.
Figure 1. Typical configuration of Complementary Metal-Oxide-Semiconductor (CMOS) camera sub-pixels.
Note that low values of texp, along with the attenuation factor in outdoor channels caused by thepresence of particles such as fog or by the light refraction by turbulence can result in Ei lower than thesensor’s lowest threshold of detection. For overcoming this, we can take advantage of the amplifyingstage in the subpixel circuitry shown in Figure 1. The voltage-ratio gain GV of the column amplifierblock behaves as
GV(dB) = 20 log10(V2/V1), (3)
where V1 is the voltage obtained from the pixel integration of light during exposure, and V2 is thevoltage value that is sampled by the ADC. In the case of the IMX219 sensor and of other CMOS sensorswith the architecture shown in Figure 1, a software-defined analog gain configuration can set the valueof GV for each capture. The typical values of GV range from 0 dB to 20.6 dB, as shown in [29].
The column gain GV of the CMOS sensor amplifies the received signal PRx and all the noises upto the ADC. This includes the shot noise at the PD, and the thermal noises of the circuits, which can bemodeled as random variables of Normal distributions with variances σ2
sh, and σ2th, as:
σ2sh = 2qe
(ipd(x, y, c) + id + ibg
)B, (4)
σ2th =
4kBTnBGV
, (5)

Sensors 2020, 20, 757 5 of 15
where kB is the Boltzmann’s constant, Tn is noise temperature, B = 1/trs is the bandwidth, qe isthe electron charge, id is the dark current of the camera’s pixels, and ipd(x, y, c) is the PD current atpixel (x, y) in the color band c ∈ {R, G, B}. This current is determined by the emitted spectrum ofthe light source, the corresponding Bayer filter, and the substrate’s responsivity. Finally, ibg modelsthe contribution of the background illumination level to the shot noise. Nonetheless, since reducedexposure times are generally used, the contribution of ibg can be neglected.
The signal is then sampled by the ADC, introducing quantization noise (σ2adc), that is usually
modeled as a zero-mean random normal contribution whose variance depends on the resolution of theconverter. This results in the SNR, which is referred at the DSP’s input as:
SNR ≈GV · i2pd(x, y, c)
GV(σ2
th + σ2sh)+ σ2
adc. (6)
Considering the SNR as a function of GV , it can be observed that it has an increasing behaviourwith an upper asymptote given by i2pd(x, y, c)/(σ2
th + σ2sh). Especially in the cases when the signal
entering the ADC is weak, e.g., as in high attenuation scenarios such as in the presence of dense fog,the relative loss due to quantization noise can be minimized by increasing the column amplification.In other words, the SNR can be optimized by the camera analog gain, unless the ADC is saturated.
Our system employs an On-off keying (OOK) modulation for each of the color bands with afixed data input that is used as a beacon signal. For bit error ratio (BER) derivation, let us assume thesystem now works with a random data input of p0 = p1 = 0.5 as the probabilities of value 0 and 1,respectively. The Maximum Likelihood Estimator (MLE) threshold µmle at the detection stage of theOOK demodulation is given by
µmle = (µ0 + µ1)/2, (7)
where µ0 and µ1 are the expected values of the received signal for the cases of transmitted signal equalto bits 0 and 1, respectively. If the receiver’s DSP applied a digital gain kd, the resulting MLE thresholdwould be µmle = kd(µ0 + µ1)/2. In this case, if µ1 < 2nbit , where nbit is the bit depth, and 2nbit is themaximum digital value of the signal coming from the ADC, the BER would tend to the worst case of acoin flip (error probability equal to 0.5).
2.2. Meteorological Phenomena
The presence of fog particles and turbulence in the air are known as relevant sources of signaldistortion in outdoor optical systems. These conditions can be emulated in a laboratory chamber, andwell-known parameters can estimate their degree, as explained in the following derivations.
Beer’s law [30] can describe the attenuation of propagating optical signals caused by fog. Generally,in optical systems, visibility VM in km is used to characterize fog attenuation (A f ). Using the Mie’sscattering model [31], A f can be related to VM as:
A f =3.91VM
(λ
550
)−q, (8)
where λ denotes wavelength in nm and parameter q is the distribution size of scattering particles givenby Kim’s model [32], which is in the short range of visibility (<0.5 km) considered equal to zero. Thus,VM is given by:
VM =3.91A f
. (9)
The channel coefficient for fog h f can be determined by applying Beer’s law describing lightscattering and absorption in a medium as:

Sensors 2020, 20, 757 6 of 15
h f = e−A f d. (10)
Consequently, the average received optical power for the LOS link at the Rx under fog isexpressed as:
PRx f (t) = PRx(t)h f + n(t), (11)
where n(t) denotes the addition of noises associated with σ2th and σ2
sh.The coefficient h f depends on the value of the product of fog-attenuation and distance (A f · d),
which is known as the optical density of the link. This variable can have the same value for differentcombinations of fog level and link span, allowing to infer the influence of both variables varying onlyone of them.
The heat-induced turbulence of air results from variations in temperature and pressure of theatmosphere along the path of transmission. Consequently, this leads to variations of the refractiveindex of the air, resulting in amplitude and phase fluctuations of the propagating optical beam [33].For describing the strength of atmospheric turbulence, the parameter most commonly used is therefractive index structure parameter (C2
n) (in units of m−2/3) [34,35], given by:
C2n =
(79 · 10−6 P
T2
)2· C2
T (12)
where T represents temperature in Kelvin, P is pressure in millibar, C2T is the temperature structure
parameter which is related to the universal 2/3 power law of temperature variations [35] given by:
DT = 〈(T1 − T2)2〉 =
{C2
T · L2/3P l0 � LP � L0
C2T · l
−4/30 · L2
P 0� LP � l0, (13)
where |T1 − T2| is the temperature difference between two points separated by distance LP, while theouter and inner scales of the small temperature variations are denoted by L0 and l0, respectively.
2.3. Experimental Design
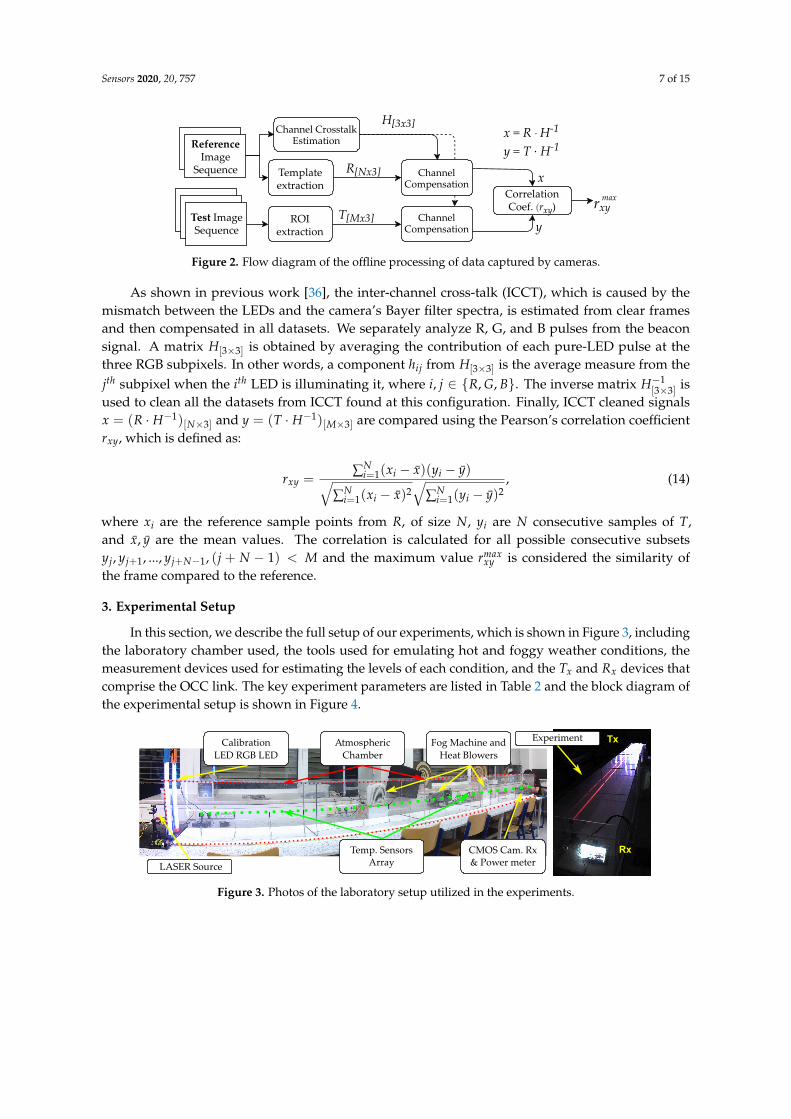
For the OCC system to be tested under emulated meteorological phenomena, the followingconditions were considered. The signal transmitted by the VLC lamp was chosen to be a repetitivebeacon, formed by a sequence of on-off pulses of each of the RGB channels, and followed by a black (offstate) pulse denoted as K, then, the beacon was arbitrarily set to the following: G-R-B-K. The K pulseallows measuring the dark intensity in the pixels that cover the lamp image, while the pure color pulsesallow to estimate the inter-channel cross-talk between the LED RGB colors and the RGB subpixelsof the camera, as explained in our previous work [36]. The Rx camera equipment was configuredto take captures with fixed texp and different GV sequentially. After taking reference measurements,the atmospheric conditions were emulated while the beacon transmission and capture processeswere sustained. The reference and test image sequences are processed through the stages shown inFigure 2, including the extraction of relevant pixels area in the picture, the estimation and enhancingof inter-channel cross-talk, and finally, the computation correlation between the signals obtained inclear conditions and under emulated weather conditions.
The extraction of the relevant group of pixels in OCC image frames, known as Region of Interest(ROI) detection, consists of locating the projection of the source in the image. In this case, we firstmanually locate and extract the ROI from the reference sequence. Then, since the test group is takenwith the same alignment, the ROI stays fixed. Thus, the same coordinates of it are re-utilized. Thepixels containing data are then averaged by row, giving the three-channel (RGB) signal T[M×3], whereN is the number of rows of the ROI. From the reference ROI, a template of one G-R-B-K beacon signalis saved as R[N×3], where M is the number of rows used by one beacon in the RS acquisition.
Sensors 2020, 20, 757 7 of 15
Figure 2. Flow diagram of the offline processing of data captured by cameras.
As shown in previous work [36], the inter-channel cross-talk (ICCT), which is caused by themismatch between the LEDs and the camera’s Bayer filter spectra, is estimated from clear framesand then compensated in all datasets. We separately analyze R, G, and B pulses from the beaconsignal. A matrix H[3×3] is obtained by averaging the contribution of each pure-LED pulse at thethree RGB subpixels. In other words, a component hij from H[3×3] is the average measure from thejth subpixel when the ith LED is illuminating it, where i, j ∈ {R, G, B}. The inverse matrix H−1
[3×3] isused to clean all the datasets from ICCT found at this configuration. Finally, ICCT cleaned signalsx = (R · H−1)[N×3] and y = (T · H−1)[M×3] are compared using the Pearson’s correlation coefficientrxy, which is defined as:
rxy =∑N
i=1(xi − x)(yi − y)√∑N
i=1(xi − x)2√
∑Ni=1(yi − y)2
, (14)
where xi are the reference sample points from R, of size N, yi are N consecutive samples of T,and x, y are the mean values. The correlation is calculated for all possible consecutive subsetsyj, yj+1, ..., yj+N−1, (j + N − 1) < M and the maximum value rmax
xy is considered the similarity ofthe frame compared to the reference.
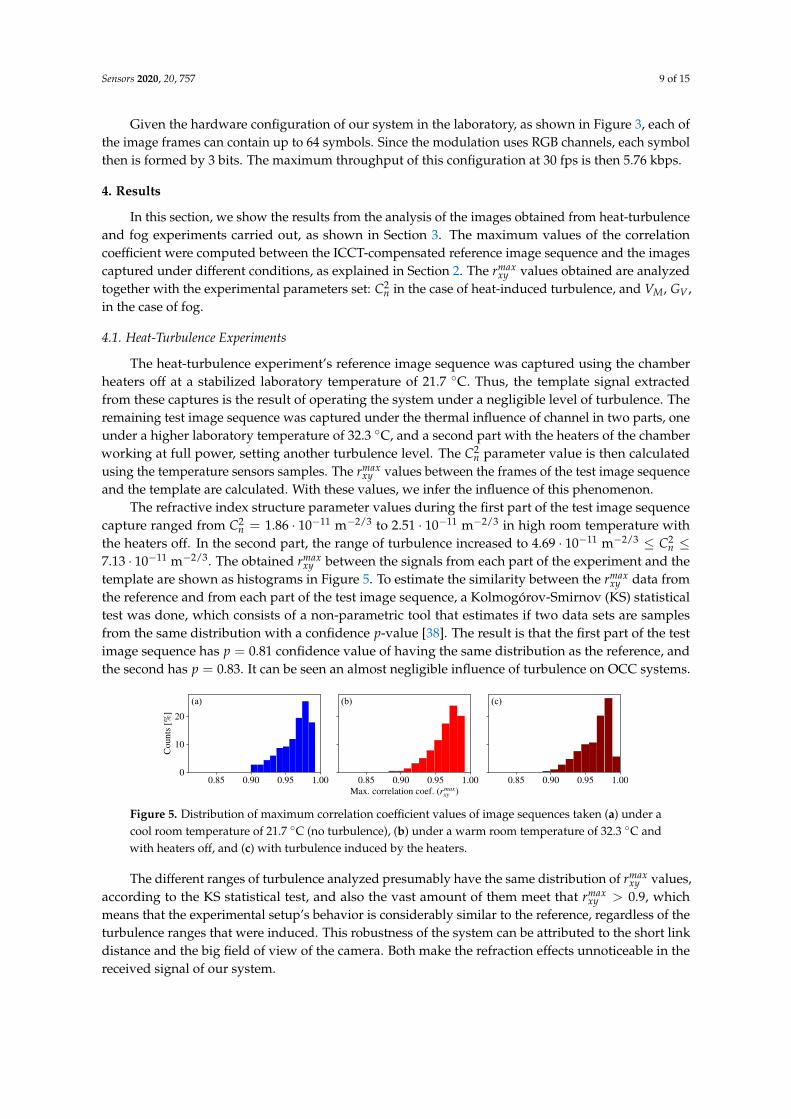
3. Experimental Setup
In this section, we describe the full setup of our experiments, which is shown in Figure 3, includingthe laboratory chamber used, the tools used for emulating hot and foggy weather conditions, themeasurement devices used for estimating the levels of each condition, and the Tx and Rx devices thatcomprise the OCC link. The key experiment parameters are listed in Table 2 and the block diagram ofthe experimental setup is shown in Figure 4.
Figure 3. Photos of the laboratory setup utilized in the experiments.

Sensors 2020, 20, 757 8 of 15
Figure 4. Block diagram of the experimental setup.
Table 2. Experiment key parameters.
Parameter ValueTransmitter
Device 12 V DC RGB LED strips (108 × 5050 SMD chips)Front-end device Microcontroller Atmel ATMega328p [37]Idle power [W] 4.76Dominant wavelengths [nm] 630 (Red), 530 (Green), 475 (Blue)Tchip [s] 1/8400
ReceiverCamera Picamera V2 module (Sony IMX219)Resolution 3280× 2464 pxtexp [µs] 60Gain (GV) [dB] 0, 1, . . . , 16Frame rate [fps] 30
Laboratory chamberDimensions [m] 4.910× 0.378× 0.368Temperature sensors 20 × Papouch Corp. TQS3-E (range: −55 to +125◦C× 0.1◦C)LASER source Thorlabs HLS635 (635 nm) F810APCOptical power meter Thorlabs PM100D S120CHeat blowers 2 × Sencor SFH7010, 2000 WFog machine Antari F-80Z, 700 W
3.1. Laboratory Chamber
The atmospheric chamber set up for measurements in the facilities of the Czech TechnicalUniversity in Prague [27] features two heater fans, and one Glycerine machine, that can blow hot airand fog into the chamber, respectively. For the characterization of turbulence and light scintillation inthe chamber, an array of 20 temperature sensors were set up equidistantly. A laser source of 625 nmand 2 mW, and an optical power meter placed on each end of the chamber are used to measure thefog attenuation.
3.2. OCC System
The transmitter unit was built using strips of RGB LEDs connected to a microcontroller (modelATmega328p [37]) through a switching circuit based on transistors. The LED arrays were installedon aluminum rails with a white meth-acrylate diffuser. The circuitry makes the RGB channels toemit the beacon signal (idle state) repeatedly, or to send arbitrary data coming from a serial port (thisfeature was not used in this experiment). The chip time tchip or the pulse width is set by software inthe microcontroller. In the case of the experiments, this parameter was set to 1/8400 s.
The receiver was made using an Element14 Raspberry Pi board with its official camera devicePiCamera V2. The firmware allows to set GV from 1 to 16 dB and exposure time from 20 ns up to thetime elapsed between frame captures, which in case of 30 fps video is approximately 33.3 ms. Thefixed internal structure of the CMOS sensor (Sony IMX219) featured by the PiCamera is set to have arow-shift time trs = 18.904 µs [29]. The exposure time was set to texp = 60 µs.
Sensors 2020, 20, 757 9 of 15
Given the hardware configuration of our system in the laboratory, as shown in Figure 3, each ofthe image frames can contain up to 64 symbols. Since the modulation uses RGB channels, each symbolthen is formed by 3 bits. The maximum throughput of this configuration at 30 fps is then 5.76 kbps.
4. Results
In this section, we show the results from the analysis of the images obtained from heat-turbulenceand fog experiments carried out, as shown in Section 3. The maximum values of the correlationcoefficient were computed between the ICCT-compensated reference image sequence and the imagescaptured under different conditions, as explained in Section 2. The rmax
xy values obtained are analyzedtogether with the experimental parameters set: C2
n in the case of heat-induced turbulence, and VM, GV ,in the case of fog.
4.1. Heat-Turbulence Experiments
The heat-turbulence experiment’s reference image sequence was captured using the chamberheaters off at a stabilized laboratory temperature of 21.7 ◦C. Thus, the template signal extractedfrom these captures is the result of operating the system under a negligible level of turbulence. Theremaining test image sequence was captured under the thermal influence of channel in two parts, oneunder a higher laboratory temperature of 32.3 ◦C, and a second part with the heaters of the chamberworking at full power, setting another turbulence level. The C2
n parameter value is then calculatedusing the temperature sensors samples. The rmax
xy values between the frames of the test image sequenceand the template are calculated. With these values, we infer the influence of this phenomenon.
The refractive index structure parameter values during the first part of the test image sequencecapture ranged from C2
n = 1.86 · 10−11 m−2/3 to 2.51 · 10−11 m−2/3 in high room temperature withthe heaters off. In the second part, the range of turbulence increased to 4.69 · 10−11 m−2/3 ≤ C2
n ≤7.13 · 10−11 m−2/3. The obtained rmax
xy between the signals from each part of the experiment and thetemplate are shown as histograms in Figure 5. To estimate the similarity between the rmax
xy data fromthe reference and from each part of the test image sequence, a Kolmogórov-Smirnov (KS) statisticaltest was done, which consists of a non-parametric tool that estimates if two data sets are samplesfrom the same distribution with a confidence p-value [38]. The result is that the first part of the testimage sequence has p = 0.81 confidence value of having the same distribution as the reference, andthe second has p = 0.83. It can be seen an almost negligible influence of turbulence on OCC systems.
Figure 5. Distribution of maximum correlation coefficient values of image sequences taken (a) under acool room temperature of 21.7 ◦C (no turbulence), (b) under a warm room temperature of 32.3 ◦C andwith heaters off, and (c) with turbulence induced by the heaters.
The different ranges of turbulence analyzed presumably have the same distribution of rmaxxy values,
according to the KS statistical test, and also the vast amount of them meet that rmaxxy > 0.9, which
means that the experimental setup’s behavior is considerably similar to the reference, regardless of theturbulence ranges that were induced. This robustness of the system can be attributed to the short linkdistance and the big field of view of the camera. Both make the refraction effects unnoticeable in thereceived signal of our system.

Sensors 2020, 20, 757 10 of 15
4.2. Fog Experiments
For the fog emulation experiment, the reference image sequence was taken under clear air inthe laboratory chamber while the optical power meter measured the power of the laser without fogattenuation. The test image sequence was taken while the chamber was arbitrarily supplied with fogfrom the Antari F-80Z, while the laser power was measured in synchronicity in order to label eachimage with the current VM. The value of GV of the images was sequentially modified from 0 to 16 dBby steps of 1 dB during the test image sequence, while for the reference, it was set to zero as default.
The rmaxxy values obtained for the test images sequence varying GV and VM are shown as a contour
plot in Figure 6. The high correlation area (rmaxxy > 0.9) determines three important regions (highlighted
in Figure 6 by dashed circles). For the high values of visibility, the signal coming from the transmitteris not affected by the fog attenuation and is received with the highest power. Then, the increase ofgain causes saturation of the ADC, affecting the correlation. In the low visibility region, the presenceof dense fog attenuates the received signal and lowers the correlation. It can be seen that, in thislow-visibility region, the increase of gain gives a high correlation, meaning that the camera amplifiercompensates the attenuation from fog. The region in between, around 50 m visibility, shows highvalues of correlation regardless of the variations of gain. The three regions described are shownin Figure 7, and a non-parametric locally estimated scatterplot smoothing (LOESS) regression [39]is performed with parameter span s = 0.5 to show the trend of the data points. Examples of theROI extraction from test images sequence are included to depict the effect of visibility and gain overthe frames.
Figure 6. Maximum correlation between test and reference signals varying camera gain under emulatedfog conditions of different values of meteorological visibility.
Figure 7. Maximum correlation data (gray dots) from fog-emulation experiments, separated by levels of(a) low, (b) medium, and (c) high visibility and their respective locally estimated scatterplot smoothing(LOESS) regression for s = 0.5 (black curves). The area encircled in (a) is the region of image framesaffected by the fog attenuation and in (b) by gain saturation. Insets are Region of Interest (ROI)extraction examples: (1) for low visibility and low gain, (2) low visibility and high gain, (3) mediumvisibility and low gain, (4) medium visibility and high gain, (5) high visibility and low gain, and (6)high visibility and high gain.

Sensors 2020, 20, 757 11 of 15
From the minimum gain values in the area of rmaxxy > 0.9, an optimum gain curve Gopt
V is derivedproviding that there is an inverse proportionality relationship between meteorological visibility andcamera gain as follows:
GoptV (VM) =
kv
VM, (15)
where kv is an empirical parameter. Using curve fitting, the value kv = 0.0497 dB·km was derived forour experimental setup.
In order to calculate the SNR from the empirical data obtained, we have considered that OOKmodulation is used. The following approximation of the SNR has been derived (note the 1/2 factordue to OOK):
SNR =12
E2 [XROI ]
V [XROI ], (16)
where XROI comprises the samples of pixels that fall within the ROI mask M[v×h] as describedin Equation (2), which was determined from reference images and since the Tx and Rx are staticit is the same for the whole experiment. E[·], and V[·] denote the statistical expected value andvariance, respectively.
The empirical SNR definition was calculated for all the image sequences of the fog experiments.The results for the frames taken with GV = 11 dB are shown in Figure 8 for the three RGB channels.This value of gain was chosen because, as shown in Figure 6, the level GV = 11 dB is affected by thedense fog and also by the saturation. The SNR values in Figure 8 are plotted against optical densityin logaritmic scale. They show that higher attenuation A f values, or alternatively, longer link spans,cause a decay of the SNR. Therefore, a curve fitting was carried out assuming that the SNR decays at arate of α dB per decade of optical density, as follows:
SNR(A f d) = SNR(1) + α · log(A f d), (17)
where SNR(1) is the estimated signal-to-noise ratio at unitary optical density.
Figure 8. Empirical signal-to-noise ratio (SNR) values obtained from captures at GV = 11 dB plottedagainst optical density values at fixed link range d and with A f values emulated by the presence of fog.The plot in (a) corresponds to R channel, (b) to G channel, and (c) to B channel, and their respectivefitted curves.
The SNR values obtained from the image sequences were also evaluated on their influence overrmax
xy , as shown in Figure 9. A LOESS regression also shows the trend of the scatterplots in the figure,and it can be seen that rmax
xy increases with the SNR, except for the highest SNR values in the bluechannel, which are affected by saturation of the ADC. It can also be seen that SNR values higher than5 dB make rmax
xy > 0.9 for most of the samples. From this, it can be concluded that rmaxxy is a valid metric
for the quality of the signal in OCC, although SNR is more robust.

Sensors 2020, 20, 757 12 of 15
Figure 9. Values of rmaxxy from test image sequence of the fog-emulation experiment plotted against
empirical SNR. The values are for frames taken with GV = 11 dB. The scatter plot in (a) correspondsto R channel, (b) to G channel, and (c) to B channel, and the curves in black are their correspondingLOESS regression for span value s = 0.7.
The results obtained in this experiment show that the fog attenuation can make the power ofthe optical signal weaken down to the point that the noise induced by the ADC considerably affectsthe SNR. In other words, the conversion to digital corrupts the weak optical signal from dense fogconditions or long link spans. In these cases, the column amplifier of the camera is crucial to keep ahigh amplitude input at the ADC and reduce the effect of quantization.
5. Conclusions
In this paper, we presented an experimental study of the influence of two kinds of atmosphericconditions over an RS-based OCC link: the heat-induced turbulence due to random fluctuations of therefractive index of the air along the path, and the attenuation caused by the presence of fog particles inthe air. The image sequences captured under the two different conditions were compared to a referencesequence of images taken under clear conditions. For this, we used the maximum value of Pearson’scorrelation coefficient rmax
xy to determine their similarity. We have also evaluated the signal qualityby the empirical SNR obtained from the image frames and showed its relationship with rmax
xy and itsdependence on the product between fog attenuation and link span, known as the optical density. Themost important findings in this work are, first, that the turbulence levels emulated do not affect thesignal quality considerably. For the fog experiments, we have derived an expression for the theoreticalSNR as a function of the analog camera gain, showing that a CMOS camera-based OCC system canimprove the SNR by using the column amplifier. In the fog experiments, the correlation rmax
xy wasimpaired in two different cases: for high values of VM, when the gain is increased, the correlation dropsbecause of the saturation of the signal, and, for low visibility, the attenuation caused by the fog impairsthe similarity to the reference when the gain is low, because of the loss due to quantization noise atthe ADC. It was found for the latter case that by increasing the gain of the camera, the attenuationcan be compensated, allowing the OCC link to receive signal with a rmax
xy > 0.9 for VM values down to10 m. Our findings show that there is an inverse proportionality relationship between the optimumcamera gain and the visibility, and that the empirical SNR decays at a rate α with the optical density.This utilization of the CMOS camera’s built-in amplifier opens a new possibility for OCC systems,extending the control strategy, and allowing to keep low exposure times and, thus, a high bandwidth,even in dense fog scenarios.
Author Contributions: The contributions of the authors in this paper are the following: conceptualization, V.M.,S.R.T., E.E.; investigation, V.M., S.R.T.; methodology, V.M., E.E.; project administration, S.Z., R.P.-J.; software V.M.;and validation, S.Z., R.P.-J. All authors have read and agreed to the published version of the manuscript.
Funding: This project has received funding from the European Union’s Horizon 2020 research and innovationprogram under the Marie Skłodowska-Curie grant agreement No 764461, and from the Spanish ResearchAdministration (MINECO project: OSCAR, ref.: TEC 2017-84065-C3-1-R)
Acknowledgments: V. M. thanks the technical support given by Jan Bohata, Petr Chvojka, and Dmytro Suslov atthe Czech Technical University in Prague, and by Victor Guerra, and Cristo Jurado-Verdu at IDeTIC - Universidadde Las Palmas de Gran Canaria.

Sensors 2020, 20, 757 13 of 15
Conflicts of Interest: The authors declare no conflict of interest. The funders had no role in the design of thestudy; in the collection, analyses, or interpretation of data; in the writing of the manuscript, or in the decision topublish the results.
References
1. Cahyadi, W.A.; Kim, Y.H.; Chung, Y.H.; Ahn, C.J. Mobile phone camera-based indoor visible lightcommunications with rotation compensation. IEEE Photonics J. 2016, 8, 1–8. [CrossRef]
2. Teli, S.R.; Zvanovec, S.; Ghassemlooy, Z. Performance evaluation of neural network assisted motiondetection schemes implemented within indoor optical camera based communications. Opt. Express 2019,27, 24082–24092. [CrossRef] [PubMed]
3. Chavez-Burbano, P.; Vitek, S.; Teli, S.; Guerra, V.; Rabadan, J.; Perez-Jimenez, R.; Zvanovec, S. Optical cameracommunication system for Internet of Things based on organic light emitting diodes. Electron. Lett. 2019,55, 334–336. [CrossRef]
4. Tiwari, S.V.; Sewaiwar, A.; Chung, Y.H. Optical bidirectional beacon based visible light communications.Opt. Express 2015, 23, 26551–26564. [CrossRef] [PubMed]
5. Pergoloni, S.; Biagi, M.; Colonnese, S.; Cusani, R.; Scarano, G. Coverage optimization of 5G atto-cellsfor visible light communications access. In Proceedings of the 2015 IEEE International Workshop onMeasurements & Networking (M&N), Coimbra, Portugal, 12–13 October 2015; pp. 1–5.
6. Boban, M.; Kousaridas, A.; Manolakis, K.; Eichinger, J.; Xu, W. Connected roads of the future: Use cases,requirements, and design considerations for vehicle-to-everything communications. IEEE Veh. Technol. Mag.2018, 13, 110–123. [CrossRef]
7. Yamazato, T.; Takai, I.; Okada, H.; Fujii, T.; Yendo, T.; Arai, S.; Andoh, M.; Harada, T.; Yasutomi, K.;Kagawa, K.; et al. Image-sensor-based visible light communication for automotive applications.IEEE Commun. Mag. 2014, 52, 88–97. [CrossRef]
8. Takai, I.; Ito, S.; Yasutomi, K.; Kagawa, K.; Andoh, M.; Kawahito, S. LED and CMOS image sensor basedoptical wireless communication system for automotive applications. IEEE Photonics J. 2013, 5, 6801418.[CrossRef]
9. Ghassemlooy, Z.; Alves, L.N.; Zvanovec, S.; Khalighi, M.A. Visible Light Communications: Theory andApplications; CRC Press: Borarton, FL, USA, 2017.
10. Boubezari, R.; Le Minh, H.; Ghassemlooy, Z.; Bouridane, A. Smartphone camera based visible lightcommunication. J. Lightwave Technol. 2016, 34, 4121–4127. [CrossRef]
11. Nguyen, T.; Islam, A.; Hossan, T.; Jang, Y.M. Current status and performance analysis of optical cameracommunication technologies for 5G networks. IEEE Access 2017, 5, 4574–4594. [CrossRef]
12. Nguyen, T.; Hong, C.H.; Le, N.T.; Jang, Y.M. High-speed asynchronous Optical Camera Communicationusing LED and rolling shutter camera. In Proceedings of the 2015 Seventh International Conference onUbiquitous and Future Networks, Sapporo, Japan, 7–10 July 2015; pp. 214–219.
13. Chavez-Burbano, P.; Guerra, V.; Rabadan, J.; Perez-Jimenez, R. Optical camera communication for smartcities. In Proceedings of the 2017 IEEE/CIC International Conference on Communications in China (ICCCWorkshops), Qingdao, China, 22–24 October 2017; pp. 1–4. [CrossRef]
14. Chavez-Burbano, P.; Guerra, V.; Rabadan, J.; Rodriguez-Esparragon, D.; Perez-Jimenez, R. Experimentalcharacterization of close-emitter interference in an optical camera communication system. Sensors 2017, 17, 1561.[CrossRef] [PubMed]
15. Cui, Z.; Wang, C.; Tsai, H.M. Characterizing channel fading in vehicular visible light communications withvideo data. In Proceedings of the 2014 IEEE Vehicular Networking Conference (VNC), Paderborn, Germany,3–5 December 2014; pp. 226–229.
16. Wu, L.C.; Tsai, H.M. Modeling vehicle-to-vehicle visible light communication link duration with empiricaldata. In Proceedings of the 2013 IEEE Globecom Workshops (GC Wkshps), Atlanta, GA, USA, 9–13 December2013; pp. 1103–1109.

Sensors 2020, 20, 757 14 of 15
17. Mobility and Transport (European Comission). Current Speed Limit Policies. Availableonline: https://ec.europa.eu/transport/road_safety/specialist/knowledge/speed/speed_limits/current_speed_limit_policies_en (accessed on 28 January 2020).
18. Road Safety Authority (Government of Ireland). The Two-Second Rule. Available online: http://www.rotr.ie/rules-for-driving/speed-limits/speed-limits_2-second-rule.html (accessed on 28 January 2020).
19. Kim, Y.h.; Chung, Y.h. Experimental outdoor visible light data communication system using differentialdecision threshold with optical and color filters. Opt. Eng. 2015, 54, 040501. [CrossRef]
20. Islam, A.; Hossan, M.T.; Jang, Y.M. Convolutional neural networkscheme–based optical cameracommunication system for intelligent Internet of vehicles. Int. J. Distrib. Sens. Netw. 2018,14, 1550147718770153. [CrossRef]
21. Elamassie, M.; Karbalayghareh, M.; Miramirkhani, F.; Kizilirmak, R.C.; Uysal, M. Effect of fog and rain onthe performance of vehicular visible light communications. In Proceedings of the 2018 IEEE 87th VehicularTechnology Conference (VTC Spring), Porto, Portugal, 3–6 June 2018; pp. 1–6.
22. Tian, X.; Miao, Z.; Han, X.; Lu, F. Sea Fog Attenuation Analysis of White-LED Light Sources for MaritimeVLC. In Proceedings of the 2019 IEEE International Conference on Computational Electromagnetics (ICCEM),Shanghai, China, 20–22 March 2019; pp. 1–3. [CrossRef]
23. Kim, Y.H.; Cahyadi, W.A.; Chung, Y.H. Experimental demonstration of VLC-based vehicle-to-vehiclecommunications under fog conditions. IEEE Photonics J. 2015, 7, 1–9. [CrossRef]
24. Guo, L.-d.; Cheng, M.-j.; Guo, L.-x. Visible light propagation characteristics under turbulent atmosphere andits impact on communication performance of traffic system. In Proceedings of the 14th National Conferenceon Laser Technology and Optoelectronics (LTO 2019), Shanghai, China, 17 May 2019; p. 1117047. [CrossRef]
25. Nikishov, V.V.; Nikishov, V.I. Spectrum of Turbulent Fluctuations of the Sea-Water Refraction Index. Int. J.Fluid Mech. Res. 2000, 27, 82–98. [CrossRef]
26. Eso, E.; Burton, A.; Hassan, N.B.; Abadi, M.M.; Ghassemlooy, Z.; Zvanovec, S. Experimental Investigation ofthe Effects of Fog on Optical Camera-based VLC for a Vehicular Environment. In Proceedings of the 201915th International Conference on Telecommunications (ConTEL), Graz, Austria, 3–5 July 2019; pp. 1–5.
27. Bohata, J.; Zvanovec, S.; Korinek, T.; Abadi, M.M.; Ghassemlooy, Z. Characterization of dual-polarizationLTE radio over a free-space optical turbulence channel. Appl. Opt. 2015, 54, 7082–7087. [CrossRef] [PubMed]
28. Kuroda, T. Essential Principles of Image Sensors; CRC Press: Borarton, FL, USA, 2017.29. IMX219PQH5-C Datasheet. Available online: https://datasheetspdf.com/pdf/1404029/Sony/
IMX219PQH5-C/1 (accessed on 28 January 2020)30. Weichel, H. Laser Beam Propagation in the Atmosphere; SPIE Press: Bellingham, WA, USA, 1990; Volume 3.31. Henniger, H.; Wilfert, O. An Introduction to Free-space Optical Communications. Radioengineering 2010, 19,
203–212.32. Kim, I.I.; McArthur, B.; Korevaar, E.J. Comparison of laser beam propagation at 785 nm and 1550 nm in fog
and haze for optical wireless communications. In Proceedings of the Optical Wireless Communications III.International Society for Optics and Photonics, Boston, MA, USA, 6 February 2001; pp. 26–37.
33. Ghassemlooy, Z.; Popoola, W.; Rajbhandari, S. Optical Wireless Communications: System and Channel Modellingwith Matlab; CRC Press: Borarton, FL, USA, 2019.
34. Nor, N.A.M.; Fabiyi, E.; Abadi, M.M.; Tang, X.; Ghassemlooy, Z.; Burton, A. Investigation ofmoderate-to-strong turbulence effects on free space optics—A laboratory demonstration. In Proceedings ofthe 2015 13th International Conference on Telecommunications (ConTEL), Graz, Austria, 13–15 July 2015;pp. 1–5.
35. Andrews, L.C.; Phillips, R.L. Laser Beam Propagation Through Random Media; SPIE Press: Bellingham, WA,USA, 2005; Volume 152.
36. Jurado-Verdu, C.; Matus, V.; Rabadan, J.; Guerra, V.; Perez-Jimenez, R. Correlation-based receiver for opticalcamera communications. Opt. Express 2019, 27, 19150–19155. [CrossRef] [PubMed]
37. Atmel Corporation. ATmega328p, 8-bit AVR Microcontroller with 32K Bytes In-System Programmable Flash,Datasheet; Atmel Corporation: San Jose, CA, USA, 2015.

Sensors 2020, 20, 757 15 of 15
38. Massey, F.J., Jr. The Kolmogorov-Smirnov Test for Goodness of Fit. J. Am. Stat. Assoc. 1951, 46, 68–78.[CrossRef]
39. Cleveland, W.S.; Devlin, S.J. Locally weighted regression: an approach to regression analysis by local fitting.J. Am. Stat. Assoc. 1988, 83, 596–610. [CrossRef]
c© 2020 by the authors. Licensee MDPI, Basel, Switzerland. This article is an open accessarticle distributed under the terms and conditions of the Creative Commons Attribution(CC BY) license (http://creativecommons.org/licenses/by/4.0/).