Experimental study on the deterioration and natural remediation of the Ariake Sea tidal mud caused...
12
ORIGINAL ARTICLE Experimental study on the deterioration and natural remediation of the Ariake Sea tidal mud caused by the sea laver treatment acid practice and the upward seepage of pore water liquid Yan-Jun Du Song-Yu Liu Shigenori Hayashi Received: 18 July 2007 / Accepted: 11 September 2007 / Published online: 3 October 2007 Ó Springer-Verlag 2007 Abstract This study presents a laboratory study of the following two aspects: (1) the influence of sea laver treatment acid on the geoenvironmental properties of Ari- ake Sea tidal mud, and (2) the natural remediation effect on the sea laver treatment acid contaminated Ariake Sea tidal mud caused by the upward seepage of pore water liquid in the mud. Firstly, the mechanisms of the transport of sea laver treatment acid in the Ariake Sea tidal mud and the generation mechanisms of the upward seepage flow in the Ariake Sea tidal mud are discussed. Secondly, a series of one-dimensional laboratory infiltration tests were carried out to investigate the deterioration of the Ariake Sea tidal mud caused by the sea laver acid treatment practice. Test results reveal that the acid treatment practice caused con- siderable change in the geochemical properties of the mud in terms of increase in sulfide content and decrease in pH value. After the treatment by the sea laver treatment acid, the sulfide content of the mud even exceeded the safe limit value for the benthos, which represents undesirable living condition for benthos. Thirdly, series of laboratory fresh seawater infiltration tests for the deteriorated Iida site mud were conducted to illustrate this natural remediation effi- ciency. It is found that with the infiltration of the fresh seawater, the sulfide content of the Iida site mud was considerably reduced and pH value increased to an acceptable range for benthos living in the tidal flat mud. With the increase in the infiltration time and the hydraulic gradient, the remediation efficiency could be increased. Keywords Ariake Sea Benthos Deterioration Geoenvironment Remediation Sea laver treatment acid Tidal mud Introduction The Ariake Sea, which is located in the Kyushu region of Japan, is one of the well-known semi-closed shallow seas in Japan. The Ariake Sea has vast tidal flat area, which almost covers 40% of the total tidal flat in Japan. The tidal flat area is well known for large amount of production of sea lavers (Porphyra spp.) and benthos such as Agemaki shell (Sinonovacula constricta), Tairagi shell (Atrina pectinata), and Oyster (Crassostreagigas). According to the unpublished data from the Ministry of Agriculture, Forestry and Fisheries of Japan, recently the annual catch of some benthos decreased. For example, the catch of the Agemaki shell which lives in 0–700 mm zone below mud surface dropped from 170 tons in 1976 to practically nil by 1992 (Fig. 1). So far, the possible reasons for this observed decrease are: (1) the man-made changes such as the Isa- haya land reclamation project started from 1988 to 1998 (Unoki 2002; Kotama et al. 2005); (2) the frequently occurrence of red tides in the Ariake Sea after 1998 (Tsuzumi 2003), and (3) the deteriorated environment in the mud of the Ariake Sea. The first reason is mostly due to the change in the tidal height and tidal velocity in the Ariake Sea, and change in the water quality inside the reservoir of the Isahaya reclamation project. The Isahaya land reclamation was initially constructed for the purpose of increasing farmlands and against flood disaster. Unoki Y.-J. Du (&) S.-Y. Liu Institute of Geotechnical Engineering, Southeast University, Si Pai Lou #2, Nanjing 210096, Jiangsu Province, China e-mail: [email protected] S. Hayashi Institute of Lowland Technology, Saga University, Honjo 1, Saga 840-8502, Japan 123 Environ Geol (2008) 55:889–900 DOI 10.1007/s00254-007-1040-z
Transcript of Experimental study on the deterioration and natural remediation of the Ariake Sea tidal mud caused...

ORIGINAL ARTICLE
Experimental study on the deterioration and natural remediationof the Ariake Sea tidal mud caused by the sea laver treatmentacid practice and the upward seepage of pore water liquid
Yan-Jun Du Æ Song-Yu Liu Æ Shigenori Hayashi
Received: 18 July 2007 / Accepted: 11 September 2007 / Published online: 3 October 2007
� Springer-Verlag 2007
Abstract This study presents a laboratory study of the
following two aspects: (1) the influence of sea laver
treatment acid on the geoenvironmental properties of Ari-
ake Sea tidal mud, and (2) the natural remediation effect on
the sea laver treatment acid contaminated Ariake Sea tidal
mud caused by the upward seepage of pore water liquid in
the mud. Firstly, the mechanisms of the transport of sea
laver treatment acid in the Ariake Sea tidal mud and the
generation mechanisms of the upward seepage flow in the
Ariake Sea tidal mud are discussed. Secondly, a series of
one-dimensional laboratory infiltration tests were carried
out to investigate the deterioration of the Ariake Sea tidal
mud caused by the sea laver acid treatment practice. Test
results reveal that the acid treatment practice caused con-
siderable change in the geochemical properties of the mud
in terms of increase in sulfide content and decrease in pH
value. After the treatment by the sea laver treatment acid,
the sulfide content of the mud even exceeded the safe limit
value for the benthos, which represents undesirable living
condition for benthos. Thirdly, series of laboratory fresh
seawater infiltration tests for the deteriorated Iida site mud
were conducted to illustrate this natural remediation effi-
ciency. It is found that with the infiltration of the fresh
seawater, the sulfide content of the Iida site mud was
considerably reduced and pH value increased to an
acceptable range for benthos living in the tidal flat mud.
With the increase in the infiltration time and the hydraulic
gradient, the remediation efficiency could be increased.
Keywords Ariake Sea � Benthos � Deterioration �Geoenvironment � Remediation � Sea laver treatment acid �Tidal mud
Introduction
The Ariake Sea, which is located in the Kyushu region of
Japan, is one of the well-known semi-closed shallow seas
in Japan. The Ariake Sea has vast tidal flat area, which
almost covers 40% of the total tidal flat in Japan. The tidal
flat area is well known for large amount of production of
sea lavers (Porphyra spp.) and benthos such as Agemaki
shell (Sinonovacula constricta), Tairagi shell (Atrina
pectinata), and Oyster (Crassostreagigas). According to
the unpublished data from the Ministry of Agriculture,
Forestry and Fisheries of Japan, recently the annual catch
of some benthos decreased. For example, the catch of the
Agemaki shell which lives in 0–700 mm zone below mud
surface dropped from 170 tons in 1976 to practically nil by
1992 (Fig. 1). So far, the possible reasons for this observed
decrease are: (1) the man-made changes such as the Isa-
haya land reclamation project started from 1988 to 1998
(Unoki 2002; Kotama et al. 2005); (2) the frequently
occurrence of red tides in the Ariake Sea after 1998
(Tsuzumi 2003), and (3) the deteriorated environment in
the mud of the Ariake Sea. The first reason is mostly due to
the change in the tidal height and tidal velocity in the
Ariake Sea, and change in the water quality inside the
reservoir of the Isahaya reclamation project. The Isahaya
land reclamation was initially constructed for the purpose
of increasing farmlands and against flood disaster. Unoki
Y.-J. Du (&) � S.-Y. Liu
Institute of Geotechnical Engineering, Southeast University,
Si Pai Lou #2, Nanjing 210096, Jiangsu Province, China
e-mail: [email protected]
S. Hayashi
Institute of Lowland Technology, Saga University,
Honjo 1, Saga 840-8502, Japan
123
Environ Geol (2008) 55:889–900
DOI 10.1007/s00254-007-1040-z

(2002) reported that due to the construction of the reservoir
of the Isahaya land reclamation project, both the tidal
velocity and tidal height near the reservoir and those away
from the reservoir decreased. Unoki (2002) indicated that
the average decrease in the tidal velocity in the whole
Ariake Sea was theoretically about 2–3% due to the con-
struction of the dike of the Isahaya land reclamation
project. The reduced tidal velocity in the Ariake Sea would
result in the water density stratification and the oxygen-
depleted water in the tidal flat areas of the Ariake Bay head
(Kotama et al. 2005), which causes impact on the living
conditions of benthos inhabiting in the tidal flat muds of the
Ariake Sea. The second reason is mostly attributed to the
fact that occurrence of red tide in the Ariake Sea has been
frequently observed since 1998 as well as its scale. Tsuz-
umi (2003) proposed an index namely Index of Occurrence
Scale of Red Tide to quantify the occurrence frequency of
the red tide in the Ariake Sea. He indicated that this index
gradually increased from 1997 and reached the maximum
in the year of 2000 during the period of year of 1981–2002.
Due to the toxicity, the red tide caused considerable
damage to the benthos that inhabit in the shallow depth of
the tidal mud. Although the aforementioned two reasons
can partly explain the observed phenomenon shown in
Fig. 1, none of them can reasonably explain why the catch
of Oyster shell and Tairagi shell decreased since the
middle of 1970s and the end of 1970s, respectively.
The third reason is from the questionnaires of the
Kyushu local fishermen. Most fishermen thought that the
mud in the tidal flat areas of the Ariake Sea has been
deteriorated in terms of the appearance that unpleasant
odor from the mud was found in the Ariake Sea tidal flats
and the color of the Ariake Sea tidal flats became darker,
recently. These fishermen thought that the observed
unpleasant odor was toxic and harmful to the clamps like
Agemaki shells and Tairagi shells. These fishermen thought
that the considerable unpleasant odor is due to the sea laver
acid treatment practice, which is used by the local sea laver
farmers as the disinfectant acid to treat the sea lavers as
well as an effective way to remove the attachments. The
color of attachments is different from the sea lavers culti-
vated in the Ariake Sea. By doing so, the farmers found
that the sea laver could keep its characteristic color for a
good sale. Sea laver farmers usually dilute the sea laver
treatment acid to 1% (by volume) by the seawater before
treating the sea lavers. In Saga Prefecture, the diluted
concentration of the sea laver treatment agent is usually 1%
(by the volume of seawater). This practice has been widely
undertaken all over Japan from 1978 to present. In 1993,
large scaled acid treatment practice was officially under-
taken in Saga Prefecture although before that acid
treatment practice had been undertaken without any official
record. In the Kyushu region before 2002, the residual sea
laver treatment agents were directly dumped into the Ari-
ake Sea without any pre-treatment. During the period of
1977–2001, annually about 2,800 tons of sea laver treat-
ment acid has been dumped into the Ariake Sea water
within the sea laver farming areas (The Oceanographic
Society of Japan 2005). Since the density of the treatment
1972 1976 1980 1984 1988 1992 1996 20000
200
400
600
800
1000
a)Offically recorded sea
laver treatment practice started in Saga Prefecture
Reduction of Pcontent in sea laver
treatment acidSea laver treatment
practice started
Year
1972 1976 1980 1984 1988 1992 1996 2000
1972 1976 1980 1984 1988 1992 1996 2000
Cat
ch (
ton)
Cat
ch (
ton)
Cat
ch (
ton)
0
5000
10000
15000
20000
b)Reduction of P
content in sea laver treatment acid
Offically recorded sea laver treatment practice
started in Saga Prefecture
Sea laver treatment practice started
Year
0
2000
4000
6000
8000
10000
12000
14000
16000
c) Reduction of P content in sea laver
treatment acid
Offically recorded sea laver treatment practice
started in Saga Prefecture
Sea laver treatment practice started
Year
Isahaya landreclamation
Isahaya landreclamation
Isahaya landreclamation
Fig. 1 Change of annual catch of some clams in the Ariake Sea and
some recorded human activities: a Agemaki shell; b Oyster shell; cTairagi shell
890 Environ Geol (2008) 55:889–900
123

acid (17 kN/m3) is usually higher than that of the sea water
(10 kN/m3), considerable amount of sea laver treatment
acid would settle down to the surface of the tidal mud in
the acid treatment practice. It is thought that during the sea
laver cultivation season, the sea laver treatment acid would
transport into the mud driven by the downward seepage.
Under appropriate condition (i.e., relatively high tempera-
ture such as in spring and summer seasons), phosphorous
(P) contained in the sea laver treatment acid would enhance
the activity of the sulfate-reducing bacteria and thereby
enhance the bio-chemical reactions that generally occur in
the marine sediments. However, so far the mechanisms of
transport of the sea laver treatment acid in the Ariake Sea
tidal mud and detailed studies on how the sea laver treat-
ment practice affects the geoenvironmental properties of
the tidal mud have not received sufficient attention.
On the other hand, the field test on the Iida tidal mud of
the Ariake Sea shows that the deteriorated tidal mud is
becoming ‘‘clean’’ now in terms of decrease in the sulfide
content at a depth of 100 mm, as shown in Fig. 2. One of
the reasons for this observation is due to the controlled sea
laver treatment practice in which P content in the treatment
acid was reduced from the initial 14–5, 4, and 3% (by
weight) in the year of 2002, 2003, and 2004 to present,
respectively. Such a countermeasure limits the activity of
the sulfate reduction bacteria and the consequent interac-
tion between the tidal mud and the sea laver treatment acid.
Another possible reason may be due to that an upward
seepage of pore water liquid was observed in the Iida tidal
mud (Fig. 3), which may ‘‘wash out’’ those chemical
compounds that lead to the unpleasant odor (e.g., hydrogen
sulfide, H2S) and dark color (e.g., iron sulfide, FeS) in the
mud. In another words, the upward seepage of the pore
water liquid in the tidal mud has a natural remediation
effect. However, the mechanism of generation of the
upward seepage in the tidal mud is not clear.
The purpose of this study is to: (1) propose mechanisms
for explaining the transport of the sea laver treatment acid
in the Ariake Sea tidal mud and the generation of the
upward seepage of pore water liquid in the mud; (2)
investigate the effects of the sea laver treatment practice on
the geoenvironmental properties of the Ariake Sea tidal
mud; and (3) investigate the factors controlling the natural
remediation effect caused by the upward seepage of pore
water liquid in the mud.
Proposed mechanisms of transport of sea laver
treatment acid in the Ariake Sea tidal mud
and natural remediation effect
The downward and upward seepage of pore water liquid in
the mud may be induced by three possible mechanisms: (1)
tidal flow induced seepage in the tidal mud, as shown in
Fig. 3, (2) coupled heat-pore water vapor-pore water liquid
flow; and (3) heat-free pore gas bubble interaction induced
pore water liquid flow in the tidal mud. The first aspect has
been proved by the field test in the Iida tidal area (see
Fig. 3) and by the laboratory test (Okuzono 2006). The
reason for the different corresponding time for arriving at
the peak total head is mainly due to the presence of the free
gas bubble (including oxygen, methane, hydrogen sulfide
and carbon oxide etc.) in the pore water of the Ariake Sea
tidal mud, which usually has a concentration of about 3–
5% (by volume). Due to the presence of the free gas bubble
in the pore water, the transfer of the flood tide loading to
the tidal mud is delayed. As a result, at the flood tide, the
time for arriving at peak pore water pressure at the shallow
Oct0.0
0.2
0.4
0.6
0.8
1.0
1.2
1.4
1.6
1.8
2.0
Year
Month
200720062005200420032002
Apr OctApr OctApr OctApr OctApr
)g/gm( tnetnoc edifluS
Fig. 2 Annual change in sulfide content of the Iida tidal mud at the
depth of 100 mm
2.5
3.0
3.5
4.0
4.5
5.0
5.5
6.0
6.5
flood tidedownward
ebb tideupward
A: 22:37 (time), 6.28m (total head)B: 23:04 (time), 6.21m (total head)C: 23:26 (time), 6.19m (total head)
C B A
2003/11/25 09:48
2003/11/25 19:24
2003/11/26 05:00
2003/11/25 05:00
)m( daeh lato
T
Elapsed time (Year/month/date, hr:min)
0 depth 1.5m depth 3.0m depth
seepage
flood tidedownward
seepage seepage
ebb tideupwardseepage
Fig. 3 Calculated total head in the Iida tidal mud based on the
measurements of pore water pressure data
Environ Geol (2008) 55:889–900 891
123
depth is shorter than that at the deep depth, which results in
a downward seepage flow of pore water liquid. At the ebb
tide, the time for arriving at peak pore water pressure at the
shallow depth is longer than that at the deep depth, which
results in a upward seepage flow of pore water liquid. The
second and third aspects are related to the temperature
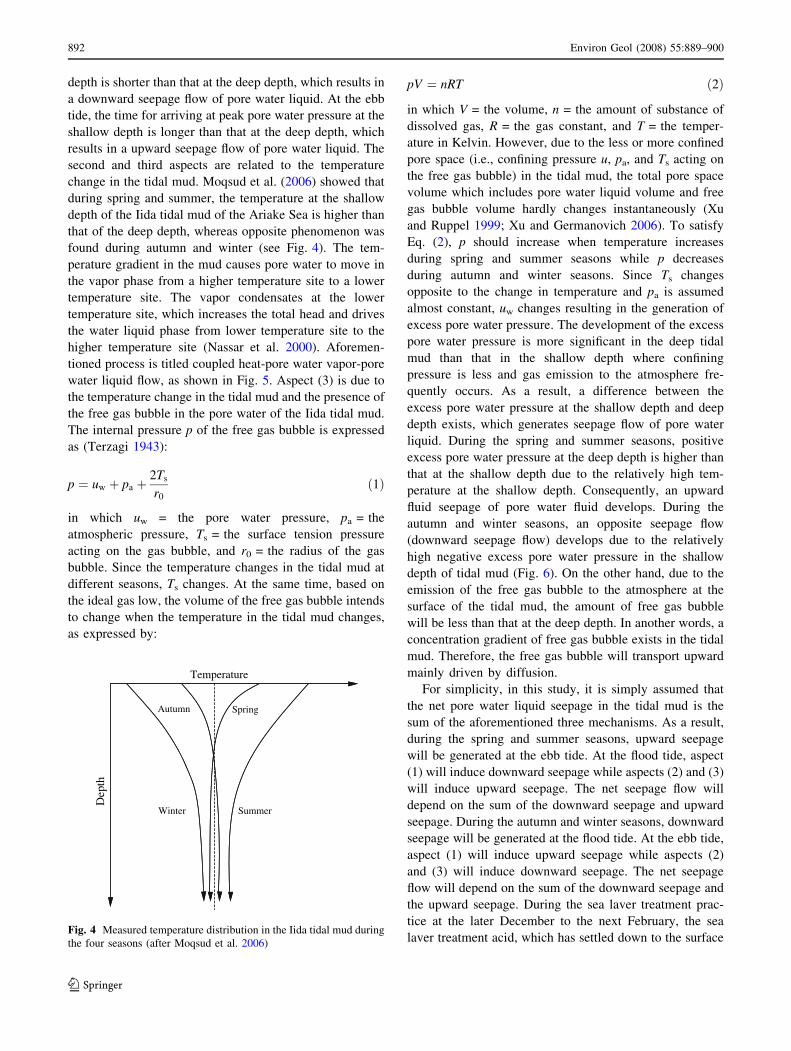
change in the tidal mud. Moqsud et al. (2006) showed that
during spring and summer, the temperature at the shallow
depth of the Iida tidal mud of the Ariake Sea is higher than
that of the deep depth, whereas opposite phenomenon was
found during autumn and winter (see Fig. 4). The tem-
perature gradient in the mud causes pore water to move in
the vapor phase from a higher temperature site to a lower
temperature site. The vapor condensates at the lower
temperature site, which increases the total head and drives
the water liquid phase from lower temperature site to the
higher temperature site (Nassar et al. 2000). Aforemen-
tioned process is titled coupled heat-pore water vapor-pore
water liquid flow, as shown in Fig. 5. Aspect (3) is due to
the temperature change in the tidal mud and the presence of
the free gas bubble in the pore water of the Iida tidal mud.
The internal pressure p of the free gas bubble is expressed
as (Terzagi 1943):
p ¼ uw þ pa þ2Ts
r0
ð1Þ
in which uw = the pore water pressure, pa = the
atmospheric pressure, Ts = the surface tension pressure
acting on the gas bubble, and r0 = the radius of the gas
bubble. Since the temperature changes in the tidal mud at
different seasons, Ts changes. At the same time, based on
the ideal gas low, the volume of the free gas bubble intends
to change when the temperature in the tidal mud changes,
as expressed by:
pV ¼ nRT ð2Þ
in which V = the volume, n = the amount of substance of
dissolved gas, R = the gas constant, and T = the temper-
ature in Kelvin. However, due to the less or more confined
pore space (i.e., confining pressure u, pa, and Ts acting on
the free gas bubble) in the tidal mud, the total pore space
volume which includes pore water liquid volume and free
gas bubble volume hardly changes instantaneously (Xu
and Ruppel 1999; Xu and Germanovich 2006). To satisfy
Eq. (2), p should increase when temperature increases
during spring and summer seasons while p decreases
during autumn and winter seasons. Since Ts changes
opposite to the change in temperature and pa is assumed
almost constant, uw changes resulting in the generation of
excess pore water pressure. The development of the excess
pore water pressure is more significant in the deep tidal
mud than that in the shallow depth where confining
pressure is less and gas emission to the atmosphere fre-
quently occurs. As a result, a difference between the
excess pore water pressure at the shallow depth and deep
depth exists, which generates seepage flow of pore water
liquid. During the spring and summer seasons, positive
excess pore water pressure at the deep depth is higher than
that at the shallow depth due to the relatively high tem-
perature at the shallow depth. Consequently, an upward
fluid seepage of pore water fluid develops. During the
autumn and winter seasons, an opposite seepage flow
(downward seepage flow) develops due to the relatively
high negative excess pore water pressure in the shallow
depth of tidal mud (Fig. 6). On the other hand, due to the
emission of the free gas bubble to the atmosphere at the
surface of the tidal mud, the amount of free gas bubble
will be less than that at the deep depth. In another words, a
concentration gradient of free gas bubble exists in the tidal
mud. Therefore, the free gas bubble will transport upward
mainly driven by diffusion.
For simplicity, in this study, it is simply assumed that
the net pore water liquid seepage in the tidal mud is the
sum of the aforementioned three mechanisms. As a result,
during the spring and summer seasons, upward seepage
will be generated at the ebb tide. At the flood tide, aspect
(1) will induce downward seepage while aspects (2) and (3)
will induce upward seepage. The net seepage flow will
depend on the sum of the downward seepage and upward
seepage. During the autumn and winter seasons, downward
seepage will be generated at the flood tide. At the ebb tide,
aspect (1) will induce upward seepage while aspects (2)
and (3) will induce downward seepage. The net seepage
flow will depend on the sum of the downward seepage and
the upward seepage. During the sea laver treatment prac-
tice at the later December to the next February, the sea
laver treatment acid, which has settled down to the surface
Temperature
htpeD
Summer Winter
Spring Autumn
Fig. 4 Measured temperature distribution in the Iida tidal mud during
the four seasons (after Moqsud et al. 2006)
892 Environ Geol (2008) 55:889–900
123

of the tidal mud due to the higher density than that of the
seawater, would transport down in the tidal mud driven by
the downward seepage of pore water liquid at the flood
tide. The interaction between the migrated acid and the
mud may not be significant because that the low temper-
ature limits the sulfate reduction bacteria (Cook and Kelly
1992) and thereby the generation of the H2S and FeS
(Hayashi et al. 2003). In the spring and summer seasons,
when the temperature increases, considerable amount of
chemical compounds like H2S and FeS are generated due
to the enhanced activity of the sulfate reduction bacteria in
the tidal mud (Richard and Morse 2005; Hayashi and Du
2005). At the ebb tide, these chemical compounds would
be washed out of the tidal mud due to the upward pore
water liquid seepage and consequently would induce a
natural remediation effect on the mud. As a result, the
measured content of H2S decreases recently (see Fig. 2). In
this study, only the effect of the aforementioned aspect (1)
related pore water liquid seepage on the transport of the sea
laver treatment acid in the mud and the natural remediation
effect will be presented in the later part. A series of current
laboratory tests are undertaken to investigate the aspects
(2) and (3) related pore water liquid seepage.
Materials and test method
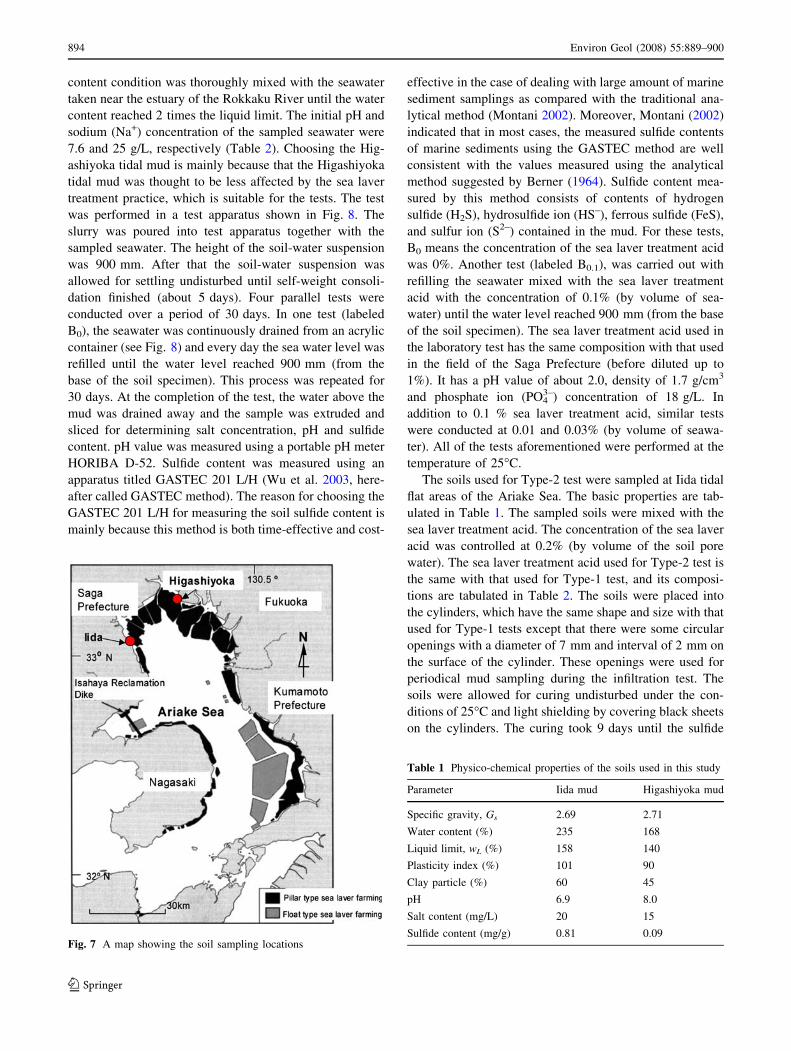
The soils used for the laboratory tests were sampled from
the Higashiyoka site tidal flat area, Ariake Sea (See Fig. 7).
The basic physico-chemical properties of the sampled soils
are tabulated in Table 1. Two types of laboratory tests were
performed: (a) Type-1, infiltration of sea laver treatment
acid together with seawater; and (b) Type-2, infiltration of
fresh seawater. Type-1 test represents the field scenario that
sea laver treatment acid transports in the tidal mud driven
by the downward seepage occurring at the flood tide during
the sea laver cultivation season. It is noted that although the
real tidal mud temperature in the field during the sea laver
cultivation (7–16�C) is lower than that of the laboratory
test (25�C), the laboratory test represents an acceleration
condition in which the tidal temperature is elevated to
enhance the activity of the sulfate reduction bacteria and
thereby enhance the deterioration of the mud. With the
elevated temperature, it was both time-effective and cost-
effective. Type-2 test represents the field scenario that the
upward seepage of pore water liquid occurs in the tidal
mud at the ebb tide during the cultivation season. For
Type-1 test, about 6 kg of mud under the field water
temperature
High temperature
Low total headEvaporation
CondensationLow
Low temperature
Hightemperature
Spring ~ Summer16°C - 29°C
Autumn ~ Winter16°C - 7°C
Hot water Cold water
High total head
High totalhead
Condensation
EvaporationLow total
head
Temperature
Summer Winter
Spring Autumn
Sun Sun
Mud
dep
th
Mud
dep
th
Pore
wat
er v
apor
Pore
wat
er li
qurd
Hea
t
Pore
wat
er v
apor
Pore
wat
er li
qurd
Hea
t
Fig. 5 Proposed concept of
coupled heat-pore water vapor
and coupled heat-pore water
liquid flow in the tidal mud
free
gas
free
gas
Low positive excess pore
water pressure
High volumetricswell tendency,
Low content
Low volumetricswell tendency,High content
Lowtemperature
High temperature
Hightemperature
Low temperature
Spring ~ Summer16°C -29°C
Autumn ~ Winter16°C -7°C
Hot water Cold water
High positive excess pore
water pressure
Low negative excess pore
water pressure
High volumetricshrink tendency,
Low content
Low volumetricshrink tendency,
High content
High negative excess pore
water pressure
Sun Sun
Temperature
Summer Winter
Spring Autumn
Mud
dep
th
Mud
dep
th
Pore
wat
er li
qurd
Pore
wat
er li
qurd
Hea
t
Hea
t
Fig. 6 Proposed concept of
heat-free pore gas interaction
induced pore water liquid flow
in the tidal mud
Environ Geol (2008) 55:889–900 893
123
content condition was thoroughly mixed with the seawater
taken near the estuary of the Rokkaku River until the water
content reached 2 times the liquid limit. The initial pH and
sodium (Na+) concentration of the sampled seawater were
7.6 and 25 g/L, respectively (Table 2). Choosing the Hig-
ashiyoka tidal mud is mainly because that the Higashiyoka
tidal mud was thought to be less affected by the sea laver
treatment practice, which is suitable for the tests. The test
was performed in a test apparatus shown in Fig. 8. The
slurry was poured into test apparatus together with the
sampled seawater. The height of the soil-water suspension
was 900 mm. After that the soil-water suspension was
allowed for settling undisturbed until self-weight consoli-
dation finished (about 5 days). Four parallel tests were
conducted over a period of 30 days. In one test (labeled
B0), the seawater was continuously drained from an acrylic
container (see Fig. 8) and every day the sea water level was
refilled until the water level reached 900 mm (from the
base of the soil specimen). This process was repeated for
30 days. At the completion of the test, the water above the
mud was drained away and the sample was extruded and
sliced for determining salt concentration, pH and sulfide
content. pH value was measured using a portable pH meter
HORIBA D-52. Sulfide content was measured using an
apparatus titled GASTEC 201 L/H (Wu et al. 2003, here-
after called GASTEC method). The reason for choosing the
GASTEC 201 L/H for measuring the soil sulfide content is
mainly because this method is both time-effective and cost-
effective in the case of dealing with large amount of marine
sediment samplings as compared with the traditional ana-
lytical method (Montani 2002). Moreover, Montani (2002)
indicated that in most cases, the measured sulfide contents
of marine sediments using the GASTEC method are well
consistent with the values measured using the analytical
method suggested by Berner (1964). Sulfide content mea-
sured by this method consists of contents of hydrogen
sulfide (H2S), hydrosulfide ion (HS–), ferrous sulfide (FeS),
and sulfur ion (S2–) contained in the mud. For these tests,
B0 means the concentration of the sea laver treatment acid
was 0%. Another test (labeled B0.1), was carried out with
refilling the seawater mixed with the sea laver treatment
acid with the concentration of 0.1% (by volume of sea-
water) until the water level reached 900 mm (from the base
of the soil specimen). The sea laver treatment acid used in
the laboratory test has the same composition with that used
in the field of the Saga Prefecture (before diluted up to
1%). It has a pH value of about 2.0, density of 1.7 g/cm3
and phosphate ion (PO43–) concentration of 18 g/L. In
addition to 0.1 % sea laver treatment acid, similar tests
were conducted at 0.01 and 0.03% (by volume of seawa-
ter). All of the tests aforementioned were performed at the
temperature of 25�C.
The soils used for Type-2 test were sampled at Iida tidal
flat areas of the Ariake Sea. The basic properties are tab-
ulated in Table 1. The sampled soils were mixed with the
sea laver treatment acid. The concentration of the sea laver
acid was controlled at 0.2% (by volume of the soil pore
water). The sea laver treatment acid used for Type-2 test is
the same with that used for Type-1 test, and its composi-
tions are tabulated in Table 2. The soils were placed into
the cylinders, which have the same shape and size with that
used for Type-1 tests except that there were some circular
openings with a diameter of 7 mm and interval of 2 mm on
the surface of the cylinder. These openings were used for
periodical mud sampling during the infiltration test. The
soils were allowed for curing undisturbed under the con-
ditions of 25�C and light shielding by covering black sheets
on the cylinders. The curing took 9 days until the sulfide
Fig. 7 A map showing the soil sampling locations
Table 1 Physico-chemical properties of the soils used in this study
Parameter Iida mud Higashiyoka mud
Specific gravity, Gs 2.69 2.71
Water content (%) 235 168
Liquid limit, wL (%) 158 140
Plasticity index (%) 101 90
Clay particle (%) 60 45
pH 6.9 8.0
Salt content (mg/L) 20 15
Sulfide content (mg/g) 0.81 0.09
894 Environ Geol (2008) 55:889–900
123

content reached practically constant in the soils. It was
observed that gravity consolidation of the soil finished at
4 days after pouring into the cylinder. The sea laver
treatment acid used for the test is the same with that used
for Type-1 test. The Ariake Sea water taken from the
estuary of the Rokkaku River was then introduced to the
cylinders in a careful manner until the downward hydraulic
gradients reached 1 and 5, respectively. The basic chemical
properties of the seawater are summarized in Table 2.
Throughout the test, the volume of the infiltrated seawater
from the soil base was measured periodically and the same
amount of the fresh seawater was introduced above the
soils to maintain the constant hydraulic gradient. During
the test, a syringe was inserted into the openings of the
cylinder to take soil samples from different depth for the
regular measurement of pH and sulfide content. The infil-
tration test was performed at the temperature of 25�C.
Results and discussion
Type-1 test
The measured sulfide content along the soil depth is plotted
in Fig. 9. It can be seen that the sulfide content in the case
of the Higashiyoka mud experienced acid treatment (B0.1
test) was significantly higher than the original low values
(B0 test), especially at the depth of 0–40 mm. The sulfide
content at this depth range even exceeded the safe limit
value of 0.2 mg/g, as required by the Japan Fishery Water
Quality Standard (Japan Fisheries Resource Conservation
Association, 2000). For B0 test, which represents an field
scenario that mud was not contaminated by the sea laver
acid treatment practice, the sulfide content is much lower at
the depth of 0–40 mm, as compared with B0.1 test. At the
depth of 40–120 mm, the sulfide content did not change
considerably in the case of B0.1 test, i.e., practically
constant.
Table 2 Chemical properties of seawater and sea laver treatment
acid used for both Type-1 and Type-2 tests
Parameter Seawater Sea laver treatment acid
Density (g/cm3) 1.0 1.7
pH value 7.6 2.0
Na+ 25.1 0.3
K+ 0.9 0.03
Ca2+ 1.1 ND
Mg2+ 2.5 ND
Cl– 35.8 ND
SO42– 3.3 171.6
PO43– ND 124.4
SO42– 3.3 171.6
PO43– ND 124.4
drain
002
007
200Unit: mm
Mud
Seawater 4-tie rods, @90°
acrylic cylinder
porous plate
acrylic base container
flange
4-tie rods, @90°
flange
Fig. 8 Schematic of laboratory test apparatus used for this study
120
100
80
60
40
20
00.0 0.2 0.4 0.6 0.8 1.0 1.2 1.4 1.6 1.8 2.0 2.2
Safe limit
Sulfide content (mg/g)
B0 test
B0.1
test
Dep
th (
mm
)
Fig. 9 Change of sulfide content versus soil depth for Type-1 test
Environ Geol (2008) 55:889–900 895
123
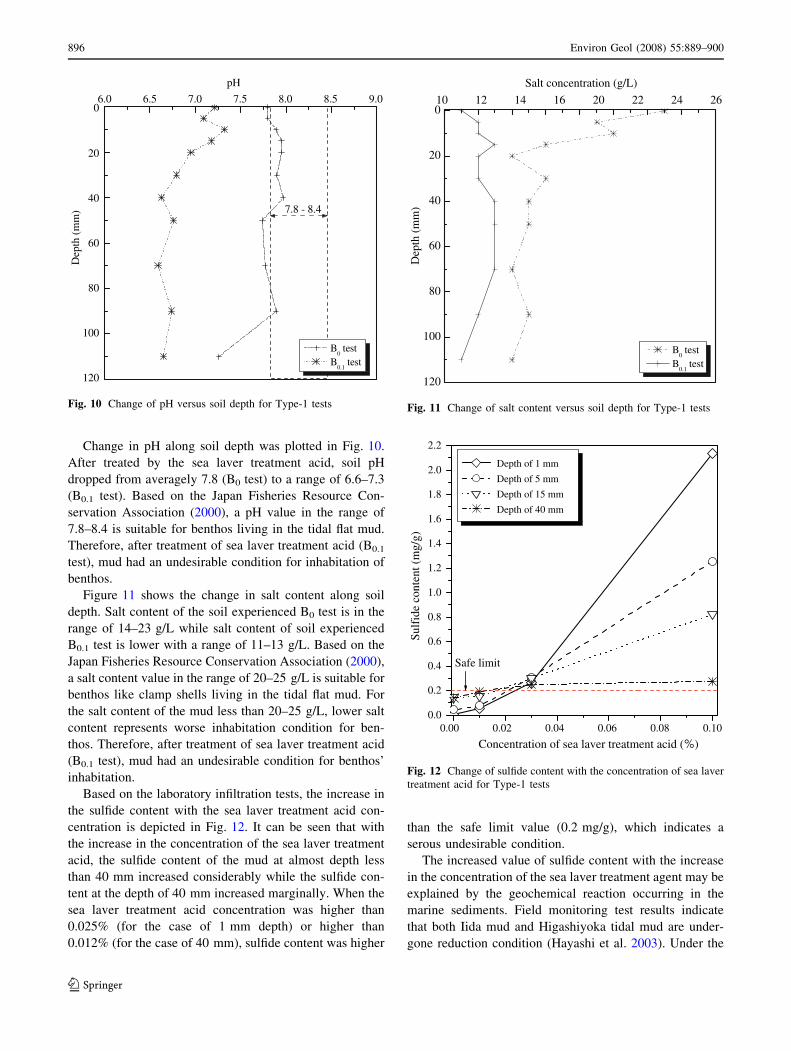
Change in pH along soil depth was plotted in Fig. 10.
After treated by the sea laver treatment acid, soil pH
dropped from averagely 7.8 (B0 test) to a range of 6.6–7.3
(B0.1 test). Based on the Japan Fisheries Resource Con-
servation Association (2000), a pH value in the range of
7.8–8.4 is suitable for benthos living in the tidal flat mud.
Therefore, after treatment of sea laver treatment acid (B0.1
test), mud had an undesirable condition for inhabitation of
benthos.
Figure 11 shows the change in salt content along soil
depth. Salt content of the soil experienced B0 test is in the
range of 14–23 g/L while salt content of soil experienced
B0.1 test is lower with a range of 11–13 g/L. Based on the
Japan Fisheries Resource Conservation Association (2000),
a salt content value in the range of 20–25 g/L is suitable for
benthos like clamp shells living in the tidal flat mud. For
the salt content of the mud less than 20–25 g/L, lower salt
content represents worse inhabitation condition for ben-
thos. Therefore, after treatment of sea laver treatment acid
(B0.1 test), mud had an undesirable condition for benthos’
inhabitation.
Based on the laboratory infiltration tests, the increase in
the sulfide content with the sea laver treatment acid con-
centration is depicted in Fig. 12. It can be seen that with
the increase in the concentration of the sea laver treatment
acid, the sulfide content of the mud at almost depth less
than 40 mm increased considerably while the sulfide con-
tent at the depth of 40 mm increased marginally. When the
sea laver treatment acid concentration was higher than
0.025% (for the case of 1 mm depth) or higher than
0.012% (for the case of 40 mm), sulfide content was higher
than the safe limit value (0.2 mg/g), which indicates a
serous undesirable condition.
The increased value of sulfide content with the increase
in the concentration of the sea laver treatment agent may be
explained by the geochemical reaction occurring in the
marine sediments. Field monitoring test results indicate
that both Iida mud and Higashiyoka tidal mud are under-
gone reduction condition (Hayashi et al. 2003). Under the
120
100
80
60
40
20
06.0
7.8 - 8.4
pH
B0 test
B0.1
test
Dep
th (
mm
)
6.5 7.0 7.5 8.0 8.5 9.0
Fig. 10 Change of pH versus soil depth for Type-1 tests
120
100
80
60
40
20
010 12 14 16 20 22 24 26
Salt concentration (g/L)
B0 test
B0.1
test
Dep
th (
mm
)Fig. 11 Change of salt content versus soil depth for Type-1 tests
0.00 0.02 0.04 0.06 0.08 0.100.0
0.2
0.4
0.6
0.8
1.0
1.2
1.4
1.6
1.8
2.0
2.2
Depth of 1 mm
Depth of 5 mm
Depth of 15 mm
Depth of 40 mm
Sulf
ide
cont
ent (
mg/
g)
Concentration of sea laver treatment acid (%)
Safe limit
Fig. 12 Change of sulfide content with the concentration of sea laver
treatment acid for Type-1 tests
896 Environ Geol (2008) 55:889–900
123
reduction condition, the sulfate (SO42–) in the pore water of
the mud is reduced to hydrogen sulfide (H2S) by the
organic matter deposition with the aid of sulfate-reducing
bacteria (Jorgenson 1991; Mitchell 1993). Simultaneously
the H2S reacts with soluble ferrous iron (Fe2+), which is
usually observed in the Ariake marine muds (Ohtsubo et al.
1995) and forms black amorphous FeS. The reduction
process of SO42– to H2S and formation of FeS can be
expressed by following equations.
SO2�4 þ CH3COO� þ Hþ ! H2Sþ CO2 þ H2O ð3Þ
H2Sþ Fe2þ ! FeS ð4Þ
in which CH3COO– symbolizes the organic matter. Usually
oxidation condition was observed in the shallow depth up
to 5 cm of the Ariake mud (Hayashi et al. 2003). Under this
condition, with the aid of the sulfur bacteria, H2S is
oxidized to SO42–, as expressed in Eq. (5):
H2Sþ H2O! SO2�4 þ Hþ ð5Þ
Jorgenson (1991) and Mitchell (1993) indicated that
aforementioned geochemistry reaction is typically occurred
in marine sediments showing the cycle of sulfur (S) in the
marine sediments. However, during the sea laver treatment
practice undertaken in the Ariake Sea, the reaction equi-
librium of Eqs. (3) and (4) might have been broken which
lead to significant occurrence of H2S in the tidal mud of
Ariake Sea. Since the phosphorous (P) contained in the sea
laver treatment agent (in the form of inorganic chemical
compound, NaH2PO4) provides source of feed to the sul-
fate-reducing bacteria, the activity of the sulfate-reducing
bacteria would become higher under relatively high tem-
perature ([18�C) and reduction condition (McGhee 1991).
Therefore, the decomposition of organic matter initially
contained in the mud and the additional organic matter like
DL-Malic acid from the sea laver treatment agent would be
enhanced. Consequently, according to Eqs. (1) and (2),
considerable amount of H2S and FeS would form. As a
result, the sulfide content of the mud increased. The
occurrence of black FeS was observed in the B0.1 test that a
blackish matter (identified as FeS) appeared in the water
above the mud after 10 days of test. At the end of test, a
thin layer of blackish fine mass (identified as FeS) was
observed on the surface of the mud.
The decrease in pH and increase in sulfide content as a
result of the sea laver acid treatment practice seems to have
also occurred in the Iida tidal flat areas where the non-
officially recorded local acid treatment practice before
1993 and the large scaled acid treatment practice after 1993
have been encountered. Such a result is reasonable for
explaining the phenomenon that the catch of the clamp
shells living in the shallow depths of the mud decreased
during the period of the sea laver treatment practice, as
depicted in Fig. 1.
Type-2 test
Figure 13 shows the change of sulfide content along the
soil depth before and after the fresh seawater infiltration
test. Compared with the original value, after infiltration of
fresh seawater, sulfide content decreased, indicating that
the infiltration of fresh seawater had a remediation effect
on the sea laver treatment acid contaminated Iida site tidal
mud. The decrease in sulfide content became significant
with the increase in testing time. This is mainly because
that with the increase in test duration, larger amount of
oxygen (O2) dissolved in the seawater might have been
consumed by the mud, which lead to the oxidation of H2S
as expressed by Eq. (5). As a result, sulfide content
decreased with the increase in time duration. Compared
with the case of the hydraulic gradient i = 1 (see Fig. 13a),
the case of the hydraulic gradient i = 5 (see Fig. 13b)
resulted in a better remediation efficiency in terms of
decrease in the sulfide content in the soil at the same testing
duration. The reason that the sulfide content is still higher
than the safe limit, 0.2 mg/g is mainly due to the limited
short test duration.
The change in pH value along the soil depth before and
after the test was shown in Fig. 14. Compared with the
original value, pH of soil increased after test. It increased
with the increase in testing duration. After 30 days, pH
value exceeds 7.8, which is in the acceptable range for
benthos living in the tidal mud (pH = 7.8–8.4). However, it
was found that the effect of hydraulic gradient on change in
pH was not considerable.
To evaluate the remediation efficiency, the percentage
of sulfide content reduction, A%, is used in this study as
expressed by following:
A% ¼ SC0 � SCðtÞSC0
� 100 ð6Þ
in which SC0 = the original sulfide content and SC(t) = the
sulfide content at specified time. A high value of A%
represents that sulfide content at specified time is low,
indicating that the remediation efficiency is high. A nega-
tive value of A% means that after the infiltration of sea
water, sulfide content became higher than the original
value.
The variations of A% along the mud depth for both the
hydraulic gradient i = 1 and the hydraulic gradient i = 5
are shown in Fig. 15. For both cases (i = 1 and i = 5), at
the shallow depth, soils have higher A% value than the
deep depth, indicating that the remediation effect at the
Environ Geol (2008) 55:889–900 897
123

shallow depth is better than that of the deep depth. At some
depths, the value of A% even became negative. The neg-
ative value at the deep depth may be due to that with the
downward seepage of seawater, the FeS contained in the
deteriorated mud might have moved from shallow depth to
the deep depth mainly driven by the downward seepage. As
a result, the measured sulfide content at some deep depth
became higher than the original value (see Fig. 13) and A%
value at some deep depth became negative (see Fig. 15).
A% value at the shallow depth is higher than that at the
great depth, i.e., a gradient exists along the soil depth. This
may be because that with the downward seepage of sea-
water, FeS contained in the deteriorated mud at the shallow
depth was washed down from the shallow depth to the
great depth driven by the seepage pressure. As a result, the
sulfide content at the shallow depth was less than that at the
great depth.
With the increase in hydraulic gradient, A% value
increased. For the case of the hydraulic gradient i = 1, A%
varied in a range of 10–50%. For the case of i = 5, A%
varied in a range of 5–90%, indicating a higher remediation
effect. This may be due to that with the downward seepage
of seawater, the FeS contained in the deteriorated mud at
the shallow depth was washed down driven by the seepage
160
140
120
100
80
60
40
20
00.0 0.3 0.6 0.9 1.2 1.5 1.8 2.1 2.4
0.0 0.3 0.6 0.9 1.2 1.5 1.8 2.1 2.4
a)
i = 1
Sulfide content (mg/g)
Sulfide content (mg/g)
)m
m( htpeD
Original after 5 days after 10 days after 15 days after 20 days after 30 days
160
140
120
100
80
60
40
20
0b)
i = 5
Original after 5 days after 10 days after 15 days after 20 days after 30 days
)mc( htpe
D
Fig. 13 a Change of sulfide content versus soil depth for the case of
i = 1 in Type-2 test. b Change of sulfide content versus soil depth for
the case of i = 5 in Type-2 test
160
140
120
100
80
60
40
20
06.5
a)
i = 1
pH value
)m
m( htpeD
)m
m( htpeD
Original after 5 days after 10 days after 15 days after 20 days after 30 days
160
140
120
100
80
60
40
20
0b)
i = 5
pH
Original after 5 days after 10 days after 15 days after 20 days after 30 days
7.0 7.5 8.0 8.5
6.5 7.0 7.5 8.0 8.5
Fig. 14 a Change of pH versus soil depth for the case of i = 1 in
Type-2 test. b Change of pH versus soil depth for the case of i = 5 in
Type-2 test
898 Environ Geol (2008) 55:889–900
123

pressure, icwH, in which cw = the density of seawater and
H = the thickness of soil. Since H was almost constant
(approximately 180 mm in this study), the seepage pres-
sure for the case of i = 5 is five times higher than i = 1.
Thereby, higher amount of FeS was washed out from the
soil. As a result, value of A% for the case of i = 5 is higher
than that for the case of i = 1.
The relationship between pH and sulfide content for
both cases i = 1 and i = 5 is plotted in Fig. 16a and b,
respectively. Generally, the locations of the data measured
after treatment by the sea laver treatment acid are away
from the original locations. With the increase in pH, soil
sulfide content decreased. The co-relationship coefficients,
R, were 0.38 and 0.66 for the cases of i = 1 and i = 5,
respectively, indicating that pH was one of the factors
controlling the soil sulfide content. It was observed that five
data were far below others in the case of i = 5 (see
Fig. 16b), while such a phenomenon was not observed in
the case of i = 1 (see Fig. 16a). This is mainly because that
these five data are mainly from the shallow depth of the soil
(10 cm depth). As discussed in the earlier part, under the
condition of i = 1, at the shallow depth, larger amount of
140
160
120
100
80
60
40
20
0
a)
i =1
Variation in sulfide content, A% )
mm( htpe
D
160
140
120
100
80
60
40
20
0-100 -80 -60 -40 -20 -0 20 40 60 80 100
-100 -80 -60 -40 -20 -0 20 40 60 80 100
b)
i = 5
Variation in sulfide content, A%
)m
m( htpeD
after 5 days after 10 days after 15 days after 20 days after 30 days
after 5 days after 10 days after 15 days after 20 days after 30 days
Fig. 15 a Change of A% versus soil depth for the case of i = 1 in
Type-2 test. b Change of A% versus soil depth for the case of i = 5 in
Type-2 test
0.0
0.3
0.6
0.9
1.2
1.5
1.8
2.1
2.4
y = -0.37x+4.25R = 0.38
)g/gm( tnetnoc edifluS
)g /gm( tnetnoc edifluS
pH
Original after 5 days after 10 days after 15 days after 20 days after 30 days
0.0
0.3
0.6
0.9
1.2
1.5
1.8
2.1
2.4
y = -0.51x+5.12R = 0.66
pH
Original after 5 days after 10 days after 15 days after 20 days after 30 days
6.5 7.0 7.5 8.0 8.5
6.5 7.0 7.5 8.0 8.5
a)
b)
Fig. 16 a Relationship between pH and sulfide content for the case of
i = 1. b Relationship between pH and sulfide content for the case of
i = 5
Environ Geol (2008) 55:889–900 899
123
FeS initially contained in the soil might had been washed
down to the great depth. However, change of pH at the
shallow depth was not sensitive to the hydraulic gradient
(see Fig. 14). Therefore, the measured sulfide contents at
this depth are much lower than others (see Fig. 13b). As a
result, five data measured from the shallow soil depth were
below others and the trend line in Fig. 16b.
Conclusions
This study presents three proposed mechanisms for
explaining the transient seepage of pore water liquid of the
tidal mud, which contributes to the transport of sea laver
treatment acid in the Ariake Sea tidal mud and natural
remediation of the sea laver treatment acid contaminated
tidal mud. The mechanisms of the generation of the pore
water liquid seepage in the tidal mud are discussed.
The Type-1 test results show that for the sea laver
treatment acid treated Higashiyoka mud, with the increase
in the concentration of the sea laver treatment acid, the
sulfide content increased whereas the pH value decreased.
The mechanism of the increase in the sulfide content
caused by the sea laver treatment acid is explained based
on the enhanced geochemical reactions occurring in the
Ariake Sea tidal mud.
The Type-2 test results show that with the infiltration of
the fresh seawater in the sea laver acid contaminated mud,
the sulfide content decreased and pH values decreased,
indicating that the upward seepage of pore water liquid in
the mud has natural remediation effect.
The Type-2 test results show that with the increase in
hydraulic gradient, A% increased indicating that the reme-
diation efficiency increased. It is found that A% at the
shallow depth of the soil is higher than that at the great depth.
Acknowledgments This study is part of a big research grant titled
‘‘Proof Test of Sediment Improvement by Sand Filling and Mixing in
Enclosed Dikes and Evaluation’’ commissioned by the Japanese
Ministry of Education, Culture, Sports and Society and Technology
Agency (JST). The partial financial support from the International
Cooperation project titled ‘‘Recovery of Benthos in Ariake Sea Tidal
Mud’’ (No. 8621002036) between Southeast University, China and
Saga University, Japan, is appreciated. The former graduate students,
Mr. Yuji Ushihara, Mr. Kazuya Nakatake, Mr. Kengo Okuzono,
and Mr. Sei Tanaka, are thanked for their help with performing the
laboratory tests.
References
Berner RA (1964) Distribution and diagenesis of sulfur in some
sediments from the Gulf of California. Mar Geol 1(2):117–140
Cook RB, Kelly CA (1992) Sulphur cycling and flues in temperature
dimictic lakes. Sulphur cycling on the continents. Wiley, New
York
Hayashi S, Du YJ (2005) Effect of acid treatment agent of sea laver
on geoenvironmental properties of tidal flat muds in the Ariake
Sea. J ASTM Int 3(7):52–59
Hayashi S, Du YJ, Ushihara Y (2003) Investigation on effect of acid
treatment agent on the change in geoenvironmental properties of
sediment in the Ariake Sea. In: Proc 1st China–Japan Joint
Symposium on Geotechnical Engineering, Beijing, pp 264–271
Japan Fisheries Resource Conservation Association (2000) Fishery
water quality standard (in Japanese). Kouseisha-kouseikaku
Press Co., Tokyo
Jorgensen BB (1991) A thiosulfate shunt in the sulfur cycle of marine
sediments. Science 249(1):152–154
Kotama M, Tanaka K, Fujita T, Kimoto K, Okamura K, Mori Y
(2005) Variation of oxygen-depleted water and environmental
properties of bottom sediments in the western region of Ariake
Bay head (in Japanese). In: Proceedings of annual spring
conference of the oceanographic society of Japan, p 191
McGhee TJ (1991) Water supply and sewerage, 6th edn McGraw-Hill
Book Co., Singapore
Mitchell JK (1993) Fundamentals of soil behavior, 2nd edn. Wiley,
New York
Montani T (2002) Manual of measurement of sulfide content using
simple method (in Japanese). Japan Brine Water Fishing
Association, Tokyo
Moqsud MA, Hayashi S, Du YJ, Suetsugu D (2006) Evaluation of
Temperature trend in contaminated tidal flat in the Ariake Sea,
Japan. Am J Environ Sci 2(3):104–108
Nassar IN, Horton R, Flerchinger GN (2000) Simultaneous heat and
mass transfer in soil columns exposed to freezing/thawing
conditions. Soil Sci 165(3):208–216
Ohtsubo M, Egashira K, Kashima K (1995) Depositional and post-
depositional geochemistry, and its correlation with geotechnical
properties of the marine clays in Ariake Bay, Japan. Geotech-
nique 45(3):263–282
Okuzono K (2006) A laboratory test study of pore water seepage flow
in the Ariake Sea tidal mud. Master Thesis, Saga University,
Saga, Japan
Terzagi K (1943) Theoretical soil mechanics. Wiley, New York
The Oceanographic Society of Japan (2005) Recovery of the Ariake
Sea eco-system (in Japanese). Kouseisha-kouseikaku Press Co.,
Tokyo
Tsuzumi H (2003) The mechanisms of occurrence of large-scaled red
tide in the Ariake Sea where eutrophication process is not
significantly processed (in Japanese). Report to the General
Assessment Committee of Ariake Sea and Yachiyo Sea,
Japanese Ministry of the Environment
Unoki S (2002) Change in the tide amplitude and tidal velocity of
Ariake Sea caused by the Isahaya reclamation project (in
Japanese). Umi-to-Sora 78(1):19–30
Wu SS, Tsunami H, Tsukamoto K, Kogure K, Ohwada K, Wada M
(2003) Visualization of the respiring bacteria in sediments
inhabited by Capitella sp. 1. Fisheries Res 69(1):170–175
Xu W, Ruppel C (1999) Predicting the occurrence, distribution and
evolution of methane gas hydrates in porous sediments. J
Geophys Res 104:5081–5096
Xu W, Germanovich LN (2006) Excess pore pressure resulting
from methane hydrate dissociation in marine sediments: A
theoretical approach. J Geophys Res 111 (B01104). doi:10.1029/
2004JB003600
900 Environ Geol (2008) 55:889–900
123