Experimental Setup and Standardization of a Continuous Flow Stable Isotope Mass Spectrometer for...
11
SHORT COMMUNICATION Experimental Setup and Standardization of a Continuous Flow Stable Isotope Mass Spectrometer for Measuring Stable Isotopes of Carbon, Nitrogen and Sulfur in Environmental Samples R. Agnihotri*, R. Kumar, M. V. S. N. Prasad, C. Sharma, S. K. Bhatia and B. C. Arya Radio and Atmospheric Science Division, CSIR-National Physical Laboratory, New Delhi 110012, India Received: 28 October 2013 / Accepted: 10 February 2014 Ó Metrology Society of India 2014 Abstract: We present here the experimental setup and standardization of a newly acquired stable isotope ratio mass- spectrometer (Isoprime 100, Isoprime Ò UK) coupled with elemental analyzer (Pyrocube, Elementar Ò -Germany) in a continuous flow mode, for the measurements of C, N and S isotopes in a variety of natural as well as synthetic organics and sulfur containing solid samples. We have calibrated our instrument using a suite of certified international standards supplied by International Atomic Energy Agency Vienna and cross-checked against several in-house laboratory standards used by other institutions of international repute. A synthetic organic compound Sulfanilamide was continuously used along with international standards to develop an in-house internal laboratory standard for the accurate and precise isotopic measurements. Important components contributing to the overall uncertainty of the isotopic measurements such as blank contributions, amount effect and response of mass-spectrometric current against thermal conductivity detector were per- formed using several aliquots of e-Amino-n-caproic acid and sulfanilamide (in-house) standards. Both short and long term variabilities in the measure isotopic data were assessed using our in-house laboratory standard Sulfanilamide. Overall estimated uncertainties of C, N and S isotopic measurements are better than 0.2, 0.2 and 0.3 %, respectively; which are well within the recommended limits of aforementioned isotopic data. Keywords: CNS isotopes; Isoprime; Pyro-cube; IRMS; Continuous flow mode 1. Introduction The Radio and Atmospheric Science Division of CSIR- National Physical Laboratory (CSIR-NPL, New Delhi) is engaged in monitoring various atmospheric parameters over different regions of northern India, especially focusing on physical, chemical and isotopic characterization of atmospheric aerosols and trace gases [1]. Towards achieving this goal, the division acquired a new ‘state of the art’ continuous flow isotope ratio mass-spectrometer (CF-IRMS) for measuring stable isotopes of carbon, nitrogen, sulfur, hydrogen and oxygen (C, N, S, H & O) in a variety of natural (environmental) as well as synthetic samples. This paper presents an overview of the experi- mental setup and standardization of the aforementioned CF-IRMS. In the concurrent environmental research of the lower troposphere, the aforementioned stable isotopes are vital tools for (i) identification of source of organic and sulfur containing biomass material derived aerosols and trace gases (ii) understanding and quantifying degree of secondary transformations occurring within the atmosphere (aerosol secondary processes especially involving N cycling) (iii) evaluating net impacts on regional C, N and S biogeochemical cycles [2–5]. Stable isotopes of C and N in conjunction with other chemical parameters have proven their potential in deciphering as well as quantifying com- plex biogeochemical changes occurring on variety of timescales ranging from seasonal to millennial, in various earth system research fields viz. oceanography and lim- nology [6–12]. In addition, C and N isotopes have been successfully exploited as tracers of various emissions in the atmospheric aerosol sciences [13–16]. With modern developments in analytical methods in mass-spectrometry it has been demonstrated that S isotope (d 34 S) can also be measured in small amounts of sulfur together with C and N isotopes in a sample aliquot with high sample throughput without compromising accuracy and precision [17]. As *Corresponding author, E-mail: [email protected] M APAN-Journal of Metrology Society of India DOI 10.1007/s12647-014-0099-8 123
-
Upload
lkouniversity -
Category
Documents
-
view
0 -
download
0
Transcript of Experimental Setup and Standardization of a Continuous Flow Stable Isotope Mass Spectrometer for...
SHORT COMMUNICATION
Experimental Setup and Standardization of a Continuous Flow StableIsotope Mass Spectrometer for Measuring Stable Isotopes of Carbon,
Nitrogen and Sulfur in Environmental Samples
R. Agnihotri*, R. Kumar, M. V. S. N. Prasad, C. Sharma, S. K. Bhatia and B. C. Arya
Radio and Atmospheric Science Division, CSIR-National Physical Laboratory, New Delhi 110012, India
Received: 28 October 2013 / Accepted: 10 February 2014
� Metrology Society of India 2014
Abstract: We present here the experimental setup and standardization of a newly acquired stable isotope ratio mass-
spectrometer (Isoprime 100, Isoprime� UK) coupled with elemental analyzer (Pyrocube, Elementar�-Germany) in a
continuous flow mode, for the measurements of C, N and S isotopes in a variety of natural as well as synthetic organics and
sulfur containing solid samples. We have calibrated our instrument using a suite of certified international standards
supplied by International Atomic Energy Agency Vienna and cross-checked against several in-house laboratory standards
used by other institutions of international repute. A synthetic organic compound Sulfanilamide was continuously used
along with international standards to develop an in-house internal laboratory standard for the accurate and precise isotopic
measurements. Important components contributing to the overall uncertainty of the isotopic measurements such as blank
contributions, amount effect and response of mass-spectrometric current against thermal conductivity detector were per-
formed using several aliquots of e-Amino-n-caproic acid and sulfanilamide (in-house) standards. Both short and long term
variabilities in the measure isotopic data were assessed using our in-house laboratory standard Sulfanilamide. Overall
estimated uncertainties of C, N and S isotopic measurements are better than 0.2, 0.2 and 0.3 %, respectively; which are
well within the recommended limits of aforementioned isotopic data.
Keywords: CNS isotopes; Isoprime; Pyro-cube; IRMS; Continuous flow mode
1. Introduction
The Radio and Atmospheric Science Division of CSIR-
National Physical Laboratory (CSIR-NPL, New Delhi) is
engaged in monitoring various atmospheric parameters
over different regions of northern India, especially focusing
on physical, chemical and isotopic characterization of
atmospheric aerosols and trace gases [1]. Towards
achieving this goal, the division acquired a new ‘state of
the art’ continuous flow isotope ratio mass-spectrometer
(CF-IRMS) for measuring stable isotopes of carbon,
nitrogen, sulfur, hydrogen and oxygen (C, N, S, H & O) in
a variety of natural (environmental) as well as synthetic
samples. This paper presents an overview of the experi-
mental setup and standardization of the aforementioned
CF-IRMS. In the concurrent environmental research of the
lower troposphere, the aforementioned stable isotopes are
vital tools for (i) identification of source of organic and
sulfur containing biomass material derived aerosols and
trace gases (ii) understanding and quantifying degree of
secondary transformations occurring within the atmosphere
(aerosol secondary processes especially involving N
cycling) (iii) evaluating net impacts on regional C, N and S
biogeochemical cycles [2–5]. Stable isotopes of C and N in
conjunction with other chemical parameters have proven
their potential in deciphering as well as quantifying com-
plex biogeochemical changes occurring on variety of
timescales ranging from seasonal to millennial, in various
earth system research fields viz. oceanography and lim-
nology [6–12]. In addition, C and N isotopes have been
successfully exploited as tracers of various emissions in the
atmospheric aerosol sciences [13–16]. With modern
developments in analytical methods in mass-spectrometry
it has been demonstrated that S isotope (d34S) can also be
measured in small amounts of sulfur together with C and N
isotopes in a sample aliquot with high sample throughput
without compromising accuracy and precision [17]. As*Corresponding author, E-mail: [email protected]
M �APAN-Journal of Metrology Society of India
DOI 10.1007/s12647-014-0099-8
123

sulfate constitutes an important fraction of aerosol mass in
both natural and anthropogenic emissions; S isotope of
aerosol sulfur can be used for source apportionment [18].
Hence measuring a combination of C, N and S isotopes
together with their concentrations can provide valuable
inputs in the environmental research. In dealing with
environmental samples (e.g. atmospheric aerosols), accu-
rate and precise measurements of all the three N, C and S
isotopes in same sample aliquot becomes more challenging
as there could be significant variations in their relative
amounts (such as C/N ratios of atmospheric aerosols could
vary from *1 to 50 (e.g. [13]); in contrast to oceanic
sediments where C/N ratios generally vary between *6
and 15 (e.g. [19]), requiring an optimal adjustment of
various operating parameters. In addition to aforesaid
stoichiometric difference, carbonaceous components may
be differ widely in aerosols over varying environments in
terms of their organic constituents (e.g. [20]). Therefore we
carried out a detailed investigation on reliability (accuracy)
and reproducibility of each isotopic measurement espe-
cially for sample containing low N or S contents
(\2 lmol). While d13C and d34S isotopic measurements
showed no observable amount or size effect for samples
containing lower amounts of C and S (from 1 to 4 lmol),
we observed there is a significant size or amount effect on
d15N measurements especially for samples containing low
N (\2 lmol of N). Through applying a proper blank cor-
rection, accurate and precise d15N data can be generated for
variety of environmental samples.
2. Experimental Setup
Hence, to develop a multi-isotope measurement capability
for variety of environmental samples (e.g. atmospheric
aerosols, soil and dust samples), RASD of CSIR-NPL
procured a new isotope ratio mass-spectrometer (Isoprime
100, Isoprime UK�; simply IRMS henceforth) coupled
with an elemental analyzer (Pyrocube, Elementar�; EA
henceforth). In recent years, several CF-IRMS’s have been
established in other institutions of India like National
Institute of Oceanography (Goa and Vishakhapatnam),
Physical Research Laboratory (Ahmedabad), Wadia Insti-
tute of Himalayan Geology (Dehradun) and Indian Institute
of Technology (Kharagpur) for measuring light stable
isotopes (C, N, S, H &O) in solids as well as in analytes
dissolved in aqueous media. RASD’s newly established
CF-IRMS is relatively a bit advanced, as it is designed for
simultaneous measurement of C, N, S isotopes in single
aliquot of a natural/synthetic sample via flash-combustion
pathway and H & O isotopic analysis via pyrolysis
pathway.
Figure 1 shows the picture of NPL’s newly established
CF-IRMS. The two units are connected through continuous
flow mode (open split device in a Helium environment).
The IsoPrime100 is the latest ‘state of the art’ gas source
stable isotope ratio mass spectrometer, which has a com-
pletely redesigned 100 V head-amplifier, offering a wide
dynamic range as well as automatic gain-switching, nec-
essary for multi-isotopic measurements in same aliquot of
sample. Enhancements in the ionization source are expec-
ted to result in better instrument performance with high
sensitivity, precision and accuracy. The IsoPrime100 offers
determination of d13C, d15N, d34S and dD, d18O via con-
tinuous flow mode connection with a EA (Pyrocube)
through flash-combustion (combustion in presence of pure
O2) and pyrolysis (combustion without O2), respectively.
Sample introduction system is fully automated through
IonVantage software to give excellent control and switch-
ing between inlet systems and gas species. Universal three
cup collectors are used to collect the ion beams of C, N, O,
S isotopes, and for H isotopes (dD) additional cup collector
is provided. Analyte gas mixture (N2, CO2, and SO2) is
separated using Purge & Trap separation controlled by
thermal programmed desorption (Fig. 2). Purge & Trap
separation offers multi-elemental isotopic analyses with
suitable baseline resolution. Pyrocube EA has zero-blank
ball-valve technology for sample introduction. Each sam-
ple is individually purged before analysis resulting in
reliable analysis of very low nitrogen concentrations. EA’s
sample carousel has 120 sample positions. All the daily
maintenances can be done without usage of any tools due
to ball and clamp fittings. Ash finger and furnace tube
exchange can be done easily depending on requirement.
Automated, leak checks can be performed via software
controlled leak diagnostics program. Basic schematic of
Isoprime 100 mass-spectrometer coupled with EA in con-
tinuous flow mode is shown in the Fig. 2.
3. Theoretical Description of Notations Used
in the Stable Isotopic Data
Isotopic anomalies are expressed in terms of ratio of less
abundant (heavier) atoms with respect to naturally more
abundant (lighter) atoms and they are expressed using
Delta (d) notation. For example, isotopes anomalies of
carbon, nitrogen and sulfur are expressed as d13C, d15N and
d34S respectively and defined as -
d ¼ Rsample=Rstandard
� �� 1
� �� 1000 ð1Þ
where R = 13C/12C, 15N/14N and 34S/32S
Hence d values are simply ratios expressed in per
thousand (commonly known as per mil denoted by %).
d13C values of all the carbon containing substances are
R. Agnihotri et al.
123

expressed with respect to Vienna-Peedee Belemnite (V-
PDB). Likewise, d15N values are expressed with respect to
atmospheric N2, which is assumed to be of 0 % value. The
international standard for Sulfur isotope measurements is
vienna-cation diablo troilite [18].
3.1. Sample Preparation and Methodology
To measure d13C, d15N, d34S and their respective concen-
trations [total carbon (TC), total nitrogen (TN) and total
sulfur (TS)] of solid environmental samples (e.g. soil,
sediment, dust or atmospheric aerosols), suitable amount of
sample is dried in oven (at *60 �C), cooled in desiccators,
weighed in appropriate amounts and packed in tin cups
before introducing to EA’s auto-sampler unit. In case of
atmospheric aerosol samples collected on quartz filters,
about 1–3 hole punches (area *1 cm2) of aerosol con-
taining filters are cut and packed in suitable sized tin cups.
It is important to use dried samples before weighing them
in tin cups. Sediment samples can be dried in oven *60 �C
or freeze dried samples can also be used. Aerosol sample
are better to dry in desiccator only. Then round pellets
should be made by pressing from all the sides to remove
any air. Pellets have to be round or oval shaped to ensure
their proper dropping into combustion tube. Number of
filter punches or amounts of solid samples (e.g. soil or dust)
taken for isotopic analysis is decided by a priori knowledge
of expected C, N, and S contents. Generally solid samples
can be weighed in the range of *2–50 mg, where number
of filter punches can be taken from 1 to 3. Packed tin cups
are dropped into the combustion tube (heated at 1,120 �C)
of the Pyrocube EA. The combustion tube is filled with
tungsten oxide (WO3) (padded with corundum balls and
quartz wool) which acts as catalyst for the CNS mode. For
only C and N isotopic determination a different filling can
be used which contains copper oxide (CuO) and lead
chromate (PbCrO4) [21]. Flash combustion takes place in
the presence of high purity (6-grade) oxygen gas (O2). The
evolved gases are passed through reduction tube (at 670 �C
for CN mode and 850 �C for CNS mode) filled with acti-
vated metallic copper that reduces the oxides of nitrogen
(NOx) to N2. Ensuring proper removal of NOx is very
Fig. 1 A picture of NPL’s CF-
IRMS installed in the TEC
building (room no. 108)
Fig. 2 Basic schematic of NPL-CFIRMS interfaced with EA in continuous flow mode. (source: isoprime technical note)
Experimental Setup and Standardization of a Continuous Flow Stable Isotope Mass Spectrometer
123

important for reliable isotopic data of N isotopes and also
for S isotopes. That is why, for CNS mode temperature of
the reduction tube is kept higher than that of CN mode. Dry
helium (5.5 grade) is used as carrier gas for sample intro-
duction. Gas streams are then passed through a water-trap
filled with sicapent or magnesium perchlorate (MgClO4)
ensuring complete removal of moisture. Sample N2 is
passed through directly to open split orifice of IRMS, while
and CO2 and SO2 are held on two special CO2 and SO2
columns normally kept at temperatures 20–25 �C (room
temperature) and 55 �C respectively. When N2 analysis is
over, CO2 is allowed to be desorbed from CO2 column by
raising the temperature to 240 �C; similarly after CO2
analysis, SO2 is allowed to be desorbed from SO2 column
by raising the temperature to 220 �C. The typical chro-
matogram of simultaneous analysis of CNS isotopes using
a sulfanilamide is shown in Fig. 3.
4. Background, Internal Stability and Linearity
of the IRMS System
4.1. Background
Background in the CF-IRMS is mainly dependent on quality
(purity level) of carrier gas (i.e. He gas and moisture levels
present in Helium tank. High backgrounds may impair
measurement inaccuracy and poor precision. In practice,
these back ground values will vary from lab to lab, depending
on the instrument configuration, the grade of gases used and
many other factors. In general, it is recommended to use
grade 5.5 (99.9995) He as a carrier gas in CF-IRMS. We
show here a typical and ideal background scan of our CF-
IRMS in Fig. 4. The observed background level for the water
(moisture) is 0.12 9 10-10 A which is less than the maxi-
mum permissible background level (as recommended in the
Isoprime 100 manual) for water (moisture) i.e. 5 9 10-10 A.
Similarly the observed background level for the N2
0.108 9 10-10 A, which is less than the maximum permis-
sible background level for N2 i.e. 1 9 10-10 A. The Ar and
CO2 levels are significantly lower than their respective per-
missible levels described in the Isoprime 100 manual which
are[1910-11 A for Ar and[5 9 10-11 A for CO2. Back-
ground levels may not significantly affect reference gas
stabilities, but may give rise to non-linearity effects and may
eventually lead higher analytical uncertainties.
4.2. Reference Gas Stability Tests
It is important to monitor the stability of the measurement
of the isotopic composition of the working gas on the daily
basis. The stability of internal continuous flow system is
determined using ten (or more) injections of each analyte
gas (e.g. N2, CO2 and SO2) at same pressure level (con-
trolled by mass-flow controllers in the reference gas box)
and isotopic abundances are measured. This set of mea-
surements is also known as ‘zero enrichment’ or ‘on–off’
test. The standard deviation (SD) of these ten measure-
ments are checked; if the analyte reference gases are
properly tuned a priori, in general SDs for all the reference
gases must be within 0.1 % for ensuring good (reproduc-
ible) isotopic measurements (Isoprime 100 manual). Here
we show typical stability test results of N2, CO2 and SO2
that show typical SDs as 0.01, 0.01 and 0.07 % respec-
tively (Fig. 5). Hence the actual stabilities achievable by
NPL-IRMS are better than maximum permissible limits.
Better tuning of reference gases and consistency of tem-
perature and relative humidity conditions in the IRMS lab
are key for achieving better stabilities and thereby more
precise isotopic measurements.
4.3. Reference Gas Linearity Tests
Reference gas linearity test is conducted in same way as
stability test except reference gas pressures are manually
changed from mass-flow controllers of reference gas box.
By changing the reference gas pressure, amount of analyte
gas and hence IRMS current is varied and isotopic mea-
surements are made. Measured isotopic values on varying
IRMS current are checked for stability which should be
within 0.1(%/nA). This exercise is normally not done in
routine running of CF-IRMS on daily basis, but has to be
conducted and checked periodically. The intensity of
working gas pulses must encompass the intensities of the
sample to be determined, i.e. if sample are measured in the
range 5,000–15,000 mV the linearity measurement should
cover the range 4,000–16,000 mV. We have shown here
typical linearity tests of N2, CO2 and SO2 which are 0.01,
0.02 and 0.01 respectively, as shown in Fig. 6. It isFig. 3 Typical chromatogram of a ‘Sulfanilamide standard’ run on
NPL-CFIRMS. Time in seconds
R. Agnihotri et al.
123

important to mention that linearity test in Isoprime mass-
spectrometer is not automatic and gas pressures have to be
altered manually. In the case of N2 and CO2, changing inlet
gas pressure is relatively simpler to manage compared to
the case of SO2 where it is little bit more time taking and
difficult to do in multiple steps as SO2 pressure adjustment
is not that easy manually.
4.4. Calibration of CNS Isotopic Data
The C and N mass concentrations and their isotopic mea-
surements (d15N, d13C) of NPL-CFIRMS were mainly
calibrated using an international standard i.e. e-Amino-n-
Caproic acid [C6H15NO2] that is generally known as ACA,
a laboratory standard used in School of Marine Science and
Technology, University of Massachusetts USA. This stan-
dard was acquired through the good offices of Prof. Mark
Altabet. Reported values of d15N and d13C are 4.6 and
-25.3 % respectively. Reference gas tanks were calibrated
initially by running several aliquots of ACA and then
offsets between actual isotopic values from those of mea-
sured values were estimated. The obtained offsets were
incorporated in Ionvontage software of CF-IRMS to obtain
calibrated isotopic values. We also used two other inter-
national standards viz. Japan-Glutamic acid (through the
good offices of Dr. VVSS Sarma of NIO, Vishakhapat-
nam), IAEA-N-2 and IAEA-CH-6 for which reported
(consensus) isotopic values are also known. We have
shown plots of measured and calibrated values of d15N and
d13C against respective reported values in Fig. 7. Likewise,
calibration of S content and d34S values was accomplished
using three international IAEA standards (IAEA-S-1;
IAEA-S-2 and IAEA-SO5; Fig. 7). The correlations (r2
values) obtained for all the isotopic measurements are
better than 0.9 (Fig. 7).
For developing an internal laboratory standard for
CNS isotopic measurements, we used solid powdered
Sulfanilamide (C6H8N2O2S). Contents of CNS are known
for this standard but isotopic values were not known. A
few aliquots of Sulfanilamide were always run in tandem
with aforementioned international standards and stan-
dardized isotopic values were obtained. The calibrated
isotopic values of d15N, d13C and d34Svalues are -1.03,
-27.29 and 1.23 % respectively. We have shown sta-
bility of nine Sulfanilamide runs made on single day in
the (Fig. 8a).
4.5. Blank Determination
In the CNS isotopic analysis by CF-IRMS, it is important
to ascertain blank levels. Procedure of blank determination
is decided by type of sample. For example, in case of solid
soil, sediment or dust samples, a few empty cleaned tin
cups are just packed and run as samples. Whereas, for
aerosol samples collected on quartz filers, same size ali-
quots of pre-combusted quartz filters are packed in clean
cups and run as samples.
We always run a few (at least 2–3) pellets made with
empty tin cups as blank in the beginning of analysis.
Generally no detectable blanks are seen in the
Fig. 4 A typical ‘background’
run measured on 12-09-2013
Experimental Setup and Standardization of a Continuous Flow Stable Isotope Mass Spectrometer
123

chromatogram for the empty tin cups, nonetheless, CNS
areas measured on TCD of Pyrocube EA are corrected by
mean values of at least two blank runs. For analysis of
aerosol samples, field blanks of quartz filters are also cut
into same size of hole-punches (/ = 1 cm) and packed in
tin cup to make pellets. These pellets are run in similar way
as samples. Important to note that, blank levels are sig-
nificantly influenced by purity levels of He and O2 used for
isotopic analysis. Blank filter aliquots often show detect-
able peaks on TCD which are equivalent to *0.02 and
0.11 lmol of N, 0.2–0.6 lmol of C, and 0.06–0.11 lmol of
S, which are generally at least 10–12 times smaller than the
minimum analyte signals of CNS typically measured.
Therefore we did make blank corrections for estimating
final TN, TC, TS mass concentrations using mean blank
filter values. We carried out blank correction for d15N
measurements especially samples containing N \ 2 lmol
(described in detail in the Sect. 9; amount effect). For the
isotopic data of d13C and d34S, however, we have not made
any blank correction.
4.6. Long Term Reproducibility of the Instrument
For the long term stability of isotopic measurements we
show here the results of in-house laboratory standard
(Sulfanilamide) as several aliquots of it were always run
along with all types of samples. Figure 8b shows average
values of d15N, d13C, d34S obtained on each day of
instrument run along with respective ranges (shown as
uncertainty bars) and their long term means. Presented data
do not show any evidence of a systematic drift or trend and
overall uncertainties (1r standard deviations) are well
within reportable uncertainties on the isotopic measure-
ments (i.e. 0.2–0.3 %).
Fig. 5 Typical chromatogram of reference gas stability a N2, b CO2 and c SO2
R. Agnihotri et al.
123

4.7. Effect of Amount on CNS Isotopic Measurements
Amount or size effect on N isotope measurements is known
to be significant especially in samples having lower amount
of N [22, 23]. The reason for this is (i) in general, the
amount of N in natural samples is much lesser (*7–50
times) than that of C content and (ii) He tanks used for
supplying pure He as carrier gas are prone to have some
background levels of N2. Therefore it is necessary to
understand and correct for size effect on N isotopic mea-
surements to achieve better accuracy. As it is little difficult
to make standards containing low N (\2 lmol) gravimet-
rically, we used dissolved ACA solution to obtain N
standards containing 0.5, 1, 2 and 4 lmol of N. For this
known weight of solid ACA was dissolved in known vol-
ume of deionized water in such a way that 100 ll of the
solution contains 4 lmol of N and 24 lmol of C. Then 100,
50, 25 and 12.5 ll volumes of the dissolved ACA solution
Fig. 6 Typical chromatograms
of linearity a for N2, b for CO2
and c for SO2. Linearity was
conducted by varying inlet
pressures of analyte gases from
8 to 20 psi. For N2 and CO2
pressures were increased at
smaller steps, inlet pressure
could only be increase at two
steps in case of SO2
Fig. 7 Calibration of CNS isotopic measurements against international standard results for accuracy
Experimental Setup and Standardization of a Continuous Flow Stable Isotope Mass Spectrometer
123

were pipetted on pre-combusted quartz (or GF/F) filter
punches (of diameter *1 cm) and left for overnight
evaporation. Next day dried filter papers containing dif-
ferent amounts of N and C were packed in circular pre-
cleaned Tin cups and transformed into pellets. Amount or
size effects on C, N isotopic measurements were estimated
by running these dried ACAs which correspond to 0.5, 1.0,
2.0 and 4.0 lmol of N and 3, 6, 12 and 24 lmol of C.
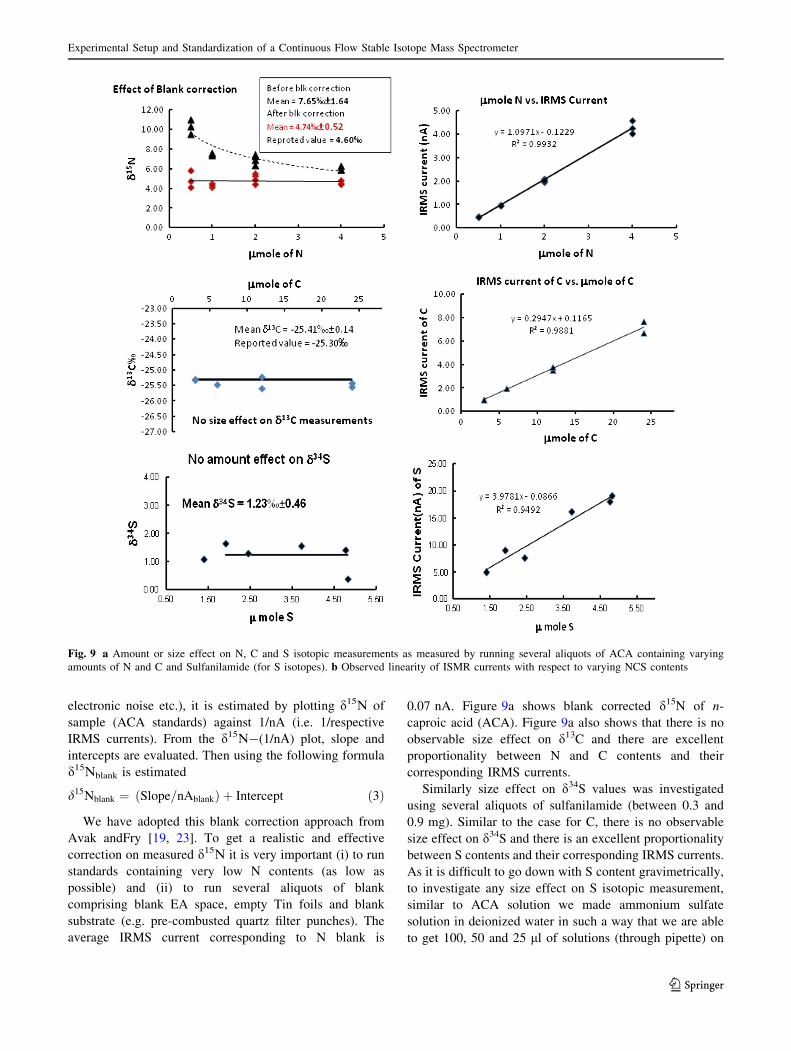
Figure 9 shows the obtained results. As can be seen lower
amounts of N tend to overestimate d15N significantly. It
was decided to carry out blank correction using following
equation.
d15Ncorrected ¼ d15Nsample� nAsample
� ���
�ðnAblank � d15Nblank
�= nAsample� nAblank
� ��
ð2Þ
where nA stands for measured IRMS current for sample or
blank. As d15Mblank could be highly variable (due to several
factors like difficulties in integrating small peak, internal
Fig. 8 a Depiction of reproducibility achieved by running different
aliquots of internal laboratory standard Sulfanilamide made on single
day. b Stability of isotopic values measured by sulfanilamide runs
(*3–8 aliquots were run on each day of analysis) on different days
from March–September 2013
R. Agnihotri et al.
123
electronic noise etc.), it is estimated by plotting d15M of
sample (ACA standards) against 1/nA (i.e. 1/respective
IRMS currents). From the d15M-(1/nA) plot, slope and
intercepts are evaluated. Then using the following formula
d15Mblank is estimated
d15Nblank ¼ Slope=nAblankð Þ þ Intercept ð3Þ
We have adopted this blank correction approach from
Avak andFry [19, 23]. To get a realistic and effective
correction on measured d15M it is very important (i) to run
standards containing very low N contents (as low as
possible) and (ii) to run several aliquots of blank
comprising blank EA space, empty Tin foils and blank
substrate (e.g. pre-combusted quartz filter punches). The
average IRMS current corresponding to N blank is
0.07 nA. Figure 9a shows blank corrected d15N of n-
caproic acid (ACA). Figure 9a also shows that there is no
observable size effect on d13C and there are excellent
proportionality between N and C contents and their
corresponding IRMS currents.
Similarly size effect on d34S values was investigated
using several aliquots of sulfanilamide (between 0.3 and
0.9 mg). Similar to the case for C, there is no observable
size effect on d34S and there is an excellent proportionality
between S contents and their corresponding IRMS currents.
As it is difficult to go down with S content gravimetrically,
to investigate any size effect on S isotopic measurement,
similar to ACA solution we made ammonium sulfate
solution in deionized water in such a way that we are able
to get 100, 50 and 25 ll of solutions (through pipette) on
Fig. 9 a Amount or size effect on N, C and S isotopic measurements as measured by running several aliquots of ACA containing varying
amounts of N and C and Sulfanilamide (for S isotopes). b Observed linearity of ISMR currents with respect to varying NCS contents
Experimental Setup and Standardization of a Continuous Flow Stable Isotope Mass Spectrometer
123

pre-combusted quartz filters corresponding to 4, 2 and
1 lmol of S respectively. Results of these aliquots on EA-
IRMS are shown in Fig. 10. As can be seen from the
Fig. 10, there is no apparent size or amount effect on the
measured d34S and as expected there is an excellent pro-
portionality between S content (in lmol) and correspond-
ing IRMS current. We recommend here therefore, in case
of only N isotopic measurements, blank correction are
necessary especially for sample containing low N contents
(\2 lmol of N i.e. *20 lg of N).
We also checked the sensitivities of Pyrocube EA’s
thermal conductivity detector (TCD) and respective IRMS
currents for all the three analytes gases N2, CO2 and SO2.
Figure 11 shows excellent ‘proportionality’ between the
two detection techniques, hence any of them (or both) can
be used for accurate and precise determination of elemental
concentrations.
4.8. Concluding Remarks and Scope of Future Work
Thus, we show the experimental setup of a newly estab-
lished CF-IRMS facility in RASD for isotopic measure-
ments of C, N and S along with their concentrations in
variety of natural (environmental) and synthetic carbona-
ceous and sulfur containing samples. Accuracies and pre-
cisions of the instrument were checked with several
international and in-house isotopic standards. Generated
data clearly shows overall reproducibility of C, N, S iso-
topic measurements are within to 0.2–0.3 %. In addition,
on-line production of analyte gases viz. N2, CO2 and SO2
by Purocube EA coupled with Isoprime 100 IRMS in
continuous flow mode is capable of yielding high sample
throughput (*40–80 samples per day) without any sig-
nificant drift. Long-term running of laboratory standard
Sulfanilamide do not show any systematic trends and sta-
bility for all C, N and S isotopes is close to practical pre-
cision achievable on these isotopic data (0.2–0.3 %).
Even though aforementioned blank correction appears to
work for d15N measurements for better accuracy and
precision, we believe better quality of Helium carrier gas
and high purity O2 can significantly reduce amount of
blank. This will help for accurate and precise isotopic
measurements of specific environmental samples contain-
ing very low amounts of N as may be the case for aerosols
over polar or high altitude regions. Following aforemen-
tioned experimental protocol, N, C and S isotopic
Fig. 10 Analysis of (NH4)2SO4 solution (dried aliquots on pre-combusted filter punches) showing no size or amount effect on measurement of
d34S and excellent proportionality between S content (in lmol) and corresponding IRMS current
Fig. 11 Comparison of thermal conductivity detector (TCD)
response against IRMS current for all three analytes gases N2, CO2
and SO2. Plots show that variable of response of TCD is linear with
respect to that of proportional IRMS current
R. Agnihotri et al.
123
measurements coupled with their concentrations can pro-
vide useful information in several atmospheric pollution
studies and related ones (e.g. [24–26].
Acknowledgments Authors are thankful to Prof. R.C. Budhani,
Director NPL for his keen interest and encouragement in the above
work. The work reported in the paper is a part of project sanctioned
by the CSIR under its XII 5 Year Plan network project ‘AIM_IG-
PHim (PSC-0112)’. Authors do acknowledge the support and tech-
nical help provided by Mr. Gaurav Kothiyal, Mr. Rob Estbury and
Mr. Mike Seed (from Isoprime India and UK) during installation and
thereafter. We also thank Prof. Mark Altabet (University of Massa-
chusetts, Dartmouth USA) and Dr. VVSS Sarma for kindly providing
their reference CN isotopic standards for calibration purpose.
References
[1] M.V.S.N. Prasad, C. Sharma, B.C. Arya, T.K. Mandal, S. Singh,
M.J. Kulshrestha, R. Agnihotri, S.K. Mishra, S.K. Sharma,
Experimental facilities to monitor various types of atmospheric
parameters in the Radio and Atmospheric Sciences Division
(RASD) of CSIR-National Physical Laboratory, MAPAN-J.
Metrol. Soc. India, 28(3) (2013) 193–203, doi: 10.1007/
s12647-013-0067-8.
[2] S. Doney, N. Mahowald, I. Lima R. Feeley and F. Mackenzie,
Impact of anthropogenic atmospheric nitrogen and sulfur
deposition ocean acidification and the inorganic carbon system,
Proc. Natl. Acad. Sci., (2007) doi:10.1073/pnas.0702218104.
[3] R.A. Duce et al., Impacts of atmospheric anthropogenic nitrogen
on the open ocean, Science, 320 (2008) 893–897, doi:
10.1126/science.115036.
[4] J. Galloway, A. Townsend, J. Erisman, M. Bekunda and Z. Cai
et al., Transformation of the nitrogen cycle: recent trends,
questions and potential solutions, Science, 320 (2008) 889–92.
[5] B. Srinivas, M.M. Sarin, and V.V.S.S. Sarma, Atmospheric dry
deposition of inorganic and organic nitrogen to the Bay of
Bengal: impact of continental outflow, Mar. Chem., 127 (2011)
170–179.
[6] M.A. Altabet, M.J. Higginson, and D W. Murray, The effect of
millennial-scale changes in Arabian Sea denitrification on
atmospheric CO2, Nature, 415 (2002) 159–162.
[7] M.A. Altabet, Isotopic tracers of the marine nitrogen cycle, In:
Marine organic matter: chemical and biological markers edited
by J. Volkman, vol. 2 of ‘‘The Handbook of Environmental
Chemistry’’, Editor-in-Chief: O. Hutzinger, (2005), doi:
10.1007/698_2_008.
[8] R. Agnihotri, S.K. Bhattacharya, M.M. Sarin and B.L.K. So-
mayajulu. Changes in surface productivity, sub-surface denitri-
fication and SW monsoon during the Holocene: a multi proxy
record from the eastern Arabian Sea, The Holocene, 13 (2003),
701–713.
[9] R. Agnihotri, Mark A. Altabet, and T.D. Herbert, Influence of
marine denitrification on atmospheric N2O variability during the
Holocene, Geophy. Res. Lett., 33 (2006) L13704, doi:
10.1029/2006GL025864.
[10] R. Agnihotri, S. Kurian, M. Fernandes, K. Reshma, W.D’ Souza,
S.W.A. Naqvi, Variability of subsurface denitrification and
surface productivity in the coastal eastern Arabian Sea over the
past seven centuries, The Holocene, 18(5) (2008a) 755–764, IF:
2.481.
[11] R. Agnihotri, M.A. Altabet, T.D. Herbert, J.E. Tierney, Ultra
high-resolution paleoceanography of the Peru margin during the
last two millennia, Geophys. Geochem. Geosyst., 9 (2008b)
Q05013, doi:10.1029/2007GC001744, IF: 2.979.
[12] O. Hadas, M.A. Altabet, R. Agnihotri, Seasonally varying N
isotope biogeochemistry in Lake Kinneret, Israel, Limnology.
Oceanography, 54 (2009) 75–85.
[13] R. Agnihotri, T.K. Mandal, S. Karapurkar, M. Naja, R. Gadi,
Y.N. Ahammed, A. Kumar, T. Saud, and M. Saxena, Stable
carbon and nitrogen isotopic composition of bulk aerosols over
India and Northern Indian Ocean, Atmospheric Environ., 45(2011) 2828–2835.
[14] C.M. Pavuluri, K. Kawamura, T. Swaminathan, and E. Tachi-
bana, Stable carbon isotopic compositions of total carbon,
dicarboxylic acids and glyoxylic acid in the tropical Indian
aerosols: Implications for sources and photochemical processing
of organic aerosols, J. Geophys. Res., 116 (2011) D18307, doi:
10.1029/2011JD015617.
[15] C.M. Pavuluri, K. Kawamura, E. Tachibana, and T. Swamina-
than, Elevated nitrogen isotope ratios of tropical Indian aerosols
from Chennai: implication for the origins of aerosol nitrogen in
South and Southeast Asia. Atmospheric Environ., 44 (2010)
3597–3604.
[16] S.G. Aggrawal, K. Kawamura, G.S. Umarji, E. Tachibana, R.S.
Patil and P.K. Gupta, Organic and inorganic markers and stable
C-, N-isotopic compositions of tropical coastal aerosols from
megacity Mumbai: sources of organic aerosols and atmospheric
processing, Atmospheric Chem. Phys., 13 (2013) 4667–4680.
[17] T. Hansen et al., Simultaneous d15N, d13C and d34S measure-
ments of low biomass samples using a technically advanced high
sensitivity elemental analyzer connected to an isotope ratio mass
spectrometer, Rapid Commun. Mass Spectrom., 23 (2009)
2521–2527.
[18] A.L. Norman, L.A. Barrie, D. Toom-Sauntry, A. Sirois, H.R.
Krouse, S.M. Li, and S. Sharma, Sources of aerosol sulphate at
Alert: Apportionment using stable isotopes, J. Geophys. Res.,
104 (D9) (1999) 11619–11631, doi:10.1029/1999JD900078.
[19] R. Bhushan, K. Dutta, and B L.K. Somayajulu, Concentrations
and burial fluxes of organic and inorganic carbon on the eastern
margins of the Arabian Sea, Mar. Geol. 178 (2001), 95–11.
[20] S.G. Aggarwal, Recent developments in aerosol measurements
techniques and the metrological issue, MAPAN-J. Metrol. Soc.
India, 25(3) (2010) 165–189.
[21] S.G. Karapurkar, A. Methar, and R. Agnihotri, Measurement of
C and N isotopes of geological samples using Delta V Plus
Stable Isotope Ratio Mass Spectrometer via different prepara-
tory systems. Technical report published by National Institute of
Oceanography, NIO/TR-02, (2008).
[22] H. Avak and B. Fry, EA-IRMS: Precise and Accurate Mea-
surement of d15 N on\10 lg N, Application Flash Report No.
G 29 (1999).
[23] B. Fry, Coupled N, C and S isotopic measurements using a dual
column gas chromatography system. Rapid Commun. Mass
Spectrom., 21 (2007), 750–756, doi: 10.1002/rcm.2892.
[24] A.C. Llyod and G. Bansal, Emissions from transportation and
fuels: the importance of initial and real world measurements for
policy making in India, MAPAN-J. Metrol. Soc. India, 28(3)
(2013) 227–234, doi: 10.1007/s12647-013-0065-x.
[25] M. Ferm, J. Watt, S. O’hanlon, F. De Santis, and C. Varotsos.
Deposition measurement of particulate matter in connection
with corrosion studies, Anal. Bioanal. Chem., 384 (2006)
1320–1330.
[26] M. Ferm, F. De Santis and C. Varotsos, Nitric acid measure-
ments in connection with corrosion studies, Atmospheric Envi-
ron., 39 (2005) 6664–6672.
Experimental Setup and Standardization of a Continuous Flow Stable Isotope Mass Spectrometer
123