Experimental investigation of the tribological behaviour of carbon and low-alloy steels sliding...
8
Mechanics & Industry c AFM, EDP Sciences 2014 DOI: 10.1051/meca/2014076 www.mechanics-industry.org Mechanics & Industry Experimental investigation of the tribological behaviour of carbon and low-alloy steels sliding against HSS Riadh Autay a , Mounir Kchaou and Fakhreddine Dammak Laboratory of Mechanics, Modeling and Production (LA2MP), National Engineering School of Sfax, University of Sfax, Route Soukra km 3.5, B.P 1173, 3038 Sfax, Tunisia Received 29 June 2014, Accepted 18 September 2014 Abstract – ISO 42CrMo4 low-alloy steel and ISO C45 carbon steel are commonly used in the manufacture of mechanical parts, which are continuously subjected to friction and wear. The effect of microstructure changes during functioning on the tribological behaviour of these steels was evaluated under unlubricated and reciprocating sliding conditions. The diverse microstructures are obtained by varying the heat treat- ment conditions. The mechanical behaviour of the diverse obtained microstructures was investigated via hardness measurements and tensile tests. Results showed that there is no correlation between friction properties and mechanical ones. Wear properties depend on hardness but no correlation is obtained be- tween wear properties and work hardening ones. Increasing normal load decreased friction properties but increased wear properties. Key words: Low-alloy steel / carbon steel / microstructure / hardness / friction coefficient / friction energy / wear volume / wear coefficient Nomenclature A% Elongation at break (%) b Worn track width (mm) D Cylinder diameter (mm) E Total energy (J) F Applied load (N) Fn Normal force (N) Ft Friction force (N) HV Vickers hardness of studied steel (N.mm −2 ) K Archard wear coefficient (dimensionless) L Sliding distance (mm) n Work hardening coefficient (dimensionless) Rm Ultimate strength (MPa) Rp0.2 Offset yield strength or proof stress (MPa) Rm−Rp0.2 Hardening capacity (MPa) l Worn track length (mm) v Average sliding speed (m.s −1 ) V Worn volume (mm 3 ) Z% Reduction in cross sectional area (%) Zu% Elongation due to necking (%) μ Friction coefficient (dimensionless) a Corresponding author: [email protected] 1 Introduction 1 When two surfaces are in relative sliding most of the 2 friction work is converted into heat. The significant rise in 3 temperature can change the metallurgical and mechanical 4 properties of sliding surfaces and eventually their tribo- 5 logical behaviour. Predicting the impact of microstruc- 6 tural changes on friction and wear behaviours can be 7 performed by a tribological study of some typical mi- 8 crostructures obtained via different heat treatment meth- 9 ods. Rai et al. [1] studied wear behaviour of different mi- 10 crostructures of Ni-Cr-Mo-V steel, and considered that 11 such study may provide a better understanding of the 12 basic modes and mechanisms of wear and help in proper 13 selection of typical-structured-steel for particular applica- 14 tion. Shaeri et al. [2] investigated the effect of austemper- 15 ing and martempering heat treatments on wear behaviour 16 of Cr-Mo steel (FMU-226). Das et al. [3] studied AISI 17 D2 steel and attempted to correlate microstructure with 18 wear behaviour of deep cryogenically treated specimens 19 with reference to that of conventional heat treatment and 20 cold treatment. Kumar et al. [4] studied the effect of two 21 microstructures (fine pearlite with small amount of fer- 22 rite and tempered martensite with cementite) on wear 23 behaviour of a medium carbon steel. Abouei et al. [5] com- 24 pared wear and friction characteristics of a plain carbon 25 dual phase steel (hard martensite island embedded in a 26 Article published by EDP Sciences
Transcript of Experimental investigation of the tribological behaviour of carbon and low-alloy steels sliding...
Mechanics & Industryc© AFM, EDP Sciences 2014DOI: 10.1051/meca/2014076www.mechanics-industry.org
Mechanics&Industry
Experimental investigation of the tribological behaviourof carbon and low-alloy steels sliding against HSS
Riadh Autaya, Mounir Kchaou and Fakhreddine Dammak
Laboratory of Mechanics, Modeling and Production (LA2MP), National Engineering School of Sfax, University of Sfax,Route Soukra km 3.5, B.P 1173, 3038 Sfax, Tunisia
Received 29 June 2014, Accepted 18 September 2014
Abstract – ISO 42CrMo4 low-alloy steel and ISO C45 carbon steel are commonly used in the manufactureof mechanical parts, which are continuously subjected to friction and wear. The effect of microstructurechanges during functioning on the tribological behaviour of these steels was evaluated under unlubricatedand reciprocating sliding conditions. The diverse microstructures are obtained by varying the heat treat-ment conditions. The mechanical behaviour of the diverse obtained microstructures was investigated viahardness measurements and tensile tests. Results showed that there is no correlation between frictionproperties and mechanical ones. Wear properties depend on hardness but no correlation is obtained be-tween wear properties and work hardening ones. Increasing normal load decreased friction properties butincreased wear properties.
Key words: Low-alloy steel / carbon steel / microstructure / hardness / friction coefficient / frictionenergy / wear volume / wear coefficient
Nomenclature
A% Elongation at break (%)b Worn track width (mm)D Cylinder diameter (mm)E Total energy (J)F Applied load (N)Fn Normal force (N)Ft Friction force (N)HV Vickers hardness of studied steel (N.mm−2)K Archard wear coefficient (dimensionless)L Sliding distance (mm)n Work hardening coefficient (dimensionless)Rm Ultimate strength (MPa)Rp0.2 Offset yield strength or proof stress (MPa)Rm−Rp0.2 Hardening capacity (MPa)l Worn track length (mm)v Average sliding speed (m.s−1)V Worn volume (mm3)Z% Reduction in cross sectional area (%)Zu% Elongation due to necking (%)µ Friction coefficient (dimensionless)
a Corresponding author: [email protected]
1 Introduction 1
When two surfaces are in relative sliding most of the 2
friction work is converted into heat. The significant rise in 3
temperature can change the metallurgical and mechanical 4
properties of sliding surfaces and eventually their tribo- 5
logical behaviour. Predicting the impact of microstruc- 6
tural changes on friction and wear behaviours can be 7
performed by a tribological study of some typical mi- 8
crostructures obtained via different heat treatment meth- 9
ods. Rai et al. [1] studied wear behaviour of different mi- 10
crostructures of Ni-Cr-Mo-V steel, and considered that 11
such study may provide a better understanding of the 12
basic modes and mechanisms of wear and help in proper 13
selection of typical-structured-steel for particular applica- 14
tion. Shaeri et al. [2] investigated the effect of austemper- 15
ing and martempering heat treatments on wear behaviour 16
of Cr-Mo steel (FMU-226). Das et al. [3] studied AISI 17
D2 steel and attempted to correlate microstructure with 18
wear behaviour of deep cryogenically treated specimens 19
with reference to that of conventional heat treatment and 20
cold treatment. Kumar et al. [4] studied the effect of two 21
microstructures (fine pearlite with small amount of fer- 22
rite and tempered martensite with cementite) on wear 23
behaviour of a medium carbon steel. Abouei et al. [5] com- 24
pared wear and friction characteristics of a plain carbon 25
dual phase steel (hard martensite island embedded in a 26
Article published by EDP Sciences
2 R. Autay et al.: Mechanics & Industry
Table 1. Chemical compositions of as-received steels and HSS (wt. %).
C Mn Si S P Cr Mo Ni Cu Al V WC45 0.45 0.76 0.34 0.036 0.034 0.19 0.019 0.056 0.043 0.021 – –
42CrMo4 0.42 0.78 0.28 0.031 0.009 0.97 0.19 – – – – –SW9M2S 0.95 0.4 0.7 <0.02 <0.02 4.5 2 – – – 1.8 9
Table 2. Process conditions and specimens hardnesses.
Methods Code Conditions HVC45 42CrMo4
Untreated NT – 208 373Normalizing N Heating at 870 ◦C for 30 min/Cooling in Air 210 328Quenching WQ Heating at 850 ◦C for 30 min/Cooling in Water 608 664Quenching OQ Heating at 850 ◦C for 30 min/Quenching in Oil 275 588Tempering WQT WQ/200 ◦C for 120 min/Quenching in Air 538 545Tempering OQT OQ/200 ◦C for 120 min/Quenching in Air 265 496
ductile ferrite matrix) with those observed in plain carbon1
normalized (pearlite and ferrite) and hardened (marten-2
site structure only) steels. Garcia et al. [6] compared3
abrasive wear resistance of an austenitic manganese steel4
subjected to diverse thermal treatments. Wang et al. [7]5
studied wear behaviour of 52 100 and 1080 steels with6
different microstructures in dry sliding conditions and7
showed that wear resistance of different microstructures8
is increased in the following order: martensite + car-9
bide + retained austenite, spheroidized structure (ferrite10
plus spheroidized cementite), martensite, bainite, lamel-11
lar pearlite. In this context, tribological study is con-12
ducted on a carbon steel and a low-alloy steel, which are13
commonly used in the manufacture of mechanical parts14
such as shafts, bearings, gears, cams [8]. . . etc. Such me-15
chanical parts have a contact surface continuously evolv-16
ing over time due to friction and wear. This study is a17
contribution in the good understanding of the tribolog-18
ical behaviour of such engineering steels when a harder19
material, such as HSS, is used as counterpart.20
2 Experimental data21
The materials of investigation are the ISO C45 car-22
bon steel and the ISO 42CrMo4 low-alloy steel. HSS23
(SW9M2S) was employed as counterpart. The reason for24
utilising HSS as a counter material was essentially its25
high hardness. The chemical compositions of the three26
steels are presented in Table 1. The studied steels were27
subjected to different heat treatments. The process con-28
ditions and the obtained hardnesses are given in Ta-29
ble 2. The hardness measurements are carried out on a30
VH6-L semi-automatic Vickers durometer under load of31
10 N and dwell time of 5 s. Three indentations are made32
at least for each specimen. The measurements are done33
along a cross section at different positions and an aver-34
age value was calculated. After treatments, the specimens35
were ground, polished and etched with Nital 5%, in order36
to obtain suitable surface for their microscopic exami-37
nation. The microstructure of studied steels was exam-38
ined using a Carl Zeiss optical microscope. The surface39
Table 3. Conditions of the friction tests.
Normal loads (N) 22.7/42.7/62.7Hertzian pressures (MPa) ≈59/81/98Frequency of oscillation 1 Hz
Oscillating stroke 10 mmSliding duration ≥120 min
Acquisition 32 s−1
Roughness (Ra) 0.2 ± 0.05 µmRelative humidity ≈40%
roughness was evaluated before and after friction test 40
using a DIAVITE DH-7 profilometer. Tensile tests are 41
carried out using a Lloyd Instruments machine (50 kN 42
load cell) at 5 mm.min−1 elongation speed. Three tests 43
were carried out and an average value was calculated for 44
each microstructure. Cylindrical specimens are employed; 45
their shapes and dimensions are taken in accordance with 46
standard NF EN 10002-1. Tensile tests were carried out 47
without using an extensometer. Consequently, a varied 48
elastic modulus is noticed. In this study, we are not in- 49
terested by elastic modulus, which depends on the elon- 50
gation (and then the use of an extensometer) but only 51
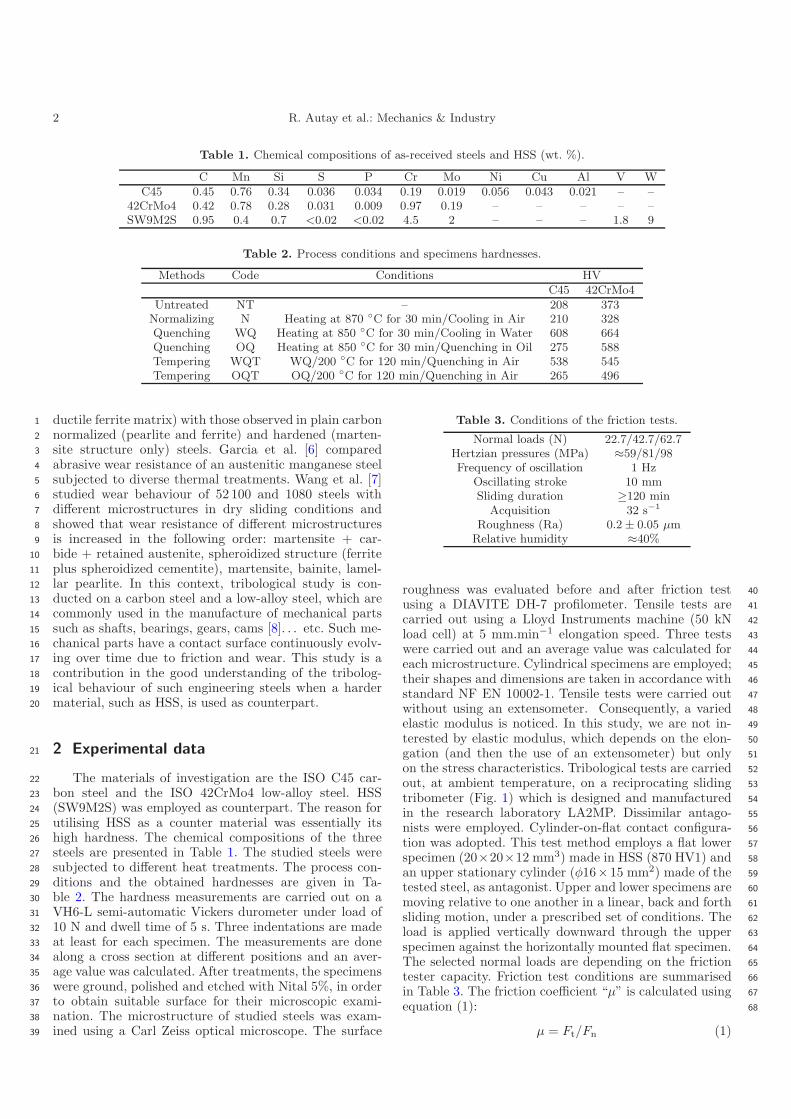
on the stress characteristics. Tribological tests are carried 52
out, at ambient temperature, on a reciprocating sliding 53
tribometer (Fig. 1) which is designed and manufactured 54
in the research laboratory LA2MP. Dissimilar antago- 55
nists were employed. Cylinder-on-flat contact configura- 56
tion was adopted. This test method employs a flat lower 57
specimen (20×20×12 mm3) made in HSS (870 HV1) and 58
an upper stationary cylinder (φ16×15 mm2) made of the 59
tested steel, as antagonist. Upper and lower specimens are 60
moving relative to one another in a linear, back and forth 61
sliding motion, under a prescribed set of conditions. The 62
load is applied vertically downward through the upper 63
specimen against the horizontally mounted flat specimen. 64
The selected normal loads are depending on the friction 65
tester capacity. Friction test conditions are summarised 66
in Table 3. The friction coefficient “μ” is calculated using 67
equation (1): 68
μ = Ft/Fn (1)
R. Autay et al.: Mechanics & Industry 3
Fig. 1. Reciprocating friction tester and contact configuration.
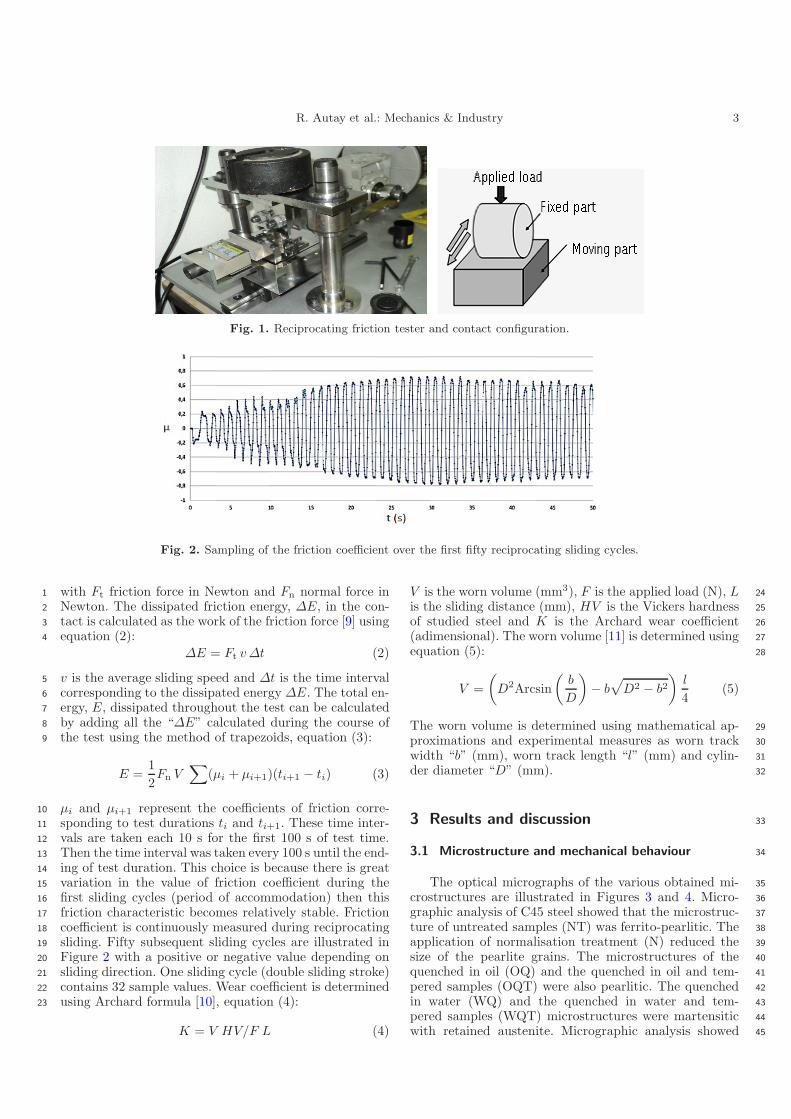
Fig. 2. Sampling of the friction coefficient over the first fifty reciprocating sliding cycles.
with Ft friction force in Newton and Fn normal force in1
Newton. The dissipated friction energy, ΔE, in the con-2
tact is calculated as the work of the friction force [9] using3
equation (2):4
ΔE = Ft v Δt (2)
v is the average sliding speed and Δt is the time interval5
corresponding to the dissipated energy ΔE. The total en-6
ergy, E, dissipated throughout the test can be calculated7
by adding all the “ΔE” calculated during the course of8
the test using the method of trapezoids, equation (3):9
E =12Fn V
∑(μi + μi+1)(ti+1 − ti) (3)
μi and μi+1 represent the coefficients of friction corre-10
sponding to test durations ti and ti+1. These time inter-11
vals are taken each 10 s for the first 100 s of test time.12
Then the time interval was taken every 100 s until the end-13
ing of test duration. This choice is because there is great14
variation in the value of friction coefficient during the15
first sliding cycles (period of accommodation) then this16
friction characteristic becomes relatively stable. Friction17
coefficient is continuously measured during reciprocating18
sliding. Fifty subsequent sliding cycles are illustrated in19
Figure 2 with a positive or negative value depending on20
sliding direction. One sliding cycle (double sliding stroke)21
contains 32 sample values. Wear coefficient is determined22
using Archard formula [10], equation (4):23
K = V HV/F L (4)
V is the worn volume (mm3), F is the applied load (N), L 24
is the sliding distance (mm), HV is the Vickers hardness 25
of studied steel and K is the Archard wear coefficient 26
(adimensional). The worn volume [11] is determined using 27
equation (5): 28
V =(
D2Arcsin(
b
D
)− b
√D2 − b2
)l
4(5)
The worn volume is determined using mathematical ap- 29
proximations and experimental measures as worn track 30
width “b” (mm), worn track length “l” (mm) and cylin- 31
der diameter “D” (mm). 32
3 Results and discussion 33
3.1 Microstructure and mechanical behaviour 34
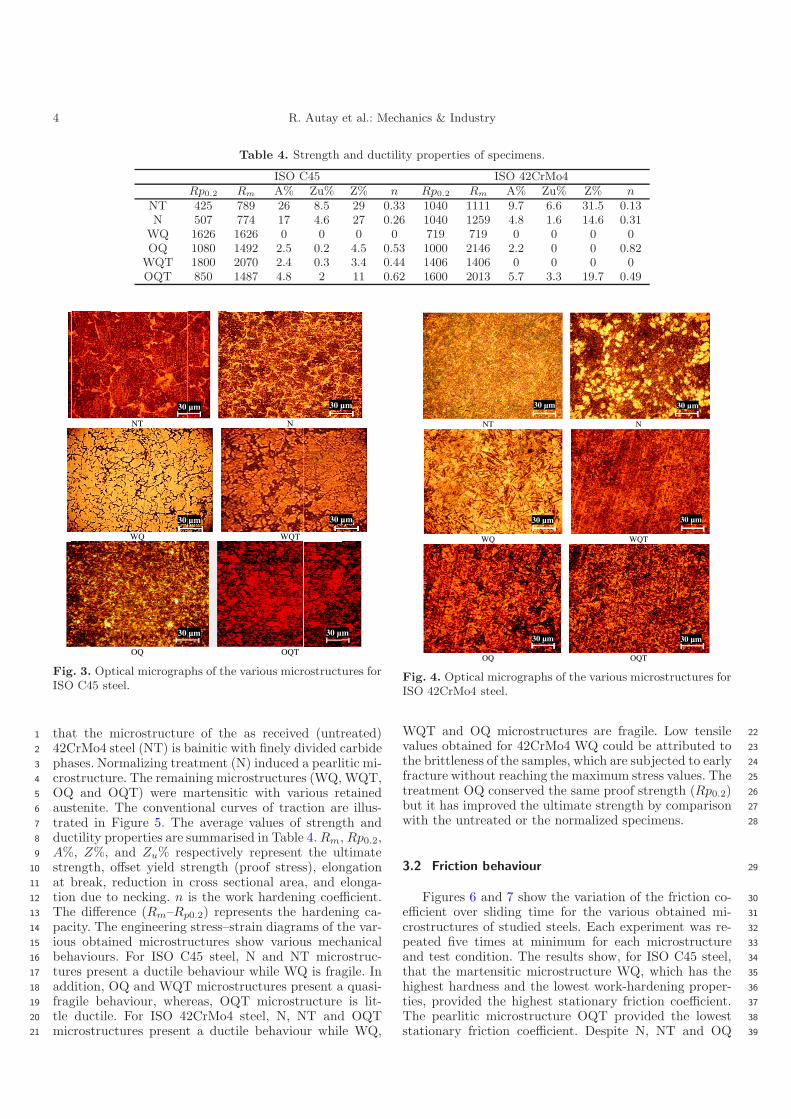
The optical micrographs of the various obtained mi- 35
crostructures are illustrated in Figures 3 and 4. Micro- 36
graphic analysis of C45 steel showed that the microstruc- 37
ture of untreated samples (NT) was ferrito-pearlitic. The 38
application of normalisation treatment (N) reduced the 39
size of the pearlite grains. The microstructures of the 40
quenched in oil (OQ) and the quenched in oil and tem- 41
pered samples (OQT) were also pearlitic. The quenched 42
in water (WQ) and the quenched in water and tem- 43
pered samples (WQT) microstructures were martensitic 44
with retained austenite. Micrographic analysis showed 45
4 R. Autay et al.: Mechanics & Industry
Table 4. Strength and ductility properties of specimens.
ISO C45 ISO 42CrMo4Rp0.2 Rm A% Zu% Z% n Rp0.2 Rm A% Zu% Z% n
NT 425 789 26 8.5 29 0.33 1040 1111 9.7 6.6 31.5 0.13N 507 774 17 4.6 27 0.26 1040 1259 4.8 1.6 14.6 0.31
WQ 1626 1626 0 0 0 0 719 719 0 0 0 0OQ 1080 1492 2.5 0.2 4.5 0.53 1000 2146 2.2 0 0 0.82
WQT 1800 2070 2.4 0.3 3.4 0.44 1406 1406 0 0 0 0OQT 850 1487 4.8 2 11 0.62 1600 2013 5.7 3.3 19.7 0.49
NT
WQ
OQ
30
30
30
µm
µm
µm
N
WQT
OQT
30 µ
30 µ
30 µm
µm
µm
m
Fig. 3. Optical micrographs of the various microstructures forISO C45 steel.
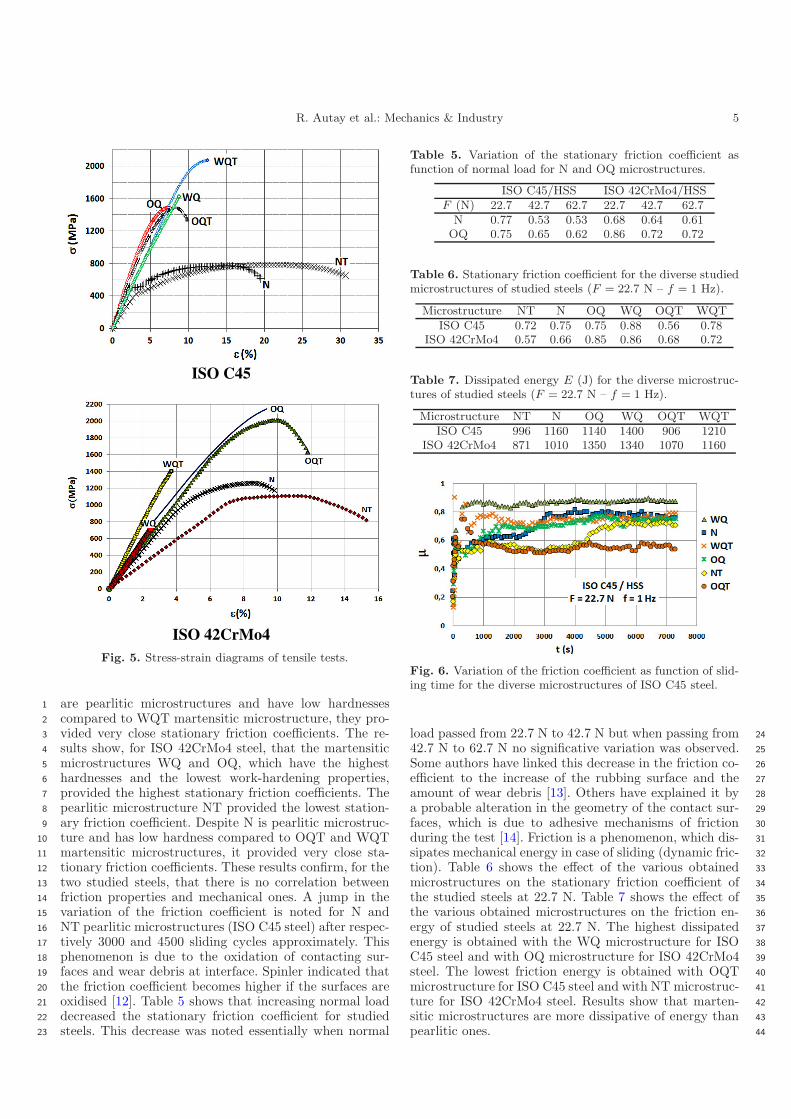
that the microstructure of the as received (untreated)1
42CrMo4 steel (NT) is bainitic with finely divided carbide2
phases. Normalizing treatment (N) induced a pearlitic mi-3
crostructure. The remaining microstructures (WQ, WQT,4
OQ and OQT) were martensitic with various retained5
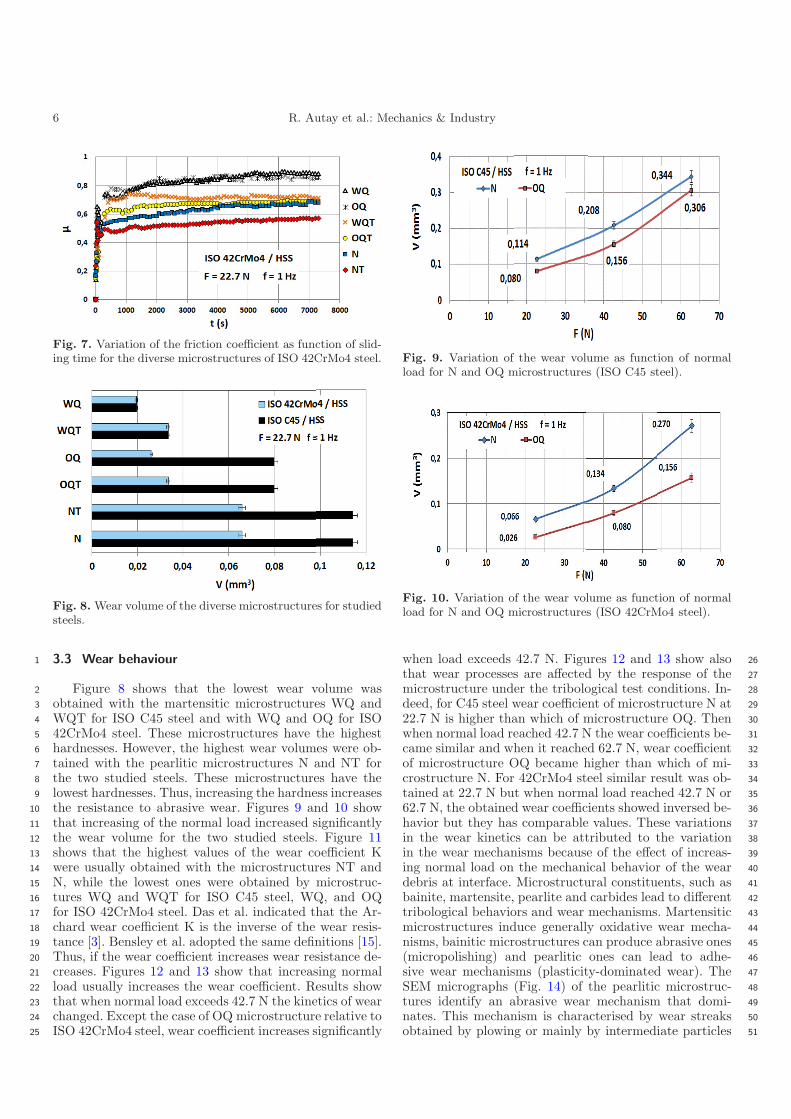
austenite. The conventional curves of traction are illus-6
trated in Figure 5. The average values of strength and7
ductility properties are summarised in Table 4. Rm, Rp0.2,8
A%, Z%, and Zu% respectively represent the ultimate9
strength, offset yield strength (proof stress), elongation10
at break, reduction in cross sectional area, and elonga-11
tion due to necking. n is the work hardening coefficient.12
The difference (Rm–Rp0.2) represents the hardening ca-13
pacity. The engineering stress–strain diagrams of the var-14
ious obtained microstructures show various mechanical15
behaviours. For ISO C45 steel, N and NT microstruc-16
tures present a ductile behaviour while WQ is fragile. In17
addition, OQ and WQT microstructures present a quasi-18
fragile behaviour, whereas, OQT microstructure is lit-19
tle ductile. For ISO 42CrMo4 steel, N, NT and OQT20
microstructures present a ductile behaviour while WQ,21
N TN
TQW QW
TQO QO
30 µm 30 µm
30 µm 30 µm
30 µm 30 µm
Fig. 4. Optical micrographs of the various microstructures forISO 42CrMo4 steel.
WQT and OQ microstructures are fragile. Low tensile 22
values obtained for 42CrMo4 WQ could be attributed to 23
the brittleness of the samples, which are subjected to early 24
fracture without reaching the maximum stress values. The 25
treatment OQ conserved the same proof strength (Rp0.2) 26
but it has improved the ultimate strength by comparison 27
with the untreated or the normalized specimens. 28
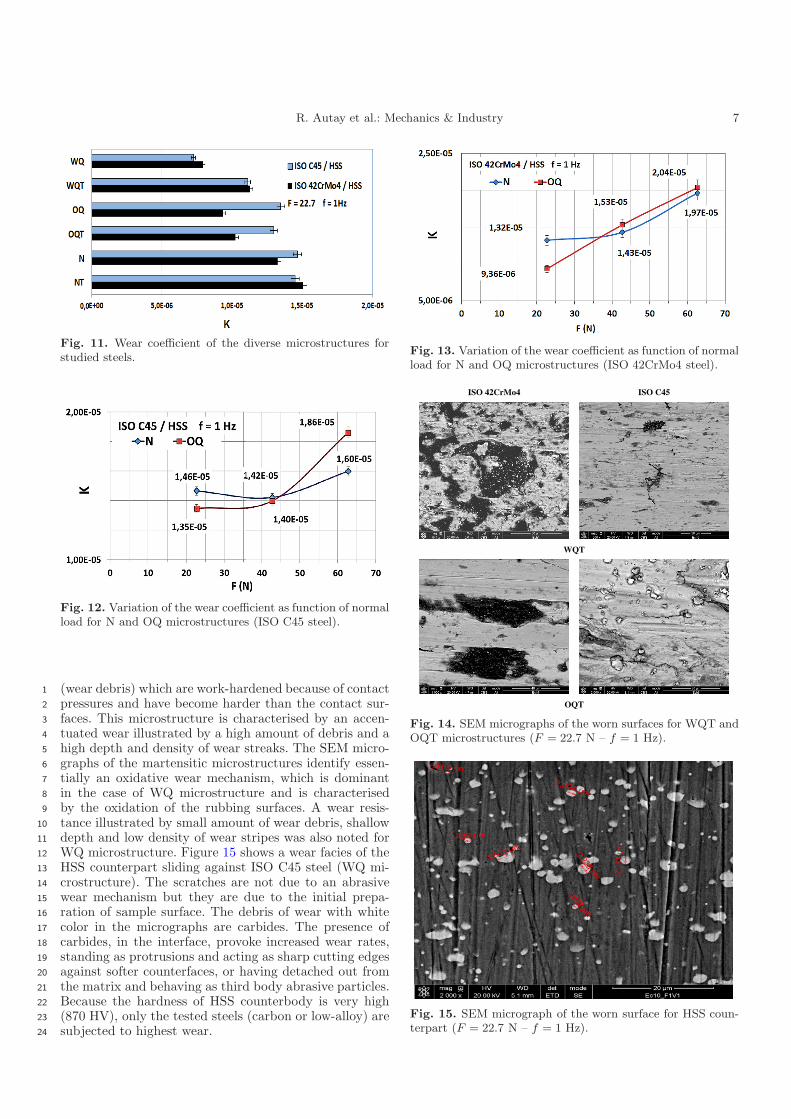
3.2 Friction behaviour 29
Figures 6 and 7 show the variation of the friction co- 30
efficient over sliding time for the various obtained mi- 31
crostructures of studied steels. Each experiment was re- 32
peated five times at minimum for each microstructure 33
and test condition. The results show, for ISO C45 steel, 34
that the martensitic microstructure WQ, which has the 35
highest hardness and the lowest work-hardening proper- 36
ties, provided the highest stationary friction coefficient. 37
The pearlitic microstructure OQT provided the lowest 38
stationary friction coefficient. Despite N, NT and OQ 39
R. Autay et al.: Mechanics & Industry 5
ISO C45
ISO 42CrMo4
Fig. 5. Stress-strain diagrams of tensile tests.
are pearlitic microstructures and have low hardnesses1
compared to WQT martensitic microstructure, they pro-2
vided very close stationary friction coefficients. The re-3
sults show, for ISO 42CrMo4 steel, that the martensitic4
microstructures WQ and OQ, which have the highest5
hardnesses and the lowest work-hardening properties,6
provided the highest stationary friction coefficients. The7
pearlitic microstructure NT provided the lowest station-8
ary friction coefficient. Despite N is pearlitic microstruc-9
ture and has low hardness compared to OQT and WQT10
martensitic microstructures, it provided very close sta-11
tionary friction coefficients. These results confirm, for the12
two studied steels, that there is no correlation between13
friction properties and mechanical ones. A jump in the14
variation of the friction coefficient is noted for N and15
NT pearlitic microstructures (ISO C45 steel) after respec-16
tively 3000 and 4500 sliding cycles approximately. This17
phenomenon is due to the oxidation of contacting sur-18
faces and wear debris at interface. Spinler indicated that19
the friction coefficient becomes higher if the surfaces are20
oxidised [12]. Table 5 shows that increasing normal load21
decreased the stationary friction coefficient for studied22
steels. This decrease was noted essentially when normal23
Table 5. Variation of the stationary friction coefficient asfunction of normal load for N and OQ microstructures.
ISO C45/HSS ISO 42CrMo4/HSSF (N) 22.7 42.7 62.7 22.7 42.7 62.7
N 0.77 0.53 0.53 0.68 0.64 0.61OQ 0.75 0.65 0.62 0.86 0.72 0.72
Table 6. Stationary friction coefficient for the diverse studiedmicrostructures of studied steels (F = 22.7 N – f = 1 Hz).
Microstructure NT N OQ WQ OQT WQTISO C45 0.72 0.75 0.75 0.88 0.56 0.78
ISO 42CrMo4 0.57 0.66 0.85 0.86 0.68 0.72
Table 7. Dissipated energy E (J) for the diverse microstruc-tures of studied steels (F = 22.7 N – f = 1 Hz).
Microstructure NT N OQ WQ OQT WQTISO C45 996 1160 1140 1400 906 1210
ISO 42CrMo4 871 1010 1350 1340 1070 1160
Fig. 6. Variation of the friction coefficient as function of slid-ing time for the diverse microstructures of ISO C45 steel.
load passed from 22.7 N to 42.7 N but when passing from 24
42.7 N to 62.7 N no significative variation was observed. 25
Some authors have linked this decrease in the friction co- 26
efficient to the increase of the rubbing surface and the 27
amount of wear debris [13]. Others have explained it by 28
a probable alteration in the geometry of the contact sur- 29
faces, which is due to adhesive mechanisms of friction 30
during the test [14]. Friction is a phenomenon, which dis- 31
sipates mechanical energy in case of sliding (dynamic fric- 32
tion). Table 6 shows the effect of the various obtained 33
microstructures on the stationary friction coefficient of 34
the studied steels at 22.7 N. Table 7 shows the effect of 35
the various obtained microstructures on the friction en- 36
ergy of studied steels at 22.7 N. The highest dissipated 37
energy is obtained with the WQ microstructure for ISO 38
C45 steel and with OQ microstructure for ISO 42CrMo4 39
steel. The lowest friction energy is obtained with OQT 40
microstructure for ISO C45 steel and with NT microstruc- 41
ture for ISO 42CrMo4 steel. Results show that marten- 42
sitic microstructures are more dissipative of energy than 43
pearlitic ones. 44
6 R. Autay et al.: Mechanics & Industry
Fig. 7. Variation of the friction coefficient as function of slid-ing time for the diverse microstructures of ISO 42CrMo4 steel.
Fig. 8. Wear volume of the diverse microstructures for studiedsteels.
3.3 Wear behaviour1
Figure 8 shows that the lowest wear volume was2
obtained with the martensitic microstructures WQ and3
WQT for ISO C45 steel and with WQ and OQ for ISO4
42CrMo4 steel. These microstructures have the highest5
hardnesses. However, the highest wear volumes were ob-6
tained with the pearlitic microstructures N and NT for7
the two studied steels. These microstructures have the8
lowest hardnesses. Thus, increasing the hardness increases9
the resistance to abrasive wear. Figures 9 and 10 show10
that increasing of the normal load increased significantly11
the wear volume for the two studied steels. Figure 1112
shows that the highest values of the wear coefficient K13
were usually obtained with the microstructures NT and14
N, while the lowest ones were obtained by microstruc-15
tures WQ and WQT for ISO C45 steel, WQ, and OQ16
for ISO 42CrMo4 steel. Das et al. indicated that the Ar-17
chard wear coefficient K is the inverse of the wear resis-18
tance [3]. Bensley et al. adopted the same definitions [15].19
Thus, if the wear coefficient increases wear resistance de-20
creases. Figures 12 and 13 show that increasing normal21
load usually increases the wear coefficient. Results show22
that when normal load exceeds 42.7 N the kinetics of wear23
changed. Except the case of OQ microstructure relative to24
ISO 42CrMo4 steel, wear coefficient increases significantly25
Fig. 9. Variation of the wear volume as function of normalload for N and OQ microstructures (ISO C45 steel).
Fig. 10. Variation of the wear volume as function of normalload for N and OQ microstructures (ISO 42CrMo4 steel).
when load exceeds 42.7 N. Figures 12 and 13 show also 26
that wear processes are affected by the response of the 27
microstructure under the tribological test conditions. In- 28
deed, for C45 steel wear coefficient of microstructure N at 29
22.7 N is higher than which of microstructure OQ. Then 30
when normal load reached 42.7 N the wear coefficients be- 31
came similar and when it reached 62.7 N, wear coefficient 32
of microstructure OQ became higher than which of mi- 33
crostructure N. For 42CrMo4 steel similar result was ob- 34
tained at 22.7 N but when normal load reached 42.7 N or 35
62.7 N, the obtained wear coefficients showed inversed be- 36
havior but they has comparable values. These variations 37
in the wear kinetics can be attributed to the variation 38
in the wear mechanisms because of the effect of increas- 39
ing normal load on the mechanical behavior of the wear 40
debris at interface. Microstructural constituents, such as 41
bainite, martensite, pearlite and carbides lead to different 42
tribological behaviors and wear mechanisms. Martensitic 43
microstructures induce generally oxidative wear mecha- 44
nisms, bainitic microstructures can produce abrasive ones 45
(micropolishing) and pearlitic ones can lead to adhe- 46
sive wear mechanisms (plasticity-dominated wear). The 47
SEM micrographs (Fig. 14) of the pearlitic microstruc- 48
tures identify an abrasive wear mechanism that domi- 49
nates. This mechanism is characterised by wear streaks 50
obtained by plowing or mainly by intermediate particles 51
R. Autay et al.: Mechanics & Industry 7
Fig. 11. Wear coefficient of the diverse microstructures forstudied steels.
Fig. 12. Variation of the wear coefficient as function of normalload for N and OQ microstructures (ISO C45 steel).
(wear debris) which are work-hardened because of contact1
pressures and have become harder than the contact sur-2
faces. This microstructure is characterised by an accen-3
tuated wear illustrated by a high amount of debris and a4
high depth and density of wear streaks. The SEM micro-5
graphs of the martensitic microstructures identify essen-6
tially an oxidative wear mechanism, which is dominant7
in the case of WQ microstructure and is characterised8
by the oxidation of the rubbing surfaces. A wear resis-9
tance illustrated by small amount of wear debris, shallow10
depth and low density of wear stripes was also noted for11
WQ microstructure. Figure 15 shows a wear facies of the12
HSS counterpart sliding against ISO C45 steel (WQ mi-13
crostructure). The scratches are not due to an abrasive14
wear mechanism but they are due to the initial prepa-15
ration of sample surface. The debris of wear with white16
color in the micrographs are carbides. The presence of17
carbides, in the interface, provoke increased wear rates,18
standing as protrusions and acting as sharp cutting edges19
against softer counterfaces, or having detached out from20
the matrix and behaving as third body abrasive particles.21
Because the hardness of HSS counterbody is very high22
(870 HV), only the tested steels (carbon or low-alloy) are23
subjected to highest wear.24
Fig. 13. Variation of the wear coefficient as function of normalload for N and OQ microstructures (ISO 42CrMo4 steel).
54C OSI 4oMrC24 OSI
WQT
OQT
Fig. 14. SEM micrographs of the worn surfaces for WQT andOQT microstructures (F = 22.7 N – f = 1 Hz).
Fig. 15. SEM micrograph of the worn surface for HSS coun-terpart (F = 22.7 N – f = 1 Hz).
8 R. Autay et al.: Mechanics & Industry
4 Conclusions1
This work investigates the effect of various microstruc-2
tures on the tribological properties of ISO C45 carbon3
steel and ISO 42CrMo4 low-alloy steel. Results showed4
that WQ microstructure yielded to the highest friction5
properties. On the contrary, the lowest energy and friction6
coefficient do not depend on a specific microstructure.7
There is no obvious correlation between friction proper-8
ties and hardness or work hardening properties. Oxida-9
tion of worn surfaces increases the friction coefficient for10
all studied microstructures. Abrasive and oxidative wear11
mechanisms were identifed for the different microstruc-12
tures. The first mechanism is essentially characteristic of13
pearlitic microstructures while the latest is particularly14
characteristic of martensitic microstructures. Martensitic15
microstructures gave generally the lowest volumes and16
coefficients of wear while pearlitic microstructures gave17
the highest ones. These tribological properties decrease,18
in general, when hardness increases. However, no correla-19
tion appears between wear properties and work hardening20
ones. Increasing of normal load decreased the friction co-21
efficient but increased generally wear volume and wear22
coefficient.23
References24
[1] D. Rai, B. Singh, J. Singh, Characterisation of wear25
behaviour of different microstructures in Ni–Cr–Mo–V26
steel, Wear 263 (2007) 821–82927
[2] M.H. Shaeri, H. Saghafian, S.G. Shabestari, Effect of heat28
treatment on microstructure and mechanical properties29
of Cr–Mo steels (FMU-226) used in mills liner, Mater.30
Design 34 (2012) 192–20031
[3] D. Das, A.K. Dutta, K.K. Ray, Correlation of microstruc-32
ture with wear behaviour of deep cryogenically treated33
AISI D2 steel, Wear 267 (2009) 1371–138034
[4] S. Kumar, A. Bhattacharyya, D.K. Mondal, K. Biswas, 35
J. Maity, Dry sliding wear behaviour of medium carbon 36
steel against an alumina disk, Wear 270 (2011) 413–421 37
[5] V. Abouei, H. Saghafian, Sh. Kheirandish, Effect of mi- 38
crostructure on the oxidative wear behaviour of plain car- 39
bon steel, Wear 262 (2007) 1225–1231 40
[6] A. Garcia, A. Varela, L. Garcia, M.C. Rio, S. Naya, 41
M. Suarez, Comparing the tribological behaviour of an 42
austenitic steel subjected to diverse thermal treatments, 43
Wear 258 (2005) 203–207 44
[7] Y. Wang, T. Lei, J. Liu, Tribo-metallographic behavior 45
of high carbon steels in dry sliding II. Microstructure and 46
wear, Wear 231 (1999) 12–19 47
[8] J.L. Fanchon, Guide des sciences et technologies indus- 48
trielles, Nathan, 2001 49
[9] A. Ramalho, J.C. Miranda, The relationship between 50
wear and dissipated energy in sliding systems, Wear 260 51
(2006) 361–367 52
[10] J.F. Archard, Contact and rubbing of flat surfaces, J. 53
Appl. Phys. 24 (1953) 981–988 54
[11] M.J. Perez, M.M. Cisneros, H.F. Lopez, Wear resistance 55
of Cu-Ni-Mo austempered ductile iron, Wear 260 (2006) 56
879–885 57
[12] G. Spinler, Conception des machines, Principes et appli- 58
cations, 1 statique, 2002, p. 61 59
[13] M.A. Chowdhury, M.K. Khalil, D.M. Nuruzzaman, M.L. 60
Rahaman, The effect of sliding speed and normal load on 61
friction and wear property of aluminum, IJMME-IJENS 62
11 (2011) 53–57 63
[14] G. Pantazopoulos, P. Psyllaki, D. Kanakis, S. Antoniou, 64
K. Papadimitriou, J. Sideris, Tribological properties of 65
a liquid nitrocarburised special purpose cold work tool 66
steel, Surf. Coat. Technol. 200 (2006) 5889–5895 67
[15] A. Bensely, A. Prabhakaran, D. Mohan Lal, G. 68
Nagarajan, Enhancing the wear resistance of case carbur- 69
ized steel (En 353) by cryogenic treatment, Cryogenics 45 70
(2006) 747–754 71