Experimental investigation of a circular radially deforming cylinder near wake using an infrared...
16
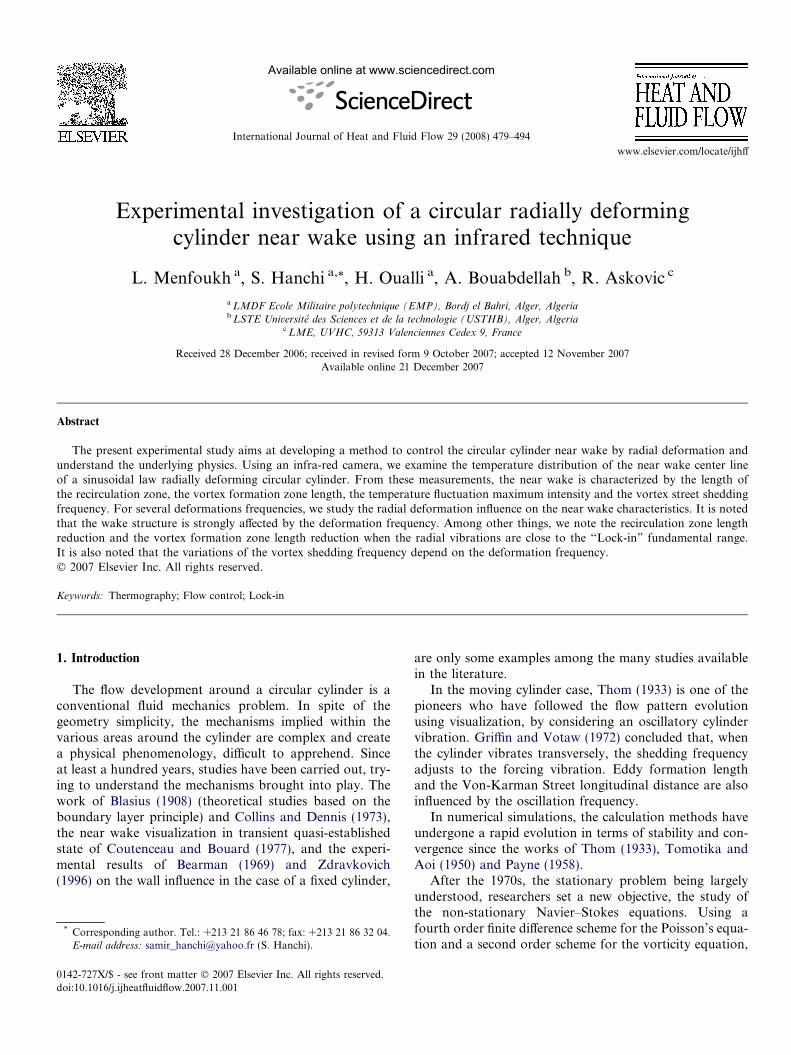
Experimental investigation of a circular radially deforming cylinder near wake using an infrared technique L. Menfoukh a , S. Hanchi a, * , H. Oualli a , A. Bouabdellah b , R. Askovic c a LMDF Ecole Militaire polytechnique (EMP), Bordj el Bahri, Alger, Algeria b LSTE Universite ´ des Sciences et de la technologie (USTHB), Alger, Algeria c LME, UVHC, 59313 Valenciennes Cedex 9, France Received 28 December 2006; received in revised form 9 October 2007; accepted 12 November 2007 Available online 21 December 2007 Abstract The present experimental study aims at developing a method to control the circular cylinder near wake by radial deformation and understand the underlying physics. Using an infra-red camera, we examine the temperature distribution of the near wake center line of a sinusoidal law radially deforming circular cylinder. From these measurements, the near wake is characterized by the length of the recirculation zone, the vortex formation zone length, the temperature fluctuation maximum intensity and the vortex street shedding frequency. For several deformations frequencies, we study the radial deformation influence on the near wake characteristics. It is noted that the wake structure is strongly affected by the deformation frequency. Among other things, we note the recirculation zone length reduction and the vortex formation zone length reduction when the radial vibrations are close to the ‘‘Lock-in” fundamental range. It is also noted that the variations of the vortex shedding frequency depend on the deformation frequency. Ó 2007 Elsevier Inc. All rights reserved. Keywords: Thermography; Flow control; Lock-in 1. Introduction The flow development around a circular cylinder is a conventional fluid mechanics problem. In spite of the geometry simplicity, the mechanisms implied within the various areas around the cylinder are complex and create a physical phenomenology, difficult to apprehend. Since at least a hundred years, studies have been carried out, try- ing to understand the mechanisms brought into play. The work of Blasius (1908) (theoretical studies based on the boundary layer principle) and Collins and Dennis (1973), the near wake visualization in transient quasi-established state of Coutenceau and Bouard (1977), and the experi- mental results of Bearman (1969) and Zdravkovich (1996) on the wall influence in the case of a fixed cylinder, are only some examples among the many studies available in the literature. In the moving cylinder case, Thom (1933) is one of the pioneers who have followed the flow pattern evolution using visualization, by considering an oscillatory cylinder vibration. Griffin and Votaw (1972) concluded that, when the cylinder vibrates transversely, the shedding frequency adjusts to the forcing vibration. Eddy formation length and the Von-Karman Street longitudinal distance are also influenced by the oscillation frequency. In numerical simulations, the calculation methods have undergone a rapid evolution in terms of stability and con- vergence since the works of Thom (1933), Tomotika and Aoi (1950) and Payne (1958). After the 1970s, the stationary problem being largely understood, researchers set a new objective, the study of the non-stationary Navier–Stokes equations. Using a fourth order finite difference scheme for the Poisson’s equa- tion and a second order scheme for the vorticity equation, 0142-727X/$ - see front matter Ó 2007 Elsevier Inc. All rights reserved. doi:10.1016/j.ijheatfluidflow.2007.11.001 * Corresponding author. Tel.: +213 21 86 46 78; fax: +213 21 86 32 04. E-mail address: [email protected] (S. Hanchi). www.elsevier.com/locate/ijhff Available online at www.sciencedirect.com International Journal of Heat and Fluid Flow 29 (2008) 479–494
Transcript of Experimental investigation of a circular radially deforming cylinder near wake using an infrared...
Available online at www.sciencedirect.com
www.elsevier.com/locate/ijhff
International Journal of Heat and Fluid Flow 29 (2008) 479–494
Experimental investigation of a circular radially deformingcylinder near wake using an infrared technique
L. Menfoukh a, S. Hanchi a,*, H. Oualli a, A. Bouabdellah b, R. Askovic c
a LMDF Ecole Militaire polytechnique (EMP), Bordj el Bahri, Alger, Algeriab LSTE Universite des Sciences et de la technologie (USTHB), Alger, Algeria
c LME, UVHC, 59313 Valenciennes Cedex 9, France
Received 28 December 2006; received in revised form 9 October 2007; accepted 12 November 2007Available online 21 December 2007
Abstract
The present experimental study aims at developing a method to control the circular cylinder near wake by radial deformation andunderstand the underlying physics. Using an infra-red camera, we examine the temperature distribution of the near wake center lineof a sinusoidal law radially deforming circular cylinder. From these measurements, the near wake is characterized by the length ofthe recirculation zone, the vortex formation zone length, the temperature fluctuation maximum intensity and the vortex street sheddingfrequency. For several deformations frequencies, we study the radial deformation influence on the near wake characteristics. It is notedthat the wake structure is strongly affected by the deformation frequency. Among other things, we note the recirculation zone lengthreduction and the vortex formation zone length reduction when the radial vibrations are close to the ‘‘Lock-in” fundamental range.It is also noted that the variations of the vortex shedding frequency depend on the deformation frequency.� 2007 Elsevier Inc. All rights reserved.
Keywords: Thermography; Flow control; Lock-in
1. Introduction
The flow development around a circular cylinder is aconventional fluid mechanics problem. In spite of thegeometry simplicity, the mechanisms implied within thevarious areas around the cylinder are complex and createa physical phenomenology, difficult to apprehend. Sinceat least a hundred years, studies have been carried out, try-ing to understand the mechanisms brought into play. Thework of Blasius (1908) (theoretical studies based on theboundary layer principle) and Collins and Dennis (1973),the near wake visualization in transient quasi-establishedstate of Coutenceau and Bouard (1977), and the experi-mental results of Bearman (1969) and Zdravkovich(1996) on the wall influence in the case of a fixed cylinder,
0142-727X/$ - see front matter � 2007 Elsevier Inc. All rights reserved.
doi:10.1016/j.ijheatfluidflow.2007.11.001
* Corresponding author. Tel.: +213 21 86 46 78; fax: +213 21 86 32 04.E-mail address: [email protected] (S. Hanchi).
are only some examples among the many studies availablein the literature.
In the moving cylinder case, Thom (1933) is one of thepioneers who have followed the flow pattern evolutionusing visualization, by considering an oscillatory cylindervibration. Griffin and Votaw (1972) concluded that, whenthe cylinder vibrates transversely, the shedding frequencyadjusts to the forcing vibration. Eddy formation lengthand the Von-Karman Street longitudinal distance are alsoinfluenced by the oscillation frequency.
In numerical simulations, the calculation methods haveundergone a rapid evolution in terms of stability and con-vergence since the works of Thom (1933), Tomotika andAoi (1950) and Payne (1958).
After the 1970s, the stationary problem being largelyunderstood, researchers set a new objective, the study ofthe non-stationary Navier–Stokes equations. Using afourth order finite difference scheme for the Poisson’s equa-tion and a second order scheme for the vorticity equation,
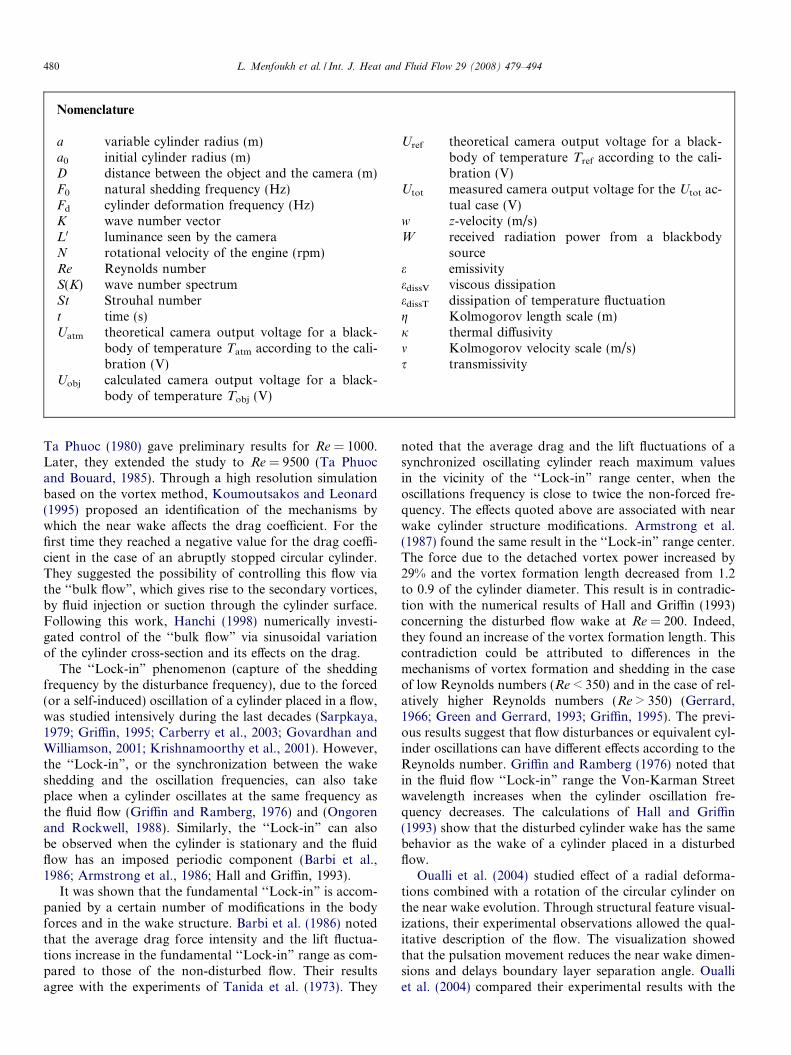
Nomenclature
a variable cylinder radius (m)a0 initial cylinder radius (m)D distance between the object and the camera (m)F0 natural shedding frequency (Hz)Fd cylinder deformation frequency (Hz)K wave number vectorL0 luminance seen by the cameraN rotational velocity of the engine (rpm)Re Reynolds numberS(K) wave number spectrumSt Strouhal numbert time (s)Uatm theoretical camera output voltage for a black-
body of temperature Tatm according to the cali-bration (V)
Uobj calculated camera output voltage for a black-body of temperature Tobj (V)
Uref theoretical camera output voltage for a black-body of temperature Tref according to the cali-bration (V)
Utot measured camera output voltage for the Utot ac-tual case (V)
w z-velocity (m/s)W received radiation power from a blackbody
sourcee emissivityedissV viscous dissipationedissT dissipation of temperature fluctuationg Kolmogorov length scale (m)j thermal diffusivitym Kolmogorov velocity scale (m/s)s transmissivity
480 L. Menfoukh et al. / Int. J. Heat and Fluid Flow 29 (2008) 479–494
Ta Phuoc (1980) gave preliminary results for Re = 1000.Later, they extended the study to Re = 9500 (Ta Phuocand Bouard, 1985). Through a high resolution simulationbased on the vortex method, Koumoutsakos and Leonard(1995) proposed an identification of the mechanisms bywhich the near wake affects the drag coefficient. For thefirst time they reached a negative value for the drag coeffi-cient in the case of an abruptly stopped circular cylinder.They suggested the possibility of controlling this flow viathe ‘‘bulk flow”, which gives rise to the secondary vortices,by fluid injection or suction through the cylinder surface.Following this work, Hanchi (1998) numerically investi-gated control of the ‘‘bulk flow” via sinusoidal variationof the cylinder cross-section and its effects on the drag.
The ‘‘Lock-in” phenomenon (capture of the sheddingfrequency by the disturbance frequency), due to the forced(or a self-induced) oscillation of a cylinder placed in a flow,was studied intensively during the last decades (Sarpkaya,1979; Griffin, 1995; Carberry et al., 2003; Govardhan andWilliamson, 2001; Krishnamoorthy et al., 2001). However,the ‘‘Lock-in”, or the synchronization between the wakeshedding and the oscillation frequencies, can also takeplace when a cylinder oscillates at the same frequency asthe fluid flow (Griffin and Ramberg, 1976) and (Ongorenand Rockwell, 1988). Similarly, the ‘‘Lock-in” can alsobe observed when the cylinder is stationary and the fluidflow has an imposed periodic component (Barbi et al.,1986; Armstrong et al., 1986; Hall and Griffin, 1993).
It was shown that the fundamental ‘‘Lock-in” is accom-panied by a certain number of modifications in the bodyforces and in the wake structure. Barbi et al. (1986) notedthat the average drag force intensity and the lift fluctua-tions increase in the fundamental ‘‘Lock-in” range as com-pared to those of the non-disturbed flow. Their resultsagree with the experiments of Tanida et al. (1973). They
noted that the average drag and the lift fluctuations of asynchronized oscillating cylinder reach maximum valuesin the vicinity of the ‘‘Lock-in” range center, when theoscillations frequency is close to twice the non-forced fre-quency. The effects quoted above are associated with nearwake cylinder structure modifications. Armstrong et al.(1987) found the same result in the ‘‘Lock-in” range center.The force due to the detached vortex power increased by29% and the vortex formation length decreased from 1.2to 0.9 of the cylinder diameter. This result is in contradic-tion with the numerical results of Hall and Griffin (1993)concerning the disturbed flow wake at Re = 200. Indeed,they found an increase of the vortex formation length. Thiscontradiction could be attributed to differences in themechanisms of vortex formation and shedding in the caseof low Reynolds numbers (Re < 350) and in the case of rel-atively higher Reynolds numbers (Re > 350) (Gerrard,1966; Green and Gerrard, 1993; Griffin, 1995). The previ-ous results suggest that flow disturbances or equivalent cyl-inder oscillations can have different effects according to theReynolds number. Griffin and Ramberg (1976) noted thatin the fluid flow ‘‘Lock-in” range the Von-Karman Streetwavelength increases when the cylinder oscillation fre-quency decreases. The calculations of Hall and Griffin(1993) show that the disturbed cylinder wake has the samebehavior as the wake of a cylinder placed in a disturbedflow.
Oualli et al. (2004) studied effect of a radial deforma-tions combined with a rotation of the circular cylinder onthe near wake evolution. Through structural feature visual-izations, their experimental observations allowed the qual-itative description of the flow. The visualization showedthat the pulsation movement reduces the near wake dimen-sions and delays boundary layer separation angle. Oualliet al. (2004) compared their experimental results with the
L. Menfoukh et al. / Int. J. Heat and Fluid Flow 29 (2008) 479–494 481
numerical results obtained by Hanchi (1998) for the samecontrol parameters (Reynolds number, frequency andamplitude of deformation). There was good agreementbetween observation and simulation.
The objective of the present study is to show the circularcylinder radial deformation influence on the near wakecharacteristics by using a particular experimental tech-nique. Indeed, using a smoke generator, we inject a hotfluid within the ambient fluid flow. The resulting tempera-ture gradient is convected by vortices developed behind thecylinder. The mean and the fluctuating temperature fieldsare examined using an infra-red camera. The measure-ments showed that the wake is characterized by the recircu-lation area length, the vortex formation length, themaximum fluctuation intensity, the developed vortexradius and the vortex shedding frequencies.
2. Theory
2.1. Analogy between the spectrum of temperature
fluctuation and the spectrum of turbulence inertial subrange
Let the wave number spectrum, S(K), represent turbu-lent kinetic energy as a function of the wave number vec-tor K. If the turbulence is isotropic, then the spectrum isindependent of the orientation of the wave number vectorand depends on its magnitude K only. In that case we canwrite
u2 ¼Z 1
0
SðKÞdK: ð1Þ
We will derive the form of S(K) for a range of wave num-bers in which the turbulence is nearly isotropic.
Let’s associate a wave number K with an eddy of sizeK�1. Small eddies are represented by large wave numbers.Suppose l is the scale of the large eddies. At the relativelysmall scales represented by wave numbers K� l�1, thereis no direct interaction between the turbulence and themotion of the large energy-containing eddies. The spec-trum in this range of large wave numbers is nearly isotro-pic, as only the large eddies are aware of the direction ofthe mean gradient. In this range the spectrum depends onlyon the parameters that determine the nature of the small-scale flow, so that we can write
S ¼ SðK; edissV; mÞ; K � l�1: ð2ÞThe wave number range K� l�1 is usually called the equi-librium range. The dissipating wave numbers with K � g�1
and beyond which the spectrum falls off very rapidly, formthe high end of the equilibrium range. The lower end of thisrange, for which l�1� K� g�1, is called the inertial sub-range, as transfer of energy is only by inertial forces (vortexstretching) in this range. Both production and dissipationare small in the inertial subrange. The production of energyby large eddies results in a peak of S at a certain K � l�1,and the dissipation of energy causes a sharp drop of S
for K > g�1.
Kolmogorov argued that in the inertial subrange, whichis part of the equilibrium range, also S is independent of m,so that (Kundu and Cohen, 2002):
S ¼ SðK; edissVÞ; l�1 � K � g�1: ð3ÞAlthough little dissipation occurs in the inertial subrange,the spectrum depends on edissV (viscous dissipation) be-cause the dissipated energy must be transferred across theinertial subrange, from the low to the high wave numbers.
As the units of S is m3/s2 and e is m2/s3, dimensionalanalysis gives (Kundu and Cohen, 2002):
S ¼ Ae2=3dissVK�5=3; l�1 � K � g�1; ð4Þ
where A � 1.5 has been found to be a universal constant,valid for all turbulent flows. Eq. (4) is usually called Kol-mogorov’s K�5/3 law. If the Reynolds number of the flowis large, the dissipating eddies are much smaller than theenergy-containing eddies and the inertial subrange is quitebroad.
Under the Boussinesq approximation, the energy equa-tion for the instantaneous variables are
oeTotþ ~uj
oeToxj¼ j
o2eT
oxjoxj: ð5Þ
By using Reynolds decomposition, ~ul ¼ Ui þ u0 andeT ¼ T þ T 0, the mean heat equation takes the form:
DTDtþ Uj
oToxjþ oðujT 0Þ
oxj¼ j
o2T
ox2j; ð6Þ
where j is the thermal diffusivity.An equation for the temperature fluctuation intensity T 02
can be obtained in a way similar to the one used for obtain-ing the turbulent kinetic energy. Therefore, the procedureconsists of obtaining an equation for DT 0
Dt by subtractingthe equation for DeT
Dt and DTDt and then multiply the resulting
equation for DT 0Dt by T0 and take in the average. The result is
1
2
DT 02
Dt¼ �wT 0
dTdz� o
oz1
2T 02w� j
dT 02
dz
!� j
oT 0
dxj
� �; ð7Þ
where edissT ¼ j oT 0
dxj
� �is the dissipation of temperature fluc-
tuation, analogous to the dissipation of turbulent kineticenergy. The first term on the right-hand side of Eq. (7) is
the generation of T 02 by the mean temperature gradient
wT 0, being positive if dTdz is negative. The second term on
the right-hand side is the turbulent transport of T 02.
A wave number spectrum of temperature fluctuationscan be defined such that
T 02 �Z 1
0
CðKÞdK: ð8Þ
As in the case of the kinetic energy spectrum, an inertialrange of wave numbers exists in which neither the produc-tion by large-scale eddies nor the dissipation by conductiveand viscous effects are important.
482 L. Menfoukh et al. / Int. J. Heat and Fluid Flow 29 (2008) 479–494
As the temperature fluctuations are intimately associ-ated with velocity fluctuations, C(K) in this range mustdepend not only on edissT but also on the variables thatdetermine the velocity spectrum, namely edissV and K.Therefore
CðKÞ ¼ CðeT; e;KÞ; l�1 � K � g�1: ð9ÞThe unit C is �C2 m, and the unit of eT is �C2/s. A dimen-sional analysis gives
CðKÞ / eTe�1=3K�5=3; l�1 � K � g�1; ð10Þwhich was first derived by Obukhov in 1949 (Kundu andCohen, 2002). Comparing with Eq. (4), it appear that thespectra of both velocity and temperature fluctuations inthe inertial subrange have the same K�5/3 form.
3. Experimental set up
An infrared camera measures and images the infraredradiation emitted from an object. The fact that radiationis a function of object surface temperature makes it possi-ble, for the camera, to calculate and display this tempera-ture. However, the radiation measured by the camera notonly depends on the object temperature but is also a func-tion of the emissivity. Radiation also originates from thesurroundings and is reflected in the object. The radiationfrom the object and the reflected radiation will also beinfluenced by the absorption of the atmosphere.
Therefore, in order to measure temperature accurately,it is necessary to compensate the effects of a number of dif-ferent radiation sources. This is done automatically by thecamera. The following object parameters must, however,be supplied to the camera:
� The emissivity of the object.� The reflected temperature.� The distance between the object and the camera.� The relative humidity.
Obj
and
t at temperatu
emissivity ε
ure Tobj Reflec
and em
Atmo
and t
cted tempera
missivity εre
ospher at T
transmissivi
e
Fig. 1. A schematic representation of the gene
To find the emissivity of the smoke in the near wake, weselect a reference point and measure its temperature using athermocouple. Then, we alter the emissivity until the tem-perature measured by the camera agrees with the thermo-couple reading. This is the smoke emissivity value we usein our work (e = 0.1). It is also required that the tempera-ture range be far from the ambient temperature, a condi-tion met in the present work.
The measurement distance is set to one meter to reducethe radiation absorbed by the atmosphere.
3.1. Measurement formula
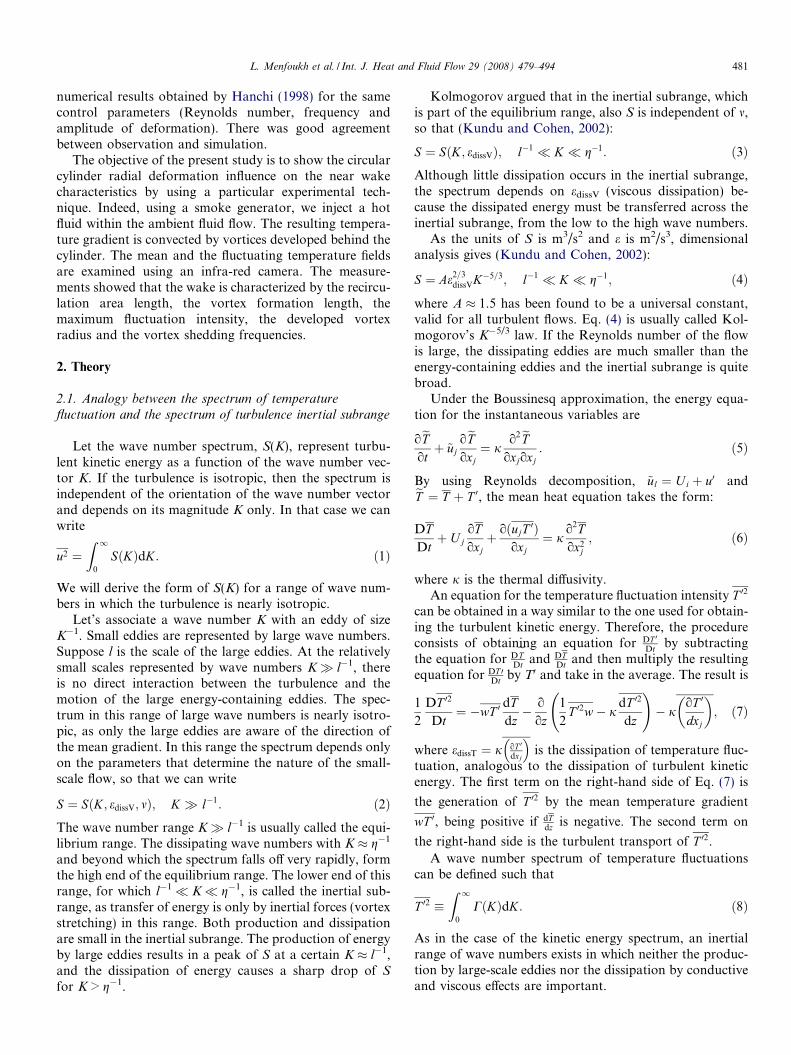
The camera receives radiation from both the object itselfand from the surroundings via reflection over the object’ssurface. Both radiation contributions are attenuated tosome extent by the atmosphere in the measurement path.To these two contributions we must add a third radiationcontribution from the atmosphere itself.
We can use Fig. 1 to derive a formula for the calculationof the object temperature from the calibrated cameraoutput.
Assuming that the received radiation power W from ablackbody source at temperature Tsource over a short dis-tance generates a camera output signal Usource and is pro-portional to the power input (power linear camera), wecan write
U source ¼ CðW sourceÞ; ð11ÞC is a constant given by one of the expressions belowaccording to the kind of source considered.
When the source is a gray-body with emissivity e, thereceived radiation is eWsource.
The three collected radiation power terms are:
1. Object emission = esWobj, where e is the emissivity ofthe object and s is the transmittance of the atmosphere.The object temperature is Tobj.
tu
f =
atm
ty
ure Tref
= 1
y τ
Camera FLIRR A40M
ral thermographic measurement situation.
L. Menfoukh et al. / Int. J. Heat and Fluid Flow 29 (2008) 479–494 483
2. Reflected emission from ambient sources = (1 � e)-sWrefl, where (1 � e) is the reflectance of the object.The ambient sources have the temperature Trefl.
3. Emission from the atmosphere = (1 � s)Watm, where(1 � s) is the emissivity of the atmosphere. The temper-ature of the atmosphere is Tatm.
The total received radiation power can now be written:
W tot ¼ esW obj þ ð1� eÞsW ref þ ð1� sÞW atm: ð12ÞThis can be transformed to obtain the output signal of thecamera:
U tot ¼ esU obj þ ð1� eÞsU ref þ ð1� sÞU atm: ð13ÞSolving for Uobj, we obtain:
U obj ¼1
esU tot �
1� ee
U ref �1� ses
U atm: ð14Þ
This is the general measurement formula used in all FLIRSystems thermographic equipments.
The camera is calibrated by FLIR systems (Table 1).The camera measures a luminance taking into account ofall the parameters. This quantity is known as ‘‘non-com-pensated”. The operator introduces the object parameters.It allows the compensation determination. From this, onegets the object luminance (compensated) from an equiva-lent black body.
It is enough to defer this compensated value on the cal-ibration curve to obtain the real temperature.
Thus, the measurement is done according to the follow-ing procedure. First of all the following assumptions aremade:
� The smoke is opaque.� The emissivity is gray and denoted e0.� The surface temperature is Tobj.� The environment is comparable to a black body of tem-
perature Tenv.
Table 1Main features of the IR camera FLIR A40M
Characteristic Value or description
Objecttemperaturemeasurementrange
�40/ + 120 �C0/+500 �C+500/1700 �C
Measurementaccuracy
±2 �C or ±2% of the recording. The specification isvalid when the ambient temperature lies between+5 �C and +45 �C
Thermalsensitivity
80 mK at 25�C
Detector type Matrix in focal plan (FPA), microbolometer notcooled
Spectral range 7.5–13 lmIntegration time 20 msDistance range
between cameraand object
>0.3 m
Spatial resolution 320 � 240 pixels
� The atmosphere is comparable to a black body of tem-perature Tatm.� The atmosphere transmission is imperfect and worth
satm.
According to relation (3), the luminance (L0) as seen bythe camera is equal to
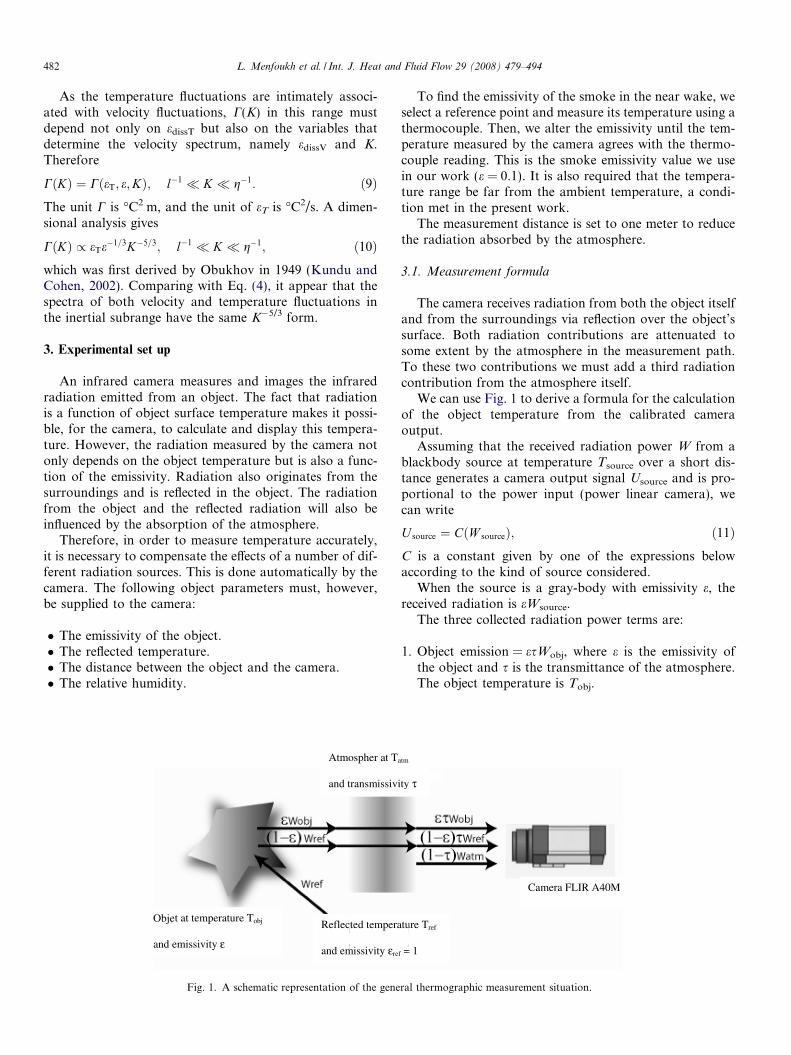
L0 ¼ satme0Lobj þ satmð1� e0ÞLenv þ ð1� satmÞLatm: ð15ÞConsidering that Tenv = Tatm and that transmission is opti-mum, this relation simplifies to
L0 ¼ e0Lobj þ ð1� e0ÞLenv: ð16ÞThe temperature is then obtained from the calibrationcurve (Fig. 2).
3.2. Camera characteristics
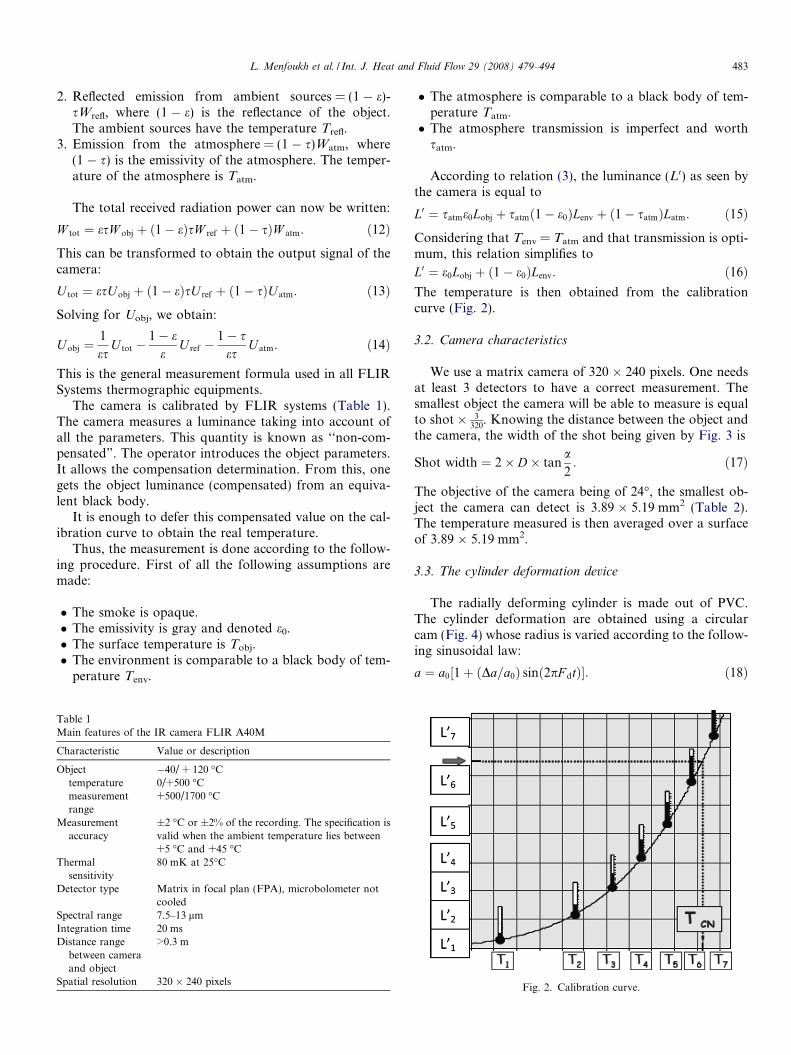
We use a matrix camera of 320 � 240 pixels. One needsat least 3 detectors to have a correct measurement. Thesmallest object the camera will be able to measure is equalto shot� 3
320. Knowing the distance between the object and
the camera, the width of the shot being given by Fig. 3 is
Shot width ¼ 2� D� tana2: ð17Þ
The objective of the camera being of 24�, the smallest ob-ject the camera can detect is 3.89 � 5.19 mm2 (Table 2).The temperature measured is then averaged over a surfaceof 3.89 � 5.19 mm2.
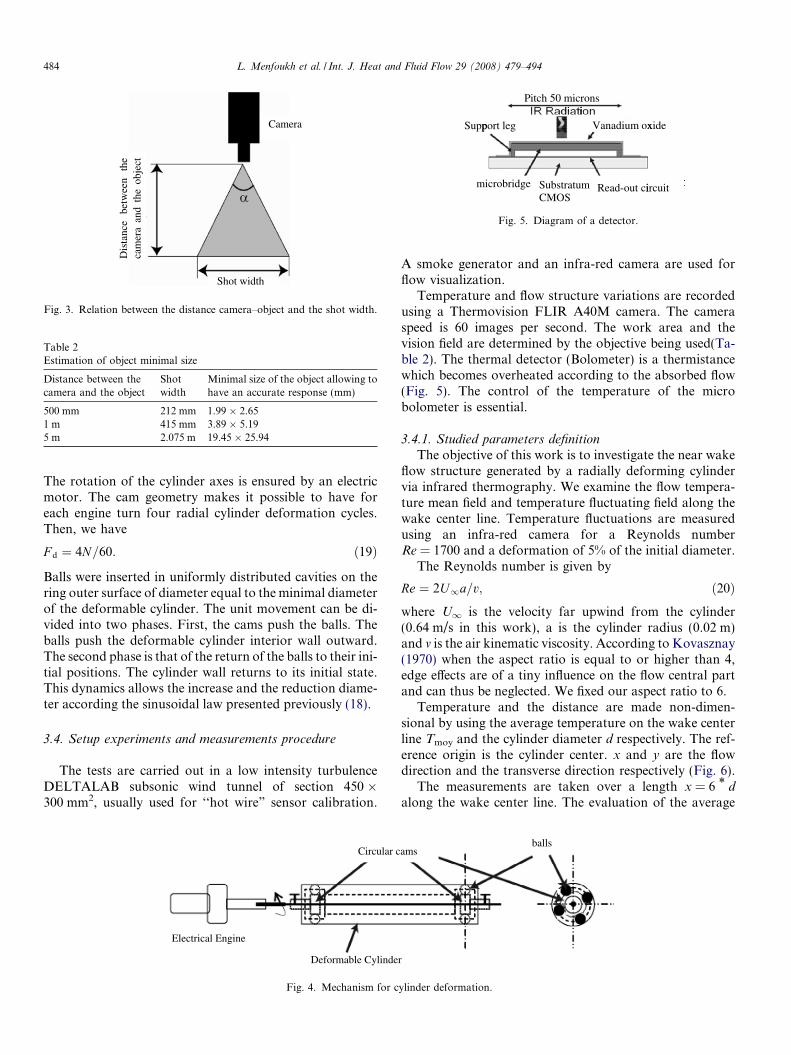
3.3. The cylinder deformation device
The radially deforming cylinder is made out of PVC.The cylinder deformation are obtained using a circularcam (Fig. 4) whose radius is varied according to the follow-ing sinusoidal law:
a ¼ a0 1þ ðDa=a0Þ sinð2pF dtÞ½ : ð18Þ
Fig. 2. Calibration curve.
Pitc 50 micronsh
Su ort leppp g Vanadium oxxide
rmic obridge u mM
SC
bstratuOS
iiRead-out c rcuit
Fig. 5. Diagram of a detector.
Dis
tanc
e be
twee
n th
e ca
mer
a an
d th
e ob
ject
Camera
Shot width
Fig. 3. Relation between the distance camera–object and the shot width.
Table 2Estimation of object minimal size
Distance between thecamera and the object
Shotwidth
Minimal size of the object allowing tohave an accurate response (mm)
500 mm 212 mm 1.99 � 2.651 m 415 mm 3.89 � 5.195 m 2.075 m 19.45 � 25.94
484 L. Menfoukh et al. / Int. J. Heat and Fluid Flow 29 (2008) 479–494
The rotation of the cylinder axes is ensured by an electricmotor. The cam geometry makes it possible to have foreach engine turn four radial cylinder deformation cycles.Then, we have
F d ¼ 4N=60: ð19Þ
Balls were inserted in uniformly distributed cavities on thering outer surface of diameter equal to the minimal diameterof the deformable cylinder. The unit movement can be di-vided into two phases. First, the cams push the balls. Theballs push the deformable cylinder interior wall outward.The second phase is that of the return of the balls to their ini-tial positions. The cylinder wall returns to its initial state.This dynamics allows the increase and the reduction diame-ter according the sinusoidal law presented previously (18).
3.4. Setup experiments and measurements procedure
The tests are carried out in a low intensity turbulenceDELTALAB subsonic wind tunnel of section 450 �300 mm2, usually used for ‘‘hot wire” sensor calibration.
Electrical Engine
Circular c
Deformable Cylinde
Fig. 4. Mechanism for c
A smoke generator and an infra-red camera are used forflow visualization.
Temperature and flow structure variations are recordedusing a Thermovision FLIR A40M camera. The cameraspeed is 60 images per second. The work area and thevision field are determined by the objective being used(Ta-ble 2). The thermal detector (Bolometer) is a thermistancewhich becomes overheated according to the absorbed flow(Fig. 5). The control of the temperature of the microbolometer is essential.
3.4.1. Studied parameters definition
The objective of this work is to investigate the near wakeflow structure generated by a radially deforming cylindervia infrared thermography. We examine the flow tempera-ture mean field and temperature fluctuating field along thewake center line. Temperature fluctuations are measuredusing an infra-red camera for a Reynolds numberRe = 1700 and a deformation of 5% of the initial diameter.
The Reynolds number is given by
Re ¼ 2U1a=v; ð20Þwhere U1 is the velocity far upwind from the cylinder(0.64 m/s in this work), a is the cylinder radius (0.02 m)and m is the air kinematic viscosity. According to Kovasznay(1970) when the aspect ratio is equal to or higher than 4,edge effects are of a tiny influence on the flow central partand can thus be neglected. We fixed our aspect ratio to 6.
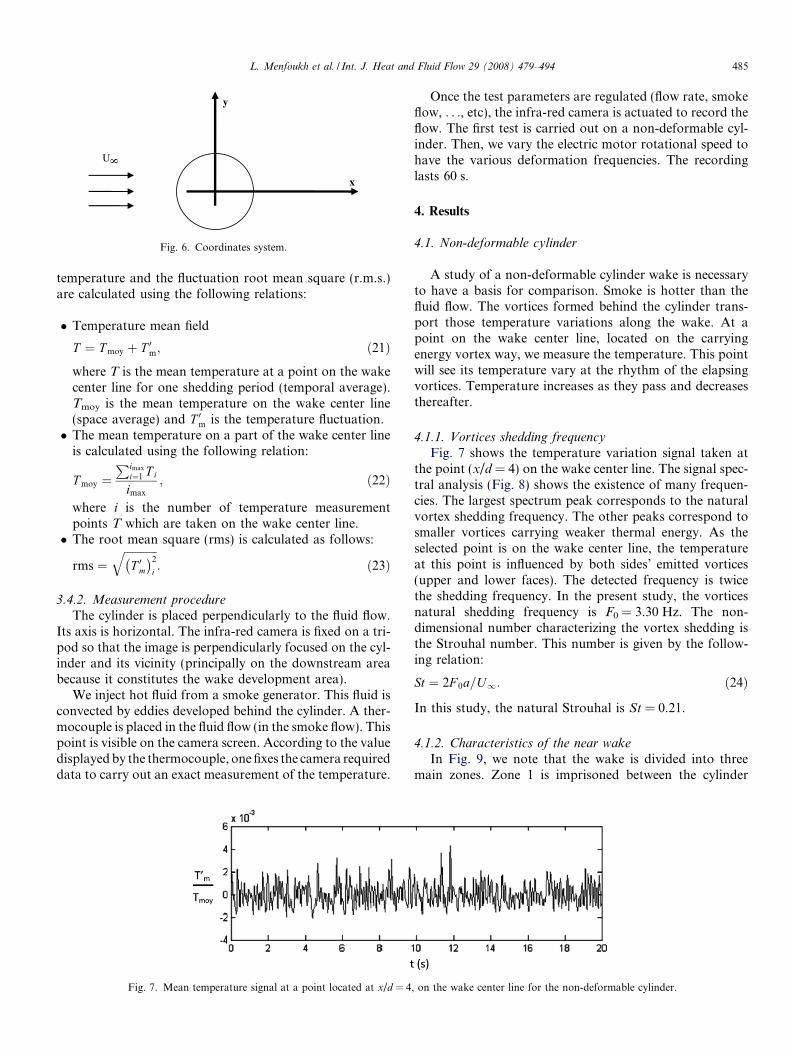
Temperature and the distance are made non-dimen-sional by using the average temperature on the wake centerline Tmoy and the cylinder diameter d respectively. The ref-erence origin is the cylinder center. x and y are the flowdirection and the transverse direction respectively (Fig. 6).
The measurements are taken over a length x = 6 * d
along the wake center line. The evaluation of the average
ams
r
balls
ylinder deformation.
U
y
x
8
Fig. 6. Coordinates system.
L. Menfoukh et al. / Int. J. Heat and Fluid Flow 29 (2008) 479–494 485
temperature and the fluctuation root mean square (r.m.s.)are calculated using the following relations:
� Temperature mean field
T ¼ T moy þ T 0m; ð21Þwhere T is the mean temperature at a point on the wakecenter line for one shedding period (temporal average).Tmoy is the mean temperature on the wake center line(space average) and T 0m is the temperature fluctuation.� The mean temperature on a part of the wake center line
is calculated using the following relation:
T moy ¼Pimax
i¼1 T i
imax
; ð22Þ
where i is the number of temperature measurementpoints T which are taken on the wake center line.� The root mean square (rms) is calculated as follows:
rms ¼ffiffiffiffiffiffiffiffiffiffiffiffiT 0m� �2
i
q: ð23Þ
3.4.2. Measurement procedure
The cylinder is placed perpendicularly to the fluid flow.Its axis is horizontal. The infra-red camera is fixed on a tri-pod so that the image is perpendicularly focused on the cyl-inder and its vicinity (principally on the downstream areabecause it constitutes the wake development area).
We inject hot fluid from a smoke generator. This fluid isconvected by eddies developed behind the cylinder. A ther-mocouple is placed in the fluid flow (in the smoke flow). Thispoint is visible on the camera screen. According to the valuedisplayed by the thermocouple, one fixes the camera requireddata to carry out an exact measurement of the temperature.
Fig. 7. Mean temperature signal at a point located at x/d = 4
Once the test parameters are regulated (flow rate, smokeflow, . . ., etc), the infra-red camera is actuated to record theflow. The first test is carried out on a non-deformable cyl-inder. Then, we vary the electric motor rotational speed tohave the various deformation frequencies. The recordinglasts 60 s.
4. Results
4.1. Non-deformable cylinder
A study of a non-deformable cylinder wake is necessaryto have a basis for comparison. Smoke is hotter than thefluid flow. The vortices formed behind the cylinder trans-port those temperature variations along the wake. At apoint on the wake center line, located on the carryingenergy vortex way, we measure the temperature. This pointwill see its temperature vary at the rhythm of the elapsingvortices. Temperature increases as they pass and decreasesthereafter.
4.1.1. Vortices shedding frequency
Fig. 7 shows the temperature variation signal taken atthe point (x/d = 4) on the wake center line. The signal spec-tral analysis (Fig. 8) shows the existence of many frequen-cies. The largest spectrum peak corresponds to the naturalvortex shedding frequency. The other peaks correspond tosmaller vortices carrying weaker thermal energy. As theselected point is on the wake center line, the temperatureat this point is influenced by both sides’ emitted vortices(upper and lower faces). The detected frequency is twicethe shedding frequency. In the present study, the vorticesnatural shedding frequency is F0 = 3.30 Hz. The non-dimensional number characterizing the vortex shedding isthe Strouhal number. This number is given by the follow-ing relation:
St ¼ 2F 0a=U1: ð24Þ
In this study, the natural Strouhal is St = 0.21.
4.1.2. Characteristics of the near wake
In Fig. 9, we note that the wake is divided into threemain zones. Zone 1 is imprisoned between the cylinder
, on the wake center line for the non-deformable cylinder.
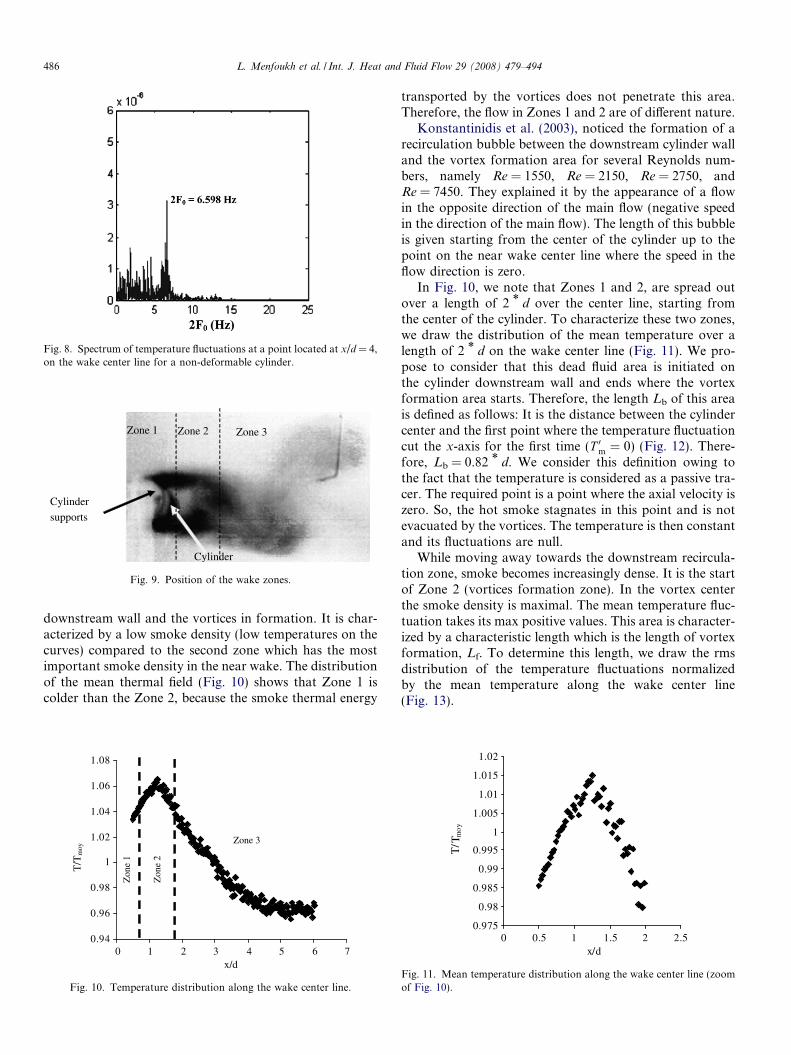
Fig. 8. Spectrum of temperature fluctuations at a point located at x/d = 4,on the wake center line for a non-deformable cylinder.
Cylinder
supports
Zone 1 Zone 2 Zone 3
Cylinder
Fig. 9. Position of the wake zones.
486 L. Menfoukh et al. / Int. J. Heat and Fluid Flow 29 (2008) 479–494
downstream wall and the vortices in formation. It is char-acterized by a low smoke density (low temperatures on thecurves) compared to the second zone which has the mostimportant smoke density in the near wake. The distributionof the mean thermal field (Fig. 10) shows that Zone 1 iscolder than the Zone 2, because the smoke thermal energy
0.94
0.96
0.98
1
1.02
1.04
1.06
1.08
0 1 2 3 4 5 6 7
Zone
1
Zone
2
T/T
moy
Zon
e 1
Zon
e 2
Zone 3
x/d
Fig. 10. Temperature distribution along the wake center line.
transported by the vortices does not penetrate this area.Therefore, the flow in Zones 1 and 2 are of different nature.
Konstantinidis et al. (2003), noticed the formation of arecirculation bubble between the downstream cylinder walland the vortex formation area for several Reynolds num-bers, namely Re = 1550, Re = 2150, Re = 2750, andRe = 7450. They explained it by the appearance of a flowin the opposite direction of the main flow (negative speedin the direction of the main flow). The length of this bubbleis given starting from the center of the cylinder up to thepoint on the near wake center line where the speed in theflow direction is zero.
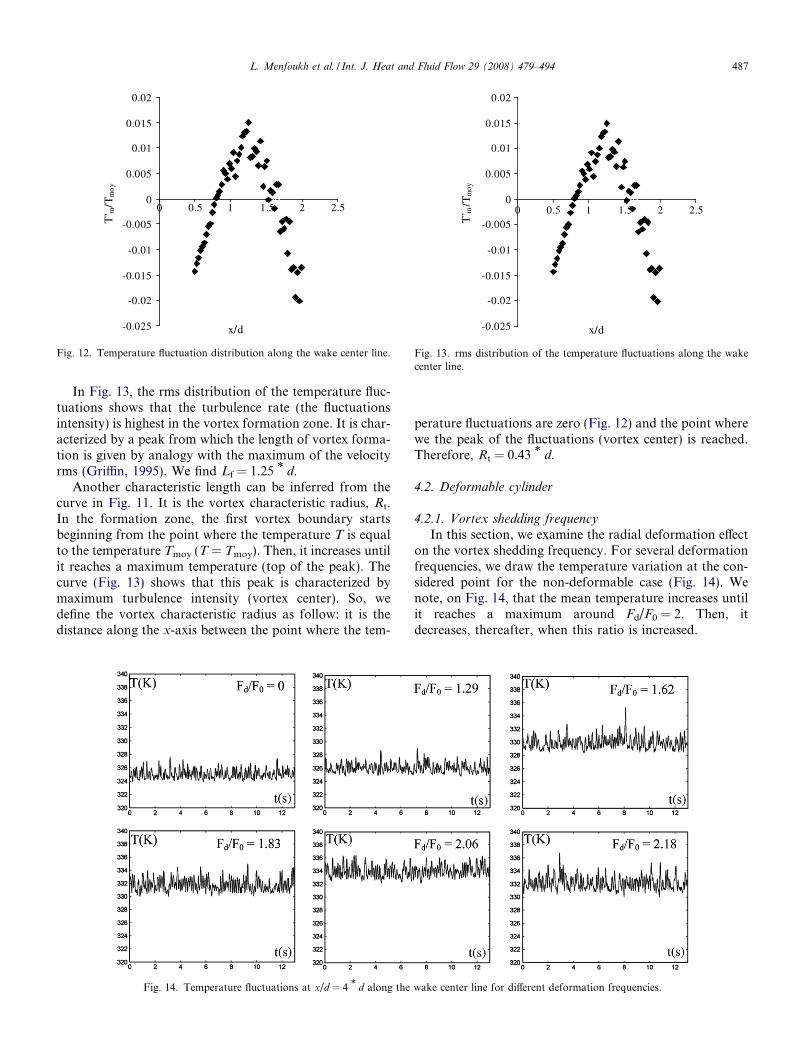
In Fig. 10, we note that Zones 1 and 2, are spread outover a length of 2 * d over the center line, starting fromthe center of the cylinder. To characterize these two zones,we draw the distribution of the mean temperature over alength of 2 * d on the wake center line (Fig. 11). We pro-pose to consider that this dead fluid area is initiated onthe cylinder downstream wall and ends where the vortexformation area starts. Therefore, the length Lb of this areais defined as follows: It is the distance between the cylindercenter and the first point where the temperature fluctuationcut the x-axis for the first time (T 0m ¼ 0) (Fig. 12). There-fore, Lb = 0.82 * d. We consider this definition owing tothe fact that the temperature is considered as a passive tra-cer. The required point is a point where the axial velocity iszero. So, the hot smoke stagnates in this point and is notevacuated by the vortices. The temperature is then constantand its fluctuations are null.
While moving away towards the downstream recircula-tion zone, smoke becomes increasingly dense. It is the startof Zone 2 (vortices formation zone). In the vortex centerthe smoke density is maximal. The mean temperature fluc-tuation takes its max positive values. This area is character-ized by a characteristic length which is the length of vortexformation, Lf. To determine this length, we draw the rmsdistribution of the temperature fluctuations normalizedby the mean temperature along the wake center line(Fig. 13).
0.975
0.98
0.985
0.99
0.995
1
1.005
1.01
1.015
1.02
0 0.5 1 1.5 2 2.5x/d
T/ T
mo
y
Fig. 11. Mean temperature distribution along the wake center line (zoomof Fig. 10).
-0.025
-0.02
-0.015
-0.01
-0.005
0
0.005
0.01
0.015
0.02
0 0.5 1 1.5 2 2.5
x/d
T’ m
/Tm
oy
Fig. 12. Temperature fluctuation distribution along the wake center line.
-0.025
-0.02
-0.015
-0.01
-0.005
0
0.005
0.01
0.015
0.02
0 0.5 1 1.5 2 2.5
x/d
T’ m
/Tm
oy
Fig. 13. rms distribution of the temperature fluctuations along the wakecenter line.
L. Menfoukh et al. / Int. J. Heat and Fluid Flow 29 (2008) 479–494 487
In Fig. 13, the rms distribution of the temperature fluc-tuations shows that the turbulence rate (the fluctuationsintensity) is highest in the vortex formation zone. It is char-acterized by a peak from which the length of vortex forma-tion is given by analogy with the maximum of the velocityrms (Griffin, 1995). We find Lf = 1.25 * d.
Another characteristic length can be inferred from thecurve in Fig. 11. It is the vortex characteristic radius, Rt.In the formation zone, the first vortex boundary startsbeginning from the point where the temperature T is equalto the temperature Tmoy (T = Tmoy). Then, it increases untilit reaches a maximum temperature (top of the peak). Thecurve (Fig. 13) shows that this peak is characterized bymaximum turbulence intensity (vortex center). So, wedefine the vortex characteristic radius as follow: it is thedistance along the x-axis between the point where the tem-
Fig. 14. Temperature fluctuations at x/d = 4 * d along the
perature fluctuations are zero (Fig. 12) and the point wherewe the peak of the fluctuations (vortex center) is reached.Therefore, Rt = 0.43 * d.
4.2. Deformable cylinder
4.2.1. Vortex shedding frequency
In this section, we examine the radial deformation effecton the vortex shedding frequency. For several deformationfrequencies, we draw the temperature variation at the con-sidered point for the non-deformable case (Fig. 14). Wenote, on Fig. 14, that the mean temperature increases untilit reaches a maximum around Fd/F0 = 2. Then, itdecreases, thereafter, when this ratio is increased.
wake center line for different deformation frequencies.
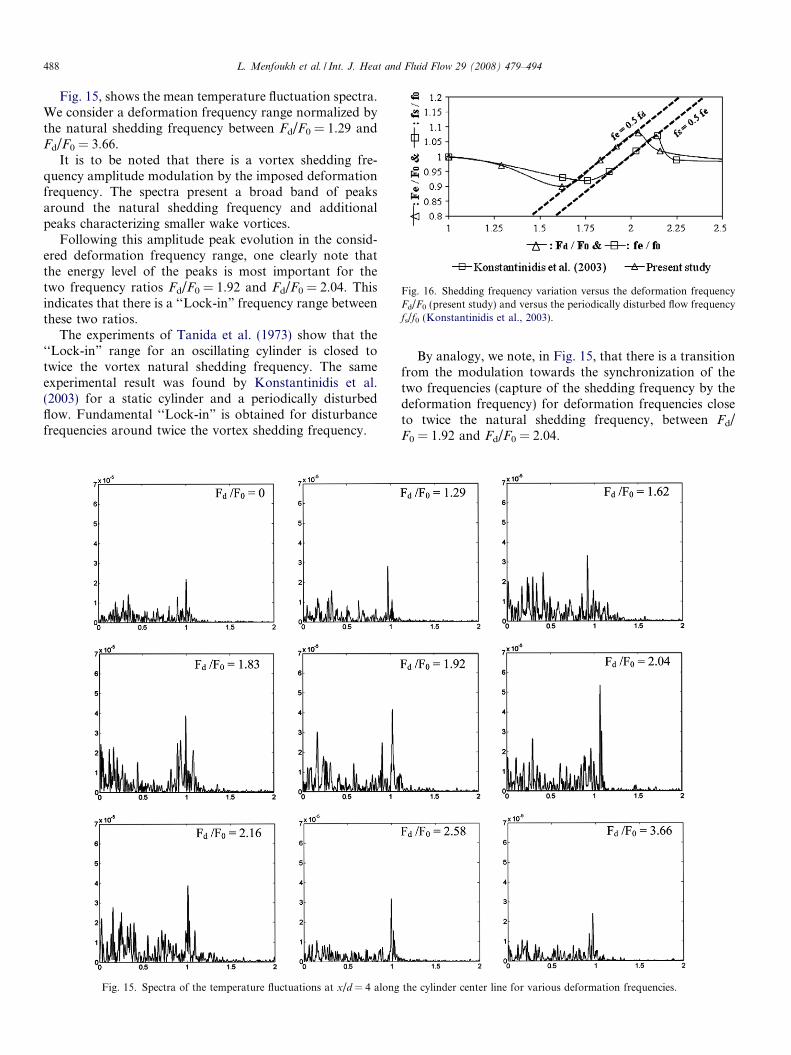
Fig. 16. Shedding frequency variation versus the deformation frequencyFd/F0 (present study) and versus the periodically disturbed flow frequencyfs/f0 (Konstantinidis et al., 2003).
488 L. Menfoukh et al. / Int. J. Heat and Fluid Flow 29 (2008) 479–494
Fig. 15, shows the mean temperature fluctuation spectra.We consider a deformation frequency range normalized bythe natural shedding frequency between Fd/F0 = 1.29 andFd/F0 = 3.66.
It is to be noted that there is a vortex shedding fre-quency amplitude modulation by the imposed deformationfrequency. The spectra present a broad band of peaksaround the natural shedding frequency and additionalpeaks characterizing smaller wake vortices.
Following this amplitude peak evolution in the consid-ered deformation frequency range, one clearly note thatthe energy level of the peaks is most important for thetwo frequency ratios Fd/F0 = 1.92 and Fd/F0 = 2.04. Thisindicates that there is a ‘‘Lock-in” frequency range betweenthese two ratios.
The experiments of Tanida et al. (1973) show that the‘‘Lock-in” range for an oscillating cylinder is closed totwice the vortex natural shedding frequency. The sameexperimental result was found by Konstantinidis et al.(2003) for a static cylinder and a periodically disturbedflow. Fundamental ‘‘Lock-in” is obtained for disturbancefrequencies around twice the vortex shedding frequency.
Fig. 15. Spectra of the temperature fluctuations at x/d = 4 along
By analogy, we note, in Fig. 15, that there is a transitionfrom the modulation towards the synchronization of thetwo frequencies (capture of the shedding frequency by thedeformation frequency) for deformation frequencies closeto twice the natural shedding frequency, between Fd/F0 = 1.92 and Fd/F0 = 2.04.
the cylinder center line for various deformation frequencies.
L. Menfoukh et al. / Int. J. Heat and Fluid Flow 29 (2008) 479–494 489
The synchronized wake frequency is obtained when thedeformation frequency is twice the natural shedding fre-quency. The spectra show peaks with a narrow band, wellestablished at this frequency. Thus the ‘‘Lock-in” isobtained. The periodic amplitude of the wake temperaturefluctuations related to the vortex shedding is undeniablymore important in the vicinity of the ‘‘Lock-in” range.
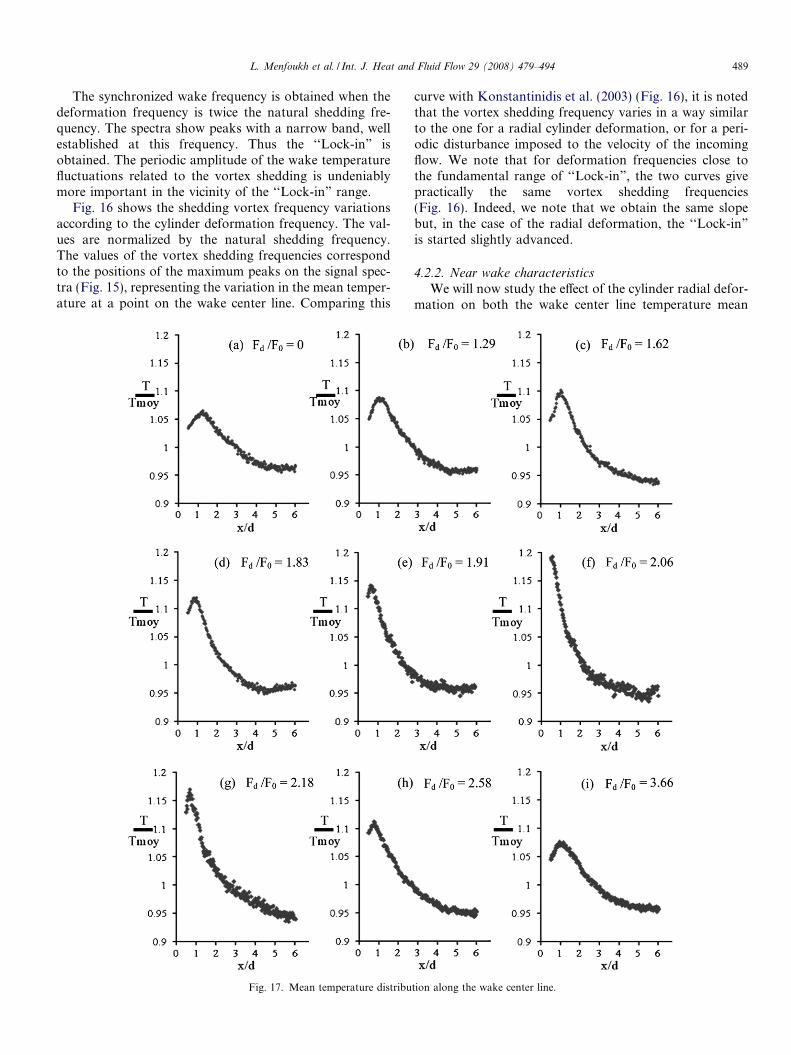
Fig. 16 shows the shedding vortex frequency variationsaccording to the cylinder deformation frequency. The val-ues are normalized by the natural shedding frequency.The values of the vortex shedding frequencies correspondto the positions of the maximum peaks on the signal spec-tra (Fig. 15), representing the variation in the mean temper-ature at a point on the wake center line. Comparing this
Fig. 17. Mean temperature distribu
curve with Konstantinidis et al. (2003) (Fig. 16), it is notedthat the vortex shedding frequency varies in a way similarto the one for a radial cylinder deformation, or for a peri-odic disturbance imposed to the velocity of the incomingflow. We note that for deformation frequencies close tothe fundamental range of ‘‘Lock-in”, the two curves givepractically the same vortex shedding frequencies(Fig. 16). Indeed, we note that we obtain the same slopebut, in the case of the radial deformation, the ‘‘Lock-in”
is started slightly advanced.
4.2.2. Near wake characteristics
We will now study the effect of the cylinder radial defor-mation on both the wake center line temperature mean
tion along the wake center line.
490 L. Menfoukh et al. / Int. J. Heat and Fluid Flow 29 (2008) 479–494
field and fluctuating field distributions. Fig. 17a–i showsthat the general look of the mean temperature field distri-bution is the same as the one we had for the non-deform-able case.
In the vicinity of the cylinder downstream wall (recircu-lation zone), the mean temperature increases graduallyuntil it reaches the point characterizing the beginning ofthe vortices formation zone. Then, it increases abruptlytowards its maximum value, characterized by a peak, fromwhich the formation length is measured. Then, it decreasestowards temperatures equal to those at the beginning.Then, it is spreads out, asymptotically along the remotewake. However, one notices, in the curve (Fig. 17a–i), thatthe formation zone is moved slightly towards the cylinder,showing a light penetration of the recirculation zone by thevortices during their formation.
In Fig. 17b–d, we note that the initial increase in thetemperature is reduced when one increases the frequencyof deformation. This zone disappears completely in thevicinity of the ‘‘Lock-in” frequency (Fig. 17e and f). Thisindicates that the vortices penetrate the recirculation zonecompletely and that they develop directly on the down-
Fig. 18. Non-dimensional temperature fluctuati
Fig. 19. Distributio
stream cylinder wall. The formation zone continues toapproach the cylinder and its maximum temperature (thepeak of the temperature) increases proportionally accord-ing to the deformation frequency. On the other hand, thedimension of this zone is inversely proportional to thedeformation frequency.
Increasing the deformation frequency further (Fig. 19g–i), one notices that the phenomena observed for the twopreceding deformation frequencies are completely reversed.The curve starts to take again the same look as the one ofthe non-deformable case. It loses its monotony as the fre-quency of deformation increases. The recirculation zoneis then initiated in the vicinity of the cylinder and the for-mation zone moves more and more away from the cylinder.Its maximum temperature (top of the peak) decreases andits dimension increases compared to the preceding twocases (Fig. 19e and f).
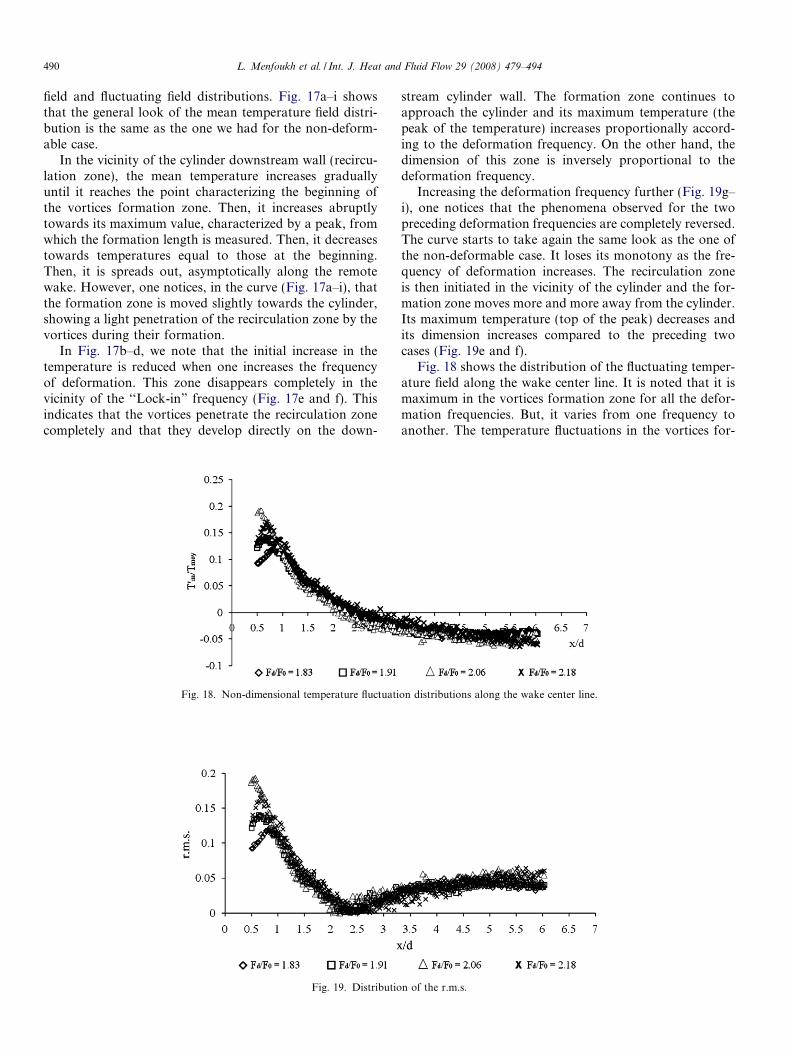
Fig. 18 shows the distribution of the fluctuating temper-ature field along the wake center line. It is noted that it ismaximum in the vortices formation zone for all the defor-mation frequencies. But, it varies from one frequency toanother. The temperature fluctuations in the vortices for-
on distributions along the wake center line.
n of the r.m.s.
L. Menfoukh et al. / Int. J. Heat and Fluid Flow 29 (2008) 479–494 491
mation zone are more important for the deformation fre-quencies close to the fundamental range of ‘‘Lock-in”
(Fd/F0 = 1.92 and Fd/F0 = 2.04).The temperature rms on the wake center line (Fig. 19)
also presents a turbulence maxima in the vortex formationzone. The rate of turbulence, in this zone, varies accordingto the deformation frequency. It is noted that it increaseswhen the deformation frequency increases, reaches a max-imum value in the vicinity of the ‘‘Lock-in” frequency, anddecreases when we continue to increase the deformationfrequency higher than the ‘‘Lock-in” frequency.
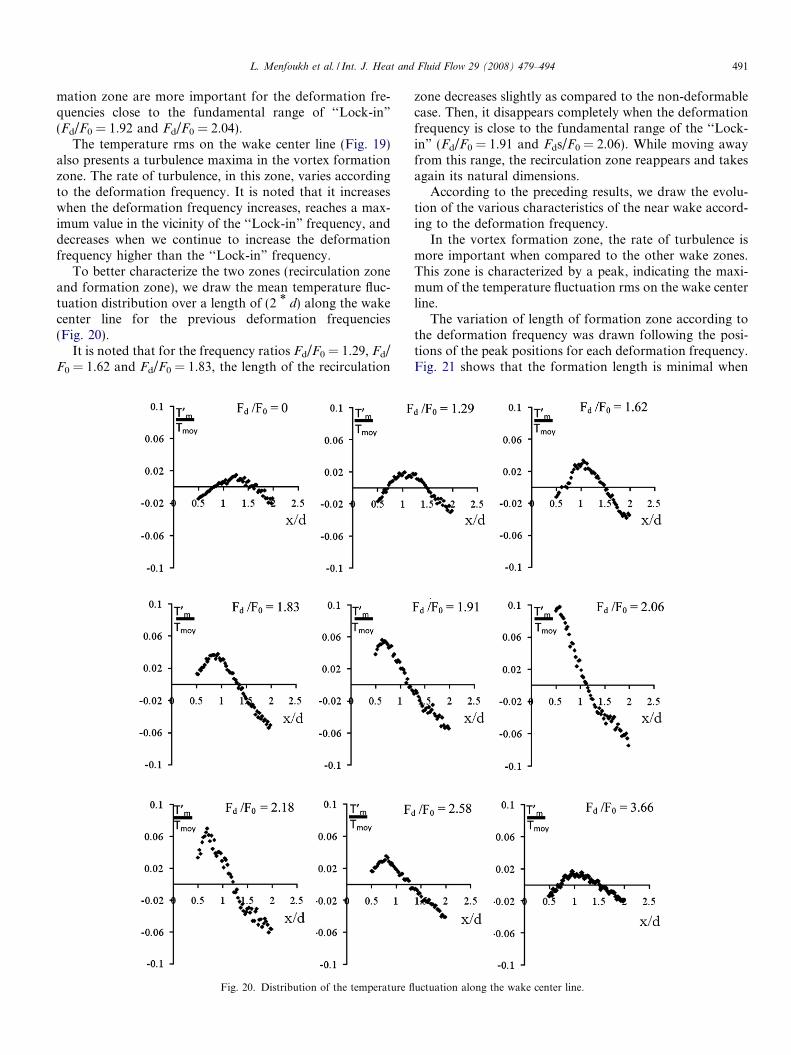
To better characterize the two zones (recirculation zoneand formation zone), we draw the mean temperature fluc-tuation distribution over a length of (2 * d) along the wakecenter line for the previous deformation frequencies(Fig. 20).
It is noted that for the frequency ratios Fd/F0 = 1.29, Fd/F0 = 1.62 and Fd/F0 = 1.83, the length of the recirculation
Fig. 20. Distribution of the temperature fl
zone decreases slightly as compared to the non-deformablecase. Then, it disappears completely when the deformationfrequency is close to the fundamental range of the ‘‘Lock-in” (Fd/F0 = 1.91 and Fds/F0 = 2.06). While moving awayfrom this range, the recirculation zone reappears and takesagain its natural dimensions.
According to the preceding results, we draw the evolu-tion of the various characteristics of the near wake accord-ing to the deformation frequency.
In the vortex formation zone, the rate of turbulence ismore important when compared to the other wake zones.This zone is characterized by a peak, indicating the maxi-mum of the temperature fluctuation rms on the wake centerline.
The variation of length of formation zone according tothe deformation frequency was drawn following the posi-tions of the peak positions for each deformation frequency.Fig. 21 shows that the formation length is minimal when
uctuation along the wake center line.
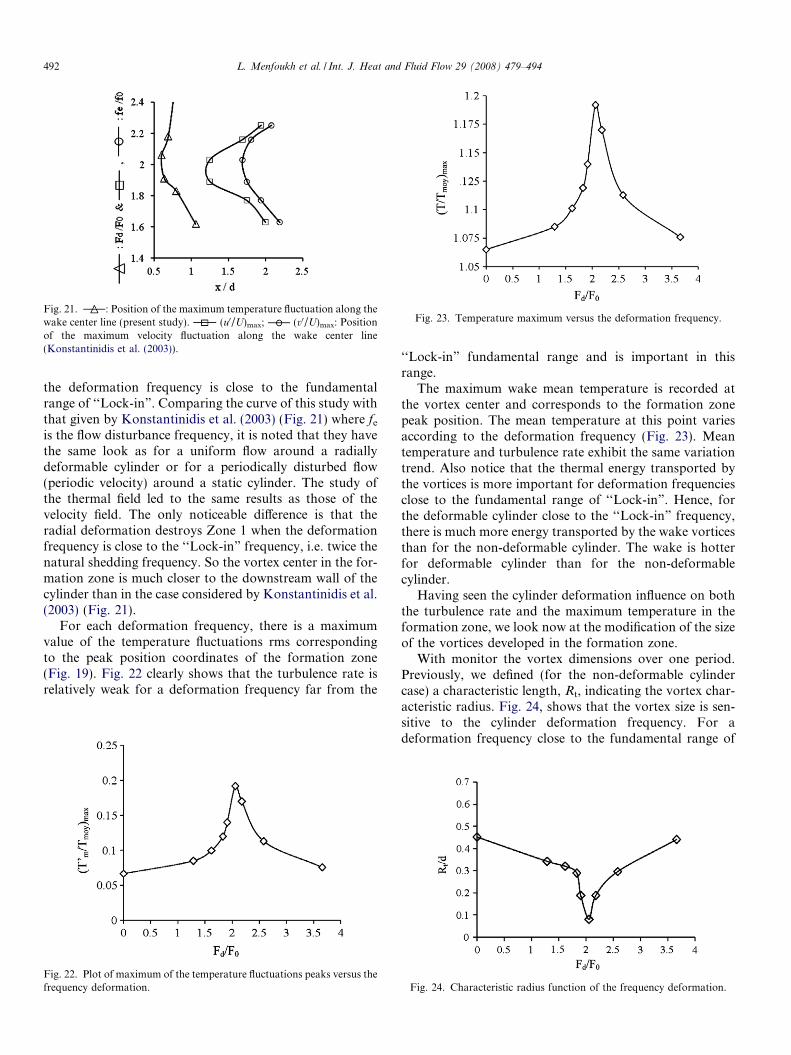
Fig. 21. : Position of the maximum temperature fluctuation along thewake center line (present study). (u0/U)max; (v0/U)max: Positionof the maximum velocity fluctuation along the wake center line(Konstantinidis et al. (2003)).
Fig. 23. Temperature maximum versus the deformation frequency.
492 L. Menfoukh et al. / Int. J. Heat and Fluid Flow 29 (2008) 479–494
the deformation frequency is close to the fundamentalrange of ‘‘Lock-in”. Comparing the curve of this study withthat given by Konstantinidis et al. (2003) (Fig. 21) where fe
is the flow disturbance frequency, it is noted that they havethe same look as for a uniform flow around a radiallydeformable cylinder or for a periodically disturbed flow(periodic velocity) around a static cylinder. The study ofthe thermal field led to the same results as those of thevelocity field. The only noticeable difference is that theradial deformation destroys Zone 1 when the deformationfrequency is close to the ‘‘Lock-in” frequency, i.e. twice thenatural shedding frequency. So the vortex center in the for-mation zone is much closer to the downstream wall of thecylinder than in the case considered by Konstantinidis et al.(2003) (Fig. 21).
For each deformation frequency, there is a maximumvalue of the temperature fluctuations rms correspondingto the peak position coordinates of the formation zone(Fig. 19). Fig. 22 clearly shows that the turbulence rate isrelatively weak for a deformation frequency far from the
Fig. 22. Plot of maximum of the temperature fluctuations peaks versus thefrequency deformation.
‘‘Lock-in” fundamental range and is important in thisrange.
The maximum wake mean temperature is recorded atthe vortex center and corresponds to the formation zonepeak position. The mean temperature at this point variesaccording to the deformation frequency (Fig. 23). Meantemperature and turbulence rate exhibit the same variationtrend. Also notice that the thermal energy transported bythe vortices is more important for deformation frequenciesclose to the fundamental range of ‘‘Lock-in”. Hence, forthe deformable cylinder close to the ‘‘Lock-in” frequency,there is much more energy transported by the wake vorticesthan for the non-deformable cylinder. The wake is hotterfor deformable cylinder than for the non-deformablecylinder.
Having seen the cylinder deformation influence on boththe turbulence rate and the maximum temperature in theformation zone, we look now at the modification of the sizeof the vortices developed in the formation zone.
With monitor the vortex dimensions over one period.Previously, we defined (for the non-deformable cylindercase) a characteristic length, Rt, indicating the vortex char-acteristic radius. Fig. 24, shows that the vortex size is sen-sitive to the cylinder deformation frequency. For adeformation frequency close to the fundamental range of
Fig. 24. Characteristic radius function of the frequency deformation.
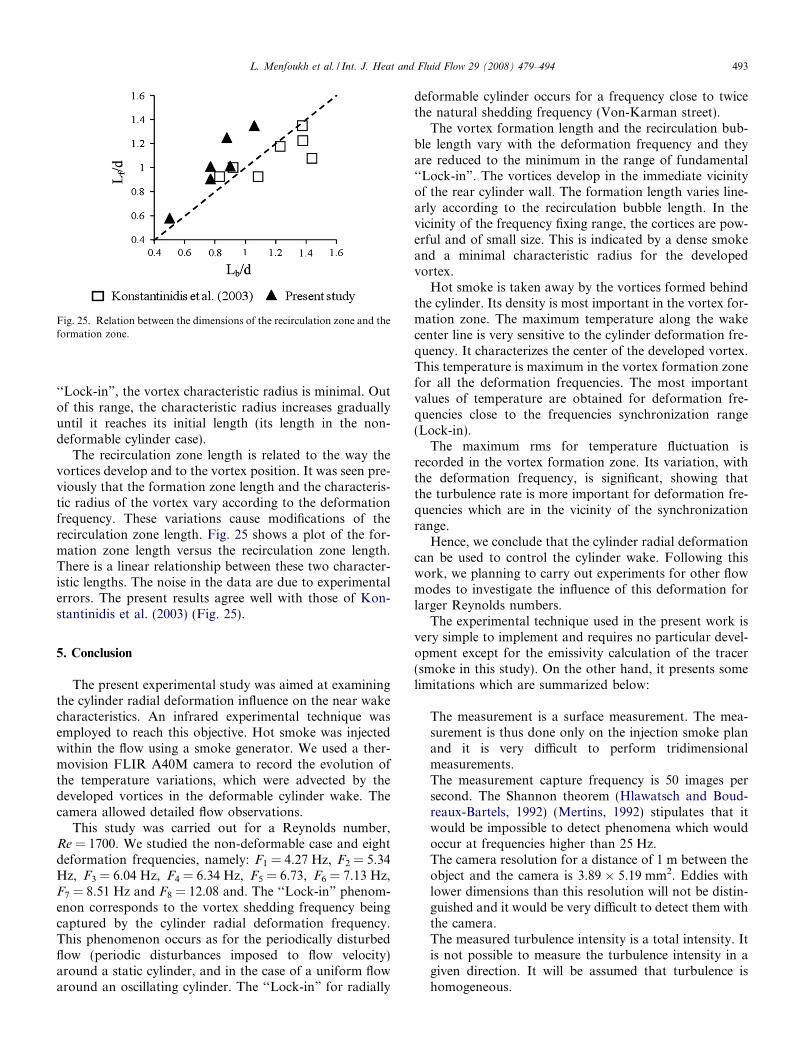
Fig. 25. Relation between the dimensions of the recirculation zone and theformation zone.
L. Menfoukh et al. / Int. J. Heat and Fluid Flow 29 (2008) 479–494 493
‘‘Lock-in”, the vortex characteristic radius is minimal. Outof this range, the characteristic radius increases graduallyuntil it reaches its initial length (its length in the non-deformable cylinder case).
The recirculation zone length is related to the way thevortices develop and to the vortex position. It was seen pre-viously that the formation zone length and the characteris-tic radius of the vortex vary according to the deformationfrequency. These variations cause modifications of therecirculation zone length. Fig. 25 shows a plot of the for-mation zone length versus the recirculation zone length.There is a linear relationship between these two character-istic lengths. The noise in the data are due to experimentalerrors. The present results agree well with those of Kon-stantinidis et al. (2003) (Fig. 25).
5. Conclusion
The present experimental study was aimed at examiningthe cylinder radial deformation influence on the near wakecharacteristics. An infrared experimental technique wasemployed to reach this objective. Hot smoke was injectedwithin the flow using a smoke generator. We used a ther-movision FLIR A40M camera to record the evolution ofthe temperature variations, which were advected by thedeveloped vortices in the deformable cylinder wake. Thecamera allowed detailed flow observations.
This study was carried out for a Reynolds number,Re = 1700. We studied the non-deformable case and eightdeformation frequencies, namely: F1 = 4.27 Hz, F2 = 5.34Hz, F3 = 6.04 Hz, F4 = 6.34 Hz, F5 = 6.73, F6 = 7.13 Hz,F7 = 8.51 Hz and F8 = 12.08 and. The ‘‘Lock-in” phenom-enon corresponds to the vortex shedding frequency beingcaptured by the cylinder radial deformation frequency.This phenomenon occurs as for the periodically disturbedflow (periodic disturbances imposed to flow velocity)around a static cylinder, and in the case of a uniform flowaround an oscillating cylinder. The ‘‘Lock-in” for radially
deformable cylinder occurs for a frequency close to twicethe natural shedding frequency (Von-Karman street).
The vortex formation length and the recirculation bub-ble length vary with the deformation frequency and theyare reduced to the minimum in the range of fundamental‘‘Lock-in”. The vortices develop in the immediate vicinityof the rear cylinder wall. The formation length varies line-arly according to the recirculation bubble length. In thevicinity of the frequency fixing range, the cortices are pow-erful and of small size. This is indicated by a dense smokeand a minimal characteristic radius for the developedvortex.
Hot smoke is taken away by the vortices formed behindthe cylinder. Its density is most important in the vortex for-mation zone. The maximum temperature along the wakecenter line is very sensitive to the cylinder deformation fre-quency. It characterizes the center of the developed vortex.This temperature is maximum in the vortex formation zonefor all the deformation frequencies. The most importantvalues of temperature are obtained for deformation fre-quencies close to the frequencies synchronization range(Lock-in).
The maximum rms for temperature fluctuation isrecorded in the vortex formation zone. Its variation, withthe deformation frequency, is significant, showing thatthe turbulence rate is more important for deformation fre-quencies which are in the vicinity of the synchronizationrange.
Hence, we conclude that the cylinder radial deformationcan be used to control the cylinder wake. Following thiswork, we planning to carry out experiments for other flowmodes to investigate the influence of this deformation forlarger Reynolds numbers.
The experimental technique used in the present work isvery simple to implement and requires no particular devel-opment except for the emissivity calculation of the tracer(smoke in this study). On the other hand, it presents somelimitations which are summarized below:
The measurement is a surface measurement. The mea-surement is thus done only on the injection smoke planand it is very difficult to perform tridimensionalmeasurements.The measurement capture frequency is 50 images persecond. The Shannon theorem (Hlawatsch and Boud-reaux-Bartels, 1992) (Mertins, 1992) stipulates that itwould be impossible to detect phenomena which wouldoccur at frequencies higher than 25 Hz.The camera resolution for a distance of 1 m between theobject and the camera is 3.89 � 5.19 mm2. Eddies withlower dimensions than this resolution will not be distin-guished and it would be very difficult to detect them withthe camera.The measured turbulence intensity is a total intensity. Itis not possible to measure the turbulence intensity in agiven direction. It will be assumed that turbulence ishomogeneous.
494 L. Menfoukh et al. / Int. J. Heat and Fluid Flow 29 (2008) 479–494
References
Armstrong, B.J., Barnes, F.H., Grant, I., 1986. The effect of a perturba-tion on the flow over a bluff cylinder. Phys. Fluids 29, 2095–2102.
Armstrong, B.J., Barnes, F.H., Grant, I., 1987. A comparison of thestructure of the wake behind a circular cylinder in steady flow with thatin a perturbed flow. Phys. Fluids 30, 19–26.
Barbi, C., Favier, D.P., Maresca, C.A., Telionis, D.P., 1986. Vortexshedding and lock-on of a circular cylinder in oscillatory flow. J. FluidMech. 170, 527–544.
Bearman, P.W., 1969. On vortex shedding from a circular cylinder in thecritical Reynolds number region. J. Fluid Mech. 37, 577–587.
Blasius, H., 1908. Grenzchichten in Flussigkeiten mit Kleiner Reiburg. Z.Angew. Math Phys. Engl. Trans. NACA TM-1256 56, 1.
Carberry, J., Sheridan, J., Rockwell, D., 2003. Controlled oscillations of acylinder: a new wake state. J. Fluids Struct. 17, 337–343.
Collins, W.M., Dennis, S.C.R., 1973. Flow past an impulsively startedcircular cylinder. Z. Angew, Math. Phys. Engl.Trans NACA TM-125656, 1.
Coutenceau, M., Bouard, R., 1977. Experimental determination of themain features of the viscous flow in the wake of a circular cylinder inuniform translation. Part-1, steady flow. J. Fluid Mech. 79, 231–256.
Gerrard, J.H., 1966. The mechanics of the formation region of the vorticesbehind bluff bodies. J. Fluid Mech. 25, 401–413.
Govardhan, R., Williamson, C.H.K., 2001. Mean and fluctuating velocityfields in the wake of a freely vibrating cylinder. J. Fluid Struct. 15, 489–501.
Green, R.B., Gerrard, J.H., 1993. Vorticity measurements in the nearwake of a circular cylinder at low Reynolds numbers. J. Fluid Mech.246, 675–691.
Griffin, O.M., 1995. A note on bluff body vortex formation. J. FluidMech. 284, 217–224.
Griffin, O.M., Ramberg, S.E., 1976. Vortex shedding from a cylindervibrating in line with an incident uniform flow. J. Fluid Mech. 75, 526–537.
Griffin, O.M., Votaw, C.W., 1972. The vortex street in the Wake ofvibrating cylinder. Appl. Mech. Rev. 51, 31–48.
Hall, S.E., Griffin, O.M., 1993. Vortex shedding and lock-on in aperturbed flow. ASME J. Fluids Eng. 115, 283–291.
Hanchi, S., 1998. Contribution a l’etude de l’ecoulement et du transfert dechaleur autour d’un cylindre deformable. D. Phil. Thesis, University ofValenciennes and Hainaut-Cambresis.
Hlawatsch, F., Boudreaux-Bartels, G.F., 1992. Linear and quadratic time–frequency signal representations. IEEE Signal Process. Mag. 9 (2), 21–67.
Konstantinidis, E., Balabani, S., Yianneskis, M., 2003. effect of flowperturbations on the near wake characteristics of a circular cylinder. J.Fluid Struct 18, 367–386.
Koumoutsakos, P., Leonard, A., 1995. High-resolution simulations of theflow around the impulsively started cylinder using vortex method. J.Fluid Mech. 296, 1–38.
Kovasznay, L.S.G., 1970. The turbulent boundary layer. Ann. Rev. FluidMech. 2, 95–112.
Krishnamoorthy, S., Price, S.J., Paidoussis, M.P., 2001. Cross-flow pastan oscillating circular cylinder: synchronization phenomena in the nearwake. J. Fluid Struct. 15, 955–980.
Kundu, P.K., Cohen, I.M., 2002. Fluid Mechanics, second ed. AcademicPress, Elsevier Science, USA, pp. 545–546.
Mertins, A., 1992. Signal Analysis: Wavelets, Filters Banks, Time–Frequency Transformations and Applications. John Wiley & Sons, pp.221–230.
Ongoren, A., Rockwell, D., 1988. Flow structure from an oscillatingcylinder. Part 2. Mode competition in the near wake. J. Fluid Mech.191, 225–245.
Oualli, H., Hanchi, S., Bouabdallah, A., Askovic, R., 2004. Experimentalinvestigation of the flow around a radially vibrating circular cylinder.J. Exp. Fluids 37 (6), 789–801.
Payne, R.B., 1958. Calculations of unsteady viscous flow past a circularcylinder. J. Fluid Mech. 4, 13.
Sarpkaya, T., 1979. Vortex induced oscillations. J. Appl. Mech. 46, 241–258.
Tanida, Y., Okajima, A., Watanabe, Y., 1973. Stability of a circularcylinder oscillating in uniform flow or in wake. J. Fluids Mech. 61,769–784.
Ta Phuoc, L., 1980. Numerical analysis of unsteady secondary vorticesgenerated by an impulsively started circular cylinder. J. Fluid Mech.100 (1), 111–128.
Ta Phuoc, L., Bouard, R., 1985. Numerical solution of the early stage ofthe unsteady viscous flow around a circular cylinder: a comparisonwith experimental visualization and measurements. J. Fluid Mech. 160,93–117.
Thom, A., 1933. The flux past circular cylinders at low speeds. Proc. R.Soc. Lond. A 141, 651.
Tomotika, S., Aoi, T., 1950. The steady flow of viscous fluid past a sphereand circular cylinders at small Reynolds numbers. Quart. J. Mech.Appl. Math. 3 (2), 140–161.
Zdravkovich, M.M., 1996. Different modes of vortex shedding: anoverview. J. Fluid Struct. 10, 427–437.