American WAKE experimeNt (AWAKEN) - NREL
44
NREL is a national laboratory of the U.S. Department of Energy Office of Energy Efficiency & Renewable Energy Operated by the Alliance for Sustainable Energy, LLC This report is available at no cost from the National Renewable Energy Laboratory (NREL) at www.nrel.gov/publications. Contract No. DE-AC36-08GO28308 Technical Report NREL/TP-5000-75789 May 2020 American WAKE experimeNt (AWAKEN) Patrick Moriarty, 1 Nicholas Hamilton, 1 Mithu Debnath, 1 Tommy Herges, 2 Brad Isom, 3 Julie K. Lundquist, 1,4 David Maniaci, 2 Brian Naughton, 2 Rebecca Pauly, 1 Jason Roadman, 1 Will Shaw, 3 Jeroen van Dam, 1 and Sonia Wharton 5 1 National Renewable Energy Laboratory 2 Sandia National Laboratories 3 Pacific Northwest National Laboratory 4 University of Colorado Boulder 5 Lawrence Livermore National Laboratory
-
Upload
khangminh22 -
Category
Documents
-
view
0 -
download
0
Transcript of American WAKE experimeNt (AWAKEN) - NREL
NREL is a national laboratory of the U.S. Department of Energy Office of Energy Efficiency & Renewable Energy Operated by the Alliance for Sustainable Energy, LLC This report is available at no cost from the National Renewable Energy Laboratory (NREL) at www.nrel.gov/publications.
Contract No. DE-AC36-08GO28308
Technical Report NREL/TP-5000-75789 May 2020
American WAKE experimeNt (AWAKEN) Patrick Moriarty,1 Nicholas Hamilton,1 Mithu Debnath,1 Tommy Herges,2 Brad Isom,3 Julie K. Lundquist,1,4 David Maniaci,2 Brian Naughton,2 Rebecca Pauly,1 Jason Roadman,1 Will Shaw,3 Jeroen van Dam,1 and Sonia Wharton5 1 National Renewable Energy Laboratory 2 Sandia National Laboratories 3 Pacific Northwest National Laboratory 4 University of Colorado Boulder 5 Lawrence Livermore National Laboratory
NREL is a national laboratory of the U.S. Department of Energy Office of Energy Efficiency & Renewable Energy Operated by the Alliance for Sustainable Energy, LLC This report is available at no cost from the National Renewable Energy Laboratory (NREL) at www.nrel.gov/publications.
Contract No. DE-AC36-08GO28308
National Renewable Energy Laboratory 15013 Denver West Parkway Golden, CO 80401 303-275-3000 • www.nrel.gov
Technical Report NREL/TP-5000-75789 May 2020
American WAKE experimeNt (AWAKEN) Patrick Moriarty,1 Nicholas Hamilton,1 Mithu Debnath,1 Tommy Herges,2 Brad Isom,3 Julie K. Lundquist,1,4 David Maniaci,2 Brian Naughton,2 Rebecca Pauly,1 Jason Roadman,1 Will Shaw,3 Jeroen van Dam,1 and Sonia Wharton5 1 National Renewable Energy Laboratory 2 Sandia National Laboratories 3 Pacific Northwest National Laboratory 4 University of Colorado Boulder 5 Lawrence Livermore National Laboratory
Suggested Citation Moriarty, Patrick, Nicholas Hamilton, Mithu Debnath, et al. 2020. American WAKE experiment (AWAKEN). Golden, CO: National Renewable Energy Laboratory. NREL/TP-5000-75789. https://www.nrel.gov/docs/fy20osti/75789.pdf.
NOTICE
This work was authored in part by the National Renewable Energy Laboratory, operated by Alliance for Sustainable Energy, LLC, for the U.S. Department of Energy (DOE) under Contract No. DE-AC36-08GO28308. Funding provided U.S. Department of Energy Wind Energy Technologies Office. The views expressed herein do not necessarily represent the views of the DOE or the U.S. Government.
This work was performed under the auspices of the U.S. Department of Energy by Lawrence Livermore National Laboratory under Contract DE-AC52-07NA27344. This report is also published as Lawrence Livermore National Laboratory Technical Report LLNL-TR-806278.
Pacific Northwest National Laboratory is operated by Battelle Memorial Institute for the DOE under Contract DE- AC05-76RL01830.
Sandia National Laboratories is a multimission laboratory managed and operated by National Technology & Engineering Solutions of Sandia LLC, a wholly owned subsidiary of Honeywell International Inc., for the U.S. Department of Energy's National Nuclear Security Administration under contract DE-NA0003525. This report is also published as Sandia National Laboratories Report SAND2020-4296 O.
This report is available at no cost from the National Renewable Energy Laboratory (NREL) at www.nrel.gov/publications.
U.S. Department of Energy (DOE) reports produced after 1991 and a growing number of pre-1991 documents are available free via www.OSTI.gov.
Cover Photos by Dennis Schroeder: (clockwise, left to right) NREL 51934, NREL 45897, NREL 42160, NREL 45891, NREL 48097, NREL 46526.
NREL prints on paper that contains recycled content.
Executive Summary
The national laboratories, directed by the U.S. Department of Energy Wind Energy Technologies Office, will organize,
design, and execute a landmark international wake observation and validation campaign known as the American
WAKE experimeNt or AWAKEN. This document describes the vision and purpose for AWAKEN and describes some
of the organizational activities that have taken place to date. The driving need for this experimental campaign is that
wake interactions are among the least understood physical phenomena in wind plants today, leading to unexpected
power and financial losses. New observation data gathered will be used to further validate wind plant models and
lead to both improved layout and more optimal operation of wind farms with greater power production and improved
reliability, ultimately leading to lower wind energy costs.
This campaign will occur in the U.S. Midwest, where the largest concentration of wind farms in the U.S. is located
and where significant future growth is most likely. The field campaign will provide a data set that is unique among
wake studies, based on location, scope, and observational fidelity: most wake studies have largely focused on offshore
wind farms, which are not currently critical to the U.S. wind energy supply, and with a limited number of observations.
While AWAKEN is focused on land-based wind farms in flat terrain, many of the observations will help researchers
understand fundamental wake behavior applicable in both offshore and complex terrain environments.
Project organization has begun with initial kickoff meetings to stimulate interest in the community and prioritize
science goals that a new wake field campaign can and should accomplish. The design of the experimental campaign
will rely on the successful collaborative model based on one used within the New European Wind Atlas. Leading up
to the experiment, U.S.-Department-of-Energy-funded researchers will assist interested participants with developing
proposals for individual external funding agencies to build a large collaborative team funded through multiple sources.
The AWAKEN team will include industry members, such as wind farm owners, who wish to learn more about wake
impacts within their wind farms, turbine manufacturers who want to study turbine response in wind farm environments,
and observational measurement companies with a desire to demonstrate their own sensing technology applied to the
wind energy wake problem. The national laboratories are uniquely suited to assemble the international team to perform
the observational and model validation campaign envisioned.
Researchers will narrow their experimental design and select a site that will fulfill the critical science goals identified
by the international group of experts. Once a site has been identified, numerical studies of the potential observation
campaign will be conducted to give researchers a sense of quantities that can be observed and to what resolution in
the weather situations typical of this location. These simulations will also assist researchers in identifying optimal
placement of instruments for the greatest potential benefit toward validation of numerical models. Concurrently,
researchers will develop a roadmap for advanced microscale sensing technologies to improve observational capabilities
of complex flow fields within wind plants. The expert-driven roadmap will guide the multiyear effort to advance
remote sensing technologies specifically for wind energy applications. New sensing technologies will be simulated
and potentially prototyped for use in the AWAKEN campaign, once sufficient measurement quality and reliability are
achieved.
Researchers will then identify the optimal instrumentation to acquire through purchase, rental, or collaboration and
then commence setup of the experiment. With all partners in place, the experiment will be executed through an
iterative process of observation and model validation focused primarily on the important wake science goals outlined
in planning meetings. Researchers will develop new model validation benchmarks that will be used internationally
to improve a wide range of wind plant models worldwide. Data gathered from the field campaign and a select set of
validation simulations will be made publicly available through the Atmosphere to Electrons Data Archive and Portal. A
series of publications of the field campaign and validation studies will be prepared and presented at relevant academic
and industry events.
This report is available at no cost from the National Renewable Energy Laboratory (NREL) at www.nrel.gov/publications1
Contents
Executive Summary . . . . . . . . . . . . . . . . . . . . . . . . . . . . . . . . . . . . . . . . . . . . . . . . ii
1 Introduction . . . . . . . . . . . . . . . . . . . . . . . . . . . . . . . . . . . . . . . . . . . . . . . . . . 1
2 Previous Wake Observation Campaigns . . . . . . . . . . . . . . . . . . . . . . . . . . . . . . . . . . . 22.1 Future Directions for Observational Technology . . . . . . . . . . . . . . . . . . . . . . . . . . . . . 3
3 Project Objectives and Outcomes . . . . . . . . . . . . . . . . . . . . . . . . . . . . . . . . . . . . . . . 4
4 Project Tasks . . . . . . . . . . . . . . . . . . . . . . . . . . . . . . . . . . . . . . . . . . . . . . . . . . 54.1 Test Planning . . . . . . . . . . . . . . . . . . . . . . . . . . . . . . . . . . . . . . . . . . . . . . . 54.2 Partnership Engagement . . . . . . . . . . . . . . . . . . . . . . . . . . . . . . . . . . . . . . . . . 74.3 Microscale Instrumentation Development . . . . . . . . . . . . . . . . . . . . . . . . . . . . . . . . 74.4 Experimental Design . . . . . . . . . . . . . . . . . . . . . . . . . . . . . . . . . . . . . . . . . . . 84.5 Experimental Execution . . . . . . . . . . . . . . . . . . . . . . . . . . . . . . . . . . . . . . . . . . 104.6 Data Analysis and Model Validation and Archival . . . . . . . . . . . . . . . . . . . . . . . . . . . . 10
5 Expert Elicitation Meeting . . . . . . . . . . . . . . . . . . . . . . . . . . . . . . . . . . . . . . . . . . 125.1 Key Points by Speakers . . . . . . . . . . . . . . . . . . . . . . . . . . . . . . . . . . . . . . . . . . 125.2 Feedback Sessions . . . . . . . . . . . . . . . . . . . . . . . . . . . . . . . . . . . . . . . . . . . . 12
6 Next Steps . . . . . . . . . . . . . . . . . . . . . . . . . . . . . . . . . . . . . . . . . . . . . . . . . . . 16
7 Timeline and Milestones . . . . . . . . . . . . . . . . . . . . . . . . . . . . . . . . . . . . . . . . . . . . 17
References . . . . . . . . . . . . . . . . . . . . . . . . . . . . . . . . . . . . . . . . . . . . . . . . . . . . . 18
A Science Goals . . . . . . . . . . . . . . . . . . . . . . . . . . . . . . . . . . . . . . . . . . . . . . . . . . 23A.1 Instrumentation Matched to Science Questions . . . . . . . . . . . . . . . . . . . . . . . . . . . . . 26
B Feedback sessions . . . . . . . . . . . . . . . . . . . . . . . . . . . . . . . . . . . . . . . . . . . . . . . 28B.1 Feedback Session #1 - Science Goals . . . . . . . . . . . . . . . . . . . . . . . . . . . . . . . . . . . 28B.2 Feedback Session #2 - Science Goal Prioritization . . . . . . . . . . . . . . . . . . . . . . . . . . . . 30B.3 Feedback Session #3 - Testing Plan Feedback . . . . . . . . . . . . . . . . . . . . . . . . . . . . . . 30
C Expert Elicitation Meeting Agenda . . . . . . . . . . . . . . . . . . . . . . . . . . . . . . . . . . . . . . 36
D Expert Elicitation Meeting Attendees . . . . . . . . . . . . . . . . . . . . . . . . . . . . . . . . . . . . 38
This report is available at no cost from the National Renewable Energy Laboratory (NREL) at www.nrel.gov/publications2
1 Introduction
The American WAKE experimeNt (AWAKEN) is an international multi-institutional wind energy field campaign to
better understand wake losses within operational wind farms. Wake interactions are among the least understood phys-
ical interactions in wind plants today, leading to unexpected power and profit losses. For example, Ørsted, the world’slargest offshore wind farm developer, recently announced (Ørsted 2019) a downward revision in energy estimates
across their energy generation portfolio, primarily caused by underprediction of energy losses from wind farm block-age and wakes. In their announcement, they noted that the standard industry models used for their original energyestimates were inaccurate, and this was likely an industry-wide issue. To help further improve and validate wind plant
models across scales from individual turbines as well as interfarm interactions between plants, new observations, such
as those planned for AWAKEN, are critical. These model improvements will enable both improved layout and moreoptimal operation of wind farms with greater power production and improved reliability, ultimately leading to lowerwind energy costs.
The average wind power plant in the United States loses 10% of its potential energy production to wake interactions
between turbines and wind farms (Clifton, Smith, and Fields 2016), some of which may be recoverable throughadvanced wind farm design and operation. The models used to predict these losses have uncertainty levels of 20%–50%, which lead to excessive wind project financial costs. The reduction in overall plant power output and themechanical stresses associated with transient turbine-to-turbine wake interaction are among the major causes of poorwind plant performance as well as a contributor to degraded turbine reliability. Addressing these issues requiresdetailed knowledge about the complex fluid dynamic interactions throughout a plant and well-validated models topredict future performance and impacts. The ability to predict wake evolution, merging, and dissipation, along withplant inflow conditions and turbine control strategies, will improve optimization of plant layout, power output, andturbine reliability. More accurate modeling capabilities can also lead to revolutionary turbine and plant designs thatwill support the renewable-energy-centered grid of the future (Veers et al. 2019). Because of their impact on windplant profitability and unresolved physical understanding, wakes have been a significant focus of the U.S. Departmentof Energy’s (DOE’s) Atmosphere to Electrons (A2e) program (Cline, Haupt, and Shaw 2017) since its inception, andAWAKEN represents a culmination of the work done within this program to date.
Numerous data sets gathered from around the world have been used in initial validation studies of increasing sophis-tication with the passage of time. Some of the first data sets consisted primarily of coarse observations of wakesusing supervisory control and data acquisition (SCADA) data available from offshore wind farms (e.g., Barthelmieet al. 2010; Hansen et al. 2012). More recently, new data sets have directly measured the wake and its impact. Theadvent of scanning lidar and scanning radar technology led to remote-sensing studies of individual wakes. Some ofthese campaigns took place at DOE facilities (Smalikho et al. 2013; Aitken et al. 2014a), research sites (Iungo, Wu,and Porté-Agel 2013; Vollmer et al. 2015; Machefaux et al. 2016; Kumer et al. 2016; Trujillo et al. 2016; Krish-namurthy et al. 2017), or at commercial facilities (Käsler et al. 2010; Hirth et al. 2012; Iungo, Wu, and Porté-Agel2013; Aitken and Lundquist 2014; Bodini, Zardi, and Lundquist 2017; Menke et al. 2018; Wildmann, Vasiljevic, andGerz 2018; Bromm et al. 2018). Recent field campaigns have also included two measurement campaigns currentlytaking place under the A2e Wake Dynamics program: the Sandia National Laboratories (Sandia) Scaled Wind FarmTechnology (SWiFT) wake measurement and validation campaign (Herges et al. 2017; Doubrawa et al. 2019) and theNextEra Peetz Table wake steering campaign (Fleming et al. 2019; Murphy, Lundquist, and Fleming 2019; Fleminget al. 2020). Experiments at the SWiFT facility on smaller-scale V27 turbines have produced the highest resolutiondata to date ( ∼ 1 . 25 m) (Herges et al. 2017), but questions remain as to what physics are sufficiently representedthat are relevant to modern utility-scale turbines. The ongoing test at Peetz Table has primarily utilized SCADA dataoutput, with a small effort to directly observe wakes using scanning lidars.
To beyond smaller-scale and ungeneralizable tests that examine the wakes from a handful of turbines and capturefull-plant interaction physics, a multinational wakes experiment is needed. This new experiment can leverage theexperience, instrumentation, and combined funding of multiple institutions to create the most highly detailed, com-prehensive wind energy wake experiment to date is needed.
Investment in augmented observational technology is also required to complement high-fidelity simulations to improvethe systematic validation of wind plant modeling tools. Validation has not advanced as quickly as model development,
This report is available at no cost from the National Renewable Energy Laboratory (NREL) at www.nrel.gov/publications3
mainly because of the lack of observations at a similar range of fidelities, particularly for full-scale wind plants. Re-cent advances in remote-sensing technology, such as Ka-band and X-band radars, have been promising (Nygaard and
Newcombe 2018), but further development across a range of technologies is necessary to improve data availabil-ity, temporal and spatial resolution, and the reliability of observations of quantities of interest related to wind plantperformance.
2 Previous Wake Observation Campaigns
Wind energy wake experiments have taken place since the 1970s and can generally be separated into two categories:wind tunnel testing and field testing in the atmosphere. Both approaches are helpful for improved understanding ofwind plant atmosphere interactions, but have limitations leading to knowledge gaps to be addressed by AWAKEN.Wind tunnel tests are executed in a controlled environment where flow conditions are well quantified but lack large-scale atmospheric behavior, which can only be addressed through full-scale testing. Early and more recent field tests atsmaller than utility scale have provided valuable information about single wake formation and evolution, but lack thephysics of larger farms, such as deep array effects and farm blockage. Utility-scale observations have been limited tolower-fidelity observations and an inability to control the driving physical processes. A large-scale field campaign suchas AWAKEN will fill many of the knowledge gaps of previous observations by providing higher fidelity measurementsacross a wider range of scales, particularly at the mesoscale where data are limited.
Researchers have performed wind tunnel tests of single turbines (e.g., Krogstad and Adaramola 2012, some of whichinclude the impacts of atmospheric stability (e.g., Chamorro and Porté-Agel 2010. There have also been studies ofscaled full wind farms within wind tunnels (e.g., Cal et al. 2010; Hamilton and Cal 2015. Such studies have beenuseful for calibration of wind farm models and studies of wind farm layout impacts.
At full scale, measurements of older and smaller turbines have produced valuable data sets for the early wind industry.For example, in a series of observations at Sexberium (Cleijne 1992, 1993), a wind farm containing eighteen 310-kW turbines and three meteorological masts proved useful for model intercomparison and validation (Moriarty etal. 2014). In this data set, tower-based wind speed measurements were taken over a period of 6 months and wakeimpacts measured as the wind changed directions for multiple rotors and downstream spacings.
Some years later, operational data from full-scale offshore wind farms have been used for better understanding of windfarm flows, such as in the ENDOW project (Rados et al. 2001) and UpWind project (Barthelmie et al. 2011). SCADAdata taken from Horns Rev, a wind farm in the Danish North Sea, have been popular and serve as a base validationdata set for many industry and research wind farm wake models (Barthelmie et al. 2009; Hansen et al. 2012). Thefocus on offshore experiments has been because lower turbulence levels result in longer propagation of wakes, whichare thought to have greater impact offshore than wakes from land-based wind farms. These validation cases are basedon meteorological observations coupled with turbine supervisory control and SCADA data, binned according to winddirection, atmospheric stability, and turbulence.
SCADA data have also been useful to diagnose large-scale interactions between wind plants (Nygaard 2014; Nygaardand Hansen 2016). These studies highlighted the importance of accounting for spatial variations in inflow condi-tions that must be observed as wind farm size increases. The disadvantages of these offshore data sets are that theatmospheric conditions, such as wind direction and stability, as well as detailed turbine characteristics and operatingbehavior, are not always observed or reported. In any full-scale test, turbine design information, particularly controlsystem behavior, is often proprietary, making scientific analysis and comparisons to models more difficult.
More high-fidelity observations with direct measurement of wakes using remote sensing are now being used to aug-ment data taken from wind farm SCADA systems. Remote-sensing measurements made in land-based wind farmshave provided direct observation of wakes (e.g., Barthelmie et al. 2006; Krishnamurthy et al. 2017, and similar vali-dation studies were also done for land-based scale turbines (Machefaux et al. 2016), including the DOE Crop WindEnergy Experiment campaign, as published in Rajewski et al. 2013; Rajewski et al. 2014; Bodini, Zardi, and Lundquist2017; Lee and Lundquist 2017; Muñoz-Esparza et al. 2017; Sanchez Gomez and Lundquist 2020. Researchers havealso found value in airborne and unmanned aerial vehicle observations that can be used to augment remote sensing(Kocer et al. 2011; Reuder and Jonassen 2012; Wildmann et al. 2014; Lundquist and Bariteau 2015).
This report is available at no cost from the National Renewable Energy Laboratory (NREL) at www.nrel.gov/publications4
Remote-sensing instruments are also valuable in gathering wind field data of an atmospheric boundary layer profileneeded for wind energy. For example, there have been field campaigns using remote-sensing instruments in land-based
(Rhodes and Lundquist 2013; Klein et al. 2015; Wilczak et al. 2015; Bianco et al. 2017; Lundquist et al. 2017; Mann et
al. 2017; Wilczak et al. 2019) and offshore (Pichugina et al. 2012) locations to examine the inflow and thermodynamic
conditions within potential wind energy areas. Radiometers used in many of these campaigns have been valuable fordetermining atmospheric stability, which can substantially influence turbine wake behavior.
New remote-sensing measurements are becoming available that will serve as validation data sets for the near future.New observations with scanning lidars (Bingöl, Mann, and Larsen 2010; Käsler et al. 2010; Trujillo et al. 2011;
Aitken et al. 2014b; Iungo and Porté-Agel 2014; Aitken and Lundquist 2014; Banta et al. 2015) are proving valuable;
for example, Sandia National Laboratories have the SWiFT facility, and researchers there have performed detailed
observations of a single turbine wake using a high-resolution scanning lidar (Herges et al. 2017). Remote-sensing
techniques will continue to be important as turbines grow in size, and more traditional meteorological towers will
become cost prohibitive at larger heights. New technologies, such as Ka- and X-band radars, are making real-time
measurements of entire wind farm interactions and wind farm wakes possible (Hirth et al. 2012; Nygaard and New-
combe 2018). Additionally, using an offshore synthetic aperture radar is a promising method for investigating wind
farm wakes (Christiansen and Hasager 2005; Ahsbahs et al. 2018; Jagdish et al. 2018; Hasager et al. 2019). While
combining satellite with aircraft observations has been shown to be useful (Emeis et al. 2016), larger scale instru-
mented aircraft can measure wind speed, wind direction, turbulence, and temperature data within the wind farm or
wake from wind farms (Platis et al. 2018; Tucker et al. 2018). In complex terrain, recent observations (Menke et
al. 2018; Barthelmie et al. 2018; Wildmann, Kigle, and Gerz 2018) of single-turbine wakes show that local features of
the surface topology can have significant effects on wake evolution.
2.1 Future Directions for Observational Technology
The importance of gathering quality data within the atmosphere is not limited to the wind energy community. Re-
searchers in the atmospheric, aeronautical, and even planetary exploration communities are exploring new technolo-
gies for atmospheric observation. The quantities of interest for each community may be diverse, but the AWAKEN
project and wind energy industry as a whole can benefit from what is being done in other sectors.
A major task within AWAKEN is the development and execution of an instrumentation development roadmap that
will advance the state of the art in observational technologies for wind energy applications. The AWAKEN team will
organize a group of researchers and industry partners early in the project to create this roadmap. They will build on
similar roadmaps developed in other communities, such as recent ones published by the National Academy of Sciences
(Board, Sciences, and Medicine 2018) and the National Center for Atmospheric Research (Vömel et al. 2018; Geerts
et al. 2018).
Given the growing size of turbines and potential cost of more traditional tower-based observation systems, much focus
will be on remote-sensing technologies based on the ground, in the air, and possibly in space. Note that AWAKEN
will serve as a starting point for other field campaigns; much of the instrumentation deployed will also be deployed
for a future DOE-planned offshore wind farm field experiment in the United States, known as the Wind Forecast
Improvement Project 3 (WFIP3). Of particular importance for AWAKEN is gathering observations of the sort of
mesoscale impacts on wind turbine wakes that have been observed offshore (e.g., Emeis et al. 2016; Platis et al. 2018),
as land-based data are not currently available.
This report is available at no cost from the National Renewable Energy Laboratory (NREL) at www.nrel.gov/publications5
3 Project Objectives and Outcomes
The overall objective of this project is to gather high-fidelity observations of wind turbines and power plants operatingin representative atmospheric conditions and to use the data to advance the understanding of wind plant physics. Thedata gathered as part of this project will also be used to validate computational simulation tools developed under the
A2e initiative and by project partners. Advanced instrumentation for microscale observation will be developed and
deployed to enable higher-resolution observations beyond present capabilities. Validation studies will be undertaken
for both high-performance and engineering models of wind plant operation and design, as well as publicly shared, to
ensure dissemination of this work to the wind research and development and industry community. Specific multiyear
project objectives are to:
1. Acquire high-quality, high-resolution wind plant wake data sets suitable for the validation of wind turbine and
wind plant high-fidelity modeling tools.
2. Demonstrate validation and uncertainty quantification of computational modeling tools developed under the A2e
initiative and those of project partners.
3. Advance the fundamental understanding of wind turbine and wind plant physics.
4. Enhance measurement instrumentation and methods as needed to support validation data requirements.
5. Create an international team to observe critical wind plant phenomena and advance wind plant models.
6. Leverage funding opportunities outside of DOE and partnerships to design and collect the highest-quality wind
plant observational data set to date.
Advanced observation of wind turbine wakes at utility scale will produce a unique data set for validating high-fidelity
models, reduce the uncertainty of a range of wake models, and lead to better overall design and operation of wind
plants. This data set will be unique as a U.S. wind energy resource and therefore provide validation data for U.S.
developers and manufacturers. By advancing observational technology, researchers will be in a better position to
gather observational data with quantified uncertainty at the temporal and spatial resolution required to properly confirm
new theories and validate models for wind farm performance. New technology will help enhance the fundamental
understanding of wind plant flow physics by research and industry communities alike. Technology transfer will benefit
industry by providing more advanced observational tools for understanding the wind resource, wake interactions, and
other phenomena of interest that drive wind plant performance and industry profits.
This report is available at no cost from the National Renewable Energy Laboratory (NREL) at www.nrel.gov/publications6
4 Project Tasks
The key tasks for the AWAKEN project are: organize an international team to perform new wind farm observations,
leverage funding and partnership opportunities external to DOE, design the experiment, advance the state of the artin microscale observational technologies, execute the experiment, perform useful validation studies to advance windplant models, and disseminate validation data and publish research results.
4.1 Test Planning
One of the first subtasks in the project will be to finalize the science goals of the AWAKEN field campaign. These goalsare aligned with the A2e verification and validation documents (Hills, Maniaci, and Naughton 2015) and presentedin detail through phenomena importance and ranking tables (Maniaci 2016). These goals were further prioritizedduring an international expert meeting held in 2018 to begin defining the motivation and objectives of the new fieldcampaign, which is explained in more detail in Section 5 and Appendix A. The science goals identified by NationalRenewable Energy Laboratory (NREL) researchers and the international community range from turbulence breakdownof individual wakes and their interactions with downstream turbines to large-scale wind plants and their mesoscale
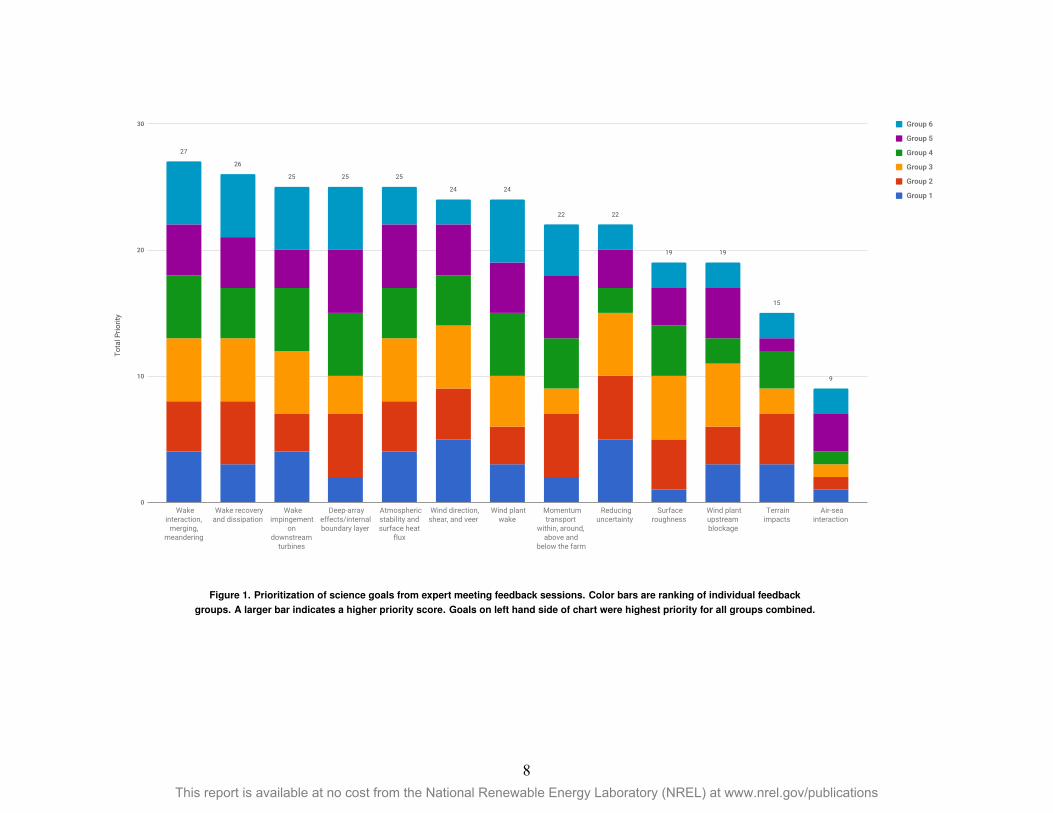
interactions with the atmosphere and neighboring wind plants. Figure 1 provides a view of the rankings of importantphenomena to be studied in the AWAKEN field campaign, according to expert meeting breakout groups. Researchtopic areas listed on the left side of the graph were deemed most important by all the groups. The final set of sciencegoals will synthesize items from this list into a few overarching topics, many of which can be observed simultaneously
using similar instrumentation. An overview of potential instrumentation and their link to science goals is provided inAppendix A.1.
As for site selection, the site must first have representative physical behavior commensurate with the science goals.The site will be located somewhere in the central U.S., where the majority of wind farms are located. The willingness
of both the wind farm owner and landowners to share access to the wind farm turbines, as well as the openness of theturbine manufacturer to share turbine data, will all be considered for the selection of the site. Researchers will workwith local landowners to identify locations for instrument placement and begin land lease procurement, which is oftena long lead-time item in field studies.
This report is available at no cost from the National Renewable Energy Laboratory (NREL) at www.nrel.gov/publications7
27
26
25 25 25
24 24
22 22
19 19
15
9
Tota
l Prio
rity
0
10
20
30
Wake interaction,
merging, meandering
Wake recovery and dissipation
Wake impingement
on downstream
turbines
Deep-array effects/internal boundary layer
Atmospheric stability and surface heat
flux
Wind direction, shear, and veer
Wind plant wake
Momentum transport
within, around, above and
below the farm
Reducing uncertainty
Surface roughness
Wind plant upstream blockage
Terrain impacts
Air-sea interaction
Group 6
Group 5
Group 4
Group 3
Group 2
Group 1
Figure 1. Prioritization of science goals from expert meeting feedback sessions. Color bars are ranking of individual feedbackgroups. A larger bar indicates a higher priority score. Goals on left hand side of chart were highest priority for all groups combined.
This report is available at no cost from the National Renewable Energy Laboratory (NREL) at www.nrel.gov/publications8
4.2 Partnership Engagement
Because the wind farms and turbines used in the AWAKEN experiment will not be DOE-owned, partnerships withindustry are critical. With work and research partnerships comes the need for agreements on specific issues (e.g., site
access and data sharing) that may require considerable negotiation between project partners. A fully open data set thatis publicly available would be ideal for DOE goals, but certain data may need to be protected to ensure participationby industry members. Often, protections such as normalizing data and granting editorial power on publications toindustry partners are useful compromises that can strengthen partnerships between collaborating entities and openpaths forward for the project.
DOE laboratories have experience in complex partnership arrangements and commercial data sharing through theWind Forecasting Improvement projects (Wilczak et al. 2015; Shaw et al. 2019; Wilczak et al. 2019), which canbe applied to the AWAKEN project. This includes data sharing with researchers before, during, and after the fieldcampaigns as well as commercially sensitive data protected in the A2e Data Archive and Portal (DAP) (Sivaramanet al. 2014).
Following the example of the New European Wind Atlas Perdigão experiment (Mann et al. 2017; Fernando et al. 2019),external funding sources will be pursued to leverage existing DOE funds and enable the largest possible field and
validation campaign. The New European Wind Atlas consortium consisted mainly of European entities, but also
included three teams funded by the U.S. National Science Foundation. Two National-Science-Foundation-fundedteams were consortia of multiple universities, and the other was the National Center for Atmospheric Research’s EarthObserving Laboratory, all of which added considerably to the instrumentation suite available for the project. While the
key science goals of AWAKEN will be achieved by the core DOE-funded team, the acquisition of external funding will
enhance the team and value of the overall data set. Potential sources for AWAKEN within the United States include
government agencies like the National Science Foundation, National Oceanic and Atmospheric Administration, and
U.S. Department of Interior, who may be willing to fund their traditional partner institutions. The team will also
investigate international funding cost sharing from industry in the form of staff time and access to equipment and
instrumentation.
4.3 Microscale Instrumentation Development
The current state of the art for instrumentation to observe complex wind farm flows is generally of much lower fidelity
than the current range of simulation tools in terms of temporal and spatial resolution. Current instrumentation can
provide real-time data with higher temporal frequency but with lower spatial resolution. To cover spatial variability
of a wind field within the atmospheric boundary layer and wind farm, the accuracy of the measurements needs to be
compromised. Therefore, validation of numerical models based on the field observation data is not at the required ortargeted fidelity, and the quality of the assessment of the numerical models is often obstructed by the limitations ofmeasurements. To narrow the gap between observation and simulation and improve confidence in validation exercises,
researchers involved in this task will seek to develop next-generation instrumentation that will improve the spatial and
temporal fidelity of microscale observations. Researchers will also quantify the uncertainty of experimental data and
the propagation of that uncertainty to the quantities of interest.
The national laboratories will develop and execute an advanced wind plant observation instrumentation development
strategy. The strategy will begin with a summary of the state of the art of remote-sensing technology for wind plant
applications, which begins with an instrumentation atlas (Lundquist et al. 2019) and will be augmented through a
meeting of international experts. The outcome of the experts’ meeting will be a document to detail and compare
currently available technology and make recommendations and estimate potential costs for the most promising tech-
nologies to develop. During this meeting, prioritization of advanced instrumentation will be informed by the A2e
high-fidelity modeling (HFM) verification and validation (V&V) roadmap (Hills, Maniaci, and Naughton 2015; Ma-
niaci and Naughton 2019) and AWAKEN science goals (see Appendix A). Potential technologies of interest includeX-band radars, acoustic tomography, the Sandia Wake Imaging System (Herges et al. 2016), unmanned aerial vehicle
swarms, multistatic lidar, and so on. Using this document as a basis, an International Energy Agency task on remote-sensing technology will be created to allow for international collaboration on advanced instrumentation during the
This report is available at no cost from the National Renewable Energy Laboratory (NREL) at www.nrel.gov/publications9
period of the project. Starting with the feedback from the experts’ meeting, national laboratory researchers will con-duct observing system studies experiments using numerical simulations of different technologies to better understand
their ability to measure wind plant quantities of interest.
Results from these studies will highlight the temporal and spatial resolutions possible across a range of technologies
for the highest-priority quantities of interest. From these studies, laboratory researchers will identify promising tech-nologies for future development. Assuming technologies are at a sufficient technology readiness level, laboratoryresearchers will collaborate with private industry to help develop and validate the performance of early prototypes inthe field. Prototype testing will occur at DOE field testing sites with atmospheric observation capabilities, such as
NREL’s Flatirons Campus, SWiFT, and DOE Atmospheric Radiation Measurement (ARM) sites. Testing may also
occur at operational wind farms as needed for validation. Finally, new technologies will be compared with currentindustrial and research technologies to help quantify the improvement in observational capability.
An important task will be the creation of an instrumentation development roadmap, starting from the current state of theart and proceeding through the end of the AWAKEN project. In 2019, an instrumentation atlas (Lundquist et al. 2019)was developed that provided a current state of the art of microscale instrumentation and measurement capabilitygaps. The instrumentation atlas has been updated and ported to the AWAKEN wiki website (https://openei.org/wiki/AWAKEN), where it can be maintained throughout the AWAKEN project. This summary will be useful for providingcurrent capabilities of existing observational equipment as a baseline for improvements made within this task. Theprimary purpose of the instruments to be developed will be those to provide high-resolution validation data withinAWAKEN following the A2e HFM V&V roadmap. However, we envision that such technology will also be usefulfor industry in advancing their observational methods. Therefore, this subtask will involve close collaboration withindustry remote-sensing manufacturers and others. The roadmap will initially be written by laboratory researchers butthen distributed to outside partners and finalized after feedback from an expert elicitation meeting in the beginning of2020. The roadmap will highlight the potential capabilities of new instruments, matching observational requirementsfor AWAKEN validation goals and projected timelines and funding requirements for development. Researchers willmodify the roadmap during the project as more accurate performance estimates and realistic development timelinesbecome available, and the AWAKEN experimental design becomes clearer.
During expert elicitation meetings, promising technologies will be identified that show the greatest promise for invest-ment in further development. The different technologies, depending on their level of maturity and needs for futuregrowth, will first be modeled in high-fidelity simulation tools such as A2e-developed Nalu-Wind (Lawson et al. 2019).Assuming these simulations show promise and significant potential impact for better microscale observation, proto-types will be built and tested in a laboratory setting before being deployed and validated in a field location. Go/no-godecisions for each technology will be made prior to prototyping based on the potential ability to fill measurement gapsand estimated development timeline. Researchers will ensure technology testing can be completed within the projecttime window and, if not available for the AWAKEN experiment, be available for future observational campaigns. Fa-cilities at the NREL Flatirons Campus, Sandia, SWiFT, and DOE ARM sites will be used for development and testingof new instrumentation. Depending on the pace of development, these new technologies could also be deployed duringthe actual AWAKEN test.
4.4 Experimental Design
A major task following site selection is the planning of the experiment itself. Planning will involve developing multi-ple timelines, incorporating the availability and applicability of different sorts of instrumentation, and understandingproject partner constraints. Logistical considerations, such as instrument power supply, spare parts, and estimatedrepair times, will also be included. We envision a field campaign of at least 18 months to capture seasonal variabilityof the atmosphere. Such a long field campaign can be very challenging, and lessons learned regarding instrumenta-tion monitoring and support, real-time data visualization, and so on, from the 18-month Wind Forecast ImprovementProject 2 and Perdigão field campaigns will be incorporated into the planning. The range of instruments to be deployedin the field will be simulated with high-fidelity models, and the overall test plan will be optimized to gather the bestpossible data set with the available instruments based on previous work to reduce the measurement errors caused byinstrument coordination or their placement (Stawiarski et al. 2013; Simley et al. 2016; Choukulkar et al. 2017; Deb-
This report is available at no cost from the National Renewable Energy Laboratory (NREL) at www.nrel.gov/publications10
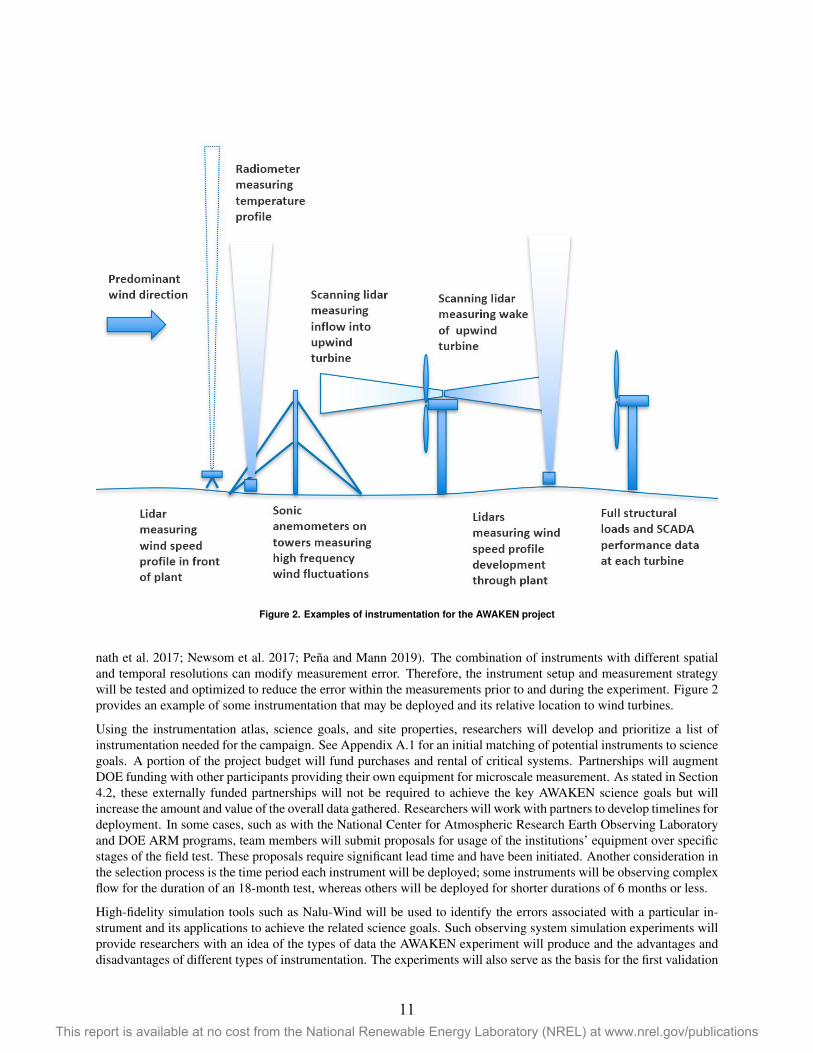
Figure 2. Examples of instrumentation for the AWAKEN project
nath et al. 2017; Newsom et al. 2017; Peña and Mann 2019). The combination of instruments with different spatial
and temporal resolutions can modify measurement error. Therefore, the instrument setup and measurement strategywill be tested and optimized to reduce the error within the measurements prior to and during the experiment. Figure 2provides an example of some instrumentation that may be deployed and its relative location to wind turbines.
Using the instrumentation atlas, science goals, and site properties, researchers will develop and prioritize a list ofinstrumentation needed for the campaign. See Appendix A.1 for an initial matching of potential instruments to science
goals. A portion of the project budget will fund purchases and rental of critical systems. Partnerships will augment
DOE funding with other participants providing their own equipment for microscale measurement. As stated in Section
4.2, these externally funded partnerships will not be required to achieve the key AWAKEN science goals but will
increase the amount and value of the overall data gathered. Researchers will work with partners to develop timelines fordeployment. In some cases, such as with the National Center for Atmospheric Research Earth Observing Laboratoryand DOE ARM programs, team members will submit proposals for usage of the institutions’ equipment over specific
stages of the field test. These proposals require significant lead time and have been initiated. Another consideration in
the selection process is the time period each instrument will be deployed; some instruments will be observing complex
flow for the duration of an 18-month test, whereas others will be deployed for shorter durations of 6 months or less.
High-fidelity simulation tools such as Nalu-Wind will be used to identify the errors associated with a particular in-
strument and its applications to achieve the related science goals. Such observing system simulation experiments will
provide researchers with an idea of the types of data the AWAKEN experiment will produce and the advantages and
disadvantages of different types of instrumentation. The experiments will also serve as the basis for the first validation
This report is available at no cost from the National Renewable Energy Laboratory (NREL) at www.nrel.gov/publications11
studies. A prerequisite for such studies is representations of each observational technology within HFM codes. Models
for profiling lidars, scanning lidars, and Ka/X-band radar are currently in development. Other technologies will be
added as needed. Researchers will use these tools to inform the sensor layout of the AWAKEN experiment during the
different phases of the campaign.
4.5 Experimental Execution
Execution of the AWAKEN field campaign at minimum will occur over a period of 18 months to ensure capture of a
full set of seasonal variations with some overlap to identify a wide range of atmospheric conditions at a specific site.
We anticipate that not all equipment will be available during the entire campaign, particularly those from externally
funded collaborators and those instruments that require significant labor to operate. However, we will seek to maximize
the amount of data gathered to ensure operation of a critical mass of instruments during the different phases of thecampaign.
A month prior to test execution, researchers will begin to deploy the instrumentation at the test site. Instruments willinitially be deployed according to the experimental design studies, and adjustments will be made to meet real-worldconstraints (e.g., insufficient power available, terrain or access complications, and so on). All instruments will be
calibrated and ready to use prior to the first simultaneous day of testing.
Long-term observations will be recorded over the duration of the test. Researchers will seek to leverage existing
instrumentation in the area, such as locally owned meteorological towers or automated surface observing system
stations or state-supported mesonets (Brock et al. 1995; Schroeder et al. 2005) (or DOE ARM facilities [Sisterson
et al. 2016]), and incorporate their data streams into the overall data set. These existing data sets will likely be most
useful for observing larger-scale physical phenomena. DOE-owned/rented instrumentation, such as meteorological
towers, vertically profiling lidars, some scanning lidars, sodars, and radiosonde launches, will be deployed and kept
operational for the duration of the experiment. Time and budget will be planned for instrumentation maintenance, data
handling, and quality control. Data will be uploaded to the A2e DAP (Sivaraman et al. 2014) in a timely, reasonable
manner.
Researchers will perform more highly detailed measurements over short targeted time periods using instrumentation
that cannot be easily deployed over longer periods. As possible, data will be made available in real-time to assist with
episodic intensive measurement periods and deployments of airborne instrumentation. Examples include unmanned
aerial vehicles for measuring turbine wakes, aircraft to measure wind plant impacts, and mobile radar systems that have
short deployment windows. The actual deployment of each of these instruments is highly dependent on the instrument
itself and the data gathered. Researchers using instruments that are best for observational campaigns lasting less than a
month will plan for multiple deployments during the test to capture some seasonal variability and provide repeatability
of observations.
4.6 Data Analysis and Model Validation and Archival
Model validation is one of the key goals of the AWAKEN project, and while the primary focus is on high-fidelity
simulation tools such as Nalu-Wind, other models will be used in a multifidelity validation approach. The process for
this validation is being developed in a related verification & validation and uncertainty quantification project being
led by Sandia researchers and currently being applied in other A2e tasks. Many researchers overlap between the
AWAKEN project and the verification and validation/uncertainty quantification project and thus will be well educated
as to the best practice for validation using observations from the test. The process of validation requires careful
processing, analysis, and understanding of observations, which will lead to new insights of wind plant behavior and
driving physical phenomena.
It is important that during execution of the AWAKEN field campaign, researchers perform validation tests to ensure
that the data being gathered are valuable. These iterative tests provide feedback to the researchers in the field, who
may have time to adjust the observational campaign and improve validation results during the test. Prior to gathering
and analyzing data, team members will identify key quantities of interest on which to focus initial validation studies
This report is available at no cost from the National Renewable Energy Laboratory (NREL) at www.nrel.gov/publications12
based on the A2e V&V roadmap. Validation metrics for simulation tools will also be devised to measure overall
performance of the simulation tools, identify areas of improvement, and help steer ongoing measurements in the field.
International Energy Agency Task 31, also known as Wakebench (Sanz Rodrigo et al. 2017), is a critical venue forvalidation exercises with a large representative group of researchers interested in wind farm model validation. Thegroup has been active for 6 years and is a well-established international working group. Various new wind plant model
benchmarks from the field campaign will be created and led by AWAKEN team members. International researchers
will use their own models following the prescribed validation process, beginning with a blind comparison between
observations and simulations, followed by a gradual release of observational results. The iterative validation process
provides insights into which models perform best under a range of conditions. Guidelines for "best practices" for
each of the different models will then be developed, following the recommendations produced in the validation study.
The principal investigator of AWAKEN is a co-lead of Wakebench and will ensure seamless interaction between the
international efforts.
All observations will be uploaded to the A2e DAP on an ongoing basis during the AWAKEN test, including a capability
for real-time monitoring of instrument performance. A dedicated web page for the AWAKEN field campaign will
be created on the DAP site. AWAKEN researchers have experience with archiving with DAP and uploading data
in near real time, so the process is well vetted. The Wind Forecast Improvement Project 2 18-month experiment
highlighted the importance of real-time instrument monitoring and local technical support to quickly identify and
repair instrumentation problems. During the long-term observational campaign, weekly weather and turbine eventdiscussions will enable the creation of an event log that will also be archived at the DAP to identify notable events
of interest to the modeling community. An event discussion coordinator will be identified early in the project to leadregular meetings during the field campaign. Researchers will work with the DAP team to ensure commonality ofdata formats that will make it easier for future data users to analyze. Both raw data from observations and processed
data from analysis will be uploaded and maintained. As validation studies proceed, researchers will upload simulation
results of interest for the wider community. Data storage limits prevent storage of all simulations, and criteria will need
to be developed to determine what data will be kept over what time periods. Analysis scripts used by team members
will be uploaded to enable reproducible research results and easier continued analysis after the AWAKEN project is
complete. In general, researchers will strive to follow FAIR (Findable, Accessible, Interoperable, and Reusable) data
principles (Wilkinson et al. 2016) to ensure lasting value from the data gathered.
This report is available at no cost from the National Renewable Energy Laboratory (NREL) at www.nrel.gov/publications13
5 Expert Elicitation Meeting
The first AWAKEN meeting to gauge interest in collaborative wind farm field observations and to begin the forma-tion of a central repository for past experiences was convened by NREL at the University of Colorado in Boulder,Colorado, March 21, 2018. The agenda for the meeting can be found in Appendix C. More than 50 participants at-tended the meeting, representing the interests of academics, wind energy industry professionals, government agencies,
and national laboratories. The agenda for the meeting is found in Appendix C, and names of the participants and theiraffiliations are listed in Appendix D. Throughout the meeting, researchers offered their perspectives on past experiencein utility-scale wind farm observation campaigns and provided insights on lessons learned about international collab-orative work and emerging technologies and instrumentation; they also contributed to the prioritization of scientific
objectives of the forthcoming study.
5.1 Key Points by Speakers
Some of the key points emphasized by the speakers include the following:
• Models, physics, experiments, and applications must all work together. Improving one benefits each of theother elements, as described by the"virtuous cycle" introduced by David Maniaci from Sandia and repeated byseveral other speakers. The importance of model validation cannot be overstated. Validation needs to outstrip
observational capabilities, and remote-sensing technology is improving, but not as fast a model’s technology.Therefore, comparisons between models and data may be most effective when reconciled against performanceor other averaged turbine data.
• Multiple forms of observations are important. Co-locating and correlating observations reduce uncertainty andincrease reliability. Duplicate measurements are important for redundancy, reduction of uncertainty, and corre-lated observations. Long-term turbine SCADA data are necessary to get a complete picture of the operation ofa wind farm. SCADA data include using turbines as anemometers through power output. Turbine anemome-ter and unsteady responses correlate to turbulence from performance and loads observations. Common dataformats and time stamping across observational platforms are vital for consistent access to data and methoddevelopment.
• Long-term project planning and careful partnership engagement are essential. Three to four years’ planningbefore a campaign begins might be necessary. The success of the project will depend on long-term relationships.
Landowner/wind farm owner/operator relationships are crucial to the success of a project. Service relationships
with instrument manufacturers are important during long campaigns.
• The added value of collaboration in large projects is attractive to a variety of potential partners. There aremany funding sources that could be leveraged to benefit the group effort. Within DOE, collaboration frequentlyoccurs between laboratories and sometimes across programs. One question discussed was: How will otherfunding agencies interact with DOE? Collaboration may be difficult because of the proposed timeline alone, and
establishing funding could potentially require years of planning. Funding collaborations between sources will
be important if the scope will be on the order of the Perdigão campaign.
5.2 Feedback Sessions
During the meeting, feedback from the attendees was solicited through three short surveys completed in group breakoutsessions, and results were tabulated into a spreadsheet. The meeting attendees were divided into working groups of8–10 people, with representatives from each sector of the wind energy research community. Each survey was designed
to collect input on the relevance of the supplied science goals, attendees’ respective priority of study, and what should
be added or removed from the preliminary test plan. Below, the feedback solicited from the small work groups duringthe meeting is summarized. The aggregated data from each of the feedback sessions have been consolidated into a
summary that is located in Appendix B.
This report is available at no cost from the National Renewable Energy Laboratory (NREL) at www.nrel.gov/publications14
5.2.1 Which science goals can be removed or combined?
Although most of the small work groups suggested some sort of reorganization and/or combination of the science goals
(Appendix A and priorities, a single recommended hierarchy or structure did not emerge from the feedback suggested
by the groups. Rather, most groups suggested identifying the two or three overarching topic areas for the campaign,under which all other science questions were nested within.
Some other comments made about the science goals were:
• While not a science goal per se, instrumentation and experimental design should be given equal standing in terms
of planning and consideration. Questions that should be considered carefully are: How will measurements
be made to address science goals? How well can the quantities of interest be measured? Does an optimalarrangement of sensors exist? Can we reach it?
• Add depth to the large-scale phenomena/wind farm effects science goal. Mesoscale effects on a wind farm areimportant. To capture these effects, ensure instruments are movable and dispersed instead of localized at a fixed
point. Expand the instrumentation plan to include observations of mesoscale recirculation effects. Also, some
observations should seek to measure the correlation between large coherent structures’ effects on wind turbines
and structural fatigue loads.
• Additional thinking is needed around terrain impacts and how boundary conditions affect science goals. Be sure
to include observations that can capture the homogeneity (or heterogeneity) of the surface (trees, roughness,
terrain, and so on). It is useful to start with flat terrain to eliminate areas of uncertainty. It is also easy to start
with areas or data sets with consistency of wind direction. Layout spacing is similar; large idealized wind farms
exist on flat terrain, but not very many are placed on regular gridded layouts.
• How do the science goals tie into the desired outcomes of the campaign? Consider which goals are achievable
in terms of observations and for model validation. Should goals be tuned to match needs for model development
or validation? What data do wind farm control designs need?
• More detail could be added to the inflow and operating conditions science goals. Inflow and atmospheric con-
ditions are equally important as measuring wakes: shear, veer, wind direction, wind direction variability, speed,
turbulence, and stability. If turbine structural loads are important, then so are turbulence and variations in flow
parameters along the blade. Can the freestream wind speed be measured? It is important to measure the flow
around the wind farm, in addition to inside it. Lastly, atmospheric stability has a big impact on the ability to con-
trol turbine wakes. For example, in highly turbulent/unstable conditions, flow wakes will be difficult to control,
but also create less energy loss due to faster wake dissipation.
• Selection of instrumentation is a priority. Try to get wind direction variability from SCADA data immediately
to begin analysis. Use the Richardson number or Obukhov length for stability; use temperature profile from
the meteorological mast or the sonic anemometer close to the ground. The preferred measurement depends
on the surface homogeneity. Some planning is required for dissipation measurements and how best to make
measurements with tethered lift systems and/or hot-wire anemometry. Strongly consider how to best instrument
blades with strain measurements along blades, accelerometers, and so on.
5.2.2 Instrumentation
The next question posed of the breakout groups was: What instrumentation should be added to the testing plan and
why? Participants suggested a substantial list of instrumentation they would like to see deployed and used during the
testing campaign. In addition to a list of instruments, many attendees offered recommendations on specific models
of sensors and measurement devices for a wide range of reasons. Next is a brief summary of recommendations.
Additional suggestions and their relation to the science goals are discussed further in Appendix A.1.
• Meteorological masts and in-situ point measurements
– Sonic anemometers
This report is available at no cost from the National Renewable Energy Laboratory (NREL) at www.nrel.gov/publications15
– Pressure-temperature-humidity
• Remote sensing
– Sodar and radar radio acoustic sounding system)
– Ka-band and X-band radar
– A diversity of lidars (e.g., ground-based, nacelle-mounted, scanners, profilers)
– Field-particle-image-velocimetry-type systems
– Satellite imaging
• Other instruments
– Radiosondes and sounding systems (difficult with the Federal Aviation Administration; labor-intensive)
– Eddy covariance (surface flux stations) both upwind and throughout the wind plant
– Ceilometer for planetary boundary layer heights
– SCADA (performance/operational data, loads)
– Upwelling/downwelling radiation sensors
– Sensors for surface properties (e.g. soil moisture/temperature, surface albedo,â Ae)
– Tethered lifting systems
– Airborne measurement systems and unmanned aerial vehicles
• Other advice
– Plan for backup units, (re)calibration of instruments, maintenance/downtime, data formatting, and timesynchronization.
5.2.3 Recommendations for Test Site
The breakout groups were asked about a potential site for the AWAKEN campaign. Most groups recommended sites
that have a wide range of atmospheric conditions and constrained terrain complexity. It was also recommended that
the potential test site be one that has already been the subject of previous research experience, as forging relationships
with landowners and wind farm operators can be a significant hurdle in any field campaign. A short list of potential
sites includes the following.
• Wind Forecast Improvement Project site (Columbia River Gorge): too complex terrain for this test, but instru-mentation already exist
• ARM climate research facilities
• Story County, Iowa: there are existing, maintained tall towers, and the site of the successful CWEX campaigns
• North of Mason City, Iowa: there are three farms close together
• NextEra pre/postconstruction test site in the Midwest: data sharing may be sensitive
• Texas wind farms (Roscoe, Loraine, Champion).
This report is available at no cost from the National Renewable Energy Laboratory (NREL) at www.nrel.gov/publications16
5.2.4 Additional Thoughts on Test Planning
Lastly, breakout groups were asked about preliminary thoughts on the initial AWAKEN test plan. Potential testing
plans will be compiled in an open-source test planning document, which will soon be open to public scoping. Inputrequested included specific strategies that would be beneficial to the AWAKEN project as well as potential locations
for the campaign, instrumentation to be considered, and wind turbine models that would be good test candidates. Themain suggested additions to the testing document fall into the categories of:
• Preassessment
• Flowfield measurements
• Turbine operational data/site characterization
• Logistics (points of contact, responsible parties, scheduling, and so on)
• Concurrent modeling.
Please refer to the aggregated results in Appendix B for a complete list of suggestions.
This report is available at no cost from the National Renewable Energy Laboratory (NREL) at www.nrel.gov/publications17
6 Next Steps
With the vision of the AWAKEN project summarized in this document, the next steps are execution of the tasks
outlined earlier and according to a timeline described in Section 7. The initial year of the project will focus onpartnership management, such as working with interested parties on agreements for wind farm and data access. Therewill be considerable time spent working with research partners submitting proposals to augment DOE funding to
increase the overall scope and potential impact of the project. Site selection will be an early goal as well, once strong
partnerships are established. While negotiations proceed, instrument selection can proceed concurrently, identifying
key instruments and matching them to science goals. The identification of instruments will also include a gaps analysis
of the current state of the art and formulation of an instrumentation development roadmap. This roadmap will be
executed throughout the AWAKEN project. Once a site is selected, detailed simulation studies will be done to design
the experiment for optimal observation of phenomena related to the science goals. Once the design is complete,
instruments will be acquired, then deployed and calibrated, and the observational campaign will begin. Throughout the
campaign, validation studies against models will be executed and the observation plan adjusted accordingly. Validation
studies will continue past the completion of the field observations until the end of the project. All data and some
simulations will be uploaded to the A2e DAP for further use by the wind energy community.
As part of the ongoing AWAKEN planning efforts, organizers at NREL will continue to solicit feedback from the wind
energy community as a whole through monthly update meetings and sporadic expert meetings. Given the early stage
of the campaign, participants are encouraged to communicate with any potential participants or collaborators and to
share the public AWAKEN-related literature.
This report is available at no cost from the National Renewable Energy Laboratory (NREL) at www.nrel.gov/publications18
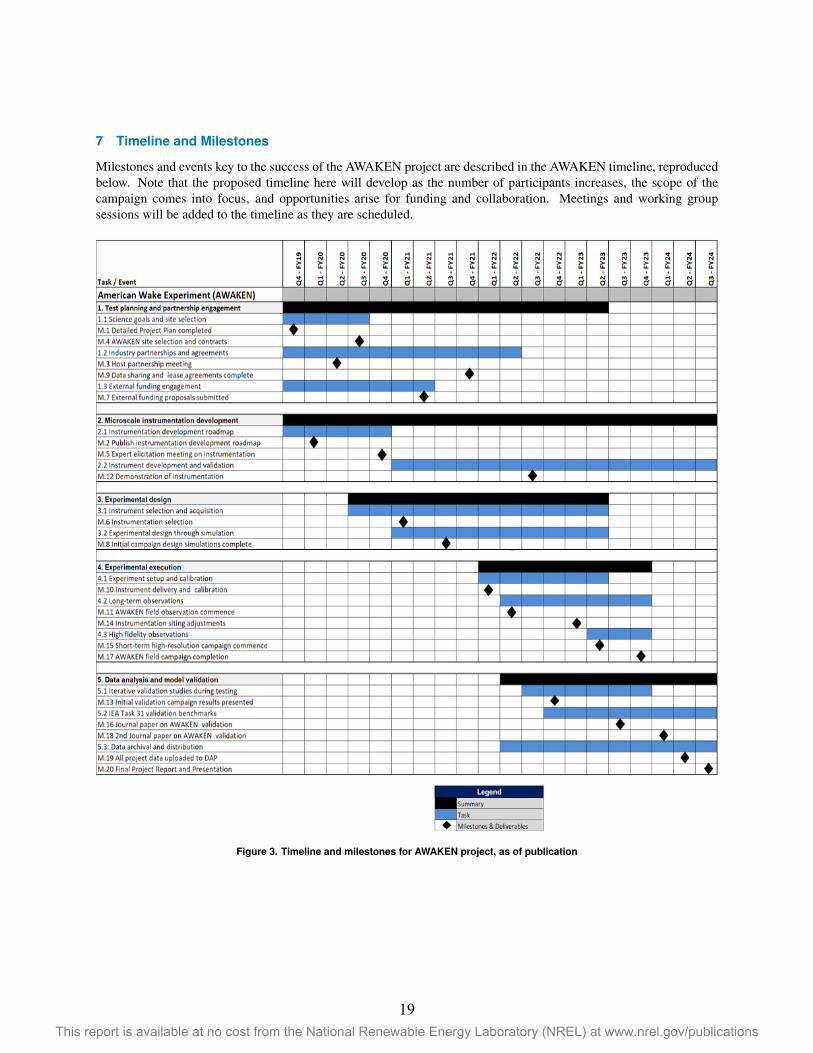
7 Timeline and Milestones
Milestones and events key to the success of the AWAKEN project are described in the AWAKEN timeline, reproducedbelow. Note that the proposed timeline here will develop as the number of participants increases, the scope of thecampaign comes into focus, and opportunities arise for funding and collaboration. Meetings and working groupsessions will be added to the timeline as they are scheduled.
Figure 3. Timeline and milestones for AWAKEN project, as of publication
This report is available at no cost from the National Renewable Energy Laboratory (NREL) at www.nrel.gov/publications19
References
Ahsbahs, T. T., M. Badger, P. Volker, K. S. Hansen, and C. B. Hasager. 2018. “Applications of satellite winds for the
offshore wind farm site Anholt.” Wind Energy Science 3 (2): 573–588.
Aitken, M. L., and J. K. Lundquist. 2014. “Utility-scale wind turbine wake characterization using nacelle-based long-
range scanning lidar.” Journal of Atmospheric and Oceanic Technology 31 (7): 1529–1539.
Aitken, M. L., R. M. Banta, Y. L. Pichugina, and J. K. Lundquist. 2014a. “Quantifying wind turbine wake character-istics from scanning remote sensor data.” Journal of Atmospheric and Oceanic Technology 31 (4): 765–787.
– . 2014b. “Quantifying wind turbine wake characteristics from scanning remote sensor data.” Journal of Atmospheric
and Oceanic Technology 31 (4): 765–787.
Banta, R. M., Y. L. Pichugina, W. A. Brewer, J. K. Lundquist, N. D. Kelley, S. P. Sandberg, R. J. Alvarez II, R. M.
Hardesty, and A. M. Weickmann. 2015. “3D Volumetric Analysis of Wind Turbine Wake Properties in the Atmo-sphere Using High-Resolution Doppler Lidar.” Journal of Atmospheric and Oceanic Technology 32 (5): 904–914.
doi:10.1175/JTECH-D-14-00078.1.Barthelmie, R. J., G. Larsen, S. Frandsen, L Folkerts, K Rados, S. Pryor, B Lange, and G Schepers. 2006. “Comparison
of wake model simulations with offshore wind turbine wake profiles measured by sodar.” Journal of atmospheric
and oceanic technology 23 (7): 888–901.
Barthelmie, R. J., K. S. Hansen, S. T. Frandsen, O. Rathmann, J. Schepers, W Schlez, J Phillips, K Rados, A Zervos,E. Politis, et al. 2009. “Modelling and measuring flow and wind turbine wakes in large wind farms offshore.” Wind
Energy 12 (5): 431–444.
Barthelmie, R. J., S. C. Pryor, S. T. Frandsen, K. S. Hansen, J. Schepers, K Rados, W Schlez, A Neubert, L. Jensen,
and S Neckelmann. 2010. “Quantifying the impact of wind turbine wakes on power output at offshore wind farms.”
Journal of Atmospheric and Oceanic Technology 27 (8): 1302–1317.
Barthelmie, R. J., et al. 2011. Flow and wakes in large wind farms: Final report for UpWind WP8 . Tech. rep. Risø-R-
1765(EN). Danmarks Tekniske Universitet, Risø Nationallaboratoriet for Bæredygtig Energi.Barthelmie, R., S. Pryor, N Wildmann, and R. Menke. 2018. “Wind turbine wake characterization in complex ter-
rain via integrated Doppler lidar data from the Perdigão experiment.” In Journal of Physics: Conference Series ,
1037:052022. 5. IOP Publishing.
Bianco, L., K. Friedrich, J. M. Wilczak, D. Hazen, D. Wolfe, R. Delgado, S. P. Oncley, and J. K. Lundquist. 2017. “As-
sessing the accuracy of microwave radiometers and radio acoustic sounding systems for wind energy applications.”
Atmospheric Measurement Techniques 10 (5): 1707.
Bingöl, F., J. Mann, and G. C. Larsen. 2010. “Light detection and ranging measurements of wake dynamics part I:
one-dimensional scanning.” Wind Energy 13 (1): 51–61.
Board, O. S., E. National Academies of Sciences, Medicine, et al. 2018. The Future of Atmospheric Boundary Layer
Observing, Understanding, and Modeling: Proceedings of a Workshop . National Academies Press.
Bodini, N., D. Zardi, and J. K. Lundquist. 2017. “Three-dimensional structure of wind turbine wakes as measured by
scanning lidar.” Atmospheric Measurement Techniques 10 (8).Brock, F. V., K. C. Crawford, R. L. Elliott, G. W. Cuperus, S. J. Stadler, H. L. Johnson, and M. D. Eilts. 1995. “The
Oklahoma Mesonet: a technical overview.” Journal of Atmospheric and Oceanic Technology 12 (1): 5–19.
Bromm, M., A. Rott, H. Beck, L. Vollmer, G. Steinfeld, and M. KÃijhn. 2018. “Field investigation on the influence of
yaw misalignment on the propagation of wind turbine wakes.” Wind Energy 21 (11): 1011–1028. doi:10.1002/we.
2210.
Cal, R. B., J. Lebrón, L. Castillo, H. S. Kang, and C. Meneveau. 2010. “Experimental study of the horizontally
averaged flow structure in a model wind-turbine array boundary layer.” Journal of Renewable and Sustainable
Energy 2 (1): 013106.
Chamorro, L. P., and F. Porté-Agel. 2010. “Effects of thermal stability and incoming boundary-layer flow characteris-
tics on wind-turbine wakes: a wind-tunnel study.” Boundary-layer meteorology 136 (3): 515–533.
Choukulkar, A., et al. 2017. “Evaluation of single and multiple Doppler lidar techniques to measure complex flow
during the XPIA field campaign.” Atmospheric Measurement Techniques 10 (1): 247–264. doi:10.5194/amt-10-
247-2017. https://www.atmos-meas-tech.net/10/247/2017/.
Christiansen, M. B., and C. B. Hasager. 2005. “Wake effects of large offshore wind farms identified from satellite
SAR.” Remote Sensing of Environment 98 (2-3): 251–268.
This report is available at no cost from the National Renewable Energy Laboratory (NREL) at www.nrel.gov/publications20
Cleijne, J. 1992. Results of Sexbierum Wind Farm; Double Measurements . Tech. rep. TNO Report 92-388. TNO(Netherlands).
– . 1993. Results of Sexbierum Wind Farm; Single Wake Measurements . Tech. rep. TNO Report 93-082. TNO (Nether-lands).
Clifton, A., A. Smith, and M. Fields. 2016. Wind plant preconstruction energy estimates. current practice and oppor-tunities . Tech. rep. NREL/TP-5000-64735. National Renewable Energy Lab. (NREL), Golden, CO (United States).
Cline, J, S. Haupt, and W. Shaw. 2017. “Meteorology Research in DOE’s Atmosphere to Electrons (A2e) Program.”In AGU Fall Meeting Abstracts .
Debnath, M., G. V. Iungo, R. Ashton, W. A. Brewer, A. Choukulkar, R. Delgado, J. K. Lundquist, W. J. Shaw, J. M.
Wilczak, and D. Wolfe. 2017. “Vertical profiles of the 3-D wind velocity retrieved from multiple wind lidars per-forming triple range-height-indicator scans.” Atmospheric Measurement Techniques 10 (2): 431–444. doi:10.5194/amt-10-431-2017.
Doubrawa, P., M. Debnath, P. J. Moriarty, E. Branlard, T. Herges, D. Maniaci, and B. Naughton. 2019. “Benchmarks
for model validation based on lidar wake measurements.” In Journal of Physics: Conference Series , 1256:012024. 1.
IOP Publishing.
Emeis, S., S. Siedersleben, A. Lampert, A. Platis, J. Bange, B. Djath, J. Schulz-Stellenfleth, and T. Neumann. 2016.
“Exploring the wakes of large offshore wind farms.” In Journal of Physics: Conference Series , 753:092014. 9. IOPPublishing.
Fernando, H., J. Mann, J. Palma, J. Lundquist, R. J. Barthelmie, M Belo-Pereira, W. Brown, F. Chow, T Gerz, C.
Hocut, et al. 2019. “The Perdigao: Peering into microscale details of mountain winds.” Bulletin of the American
Meteorological Society 100 (5): 799–819.
Fleming, P., et al. 2020. “Continued Results from a Field Campaign of Wake Steering Applied at a Commercial Wind
Farm: Part 2.” Wind Energy Science Discussions 2020:1–24. doi:10.5194/wes-2019-104. https://www.wind-energ-sci-discuss.net/wes-2019-104/.
Fleming, P., J. King, K. Dykes, E. Simley, J. Roadman, A. Scholbrock, P. Murphy, J. K. Lundquist, P. Moriarty, K.
Fleming, et al. 2019. “Initial results from a field campaign of wake steering applied at a commercial wind farm–Part1.” Wind Energy Science 4 (2): 273–285.
Geerts, B., D. J. Raymond, V. Grubišic, C. A. Davis, M. C. Barth, A. Detwiler, P. M. Klein, W.-C. Lee, P. M.
Markowski, G. L. Mullendore, et al. 2018. “Recommendations for in situ and remote sensing capabilities in at-
mospheric convection and turbulence.” Bulletin of the American Meteorological Society 99 (12): 2463–2470.
Hamilton, N., and R. B. Cal. 2015. “Anisotropy of the Reynolds stress tensor in the wakes of wind turbine arrays in
Cartesian arrangements with counter-rotating rotors.” Physics of Fluids 27 (1): 015102.
Hammond, S. W., M. A. Sprague, D. Womble, and M. Barone. 2015. A2e High Fidelity Modeling: Strategic Plan-
ning Meetings . Tech. rep. NREL/TP-2C00-64697. National Renewable Energy Lab. (NREL), Golden, CO (United
States).
Hansen, K. S., R. J. Barthelmie, L. E. Jensen, and A. Sommer. 2012. “The impact of turbulence intensity and atmo-
spheric stability on power deficits due to wind turbine wakes at Horns Rev wind farm.” Wind Energy 15 (1): 183–
196.
Hasager, C. B., A. N. Hahmann, T. Ahsbahs, I. Karagali, T. Sile, M. Badger, and J. Mann. 2019. “Europe’s offshore
winds assessed from SAR, ASCAT and WRF.” Wind Energy Science Discussions 2019:1–27. doi:10.5194/wes-
2019-38.
Herges, T., D. C. Maniaci, B. T. Naughton, T. Mikkelsen, and M. Sjöholm. 2017. “High resolution wind turbine wake
measurements with a scanning lidar.” In Journal of Physics: Conference Series , 854:012021. 1. IOP Publishing.
Herges, T. G., D. Bossert, R. Schmitt, M. Johnson, D. C. Maniaci, C. Glen, and B. Naughton. 2016. “Field Demon-
stration of the Sandia Wake Imaging System Capabilities at the Scaled Wind Farm Technology Facility.” In 34th
Wind Energy Symposium , 1524.
Hills, R. G., D. C. Maniaci, and J. W. Naughton. 2015. V&V Framework . Tech. rep. SAND2015-7455. Sandia National
Laboratories. Albuquerque, NM (United States).
Hirth, B. D., J. L. Schroeder, W. S. Gunter, and J. G. Guynes. 2012. “Measuring a utility-scale turbine wake using the
TTUKa mobile research radars.” Journal of Atmospheric and Oceanic Technology 29 (6): 765–771.
Iungo, G. V., and F. Porté-Agel. 2014. “Volumetric lidar scanning of wind turbine wakes under convective and neutral
atmospheric stability regimes.” Journal of Atmospheric and Oceanic Technology 31 (10): 2035–2048.
This report is available at no cost from the National Renewable Energy Laboratory (NREL) at www.nrel.gov/publications21
Iungo, G. V., Y.-T. Wu, and F. Porté-Agel. 2013. “Field measurements of wind turbine wakes with lidars.” Journal of
Atmospheric and Oceanic Technology 30 (2): 274–287.
Jagdish, S. A. Kumar, A. Chakraborty, and R. Kumar. 2018. “Validation of wind speed retrieval from RISAT-1 SAR
images of the North Indian Ocean.” Remote Sensing Letters 9 (5): 421–428.
Käsler, Y., S. Rahm, R. Simmet, and M. Kühn. 2010. “Wake measurements of a multi-MW wind turbine with coherentlong-range pulsed Doppler wind lidar.” Journal of Atmospheric and Oceanic Technology 27 (9): 1529–1532.
Klein, P., et al. 2015. “LABLE: A Multi-Institutional, Student-Led, Atmospheric Boundary Layer Experiment.” Bul-letin of the American Meteorological Society 96 (10): 1743–1764. doi:10.1175/BAMS-D-13-00267.1.
Kocer, G., M. Mansour, N. Chokani, R. S. Abhari, and M. Müller. 2011. “Full-scale wind turbine near-wake measure-ments using an instrumented uninhabited aerial vehicle.” Journal of Solar Energy Engineering 133 (4).
Krishnamurthy, R., J. Reuder, B. Svardal, H. J. S. Fernando, and J. B. Jakobsen. 2017. “Offshore wind turbine wake
characteristics using scanning doppler lidar.” Energy Procedia 137:428–442.
Krogstad, P.-Å., and M. S. Adaramola. 2012. “Performance and near wake measurements of a model horizontal axis
wind turbine.” Wind Energy 15 (5): 743–756.
Kumer, V.-M., J. Reuder, M. Dorninger, R. Zauner, and V. Grubišic. 2016. “Turbulent kinetic energy estimates fromprofiling wind LiDAR measurements and their potential for wind energy applications.” Renewable Energy 99:898–
910.
Lawson, M. J., J. Melvin, S. Ananthan, K. M. Gruchalla, J. S. Rood, and M. A. Sprague. 2019. Blade-Resolved, Single-
Turbine Simulations Under Atmospheric Flow . Tech. rep. NREL/TP-5000-72760. National Renewable Energy Lab.
(NREL), Golden, CO (United States).
Lee, J. C., and J. K. Lundquist. 2017. “Evaluation of the wind farm parameterization in the Weather Research and
Forecasting model (version 3.8. 1) with meteorological and turbine power data.” Geoscientific Model Development
10 (11).
Lundquist, J., and L Bariteau. 2015. “Dissipation of Turbulence in the Wake of a Wind Turbine.” Boundary-Layer
Meteorology 154 (2): 229–241.
Lundquist, J., A. J. Clifton, S. Dana, T. Herges, A. Huskey, P. J. Moriarty, and J. J. Van Dam. 2019. Wind Energy
Instrumentation Atlas . Tech. rep. NREL/TP-5000-68986. National Renewable Energy Lab. (NREL), Golden, CO
(United States).
Lundquist, J. K., et al. 2017. “Assessing State-of-the-Art Capabilities for Probing the Atmospheric Boundary Layer:The XPIA Field Campaign.” Bulletin of the American Meteorological Society 98 (2): 289–314. doi:10.1175/BAMS-
D-15-00151.1.Machefaux, E., G. C. Larsen, N. Troldborg, K. S. Hansen, N. Angelou, T. Mikkelsen, and J. Mann. 2016. “Investigation
of wake interaction using full-scale lidar measurements and large eddy simulation.” Wind Energy 19 (8): 1535–1551.
Maniaci, D. C. 2016. Overview of the V&V Framework . Tech. rep. SAND2016-2862PE. Sandia National Laboratories.Albuquerque, NM (United States).
Maniaci, D. C., and J. Naughton. 2019. V&V Integrated Program Planning for Wind Plant Performance . Tech.rep. SAND2019-6888. Sandia National Laboratories. Albuquerque, NM (United States).
Maniaci, D. C., P. J. Moriarty, M. F. Barone, M. J. Churchfield, M. A. Sprague, and S. Arunajatesan. 2020. Wind Energy
High Fidelity Model Verification and Validation Plan . Tech. rep. SAND2020-1332. Sandia National Laboratories.Albuquerque, NM (United States).
Mann, J., N. Angelou, J. Arnqvist, D. Callies, E Cantero, R. C. Arroyo, M. Courtney, J Cuxart, E. Dellwik, J.
Gottschall, et al. 2017. “Complex terrain experiments in the New European Wind Atlas.” Philosophical Trans-
actions of the Royal Society A: Mathematical, Physical and Engineering Sciences 375 (2091): 20160101.
Menke, R., N. Vasiljevic, K. S. Hansen, A. N. Hahmann, and J. Mann. 2018. “Does the wind turbine wake follow the
topography? A multi-lidar study in complex terrain.” Wind Energy Science 3 (2): 681–691.
Moriarty, P., et al. 2014. “IEA-task 31 wakebench: Towards a protocol for wind farm flow model evaluation. Part 2:
Wind farm wake models.” In Journal of Physics: Conference Series , 524:012185. 1. IOP Publishing.
Muñoz-Esparza, D., J. K. Lundquist, J. A. Sauer, B. Kosovic, and R. R. Linn. 2017. “Coupled mesoscale-LES mod-
eling of a diurnal cycle during the CWEX-13 field campaign: From weather to boundary-layer eddies.” Journal of
Advances in Modeling Earth Systems 9 (3): 1572–1594.
This report is available at no cost from the National Renewable Energy Laboratory (NREL) at www.nrel.gov/publications22

Murphy, P., J. K. Lundquist, and P. Fleming. 2019. “How wind speed shear and directional veer affect the powerproduction of a megawatt-scale operational wind turbine.” Wind Energy Science Discussions 2019:1–46. doi:10.
5194/wes-2019-86.Newsom, R. K., W. A. Brewer, J. M. Wilczak, D. E. Wolfe, S. P. Oncley, and J. K. Lundquist. 2017. “Validating
precision estimates in horizontal wind measurements from a Doppler lidar.” Atmospheric Measurement Techniques
10 (3): 1229.Nygaard, N. G. 2014. “Wakes in very large wind farms and the effect of neighbouring wind farms.” In Journal of
Physics: Conference Series , 524:012162. 1. IOP Publishing.
Nygaard, N. G., and S. D. Hansen. 2016. “Wake effects between two neighbouring wind farms.” In Journal of Physics:Conference Series , 753:032020. 3. IOP Publishing.
Nygaard, N. G., and A. C. Newcombe. 2018. “Wake behind an offshore wind farm observed with dual-Doppler radars.”In Journal of Physics: Conference Series , 1037:072008. 7. IOP Publishing.
Ørsted. 2019. “Ørsted presents update on its long-term financial targets.” Ørsted Company Announcement List . https://orsted.com/en/Company-Announcement-List/2019/10/1937002.
Peña, A., and J. Mann. 2019. “Turbulence Measurements with Dual-Doppler Scanning Lidars.” Remote Sensing 11(20). ISSN : 2072-4292. doi:10.3390/rs11202444.
Pichugina, Y. L., R. M. Banta, W. A. Brewer, S. P. Sandberg, and R. M. Hardesty. 2012. “Doppler Lidar-Based Wind-Profile Measurement System for Offshore Wind-Energy and Other Marine Boundary Layer Applications.” Journalof Applied Meteorology and Climatology 51 (2): 327–349. doi:10.1175/JAMC-D-11-040.1.
Platis, A., et al. 2018. “First in situ evidence of wakes in the far field behind offshore wind farms.” Scientific Reports8 (1): 2163. doi:10.1038/s41598-018-20389-y.
Rados, K., G. Larsen, R. Barthelmie, W. Schlez, B. Lange, G. Schepers, T. Hegberg, and M. Magnisson. 2001. “Com-parison of wake models with data for offshore windfarms.” Wind Engineering 25 (5): 271–280.
Rajewski, D., E. Takle, J. Lundquist, S Oncley, J. Prueger, T. Horst, M. Rhodes, R Pfeiffer, J. Hatfield, K. Spoth,et al. 2013. Crop Wind Energy Experiment (CWEX): observations of surface-layer, boundary layer, and mesoscale
interactions with a wind farm, B. Am. Meteorol. Soc., 94, 655–672 .Rajewski, D. A., E. S. Takle, J. K. Lundquist, J. H. Prueger, R. L. Pfeiffer, J. L. Hatfield, K. K. Spoth, and R. K.
Doorenbos. 2014. “Changes in fluxes of heat, H2O, and CO2 caused by a large wind farm.” Agricultural and forest
meteorology 194:175–187.
Reuder, J., and M. O. Jonassen. 2012. “First results of turbulence measurements in a wind park with the Small Un-manned Meteorological Observer SUMO.” Energy Procedia 24:176–185.
Rhodes, M. E., and J. K. Lundquist. 2013. “The effect of wind-turbine wakes on summertime US midwest atmosphericwind profiles as observed with ground-based doppler lidar.” Boundary-layer meteorology 149 (1): 85–103.
Sanchez Gomez, M., and J. K. Lundquist. 2020. “The effect of wind direction shear on turbine performance in a wind
farm in central Iowa.” Wind Energy Science 5 (1): 125–139. doi:10.5194/wes-5-125-2020.Sanz Rodrigo, J., R. A. Chavez Arroyo, P. Moriarty, M. Churchfield, B. Kosovic, P.-E. Réthoré, K. S. Hansen, A.
Hahmann, J. D. Mirocha, and D. Rife. 2017. “Mesoscale to microscale wind farm flow modeling and evaluation.”
Wiley Interdisciplinary Reviews: Energy and Environment 6 (2): e214.
Schroeder, J. L., W. Burgett, K. Haynie, I Sonmez, G. Skwira, A. Doggett, and J. Lipe. 2005. “The West Texas mesonet:
a technical overview.” Journal of Atmospheric and Oceanic Technology 22 (2): 211–222.
Shaw, W. J., L. K. Berg, J. Cline, C. Draxl, I. Djalalova, E. P. Grimit, J. K. Lundquist, M. Marquis, J. McCaa, J. B.
Olson, et al. 2019. “The Second Wind Forecast Improvement Project (WFIP2): General Overview.” Bulletin of the
American Meteorological Society 100 (9): 1687–1699.
Simley, E., N. Angelou, T. Mikkelsen, M. Sjöholm, J. Mann, and L. Y. Pao. 2016. “Characterization of wind velocities
in the upstream induction zone of a wind turbine using scanning continuous-wave lidars.” Journal of Renewable
and Sustainable Energy 8 (1): 013301. doi:10.1063/1.4940025.
Sisterson, D., R. Peppler, T. Cress, P. Lamb, and D. Turner. 2016. “The ARM southern great plains (SGP) site.”
Meteorological Monographs 57:6–1.
Sivaraman, C., E. G. Stephan, M. C. Macduff, and C. D. Hagler. 2014. Data Archive and Portal Thrust Area Strategy
Report . Tech. rep. PNNL-23718. Pacific Northwest National Laboratory. (PNNL), Richland, WA (United States).
Smalikho, I., V. Banakh, Y. Pichugina, W. Brewer, R. Banta, J. Lundquist, and N. Kelley. 2013. “Lidar investigation of
atmosphere effect on a wind turbine wake.” Journal of Atmospheric and Oceanic Technology 30 (11): 2554–2570.
This report is available at no cost from the National Renewable Energy Laboratory (NREL) at www.nrel.gov/publications23
Stawiarski, C., K. Trümner, C. Knigge, and R. Calhoun. 2013. “Scopes and Challenges of Dual-Doppler Lidar Wind
Measurements-An Error Analysis.” Journal of Atmospheric and Oceanic Technology 30 (9): 2044–2062. doi:10.1175/JTECH-D-12-00244.1.
Trujillo, J. J., J. K. Seifert, I. Würth, D. Schlipf, and M. Kühn. 2016. “Full-field assessment of wind turbine near-wakedeviation in relation to yaw misalignment.” Wind Energy Science 1 (1): 41–53. doi:10 . 5194 / wes - 1 - 41 - 2016.https://www.wind-energ-sci.net/1/41/2016/.
Trujillo, J.-J., F. Bingöl, G. C. Larsen, J. Mann, and M. Kühn. 2011. “Light detection and ranging measurements ofwake dynamics. Part II: two-dimensional scanning.” Wind Energy 14 (1): 61–75.
Tucker, S. C., C. S. Weimer, S. Baidar, and R. M. Hardesty. 2018. “The Optical Autocovariance Wind Lidar. Part I:OAWL Instrument Development and Demonstration.” Journal of Atmospheric and Oceanic Technology 35 (10):2079–2097. doi:10.1175/JTECH-D-18-0024.1.
Veers, P., et al. 2019. “Grand challenges in the science of wind energy.” Science 366 (6464). doi:10.1126/science.
aau2027.
Vollmer, L., M. van Dooren, D. Trabucchi, J. Schneemann, G. Steinfeld, B. Witha, J. Trujillo, and M. Kühn. 2015.
“First comparison of LES of an offshore wind turbine wake with dual-Doppler lidar measurements in a Germanoffshore wind farm.” In Journal of Physics: Conference Series , 625:012001. 1. IOP Publishing.
Vömel, H., et al. 2018. The NCAR/EOL Community Workshop On Unmanned Aircraft Systems For Atmospheric Re-search . UCAR/NCAR Earth Observing Laboratory. doi:10.5065/D6X9292S.
Wilczak, J., C. Finley, J. Freedman, J. Cline, L. Bianco, J. Olson, I. Djalalova, L. Sheridan, M. Ahlstrom, J. Manobianco,
et al. 2015. “The Wind Forecast Improvement Project (WFIP): A public–private partnership addressing wind energyforecast needs.” Bulletin of the American Meteorological Society 96 (10): 1699–1718.
Wilczak, J. M., M. Stoelinga, L. K. Berg, J. Sharp, C. Draxl, K. McCaffrey, R. M. Banta, L. Bianco, I. Djalalova, J. K.Lundquist, et al. 2019. “The Second Wind Forecast Improvement Project (WFIP2): Observational Field Campaign.”
Bulletin of the American Meteorological Society , no. 2019.
Wildmann, N., M. Hofsäß, F. Weimer, A. Joos, and J. Bange. 2014. “MASC-a small remotely piloted aircraft (RPA)for wind energy research.” Advances in Science and Research 11:55.
Wildmann, N., S. Kigle, and T. Gerz. 2018. “Coplanar lidar measurement of a single wind energy converter wake in
distinct atmospheric stability regimes at the Perdigão 2017 experiment.” In Journal of Physics: Conference Series ,
1037:052006. 5. IOP Publishing.
Wildmann, N., N. Vasiljevic, and T. Gerz. 2018. “Wind turbine wake measurements with automatically adjusting
scanning trajectories in a multi-Doppler lidar setup.” Atmospheric Measurement Techniques Discussions (AMTD)2018:1–20.
Wilkinson, M. D., M. Dumontier, I. J. Aalbersberg, G. Appleton, M. Axton, A. Baak, N. Blomberg, J.-W. Boiten,L. B. da Silva Santos, P. E. Bourne, et al. 2016. “The FAIR Guiding Principles for scientific data management andstewardship.” Scientific data 3.
This report is available at no cost from the National Renewable Energy Laboratory (NREL) at www.nrel.gov/publications24
A Science Goals
The science goals for the Atmosphere to Electrons project have been identified at a high level during previous strategic
workshops (Hammond et al. 2015) under a process using Phenomena Identification Ranking Tables (Hills, Maniaci,
and Naughton 2015). The major phenomena important for wind plant flow physics are identified in this section,
and many have been identified as high priority (Maniaci 2016; Maniaci and Naughton 2019; Maniaci et al. 2020).The experts who attended the first AWAKEN expert elicitation meeting helped refine the critical scientific goals andquestions to be answered through a new test based on their experience. The science goals and associated questions tobe answered are as follows:
1. Wake recovery and dissipation
A. How does the wake recovery rate change with atmospheric stability throughout the wind plant? How doesstability within the wind farm evolve over the diurnal and seasonal cycles in contrast to concurrent ambientstability?
B. How does wake-added and ambient turbulence affect the recovery rate and expansion?
C. What is the best way to calculate or parameterize and observe wake recovery?
D. How and why is turbulent dissipation in a wake modified compared to the freestream, and how can it bemeasured and modeled? How does dissipation rate affect wake recovery?
E. How does the wake width change with background conditions, especially the stratification and shear?
F. How does available momentum above the wind farm impact wake recovery?
G. How is wake recovery related to wake meandering?
H. How does yaw angle influence wake recovery and dissipation under different stratification conditions?
2. Wake interaction, merging, meandering
A. How do wakes merge under different atmospheric conditions?
B. How is the meandering affected by turbine separation distance?
C. What are the dominant contributing factors to wake meandering? How do atmospheric conditions con-tribute to wake meandering? How does turbine design contribute to wake meandering? How does turbineoperation contribute to wake meandering? Can these various effects be separated in a measurement cam-paign?
D. How does turbine yaw misalignment influence meander and merger?
E. How does meandering change between the upstream wakes (for the front row of turbines) and wakes deepin the plant?
F. Is meandering driven only by the large scales in the flow, or does turbulence kinetic energy redistributionwithin the wake (and therefore its expansion) also contribute to wake motion? What is the influence oftopography?
3. Wake impingement on downstream turbines
A. How do wakes influence blade, tower, and nacelle loading and acceleration on downstream turbines?
B. How is wake influence impacted by different wake mixing scenarios (single wake vs. mixed wakes frommultiple turbines)? How does that change in partial-wake scenarios?
C. How do yawed wakes impinge differently than standard wakes?
D. At what wind speeds and other atmospheric conditions do wakes have the greatest loading impact ondownstream turbines?
This report is available at no cost from the National Renewable Energy Laboratory (NREL) at www.nrel.gov/publications25
E. Is the half-wake situation the most detrimental for loads?
F. What are the important loads for wake interaction? Can loading impacts be best isolated in a wake experi-ment, in combination with simulation or with simulation alone?
G. How can the inflow—wind turbine—wake system be modeled effectively to predict loads on downstreamturbines?
4. Deep-array effects/internal boundary layer
A. How would a deep-array effect be seen and detected in a land-based wind farm?
B. What are the dominant physical processes required to model the deep-array effect for a land-based wind
farm?
C. How does the deep-array effect change with atmospheric stability?
D. How does the deep-array effect change with different turbine spacing and layout?
E. How does the deep-array effect change with turbine operation?
F. What is the shape of internal boundary layer growth above and on the sides of a wind farm? And how is
this related to the ambient boundary layer depth?
5. Atmospheric stability and surface heat flux
A. How do the dynamics of a single wake and of the wind plant (intensity/recovery/meandering) change underclear-sky, radiative forcing-driven atmosphere vs. under specific weather events?
B. What is the impact of lateral coherence (and its height dependence) in the freestream atmosphere on an
unwaked turbine vs. a waked turbine (e.g., in terms of yaw loading), and how does it vary with turbineseparation?
6. Momentum transport within, around, above, and below the farm
A. How does boundary layer height (and the development of a wind farm internal boundary layer) affectmomentum entrainment above the farm? How does this depend on stability conditions?
B. Can the influence of the wind farm on momentum be separated from the atmospheric dynamics? In simu-
lation or observation?
C. Does the speed reduction of the wind farm lead to surface convergence and enhanced upward motion?
7. Wind direction, shear, and veer
A. How does the wake behavior change under changing shear and veer?
B. How does the wake move under sudden changes in wind direction? What is a quantitative measure of di-
rection change vs. a turbulent gust? Is the International Electrotechnical Commission standard a sufficient
definition?
8. Surface roughness
A. How do seasonal changes in roughness affect power performance and plant aerodynamics in general?
B. How important is it to accurately model roughness in our wind plant aerodynamics simulations? How
dependent is the surface roughness impact to other local features such as terrain? How can individual
roughness and terrain impacts be isolated in measurements?
C. How is the levelized cost of energy affected by roughness management (e.g., corn vs. soy, dormant season
roughness management)?
9. Wind plant wake
This report is available at no cost from the National Renewable Energy Laboratory (NREL) at www.nrel.gov/publications26
A. How far downstream does a wind plant wake persist? How can this be defined if the background wind
field is changing?
B. How does the intensity/fetch of the plant wake vary with atmospheric conditions/terrain/obstacles/plant
operating conditions?
C. How is the plant wake defined? Are there near and far wakes with different physical descriptions and
influences as with individual turbine wakes?
D. Are there downstream turbine loading impacts from wind plant wakes, or is the dominant effect powerloss?
E. How does the wind plant wake affect the local climate downstream?
F. Does a wind plant wake meander?
G. How can a wind plant wake be best observed?
10. Terrain impacts
A. How does terrain affect wake recovery and trajectory (of a single wake vs. the entire plant)?
B. How does terrain affect loads? If increased shear/turbulence reflects in increased fatigue loads, do terrain-induced speedup effects outweigh the decreased fatigue lifetime of the components/turbine?
C. At which resolution does the terrain need to be modeled so that its speedup effect and its effect on wake
dynamics are reproduced?
11. Wind plant upstream blockage
A. How far upstream is the wind speed changed by presence of the wind farm?
B. How is the blockage effect influenced by turbine size, spacing, operation, and layout?
C. How does the wind accelerate around the wind farm?
12. Air-sea interaction (American WAKE experimeNt [AWAKEN] is envisioned for the U.S. Midwest, but if off-shore is prioritized highly, these science goals can be incorporated.)
A. Relationship between wave height and period on tower loads (and platform/anchor system loads for float-
ing offshore wind turbines), on the flow within the plant, on wake recovery.
B. How far off are we when we use similarity theory to estimate surface fluxes (from buoy or satellite ormodel data), and how does this propagate to our extrapolation to hub heights?
C. Should we revisit how we model (or not model) offshore roughness?
D. What are the consequences of using equivalent neutral winds (satellite product) instead of stability-dependent
winds when estimating vertical wind profiles and extrapolating low wind speeds to nominal hub heights?
Corrections accounting for stability are often based on similarity/models.
E. How do swell conditions affect the atmospheric surface layer, wake recovery, and the turbine power/loads?
13. Reducing Uncertainty
A. How will measurement sites be selected to construct ensembles of multiple experiments (e.g., single wakes,
merged wakes, wind plant wakes, wind plant-to-wind-plant interactions)?
B. How will the selection of sites help reduce measurement uncertainty?
This report is available at no cost from the National Renewable Energy Laboratory (NREL) at www.nrel.gov/publications27
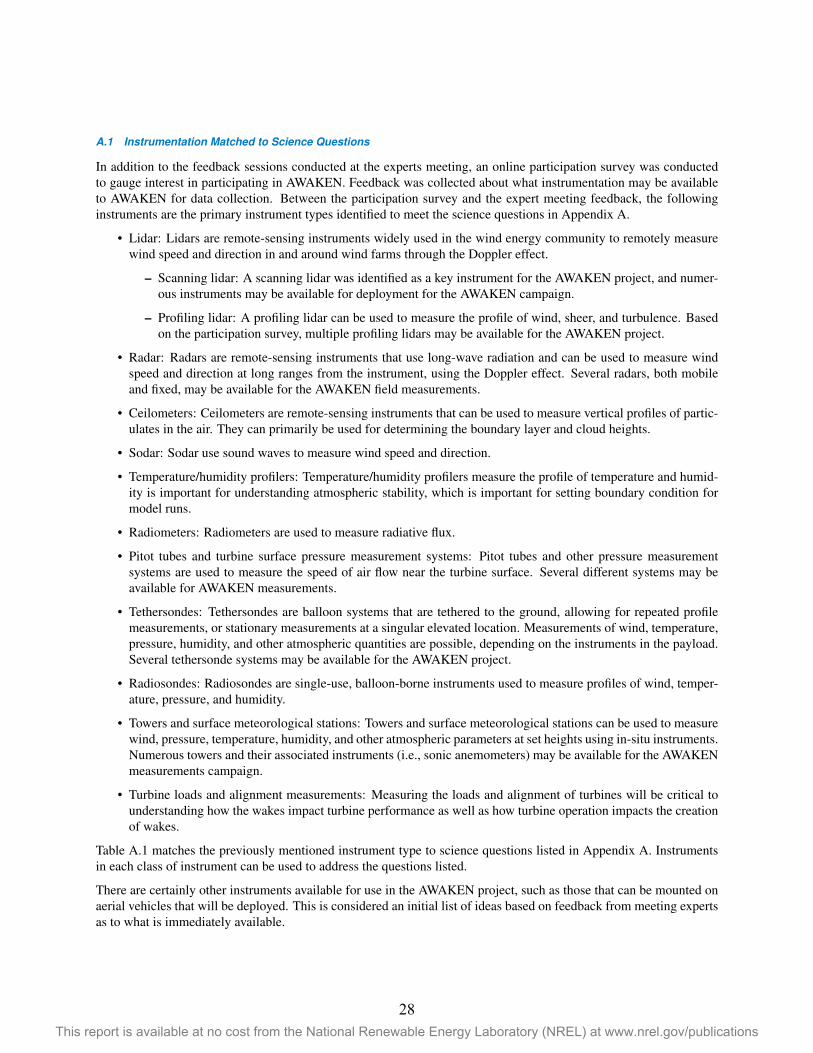
A.1 Instrumentation Matched to Science Questions
In addition to the feedback sessions conducted at the experts meeting, an online participation survey was conducted
to gauge interest in participating in AWAKEN. Feedback was collected about what instrumentation may be available
to AWAKEN for data collection. Between the participation survey and the expert meeting feedback, the followinginstruments are the primary instrument types identified to meet the science questions in Appendix A.
• Lidar: Lidars are remote-sensing instruments widely used in the wind energy community to remotely measure
wind speed and direction in and around wind farms through the Doppler effect.
– Scanning lidar: A scanning lidar was identified as a key instrument for the AWAKEN project, and numer-ous instruments may be available for deployment for the AWAKEN campaign.
– Profiling lidar: A profiling lidar can be used to measure the profile of wind, sheer, and turbulence. Based
on the participation survey, multiple profiling lidars may be available for the AWAKEN project.
• Radar: Radars are remote-sensing instruments that use long-wave radiation and can be used to measure wind
speed and direction at long ranges from the instrument, using the Doppler effect. Several radars, both mobile
and fixed, may be available for the AWAKEN field measurements.
• Ceilometers: Ceilometers are remote-sensing instruments that can be used to measure vertical profiles of partic-ulates in the air. They can primarily be used for determining the boundary layer and cloud heights.
• Sodar: Sodar use sound waves to measure wind speed and direction.
• Temperature/humidity profilers: Temperature/humidity profilers measure the profile of temperature and humid-ity is important for understanding atmospheric stability, which is important for setting boundary condition formodel runs.
• Radiometers: Radiometers are used to measure radiative flux.
• Pitot tubes and turbine surface pressure measurement systems: Pitot tubes and other pressure measurement
systems are used to measure the speed of air flow near the turbine surface. Several different systems may beavailable for AWAKEN measurements.
• Tethersondes: Tethersondes are balloon systems that are tethered to the ground, allowing for repeated profilemeasurements, or stationary measurements at a singular elevated location. Measurements of wind, temperature,pressure, humidity, and other atmospheric quantities are possible, depending on the instruments in the payload.Several tethersonde systems may be available for the AWAKEN project.
• Radiosondes: Radiosondes are single-use, balloon-borne instruments used to measure profiles of wind, temper-ature, pressure, and humidity.
• Towers and surface meteorological stations: Towers and surface meteorological stations can be used to measurewind, pressure, temperature, humidity, and other atmospheric parameters at set heights using in-situ instruments.Numerous towers and their associated instruments (i.e., sonic anemometers) may be available for the AWAKENmeasurements campaign.
• Turbine loads and alignment measurements: Measuring the loads and alignment of turbines will be critical tounderstanding how the wakes impact turbine performance as well as how turbine operation impacts the creationof wakes.
Table A.1 matches the previously mentioned instrument type to science questions listed in Appendix A. Instrumentsin each class of instrument can be used to address the questions listed.
There are certainly other instruments available for use in the AWAKEN project, such as those that can be mounted onaerial vehicles that will be deployed. This is considered an initial list of ideas based on feedback from meeting expertsas to what is immediately available.
This report is available at no cost from the National Renewable Energy Laboratory (NREL) at www.nrel.gov/publications28
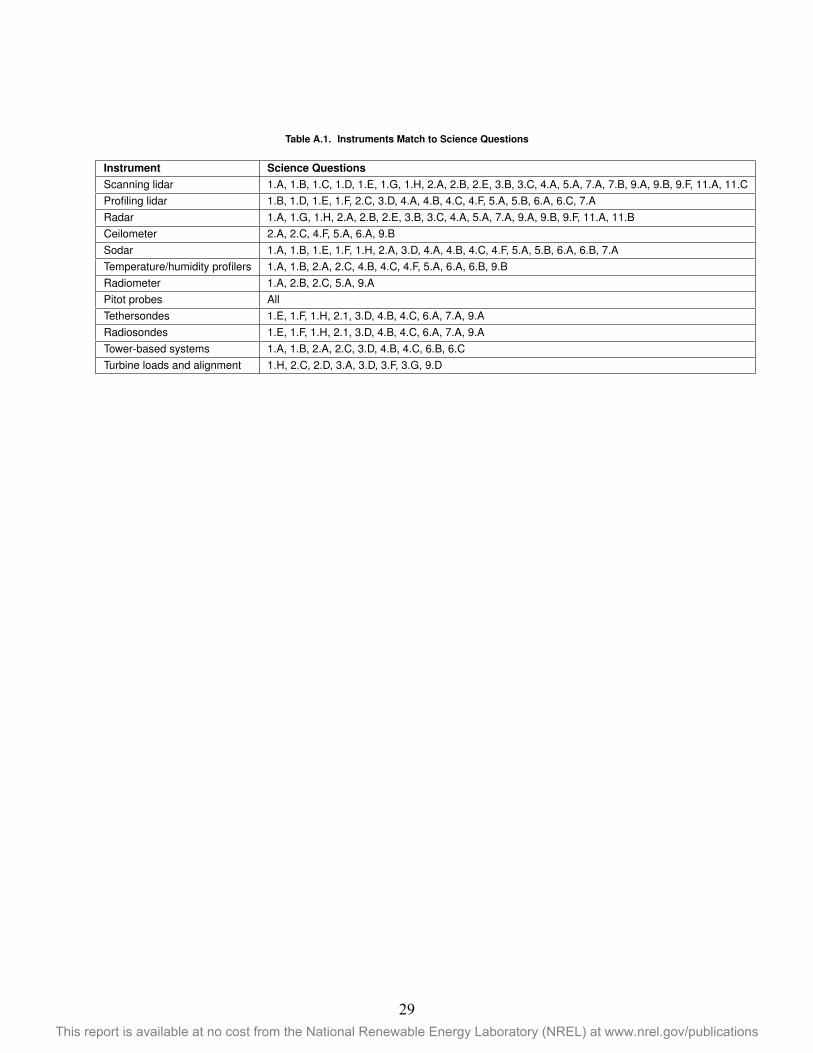
Table A.1. Instruments Match to Science Questions
Instrument Science QuestionsScanning lidar 1.A, 1.B, 1.C, 1.D, 1.E, 1.G, 1.H, 2.A, 2.B, 2.E, 3.B, 3.C, 4.A, 5.A, 7.A, 7.B, 9.A, 9.B, 9.F, 11.A, 11.CProfiling lidar 1.B, 1.D, 1.E, 1.F, 2.C, 3.D, 4.A, 4.B, 4.C, 4.F, 5.A, 5.B, 6.A, 6.C, 7.ARadar 1.A, 1.G, 1.H, 2.A, 2.B, 2.E, 3.B, 3.C, 4.A, 5.A, 7.A, 9.A, 9.B, 9.F, 11.A, 11.BCeilometer 2.A, 2.C, 4.F, 5.A, 6.A, 9.BSodar 1.A, 1.B, 1.E, 1.F, 1.H, 2.A, 3.D, 4.A, 4.B, 4.C, 4.F, 5.A, 5.B, 6.A, 6.B, 7.ATemperature/humidity profilers 1.A, 1.B, 2.A, 2.C, 4.B, 4.C, 4.F, 5.A, 6.A, 6.B, 9.BRadiometer 1.A, 2.B, 2.C, 5.A, 9.APitot probes AllTethersondes 1.E, 1.F, 1.H, 2.1, 3.D, 4.B, 4.C, 6.A, 7.A, 9.ARadiosondes 1.E, 1.F, 1.H, 2.1, 3.D, 4.B, 4.C, 6.A, 7.A, 9.ATower-based systems 1.A, 1.B, 2.A, 2.C, 3.D, 4.B, 4.C, 6.B, 6.CTurbine loads and alignment 1.H, 2.C, 2.D, 3.A, 3.D, 3.F, 3.G, 9.D
This report is available at no cost from the National Renewable Energy Laboratory (NREL) at www.nrel.gov/publications29
B Feedback sessions
Here are the aggregated notes from feedback sessions that took place at the American WAKE experimeNt expertelicitation meeting that took place on March 21, 2018.
B.1 Feedback Session #1 - Science Goals
B.1.1 Question #1 - Which science goals can be removed or combined?
Reduce the length of the list of science goals. While there are many important topics listed, it seems ambitious totry and address all of them in a single campaign. In addition, several goals or topics seem nested or interdependent.For instance, while characterizing the atmospheric conditions (wind direction, wind speed, stability, shear, veer) is
necessary to drawing consistent and reproducible conclusions from the observations; they are not in and of themselves
high-priority goals for wind energy.
By reorganizing the science goals, the main purpose of the campaign can be more clearly identified. The other topicscan be nested within the main purpose as subgoals or additional topics of interest that could be answered along theway.
The main goals appear to combine points 1 through 4:
• Goal 1. Turbine interaction with the near wake, correlation between near- and far-wake interactions. Wake
vortex startup and dissipation. Wake contraction based on turbine operation
• Goal 2. How do wakes from individual turbines combine to form a wind farm wake? Does that affect our wakemanagement strategy from one place to another?
• Goal 3. How do we characterize the transition to fully developed internal boundary layers? How does wakesteering affect transition to or development of the internal boundary layer?
Within the main goals, other points from the list could be combined:
• Combine 5, 7, 8, and 10 as atmospheric boundary conditions.
– Atmospheric stability and surface heat flux
– Wind direction, shear, and veer
– Surface roughness
– Terrain impacts.
• Combine 6, 9, and 11 as transport and plant-scale phenomena.
– Momentum transport within, around, above, and below the farm
– Wind plant wake
– Wind plant upstream blockage.
Point #13 (reducing uncertainty) as written is important but is not a science goal by itself. It is more about experimentdesign. However, there should be a goal related to quantifying uncertainties of the full range of models we use, withsituational dependence.
B.1.2 Question #2 - Which science goals are missing?
While not a science goal, instrumentation and experimental design should be give equal standing in terms of planningand consideration.
• How do we make measurements in order to address science goals?
This report is available at no cost from the National Renewable Energy Laboratory (NREL) at www.nrel.gov/publications30
• How well can we measure quantities of interest?
• Does an optimal arrangement of sensors exist? Can we reach it?
• Unmanned aerial vehicles? Thermal imaging?
Add to large-scale phenomena/wind farm effects.
• Mesoscale effects on a wind farm, maybe not localizing instruments at one point (for example, recirculationfrom a nearby mountain range) or maybe expand item 6 to include these mesoscale recirculation effects.
• Large coherence structure of wind turbines for fatigue load assessment.
Add to terrain impacts/boundary conditions.
• Homogeneity (or heterogeneity) of surface (e.g., trees, roughness, terrain).
How do the science goals tie into the desired outcomes of the campaign?
• Should goals be tuned to match needs for model development or validation?
• What data do wind farm controllers need?
B.1.3 Question #3 - Additional comments on science goals?
Reorganize priorities, including:
• Goals 3 and 4 seem to be the overarching goals of the campaign, and the other points seem to feed into those
high-level concepts. Those are the points that are most salient on wind plant controls. Does the wake manage-
ment strategy for a single wind turbine scale work for a full plant?
• A lot of these topics are interconnected (e.g. stability greatly impacts wake recovery).
• Some reorganization might be needed, as the goals are at different levels, perhaps inputs (turbine parameters,
boundary conditions) vs. outputs (e.g., wake).
• Misalignment between academia/industry on goals. Single validation/case study is not enough for industry.
• Goals we want to see/view as important:
– Atmospheric stability vs. wake controllability
– Freestream flow; need to have an idea of what happens around the wind farm
– Wind-farm-to-wind-farm interaction
– Catch the dynamics of the wake
– Wake-to-wake interaction
– Wind plant blockage/induction zone.
• Active control of wind turbines for wake control—industry hesitant to adopt. For example:
– Open-loop strategies will not work
– As an owner: never a chance to increase production after installation; wake steering could change that.
– Need additional measurements on the turbines
– Misalignment between academia/industry on goals; single validation/case study not enough for industry.
Idealize/control conditions
• Large idealized wind farm on flat terrain, but not very many regular gridded layouts
This report is available at no cost from the National Renewable Energy Laboratory (NREL) at www.nrel.gov/publications31

• Validation purposes: it is useful to start with a flat surface to eliminate areas of uncertainty and consistency ofwind direction
• We must consider which goals are achievable in terms of observations and for model validation as we plan thecampaign and identify goals.
Inflow/operating conditions
• Inflow is equally important as measuring the wakes, such as shear, veer, wind direction, wind direction variabil-ity, speed, turbulence, and stability
• If loads are important, then turbulence is important and the change of inflow parameters along the blade.
• Freestream flow: need to have an idea of what happens around the wind farm
• Atmospheric stability vs. wake controllability.
Instrumentation is a priority
• Think about potential new ways to instrument a site, but limited advancement by 2020
• Try to get wind direction variability from supervisory control and data acquisition (SCADA) data today; also
use Richardson number or Obukhov length for stability; use temperature profile from meteorological tower orsonic anemometer close to ground; depends on homogeneity of the surface.
• How will dissipation be measured (e.g., tethered lift systems, hot-wire anemometry)?
• Possibility to instrument blades, strain measurements along blades; different (scales of) models require differentmeasurements (e.g., long-term statistics for wind farm layout models vs. high-resolution measurements for high-
fidelity models). Suggest scanning techniques to answer multiple science questions (e.g., different scanning
strategies [faster scans for wake meandering vs. multiple wakes at the same time]).
Catalog "lessons learned" from previous work
• Do we have lessons learned from other measurement campaigns? Do we know at this stage?
• Researchers have a list of what they wish they did differently in Wind Forecast Improvement Project 2 (WFIP2).
Offshore
• In air-sea interactions (gulf-stream interaction—sea surface temperature and winds)
• There is a great deal of interest (professionally and scientifically) about offshore, for most of the science goals
identified.
• Offshore is important. Meteorology and underlying surface are simpler. But instrumentation is more challeng-ing.
B.2 Feedback Session #2 - Science Goal Prioritization
Please see the prioritized list of science goals and questions in Appendix A.
B.3 Feedback Session #3 - Testing Plan Feedback
B.3.1 Question #1 - What should be added to the testing plan?
Preassessment
• Lidar aerial survey prior (and perhaps after) to experiment helps in planning, and useful for modeling
• Strong surface characterization.
This report is available at no cost from the National Renewable Energy Laboratory (NREL) at www.nrel.gov/publications32
Flowfield measurements
• Long-range lidar/radar for multiple wakes
• Multiple lidars for multi-Doppler retrievals
• Thermodynamic properties
• Temperature profiles
• Consideration of the flow above the wind turbine array concurrent with wake observations, momentum entrain-ment (Do large-scale motions above the wind farm affect systemwide performance by constraining or augment-ing momentum flux?).
Turbine operational data/site characterization
• High-frequency SCADA data are important
• Surface characterization (soil moisture measurements are vital for large-eddy simulation)
• Quantification of (simple) terrain
• Consider which turbines are important (GE? Siemens?)
• Turbine-mounted instrumentation.
Logistics
• Duration: the longer the better; 3–5 years
• Plan for on-site maintenance
• Infrastructure (power and cell phone coverage)
• Webcams to monitor sensors
• Calibration plan.
Concurrent modeling
• Access to real-time model output for evaluating observations (as in WFIP2)
• Models that we want to evaluate include Simulator fOr Wind Farm Applications (SOWFA), Nalu-Wind, Weather
Research and Forecasting Model (WRF), wake merging/meandering, constants or parameters and their stability
dependence, inertial range of turbulence in wakes.)
• Consider low- or midfidelity models that can be used iteratively, or sweep over a larger experimental matrix,
compare to high-fidelity modeling
• Tune observations to measure the quantities of interest for model validation.
B.3.2 Question #2 - What should be removed from the testing plan?
Because the test plan has not yet come together into a final form, none of the small workgroups had suggestions for
removing items from the plan.
B.3.3 Question #3 - What instrumentation should be added to testing plan and why?
Meteorological masts
• Temperature profiles along with the wind speed measurements
• Sonic anemometers
This report is available at no cost from the National Renewable Energy Laboratory (NREL) at www.nrel.gov/publications33
• Pressure-temperature-humidity sensors
• Radiometers (calibrated before/after experiment)
• Thermal imaging, flux stations (thermal, momentum, moisture fluxes).
Remote sensing
• Radiosondes
• Sodar and radio acoustic sounding systems (RASS)
• Ka-band and X-band radar
• A diversity of lidars, including:
– Ground-based
– Nacelle-mounted
– Scanning
– Profiling
– All possible scan patterns.
.
• Sounding systems (difficult with the Federal Aviation Administration (FAA); a lot of labor)
• Field particle-image-velocimetry (PIV)-type systems have gone through some field testing, or possibly a lidar
or multi-Doppler technique
• Satellite may be useful for cloudiness and crop measurements. Can use satellite cloudiness index for Nowcasting
forecasting.
Other instruments
• Eddy covariance (surface flux stations) both upwind and throughout the wind plant
• Higher-frequency drone profiles for temperature, humidity, and wind that could include:
– Multirotors for vertical profiling
– Fixed wing for long transects
– Tethered balloons for profiling winds and temperature
– Ceilometer for planetary boundary layer heights.
• SCADA
– Performance/operational data
– Structural loads.
Other advice
• Plan for backup units
• Plan for calibration
• Plan for maintenance.
This report is available at no cost from the National Renewable Energy Laboratory (NREL) at www.nrel.gov/publications34
B.3.4 Question #4 - Any recommendations for test site location?
Sites
• Wind Forecast Improvement Project 2 (WFIP2) site (Columbia River Gorge): too complex terrain for this test,
but instrumentation already exist
• Atmospheric Radiation Measurement (ARM) climate research facility
• Story County, Iowa: great towers
• North of Mason City, Iowa: there are three farms close together
• NextEra: pre/postconstruction test site
• Roscoe
• Loraine
• Champion
• ARM site: Oklahoma.
Considerations
• Keep site as simple as possible.
• Flat, simple terrain. As uniform as possible in roughness surrounding site.
• An area that already has atmospheric characterization should be prioritized.
• Atmospherically complex, topographically simple
• Consider a wind farm that operates with snow, if we wish to use particle image velocimetry (PIV)
B.3.5 Question #5 - Additional thoughts on test planning?
Logistics
• Need to be flexible with landowner
– Land use
– Access
– Incentives (?)
• 2020 seems like an ambitious timeline; more likely 2022.
• In Perdigao a lot of institutes could not commit until late, which then caused disruptions for others; need strict
deadlines (but balance with flexibility)
• Do projects in phases
• Make sure safety rules are clear.
Data access, archiving, and permissions
• Common architecture for data archive
• Create data management group
• Data transfer is important, often a bottleneck for partners
• Create a team responsible for permissions, access, nondisclosure agreements, and so on
• Infrastructure to support instrumentation, such as:
This report is available at no cost from the National Renewable Energy Laboratory (NREL) at www.nrel.gov/publications35
– A data processing center
– A data access center
– An FTP server.
Instrumentation
• How will instruments be obtained? Some examples could include:
– Subcontracts with universities
– Lease from companies or international labs
– Partnerships with other national organizations: National Oceanic and Atmospheric Administration, NationalCenter for Atmospheric Research, and laboratories
• Power: deploying many lidars will require a reliable network for instrumentation
• Carnet issues for loaned equipment from Europe
• Careful calibration/alignment of the instrumentation.
Modeling component
• Should get the right suite of models, including:
– High-fidelity models
– Midfidelity and engineering models
– Parameterized models
• These should be used in the design of the experiment, during the experimental campaign, and in data analysis.
B.3.6 Question #6 - Beyond meeting attendees, any potential partners that should be included?
Agencies
• United States Department of Agriculture
• International Energy Agency (IEA) Task 31/WakeBench, IEA Task (new).
Labs
• National Laboratory for Agriculture and the Environment
• National Center for Atmospheric Research
• National Renewable Energy Centre of Spain.
University partners/research groups
• ARM climate research facility
• Technical University of Denmark
• WindForS
• ForWind
• University of Hohenheim: ability to measure atmospheric properties, aerosols
• Wind tunnel researchers
• Sowento.
This report is available at no cost from the National Renewable Energy Laboratory (NREL) at www.nrel.gov/publications36

Industry partners
• Wind energy supply chain
• Lidar manufacturers
• Drone companies
• ECN wind energy facilities
• Someone that can provide operational forecasts to plan hours or a day ahead.
This report is available at no cost from the National Renewable Energy Laboratory (NREL) at www.nrel.gov/publications37

C Expert Elicitation Meeting Agenda
MEETING FOR AWAKEN - AMERICAN WAKE EXPERIMENTUniversity of Colorado
Sustainability, Energy and Environment Complex (SEEC)Boulder, Colorado, USA
March 21, 2018
8:00 am: Introductions
8:15 am: A2e Overview
• A2e Overview - Will Shaw, PNNL, DOE wind resource coordinator
• PIRT Development, Modeling needs and Validation and Verification plan - David Maniaci, Sandia National
Laboratories
• AWAKEN Vision and Science Goals - Pat Moriarty, NREL
9:15 am: Breakout groups - Science goals feedback sessions #1
• Discussion of science goals, relevance, missing items etc.
9:45 am: Break - 20 minutes
10:05 am: Large Group - Summary of feedback session #1 and group discussion
10:35 am: Previous wake and atmospheric studies overview and future recommendations
• Perdigão overview - Jakob Mann, DTU
• SWiFT Testing - Tommy Herges, Sandia National Laboratories
• TWICS/CWEX 13 - Julie Lundquist, CU- Boulder
11:20 am: Breakout groups - Science goals feedback sessions #2
• From comments generated by groups in session #1, continue to modify science goals list and prioritize the
science goals
11:50 am: Lunch
12:40 pm: Previous wake and atmospheric studies overview and future recommendations
• TTU radar studies/BEACON project - John Schroeder, TTU
• Perdigão wakes and others - Rebecca Barthelmie, Cornell University
• Iowa Wind Farm Observations - Daniel Rajewski, Iowa State University
• NextEra experience with wakes - Bob Conzemius, NextEra
1:40 pm: Large Group - Summary of feedback session #2 and group discussion
2:00 pm: Previous wake and atmospheric studies overview and future recommendations
• Lidar wake measurements - Peter Clive, Wood Group
• GE lidar, radar and validation - Stefan Kern, GE
• Texas Panhandle Lidar Study - Valerio Iungo, UT Dallas
2:45 pm: Initial testing plans for AWAKEN and instrumentation overview - Jeroen van Dam, NREL
3:00 pm: Breakout groups - Initial plan and instrumentation feedback session #3
• Discuss suggestion for improvement
This report is available at no cost from the National Renewable Energy Laboratory (NREL) at www.nrel.gov/publications38
3:30 pm: Break - 20 minutes
3:50 pm: Summary of feedback session #3 and group discussion
4:10 pm: Future testing plans with potential overlap
• WFIP II/III - Will Shaw, PNNL
• Overview of upcoming lidar wake experiments at DTU - Elliot Simon, DTU
4:40 pm: Partnering ideas and funding opportunities
• NCAR EOL Capabilities and Timeline for Involvement -Alison Rockwell, NCAR
• Group discussion - Pat Moriarty, NREL
5:15 pm: Next Steps and Wrap-up
5:30 pm: Adjourn
This report is available at no cost from the National Renewable Energy Laboratory (NREL) at www.nrel.gov/publications39
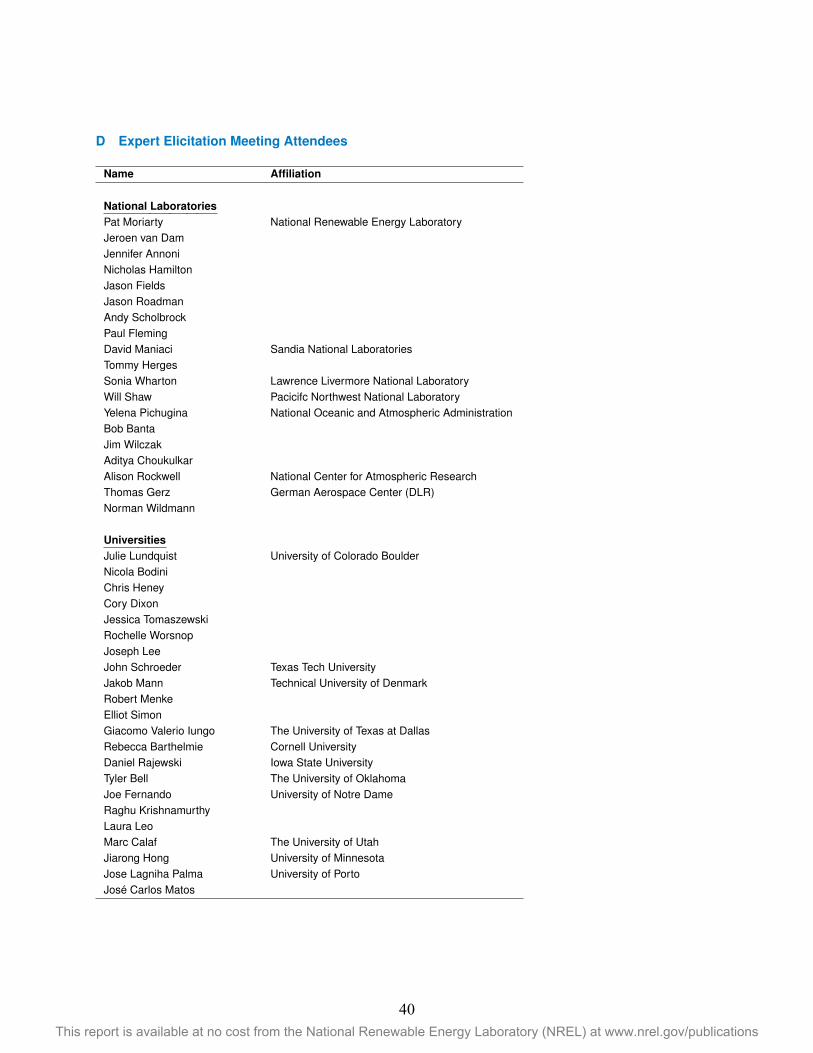
D Expert Elicitation Meeting Attendees
Name Affiliation
National Laboratories
Pat Moriarty National Renewable Energy LaboratoryJeroen van DamJennifer Annoni
Nicholas HamiltonJason FieldsJason RoadmanAndy Scholbrock
Paul FlemingDavid Maniaci Sandia National LaboratoriesTommy HergesSonia Wharton Lawrence Livermore National LaboratoryWill Shaw Pacicifc Northwest National LaboratoryYelena Pichugina National Oceanic and Atmospheric AdministrationBob Banta
Jim WilczakAditya ChoukulkarAlison Rockwell National Center for Atmospheric ResearchThomas Gerz German Aerospace Center (DLR)Norman Wildmann
UniversitiesJulie Lundquist University of Colorado Boulder
Nicola Bodini
Chris Heney
Cory Dixon
Jessica TomaszewskiRochelle WorsnopJoseph Lee
John Schroeder Texas Tech UniversityJakob Mann Technical University of DenmarkRobert MenkeElliot Simon
Giacomo Valerio Iungo The University of Texas at Dallas
Rebecca Barthelmie Cornell University
Daniel Rajewski Iowa State University
Tyler Bell The University of Oklahoma
Joe Fernando University of Notre DameRaghu KrishnamurthyLaura Leo
Marc Calaf The University of Utah
Jiarong Hong University of Minnesota
Jose Lagniha Palma University of Porto
José Carlos Matos
This report is available at no cost from the National Renewable Energy Laboratory (NREL) at www.nrel.gov/publications40
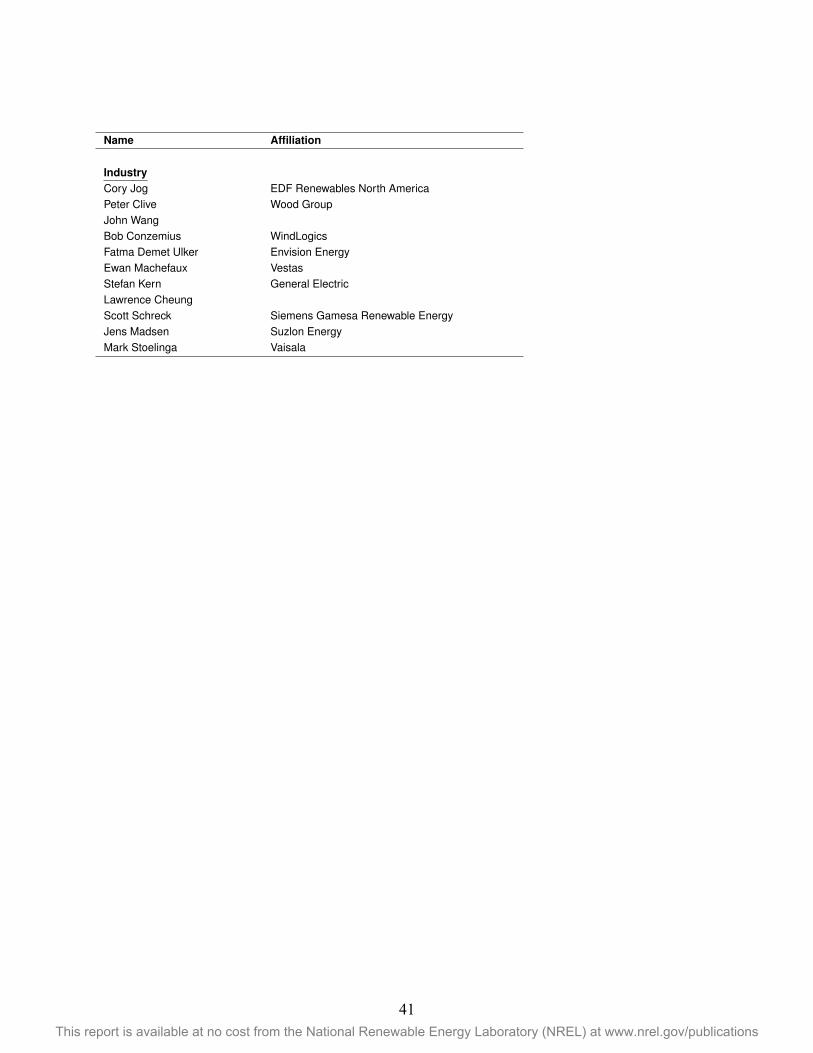
Name Affiliation
IndustryCory Jog EDF Renewables North AmericaPeter Clive Wood GroupJohn WangBob Conzemius WindLogics
Fatma Demet Ulker Envision EnergyEwan Machefaux Vestas
Stefan Kern General ElectricLawrence CheungScott Schreck Siemens Gamesa Renewable EnergyJens Madsen Suzlon EnergyMark Stoelinga Vaisala
This report is available at no cost from the National Renewable Energy Laboratory (NREL) at www.nrel.gov/publications41