Experimental equation of state in pp and p p ¯ collisions and phase transition to quark gluon...
26
arXiv:1106.2008v2 [hep-ph] 17 Jun 2011 Experimental equation of state in pp and p¯ p collisions and phase transition to quark gluon plasma Renato Campanini a,b,* , Gianluca Ferri a a Universit` a di Bologna, Dipartimento di Fisica, viale C. Berti Pichat 6/2, I-40127, Bologna, Italy b INFN, Sezione di Bologna, viale C. Berti Pichat 6/2, I-40127, Bologna, Italy Abstract We deduce approximate equations of state from experimental measurements in pp and p¯ p collisions. Thermodynamic quantities are estimated combining the measure of average transverse momentum 〈p T 〉 vs pseudorapidity density dN ch dη with the estimation of the interaction region size from measures of Bose Einstein correlation, or from a theoretical model which relates dN ch dη to the impact parameter. The results are very similar to theory predictions in case of crossover from hadron gas to quark gluon plasma. According to our analysis, the possible crossover should start at dN ch dη ≃ 6 and end at dN ch dη ≃ 24. Keywords: quark gluon plasma, average transverse momentum vs pseudorapidity density, equation of state, Bose Einstein correlation, hadron gas, sound velocity * Corresponding Author: Tel. +39 051 2095078, Fax +39 051 2095047, Mobile +39 3485925020 Email addresses: [email protected] (Renato Campanini), [email protected] (Gianluca Ferri) Preprint submitted to Physics Letters B June 20, 2011
Transcript of Experimental equation of state in pp and p p ¯ collisions and phase transition to quark gluon...
arX
iv:1
106.
2008
v2 [
hep-
ph]
17
Jun
2011
Experimental equation of state in pp and pp collisions
and phase transition to quark gluon plasma
Renato Campaninia,b,∗, Gianluca Ferria
aUniversita di Bologna, Dipartimento di Fisica, viale C. Berti Pichat 6/2, I-40127,Bologna, Italy
bINFN, Sezione di Bologna, viale C. Berti Pichat 6/2, I-40127, Bologna, Italy
Abstract
We deduce approximate equations of state from experimental measurements
in pp and pp collisions. Thermodynamic quantities are estimated combining
the measure of average transverse momentum 〈pT 〉 vs pseudorapidity density
dNch
dηwith the estimation of the interaction region size from measures of Bose
Einstein correlation, or from a theoretical model which relates dNch
dηto the
impact parameter. The results are very similar to theory predictions in case of
crossover from hadron gas to quark gluon plasma. According to our analysis,
the possible crossover should start at dNch
dη≃ 6 and end at dNch
dη≃ 24.
Keywords:
quark gluon plasma, average transverse momentum vs pseudorapidity
density, equation of state, Bose Einstein correlation, hadron gas, sound
velocity
∗Corresponding Author: Tel. +39 051 2095078, Fax +39 051 2095047,Mobile +39 3485925020
Email addresses: [email protected] (Renato Campanini),[email protected] (Gianluca Ferri)
Preprint submitted to Physics Letters B June 20, 2011
1. Introduction1
Some of the most important questions about the transition to the quark2
gluon plasma (QGP), a new state of matter with partonic degrees freedom,3
are not yet fully answered. Among them the location of phase boundaries4
between hadronic gas and the QGP. The results of lattice QCD simulations5
concerning the order of phase transition depend strongly on the number6
of quark flavors and on the quark masses. For vanishing baryon chemical7
potential µb = 0, the nature of transition can be a genuine phase transition8
(first order or continuous), or just a rapid change (crossover) over a small9
temperature range [1]. Estimates of energy densities which can be achieved10
in ultra-relativistic pp or pp collisions with high multiplicities suggest values11
sufficiently high for experimental formation of the QGP [2].12
However it may be that, unlike what happens in heavy ion interactions, in13
pp and pp the central blob of created matter never thermalizes [3], although14
there are different opinions [2, 4–7] which predict that thermodynamics con-15
cepts may be applied in pp or pp high multiplicity events.16
Probes of equation of state are among possible signatures of phase tran-17
sition or crossover. The basic idea behind this class of signatures is the18
identification of modifications in the dependence of energy density ǫ, pres-19
sure P and entropy density σ of hadronic matter on temperature T . One20
wants to search for a rapid rise in the effective number of degrees of freedom,21
as expressed by the ratio ǫ/T 4 or σ/T 3, over a small temperature range. One22
can expect a step-like rise as predicted by lattice simulations (Fig. 1), more or23
less steep depending from the presence of transition or crossover, and from24
the order of the transition in the former case. Finite volume effects may25
2
cause important consequences for ǫ/T 4 and σ/T 3: the latent heat and the26
jump in the entropy density are considerably reduced for small systems [8].27
Besides that, the critical temperature may shift to higher temperatures and28
the width of the transition may broaden for smaller volumes and there may29
be a smoothening of singularities due to the finite size of the system [8–10].30
In 1982 it has been suggested by Van Hove [12] that an anomalous be-31
havior of average transverse momentum 〈pT 〉 as function of the multiplicity32
could be a signal for the occurrence of a phase transition in hadronic matter.33
His conjecture is based on the idea that the 〈pT 〉 distribution of secondaries34
reflects the temperature of the system and its evolution in the transverse35
direction, while the multiplicity per unit rapidity provides a measure of en-36
tropy [13, 14]. In a recent paper [15] one of us showed that from 22 to37
7000 GeV in 21 〈pT 〉 vs pseudorapidity density dNch
dηcurves there is a slope38
change at dNch
dη= 5.5± 1.2. Signals related to these slope changes may indi-39
cate transition to a new mechanism of particle production. Many years ago,40
in [16], we pointed out that pp at ISR and pp data at CERN collider showed41
a kind of jump at dNch
dη= 6 and that it had to be investigated as a possible42
phase transition signal [17]. In 2002, Alexopoulos et al. [18] assumed that43
the system produced in pp at√s = 1800 GeV for dNch
dη> 6.75 was above the44
deconfinement transition to explain their experimental results.45
In present article, taking into account experimental results in pp and pp46
at high energies [19–32], we show how measured physical quantities satisfy47
relations which, given proper approximations and correspondences, can give48
a representation of the equations of state (EOS) that describe the created49
system in the central region in pseudorapidity in high energy pp and pp50
3
(a) (b)
(c)
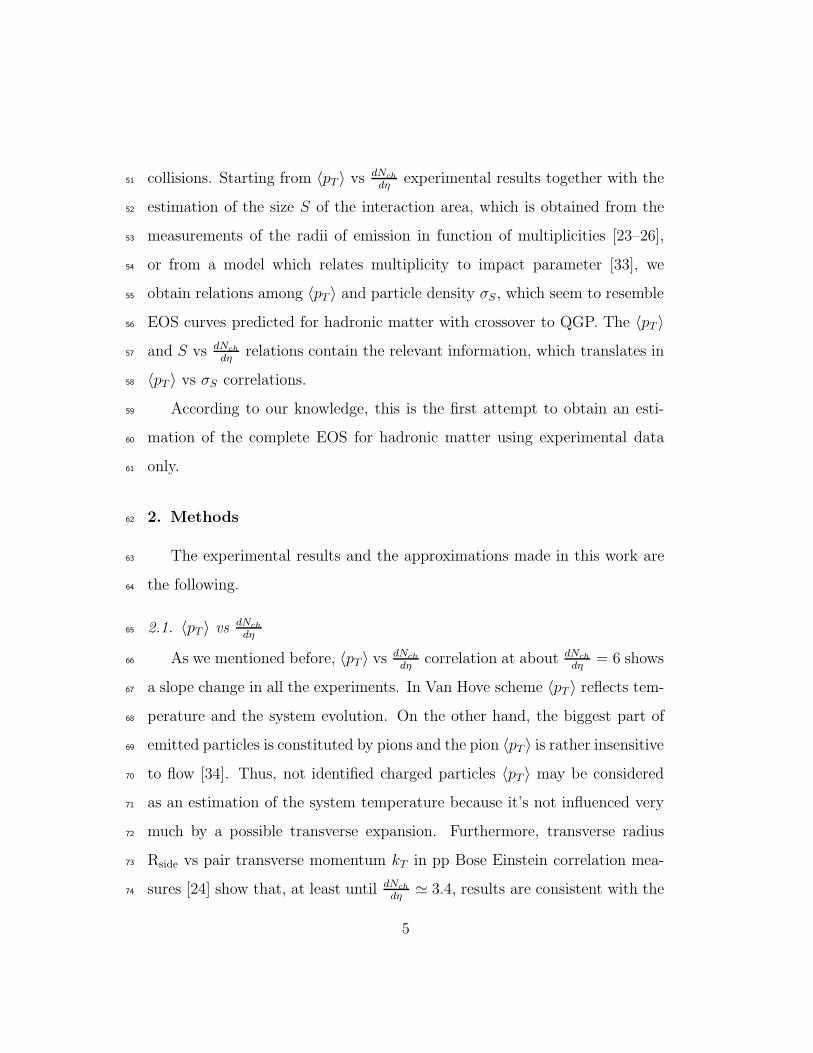
Figure 1: Results of the lattice simulations of QCD for T > Tc (critical tem-
perature) and from ideal hadron-gas model for T < Tc.
1a: entropy density σ scaled by T 3 calculated in the hadron-gas model and
by lattice simulations of QCD shown as function of temperature. The verti-
cal line indicates the critical temperature.
1b: sound velocity c2s shown as function of the energy density ǫ.
1c: temperature dependence of the square of the sound velocity at zero
baryon density as function of T . In this case the critical temperature T
is equal to 170 MeV.
From [11].4
collisions. Starting from 〈pT 〉 vs dNch
dηexperimental results together with the51
estimation of the size S of the interaction area, which is obtained from the52
measurements of the radii of emission in function of multiplicities [23–26],53
or from a model which relates multiplicity to impact parameter [33], we54
obtain relations among 〈pT 〉 and particle density σS, which seem to resemble55
EOS curves predicted for hadronic matter with crossover to QGP. The 〈pT 〉56
and S vs dNch
dηrelations contain the relevant information, which translates in57
〈pT 〉 vs σS correlations.58
According to our knowledge, this is the first attempt to obtain an esti-59
mation of the complete EOS for hadronic matter using experimental data60
only.61
2. Methods62
The experimental results and the approximations made in this work are63
the following.64
2.1. 〈pT 〉 vs dNch
dη65
As we mentioned before, 〈pT 〉 vs dNch
dηcorrelation at about dNch
dη= 6 shows66
a slope change in all the experiments. In Van Hove scheme 〈pT 〉 reflects tem-67
perature and the system evolution. On the other hand, the biggest part of68
emitted particles is constituted by pions and the pion 〈pT 〉 is rather insensitive69
to flow [34]. Thus, not identified charged particles 〈pT 〉 may be considered70
as an estimation of the system temperature because it’s not influenced very71
much by a possible transverse expansion. Furthermore, transverse radius72
Rside vs pair transverse momentum kT in pp Bose Einstein correlation mea-73
sures [24] show that, at least until dNch
dη≃ 3.4, results are consistent with the74
5
absence of transverse expansion, which further supports the adoption of 〈pT 〉75
as an identifier of temperature, because it’s little affected by the expansion.76
Since a substantial number of pions is the product of resonance decay77
and the particles originating from the resonance decays populate the low pT78
region [11], in this work we consider mainly 〈pT 〉 vs dNch
dηcorrelations with79
a pT min cut (> 400 MeV/c in CDF experiments Run I and Run II , > 50080
MeV/c in ALICE, and two different cuts, > 500 MeV/c and > 2500 MeV/c,81
in ATLAS experiment) in order to work with 〈pT 〉 values less influenced82
by this effect. Furthermore, diffractive events are substantially reduced for83
dNch
dη& 2 in 〈pT 〉 vs dNch
dηplots with pT min ≥ 400 MeV/c [21, 22].84
We will show anyway also some results for 〈pT 〉 computed with pT min cut85
0 and > 100 MeV/c. The structure of the relations we are going to show is86
still present in these measures.87
In this work, 〈pT 〉 computed for different pT cuts will be plotted without88
the application of corrections due to the cut in the used pT range, apart89
from the case of events energy density estimation, in which we will use a90
corrected 〈pT 〉. Regarding dNch
dη, it is computed from the number of particle91
in a given region of pseudorapidity η and pT , dividing by the amplitude of92
the η range and properly correcting for pT cuts. In order to perform this last93
correction, we considered dNch
dηcurves for the different experiments, measured94
with and without pT cuts, and multiplied by the ratio between correspondent95
values of dNch
dηin the central region. All data are obtained from minimum96
bias experiments. For CDF run II 1960 GeV, high multiplicity trigger data97
are added to minimum bias data, for charged particle multiplicity Nch ≥ 2298
( |η| < 1, pT > 400 MeV/c corresponding to dNch
dηcorrected ≥ 22) [15, 28].99
6
Where available, we considered also raw data results (i.e. computed with-100
out experimental inefficiencies corrections) because the 〈pT 〉 vs dNch
dηplot and101
its derived plots are much sensible to experimental losses and, on the other102
hand, the application of corrections may involve some “smearing” of data103
which could highly modify the analyzed effects [19, 35]. For reasons of space104
we don’t show behaviors for raw data in this paper, because results are very105
similar to those for corrected data.106
2.2. Entropy Density Estimation107
The initial energy density in the rest system of a head-on collision has
been argued to be [6]:
ǫ ≃dNch
dη· 3
2〈pT 〉
V
V denotes the volume into which the energy is deposited. Similarly the initial
entropy density is [2]:
σ ≃dNch
dη· 3
2
V
As a result, ǫ is equal to σ · 〈pT 〉. The volume V may be estimated as108
V = S · ct, where S is the interaction area and ct is a longitudinal dimension109
we can traditionally consider to be about 1 fm long.110
In order to study our system, we will use the quantity
σS =
dNch
dη· 3
2
S
as an estimation of entropy density. In models like color glass condensate and111
percolation, the system physics depends on σS [36–38]. For the estimation of112
the area of interaction S, we proceed in different ways, our target being the113
obtainment of results which are robust respect to the definition of the area.114
7
On the other hand, we are more interested in relations between variables115
than in their absolute values.116
2.3. Bose Einstein correlation for emission region size estimation117
Using Bose Einstein correlation among emitted particles, measurements118
of particle emission regions in many pp and pp experiments have been done [23–119
26, 31, 32, 39–41] In [23, 24], as already mentioned, the measurement of Rside120
in function of kT in pp, shows that the transverse radius doesn’t depend on121
kT for low dNch
dηvalues ( < 3.4). This can be explained by the absence of ex-122
pansion of the particle emission source, at least at these dNch
dηvalues. For dNch
dη123
values greater than 7, there is a dependence of Rside on kT , so that probably124
a source expansion is possible at least from this dNch
dηvalue. It is thus possi-125
ble that a new phenomenon is started in events with dNch
dηbetween 3.4 and126
7. The hypothesis of no expansion for low dNch
dηvalues lets us approximate127
the initial interaction section radius to be coincident to the final emission128
radius. We take into account that for dNch
dηvalues greater than about 7.5,129
this approximation is more uncertain. Furthermore, resonance effects are130
present, but, once more, we are not interested in the absolute values of the131
interaction section, but in its behavior in function of dNch
dη. Not taking into132
account these effects yields a systematic error on the value of the radius,133
which we consider invariant for different values of dNch
dη. Given the similarity134
in both the behavior and the absolute values of Rside and invariant radius135
Rinv versus multiplicity, we use Rinv as an estimation of the interaction region136
radius, mainly because Rinv data where measured for a larger dNch
dηrange than137
Rside ones [23–26, 31, 32, 39, 40]. In Fig. 2, Rinv is shown as a function of138
pseudorapidity density. In the left we only show data for CMS (preliminary)139
8
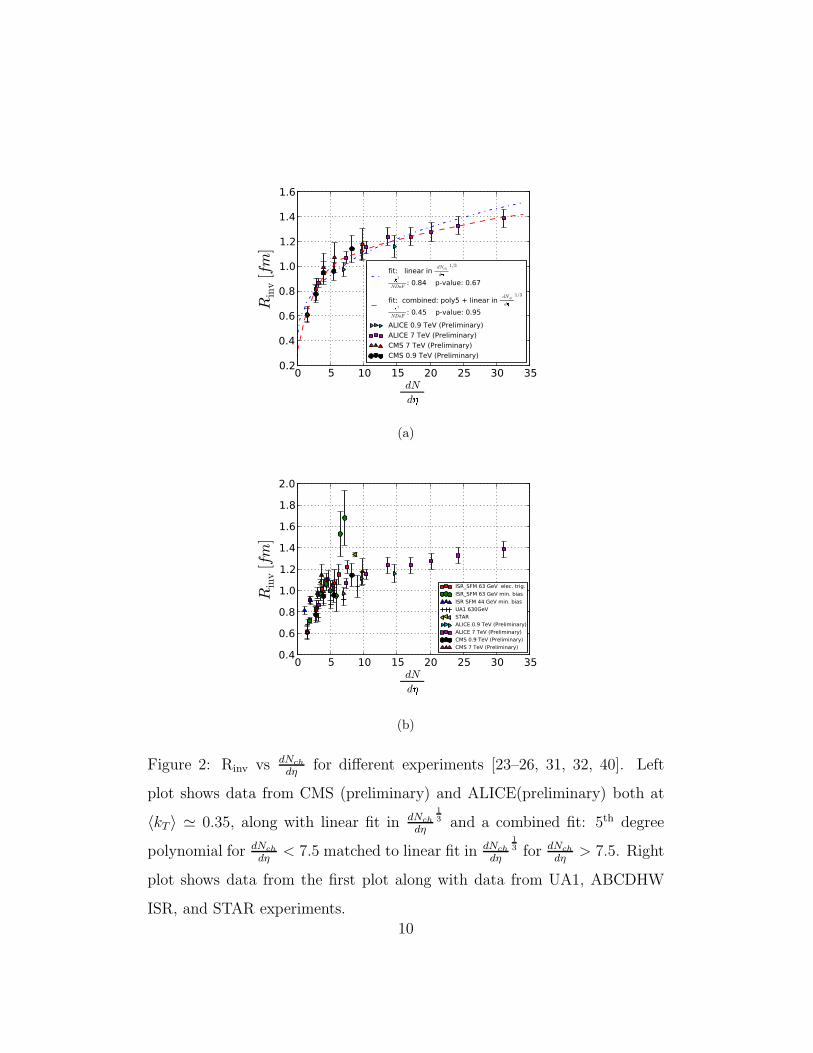
and ALICE (preliminary) at 〈kT 〉 ≃ 0.35, while in the right side we show140
the same results along data from other experiments (UA1, ABCDHW ISR,141
STAR). We fitted the data of Fig. 2a with two functional relations between142
Rinv and dNch
dη: the first is linear in the cube root of dNch
dη[23, 24, 42] and the143
second is linear in cube root of dNch
dηfor dNch
dη> 7.5, matched with a 5th de-144
gree polynomial fit for smaller dNch
dηvalues. The first fit gives a χ2
NDoF= 0.84145
with p-value: 0.67, while the second gives a χ2
NDoF= 0.45 with p-value: 0.95.146
Considering these results, we opted to use the second fit for the following147
analysis.148
It has been stated that the behavior of radii in function of dNch
dηdoesn’t149
depend on the experiment energy [41]. Data in Fig. 2 seem to confirm this150
statement, and justify our choice of a single relation for Rinv vs dNch
dηfor all151
energies.152
In order to estimate the interaction region, we used the following alter-153
natives:154
1. An area obtained using Rinv from the combined (polynomial + linear155
in cube root of dNch
dη) fit from Fig 2a. This choice may overestimate the156
interaction region in case of system expansion, being Rinv a measure of157
the emission region;158
2. following ALICE results in Rside vs kT , we make the hypothesis that159
no expansion is present in events with sufficiently low dNch
dη. So we160
use Rinv from the left (polynomial) part of the combined fit in Fig 2a,161
then we use a constant radius for dNch
dη> 7.5 as an estimation of the162
dimensions of the initial region before the possible expansion, making163
the assumption that at dNch
dη≃ 7.5 the interaction region reaches its164
9
0 5 10 15 20 25 30 35dN
d�
0.2
0.4
0.6
0.8
1.0
1.2
1.4
1.6
Rinv[fm
]fit: linear in dNch
d�
1/3
�2
NDoF: 0.84 p-value: 0.67
fit: combined: poly5 + linear in dNch
d�
1/3
�2
NDoF: 0.45 p-value: 0.95
ALICE 0.9 TeV (Preliminary)ALICE 7 TeV (Preliminary)CMS 7 TeV (Preliminary)CMS 0.9 TeV (Preliminary)
(a)
0 5 10 15 20 25 30 35dN
d�
0.4
0.6
0.8
1.0
1.2
1.4
1.6
1.8
2.0
Rin
v[fm
]
ISR_SFM 63 GeV elec. trig.ISR_SFM 63 GeV min. biasISR SFM 44 GeV min. biasUA1 630GeVSTARALICE 0.9 TeV (Preliminary)ALICE 7 TeV (Preliminary)CMS 0.9 TeV (Preliminary)CMS 7 TeV (Preliminary)
(b)
Figure 2: Rinv vs dNch
dηfor different experiments [23–26, 31, 32, 40]. Left
plot shows data from CMS (preliminary) and ALICE(preliminary) both at
〈kT 〉 ≃ 0.35, along with linear fit in dNch
dη
1
3 and a combined fit: 5th degree
polynomial for dNch
dη< 7.5 matched to linear fit in dNch
dη
1
3 for dNch
dη> 7.5. Right
plot shows data from the first plot along with data from UA1, ABCDHW
ISR, and STAR experiments.
10
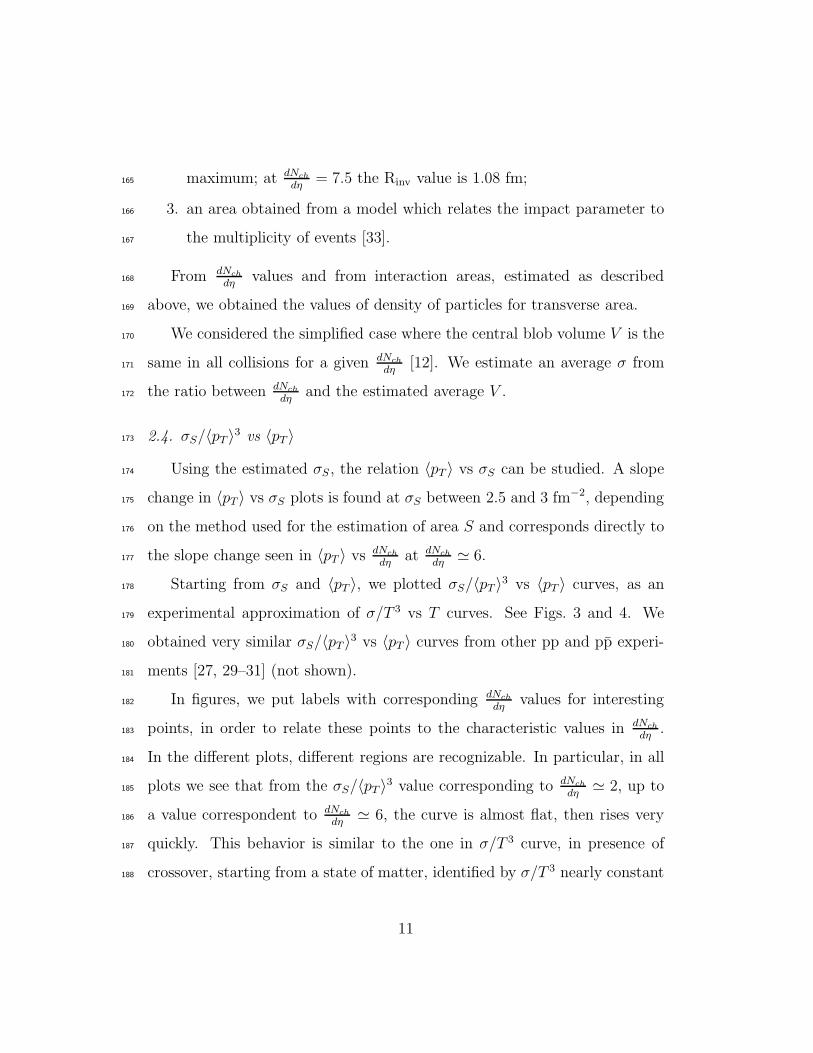
maximum; at dNch
dη= 7.5 the Rinv value is 1.08 fm;165
3. an area obtained from a model which relates the impact parameter to166
the multiplicity of events [33].167
From dNch
dηvalues and from interaction areas, estimated as described168
above, we obtained the values of density of particles for transverse area.169
We considered the simplified case where the central blob volume V is the170
same in all collisions for a given dNch
dη[12]. We estimate an average σ from171
the ratio between dNch
dηand the estimated average V .172
2.4. σS/〈pT 〉3 vs 〈pT 〉173
Using the estimated σS , the relation 〈pT 〉 vs σS can be studied. A slope174
change in 〈pT 〉 vs σS plots is found at σS between 2.5 and 3 fm−2, depending175
on the method used for the estimation of area S and corresponds directly to176
the slope change seen in 〈pT 〉 vs dNch
dηat dNch
dη≃ 6.177
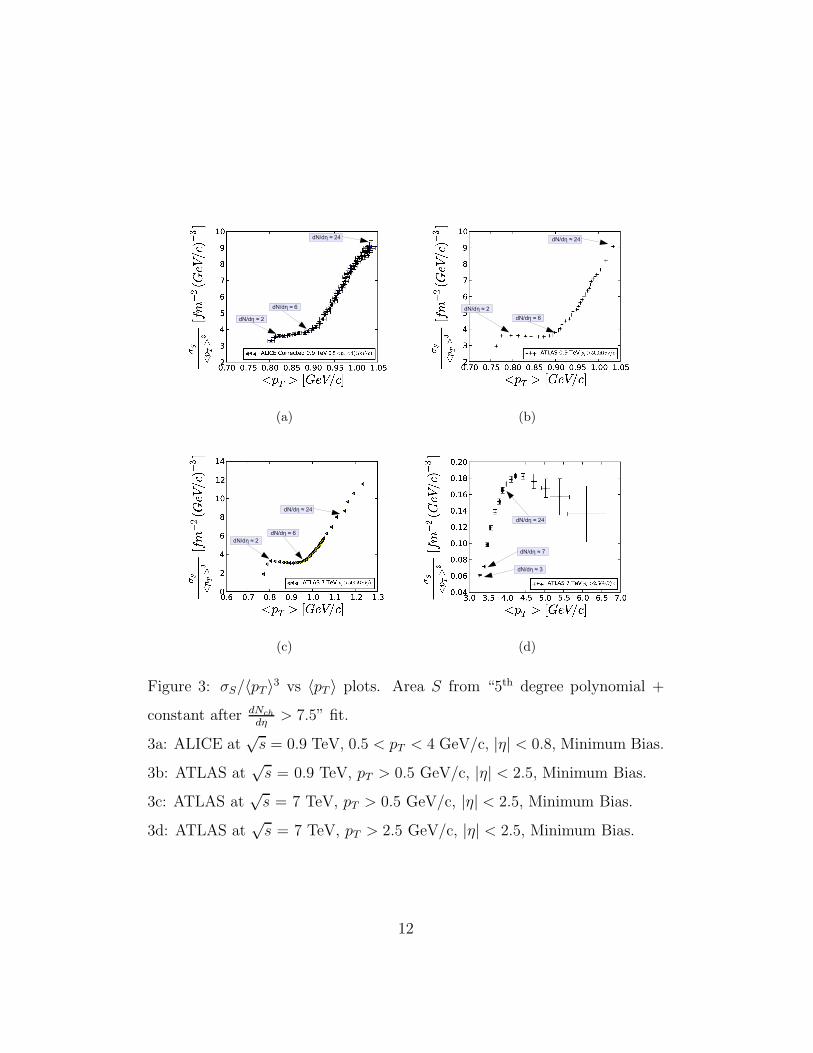
Starting from σS and 〈pT 〉, we plotted σS/〈pT 〉3 vs 〈pT 〉 curves, as an178
experimental approximation of σ/T 3 vs T curves. See Figs. 3 and 4. We179
obtained very similar σS/〈pT 〉3 vs 〈pT 〉 curves from other pp and pp experi-180
ments [27, 29–31] (not shown).181
In figures, we put labels with corresponding dNch
dηvalues for interesting182
points, in order to relate these points to the characteristic values in dNch
dη.183
In the different plots, different regions are recognizable. In particular, in all184
plots we see that from the σS/〈pT 〉3 value corresponding to dNch
dη≃ 2, up to185
a value correspondent to dNch
dη≃ 6, the curve is almost flat, then rises very186
quickly. This behavior is similar to the one in σ/T 3 curve, in presence of187
crossover, starting from a state of matter, identified by σ/T 3 nearly constant188
11
���������
����������
���������
(a)
���������
����������
���������
(b)
���������
����������
���������
(c)
���������
����������
��������
(d)
Figure 3: σS/〈pT 〉3 vs 〈pT 〉 plots. Area S from “5th degree polynomial +
constant after dNch
dη> 7.5” fit.
3a: ALICE at√s = 0.9 TeV, 0.5 < pT < 4 GeV/c, |η| < 0.8, Minimum Bias.
3b: ATLAS at√s = 0.9 TeV, pT > 0.5 GeV/c, |η| < 2.5, Minimum Bias.
3c: ATLAS at√s = 7 TeV, pT > 0.5 GeV/c, |η| < 2.5, Minimum Bias.
3d: ATLAS at√s = 7 TeV, pT > 2.5 GeV/c, |η| < 2.5, Minimum Bias.
12
���������
����������
���������
(a)
���������
����������
���������
(b)
���������
����������
���������
(c)
���������
����������
���������
(d)
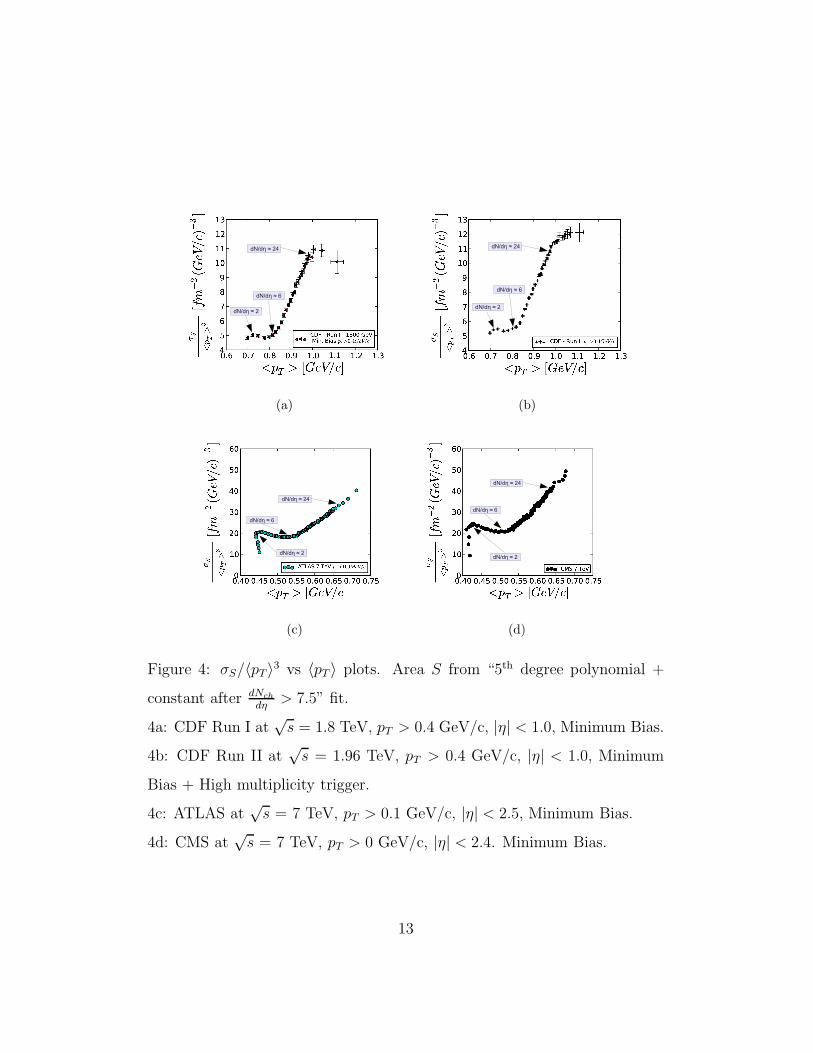
Figure 4: σS/〈pT 〉3 vs 〈pT 〉 plots. Area S from “5th degree polynomial +
constant after dNch
dη> 7.5” fit.
4a: CDF Run I at√s = 1.8 TeV, pT > 0.4 GeV/c, |η| < 1.0, Minimum Bias.
4b: CDF Run II at√s = 1.96 TeV, pT > 0.4 GeV/c, |η| < 1.0, Minimum
Bias + High multiplicity trigger.
4c: ATLAS at√s = 7 TeV, pT > 0.1 GeV/c, |η| < 2.5, Minimum Bias.
4d: CMS at√s = 7 TeV, pT > 0 GeV/c, |η| < 2.4. Minimum Bias.
13
(region 2 . dNch
dη. 6), and a crossover starting at dNch
dη≃ 6 (Fig. 1). Besides,189
in plots with many points at high dNch
dηvalues (ATLAS with pT > 2500190
MeV/c, and CDF Run II 1960 GeV with pT > 400 MeV), we observe a191
strong slope change around corresponding dNch
dηvalues of about 24 or higher.192
It’s worth noting that what seems to be a different behavior in the left side193
for ATLAS with pT > 2500 MeV/c (Fig. 3d), is only due to the fact that all194
points correspond to dNch
dη& 7, apart from the first point, which correspond195
to dNch
dη≃ 3.4. The ratio between σS/〈pT 〉3 values corresponding to dNch
dη≥ 24196
and those corresponding to dNch
dη≤ 6 varies from 2 to 3, depending on the197
area calculation method used for the estimation of σS. This ratio in the case198
of EOS would correspond to the ratio between the number of the degrees of199
freedom of the state before and after the transition or the crossover. We note200
that for small size systems as it would be in the pp case, the jump in entropy201
density is considerably reduced [8–10] in comparison to the theoretical infinite202
volume case. In plots with pT > 100 MeV/c (ATLAS 7 TeV) or pT > 0 (CMS203
7 TeV), the first points have constant 〈pT 〉 with varying dNch
dη, which leads204
to an initial steep rise. After that, the curves assume the same behavior of205
previously seen plots.206
2.5. Sound velocity c2s207
One of the physical quantities used to characterize the state of a system is208
its squared sound velocity, defined as c2s =σ
T· dTdσ
, for constant V [11]. In our209
study, we approximate it with c2s =σS
〈pT 〉· d〈pT 〉dσS
. It is really interesting that210
if 〈pT 〉 is proportional to T and if σS is proportional to the entropy density,211
then the c2s value obtained in this approximation is equal to the right value212
14
of c2s =σ
T· dTdσ
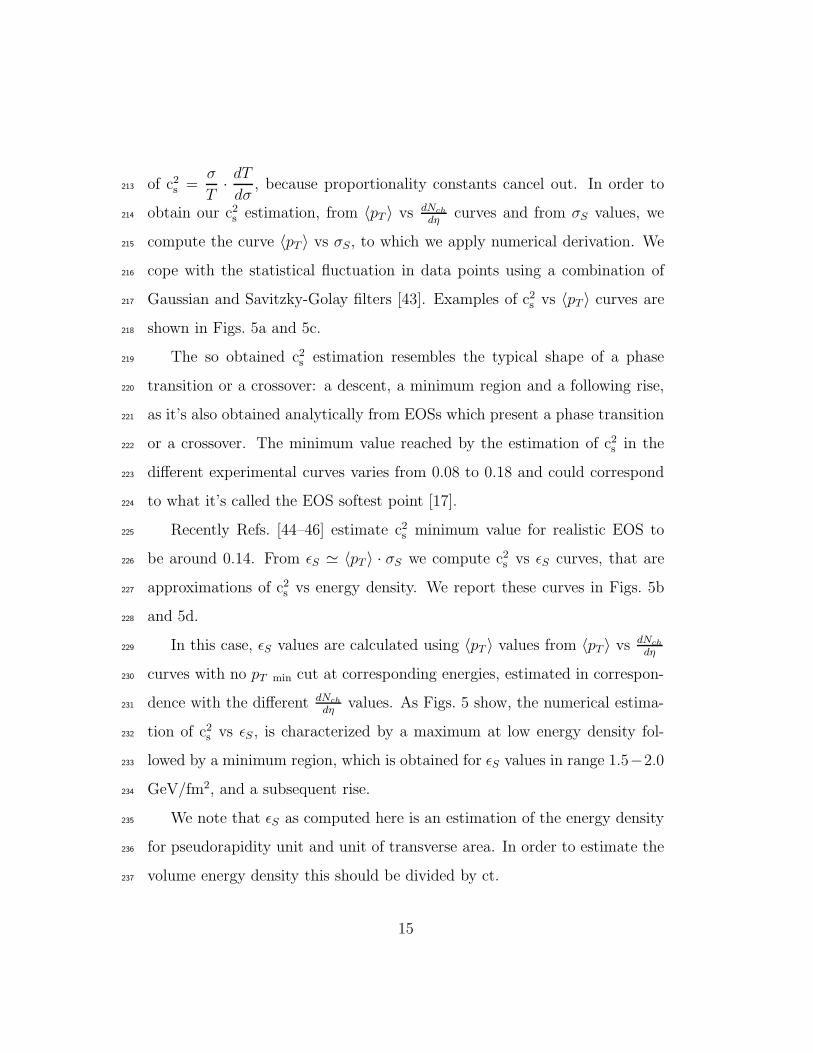
, because proportionality constants cancel out. In order to213
obtain our c2s estimation, from 〈pT 〉 vs dNch
dηcurves and from σS values, we214
compute the curve 〈pT 〉 vs σS, to which we apply numerical derivation. We215
cope with the statistical fluctuation in data points using a combination of216
Gaussian and Savitzky-Golay filters [43]. Examples of c2s vs 〈pT 〉 curves are217
shown in Figs. 5a and 5c.218
The so obtained c2s estimation resembles the typical shape of a phase219
transition or a crossover: a descent, a minimum region and a following rise,220
as it’s also obtained analytically from EOSs which present a phase transition221
or a crossover. The minimum value reached by the estimation of c2s in the222
different experimental curves varies from 0.08 to 0.18 and could correspond223
to what it’s called the EOS softest point [17].224
Recently Refs. [44–46] estimate c2s minimum value for realistic EOS to225
be around 0.14. From ǫS ≃ 〈pT 〉 · σS we compute c2s vs ǫS curves, that are226
approximations of c2s vs energy density. We report these curves in Figs. 5b227
and 5d.228
In this case, ǫS values are calculated using 〈pT 〉 values from 〈pT 〉 vs dNch
dη229
curves with no pT min cut at corresponding energies, estimated in correspon-230
dence with the different dNch
dηvalues. As Figs. 5 show, the numerical estima-231
tion of c2s vs ǫS , is characterized by a maximum at low energy density fol-232
lowed by a minimum region, which is obtained for ǫS values in range 1.5−2.0233
GeV/fm2, and a subsequent rise.234
We note that ǫS as computed here is an estimation of the energy density235
for pseudorapidity unit and unit of transverse area. In order to estimate the236
volume energy density this should be divided by ct.237
15
0.70 0.75 0.80 0.85 0.90 0.95 1.00 1.05<pT > [GeV/c]
0.05
0.10
0.15
0.20
0.25
0.30
�
S
<pT>
d<pT>
d
�
S
ALICE Corrected 0.9 TeV 0.5<pt <4(GeV/c)
(a)
0.0 0.5 1.0 1.5 2.0 2.5 3.0 3.5 4.0�S [GeVfm�2 ]
0.05
0.10
0.15
0.20
0.25
0.30
�
S
<pT>
d<pT>
d
�
S
ALICE Corrected 0.9 TeV 0.5<pt <4(GeV/c)
(b)
0.70 0.75 0.80 0.85 0.90 0.95 1.00 1.05<pT > [GeV/c]
0.05
0.10
0.15
0.20
0.25
0.30
�
S
<pT>
d<pT>
d
�
S
CDF - Run II pt >0.4GeV/c
(c)
0 2 4 6 8 10 12S [GeVfm2 ]
0.05
0.10
0.15
0.20
0.25
0.30
�
S
<pT>
d<pT>
d
�
S
CDF - Run II pt >0.4GeV/c
(d)
Figure 5: c2s =σS
〈pT 〉· d〈pT 〉dσS
vs 〈pT 〉 or ǫS, using two different fits for area S
estimation.
ALICE at√s = 0.9 TeV, 0.5 < pT < 4 GeV/c, |η| < 0.8, Minimum Bias;
area S from “5th degree polynomial + linear in dNch
dη
1/3after dNch
dη> 7.5” fit.
5a: c2s vs 〈pT 〉, 5b: c2s vs ǫS.
CDF Run II at√s = 1.96 TeV, pT > 0.4 GeV/c, |η| < 1.0, Minimum Bias
+ High multiplicity trigger; area S from “5th degree polynomial + constant
after dNch
dη> 7.5” fit.
5c: c2s vs 〈pT 〉, 5d: c2s vs ǫS .
16
3. Discussion238
The shape of the σS/〈pT 〉3 approximation to the EOS is very similar,239
using both Rinv from the fit on all dNch
dηspace and Rinv fitted up to dNch
dη=240
7.5 and then maintained constant. It slightly varies when using the area241
from the impact parameter model, but the slope change at σS/〈pT 〉3 values242
corresponding to dNch
dηaround 6 is still present, as well as the change at243
σS/〈pT 〉3 values corresponding to dNch
dηabout 24.244
In order to avoid possible systematics due to calculation involved in the245
area definition, we plotted directly dNch
dη/〈pT 〉3 vs 〈pT 〉: this is equivalent to246
obtain σS/〈pT 〉3 curves considering a transverse section which is constant for247
all dNch
dηvalues. For space reason we don’t show these plots in this paper.248
In this case the shape doesn’t resemble an EOS shape anymore, but the249
slope changes at dNch
dη≃ 6 and dNch
dη≃ 24 are still present, because they are250
contained in the 〈pT 〉 vs dNch
dηcorrelation.251
The shape of the curves obtained from experimental data (σS/〈pT 〉3 vs 〈pT 〉,252
c2s vs 〈pT 〉 and c2s vs energy) depends on experimental 〈pT 〉 vs dNch
dηcurves and253
from the value of the area used to obtain density sigmas. Systematic errors254
in 〈pT 〉, dNch
dη, and Rinv measurements don’t lead to appreciable variations in255
〈pT 〉 vs σS behavior, which is what we are interested on.256
It seems to us that the main result of this work is that putting together257
experimental data of 〈pT 〉 vs dNch
dηand Rinv vs
dNch
dη, curves are obtained which258
are the reproduction of theoretical EOS curves.259
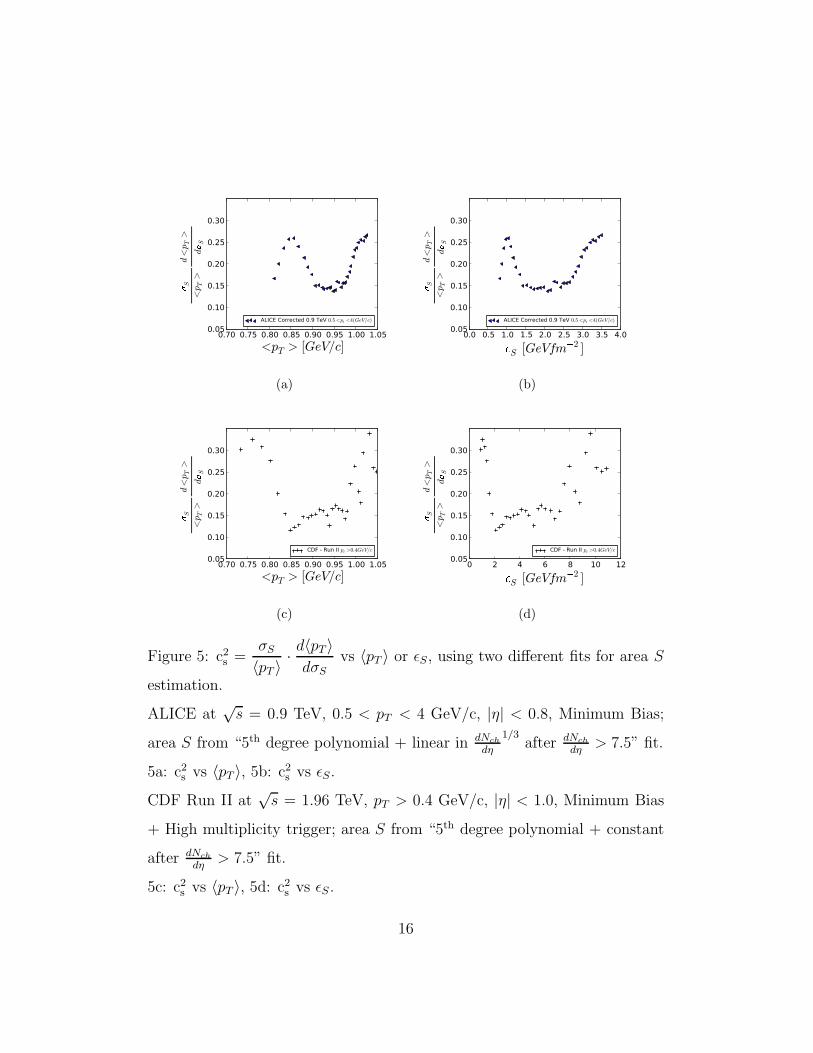
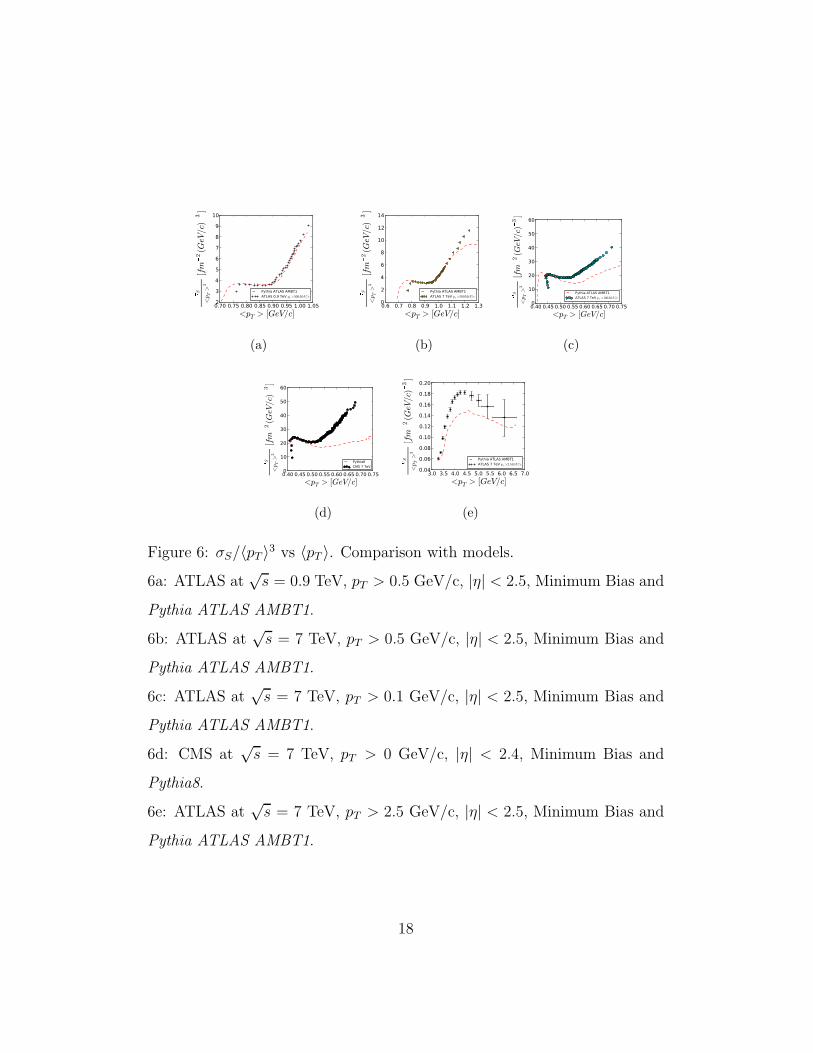
Regarding model comparison, we obtained σS/〈pT 〉3 vs 〈pT 〉 plots starting260
from Montecarlo curves (Pythia ATLAS AMBT1 and Pythia8 for ATLAS261
and CMS experiment respectively), which are shown in Fig. 6.262
17
0.70 0.75 0.80 0.85 0.90 0.95 1.00 1.05<pT > [GeV/c]
2
3
4
5
6
7
8
9
10
�
S
<pT>
3[fm
2(GeV/c)
3]
Pythia ATLAS AMBT1ATLAS 0.9 TeV pt >500MeV/c
(a)
0.6 0.7 0.8 0.9 1.0 1.1 1.2 1.3<pT > [GeV/c]
0
2
4
6
8
10
12
14
�
S
<pT>
3[fm
�
2(GeV/c)
�
3]
Pythia ATLAS AMBT1ATLAS 7 TeV pt >500MeV/c
(b)
0.40 0.45 0.50 0.55 0.60 0.65 0.70 0.75<pT > [GeV/c]
0
10
20
30
40
50
60
�
S
<pT>
3[fm
�
2(GeV/c)
�
3]
Pythia ATLAS AMBT1ATLAS 7 TeV pt >100MeV/c
(c)
0.40 0.45 0.50 0.55 0.60 0.65 0.70 0.75<pT > [GeV/c]
0
10
20
30
40
50
60
�
S
<pT>
3[fm
�
2(GeV/c)
�
3]
Pythia8CMS 7 TeV
(d)
3.0 3.5 4.0 4.5 5.0 5.5 6.0 6.5 7.0<pT > [GeV/c]
0.04
0.06
0.08
0.10
0.12
0.14
0.16
0.18
0.20
�
S
<pT>
3[fm
�
2(G
eV/c)
�
3]
Pythia ATLAS AMBT1ATLAS 7 TeV pt >2.5GeV/c
(e)
Figure 6: σS/〈pT 〉3 vs 〈pT 〉. Comparison with models.
6a: ATLAS at√s = 0.9 TeV, pT > 0.5 GeV/c, |η| < 2.5, Minimum Bias and
Pythia ATLAS AMBT1.
6b: ATLAS at√s = 7 TeV, pT > 0.5 GeV/c, |η| < 2.5, Minimum Bias and
Pythia ATLAS AMBT1.
6c: ATLAS at√s = 7 TeV, pT > 0.1 GeV/c, |η| < 2.5, Minimum Bias and
Pythia ATLAS AMBT1.
6d: CMS at√s = 7 TeV, pT > 0 GeV/c, |η| < 2.4, Minimum Bias and
Pythia8.
6e: ATLAS at√s = 7 TeV, pT > 2.5 GeV/c, |η| < 2.5, Minimum Bias and
Pythia ATLAS AMBT1.
18
Some models on which tuning has been done, for example with CDF Run263
II data at 1960 GeV for pT > 400 MeV/c, well reproduce the 〈pT 〉 vs dNch
dη264
curve at higher (7 TeV) or lower (0.9 TeV) energies with pT > 500MeV/c. It265
is clear that in these cases, starting from the 〈pT 〉 vs dNch
dηcurves of models and266
using Bose Einstein correlation or the impact parameter–multiplicity relation267
for σS estimation, curves similar to the experimental ones are obtained. On268
the other hand, models don’t predict well 〈pT 〉 vs dNch
dηcurves with low pT min,269
and consequently σS/〈pT 〉3 vs 〈pT 〉 curves as shown for the comparison of270
models at 7 TeV for CMS and ATLAS data, respectively with pT > 0 MeV/c271
and pT > 100 MeV/c [20–22, 47].272
The interpretation of curve shapes as experimental “estimation” of EOS273
depends on how much likely are the correspondences between 〈pT 〉 and T ,274
and between measured σS and entropy.275
4. Conclusion276
The result we consider to be the most important is the following: in277
many experiments [19–22, 27–31] from 31 GeV to 7000 GeV, starting from278
〈pT 〉 vs dNch
dηand using results from measures of radii with Bose Einstein279
correlation or from a model that relates impact parameter and multiplicity,280
we obtained that σS/〈pT 〉3 vs 〈pT 〉 and c2s =σS
〈pT 〉· d〈pT 〉dσS
reproduce the shape281
of hadronic matter EOSs and squared sound velocity respectively, in presence282
of crossover or phase transition. From the plots, a neat change around dNch
dη283
around 6, where the crossover or the phase transition seems to start, and284
another possible change at dNch
dηaround 24 are observed. The curve c2s vs ǫS285
has a minimum around a “transverse” energy density of about 1.5 GeV/fm2.286
19
In order to understand if these behaviors have a real physical meaning287
or are just casual, results of measures in the following regions should be288
compared: 2 . dNch
dη. 6, dNch
dη& 6, 6 . dNch
dη. 24 and dNch
dη& 24.289
References290
References291
[1] Y. Aoki, G. Endrodi, Z. Fodor, S. D. Katz, K. K. Szabo, The order292
of the quantum chromodynamics transition predicted by the standard293
model of particle physics., Nature 443 (2006) 675–8.294
[2] K. Redlich, H. Satz, Critical behavior near deconfinement, Physical295
Review D 33 (1986) 3747.296
[3] P. Braun-Munzinger, J. Stachel, The quest for the quark-gluon plasma.,297
Nature 448 (2007) 302–9.298
[4] L. C. P. Van Hove, Two problems concerning hot hadronic matter and299
high energy collisions (equilibrium formation, plasma deflagration), Z.300
Phys. C Particles and Fields 21 (1983) 93–98.301
[5] K. Werner, I. Karpenko, T. Pierog, “Ridge” in Proton-Proton Scattering302
at 7 TeV, Physical Review Letters 106 (2011).303
[6] J. D. Bjorken, Highly relativistic nucleus-nucleus collisions: The central304
rapidity region, Physical Review D 27 (1983) 140–151.305
[7] P. Castorina, D. Kharzeev, H. Satz, Thermal hadronization and306
Hawking–Unruh radiation in QCD, The European Physical Journal307
C 52 (2007) 187–201.308
20
[8] H.-T. Elze, W. Greiner, Finite size effects for quark-gluon plasma309
droplets, Physics Letters B 179 (1986) 385–392.310
[9] A. Bazavov, B. Berg, Deconfining phase transition on lattices with311
boundaries at low temperature, Physical Review D 76 (2007) 014502.312
[10] L. F. Palhares, E. S. Fraga, T. Kodama, Finite-size effects and signatures313
of the QCD critical endpoint, Journal of Physics G: Nuclear and Particle314
Physics 37 (2010) 094031.315
[11] W. Florkowski, Phenomenology of Ultra-relativistic Heavy-ion Colli-316
sions, World Scientific Publishing Company, 2010.317
[12] L. Van Hove, Multiplicity dependence of pt spectrum as a possible318
signal for a phase transition in hadronic collisions, Physics Letters B319
118 (1982) 138–140.320
[13] B. Muller, Physics and signatures of the quark-gluon plasma, Reports321
on Progress in Physics 58 (1995) 611–636.322
[14] B. Mohanty, J. Alam, S. Sarkar, T. K. Nayak, B. K. Nandi, Indication of323
a coexisting phase of quarks and hadrons in nucleus-nucleus collisions,324
Physical Review C 68 (2003).325
[15] R. Campanini, Possible Signals of new phenomena in hadronic interac-326
tions at dn/deta=5.5+-1.2, Arxiv preprint arXiv:1102.5219v1 [hep-ex]327
(2010) 32.328
[16] R. Campanini, Quark gluon plasma and multiplicity dependence of329
21
transverse momentum in hadronic collisions, Lettere Al Nuovo Cimento330
Series 2 44 (1985) 343–350.331
[17] E. Shuryak, Is the explosion of a quark-gluon plasma found?, Physics332
Letters B 171 (1986) 99–102.333
[18] T. Alexopoulos, E. Anderson, A. Bujak, D. Carmony, A. Erwin,334
L. Gutay, A. Hirsch, K. Nelson, N. Porile, S. Oh, Evidence for hadronic335
deconfinement in collisions at 1.8 TeV, Physics Letters B 528 (2002)336
43–48.337
[19] K. Aamodt, N. Abel, U. Abeysekara, A. Abrahantes Quintana,338
A. Abramyan, D. Adamova, M. Aggarwal, G. Aglieri Rinella, A. Agocs,339
S. Aguilar Salazar, Transverse momentum spectra of charged particles340
in proton–proton collisions at√s = 900 GeV with ALICE at the LHC,341
Physics Letters B 693 (2010) 53–68.342
[20] V. Khachatryan, A. M. Sirunyan, A. Tumasyan, W. Adam, T. Bergauer,343
M. Dragicevic, J. Ero, F. et al., Charged particle multiplicities in pp344
interactions at√s = 0.9 , 2.36, and 7 TeV, Journal of High Energy345
Physics 2011 (2011).346
[21] G. Aad, E. Abat, B. Abbott, J. Abdallah, A. Abdelalim, A. Abdesselam,347
O. Abdinov, B. e. Abi, Charged-particle multiplicities in pp interactions348
at√s = 900 GeV measured with the ATLAS detector at the LHC,349
Physics Letters B 688 (2010) 21–42.350
[22] G. Aad, B. Abbott, J. Abdallah, A. A. Abdelalim, A. Abdesselam,351
O. Abdinov, B. Abi, M. Abolins, A. et al., Charged-particle multi-352
22
plicities in pp interactions measured with the ATLAS detector at the353
LHC, New Journal of Physics 13 (2011) 053033.354
[23] K. Aamodt, N. Abel, U. Abeysekara, A. Abrahantes Quintana,355
A. Abramyan, D. Adamova, M. Aggarwal, G. A. et al., Two-pion Bose-356
Einstein correlations in pp collisions at√s = 900 GeV, Physical Review357
D 82 (2010) 1–14.358
[24] ALICE Collaboration, Femtoscopy of pp collisions at√s = 0.9 and359
7 TeV at the LHC with two-pion Bose-Einstein correlations, Arxiv360
preprint arXiv:1101.3665 [hep-ex] (2011) 21.361
[25] V. Khachatryan, A. Sirunyan, A. Tumasyan, W. Adam, T. Bergauer,362
M. Dragicevic, J. Ero, F. et al., First Measurement of Bose-Einstein363
Correlations in Proton-Proton Collisions at√s = 0.9 and 2.36 TeV at364
the LHC, Physical Review Letters 105 (2010) 1–14.365
[26] The CMS Collaboration, Measurement of Bose-Einstein Correlations in366
pp Collisions at√s = 0.9 and 7 TeV, Arxiv preprint arXiv:1101.3518v1367
[hep-ex] (2011).368
[27] D. Acosta, T. Affolder, H. Akimoto, M. Albrow, P. Amaral, D. Ambrose,369
D. Amidei, K. A. et al., Soft and hard interactions in pp− collisions at370
√s = 1800 and 630 GeV, Physical Review D 65 (2002).371
[28] T. Aaltonen, J. Adelman, T. Akimoto, B. Gonzalez, S. Amerio,372
D. Amidei, A. Anastassov, A. A. et al., Measurement of particle373
production and inclusive differential cross sections in pp− collisions at374
√s = 1.96 TeV, Physical Review D 79 (2009).375
23
[29] T. Alexopoulos, C. Allen, E. W. Anderson, V. Balamurali, S. Banerjee,376
P. D. Beery, P. Bhat, J. M. B. et al., Mass-identified particle production377
in proton-antiproton collisions at√s = 300, 540, 1000, and 1800 GeV,378
Physical Review D 48 (1993) 984–997.379
[30] C. Albajar, A study of the general characteristics of proton-antiproton380
collisions at√s = 0.2 to 0.9 TeV, Nuclear Physics B 335 (1990) 261–287.381
[31] A. Breakstone, R. Campanini, H. B. Crawley, M. Cuffiani, G. M.382
Dallavalle, M. M. Deninno, K. Doroba, D. D. et al., Multiplicity depen-383
dence of the average transverse momentum and of the particle source384
size in p–p interactions at√s = 62, 44 and 31 GeV, Zeitschrift fur385
Physik C Particles and Fields 33 (1987) 333–338.386
[32] STAR Collaboration, Pion femtoscopy in p+p collisions at sqrt(s)=200387
GeV, Arxiv preprint arXiv:1004.0925v2 [nucl-ex] (2010) 16.388
[33] A. Bialas, E. Bialas, Impact parameter analysis of multiplicity distri-389
bution in high-energy p p collisions, Acta Physica Polonica B 5 (1974)390
373.391
[34] E. V. Shuryak, QCD Vacuum, Hadrons and Superdense Matter, World392
Scientific Publishing Company, Singapore, 2nd revised edition, 2003.393
[35] N. Moggi, Soft Multiparticle Production in p− p Interactions at 1800394
and 630 GeV, Phd. thesis, University of Pavia, 1999. Available at395
www-cdf.fnal.gov/thesis/cdf5329_soft_multiparticle.ps.gz.396
[36] L. McLerran, R. Venugopalan, Computing quark and gluon distribution397
functions for very large nuclei, Physical Review D 49 (1994) 2233–2241.398
24
[37] J. Dias De Deus, C. Pajares, Percolation of color sources and critical399
temperature, Physics Letters B 642 (2006) 455–458.400
[38] H. Satz, Colour deconfinement in nuclear collisions, Reports on Progress401
in Physics 63 (2000) 1511–1574.402
[39] T. Alexopoulos, C. Allen, E. Anderson, V. Balamurali, S. Banerjee,403
P. Beery, P. Bhat, J. B. et al., Study of source size in pp− collisions at404
√s = 1.8 TeV using pion interferometry, Physical Review D 48 (1993)405
1931–1942.406
[40] C. Albajar, Bose-Einstein correlations in p interactions at√s = 0.2 to407
0.9 TeV, Physics Letters B 226 (1989) 410–416.408
[41] Z. Chajecki, Femtoscopy in hadron and lepton collisions: RHIC results409
and world systematics, Acta Physica Polonica B 40 (2009) 1119–1136.410
[42] M. A. Lisa, S. Pratt, Femtoscopically Probing the Freeze-411
out Configuration in Heavy Ion Collisions (ed.), in: R. Stock412
(Ed.), SpringerMaterials - The Landolt-Bornstein Database –413
http://www.springermaterials.com, Springer-Verlag, Berlin Heidel-414
berg, 2010, pp. 1–33.415
[43] A. Savitzky, M. J. E. Golay, Smoothing and Differentiation of Data by416
Simplified Least Squares Procedures., Analytical Chemistry 36 (1964)417
1627–1639.418
[44] P. Castorina, J. Cleymans, D. E. Miller, H. Satz, The speed of sound in419
hadronic matter, The European Physical Journal C 66 (2010) 207–213.420
25
[45] B. K. Srivastava, Percolation and Deconfinement, Arxiv preprint421
arXiv:1102.0754v1 [nucl-ex] (2011) 1–8.422
[46] M. Chojnacki, W. Florkowski, Temperature dependence of sound ve-423
locity and hydrodynamics of ultra-relativistic heavy-ion collisions, Acta424
Physica Polonica B 38 (2007) 3249–3262.425
[47] CMS Collaboration, Charged particle multiplicities in pp interactions426
at√s = 0.9, 2.36, and 7 TeV, Arxiv preprint arXiv:1011.5531v1 (2010).427
26