242010-high-polities-sebagai-kerangka-moral-pem ... - Neliti
Journal of Mechanical Engineering, vol. 10, Issue 2, 2014.
EXPERIMENTAL COOLING MODE VARIATION OF AN AIR-COOLED PEM FUEL CELL USING
SECOND-ORDER THERMAL ANALYSIS
Wan Ahmad Najmi b. Wan Mohamed*
Rahim Atan
Faculty of Mechanical Engineering,
Universiti Teknologi MARA
40450 Shah Alam, Selangor, Malaysia.
*email: [email protected]
ABSTRACT
Thermal analysis of air-cooled Polymer Electrolyte Membrane (PEM) fuel cells for closed cathode designs are largely
limited within first-order thermal analysis. Normally, closed cathode fuel cells apply the water cooling technique due
to large cooling loads. Technical feasibility study in applying air cooling as an alternative for closed cathode stack
designs is reported here using a down-scaled 3-cell stack assembly. A 242 cm2 active area, 3-cell closed cathode PEM
fuel cell stack, was developed with 40 integrated straight path air cooling channels in order to investigate the internal
thermal effects. The objective is to identify the bulk thermal effects of the stack under cooling for further design
considerations using the second-order thermal analysis approach. Tests were conducted with airflows in the range
between 200 and 400 Reynolds number and load variations from 10A to 30A. Different fan settings are applied to
analyze the response of the design to negative and positive pressure airflows. The temperature profiles are translated
into stack cooling profiles with discussions on its polarization, cooling response behaviour and cooling effectiveness.
Generally, the cooling effectiveness across all cooling modes was higher than 80% and the negative pressure fan
setting provides a more consistent cooling profile but with a slower cooling response.
Keywords: Fuel cells, air cooling, cooling effectiveness, thermal engineering.
Introduction
Air cooling is applied in both open cathode and closed cathode Polymer Electrolyte Membrane (PEM) fuel cell
designs. Open cathode PEM fuel cells concurrently utilizes the reactant air as a heat sink and cooling agent. It
depends heavily on environmental conditions where the humidity of the surrounding air directly affects the stack
performance [1]. Open cathode designs are currently limited to 1 kWe, and are mostly suitable for miniature PEM fuel
cells application such as micro-aerial and demo-scale vehicles, robots, small power systems, and communication
electronics [2]. On the other hand, closed cathode designs, which can now reach modular outputs beyond 100 kW,
appropriately require adequate active cooling assistance to maintain the cells at a suitable operating temperature. The
current practice in PEM fuel cells thermal management is the application of air-cooled system for low output range,
sub kW to 2 kW systems, and using water-cooled system for higher output ranges. However, Faghri and Guo [3]
stated that cells operating between 2 kW and 10 kW may still apply air cooling through judicious decision makings,
undoubtedly both in design and operation.
Technically, thermal engineering is the application of suitable cooling techniques to control the stack
temperature within its operating limit. Specifically, it serves to maintain a high uniformity of temperature profile in the
porous gas diffusion layer [4]. It is an operational requirement and closely related to the water management aspect;
however, individual studies are possible whenever the selected analytical domain is intentionally detached from the
electrochemical reactions. One such domain is the design of cooling systems. As a rule, the application of active
cooling systems is compulsory for fuel cells above the 100W power output.
Commercialization and interest of fuel cells has just aggresively started at the turn of the century, and apart
from full-scale car prototype developments, PEM fuel cell stacks with power outputs less than 3 kW are much in
demand. The popular applications include backup power systems and small-scale or demonstration vehicles, mainly
conducted by research institutions and academia. From this initial culture, there is a potential market for small-sized
PEMFC stacks with power output ratings of up to 3 kW. The main advantage air cooling systems holds over water-
cooled systems is that it is more compact, increasing the overall system size by usually less than 50%, whereas water-
cooled systems generally increases the system size by more than 200%. Therefore, for portable and limited space
applications, air-cooled fuel cells are very much desirable.
Journal of Mechanical Engineering, vol. 10, Issue 2, 2014. Thermal engineering of air-cooled PEM fuel cells
Physical investigation on the thermal effects of air cooling for stacks in the range of 1 kW to 3 kW power rating is rare
compared to publications on water-cooled systems. The majority of predictive modeling concerning stack power
outputs, temperature profiles and cooling effects are obtained largely from analytical approach, built from the
foundations of theoretical electrochemistry, species transport and heat transfer. However, it is acknowledged that
actual fuel cell behavior is also specifically influenced by component, manufacturing and assembly methods such as
clamping pressure distribution and sealing characteristics, as well as flow disturbances due to MEA deflection and
imperfections in gas channel construction. In other words, each developed PEM fuel cell would actually exhibit its
own unique operational signature.
The academic assumption where a fuel cell operates similarly every single time is certainly considered to be too
idealistic. The uniqueness of a fuel cell behaviour mainly comes from the factors affecting reaction kinetics on the
catalyst layers which are too sensitive to microscopic changes causing heterogeneous surface reaction occurrence [5].
Active sites require faster cooling rates to maintain near uniform cell temperatures. Wen and Huang [6] acknowledged
the importance of identifying the hot spots as a vital step towards effective cooling and uniform cell temperatures.
The sensivity of PEM fuel cell stacks to temperature is generally linked to the moisture levels required in the
membrane for positive charge transport across the electrodes. Heat buildup within the cells would quickly dry the
membrane and leads to greater electrical and thermal resistances [7]. However, heat is also needed for improved
reaction kinetics at the catalyst layers. Therefore, thermal management of PEM fuel cells has to balance both
requirements.
Part of the experimental and analytical approach in this paper is adopted from the works of various researchers.
Zhang et al. [8] introduced the lumped thermal mass model applying the transient stack temperature profiles based on
solid-state thermal analysis. Temperature profile plots at different load currents and dynamic temperature to electrical
power variation were identified as useful tools in modeling and experimentally validating steady-state and dynamic
heat transfers in a stack [9]. The methodology for internal stack temperature measurements was shown in [10] with
focus on cooling response analysis. Effect on stack-fan configuration to the performance of a fuel cell was conducted
by Sasmito et al. [11], but all of these techniques are still constrained within the first-order thermal analysis.
First-order thermal analysis directly relates the temperature measurements to the bulk characteristics of the
system. However, second-order analysis allows an improved understanding on the internal thermal behaviour of the
stack, ie. the rate of heat gain and dissipation in response to electrical power and cooling mode variations. From the
calculated cooling rate, qualitiative analysis on the effectiveness of the cooling operations can be performaed [12].
Hence, a detail cooling analysis of an air-cooled PEMFC under dynamic operational settings is the main subject
presented here. The operational relationship between a certain design of mini channel geometry to differences in fan
operation, in this case the application of positive and negative flow pressures, was reported together with a detail
methodolgy for the evaluation of cooling effectiveness from the perspective of secon-order thermal analysis. In
addition, thermal engineering studies on air-cooled closed cathode fuel cells are very rare compared to studies on open
cathode stacks [13,14].
Thermal analysis
Thermal analysis from the perspective of fluid-solid interaction, or convection, is a difficult science in terms of
accuracy. Disturbances in fluid flow, transient surface temperatures, or dynamic cooling loads usually pose a major
problem in properly determining the representative heat transfer coefficient. Solid state thermal analysis via
conduction is more direct and poses little problem in reliability even at dynamic load conditions [8].
Transient thermal behavior is more complex due to the ever-changing boundary conditions of the system such
as the surface temperature. In actual fuel cell operation, dynamic local reactions are common due to factors such as
localized mass concentration, membrane humidity changes and perturbations in reactant flow. In a solid body with
heat generation and internal cooling, temperature changes will continue to occur exponentially until an asymptotic
thermal saturation level, or a steady-state temperature distribution is reached [15]. This saturation level is a result of
conductive and convective rate equilibrium which is reached within a specific time period and dependent on the
specific temperature gradient within the solid, the convective cooling coefficient development and cooling surface
geometries. The common method in transient conduction analysis of a system under cooling is the lumped capacitance
method. However, its accuracy depends on the magnitude of temperature gradients within the solid body.
Journal of Mechanical Engineering, vol. 10, Issue 2, 2014.
The usual analytical methodology regarding thermal analysis of air-cooled PEM fuel cells is as reported in
[16]; stack temperatures is directly interpreted in various aspects to determine the impact of the cooling mode.
Conversion of the physical measurements into a second order internal properties such as cooling rates are rarely found.
In this work, the determination of various convective cooling properties is not a viable approach as the system
involves a fuel cell stack with a set of cooling channels. Variations in cooling air parameters such as inlet velocity,
flow rate, and even temperature is expected in the individual channels due to the fan-stack configuration. As dynamic
reaction sites are also expected across the cells, application of the lumped capacitance method in this study is also too
complex to achieve. Therefore, empirical solid state analysis was taken as the analytical methodology for cooling
performance evaluation.
Despite operating based on the principles of electrochemical rather than thermochemical reactions, a PEM
fuel cell generates heat as a by-product of the reaction irreversibilities, exothermic formation of water vapor and the
ohmic resistances on charge flow across the electrodes. For simplicity, the heat generated within fuel cells are assumed
to be the heat generated mainly at the reaction sites of the cathodes due to water vapour formation. The amount of heat
generated can be estimated by using the system relations [17] based on the energy balance of the system and
depending on the state of water formed.
Energy of the fuel = electrical power obtained + heat generated
gencellcellcellfuel QnVInHFn
I ...
. (1)
Normally, the water exists as vapor, and so the heating value of the fuel is equal to the Lower Heating value,
and consequently
Qgen = (1.254 – Vcell) I.ncell (Watts) (2)
The required cooling load of individual cooling channels can be determined through
n
PQ
cellthch
,
n
IVV cellcellrev )( (Watts)
(3)
rev
cell
cellV
V
(4)
The reversible cell voltage, Vrev, is the maximum thermodynamically calculated potential of a single fuel cell
regardless of size and design. It is evaluated based on the heating value of the fuel (hydrogen) and relative to the water
phase formed during oxidation. Using the Lower Heating Value (LHV), a value of 1.254V is obtained. The theoretical
cell voltage, Vcell, at any current loadings can be estimated by applying the conversion efficiency relation. In
experiments, the measured cell voltage and current are directly applied to obtain the cell efficiency, ηcell, and thermal
load. The total stack thermal load is calculated by substituting the cell voltage with the total stack voltage, and
multiplying the reversible cell voltage with the appropriate number of cells.
In available literature concerning experimental approach, the common analysis relates the external stack
temperatures to the phenomena under study. While this is a satisfactory approach to meet the required objectives, the
evaluation of internal heat transfer rates would provide deeper insight on the thermal behavior of the cells. Transient
temperature profiles are accompanied by its respective transient cooling rate profiles that clearly indicates the energy
balance within the stack.
In experimental design, the internal stack temperature is continuously monitored in time steps. The temperature
profiles can be converted into transient heat transfer plots based on
(Watts) (5)

Journal of Mechanical Engineering, vol. 10, Issue 2, 2014. where :
: change of stack heat content for the duration of the time step (W)
mcg : total mass of carbon graphite plates (kg)
Ccg : specific heat of carbon graphite (J/kg.K)
Ti : temperature reading at initial time step (K)
Ti+1 : temperature reading at end of single time step (K)
∆t : time step (sec)
The transient heat transfer profile is an indicator for the rate of thermal energy change within the measured
periodicals; a positive value points to stack heating effect while negative values indicates a cooling effect. From the
analysis of the experiments, the transient plots were shown to exhibit an exponential behavior with negative gradient
and so requiring an arithmetically averaged heat transfer values for steady-state performance evaluation purposes such
as the determination of the cooling effectiveness.
(Watts) (6)
where :
: averaged stack heat change rate (W)
Ti : initial temperature reading (K)
Ti+n : temperature reading at end of operation (K)
∑t : total operation time (sec)
Evaluation of cooling effectiveness is central in any thermal cooling systems. Here, the cooling effectiveness is
a direct comparison between the averaged cooling rates of the stack to the thermal power generated during operation.
(7)
where the average cooling rate, is obtained by subtracting the generated thermal power (Pth) at each loading to
the arithmetically evaluated averaged stack energy change ( ).
(8)
The cooling effectiveness is relative to the simultaneous conditions of generated thermal power of the stack at a
particular load and the rate of stack heating or energy gain; higher heating effect does not directly translate to lower
cooling effectiveness.
PEM fuel cell design and experimental
Stack design
A 3-cell PEM assembly was developed with a nominal plate size of 330 cm2 and half plate dimensions as shown in
Figure 2. The cooling channels, labelled as Ms40, are of straight path configuration with an aspect ratio of 1.7 (3.48
mm width x 2 mm height). A single bipolar plate consists of 40 integrated cooling channels that runs through the plate

Journal of Mechanical Engineering, vol. 10, Issue 2, 2014. with a total running length of 149.5 mm per channel. There are two bipolar plates and two monopolar plates in the 3-
cell assembly. It should be noted that the monopolar plates does not integrate any cooling channels.
The reactant flow field designs for both anode and cathode of the bipolar plate are multipass serpentine channel
configuration with different number of channels, as specified in Table 1. In a fuel cell, the Membrane Electrode
Assembly (MEA) is the heart of the cell where the electrochemical reaction occurs. The 5 layered MEA has an active
area of 242 cm2 per cell, making it a large sized fuel cell by definition.
Figure 2. Half section geometry of the bipolar plate showing the integrated cooling channels within the plate
Table 1. General specifications of the flow field design
Specification Anode Cathode
Single channel geometry Width : 1 mm
Depth: 0.5 mm
Width : 1 to 2 mm
Depth: 0.5 mm
Flow configuration 7-pass serpentine 3-pass serpentine
Number of nominal channels 24 15
Total area coverage 240 cm2
240 cm2
Experimental
The experimental objective was to investigate the thermal characteristics of the cooling channel design based on solid-
state thermal analysis. To obtain the cooling effectiveness of each design, the heating and cooling rates of the stack are
required which are directly dependant on the stack temperature profile. The heating rate can also be linked to its
overall polarization behavior and calculated using equation 2; therefore, the stack voltage has to be monitored across
all current loadings where the overall power curve of the stack is statistically determined. In turn, the cooling rates
were obtained by the changes in the enthalpy of the stack; hence, an averaged stack temperature needs to be presented
from a set of temperature readings across the stack.
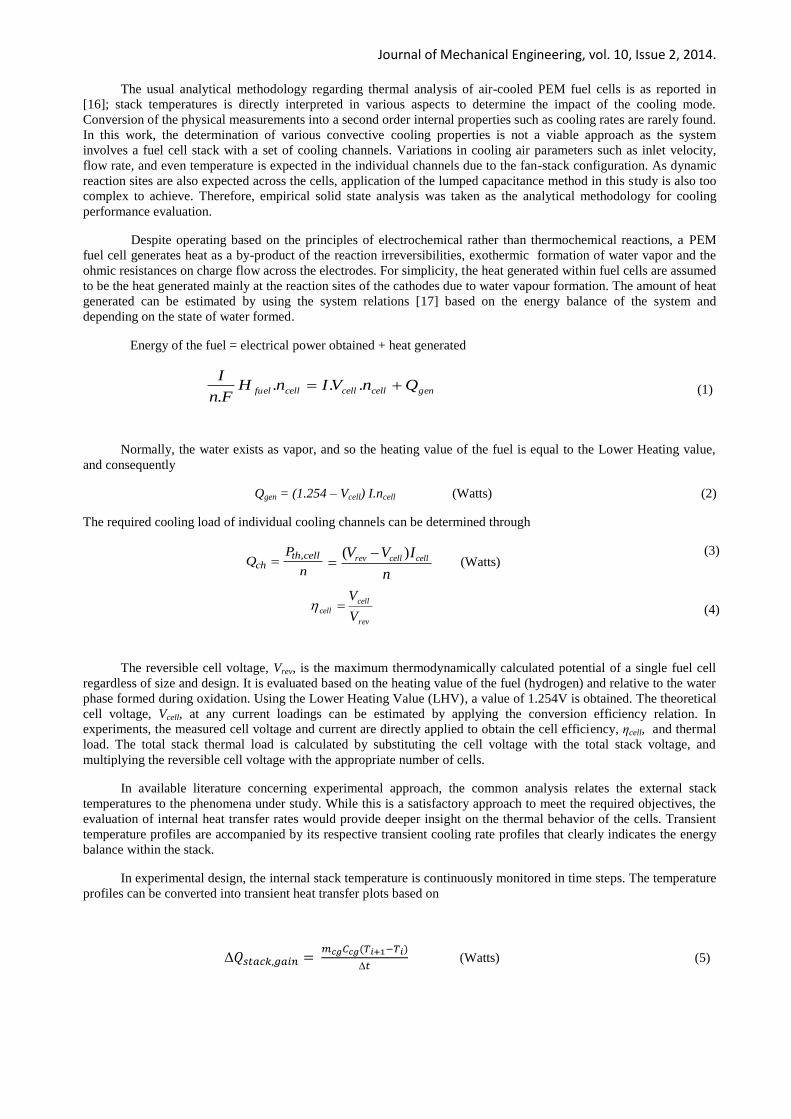
Thermocouples were positioned within the cooling channels, approximately 25 mm from the open ends, to
obtain a direct surface temperature response to the cooling activity. The positioning covered both cooling fluid ends
within three designated stack zones relative to the hydrogen inlet and outlet ports – top zone (near the hydrogen inlet),
middle zone and bottom zone (near the hydrogen exit) - as illustrated in Figure 4.
Journal of Mechanical Engineering, vol. 10, Issue 2, 2014.
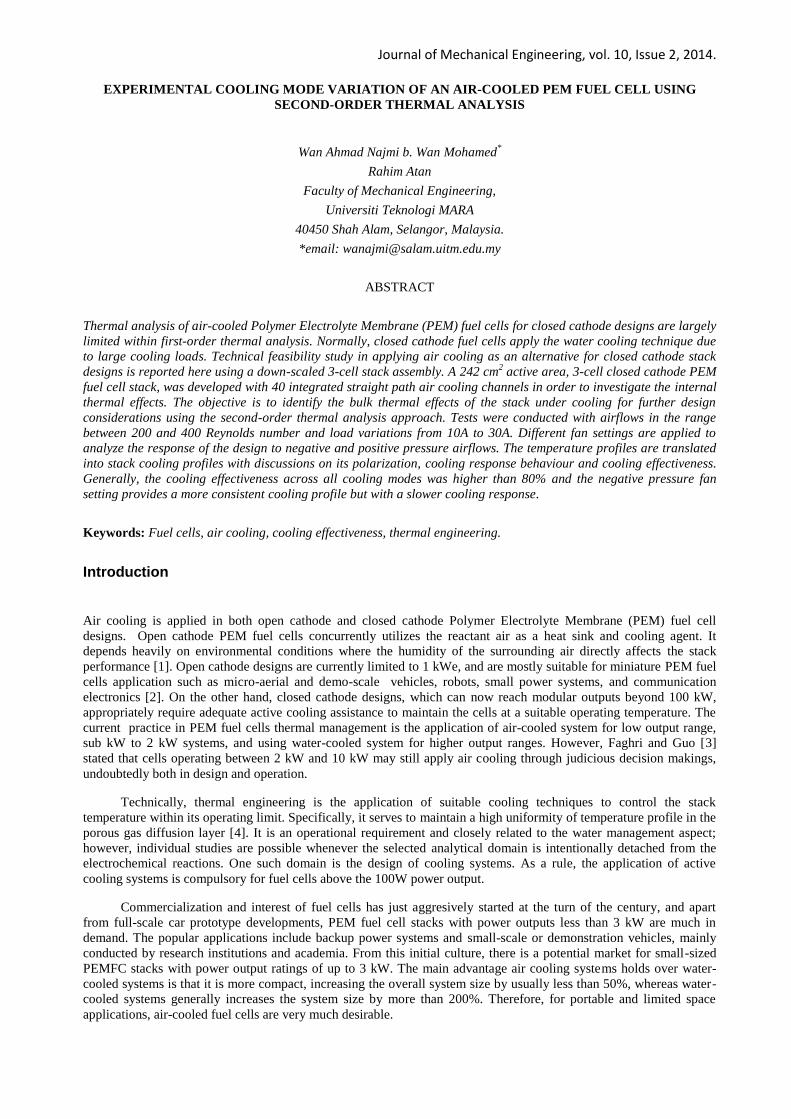
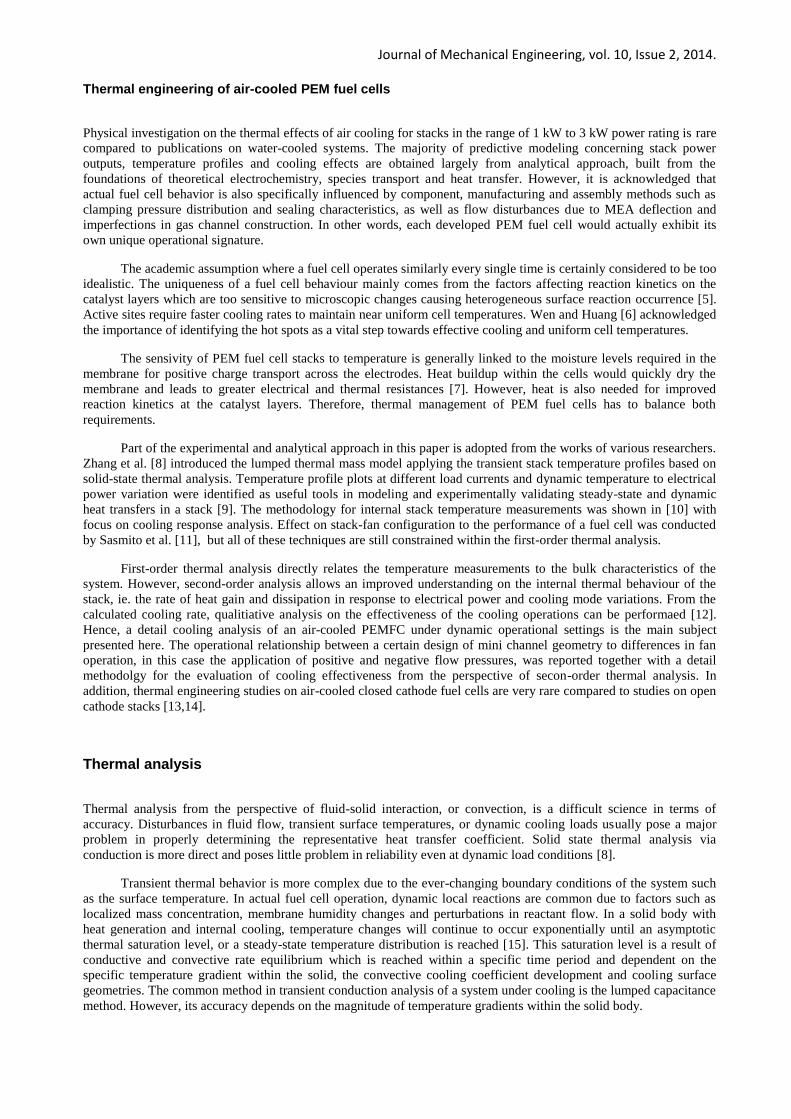
Figure 3. Stack assembly (left) and side view (right) displaying the internal components and the integrated cooling
channels within the two bipolar plates
Figure 4. Schematic showing the positioning of the thermocouples at one end of the stack; thermocouple depth at 25
mm from open ends
In order to limit the effects of reactant-assisted cooling, the experiments exercised external parameter control
by applying constant stoichiometric ratios (adjustments to mass flow) and using non-humidified reactants. A novel
aspect of this work is on conducting the tests under different fan settings. Typically, the cooling fans are set at
negative pressure (or suction) and positioned horizontally to induce air flow from the bottom to the top of the stack.
Cooling effects at positive pressure flows was not found in literature. Here, the fans are positioned vertically (as in
Figure 5) and two fan settings were applied based on varying the flow momentum sources (positive and negative
pressures). Four fans, with a power rating of 6W each (refer Table 2 for specifications), are mounted on a plate
covering the entire cooling channel array and forming a single cooling fan system.
Three current loadings of 10A, 20A and 30A were applied for each fan setting. It is essential in having at least
three data points (load variation) at each fan setting for the predictive mathematical application.This provides a
variation in stack performance database (I-V curves) that was further processed by statistical analysis to obtain a
generalized polarization behavior with higher accuracy.
H2 inlet
Air inlet H2 exit
Air exit
Thermocouple insertion points:
1. Two wires at the middle of the plate (both bipolar plates)
2. Two wires at approximately 50 mm from opposite plate edges (alternate plates)
Mono polar plate 2
Bipolar plate 2
Mono polar plate 1
Bipolar plate 1

Journal of Mechanical Engineering, vol. 10, Issue 2, 2014.
Figure 5. Actual experimental setup inclusive of fuel cell stack, test station, reactant supply lines, and data acquisition
facilities
The test sets were labeled based on both the load and fan setting. The first letter designates the cooling fan
setting and the immediate number identifies the current load setting, as specified in Table 3. Three sets of
measurement instruments installed. The first were the cables connecting both electrodes with the electrical loader that
allows load control and measurement of stack voltage. The second set was thermocouple wires positioned within the
cooling channels. The third set was a multi meter for manual cell voltage monitoring.
Table 2. Cooling fan specifications
Parameter Value
Model type EC-6025HH12C
Input power (max speed) 4.6W
Voltage DC 12V
Overall size (casing) 120 mm x 120 mm
Fan speed 6000
Air flow at max fan speed 31.81 CFM

Journal of Mechanical Engineering, vol. 10, Issue 2, 2014.
Table 3. Designation of test labels based on load and fan setting
Load
(Amp)
Cooling fan setting
Blower (B) Suction (C)
10 B10A C10A
20 B20A C20A
30 B30A C30A
At each load, the test station automatically updates the voltage values over a standard 5 second interval.
Temperature monitoring were performed by the temperature data logger, also manually set at 5 second intervals.
Besides the total stack voltage, individual cell voltages were measured manually using the multi meter. Each
individual tests were performed at 10 minutes of active load and cooling as the stack thermal equilibrium were
normally reached within that period; less time at lower loads. The internal properties of the fuel cell material is
provided in Table 4 and were applied in the analytical methodology.The specification of the experimental parameters
is listed in Tables 5 to 8.
Table 4. PEMFC stack parameters
Properties / parameters Values
1. Material Carbon graphite
2. Specific heat, C
710 J/kg.K
3. Density 2240 kg/m3
4. Top/bottom surface areas (total) 57.12 cm2
5.
6.
Side surface areas (total)
Thermal conductivity
1018.5 cm2
20 W/m.K
Table 5. Experimental setup parameters
Properties / parameters Values
1. Load current 10A, 20A and 30A
2. Test station model GasHub 1.6 kW
3. Temperature data logger model Gavitron
4. Number of temperature probes 8 K-type thermocouple wires
Table 6. Cooling air supply properties
Properties / parameters Values
1. Inlet temperature (ambient) 26oC – 29
oC
2. Nominal velocity at max fan power
- Blower fan setting
- Suction fan setting
2.2 m/s
1.9 m/s

Journal of Mechanical Engineering, vol. 10, Issue 2, 2014.
Table 7. Hydrogen supply properties
Properties / parameters Values
1. Delivery pressure from main line 0.8 bar gage
2. Inlet pressure 0.6 bar – 0.7 bar gage
3. Backpressure difference 0.2 bar – 0.4 bar gage
4. Inlet temperature 32oC – 35
oC
5. Supply flow rate range (stoichiometry)
- 10A load
- 20A load
- 30A load
0.9 l/min (12)
1.3 l/min (8.7)
1.5 l/min (6.7)
6. Supply source Hydrogen supply tank
7. Purity 99.999%
Table 8. Reactant air supply properties
Oxygen (Air)
Properties / parameters Values
1. Delivery pressure from mainline 1 bar gage
2. Inlet pressure 0.7 bar – 0.8 bar gage
3. Backpressure difference 0.2 bar – 0.4 bar gage
4. Inlet temperature 35oC – 38
oC
5. Supply flow rate 0.24 liters/min
6. Air stoichiometry
-10A load
-20A load
-30A load
26.4
13.2
8.8
7. Supply source Compressed air tank
8. Relative humidity ≈ 50%
Results and discussion
The experimental results and analysis are presented here in the order of stack polarization, stack temperatures,
transient and steady-state cooling rates and cooling effectiveness.
Stack polarization
Figure 6. Example of averaged stack voltage profiles (at 10A loading) showing the existing variations during
experimental
1.50
1.75
2.00
2.25
2.50
2.75
3.00
3.25
0 2 4 6 8 10
Stac
k vo
ltag
e (
V)
Time (min)
negative pressure fan setting
positive pressure fan setting
open
voltage

Journal of Mechanical Engineering, vol. 10, Issue 2, 2014.
Throughout the different loadings, there were slight variations in stack voltages of both fan settings (Figure 6)
due to differences in reactant flow and subsequent cell activity. Figure 7 is an example of the averaged stack voltage
profile based on the individual cell voltage readings, and these averaged values were applied extensively for the
determination of subsequent electrical and thermal analysis. To evaluate its statistical reliability, standard deviation
analysis of these averaged voltage values compared to the whole range of experimental values were performed. The
open voltage showed the lowest standard deviation for all stacks at less than 1%, conforming the consistency of design
quality and operating procedure. The maximum deviation was found under operation at 20A and 30A loads, but still
falls within a very acceptable limit of less than 6%.
Figure 7. Averaged voltage variation for both fan settings
Figure 8. Normalized I-V curves of stack Ms40 from no load to 40A electrical load
Figure 9. Electrical and thermal power generation (50% cell efficiency at 20A load)
1.0
1.5
2.0
2.5
3.0
3.5
0 10 20 30
Stac
k vo
ltag
e (
V)
Load Current (Amp)
negative pressure (suction) fan setting
positive pressure (blow) fan setting
0
10
20
30
40
50
60
70
0.0
0.5
1.0
1.5
2.0
2.5
3.0
3.5
4.0
4.5
5.0
0 10 20 30 40
Stack po
we
r (W)
Stac
k vo
ltag
e (
V)
Load Current (Amp)
stack power
stack voltage
0
20
40
60
80
100
0 10 20 30 40
Po
we
r (W
)
Load Current (Amp)
thermal power
electrical power

Journal of Mechanical Engineering, vol. 10, Issue 2, 2014.
The normalized I-V curves using averaged voltage values and the ensuing electrical-thermal power outputs are
presented in Figures 8 and 9. As an important note, all stacks were operated at reactant temperatures near to ambient
as well as low inlet pressures. In addition, the performance was based on dry reactant condition where no
humidification of the reactants was performed. These operating conditions were selected to evaluate the thermal
effects within the stack without significant influence from the inherent reactant properties. However, the selected
operating conditions led to lower power densities than usually obtained for industrial stacks.
The polarization analysis allows the evaluation of thermal energy as the load is varied. It is closely related to
the conversion efficiency which is determined from the actual stack voltage changes. Equal electrical and thermal
power outputs occurs at approximately 20A load corresponding to a conversion efficiency of 50%. From that point
onwards, the thermal power increases exponentially compared to the reduced rate of electrical power rise as the
efficiency falls below 50%. The maximum thermal-to-electrical power ratio at 40A was determined at 1.3 to 1.
Fuel cell voltage is relatively dependant on the energy density of each reactant flowing through the anode and
cathode, as well as the conductivity of the components bridging the two reactants. At its maximum voltage (open
voltage condition), the electrons are not flowing resulting in optimum energy density difference between the opposite
polars. When the circuit between anode and cathode is connected and electrical load is demanded, electrochemical
activity at both anode and cathode converts the reactants into its respective compounds, and so the mass and energy
density of the reactants were reduced resulting in the energy equilibrium being compromised.
An efficient fuel cell (high voltage at high load current) allows a very fast removal and replenishment of the
reactants. However, the existence of generated heat and water, and combined with geometrical aspects of the flow
channels such as depth and length that influences the mechanics of flow, would have diverse effects on the rate of
reactant replenishment into the fuel cell. The most common phenomena during operation to explain voltage drops
would be the flooding effect, which is caused by formation of water in liquid phase within the channels and blocking
the passage of reactants. Operation at low reactant temperature, such as defined for the works here, evidently
promoted a high level of flooding within the channels that led to voltage deteriorations.
Stack temperature
In active cooling experiments, the zonal stack temperatures for each experimental set were individually plotted, as
presented in Figure 10 for blower fan setting at 20A load, allowing a closer look into the temperature distribution
along a cooling channel at a specified zone as well as an indicator on areas of electrochemical activity. However, these
zonal temperatures are individual readings and do not represent the stack temperature as a lumped entity. Therefore,
the temperature readings were averaged to represent a single stack temperature as a basis for thermal calculations.
The middle zone profile indicates that the center area temperature is always higher than the exit area
temperature. The inlet area temperatures, where cooling effects are optimum due to first contact with the incoming
coolant, are significantly lower than the exit temperature. The trend found here highly suggests that the center area is
actively generating heat. Further details on active reaction zone characterization are beyond the scope of this
publication and will be presented elsewhere.
The comparative profiles of the averaged stack temperature (Figure 11) indicates a greater cooling consistency
of the negative pressure (suction) fan setting compared to positive pressure (blow) setting due to a better degree of
flow control into the channels. Higher inlet resistance are expected from the more energetic and mixed fluid stream of
the blower fan setting resulting in lower flow rates within the cooling channels. At 30A load where the stack thermal
energy is generated higher and across a wider MEA area, the blower fan setting has the advantage of stack edge
cooling that contributed to enhanced cooling rates.
In terms of cooling response, the suction fan setting has the capability to achieve thermal saturation conditions
at a faster response time compared to blower fan setting, especially at low thermal loads. However, a significant
increase in generated thermal energy (at 30A) shows that the cooling response deteriorates for the suction fan setting
and is approximately similar with the blower fan setting. In general, the controlled induced streamlines of the suction
fan setting provides a more stable cooling behavior within the channels.

Journal of Mechanical Engineering, vol. 10, Issue 2, 2014. Cooling profile and effectiveness
The averaged stack temperature profile is the representative bulk temperature of the stack as it is simultaneously
heated and cooled. At varying loads, difference in generated thermal power was observed. The relation between the
generated stack heat, assumed constant for a specific electrical load, and the stack heat gain profile provided the
required dynamic cooling rates of each load and fan setting. Due to the constant thermal power assumption (Pth), the
projected transient cooling trend ( ) resembles the trend of the exponential stack energy gain ( ),
but with a visible difference in magnitude and flow vector (minus sign indicating stack cooling). Mathematically,
(9)
In Figure 12, the relationship is presented graphically based on the load 30A of the positive pressure fan
setting. With an assumed constant generate heat, the stack thermal gain was initially higher as the energy is
accumulated and reduces exponentially as the cooling effect kicks in. By substracting the stack heat gain from the
generated heat, a cooling profile was obtained. The cooling trendline is similar to the stack heat gain trend due to the
assumed linear heat generation.
Figure 10. Stack temperature profiling at different stack zones (a - c) while (d) is the averaged stack temperature (data
from 20A load and full power blower fan setting experimental).
20
25
30
35
0 120 240 360 480 600 720
Surf
ace
Te
mp
era
ture
(oC
)
Time (s)
(a) B 20A: Top Zone
inlet center exit
20
25
30
35
40
0 120 240 360 480 600 720
Su
rfac
e T
em
pe
ratu
re (o
C)
Time (s)
(b) B 20A: Middle Zone
inlet center exit
20
25
30
35
40
0 120 240 360 480 600 720
Su
rfac
e T
em
pe
ratu
re (
oC
)
Time (s)
(c) B 20A: Bottom Zone
center
exit
26
27
28
29
30
31
32
33
34
0 120 240 360 480 600 720
Tem
pe
ratu
re (o
C)
Time (s)
(d) averaged stack temperature

Journal of Mechanical Engineering, vol. 10, Issue 2, 2014.
Figure 11. Averaged stack temperature profile across all electrical loads
(B : positive pressure fan setting; C : negative pressure)
An effective cooling system is capable of immediately responding to the cooling load that would translate into
lower temperature jumps and thus reducing the effect of themal stresses within the fuel cell. The exponential cooling
rate trend should also have a large negative gradient that allows the conduction and convective heat transfer
mechanisms to reach an asymptotic level at a faster response time. Figure 13 compares the cooling profiles of all the
experimentations, and it shows a larger gradient is generally achieved by the suction fan setting.
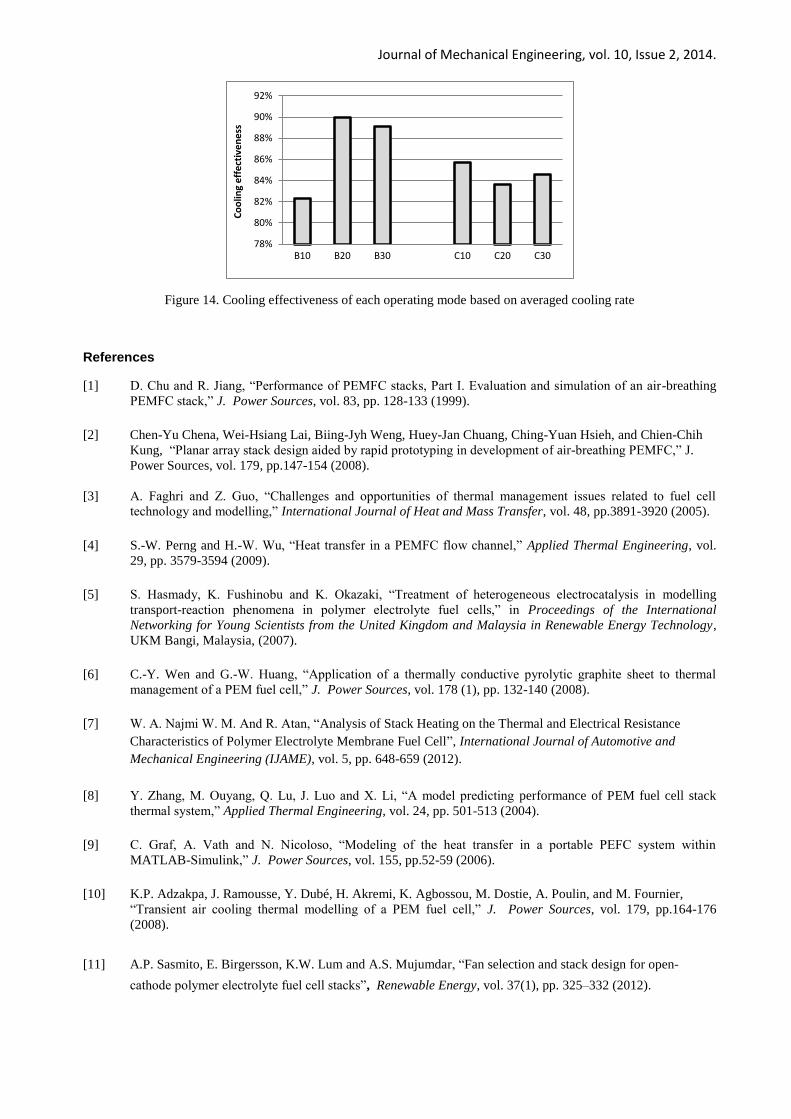
Generally, the cooling effectiveness of all the modes are at acceptable levels. An excellent cooling system
should reach at least 90% cooling effectiveness. Figure 13 indicates that this requirement is partially achieved. In
terms of cooling consistency, a difference of 6% between the minimum and maximum effectiveness was obtained. The
effectiveness of negative pressure fan setting (suction) is slightly lower than its positive pressure counterpart, but, it is
able to provide a higher consistency (2% difference across all loads). The slightly higher cooling performance of the
blower fan setting is mainly due to the assistance of frontal surface cooling which is negligble for its counterpart. The
erratic, but satisfactory, cooling performance is largely due to its smaller channel aspect ratio which gives a higher
resistance to incoming fluid flow. However, smaller cross-sections provide an ideal heat transfer interaction between
the hot surface and the cooling fluid, partially offsetting the effect of inlet resistance.
Conclusion
Experimental investigation on the effect of cooling modes to the thermal behaviour of a PEM fuel cell stack was
performed. The methodology for second-order thermal analysis was outlined and provided more information on the
cooling effectiveness of the thermal management operation compared to conventional first-order stack temperature
analysis. Though the variations in cooling effectiveness values was not literally translated into a fixed temperature
difference between the cooling modes, the general trend where high cooling effectiveness points to lower maximum
stack temperatures are evident. Thermal saturation condition between the conduction and convection mechanisms
within the stack governs the cooling response and effectiveness of each cooling mode. It was also found that the stack
accumulates heat load for periods of no less than four minutes before the cooling effects and its distribution stabilizes
the stack temperature. The accumulated heat load would cause thermal stresses and expansion of components, leading
to concentrated leaks as well as permanent deformation such as cracks.
20
25
30
35
40
0 120 240 360 480
Ave
rage
Sta
ck T
em
pe
ratu
re (
oC
)
Load period (s)
C:10A
B:10A
C:20A
B:20A
C:30A B:30A
LOAD INITIATION

Journal of Mechanical Engineering, vol. 10, Issue 2, 2014.
Figure 12. Graphical presentation of the transient cooling rate of the stack based on a constant heat generation (from
blower fan setting at 30A)
Figure 13. Cooling profile for both suction and blower fan settings across all the loads
-100
-50
0
50
100
150
200
0 100 200 300 400 500 600
He
at t
ran
sfe
r ra
te (
W)
Period (s)
-120
-80
-40
0
40
80
120
0 100 200 300 400 500 600
He
at t
ran
sfe
r ra
te (
W)
Period (s)
Blower fan setting
-150
-100
-50
0
50
100
150
200
0 100 200 300 400 500 600
He
at t
ran
sfe
r ra
te (
W)
Period (s)
Suction fan setting
Effective cooling profile
Generated thermal power
Stack heating profile
10A
20A
30A
10A
20A
30A
Journal of Mechanical Engineering, vol. 10, Issue 2, 2014.
Figure 14. Cooling effectiveness of each operating mode based on averaged cooling rate
References
[1] D. Chu and R. Jiang, “Performance of PEMFC stacks, Part I. Evaluation and simulation of an air-breathing
PEMFC stack,” J. Power Sources, vol. 83, pp. 128-133 (1999).
[2] Chen-Yu Chena, Wei-Hsiang Lai, Biing-Jyh Weng, Huey-Jan Chuang, Ching-Yuan Hsieh, and Chien-Chih
Kung, “Planar array stack design aided by rapid prototyping in development of air-breathing PEMFC,” J.
Power Sources, vol. 179, pp.147-154 (2008).
[3] A. Faghri and Z. Guo, “Challenges and opportunities of thermal management issues related to fuel cell
technology and modelling,” International Journal of Heat and Mass Transfer, vol. 48, pp.3891-3920 (2005).
[4] S.-W. Perng and H.-W. Wu, “Heat transfer in a PEMFC flow channel,” Applied Thermal Engineering, vol.
29, pp. 3579-3594 (2009).
[5] S. Hasmady, K. Fushinobu and K. Okazaki, “Treatment of heterogeneous electrocatalysis in modelling
transport-reaction phenomena in polymer electrolyte fuel cells,” in Proceedings of the International
Networking for Young Scientists from the United Kingdom and Malaysia in Renewable Energy Technology,
UKM Bangi, Malaysia, (2007).
[6] C.-Y. Wen and G.-W. Huang, “Application of a thermally conductive pyrolytic graphite sheet to thermal
management of a PEM fuel cell,” J. Power Sources, vol. 178 (1), pp. 132-140 (2008).
[7] W. A. Najmi W. M. And R. Atan, “Analysis of Stack Heating on the Thermal and Electrical Resistance
Characteristics of Polymer Electrolyte Membrane Fuel Cell”, International Journal of Automotive and
Mechanical Engineering (IJAME), vol. 5, pp. 648-659 (2012).
[8] Y. Zhang, M. Ouyang, Q. Lu, J. Luo and X. Li, “A model predicting performance of PEM fuel cell stack
thermal system,” Applied Thermal Engineering, vol. 24, pp. 501-513 (2004).
[9] C. Graf, A. Vath and N. Nicoloso, “Modeling of the heat transfer in a portable PEFC system within
MATLAB-Simulink,” J. Power Sources, vol. 155, pp.52-59 (2006).
[10] K.P. Adzakpa, J. Ramousse, Y. Dubé, H. Akremi, K. Agbossou, M. Dostie, A. Poulin, and M. Fournier,
“Transient air cooling thermal modelling of a PEM fuel cell,” J. Power Sources, vol. 179, pp.164-176
(2008).
[11] A.P. Sasmito, E. Birgersson, K.W. Lum and A.S. Mujumdar, “Fan selection and stack design for open-
cathode polymer electrolyte fuel cell stacks”, Renewable Energy, vol. 37(1), pp. 325–332 (2012).
78%
80%
82%
84%
86%
88%
90%
92%
B10 B20 B30 C10 C20 C30
Co
olin
g e
ffe
ctiv
en
ess

Journal of Mechanical Engineering, vol. 10, Issue 2, 2014. [12] W. A. Najmi W. M. And R. Atan, “Stack Cooling Profile of an Air-Cooled 3-Cell Polymer Electrolyte
Membrane Fuel Cell Stack”, Applied Mechanics and Materials, vol. 393, pp 774-780 (2013).
[13] A.P. Sasmito, E. Birgersson, and A.S. Mujumdar, “A Novel Flow Reversal Concept for Improved Thermal
Management in Polymer Electrolyte Fuel Cell Stacks”, International Journal of Thermal Sciences, vol. 54, pp
242-252 (2012).
[14] A.P. Sasmito, T. Shamim, E. Birgersson, A.S. Mujumdar, “Numerical Investigation of Water and
Temperature Distributions for Open-Cathode Polymer Electrolyte Fuel Cell Stack with Edge Cooling”,
Journal of Fuel Cell Science and Technology, vol. 10(6), doi:10.1115/1.4025054 (2013).
[15] F. P. Incropera and D. P. DeWitt, Fundamentals of Heat and Mass Transfer, Fifth Edition. John Wiley &
Sons, 2002, pp. 240-243.
[16] M. Matian, A. Marquis and N. Brandon, “Model based design and test of cooling plates for an air-cooled
PEM fuel cell stack,” International Journal of Hydrogen Energy, vol. 36, pp. 6051-6066 (2011).
[17] C.S. Spiegel, Designing and building fuel cells, McGraw Hill USA, 2007.
Copyright © 2022 FDOKUMEN