EXPERIMENTAL AND COMPUTATIONAL ... - UO Blogs
248
EXPERIMENTAL AND COMPUTATIONAL VIBRATIONAL SUM FREQUENCY SPECTROSCOPY STUDIES OF ATMOSPHERIC ORGANICS AND THEIR SURFACE-ACTIVE HYDRATION AND OLIGOMER PRODUCTS AT THE AIR-WATER INTERFACE by BRITTANY PIERCE GORDON A DISSERTATION Presented to the Department of Chemistry and Biochemistry and the Graduate School of the University of Oregon in partial fulfillment of the requirements for the degree of Doctor of Philosophy December 2019
-
Upload
khangminh22 -
Category
Documents
-
view
2 -
download
0
Transcript of EXPERIMENTAL AND COMPUTATIONAL ... - UO Blogs
EXPERIMENTAL AND COMPUTATIONAL VIBRATIONAL SUM
FREQUENCY SPECTROSCOPY STUDIES OF ATMOSPHERIC ORGANICS
AND THEIR SURFACE-ACTIVE HYDRATION AND OLIGOMER
PRODUCTS AT THE AIR-WATER INTERFACE
by
BRITTANY PIERCE GORDON
A DISSERTATION
Presented to the Department of Chemistry and Biochemistry
and the Graduate School of the University of Oregon in partial fulfillment of the requirements
for the degree of Doctor of Philosophy
December 2019
ii
DISSERTATION APPROVAL PAGE Student: Brittany Pierce Gordon
Title: Experimental and Computational Vibrational Sum Frequency Spectroscopy Studies of Atmospheric Organics and Their Surface-Active Hydration and Oligomer Products at the Air-Water Interface
This dissertation has been accepted and approved in partial fulfillment of the requirements for the Doctor of Philosophy degree in the Department of Chemistry and Biochemistry by: Marina G. Guenza Chairperson Geraldine L. Richmond Advisor George V. Nazin Core Member Emilie E.E. Hooft Institutional Representative and
Kate Mondloch Interim Vice Provost and Dean of the Graduate School
Original approval signatures are on file with the University of Oregon Graduate School. Degree awarded December 2019

iii
© 2019 Brittany Pierce Gordon
iv
DISSERTATION ABSTRACT Brittany Pierce Gordon Doctor of Philosophy Department of Chemistry and Biochemistry December 2019 Title: Experimental and Computational Vibrational Sum Frequency Spectroscopy Studies
of Atmospheric Organics and Their Surface-Active Hydration and Oligomer Products at the Air-Water Interface
Organics at aerosol interfaces greatly affect aerosol properties in turn affecting the
climate. However, many aspects about the formation and atmospheric processing of
aerosols, in particular secondary organic aerosol (SOA), remain poorly understood. The
traditional mechanism of SOA formation does not adequately predict experimental
observations in the atmosphere. It is increasingly being recognized that aqueous phase
processing of atmospheric organics is another important pathway to SOA formation. A
better picture of the surface behavior of these organics and their reaction products will aid
in further understanding the role these organics play in the formation potential of aqueous
secondary organic aerosol. The work within details studies on the adsorption, orientation,
and hydration state of select atmospheric carbonyls (glyoxal, hydroxyacetone,
methylglyoxal, and pyruvic acid) and their aqueous reaction products at the air-water
interface. Data are gathered using a combination of experimental and theoretical
techniques, including vibrational sum frequency (VSF) spectroscopy, surface tensiometry
measurements, classical molecular dynamics (MD) simulations, and density functional
theory (DFT) calculations.
This dissertation includes previously published and unpublished co-authored material.
v
CURRICULUM VITAE NAME OF AUTHOR: Brittany Pierce Gordon GRADUATE AND UNDERGRADUATE SCHOOLS ATTENDED: University of Oregon, Eugene New College of Florida, Sarasota Santa Fe College, Gainesville DEGREES AWARDED: Doctor of Philosophy, Chemistry, 2019, University of Oregon Masters of Science, Chemistry, 2019, University of Oregon Bachelors of Arts, Chemistry, 2013, New College of Florida, Sarasota Associates of Arts, Biology, 2010, Santa Fe College, Gainesville AREAS OF SPECIAL INTEREST: Spectroscopy Chirped Pulse Fourier Transform Microwave (CP-FTMW) Spectroscopy Vibrational Sum Frequency (VSF) Spectroscopy Computational Chemistry Atomistic Density Functional Theory (DFT) Atomistic Molecular Dynamics (MD) Atmospheric Chemistry Secondary Organic Aerosol (SOA) Formation PROFESSIONAL EXPERIENCE: 1st place Physical Chemistry Division Poster Session, American Chemical Society, 2017 Graduate Teaching Fellow –Presidential Undergraduate Research (PURS) Program,
University of Oregon, 2014-2017 Graduate Teaching Fellow – Physical Chemistry Lab, University of Oregon, 2013-
2015 Graduate Research Fellow - Richmond Lab, University of Oregon, 2014-2019
vi
GRANTS, AWARDS, AND HONORS: Teaching Award for Physical Chemistry Lab, University of Oregon, 2015 1st place Physical Chemistry Division Poster Session, American Chemical Society, 2017 PUBLICATIONS:
Gordon, B. P. Waveguide Chirped-Pulse Fourier Transform Microwave Spectra
of Small Alkylthiols. Undergraduate Thesis (B.A.) - New College of Florida, 2013. L. Kolesniková, L., Tercero, B., Cernicharo, J., Alonso, J. L., Daly, A. M.,
Gordon, B. P., Shipman, S. T. Spectroscopic Characterization and Detection of Ethyl Mercaptan in Orion. Astrophys. J. Lett., 2014, 784 (L7), 8pp.
Wren, S. N., Gordon, B. P., Valley, N. A., McWilliams, L. E., Richmond, G. L. Hydration, Orientation, and Conformation of Methylglyoxal at the Air-Water Interface. J. Phys. Chem. A 2015 119 (24), 6391-6403. Gordon, B. P., Moore, F. G., Scatena, L. F., Valley, N. A., Wren, S. N., Richmond, G. L. Model Behavior: Characterization of Hydroxyacetone at the Air-Water Interface Using Experimental and Computational Vibrational Sum Frequency Spectroscopy. J. Phys. Chem. A 2018 122 (15), 3837-3849. Ciszewski, R. K., Gordon, B. P., Muller, B. N., Richmond, G. L. Takes Two to Tango: The Choreography of the Co-Adsorption of CTAB and Hexanol at the Oil-Water Interface. J. Phys. Chem. B 2019 123 (40), 8519-8531. Gordon, B. P., Moore, F. G., Scatena, L. F., Richmond, G. L. On the Rise: Experimental and Computational VSFS Studies of Pyruvic Acid and its Surface Active Oligomer Species at the Air-Water Interface. J. Phys. Chem. A 2019, 123 (49), 10609-10619 Gordon, B. P., Moore, F. G., Scatena, L. F., Richmond, G. L. Diol It Up: The Influence of NaCl on Methylglyoxal Surface Adsorption and Hydration State at the Air-Water Interface. *To be submitted to Journal of Physical Chemistry A in December 2019 Gordon, B. P., Moore, F. G., Scatena, L. F., Richmond, G. L. Mix and Match: VSF studies of Glyoxal and its Surface Active Oligomers at the Air-Water Interface. *In Preparation Gordon, B. P., Moore, F. G., Valley, N. A., Richmond, G. L. Level Up: Methodology Improvements for Calculation of VSF Spectra of Aqueous Organic Interfaces Using Gas-Phase Water Microclusters. *In Preparation
vii
ACKNOWLEDGMENTS Thank you to the entire Richmond Lab. I have loved my time here and will
always treasure it. In particular, I would like to give thanks to Dr. Clive Kittredge, my
mentor during my REU and first friend in the lab. To my mentors after joining the lab,
Dr. Sumi Wren and Nick Valley, who provided me with an incredible foundation for my
future work. Dr. Jenny Hensel, for always being a friend and mentor. Dr. Regina
Ciszewski, my friend and office mate who put up with my eccentricities with just a smile
and a laugh. Andrew Carpenter, who I could always count on for good scientific
discussion. Evan Christoffersen, who is keeping Frankenstein alive. To Grace Lindquist
and Michael Crawford, my former minions, for all your help and support and just being
awesome to work with! Priscilla Lewis, our Lab Mom, who keeps it all from going off
the rails. And my advisor, Dr. Geraldine Richmond, not only for your role as my mentor,
but also for all the work you do to inspire and further the cause of women in science.
I especially want to thank Dr. Larry Scatena and Dr. Fred Moore for your
mentorship, patience, thoughtfulness, friendship, and utterly invaluable support. And of
course, Frankenstein, my laser that just keeps on keeping on through thick and thin since
1994. We have been through the trenches together, but old Frankenstein always pulled
through and has never run better!
Thank you to the UO Chemistry department for all their help and support during
my six years here. I also want to thank Dr. John Hardwick for being the best professor
anyone could ever hope to be a teaching assistant for. It was genuinely a pleasure and
privilege to work with you. The skills I learned in my two years teaching Physical
Chemistry lab with you proved to be instrumental in my own research. Every time I write
anything, I think of your favorite quote: “I wanted to write you a short note but I didn’t
have time, so I wrote you a long one.” So, so true. Also thank you to Dr. Shannon
Boettcher, my research advisor and mentor during my 2012 REU at UO. While my time
in your group might have been brief, the wisdom you offered me stuck and helped me on
my way ever since.
I would also like to express my sincere gratitude for my amazing thesis
committee, Dr. Marina Guenza, Dr. George Nazin, and Dr. Emilie Hooft. You have
viii
always been supportive and offered insightful feedback. Not every grad student looks
forward to annual reviews, but thanks to my great committee, I always did.
And finally, I would give thanks to my family for their everlasting support and
confidence in me, even when (especially when!) I doubted myself. To my aunt, Sharon
Potts, and my dad, Dr. Michael Gordon, who I know are proud of me even if they are no
longer with us. My uncle, Dr. Phillip Gordon, who was always sure I would be next Dr.
Gordon. To Taylor Potts-Gordon, my itty-bitty baby cousin (who is somehow actually in
her in 20s with a degree of her own and also taller than me) for always inspiring me and
also making me laugh. And my amazing Aunt Carol, who always gets me.
To my sister and her amazing family. My brother-in-law Eddie Fraiman for his
unwavering faith in me and laughing at the thought of me not getting into college, grad
school, whatever. My amazing, incredible, brilliant niece and nephews, Maayan, Zev, and
Alon (the Science Kiddos!) You guys never cease to astound me with how brilliant you
are! Seriously, what other kids know about Rayleigh scattering, wave-particle duality,
and black holes? You are all amazing and I can’t wait to do science with you! And to my
sister, and best friend Paule. Thank you for your support and help and guidance and
advice, but also being the one I can always count on to talk about science and books and
thought experiments with.
To my parents, Debra Gordon and Franklin Lampp, for always being my rock and
personal cheerleaders. Thank you for always being the ones I could be cranky at when I
was stressed and then still driving down to see me and bring me homemade soup. Thank
you for the countless practice talks I made you sit through and all the papers you looked
over for me (even though you couldn’t understand half the words) just to put my mind at
ease. You guys are the best and I couldn’t have done it without you!
And finally, thank you to Gremlin, Loki, Thor and Fenrir, the best pets anybody
could ever ask for. You little dudes got me through a lot of hard times and I will be
forever grateful for that.
This material is based upon work supported by the National Science Foundation
under Grant No. CHE 1051215 and Grant No. CHE 1505891 awarded to Dr. Geraldine
Richmond at the University of Oregon.

ix
For my brilliant niece and nephews (the science kiddos!) Maayan, Zev, and Alon. May this work inspire you even a fraction as much as you all have inspired me.
x
TABLE OF CONTENTS
Chapter Page I. INTRODUCTION .................................................................................................... 1
II. METHODS ............................................................................................................. 5
Theory of Vibrational Sum Frequency (VSF) Spectroscopy ................................ 5
Laser System ......................................................................................................... 7
Surface Tensiometry: The Wilhelmy Plate Method .............................................. 8
Computational Methodology ................................................................................. 10
Classical Methods: MD ................................................................................... 11
Quantum Mechanical Methods: DFT .............................................................. 12
Computational Analysis: In-House Full Analysis (FAS) Code ...................... 13
III. NEAT WATER AT THE AIR-WATER INTERFACE ........................................ 15
IV. METHYLGLYOXAL AT THE AIR-WATER INTERFACE ............................. 18
Bridge .................................................................................................................... 18
Introduction ........................................................................................................... 19
Methylglyoxal Hydration ................................................................................ 22
Experimental and Theoretical Methods ................................................................. 24
Vibrational Sum Frequency Theory ................................................................ 24
Laser System ................................................................................................... 25
Spectral Analysis ............................................................................................. 26
Surface Tension ............................................................................................... 26
Sample Preparation .......................................................................................... 27
xi
Chapter Page
Computational Methods ........................................................................................ 28
Classical Molecular Dynamics ........................................................................ 28
Quantum Mechanical Calculations .................................................................. 29
Computational Results ........................................................................................... 30
Density Profiles ............................................................................................... 30
Conformational Distributions .......................................................................... 32
Surface Orientation of MGD ........................................................................... 34
Experimental Results ............................................................................................. 35
Surface Tensiometry ........................................................................................ 35
VSF Spectra: C=O Stretching Region ............................................................ 36
VSF Spectra: CH/OH Stretching Region ........................................................ 38
Experimental Versus Calculated VSF Spectra ...................................................... 40
Simulations of Mixed MGD and MGT ........................................................... 44
MG-OH Stretching Region .............................................................................. 45
Methylglyoxal Surface Adsorption and Interfacial Structure ............................... 47
Influence on Water Structure ........................................................................... 48
Conclusions ........................................................................................................... 50
V. HYDROXYACETONE AS A MODEL SYSTEM ................................................ 52
Bridge .................................................................................................................... 52
Introduction ........................................................................................................... 53
Experimental Methods ........................................................................................... 55
xii
Chapter Page
Vibrational Sum Frequency Spectroscopy ...................................................... 55
Laser System ................................................................................................... 57
Surface Tensiometry ........................................................................................ 58
Sample Preparation .......................................................................................... 58
Computational Methods ........................................................................................ 59
Classical Molecular Dynamics ........................................................................ 59
Quantum Mechanical Calculations .................................................................. 60
Experimental VSF Spectra .................................................................................... 61
Experimental Surface Tensiometry ....................................................................... 67
Computational Results ........................................................................................... 68
Application of Computational Results with Spectral Interpretations .................... 75
Conclusions and Atmospheric Implications ......................................................... 79
VI. PYRUVIC ACID AND ITS SURFACE-ACTIVE OLIGOMERS ....................... 82
Bridge .................................................................................................................... 82
Introduction ........................................................................................................... 83
Experimental Methods ........................................................................................... 85
Vibrational Sum Frequency Spectroscopy ...................................................... 86
Laser System ................................................................................................... 87
Surface Tension ............................................................................................... 88
Sample Preparation .......................................................................................... 88
Computational Methods ........................................................................................ 88
Classical Molecular Dynamics ........................................................................ 89
xiii
Chapter Page
Quantum Mechanical Calculations .................................................................. 89
Calculated VSF responses ............................................................................... 90
Results and Discussion .......................................................................................... 90
Experimental VSF Spectra .............................................................................. 90
Surface Tensiometry ........................................................................................ 90
Computational Results ..................................................................................... 99
Density Profiles ......................................................................................... 99
Calculated VSF responses ......................................................................... 100
Conclusions ........................................................................................................... 105
VII. METHYLGLYOXAL AND SODIUM CHLORIDE .......................................... 107
Bridge .................................................................................................................... 107
Introduction ........................................................................................................... 107
Methods ................................................................................................................. 111
Vibrational Sum Frequency (VSF) Spectroscopy Theory ............................... 111
Laser System ............................................................................................. 112
Spectral Analysis ....................................................................................... 113
Surface Tensions Measurements ............................................................... 113
Sample Preparation .................................................................................... 114
Computational Methods ............................................................................ 114
Experimental Results and Discussion ............................................................. 116
Surface Tension ......................................................................................... 116
VSF Spectroscopy Results ........................................................................ 118
xiv
Chapter Page
CH Stretching Region .......................................................................... 119
C=C/C=O Stretching & HOH Bending Region .................................. 122
OH stretching region ........................................................................... 125
NMR Results ..................................................................................... 128
Calculated Results .................................................................................... 129
Calculated Density Profiles ................................................................. 129
MG Orientation and Angle Distributions ............................................ 130
Conclusions ............................................................................................... 132
VIII. GLYOXAL AND ITS OLIGOMERS ................................................................ 136
Bridge .................................................................................................................... 136
Introduction ........................................................................................................... 136
Surface Tensiometry .............................................................................................. 137
VSF Spectra ........................................................................................................... 138
IX. COMPUTATIONAL METHODOLOGY IMPROVEMENTS ............................ 141
Bridge .................................................................................................................... 141
Simulating VSF Water Spectra with Gas-Phase DFT Water Microclusters ......... 141
Investigating the MD Water Models ..................................................................... 143
Evaluating Our DFT Functional ............................................................................ 145
Evaluation of Improvements: Hydroxyacetone as a Model System ..................... 145
Conclusions ........................................................................................................... 148
X. CONCLUSIONS .................................................................................................... 150
APPENDICES ............................................................................................................. 151
xv
Chapter Page
A. SUPPLEMENTAL INFORMATION FOR NEAT WATER .......................... 151
B. SUPPLEMENTAL INFORMATION FOR MG .............................................. 152
C. SUPPLEMENTAL INFORMATION FOR HA ............................................... 155
D. SUPPLEMENTAL INFORMATION FOR PA ............................................... 163
E. SUPPLEMENTAL INFORMATION FOR MG-NaCl ..................................... 170
F. SUPPLEMENTAL INFORMATION FOR COMPUTATIONAL WORK ..... 181
REFERENCES CITED ............................................................................................... 183
xvi
LIST OF FIGURES Figure Page 2.1 VSF generation at the air-water interface. ............................................................. 5 2.2 Diagram of Wilhelmy Plate surface tensiometry at the air-water interface .......... 9
2.3 Computational methods ......................................................................................... 11
3.1 VSF spectra of neat water ...................................................................................... 16
4.1 Surface partitioning of water and MG ................................................................... 31
4.2 Gas phase DFT structures of MG species ............................................................. 32
4.3 Percent abundance of the MGD conformers as a function of depth ...................... 34
4.4 VSF ssp spectra of aqueous MG solutions in the C=O stretching region ............. 37
4.5 VSF ssp and sps spectra of MG in the CH/OH stretching region ......................... 38
4.6 Experimental vs. calculated VSF MG spectra ....................................................... 41
4.7 Experimental vs. calculated VSF spectra from mixed MG ................................... 45
4.8 Experimental vs. calculated VSF MG spectra in the CH/OH stretching region ... 46
5.1 VSF Experimental data and corresponding fits for water and HA ........................ 62
5.2 VSF Experimental spectra for HA in H2O and D2O .............................................. 63
5.3 HA Experimental ssp and sps VSF CH stretching data ........................................ 66
5.4 HA experimental surface pressure and calculated density profiles ....................... 68
5.5 Percent abundance of the HA conformers as a function of depth ......................... 70
5.6 Normalized distributions of HA bond angles ........................................................ 72
5.7 Depth variation in concentration dependent C=O bond angle .............................. 74
5.8 Experimental VSFS vs. calculated HA VSF spectra ............................................. 76
6.1 Aqueous phase processing of PA ........................................................................... 83
xvii
Figure Page
6.2 VSF spectra for water and aqueous PA ................................................................. 92
6.3 VSF spectra for PA in H2O and D2O ..................................................................... 97
6.4 Experimental surface pressure isotherms and calculated density profiles ............ 99
6.5 Experimental vs. calculated PA VSF spectra ........................................................ 103
7.1 In-cloud aqueous phase processing ....................................................................... 109
7.2 Surface pressure isotherm vs. organic concentration for MG and MG-NaCl ....... 117
7.3 VSF Experimental spectra for MG and MG-NaCl in H2O .................................... 119
7.4 Experimental VSFS MG and MG-NaCl vs. Calculated VSF stick spectra ........... 121
7.5 VSF spectra for MG and MG-NaCl vs. HA and PA in H2O and D2O ................... 124
7.6 VSF spectra of MG and MG-NaCl CH/OH stretching region .............................. 126
7.7 Calculated MG density profiles and orientations .................................................. 130
7.8 Calculated MG depth dependent angle distributions ............................................. 131
7.9 Depiction of the potential explanation of a shift in MG hydration equilibrium .... 134
8.1 Mechanistic pathways of Glyoxal (GL) hydration and oligomer production ....... 136
8.2 Surface pressure isotherm vs. organic concentration ............................................ 137
8.3 VSF Experimental spectra for 1M GL in H2O ...................................................... 138
8.4 Experimental vs. calculated VSF GL spectra ........................................................ 140
9.1 Graphical depiction of the 16-digit binary code .................................................... 142
9.2 3-point vs. 4-point MD water models .................................................................... 144
9.3 Experimental vs. calculated VSF spectra of neat water ........................................ 145
xviii
LIST OF TABLES
Table Page 4.1 Fit assignments for MG ......................................................................................... 40 5.1 Fit assignments for HA .......................................................................................... 79
7.1 Fit assignments for MG-NaCl ............................................................................... 128
1
CHAPTER I
INTRODUCTION
Atmospheric aerosols are solid or liquid suspensions in the gas phase. They are of
great importance and can affect both the climate and human health. Aerosols influence
the climate directly by scattering and absorbing light and indirectly by acting as
nucleation sites in cloud formation.1-2 Aerosol composition is complex and varied, and
consists of both inorganic and organic constituents.3-6 Many of the organics found in
aerosols are formed by gas phase reactions of primary organic precursors and are thus
considered secondary organics. Aerosols containing secondary organics are known as
secondary organic aerosol (SOA).
Due to the high surface area to volume ratio of aerosols, molecules at aerosol
surfaces play a particularly large role in their atmospheric chemistry.7-8 Additionally, the
presence of organics and salts can significantly affect SOA properties.1-8 However,
because of the complexity of SOA, little is currently known about how these components
individually or in concert affect aerosol behavior. The dearth of knowledge makes
predicting formation and aging of SOA in the atmosphere very challenging and has
necessitated oversimplifications in atmospheric models.1-10 The “standard” or “gas phase”
mechanism of SOA formation considers only gas phase oxidation of volatile organic
precursors. These oxidized organic products are less volatile, and form SOA by
reversibly coalescing into molecular clusters or by condensing onto preexisting particles.
However, the “gas phase” mechanism cannot adequately account for the quantity or
variety of observed SOA.1-3,5-7,9,10
2
These discrepancies have prompted the notion that aqueous phase processing of
atmospheric organics also contributes significantly to SOA formation. The proposed
mechanism accounts for reactions occurring in the particle phase which lead to the
formation of SOA mass (hereafter aqSOA). Semi-volatile organics, in particular
carbonyls, which can partition from the gas phase into aerosol, fog, and cloud water, are
the primary candidates for this kind of aqSOA processing.1-6,9-10 Atmospheric organics
with carbonyl moieties favor this kind of chemistry because once in the aqueous phase,
the carbonyls readily hydrate to form less volatile geminal diols. Aqueous phase
oxidation and oligomerization reactions1-6 (e.g., aldol condensation, acetal formation) of
the hydrated species can lead to the formation of additional high molecular weight
oligomers and/or highly oxygenated products.[x] Due to their low-volatility, these
products generally remain in the particle phase and thereby increase SOA mass.
This sort of aqSOA formation mechanism could account for observed particle
phase concentrations of atmospheric carbonyls, which are significantly higher than
predicted based on physical solubility alone.1,9,10 However, the chemical processes
responsible for the uptake and enhanced partitioning of these species are still not fully
understood.1-6,9-10 Moreover, the presence of these organics and their unique products
from aqueous phase processing has the ability to alter climate-relevant aerosol
characteristics in significant ways. For example, the addition of hygroscopic mass leads
to an increase in particle size that affects light scattering and cloud nucleation
activity.3,6,10 To be able to predict the impact of aqSOA, it is important to fully
characterize not only the identity and interfacial behavior of the individual organic
3
constituents, but also the perturbations in behavior that arise from their interactions with
other aerosol components, especially inorganic salts and other organics.
Alone, atmospheric salts can affect water structure7-8 and organic number density
at the air-water interface (i.e., the aerosol surface), in turn altering aerosol hygroscopicity
and surface tension.3-6 Some salts are thought to catalyze the oligomerization reactions
responsible for the formation of additional higher molecular weight species.3-6 The
presence of salts can also shift the hydration equilibrium of organics with multiple
hydration states.11-12 More work is required to understand the formation of these species.
Furthermore, it has been observed that aerosol with multiple organic species can
have unpredicted synergistic effects on aerosol surface tension and hygroscopicity,
particularly in the presence of salt. These effects have been ascribed to the adsorption of
mixed organics to the particle interface and exceed what would be expected based on
predictions from bulk properties.6,13,14 Changes in the surface tension and hygroscopicity
of aerosols have important atmospheric consequences, such as enhancing aerosol cloud
nucleation activity.1-3,5,6,13,14 Complete characterization of SOA surfaces and prediction of
their behavior requires understanding of the identity, behavior, and orientation of the
species present at the interface. Bulk-to-surface partitioning can also increase the uptake
of gaseous organics because the gas-to-particle partitioning of organics is governed by
bulk concentrations. Surface partitioning to aerosol interfaces effectively lowers bulks
concentrations, which allows for increased gas-to-particle phase uptake. This can lead to
significantly higher concentrations of organics in the particle phase.15-17 As mentioned
previously, surface tension depression in aerosol due to surface active species and bulk-
to-surface partitioning have been shown to affect aerosol cloud nucleation activity.3,15 It is
4
also known that SOA can form organic surface films, which may impede gas-aerosol
mass transport by acting as a kinetic barrier.3,6,13 Finally, it has been suggested that
reactions could occur on particle surfaces and contribute to aqueous phase processing.1,2
To improve our understanding of SOA interfaces, we must first characterize the
organics that are thought to play an important role in aqSOA formation. To decouple the
interactions of the many constituents of SOA, a firm foundation needs to be established
for how a given organic component behaves at and impacts the interface. This research
will investigate the adsorption of atmospheric carbonyls to aqueous surfaces, which
includes determination of the orientations, conformations, hydration states, and reaction
products of the studied carbonyls at the interface. With that information, investigations
will progress to studying how the addition of non-reactive salts or other organic species
influences the system further.
Aqueous systems of glyoxal (GL), hydroxyacetone (HA), methylglyoxal (MG),
and pyruvic acid (PA) have been studied with a focus on elucidating their surface
orientations, hydration states, and conformations at the air-water interface. Understanding
these properties will help to lower the uncertainties associated with atmospheric aerosol
formation by providing insight into the behaviors of these complex systems. This
information will aid in further understanding the ultimate fate of these organics within
aqueous aerosol and their SOA forming potential. The work described within utilizes a
combined approach consisting of experimental vibrational sum frequency (VSF)
spectroscopy and Wilhelmy plate surface tensiometry with computational molecular
dynamics (MD) simulations and density functional theory (DFT) calculations to
investigate organic adsorption to the air-water interface as a model for aqueous SOA.
5
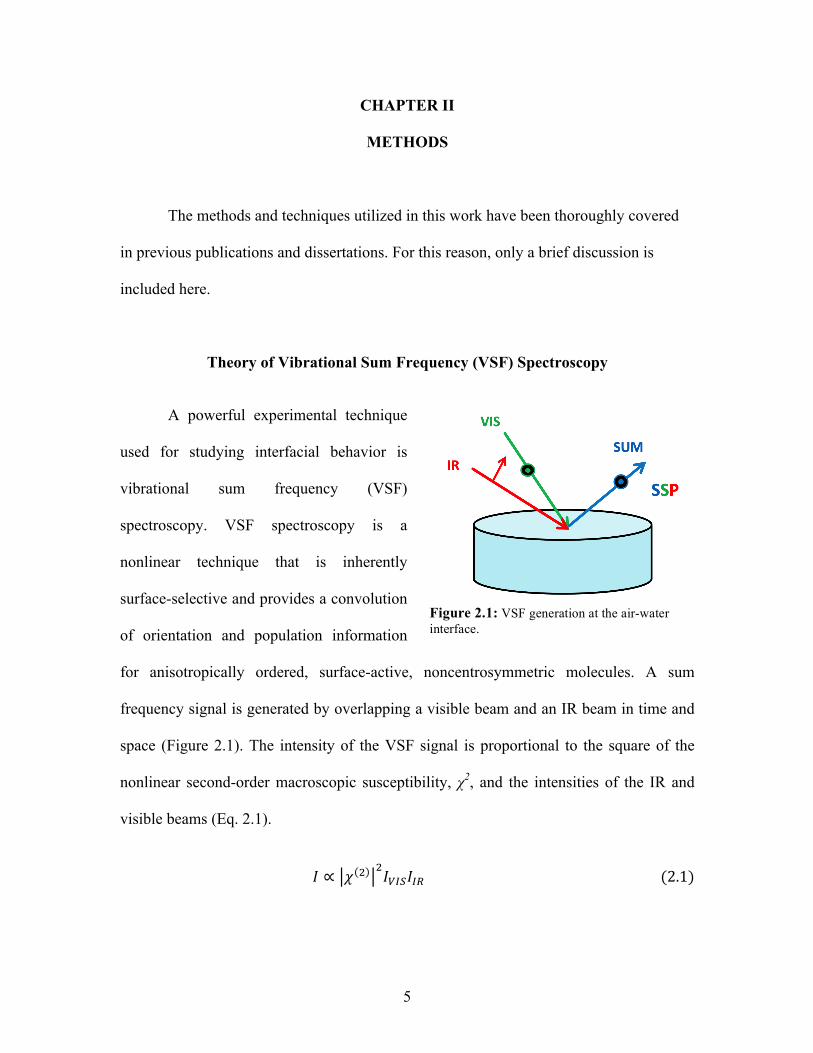
Figure 2.1: VSF generation at the air-water interface.
CHAPTER II
METHODS
The methods and techniques utilized in this work have been thoroughly covered
in previous publications and dissertations. For this reason, only a brief discussion is
included here.
Theory of Vibrational Sum Frequency (VSF) Spectroscopy
A powerful experimental technique
used for studying interfacial behavior is
vibrational sum frequency (VSF)
spectroscopy. VSF spectroscopy is a
nonlinear technique that is inherently
surface-selective and provides a convolution
of orientation and population information
for anisotropically ordered, surface-active, noncentrosymmetric molecules. A sum
frequency signal is generated by overlapping a visible beam and an IR beam in time and
space (Figure 2.1). The intensity of the VSF signal is proportional to the square of the
nonlinear second-order macroscopic susceptibility, χ2, and the intensities of the IR and
visible beams (Eq. 2.1).
! ∝ ! ! !!!"#!!" (2.1)
6
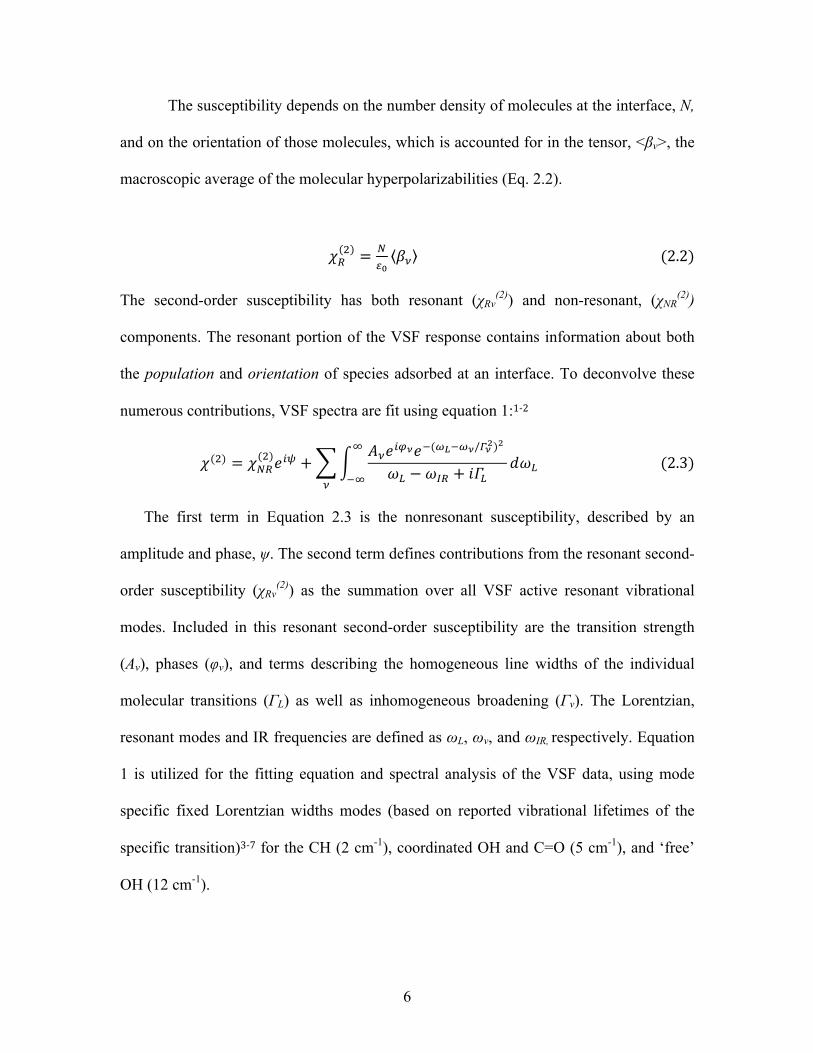
The susceptibility depends on the number density of molecules at the interface, N,
and on the orientation of those molecules, which is accounted for in the tensor, <βv>, the
macroscopic average of the molecular hyperpolarizabilities (Eq. 2.2).
!!! = !!!!! (2.2)
The second-order susceptibility has both resonant (χRν(2)) and non-resonant, (χNR
(2))
components. The resonant portion of the VSF response contains information about both
the population and orientation of species adsorbed at an interface. To deconvolve these
numerous contributions, VSF spectra are fit using equation 1:1-2
!(!) = !!"(!)!!! +!!!!"!!!(!!!!!/!!!)!
!! − !!" + !!!!!!
!
!!! (2.3)
The first term in Equation 2.3 is the nonresonant susceptibility, described by an
amplitude and phase, ψ. The second term defines contributions from the resonant second-
order susceptibility (χRν(2)) as the summation over all VSF active resonant vibrational
modes. Included in this resonant second-order susceptibility are the transition strength
(Aν), phases (φν), and terms describing the homogeneous line widths of the individual
molecular transitions (ΓL) as well as inhomogeneous broadening (Γν). The Lorentzian,
resonant modes and IR frequencies are defined as ωL, ων, and ωIR, respectively. Equation
1 is utilized for the fitting equation and spectral analysis of the VSF data, using mode
specific fixed Lorentzian widths modes (based on reported vibrational lifetimes of the
specific transition)3-7for the CH (2 cm-1), coordinated OH and C=O (5 cm-1), and ‘free’
OH (12 cm-1).
7
VSF spectra can be acquired in different polarization schemes which allow different
aspects of the molecular orientations to be probed. Spectra discussed in this proposal are
obtained using either the ssp or sps polarization scheme, where the three letters denote
the polarizations of the sum frequency, visible and IR beams respectively. The ssp
scheme probes molecular dipole components perpendicular to the air-water interface
while the sps scheme probes components parallel to the interface.
Laser System
VSF spectra were obtained using a newly-assembled picosecond system.8,11-12 The
system consists of a modelocked Ti:Sapphire laser which seeds an ultrafast regenerative
amplifier to produce a ~2000 µJ pulsed (~2.6 ps) visible beam centered at 800 nm with a
7 nm bandwidth at a repetition rate of 1 kHz. The amplified beam is split with ~ 500 µJ
directed to the visible line. The remaining ~ 1500 µJ is sent to an optical parametric
amplifier (OPA) in tandem with difference frequency generator (DFG) for mixing and
variable IR generation, producing IR light from 4000 cm-1 (~ 25 µJ) to 800 cm-1 (~2µJ).
The visible and IR beams are overlapped in time and space at the air-water interface. The
resultant sum frequency beam is detected using a thermoelectrically cooled CCD camera.
The aqueous samples are held in meticulously clean, shallow glass dishes on a vertically
translatable stage.
The picosecond laser system used to obtain the VSF results discussed here has
been described,8-16 such that only a brief description is necessary for this work. A sum
frequency (SF) beam is generated by overlapping a fixed visible beam (12500 cm-1) with
a tunable IR beam at the air-water interface in a copropagating geometry at 45˚ and 60˚
8
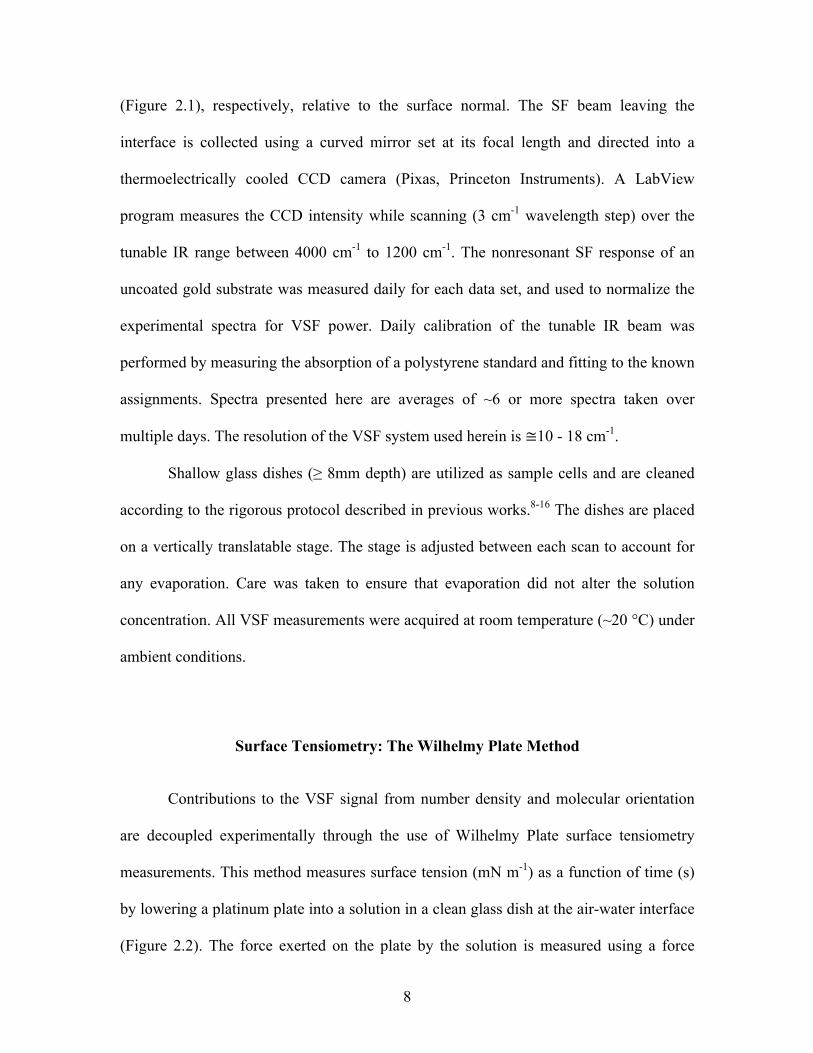
(Figure 2.1), respectively, relative to the surface normal. The SF beam leaving the
interface is collected using a curved mirror set at its focal length and directed into a
thermoelectrically cooled CCD camera (Pixas, Princeton Instruments). A LabView
program measures the CCD intensity while scanning (3 cm-1 wavelength step) over the
tunable IR range between 4000 cm-1 to 1200 cm-1. The nonresonant SF response of an
uncoated gold substrate was measured daily for each data set, and used to normalize the
experimental spectra for VSF power. Daily calibration of the tunable IR beam was
performed by measuring the absorption of a polystyrene standard and fitting to the known
assignments. Spectra presented here are averages of ~6 or more spectra taken over
multiple days. The resolution of the VSF system used herein is ≅10 - 18 cm-1.
Shallow glass dishes (≥ 8mm depth) are utilized as sample cells and are cleaned
according to the rigorous protocol described in previous works.8-16 The dishes are placed
on a vertically translatable stage. The stage is adjusted between each scan to account for
any evaporation. Care was taken to ensure that evaporation did not alter the solution
concentration. All VSF measurements were acquired at room temperature (~20 °C) under
ambient conditions.
Surface Tensiometry: The Wilhelmy Plate Method
Contributions to the VSF signal from number density and molecular orientation
are decoupled experimentally through the use of Wilhelmy Plate surface tensiometry
measurements. This method measures surface tension (mN m-1) as a function of time (s)
by lowering a platinum plate into a solution in a clean glass dish at the air-water interface
(Figure 2.2). The force exerted on the plate by the solution is measured using a force
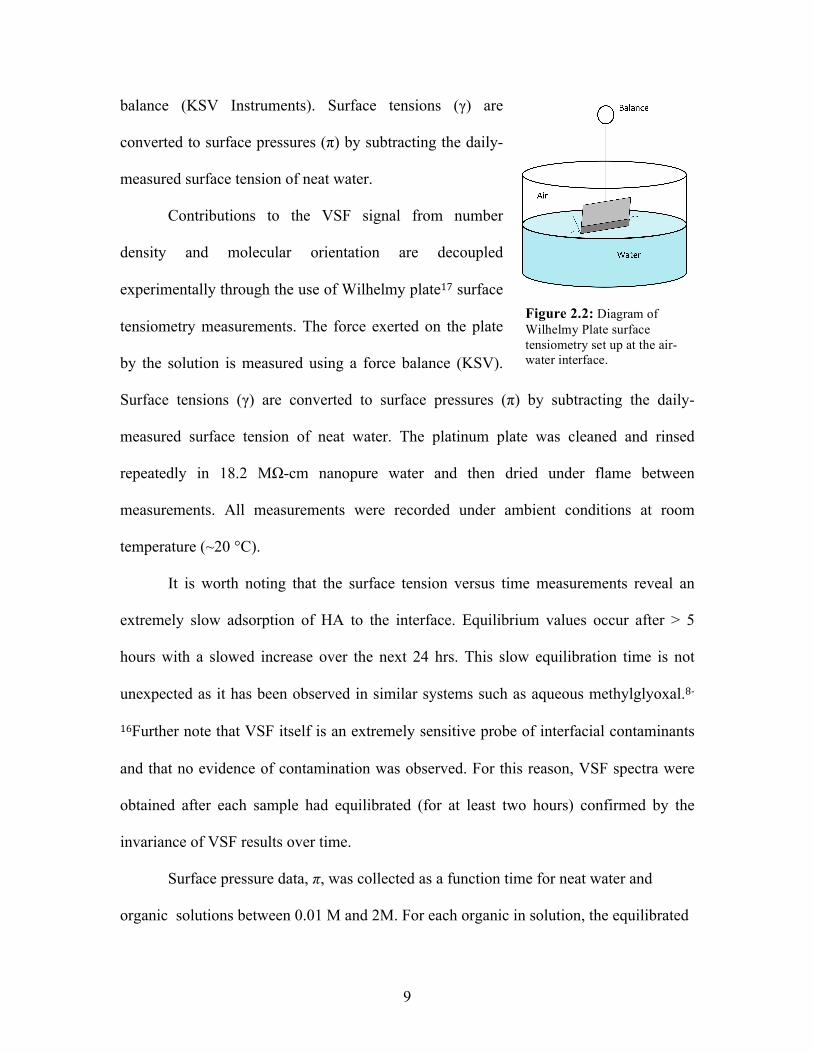
9
Figure 2.2: Diagram of Wilhelmy Plate surface tensiometry set up at the air-water interface.
balance (KSV Instruments). Surface tensions (γ) are
converted to surface pressures (π) by subtracting the daily-
measured surface tension of neat water.
Contributions to the VSF signal from number
density and molecular orientation are decoupled
experimentally through the use of Wilhelmy plate17 surface
tensiometry measurements. The force exerted on the plate
by the solution is measured using a force balance (KSV).
Surface tensions (γ) are converted to surface pressures (π) by subtracting the daily-
measured surface tension of neat water. The platinum plate was cleaned and rinsed
repeatedly in 18.2 MΩ-cm nanopure water and then dried under flame between
measurements. All measurements were recorded under ambient conditions at room
temperature (~20 °C).
It is worth noting that the surface tension versus time measurements reveal an
extremely slow adsorption of HA to the interface. Equilibrium values occur after > 5
hours with a slowed increase over the next 24 hrs. This slow equilibration time is not
unexpected as it has been observed in similar systems such as aqueous methylglyoxal.8-
16Further note that VSF itself is an extremely sensitive probe of interfacial contaminants
and that no evidence of contamination was observed. For this reason, VSF spectra were
obtained after each sample had equilibrated (for at least two hours) confirmed by the
invariance of VSF results over time.
Surface pressure data, π, was collected as a function time for neat water and
organic solutions between 0.01 M and 2M. For each organic in solution, the equilibrated
10
surface pressure value (> 2 hours) is plotted as a function of the natural log of bulk
organic concentration, [OR]. From this surface pressure isotherm, the maximum surface
excess can be calculated according to the Gibbs adsorption equation:18
!!" = (1/!")(!"/! ln!!")! (2.4)
where ΓOR is the maximum surface excess, π is the surface pressure in mN m-1, and aOR is
the activity. For those organics that lack experimental activity data, concentrations not
corrected for activity were used instead (aOR = [OR]). The slope of a linear fit of the
surface pressure versus the natural log of the activity (here, [OR]) is equivalent to the
maximum surface excess. The minimum area per molecule can then be found by
inverting the surface excess.
Computational Methodology
VSF spectra can be very difficult to interpret because of the multiple contributions
to the observed intensity. Additional techniques, in particular computational calculations,
are extremely valuable to help decouple these contributions. A combination of molecular
dynamics (MD) and density functional theory (DFT) calculations allow us to obtain
information about the orientational, depth specific behavior of molecules in order to
decouple the contributions to the experimentally observed signal.
A combination of computational techniques are used to generate calculated VSF
spectra. In addition to simulating spectra, the analysis also extracts structural details
about the system, such as density profiles, as well as depth-resolved orientation and
conformation information, which are vital in helping to understand the behavior of the
11
system. This methodology is ideal because it is both computational efficient for the
systems of interest and highly adaptable. This approach has been shown to be robust for
numerous and varied chemical systems when compared with experimental spectra.8-16
Classical Methods: DFT
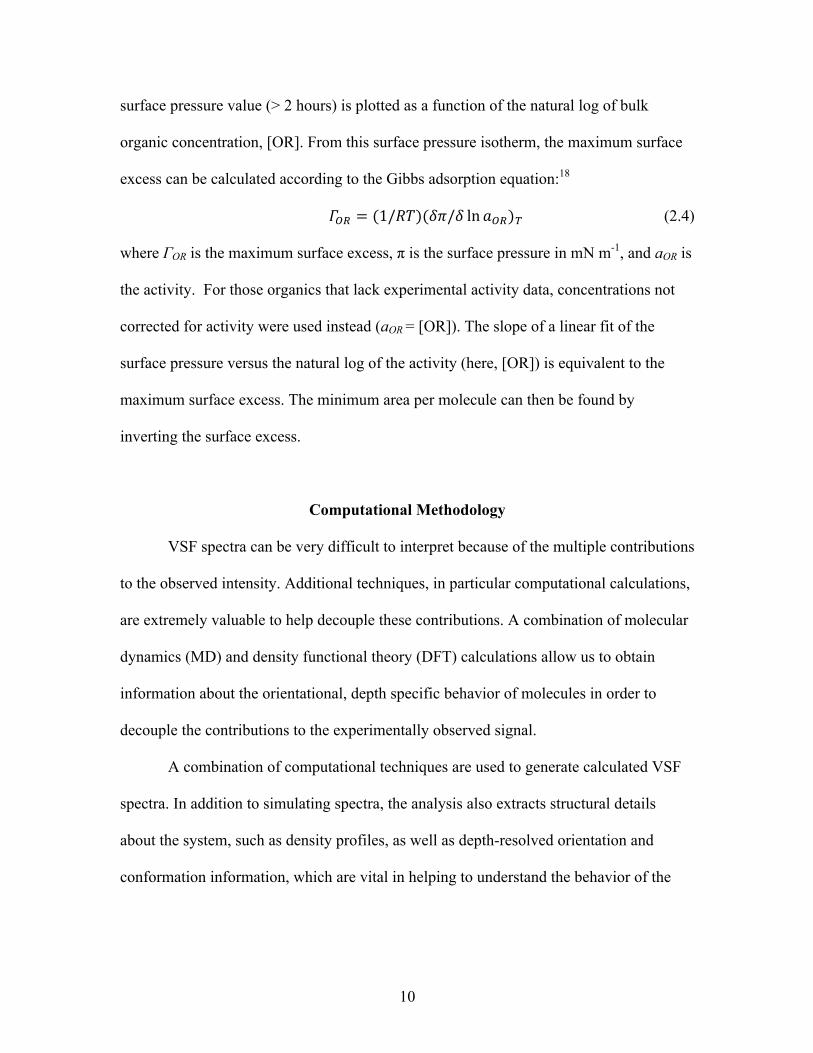
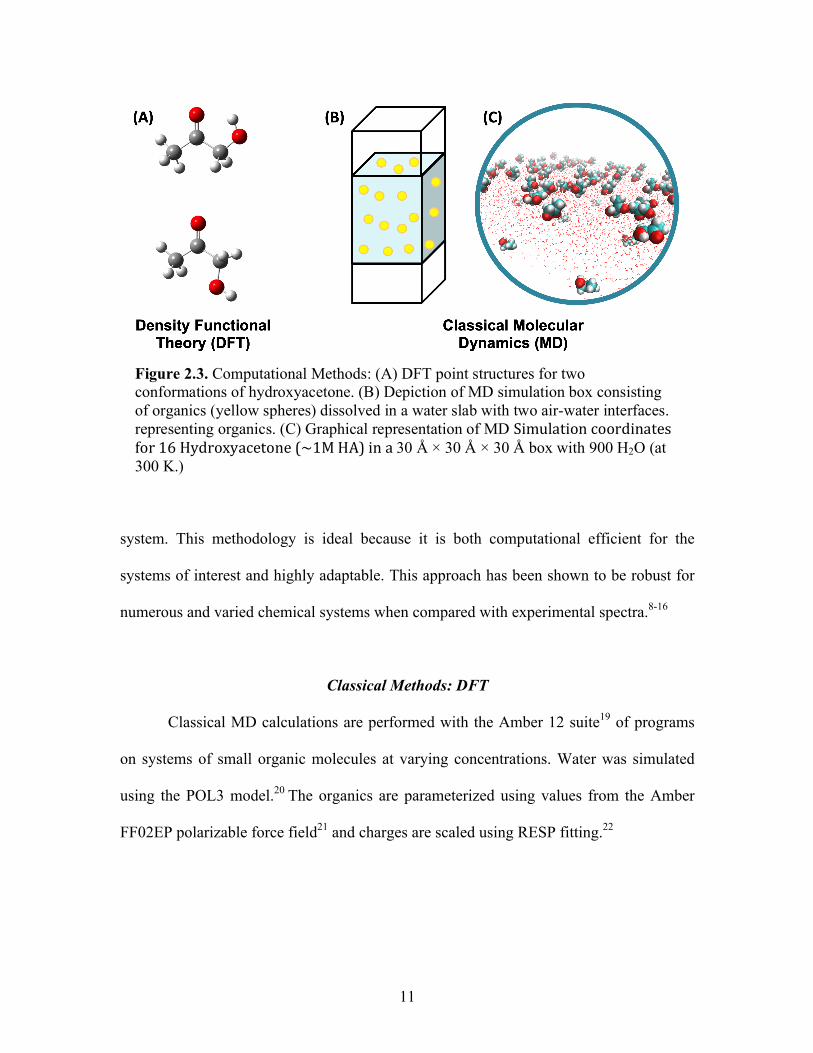
Classical MD calculations are performed with the Amber 12 suite19 of programs
on systems of small organic molecules at varying concentrations. Water was simulated
using the POL3 model.20 The organics are parameterized using values from the Amber
FF02EP polarizable force field21 and charges are scaled using RESP fitting.22
Figure 2.3. Computational Methods: (A) DFT point structures for two conformations of hydroxyacetone. (B) Depiction of MD simulation box consisting of organics (yellow spheres) dissolved in a water slab with two air-water interfaces. representing organics. (C) Graphical representation of MD Simulationcoordinatesfor16Hydroxyacetone(~1MHA)ina30 Å × 30 Å × 30 Å box with 900 H2O (at 300 K.)

12
Starting configurations are created using the PACKMOL program.23 Generally,
boxes are 30 x 30 x 30 Å and contain 900 water molecules in addition to the organics. An
air-water interface is simulated by extending one of the box dimensions to 120 Å and
applying periodic boundary conditions, creating a water slab with two surfaces.
Energy minimization is performed using conjugate gradient and steepest descent
methods at 0 K followed by a 2 ns equilibration to bring the system to 298 K. The
minimized systems are furthered evolved for 50 ns at 298 K with a 1 fs time step. Atomic
coordinates are recorded every 100 fs, resulting in 500,000 data points.
Quantum Mechanical Methods: DFT
Density functional theory (DFT) calculations are performed using the B3LYP
exchange-correlation functional and a 6-311++G(2d,2p) basis set in the NWchem24 and
Gaussian 0925 program packages. Full geometry optimization and frequency
calculations, as well as polarizabilities and dipole moments at displaced geometries along
each normal mode, are performed for all reasonable gas phase conformers. Second-order
vibrational perturbation theory is used to calculate anharmonic corrections to vibrational
frequencies.
Generating VSF spectra requires the second-order susceptibility tensor for all
major conformations and orientations sampled in a dynamical interfacial system. Thus,
for each normal mode of each HA conformer, the polarizabilities and dipole moment
derivatives were calculated using three-point finite differentiation and combined
according to Equation (2.5) to approximate the second-order linear susceptibility
response tensor.
13
!!"#(!) ∝ !!"#!!!"!!!
!!!!!!!,!,!
(2.5)
Here, α is the molecular polarizability, µ is the dipole moment, Qq, is the normal
coordinate of the mode q, and C is a geometrical factor relating the molecular and
laboratory reference frames.
Using an in-house code,97 VSF intensities and phases were then calculated by
inspecting the second-order susceptibility tensor and assigning the static gas phase DFT
structures with the molecular orientations and conformations populated in the MD
simulations. The calculated intensities were empirically broadened using Lorentzian and
Gaussian widths informed by the experimental VSF spectral fits.
Computational Analysis: In-House Full Analysis (FAS) Code
Generally speaking, there are three primary methods for calculating the second-
order susceptibility tensor which differ in the approximations made that make the
calculations feasible.26-29 The methodology used by the Richmond lab involves assigning
conformers found in the MD simulations to gas phase DFT structures and using an in-
house code developed by Dr. Nick Valley29 to calculate the tensor. In addition to
simulating spectra, the analysis also extrapolates structural details about the system, such
as density profiles, as well as depth-resolved orientation and conformation information,
which are vital in helping to understand the behavior of the system. This methodology is
ideal because it is both computational efficient for the systems of interest and highly

14
adaptable. This approach has been shown to be robust for numerous and varied chemical
systems when compared with experimental spectra.29-31
15
CHAPTER III
NEAT WATER AT THE AIR-WATER INTERFACE
The contents of this chapter have been or are intended to be published in whole or in part. The text presented here has been modified from the publication below:
Gordon, B. P., Wren, S. N., Moore, F. G., Scatena, L. F., Richmond, G. L. Diol it up: The Influence of NaCl on Methylglyoxal Surface Adsorption and Hydration State at the Air-Water Interface. *To be submitted to Journal of Physical Chemistry A in December 2019
The VSF spectrum of neat water has been extensively studies in the previous
decades, in the literature.1-9 While a few outstanding questions remain,8, 10-12 these efforts
have yielded a general consensus on the resonances giving rise to the OH stretching
region of neat water. Ranging from 3200 - 3700 cm-1, contributions from more- and less-
coordinated water at occur at the low to high frequency ranges of this region,
respectively. At the air-water interface, modes from non-hydrogen bonded “free” OH
oscillators occur at ~3700 cm-1. This is most apparent in the ssp polarization scheme,
where a sharp, well-defined peak creates a characteristic spectrum (Fig. 3.1B).
Resonances arising from OH stretching modes in a continuum of hydrogen bonded states
and environments occur at lower frequencies, producing a very broad feature from
~3200-3600 cm-1.
VSF studies of the bending region of water are still relatively young in the ssp
polarization 13-15 and has yet to be reported in the sps polarization (Figures 3.1A and C,
respectively). As such, this region is less well understood and is an active area of research
in the community. While the overall line shape of ssp polarized water-bending region has
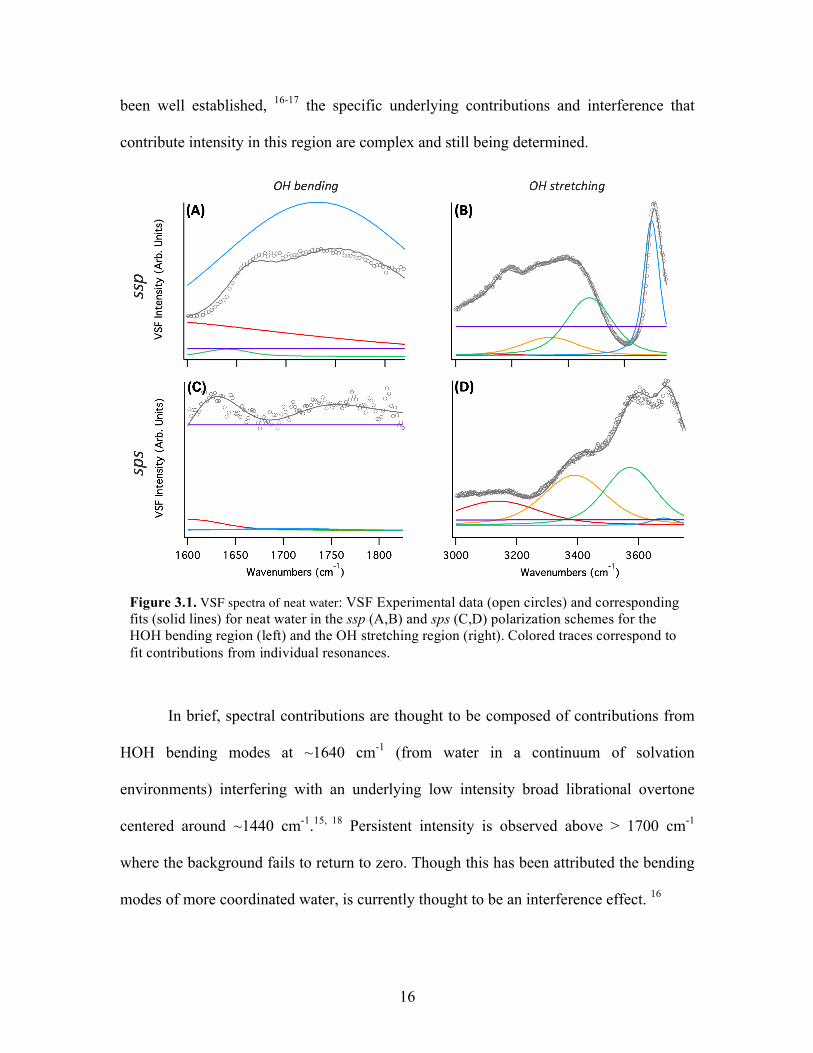
16
been well established, 16-17 the specific underlying contributions and interference that
contribute intensity in this region are complex and still being determined.
In brief, spectral contributions are thought to be composed of contributions from
HOH bending modes at ~1640 cm-1 (from water in a continuum of solvation
environments) interfering with an underlying low intensity broad librational overtone
centered around ~1440 cm-1.15, 18 Persistent intensity is observed above > 1700 cm-1
where the background fails to return to zero. Though this has been attributed the bending
modes of more coordinated water, is currently thought to be an interference effect. 16
Figure 3.1. VSF spectra of neat water: VSF Experimental data (open circles) and corresponding fits (solid lines) for neat water in the ssp (A,B) and sps (C,D) polarization schemes for the HOH bending region (left) and the OH stretching region (right). Colored traces correspond to fit contributions from individual resonances.
17
The ssp results obtained here show excellent agreement with reported spectra, 13-17
facilitating identification of oriented water at the air-water interface. Notably, our sps
bending spectrum of water does show apparent features, which were fit to plausible
frequency positions. However, due to the low signal-to-noise ratio and lack of literature
precedent, these fits of the sps bending spectrum remain highly tentative. Data tables of
VSF fits are supplied in Appendix A Tables A1 and A2.
18
CHAPTER IV
METHYLGLYOXAL AT THE AIR-WATER INTERFACE
The contents of this chapter have been previously published in whole or in part. The text presented here has been modified from the publication below:
Wren, S. N., Gordon, B. P., Valley, N. A., McWilliams, L. E., Richmond, G. L. Hydration, Orientation, and Conformation of Methylglyoxal at the Air-Water Interface. J. Phys. Chem. A 2015 119 (24), 6391-6403
Bridge
Aqueous-phase processing of methylglyoxal (MG) has been suggested to
constitute an important source of secondary organic aerosol (SOA). The uptake of MG to
aqueous particles is higher than expected due to the fact that its carbonyl moieties can
hydrate to form geminal diols, as well as the fact that MG and its hydration products can
undergo aldol condensation reactions to form larger oligomers in solution. MG is known
to be surface active but an improved description of its surface behavior is crucial to
understanding MG-SOA formation. These studies investigate MG adsorption, focusing
on its hydration state at the air-water interface, using a combined experimental and
theoretical approach that involves vibrational sum frequency (VSF) spectroscopy,
molecular dynamics simulations, and density functional theory calculations. Together, the
experimental and theoretical data show that MG exists predominantly in a singly
hydrated state (diol) at the interface, with a higher diol-tetrol ratio at the surface than that
for the bulk. In addition to exhibiting a strong surface activity, we find that MG
19
significantly perturbs the water structure at the interface. The results have implications
for understanding the atmospheric fate of methylglyoxal.
Methylglyoxal at the neat air-water interface was the first system studied in this
project. The complexities revealed in the coarse of this work determined the direction of
going forward. Additionally, significant improvements were made to the picosecond laser
system after the publication of this work. The vast improvements in spectral signal
revealed features previously buried in the noise and later prompted retreatment and
reinterpretation, as will be discussed further in Chapter VIII. Nonetheless, this initial
treatment of neat-MG in its published form has been included to provide context about
the state of affairs that necessitated the subsequent work.
Introduction
Atmospheric aerosols play an important role in influencing climate (both directly,
by scattering incident radiation and indirectly, by influencing cloud properties), human
health, and air quality. Understanding of the formation and subsequent processing of
atmospheric aerosol, particularly secondary organic aerosol (SOA) remains relatively
poor. The ‘traditional’ SOA mechanism based on the reversible gas-particle partitioning
of non- and semi-volatile species1-3 tends to grossly underestimate the magnitude and
variability of SOA in the atmosphere.4-8 Increasingly it is being recognized that aqueous
phase processing of water soluble atmospheric organics – particularly the α-dicarbonyl
compounds glyoxal and methylglyoxal – could constitute a hitherto ‘missing’ SOA
source.9-12 In fact recent modeling studies11-12 suggest that aqueous phase processing of
20
glyoxal and methylglyoxal could contribute an additional global SOA source similar in
magnitude to that obtained by the ‘traditional’ SOA mechanism. However, a better
description of the interfacial behavior of these species is required in order to accurately
predict and model their atmospheric fate and SOA-forming potential. In this study, we
investigate the surface adsorption of methylglyoxal, focusing on its hydration state at the
interface.
Glyoxal (GL) and methylglyoxal (MG) –gas phase oxidation products of both
biogenic and anthropogenic precursors11 – are semi-volatile and hence can be taken up by
aerosol, fog, and cloud water.13-14 In the aqueous phase, subsequent oxidation15-18 and
oligomerization19-37 (e.g., aldol condensation, acetal formation) leads to the formation of
low-volatility, high molecular weight and/or highly oxygenated products, thereby
increasing SOA mass. Several studies indicate that these oligomeric products remain in
the particle phase even after water evaporation.33-34, 37-38 Self- and/or cross-
oligomerization has been shown to be accelerated by drying34-35, 37, 39 and catalyzed by
strong acids,28, 40-42 amines,8, 22, 25, 31-32, 34-35 ammonium sulfate,22-23, 26-27, 43-44 and
carbonate salts.26, 45
Aqueous phase processing of organics significantly perturbs climate-relevant
aerosol properties. The addition of hygroscopic mass results in an increase in particle size
and thus influences both the direct and indirect climate effect of aerosols.12 Moreover,
studies19-21, 26-28, 39, 46-48 have shown that oligomerization reactions involving glyoxal and
methylglyoxal lead to the formation of light-absorbing species (e.g., C-N containing
compounds such as imidazoles), depending on the identity and presence of a surrounding
organic matrix.49 This formation of ‘brown carbon’ has important climate consequences
21
since it perturbs aerosol radiative properties.47 Despite the importance of aqueous phase
processing of glyoxal and methylglyoxal, many aspects of this chemistry remain
uncertain. In particular, measured concentrations of glyoxal and methylglyoxal in
inorganic aerosol are higher than those estimated based on bulk Henry’s law coefficients
and the reasons for this enhanced uptake are not fully understood.12, 31, 50-51
The focus of the current study is methylglyoxal, since both the parent compound
and its oligomerization products have been found19 to be surface active. This surface
activity has significant implications for aerosol processing and properties. For instance,
Romakkaniemi et al.52 have shown that the uptake of methylglyoxal to submicron-sized
particles is enhanced by more than an order of magnitude when surface partitioning is
taken into account. This is due to the fact that gas-to-particle partitioning based on
Henry’s law uptake is governed by bulk concentrations, which are effectively lowered by
surface partitioning. In addition, surface tension depression due to surface active species,
as well as bulk-to-surface partitioning, may influence a particle’s ability to act as cloud
condensation nuclei (CCN). 53-56 Although model calculations indicate that particle
concentrations of methylglyoxal and its reaction products may be too low for surface
tension depression to influence cloud droplet activation,46, 52 Sareen et al.57 have observed
that methylglyoxal uptake to ammonium sulfate seed aerosols results in enhanced CCN
activity. The authors suggest that the surface-adsorbed organic species induce changes to
the CCN activity, primarily by altering the properties (e.g., hygroscopicity) of the
particle’s surface. In addition, organic surface films may act as a kinetic barrier to gas-
aerosol mass transport and thereby influence particle equilibration and water/gas
uptake.58 The possibility of surface reactions contributing to aqueous SOA formation has
22
also been suggested.9, 12 Consequently, there has been a recent demand9 for laboratory
studies that address (a) the relative role of surface and bulk processes and (b) the role of
surfactants in aqueous SOA formation. Therefore, in this study, we endeavour to develop
a fundamental understanding of methylglyoxal adsorption to the air-water interface.
Results will serve as a foundation for future investigations into methylglyoxal surface
behavior in more complex matrices.
Methylglyoxal Hydration
Critical to both the particle uptake and subsequent processing of methylglyoxal is
its multi-step hydration to form gem-diols. Unhydrated methylglyoxal (MGM =
methylglyoxal monomer) hydrates favorably at the aldehydic carbonyl (i.e., the α-
carbon) to form the monohydrate (MGD = methylglyoxal diol) with a reported barrier
(ΔG‡) of +20.3 kcal mol-1 and an overall free energy change (ΔG) of -1.4 kcal mol-1
(note, the ΔG‡ and ΔG are +24.1 and +2.5 kcal mol-1 respectively for hydration at the
ketonic group)59 The monohydrate undergoes a second hydration at the ketonic group
(i.e., the β-carbon) to form the dihydrate (MGT = methylglyoxal tetrol) with a reported
barrier (ΔG‡) of +25.9 kcal mol-1 and an overall free energy change (ΔG) of +2.7 kcal
mol-1 (or +1.3 kcal mol-1 relative to the unhydrated species).59
The substantial reaction barriers of these hydrolysis reactions can be overcome by
acid catalysis,60 with the acids facilitating the intermolecular hydrogen transfer. Hazra et
al. have recently shown that atmospheric acids can catalyze gem-diol formation even
under water restricted environments.61

23
Since the hydrated forms of GL and MG have lower vapor pressures, hydrate
formation enhances their effective Henry’s law coefficients; however, this effect on its
own cannot account for their higher than expected particle concentrations.12, 23 Chemical
environments that shift the hydration equilibria toward more hydrated forms have the
potential to further enhance the effective Henry’s law coefficients. For example, in the
case of glyoxal, it has been suggested that enhanced partitioning of glyoxal to ammonium
sulfate aerosol can be attributed, in part, to a shift towards more hydrated structures (due
to stabilization of hydrated glyoxal by sulfate ions).23 Furthermore, the hydration
equilibria of methylglyoxal are critical to its reactive pathways since it is the singly
hydrated form (MGD) that contains a reactive carbonyl moiety.37 MGD can react via self-
aldol condensation via two routes, depending on the location of enol formation.19 The
two-step dehydration is also key to methylglyoxal’s fate when cloud droplets evaporate:
dehydration to the monohydrate is thought to trigger oligomerization, thereby trapping a
large fraction of MG in the particle phase.33, 37
In bulk aqueous solution, methylglyoxal has been found experimentally to exist
predominantly in its diol form with the ratio MGD/MGT ~ 1.5,33, 62 consistent with
thermodynamic calculations.59 However, since methylglyoxal is surface active,
knowledge of its hydration state at the surface is required in order to understand its fate
and therefore its potential to form SOA. This study investigates methylglyoxal at the air-
aqueous interface, with a particular focus on elucidating its hydration state there. A
combination of surface-selective vibrational sum frequency spectroscopy, surface
tensiometry, and computational methods provides a molecular-level picture of
methylglyoxal behavior at the air-aqueous interface.
24
Experimental and Theoretical Methods
Vibrational Sum Frequency Theory
Vibrational sum frequency (VSF) spectroscopy has been used extensively for the
study of water surfaces.63-68 A brief description of the theory behind VSF spectroscopy is
provided as it pertains to the experiments presented herein.69 A fixed-frequency visible
beam (800 nm) and tunable-frequency IR beam are overlapped in time and space at an
aqueous surface, producing a third beam at the sum of the incident frequencies. The
intensity of the sum frequency (SF) signal is proportional to the absolute square of the
second-order susceptibility, χ(2), which has both resonant and non-resonant components:
!(!) = !!"(!) + !!,!(!)! (4.1)
Both components are proportional to the number of molecules, N, contributing to the sum
frequency response and the orientational average of the molecular susceptibility, ⟨β⟩:
!!(!) =!!!! (4.2)
Hence via Eq. 4.2 the VSF response yields information about the population and
orientation of surface-adsorbed species. VSF spectra are fit to deconvolve the
nonresonant background and the individual resonant vibrational modes using:
!(!) = !!"(!)!!! +!!!!"!!!(!!!!!/!!
!)!
!!!!!"!!!!!!!!
!!! (4.3)
The first term is the nonresonant susceptibility (described by an amplitude and phase,
ψ). The second term is the sum over all VSF active resonant vibrational modes. The
resonant susceptibility is fit as a convolution of homogeneous line widths of the
25
individual molecular transitions (ΓL) and inhomogeneous broadening (Γν).70 The
transition strength, Aν, is proportional to the orientational average of the IR and Raman
transition probabilities as well as the number of contributing molecules. The frequencies
of the Lorentzian, resonant modes, and IR are ωL, ων, and ωIR, respectively. The phase of
each resonant mode is φν. In this work, fixed Lorentzian widths of 2 cm-1, 5 cm-1 and 12
cm-1 are used for the CH, both coordinated OH and C=O, and ‘free’ OH modes
respectively.
Laser System
A schematic of the laser system is shown in Supporting Figure S1. Results
obtained using this newly-assembled picosecond system are published here for the first
time. Briefly, the system consists of a modelocked Ti:Sapphire laser in tandem with an
ultrafast regenerative amplifier to produce a fixed visible (800 nm) beam. A portion of
the visible beam is sent to an optical parametric amplifier (OPA) in tandem with a
difference frequency generator (DFG) for mixing and IR generation.
The visible and IR beams are directed to the air-water interface in a copropagating
geometry at 63° and 55° relative to the surface normal respectively for the CH/OH
stretching region experiments, and at 45˚ and 60˚ respectively for the C=O stretching
region experiments. The SF beam leaving the interface is detected using a
thermoelectrically cooled CCD camera. The aqueous samples are held in scrupulously
clean, shallow glass dishes on a vertically translatable stage. Full details of the
experimental set-up can be found in the Appendix B.

26
Spectral Analysis
VSF spectra were acquired by measuring the intensity of the SF light as the IR
frequency was scanned in 3 cm-1 increments over the relevant spectral range (~2700 –
4000 cm-1 for the CH/OH stretching region, ~ 1650 – 1900 cm-1 for the C=O stretching
region). The spectra presented here were obtained using either the ssp or sps polarization
schemes in which the three letters denote the polarizations of the SF, visible, and IR
beams respectively. Changing the polarization scheme from ssp to sps allows us to
compare vibrational contributions resulting from dipole components that are
perpendicular or parallel to the interface, respectively. Sum frequency intensities were
normalized to account for the frequency dependence of (a) the spatial overlap of the
visible and IR beams; (b) the timing and energy of the IR pulses reaching the sample
(which are influenced by the tuning curve of the OPA/DFG as well as interactions with
ambient water vapor); and (c) the detection line optics used to collect the SF light. In
these experiments, VSF spectra were normalized to the nonresonant response from an
uncoated gold surface. IR frequencies were calibrated daily against a polystyrene
standard. All measurements were made at ambient temperature ~ 20°C. Presented
spectra are averages of 3 – 10 spectra acquired over a minimum of three days to ensure
reproducibility and to reduce the signal-to-noise ratio. Daily spectra of the neat air-water
interface were taken to ensure that the VSF response was comparable for each sample.
Surface Tension
Surface tension measurements were performed using the Wilhelmy plate method.
Solutions were placed in a clean glass dish and a Pt plate was subsequently lowered to the
27
air-water interface; great care was taken to ensure that the plate was correctly oriented
with respect to the solution surface. A force balance (KSV Instruments) measuring the
force acting on the Pt plate was used to measure surface tension (mN/m) as a function of
time (s). Surface tensions (γ) were converted to surface pressures (π) by subtracting the
daily-measured surface tension of neat water. The Pt pate was cleaned under flame until
glowing orange and then rinsed repeatedly in 18.2 MΩ water between measurements.
Sample Preparation
Aqueous MG solutions (0 – 2M) were prepared volumetrically by diluting MG
stock solution (40 wt% in H2O, Sigma Aldrich) in nanopure water. Solutions were stored
in Pyrex flasks and not further protected since photochemical degradation was not a
concern for these experiments.19 Solutions were prepared ≥ 24h before use unless
otherwise stated. MG stock solution is known to contain trace pyruvic acid and
hydroxyacetone impurities.33 The prepared MG solutions were therefore acidic due to the
fact that pyruvic acid is a strong acid (pKa ~ 2.5).19 The bulk pH of an aqueous 0.50 M
MG solution was measured with a commercial pH electrode to be ~ 2.6. This corresponds
to a pyruvic acid concentration of less than 5 × 10⁻³ M (or < 1%). Since a low pH is
consistent with the low pH of atmospheric SOA, the bulk pH of the aqueous MG
solutions was not further adjusted. The possible, but unobserved, impact of acidity on the
VSF spectra is discussed in the Supporting Information.
28
Computational Methods
Classical Molecular Dynamics
Classical molecular dynamics (MD) simulations of various MG species were
performed to (a) gain insight into their surface behavior and (b) provide orientational and
conformational information required to calculate VSF spectra. Simulations were
performed using the Amber 12 suite of programs71 using parameters and force fields
derived in the same manner as in previous studies.72-75 The MD simulations contained 1,
6, 10, 16 or 20 molecules of the target MG species along with 900 water molecules in a
30 Å cube, corresponding to total concentrations of roughly 0.06, 0.4, 0.6, 1.0 and 1.2 M
respectively. A water slab with two surfaces was created by expanding one of the box
dimensions to 120 Å and applying periodic boundary conditions. The interface is defined
here by the Gibbs dividing surface; distances are reported relative to the interface. Data
were collected for both water-vacuum interfaces, and bond angles are reported relative to
the surface normal pointing into the vacuum phase. Starting configurations were created
using PACKMOL.76
Simulations were performed on ‘pure’ systems, which contained exclusively
MGM, MGD, or MGT in water. In this study, MGD represents the energetically
favorable diol formed via hydration at the aldehydic carbon. The diol formed via
hydration at the ketone was not considered due to the fact that this reaction has been
calculated59 to have a ΔG˚of +2.5 kcal mol-1 and should contribute <1%. One ‘mixed’
system containing 10 MGD molecules and 6 MGT molecules (total of 16 molecules or ~1
M, with MGD/MGT ~1.7) was also simulated in order to (a) mimic the literature bulk
29
composition (MGD/MGT ~1.5) and (b) test for possible interactions between MG
species. It should be emphasized that these systems were not reactive.
Energy minimization of the initial system at 0 K was performed using a
combination of steepest-descent and conjugate-gradients methods. Minimized structures
were equilibrated by evolution through 2 ns of simulation from 0 K to 298 K. Each
system was further evolved at 298 K in 1 fs time steps for a total of 50 ns, with atomic
coordinates for analysis recorded every 100 fs. Results from the MD simulations (density
profiles, angle distributions, conformer distributions etc.) were found to be independent
of concentration and hence the remaining discussion focuses on simulations which
contained a total of 16 molecules (~ 1 M). As well, the overall behaviors of MGD and
MGT in the mixed system were not found to differ from their behaviors in the pure
systems.
Quantum Mechanical Calculations
The calculations presented in this work were performed employing the
NWChem77 and Gaussian 0978 program packages using the B3LYP exchange-correlation
functional and a 6-311++G(2d,2p) basis set. Full geometry optimization and harmonic
vibrational frequency calculations were performed for isolated gas phase MG species.
Anharmonic corrections to vibrational frequencies were obtained by second-order
vibrational perturbation theory. Energies and important dihedral angles for all structures
can be found in Appendix B Table B1. Polarizabilities and dipole moment derivatives
were calculated using three-point finite differentiation and combined to generate the
second-order susceptibility according to:
30
!!"#(!) ∝ !!"# !!!"!!!!!!!!!!,!,! (4.4)
Where α is the molecular polarizability, µ is the dipole moment, Qq, is the normal
coordinate of the mode q, and C is a geometrical factor relating the molecular and
laboratory reference frames. In-house code72 was used to calculate vibrational sum
frequency intensities by inspecting the second-order susceptibility tensor, accounting for
orientations and conformations from the MD calculations as well as rotational averaging
parallel to the interfacial plane. Calculated spectra were broadened using the same
predetermined Lorentzian widths as the experimental spectra. Gaussian widths obtained
from the fits to the experimental spectra were used to inform the broadening of the
calculated spectra. Gaussian widths based on experimental fits of 40 cm-1 for C=O, 30
cm-1 for α-CH, 15 cm-1 for CH3, and 80 cm-1 for methylglyoxal OH groups (MG-OH)
were ultimately applied to the calculations.
Computational Results
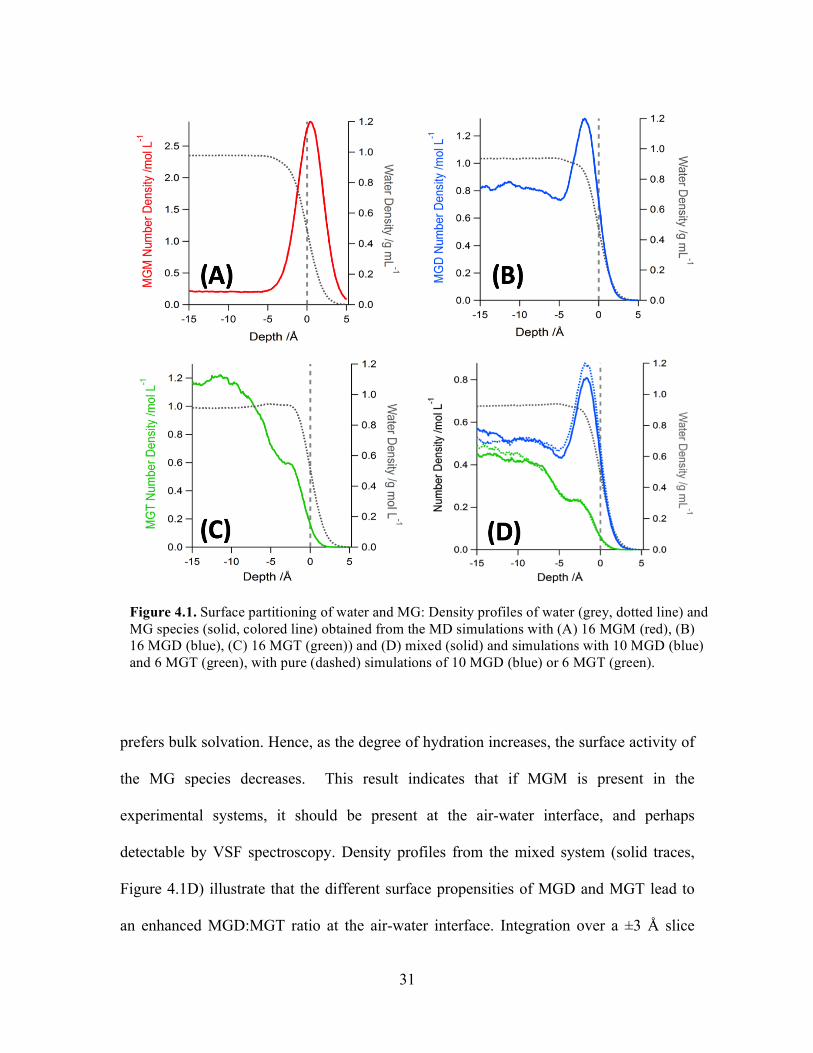
Density Profiles
The bulk-to-surface partitioning of methylglyoxal is relevant to its particle uptake,
as discussed in the Introduction. Understanding methylglyoxal surface activity is also
required to interpret the VSF spectra. Density profiles from molecular dynamics
simulations of the pure and mixed systems are displayed in Figure 4.1. The density
profiles clearly show that unhydrated MG (MGM) is very surface active; methylglyoxal
diol (MGD) is surface active but to a lesser degree, and methylglyoxal tetrol (MGT)
31
prefers bulk solvation. Hence, as the degree of hydration increases, the surface activity of
the MG species decreases. This result indicates that if MGM is present in the
experimental systems, it should be present at the air-water interface, and perhaps
detectable by VSF spectroscopy. Density profiles from the mixed system (solid traces,
Figure 4.1D) illustrate that the different surface propensities of MGD and MGT lead to
an enhanced MGD:MGT ratio at the air-water interface. Integration over a ±3 Å slice
Figure 4.1. Surface partitioning of water and MG: Density profiles of water (grey, dotted line) and MG species (solid, colored line) obtained from the MD simulations with (A) 16 MGM (red), (B) 16 MGD (blue), (C) 16 MGT (green)) and (D) mixed (solid) and simulations with 10 MGD (blue) and 6 MGT (green), with pure (dashed) simulations of 10 MGD (blue) or 6 MGT (green).
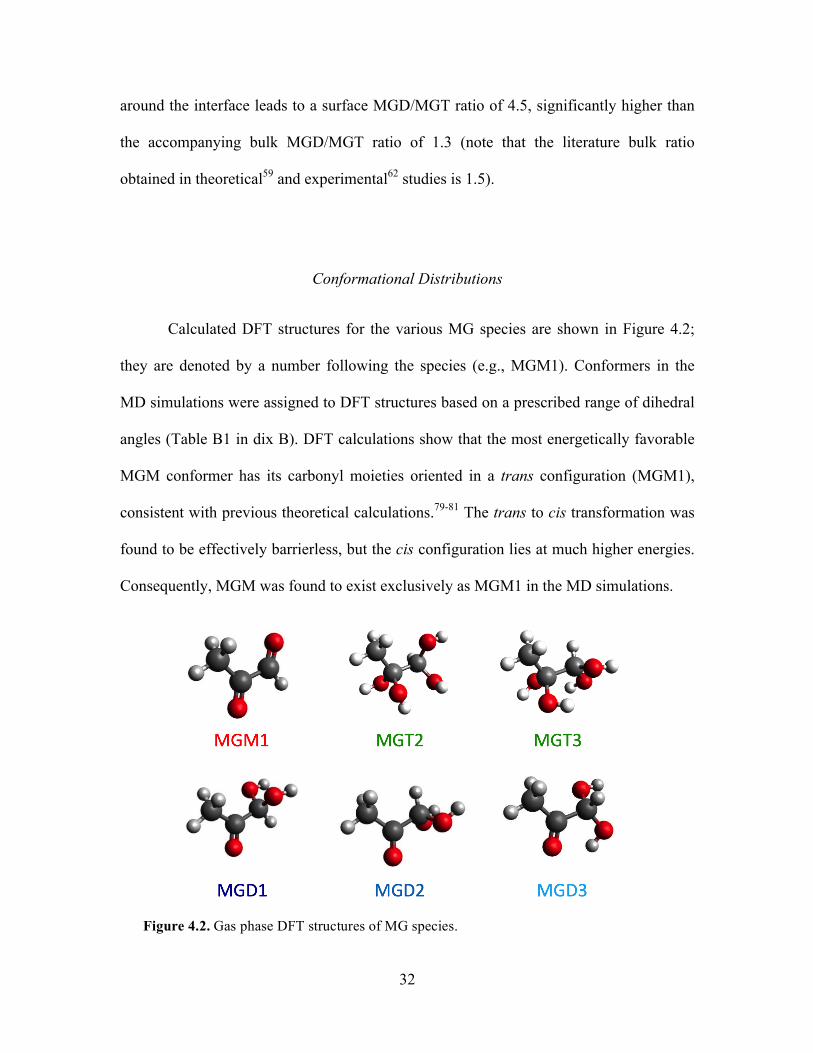
32
around the interface leads to a surface MGD/MGT ratio of 4.5, significantly higher than
the accompanying bulk MGD/MGT ratio of 1.3 (note that the literature bulk ratio
obtained in theoretical59 and experimental62 studies is 1.5).
Conformational Distributions
Calculated DFT structures for the various MG species are shown in Figure 4.2;
they are denoted by a number following the species (e.g., MGM1). Conformers in the
MD simulations were assigned to DFT structures based on a prescribed range of dihedral
angles (Table B1 in dix B). DFT calculations show that the most energetically favorable
MGM conformer has its carbonyl moieties oriented in a trans configuration (MGM1),
consistent with previous theoretical calculations.79-81 The trans to cis transformation was
found to be effectively barrierless, but the cis configuration lies at much higher energies.
Consequently, MGM was found to exist exclusively as MGM1 in the MD simulations.
Figure 4.2. Gas phase DFT structures of MG species.
33
Three gas phase DFT structures were obtained for MGD. The MGD1 (α-CH
bond cis to the C=O bond) and MGD2 (α-CH bond trans to the C=O bond) structures
were found to be excellent matches to dominant conformers in the MD simulations. The
MGD3 structure found in the DFT calculations appears to have an internal H-bond
between one of the MG-OH groups and the carbonyl moiety, evidenced by the existence
of a significantly red-shifted OH stretching frequency. This structure does not appear as a
unique conformer in the MD simulations. Rather, conformers in transition between
MGD1 and MGD2 are ‘counted’ as MGD3 (based on the relevant dihedrals). The overall
bulk distribution of the three conformers in both the pure and mixed MD simulations is
roughly 24% MGD1, 39% MGD2 and 26% MGD3 (with an additional 11% of molecules
not represented by a stable DFT structure, and binned as MGD4).
The relative abundance of the three conformers varies as a function of depth from
the interface as illustrated in Figure 4.3. The relative abundance of MGD2 falls off
approaching the interface and is replaced by MGD1, with 34% MGD1 and 24% MGD2
at 0 Å. This is consistent with the fact that the DFT calculations show that the MGD2
structure is at a saddle-point on the gas phase potential energy surface and hence does not
represent a favorable conformer in the gas phase. The larger bulk abundance of MGD2 in
the MD simulations indicates more favorable solvation of MGD2 by water than the other
conformers experience. Figure 4.3 clearly illustrates that the weaker solvation
environment of the air-water interface impacts the relative populations of conformers.
Similar impacts have previously been observed by our group via a combination of VSF
spectroscopy and computational methods.72, 74-75
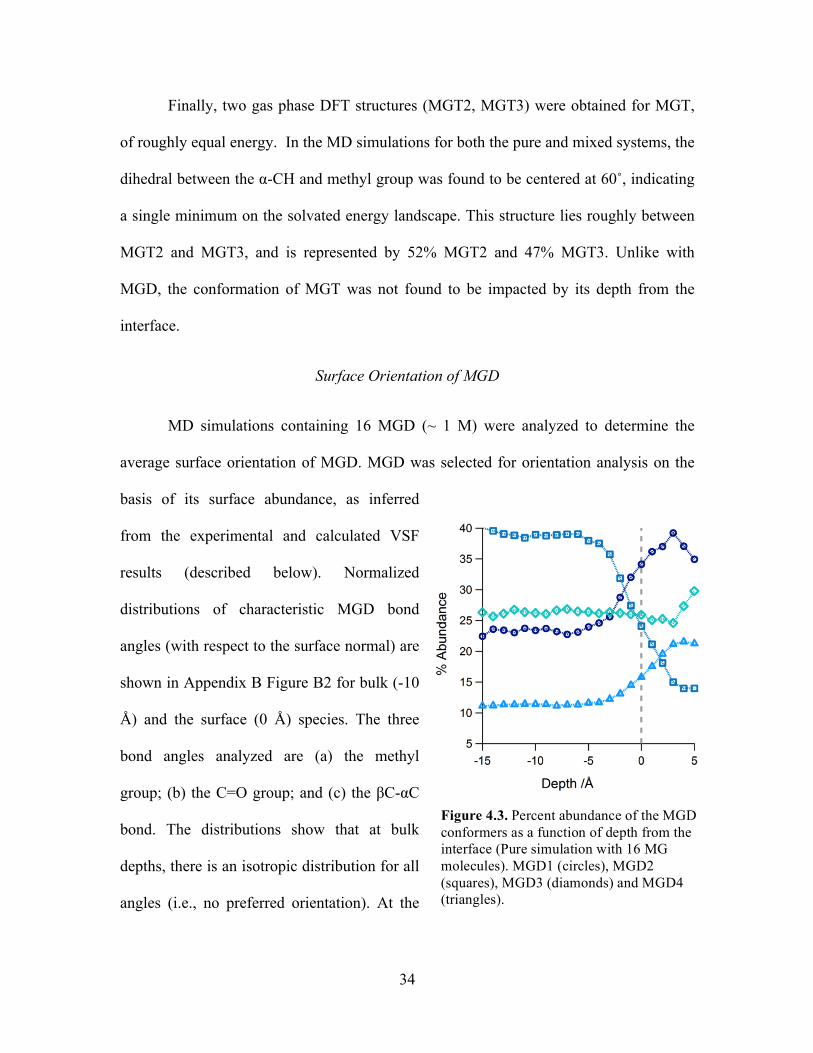
34
Finally, two gas phase DFT structures (MGT2, MGT3) were obtained for MGT,
of roughly equal energy. In the MD simulations for both the pure and mixed systems, the
dihedral between the α-CH and methyl group was found to be centered at 60˚, indicating
a single minimum on the solvated energy landscape. This structure lies roughly between
MGT2 and MGT3, and is represented by 52% MGT2 and 47% MGT3. Unlike with
MGD, the conformation of MGT was not found to be impacted by its depth from the
interface.
Surface Orientation of MGD
MD simulations containing 16 MGD (~ 1 M) were analyzed to determine the
average surface orientation of MGD. MGD was selected for orientation analysis on the
basis of its surface abundance, as inferred
from the experimental and calculated VSF
results (described below). Normalized
distributions of characteristic MGD bond
angles (with respect to the surface normal) are
shown in Appendix B Figure B2 for bulk (-10
Å) and the surface (0 Å) species. The three
bond angles analyzed are (a) the methyl
group; (b) the C=O group; and (c) the βC-αC
bond. The distributions show that at bulk
depths, there is an isotropic distribution for all
angles (i.e., no preferred orientation). At the
Figure 4.3. Percent abundance of the MGD conformers as a function of depth from the interface (Pure simulation with 16 MG molecules). MGD1 (circles), MGD2 (squares), MGD3 (diamonds) and MGD4 (triangles).
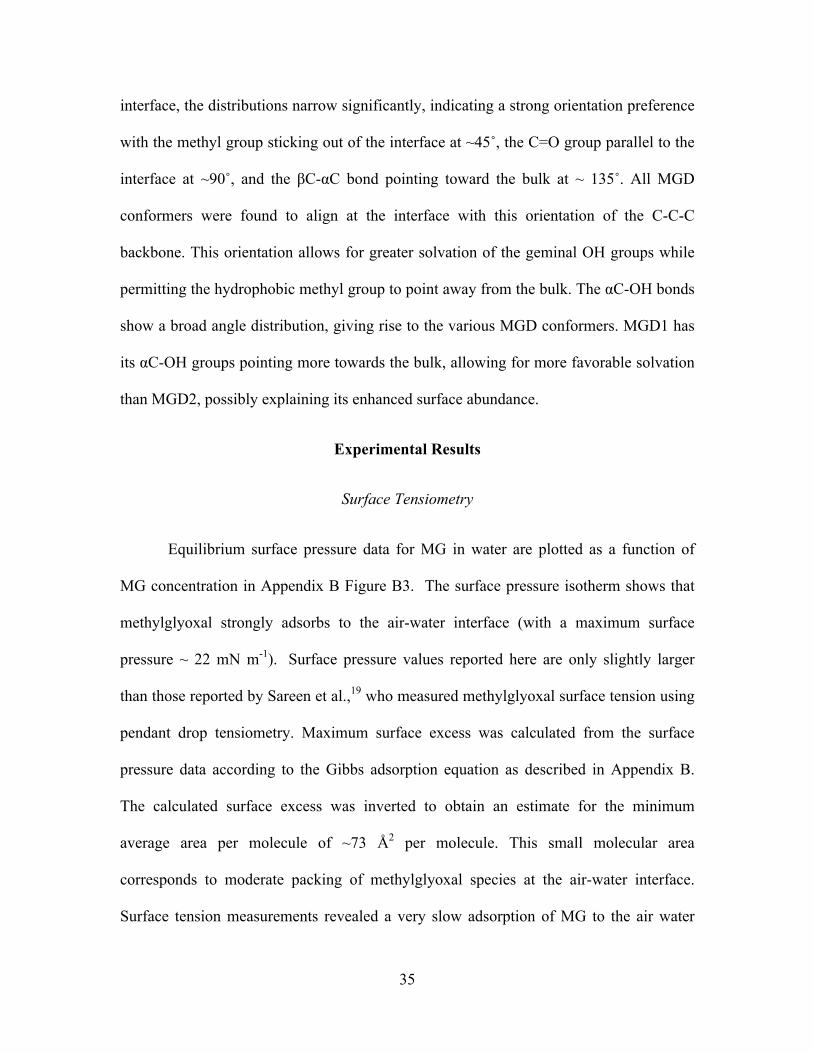
35
interface, the distributions narrow significantly, indicating a strong orientation preference
with the methyl group sticking out of the interface at ~45˚, the C=O group parallel to the
interface at ~90˚, and the βC-αC bond pointing toward the bulk at ~ 135˚. All MGD
conformers were found to align at the interface with this orientation of the C-C-C
backbone. This orientation allows for greater solvation of the geminal OH groups while
permitting the hydrophobic methyl group to point away from the bulk. The αC-OH bonds
show a broad angle distribution, giving rise to the various MGD conformers. MGD1 has
its αC-OH groups pointing more towards the bulk, allowing for more favorable solvation
than MGD2, possibly explaining its enhanced surface abundance.
Experimental Results
Surface Tensiometry
Equilibrium surface pressure data for MG in water are plotted as a function of
MG concentration in Appendix B Figure B3. The surface pressure isotherm shows that
methylglyoxal strongly adsorbs to the air-water interface (with a maximum surface
pressure ~ 22 mN m-1). Surface pressure values reported here are only slightly larger
than those reported by Sareen et al.,19 who measured methylglyoxal surface tension using
pendant drop tensiometry. Maximum surface excess was calculated from the surface
pressure data according to the Gibbs adsorption equation as described in Appendix B.
The calculated surface excess was inverted to obtain an estimate for the minimum
average area per molecule of ~73 Å2 per molecule. This small molecular area
corresponds to moderate packing of methylglyoxal species at the air-water interface.
Surface tension measurements revealed a very slow adsorption of MG to the air water
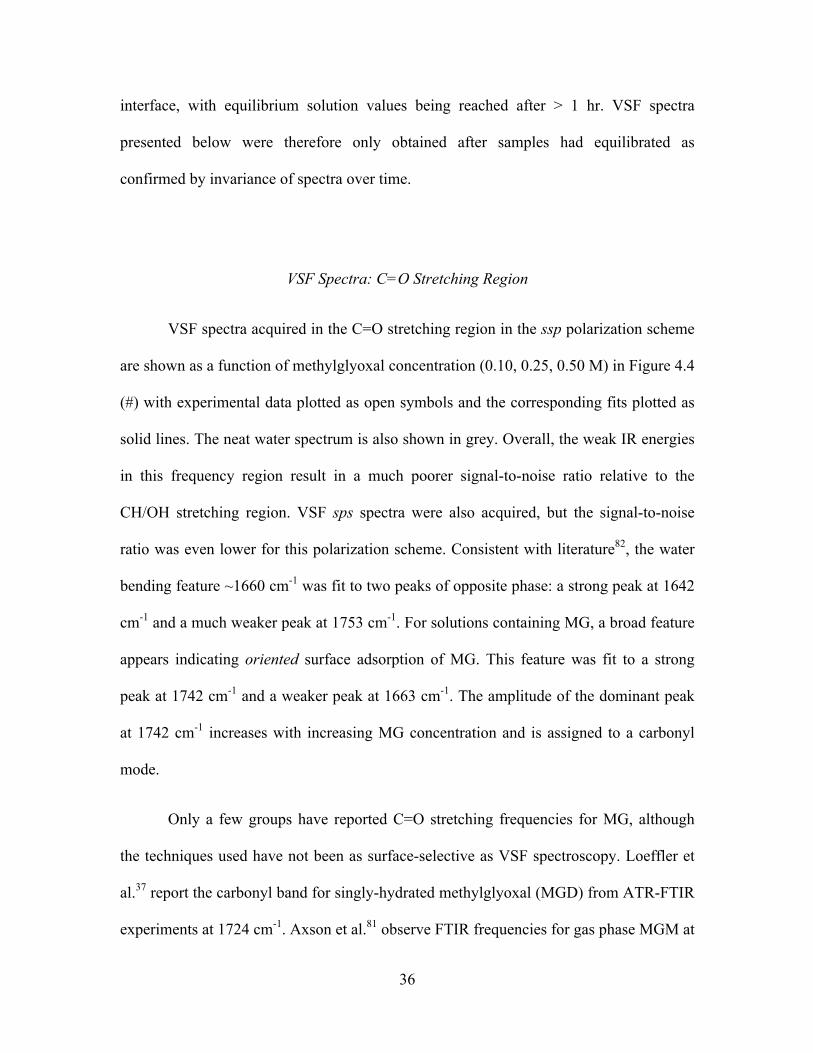
36
interface, with equilibrium solution values being reached after > 1 hr. VSF spectra
presented below were therefore only obtained after samples had equilibrated as
confirmed by invariance of spectra over time.
VSF Spectra: C=O Stretching Region
VSF spectra acquired in the C=O stretching region in the ssp polarization scheme
are shown as a function of methylglyoxal concentration (0.10, 0.25, 0.50 M) in Figure 4.4
(#) with experimental data plotted as open symbols and the corresponding fits plotted as
solid lines. The neat water spectrum is also shown in grey. Overall, the weak IR energies
in this frequency region result in a much poorer signal-to-noise ratio relative to the
CH/OH stretching region. VSF sps spectra were also acquired, but the signal-to-noise
ratio was even lower for this polarization scheme. Consistent with literature82, the water
bending feature ~1660 cm-1 was fit to two peaks of opposite phase: a strong peak at 1642
cm-1 and a much weaker peak at 1753 cm-1. For solutions containing MG, a broad feature
appears indicating oriented surface adsorption of MG. This feature was fit to a strong
peak at 1742 cm-1 and a weaker peak at 1663 cm-1. The amplitude of the dominant peak
at 1742 cm-1 increases with increasing MG concentration and is assigned to a carbonyl
mode.
Only a few groups have reported C=O stretching frequencies for MG, although
the techniques used have not been as surface-selective as VSF spectroscopy. Loeffler et
al.37 report the carbonyl band for singly-hydrated methylglyoxal (MGD) from ATR-FTIR
experiments at 1724 cm-1. Axson et al.81 observe FTIR frequencies for gas phase MGM at
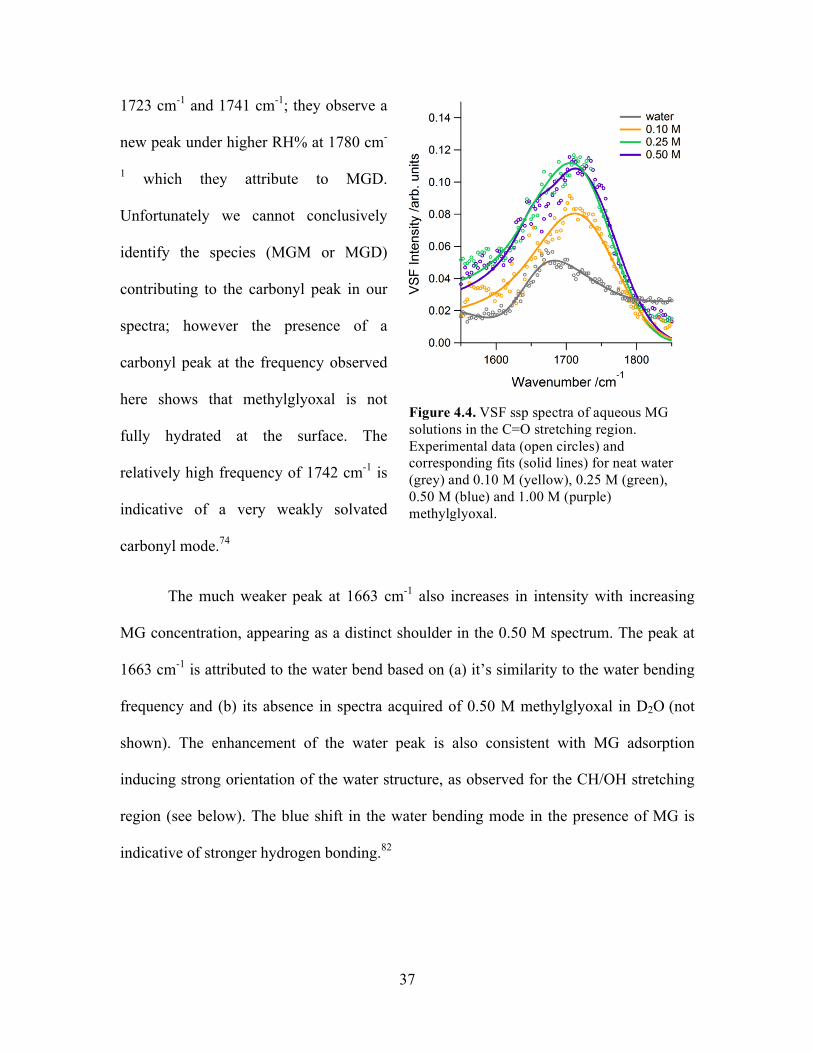
37
1723 cm-1 and 1741 cm-1; they observe a
new peak under higher RH% at 1780 cm-
1 which they attribute to MGD.
Unfortunately we cannot conclusively
identify the species (MGM or MGD)
contributing to the carbonyl peak in our
spectra; however the presence of a
carbonyl peak at the frequency observed
here shows that methylglyoxal is not
fully hydrated at the surface. The
relatively high frequency of 1742 cm-1 is
indicative of a very weakly solvated
carbonyl mode.74
The much weaker peak at 1663 cm-1 also increases in intensity with increasing
MG concentration, appearing as a distinct shoulder in the 0.50 M spectrum. The peak at
1663 cm-1 is attributed to the water bend based on (a) it’s similarity to the water bending
frequency and (b) its absence in spectra acquired of 0.50 M methylglyoxal in D2O (not
shown). The enhancement of the water peak is also consistent with MG adsorption
inducing strong orientation of the water structure, as observed for the CH/OH stretching
region (see below). The blue shift in the water bending mode in the presence of MG is
indicative of stronger hydrogen bonding.82
Figure 4.4. VSF ssp spectra of aqueous MG solutions in the C=O stretching region. Experimental data (open circles) and corresponding fits (solid lines) for neat water (grey) and 0.10 M (yellow), 0.25 M (green), 0.50 M (blue) and 1.00 M (purple) methylglyoxal.
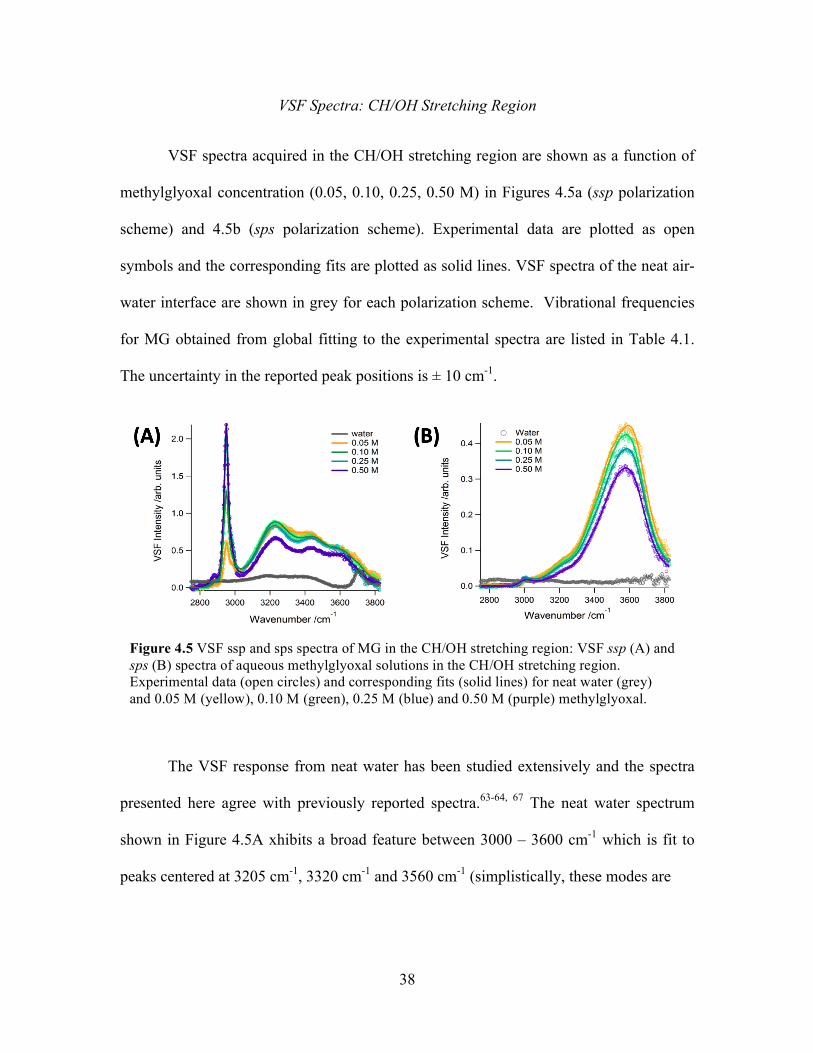
38
VSF Spectra: CH/OH Stretching Region
VSF spectra acquired in the CH/OH stretching region are shown as a function of
methylglyoxal concentration (0.05, 0.10, 0.25, 0.50 M) in Figures 4.5a (ssp polarization
scheme) and 4.5b (sps polarization scheme). Experimental data are plotted as open
symbols and the corresponding fits are plotted as solid lines. VSF spectra of the neat air-
water interface are shown in grey for each polarization scheme. Vibrational frequencies
for MG obtained from global fitting to the experimental spectra are listed in Table 4.1.
The uncertainty in the reported peak positions is ± 10 cm-1.
The VSF response from neat water has been studied extensively and the spectra
presented here agree with previously reported spectra.63-64, 67 The neat water spectrum
shown in Figure 4.5A xhibits a broad feature between 3000 – 3600 cm-1 which is fit to
peaks centered at 3205 cm-1, 3320 cm-1 and 3560 cm-1 (simplistically, these modes are
Figure 4.5 VSF ssp and sps spectra of MG in the CH/OH stretching region: VSF ssp (A) and sps (B) spectra of aqueous methylglyoxal solutions in the CH/OH stretching region. Experimental data (open circles) and corresponding fits (solid lines) for neat water (grey) and 0.05 M (yellow), 0.10 M (green), 0.25 M (blue) and 0.50 M (purple) methylglyoxal.
39
associated with coordinated OH oscillators in a hydrogen bonding continuum).63 The
sharp feature at ~3700 cm-1 corresponds to ‘free’ OH oscillators in the topmost molecular
layer. The weak VSF response from neat water in the sps polarization scheme is as
expected.83
Spectra of methylglyoxal solutions exhibit new features in the CH stretching
region at 2800 – 3000 cm-1. Global fitting over the concentration series revealed a
minimum of four distinct peaks at 2891 cm-1, 2936 cm-1, 2949 cm-1 and 2972 cm-1 in the
ssp polarization scheme (Figure 4.5A) and a single peak fit at 2988 cm-1 in the sps
polarization scheme (Figure 4.5B). The peak at 2891 cm-1 is assigned to the α-CH mode
of MGD; the remainder are assigned to methyl CH modes of MGD and MGT
conformers. Additionally, in both ssp and sps, a very strong, broad feature appears at
~3550 cm-1. This new feature can be fit to broad peaks of opposite phase: at 3544 cm-1
and 3540 cm-1 for ssp and at 3538 cm-1 and 3517 cm-1 for sps. These nascent peaks are
attributed to geminal OH groups of hydrated MG species. All peak assignments are
described in greater detail with the calculated VSF spectra, as discussed below.
In addition, spectra of methylglyoxal solutions exhibit increased intensity in the
coordinated water region ~3200 – 3400 cm-1 relative to neat water. Due to the presence of
water modes in this spectral region, it is difficult to decouple changes here due to water
modes or MG modes. VSF ssp spectra obtained by Johnson et al. of aqueous
acetaldehyde solutions also show enhanced intensity at ~3250 cm-1 relative to that of pure
acetaldehyde (although reduced relative to neat water). 84 Acetaldehyde undergoes a
single hydration in solution to form a gem-diol with a monohydrate fraction of ~0.7. The
authors suggest that the observed broad band at ~3250 cm-1 could be due either to the OH
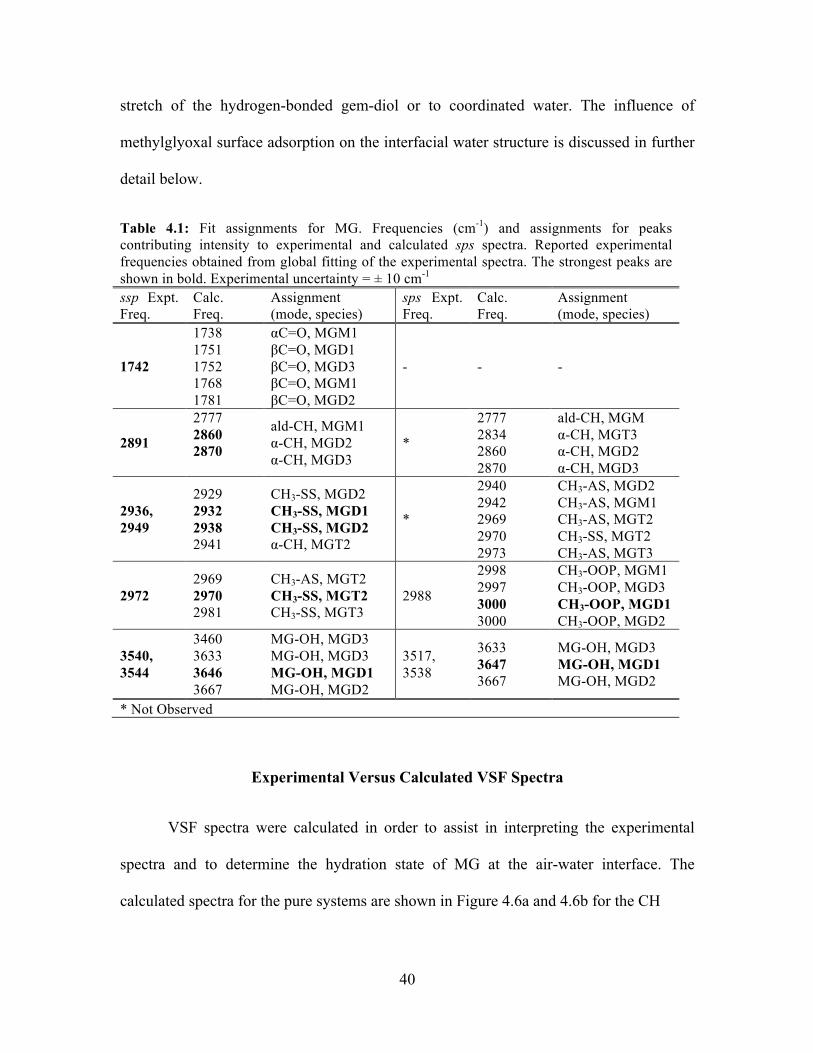
40
stretch of the hydrogen-bonded gem-diol or to coordinated water. The influence of
methylglyoxal surface adsorption on the interfacial water structure is discussed in further
detail below.
Table 4.1: Fit assignments for MG. Frequencies (cm-1) and assignments for peaks contributing intensity to experimental and calculated sps spectra. Reported experimental frequencies obtained from global fitting of the experimental spectra. The strongest peaks are shown in bold. Experimental uncertainty = ± 10 cm-1 ssp Expt. Freq.
Calc. Freq.
Assignment (mode, species)
sps Expt. Freq.
Calc. Freq.
Assignment (mode, species)
1742
1738 1751 1752 1768 1781
αC=O, MGM1 βC=O, MGD1 βC=O, MGD3 βC=O, MGM1 βC=O, MGD2
- - -
2891
2777 2860 2870
ald-CH, MGM1 α-CH, MGD2 α-CH, MGD3
*
2777 2834 2860 2870
ald-CH, MGM α-CH, MGT3 α-CH, MGD2 α-CH, MGD3
2936, 2949
2929 2932 2938 2941
CH3-SS, MGD2 CH3-SS, MGD1 CH3-SS, MGD2 α-CH, MGT2
*
2940 2942 2969 2970 2973
CH3-AS, MGD2 CH3-AS, MGM1 CH3-AS, MGT2 CH3-SS, MGT2 CH3-AS, MGT3
2972 2969 2970 2981
CH3-AS, MGT2 CH3-SS, MGT2 CH3-SS, MGT3
2988
2998 2997 3000 3000
CH3-OOP, MGM1 CH3-OOP, MGD3 CH3-OOP, MGD1 CH3-OOP, MGD2
3540, 3544
3460 3633 3646 3667
MG-OH, MGD3 MG-OH, MGD3 MG-OH, MGD1 MG-OH, MGD2
3517, 3538
3633 3647 3667
MG-OH, MGD3 MG-OH, MGD1 MG-OH, MGD2
* Not Observed
Experimental Versus Calculated VSF Spectra
VSF spectra were calculated in order to assist in interpreting the experimental
spectra and to determine the hydration state of MG at the air-water interface. The
calculated spectra for the pure systems are shown in Figure 4.6a and 4.6b for the CH
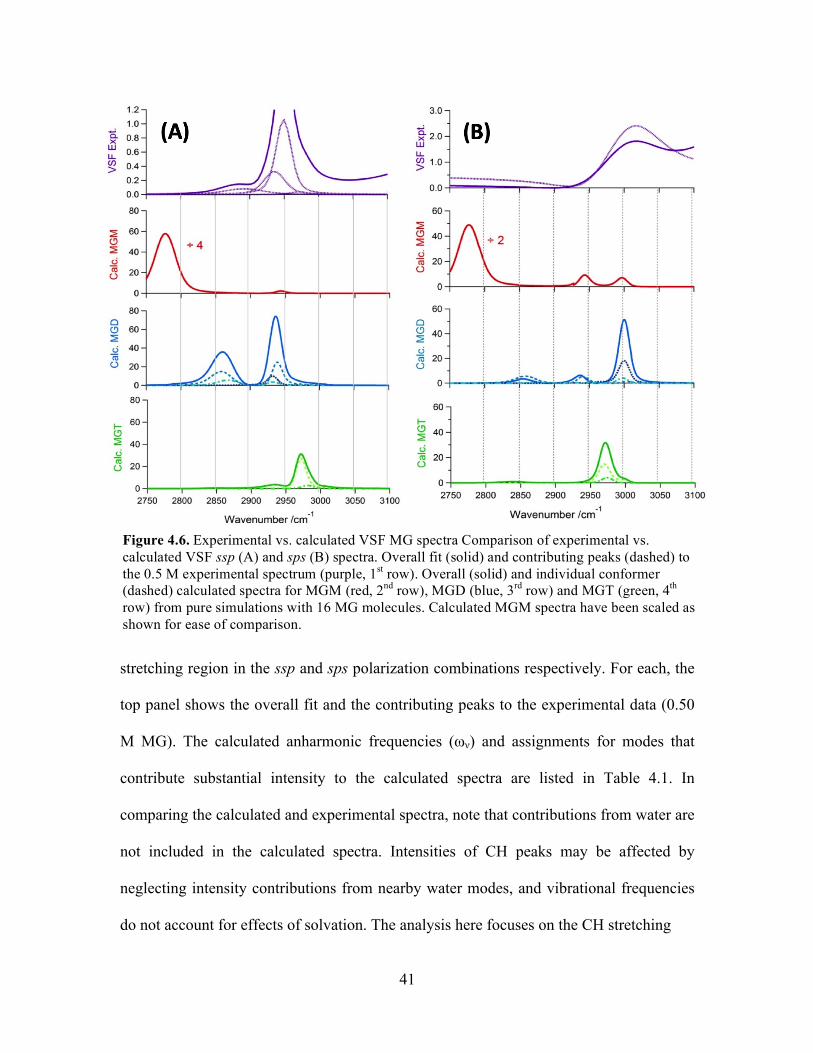
41
stretching region in the ssp and sps polarization combinations respectively. For each, the
top panel shows the overall fit and the contributing peaks to the experimental data (0.50
M MG). The calculated anharmonic frequencies (ων) and assignments for modes that
contribute substantial intensity to the calculated spectra are listed in Table 4.1. In
comparing the calculated and experimental spectra, note that contributions from water are
not included in the calculated spectra. Intensities of CH peaks may be affected by
neglecting intensity contributions from nearby water modes, and vibrational frequencies
do not account for effects of solvation. The analysis here focuses on the CH stretching
Figure 4.6. Experimental vs. calculated VSF MG spectra Comparison of experimental vs. calculated VSF ssp (A) and sps (B) spectra. Overall fit (solid) and contributing peaks (dashed) to the 0.5 M experimental spectrum (purple, 1st row). Overall (solid) and individual conformer (dashed) calculated spectra for MGM (red, 2nd row), MGD (blue, 3rd row) and MGT (green, 4th row) from pure simulations with 16 MG molecules. Calculated MGM spectra have been scaled as shown for ease of comparison.
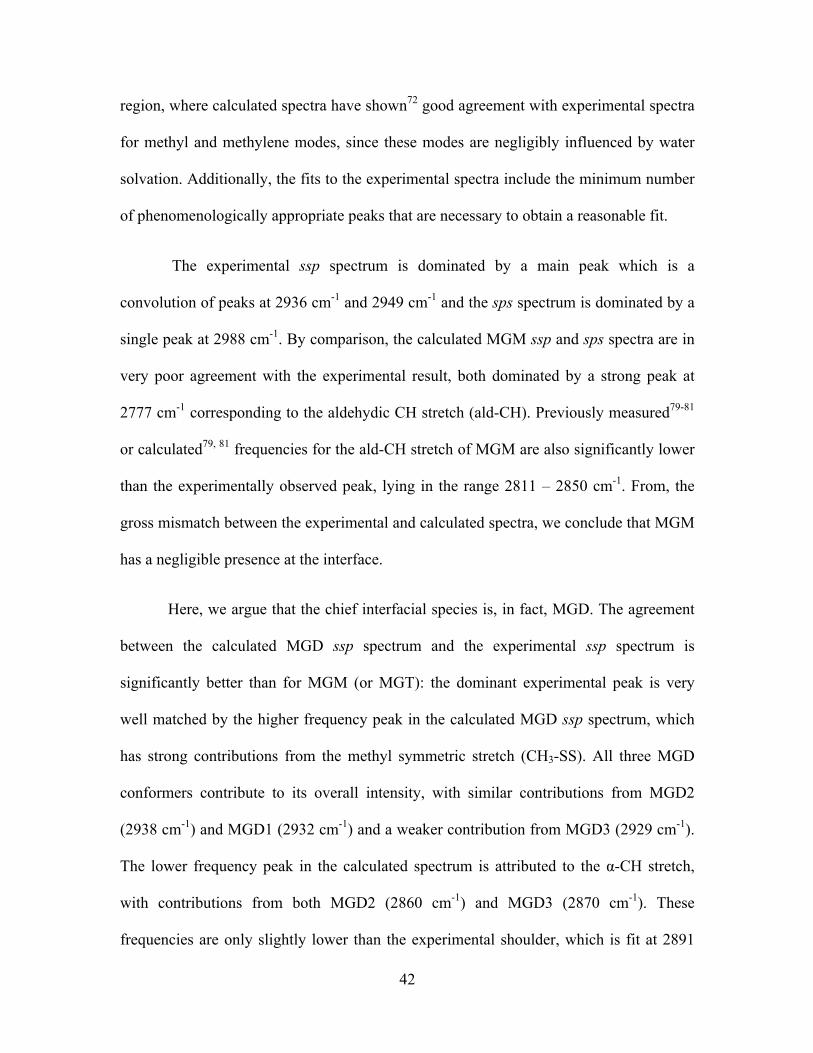
42
region, where calculated spectra have shown72 good agreement with experimental spectra
for methyl and methylene modes, since these modes are negligibly influenced by water
solvation. Additionally, the fits to the experimental spectra include the minimum number
of phenomenologically appropriate peaks that are necessary to obtain a reasonable fit.
The experimental ssp spectrum is dominated by a main peak which is a
convolution of peaks at 2936 cm-1 and 2949 cm-1 and the sps spectrum is dominated by a
single peak at 2988 cm-1. By comparison, the calculated MGM ssp and sps spectra are in
very poor agreement with the experimental result, both dominated by a strong peak at
2777 cm-1 corresponding to the aldehydic CH stretch (ald-CH). Previously measured79-81
or calculated79, 81 frequencies for the ald-CH stretch of MGM are also significantly lower
than the experimentally observed peak, lying in the range 2811 – 2850 cm-1. From, the
gross mismatch between the experimental and calculated spectra, we conclude that MGM
has a negligible presence at the interface.
Here, we argue that the chief interfacial species is, in fact, MGD. The agreement
between the calculated MGD ssp spectrum and the experimental ssp spectrum is
significantly better than for MGM (or MGT): the dominant experimental peak is very
well matched by the higher frequency peak in the calculated MGD ssp spectrum, which
has strong contributions from the methyl symmetric stretch (CH3-SS). All three MGD
conformers contribute to its overall intensity, with similar contributions from MGD2
(2938 cm-1) and MGD1 (2932 cm-1) and a weaker contribution from MGD3 (2929 cm-1).
The lower frequency peak in the calculated spectrum is attributed to the α-CH stretch,
with contributions from both MGD2 (2860 cm-1) and MGD3 (2870 cm-1). These
frequencies are only slightly lower than the experimental shoulder, which is fit at 2891
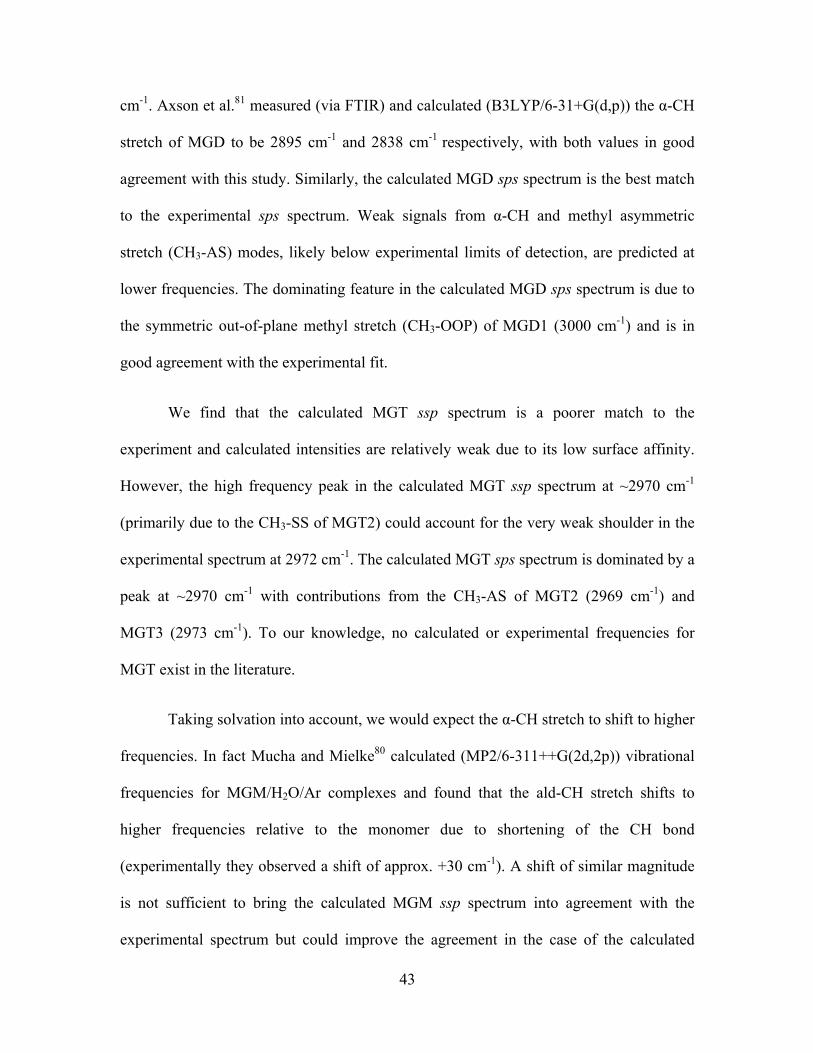
43
cm-1. Axson et al.81 measured (via FTIR) and calculated (B3LYP/6-31+G(d,p)) the α-CH
stretch of MGD to be 2895 cm-1 and 2838 cm-1 respectively, with both values in good
agreement with this study. Similarly, the calculated MGD sps spectrum is the best match
to the experimental sps spectrum. Weak signals from α-CH and methyl asymmetric
stretch (CH3-AS) modes, likely below experimental limits of detection, are predicted at
lower frequencies. The dominating feature in the calculated MGD sps spectrum is due to
the symmetric out-of-plane methyl stretch (CH3-OOP) of MGD1 (3000 cm-1) and is in
good agreement with the experimental fit.
We find that the calculated MGT ssp spectrum is a poorer match to the
experiment and calculated intensities are relatively weak due to its low surface affinity.
However, the high frequency peak in the calculated MGT ssp spectrum at ~2970 cm-1
(primarily due to the CH3-SS of MGT2) could account for the very weak shoulder in the
experimental spectrum at 2972 cm-1. The calculated MGT sps spectrum is dominated by a
peak at ~2970 cm-1 with contributions from the CH3-AS of MGT2 (2969 cm-1) and
MGT3 (2973 cm-1). To our knowledge, no calculated or experimental frequencies for
MGT exist in the literature.
Taking solvation into account, we would expect the α-CH stretch to shift to higher
frequencies. In fact Mucha and Mielke80 calculated (MP2/6-311++G(2d,2p)) vibrational
frequencies for MGM/H2O/Ar complexes and found that the ald-CH stretch shifts to
higher frequencies relative to the monomer due to shortening of the CH bond
(experimentally they observed a shift of approx. +30 cm-1). A shift of similar magnitude
is not sufficient to bring the calculated MGM ssp spectrum into agreement with the
experimental spectrum but could improve the agreement in the case of the calculated
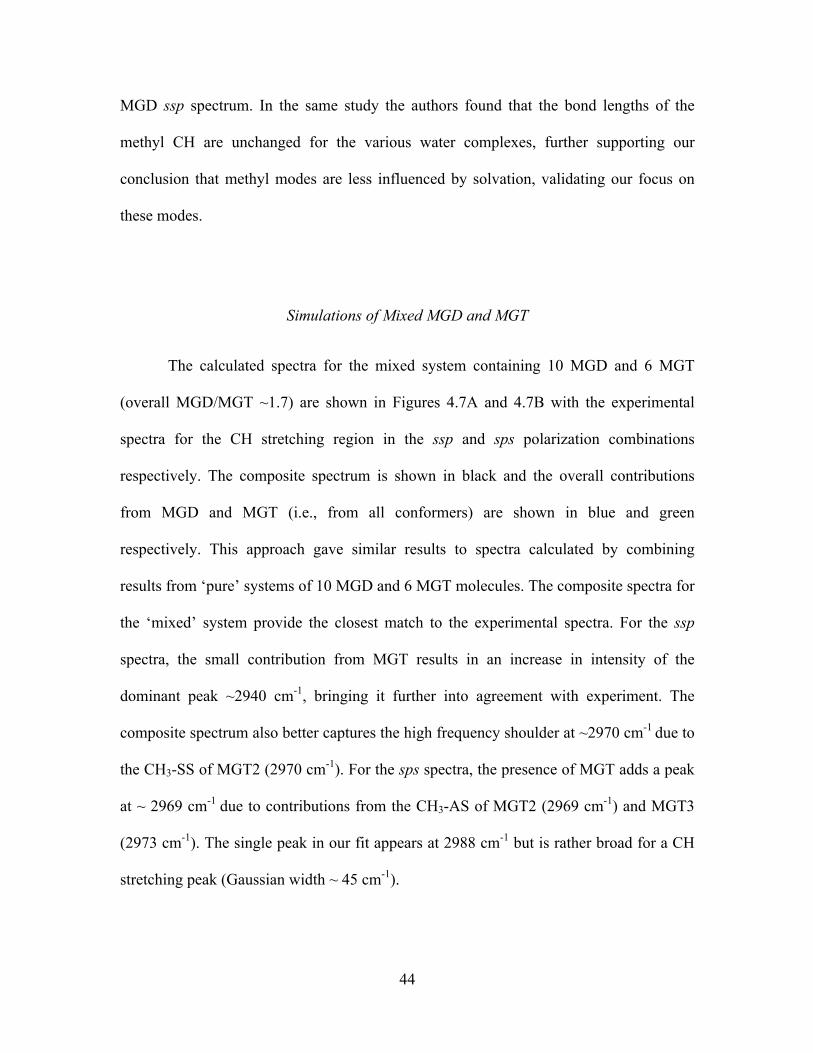
44
MGD ssp spectrum. In the same study the authors found that the bond lengths of the
methyl CH are unchanged for the various water complexes, further supporting our
conclusion that methyl modes are less influenced by solvation, validating our focus on
these modes.
Simulations of Mixed MGD and MGT
The calculated spectra for the mixed system containing 10 MGD and 6 MGT
(overall MGD/MGT ~1.7) are shown in Figures 4.7A and 4.7B with the experimental
spectra for the CH stretching region in the ssp and sps polarization combinations
respectively. The composite spectrum is shown in black and the overall contributions
from MGD and MGT (i.e., from all conformers) are shown in blue and green
respectively. This approach gave similar results to spectra calculated by combining
results from ‘pure’ systems of 10 MGD and 6 MGT molecules. The composite spectra for
the ‘mixed’ system provide the closest match to the experimental spectra. For the ssp
spectra, the small contribution from MGT results in an increase in intensity of the
dominant peak ~2940 cm-1, bringing it further into agreement with experiment. The
composite spectrum also better captures the high frequency shoulder at ~2970 cm-1 due to
the CH3-SS of MGT2 (2970 cm-1). For the sps spectra, the presence of MGT adds a peak
at ~ 2969 cm-1 due to contributions from the CH3-AS of MGT2 (2969 cm-1) and MGT3
(2973 cm-1). The single peak in our fit appears at 2988 cm-1 but is rather broad for a CH
stretching peak (Gaussian width ~ 45 cm-1).
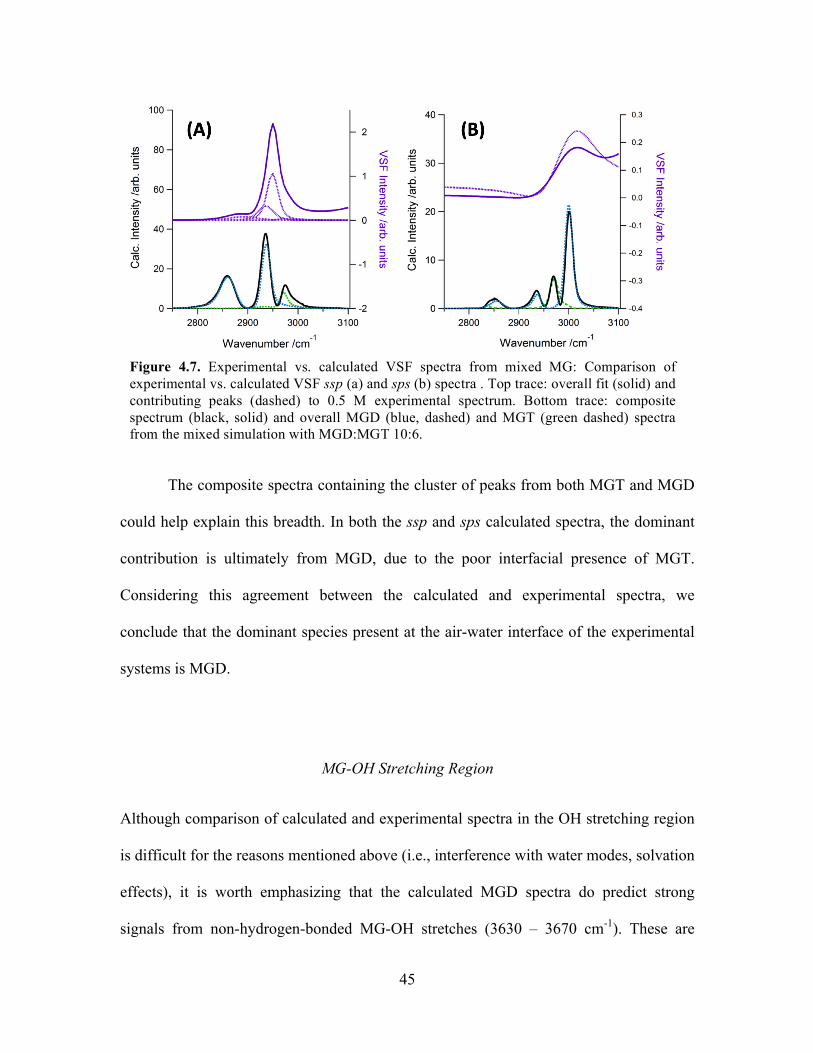
45
The composite spectra containing the cluster of peaks from both MGT and MGD
could help explain this breadth. In both the ssp and sps calculated spectra, the dominant
contribution is ultimately from MGD, due to the poor interfacial presence of MGT.
Considering this agreement between the calculated and experimental spectra, we
conclude that the dominant species present at the air-water interface of the experimental
systems is MGD.
MG-OH Stretching Region
Although comparison of calculated and experimental spectra in the OH stretching region
is difficult for the reasons mentioned above (i.e., interference with water modes, solvation
effects), it is worth emphasizing that the calculated MGD spectra do predict strong
signals from non-hydrogen-bonded MG-OH stretches (3630 – 3670 cm-1). These are
Figure 4.7. Experimental vs. calculated VSF spectra from mixed MG: Comparison of experimental vs. calculated VSF ssp (a) and sps (b) spectra . Top trace: overall fit (solid) and contributing peaks (dashed) to 0.5 M experimental spectrum. Bottom trace: composite spectrum (black, solid) and overall MGD (blue, dashed) and MGT (green dashed) spectra from the mixed simulation with MGD:MGT 10:6.
46
shown with the experimental spectra in Figures 4.8A and 4.8B in the ssp and sps
polarization combinations respectively. The MGD3 conformer is calculated to have an
(internal) hydrogen-bonded OH stretch at a lower frequency of 3460 cm-1 but this mode
does not contribute significantly to the calculated VSF spectra. As well, the relative
contribution from MGT OH modes is small, due to its weaker surface presence.
The calculated frequencies for the MG-OH vibrations are in good agreement with
previously calculated81 frequencies but lie to the blue-side of the experimental
frequencies obtained in this study (~ 3550 cm-1) and by a previous FTIR study (~3505
cm-1, 3585 cm-1). However, the frequencies of non-hydrogen-bonded gas phase MG-OH
modes would be expected to red-shift with solvation, bringing them into closer agreement
with the fitted peak frequencies. The broad Gaussian widths obtained from the
experimental fits (> 70 cm-1) are indicative of a wide range of solvation environments,
and probably also reflect the fact that multiple MG-OH modes contribute to this signal
Figure 4.8. Experimental vs. calculated VSF MG spectra in the CH/OH stretching region: Comparison of experimental vs. calculated VSF ssp (A) and sps (B) spectra. Overall fit (solid) and contributing peaks (dashed) to 0.5 M experimental spectrum (top panel, purple). Overall (solid) and individual conformer (dashed) calculated spectra for MGD (bottom panel, blue).
47
(i.e., from MGD and MGT and their various conformers, which contain two or four OH
groups respectively).
Methylglyoxal Surface Adsorption and Interfacial Structure
Due to the large number of overlapping peaks and the coherent interference from
nearby water modes, it is difficult to conclusively decouple MG and water contributions.
The following discussion on changes to the interfacial structure is not meant to be highly
quantitative but rather provide a qualitative picture of MG surface adsorption. Trends in
VSF intensities are obtained from the fitted amplitudes, but are generally clear from
visual inspection of the spectra; interpretation of the trends (to the extent provided here)
is not particularly sensitive to exact peak frequencies or assignments.
The appearance of MG features in the VSF spectra is indicative of oriented
surface adsorption of MG species, with the VSF intensities reflecting both surface
population and orientation. The VSF fitted amplitudes of the dominant CH3-SS peak
(~2949 cm-1 in ssp and ~2988 cm-1 in sps) are observed to concomitantly increase with
increasing bulk MG concentration, at least in part due to enhanced surface population of
MG, consistent with surface tensiometry measurements and calculated density profiles.
Increased surface packing of MG would also be expected to more strongly restrict the
orientation of the methyl group, giving rise to increased intensity. A restricted orientation
is reflected by its narrow angle distribution in the MD simulations.
The VSF fitted amplitudes of the MG-OH peaks follow a more complicated trend;
this is visually quite striking in the sps spectra where the intensity of the nascent MG-OH
48
peak at ~3550 cm-1 decreases with increasing bulk MG concentration. Given that the
surface pressure isotherm shows increased surface population over the full concentration
range studied, a decrease in VSF intensity is suggestive of a disordering of these modes at
higher surface coverages. In contrast to the increased alignment of the methyl groups, the
MG-OH groups exhibit increased disorder at higher MG surface coverages. The small
size of the OH moieties, the rotational freedom of the O-H bonds, and the greater
rotational freedom for the αC-βC bond to which the OH groups are attached, means
solvation considerations will dominate the orientational behavior. In this case, increased
surface packing appears to result in a solvation environment at the interface favoring
increased disorder of the MG-OH oscillators.
Influence on Water Structure
The free OH feature is greatly diminished for solutions containing methylglyoxal
(ssp spectra), although it is also obscured by the nearby MG-OH peaks. The reduction in
the free OH signal is consistent with methylglyoxal’s strong surface affinity and
moderate surface packing, as these oscillators are particularly sensitive to perturbations at
the air-water interface. Dramatic spectral changes in the coordinated water region
between 3200 – 3400 cm-1 are also observed upon addition of methylglyoxal; these
changes are most evident at the lowest MG surface coverages. VSF experiments
involving deuterated solvents and/or solutes are often employed in order to decouple
solvent and solute modes. Unfortunately this approach is not applicable in this case, due
to the fast exchange between water and geminal OH groups of methylglyoxal. In ssp, the
49
fitted amplitude of the coordinated water peaks at ~3200 cm-1 and ~3320 cm-1 are greatly
enhanced for 0.05 M solutions relative to neat water; the fitted amplitudes for all
coordinated water peaks are enhanced in sps (since they are essentially in the noise for
neat water). However, at higher bulk MG concentrations, the intensities of the
coordinated water peaks begin to decrease.
We conclude that a small amount of methylglyoxal induces enhanced ordering of
interfacial water molecules. Several factors could be contributing to this effect including
(a) an enhancement in the weak local electric field by surface-adsorbed MG and/or (b)
favorable H-bonding of interfacial water molecules with geminal OH groups of hydrated
MG species. The water peak at ~3200 cm-1, which is typically assigned to strongly H-
bound OH oscillators residing deeper in the interfacial region85 is more strongly enhanced
by small additions of MG than the other water peaks. This could indicate that MG
strengthens the H-bonding network of water. In both cases, increased ordering of
methylglyoxal would lead to increased ordering of interfacial water molecules while
decreased ordering would cause the opposite effect. The strong and narrow (Gaussian
width ~ 15 cm-1) CH3-SS peak observed in the ssp spectrum suggests that MG is, in fact,
strongly oriented at the surface; the analysis of angle distributions in the MD simulations
also supports this picture. The decrease in intensity of the water modes at higher bulk MG
concentrations is consistent with the aforementioned disordering of MG-OH groups at
higher MG surface coverages, which would weaken the local electric field and/or disrupt
the H-bonding network. However, even at the highest MG concentration studied (0.50
M), the intensity of the water peak at ~3200 cm-1 is enhanced relative to neat water.
Regardless of the underlying reason for the change (electric field effect and/or H-bonding
50
between MG and water), the spectra clearly show that MG adsorption has a strong
influence on the interfacial water structure. A change in water structure is also inferred
from changes in the C=O spectral region.
Conclusions
We have used a combined experimental and computational approach to
investigate methylglyoxal at the air-water interface. Together, surface tension, vibrational
sum frequency and classical molecular dynamics simulations show that methylglyoxal
exhibits an oriented adsorption to the air-water interface. Comparison of calculated and
experimental VSF spectra in the CH stretching region indicates that unhydrated
methylglyoxal monomer (MGM) is absent from the interface and that the dominant
surface species is singly hydrated methylglyoxal diol (MGD). The presence of both C=O
modes and strong geminal OH modes in the VSF spectra also point to MGD as the
dominant surface species. Furthermore, these observations show that methylglyoxal is
neither completely hydrated nor completely dehydrated at the interface. Moreover, MD
simulations reveal that the preferred MGD conformer is different at the surface than in
the bulk, with MGD1 (α-CH bond cis to the C=O bond) preferred at the surface. Density
profiles extracted from the mixed molecular dynamics simulation containing MGD and
MGT close to their bulk literature ratio of 1.5 indicate that the MGD/MGT ratio is
significantly enhanced at the air-water interface, with a surface MGD/MGT ratio ~4.5.
VSF spectra calculated from this mixed simulation are thus dominated by MGD features
and are a good match to experimental spectra. Focusing on the MGD species, the picture
51
that emerges is of a highly oriented interface with the hydrophobic methyl group pointing
out into the vapor phase and the geminal OH groups pointing down into the bulk. The
VSF spectra in the CH/OH stretching region and the C=O region indicate that this
oriented adsorption of methylglyoxal has a dramatic influence on the water structure at
the interface.
52
CHAPTER V
HYDROXYACETONE AT THE AIR-WATER INTERFACE
The contents of this chapter have been previously published in whole or in part. The text presented here has been modified from the publication below:
Gordon, B. P., Moore, F. G., Scatena, L. F., Valley, N. A., Wren, S. N., Richmond, G. L. Model Behavior: Characterization of Hydroxyacetone at the Air-Water Interface Using Experimental and Computational Vibrational Sum Frequency Spectroscopy. J. Phys. Chem. A 2018 122 (15), 3837-3849.
Bridge
Small atmospheric aldehydes and ketones are known to play a significant role in
the formation of secondary organic aerosols (SOA). However, many of them are difficult
to experimentally isolate, as they tend to form hydration and oligomer species.
Hydroxyacetone (HA) is unusual in this class as it contributes to SOA while existing
predominantly in its unhydrated monomeric form. This allows HA to serve as a valuable
model system for similar secondary organic carbonyls. In this paper the surface behavior
of HA at the air–water interface has been investigated using vibrational sum frequency
(VSF) spectroscopy and Wilhelmy plate surface tensiometry in combination with
computational molecular dynamics simulations and density functional theory
calculations. The experimental results demonstrate that HA has a high degree of surface
activity and is ordered at the interface. Furthermore, oriented water is observed at the
interface, even at high HA concentrations. Spectral features also reveal the presence of
both cis and trans HA conformers at the interface, in differing orientations. Molecular
dynamics results indicate conformer dependent shifts in HA orientation between the
53
subsurface (~5 Å deep) and surface. Together, these results provide a picture of a highly
dynamic, but statistically ordered interface composed of multiple HA conformers with
solvated water. These results have implications for HA’s behavior in aqueous particles,
which may affect its role in the atmosphere and SOA formation.
It is important to note that this data was collected following significant
improvements of the picosecond laser system. This resulted in superior signal-to-noise in
the VSF spectra compared with that of the previous chapter
Introduction
Small oxygenated volatile organic compounds (OVOCs) are ubiquitous in the
atmosphere and of great importance in secondary organic aerosol (SOA) formation.1-13
Yet, there still exist many uncertainties in the specific roles these small organics play in
the formation and consequent fate of SOA.13-17 Water-soluble aldehydes and ketones
have been of particular interest, due in part to their tendency to hydrate and oligomerize
upon partitioning into the aqueous phase.13, 18-35 Indeed, some of these organics (e.g.
glyoxal,24 methylglyoxal,18, 36 pyruvic acid31, 37) are unusual in that their most stable
forms in the aqueous phase are geminal diols, which are generally less stable than
unhydrated carbonyls. This tendency to form higher molecular weight species leads to
higher concentrations within aqueous aerosols than is predicted from Henry’s Law,
alone.1, 11, 16-17, 19, 38-39 Once in the particle phase, these species participate in further
oligomerization and oxidation reactions, thereby contributing to increased SOA mass,
referred to as aqueous phase processing.8, 18, 20-24, 27, 30-31, 34, 39-45
54
Since aerosols have a large surface area to volume ratio, the surface chemistry of
these particles can greatly influence their behavior and have far reaching effects on the
environment.1, 46-51 For example, it has been shown that surface interactions can strongly
effect the adsorptions of atmospheric gases to aqueous surfaces.47 Gaining a better
understanding of the aerosol air-water interface is an on-going area of research.13, 36, 45, 52-
55 However, experiments with carbonyl species are often complicated because subsequent
to purification (often, a challenge itself), exposure to water results in an equilibrium shift
into a continuum of hydration species, effectively generating a mixed organic system.18
Temperature, pH, and salinity can drive the hydration to favor one species, but each of
these perturbations also has its own effect on the system and particularly on surface
behavior.18, 26, 31, 52, 56 Furthermore, the ratio of different hydration species can be depth
dependent.36 Thus, a small carbonyl that is surface active, atmospherically relevant, and
unfavorable for either hydration or dimerization would serve as an invaluable model
system for studying how these organics behave at aerosol interfaces.
Hydroxyacetone (HA) is just such a system. HA has been the focus of work in
many fields due to its physiological, industrial, and astrochemical significance.1, 57-68 This
work focuses on HA’s role as a prevalent semi-volatile atmospheric hydroxycarbonyl.
HA has been observed experimentally in situ with other secondary organics known to
contribute to SOA formation.1 Some studies have identified HA as the most abundant
carbonyl species in aqueous SOA.1 HA is rather unique among these types of secondary
organics because while HA can also hydrate to form a geminal diol, this hydration has
been shown to be unfavorable. Glushonok et al. demonstrated that in the aqueous phase,
55
96-98% of HA exists in the unhydrated, monomeric carbonyl form with no covalently
bonded dimeric or polymeric species detected. 68
Although HA has been thoroughly examined in the gas, condensed (aqueous), and
solid phases using multiple spectroscopic techniques,1, 57-68 little to no work has been
done on the surface chemistry of HA at liquid interfaces. To elucidate the behavior and
conformational distribution of HA at the air-water interface, this study uses vibrational
sum frequency (VSF) spectroscopy, a surface specific technique, in combination with
surface tensiometry and computational methodologies. Of particular focus is the
conformer distribution and hydrogen-bonding environment of HA at the air-water
interface, as these properties have been shown to be phase dependent.59, 61-63, 65-67 By
characterizing the HA-neat water system, this work lays the groundwork for future
studies on more complicated mixed organic systems.
Experimental Methods
Vibrational Sum Frequency Spectroscopy
Vibrational sum frequency (VSF) spectroscopy is a nonlinear technique that is
inherently surface-selective and provides a convolution of orientation and population
information for anisotropically ordered, surface-active, noncentrosymmetric molecules.
This technique has been used extensively for the study of liquid interfaces.69-81 A sum
frequency signal is generated by overlapping a visible beam and a tunable-frequency IR
beam in time and space, producing a third beam at the sum of the incident frequencies.
The intensity of the VSF signal is proportional to the absolute square of the nonlinear
second-order macroscopic susceptibility (χ(2)). The second-order susceptibility has both
56
resonant (χRν(2)) and non-resonant, (χNR
(2)) components. The resonant portion of the VSF
response contains information about both the population and orientation of species
adsorbed at an interface. To deconvolve these numerous contributions, VSF spectra are
fit using equation 1:82-83
!(!) = !!"(!)!!! +!!!!"!!!(!!!!!/!!!)!
!! − !!" + !!!!!!
!
!!! (5.1)
The first term in Equation 1 is the nonresonant susceptibility, described by an
amplitude and phase, ψ. The second term defines contributions from the resonant second-
order susceptibility (χRν(2)) as the summation over all VSF active resonant vibrational
modes. Included in this resonant second-order susceptibility are the transition strength
(Aν), phases (φν), and terms describing the homogeneous line widths of the individual
molecular transitions (ΓL) as well as inhomogeneous broadening (Γν). The Lorentzian,
resonant modes and IR frequencies are defined as ωL, ων, and ωIR, respectively. Equation
1 is utilized for the fitting equation and spectral analysis of the VSF data, using mode
specific fixed Lorentzian widths modes (based on reported vibrational lifetimes of the
specific transition)84-88 for the CH (2 cm-1), coordinated OH and C=O (5 cm-1), and ‘free’
OH (12 cm-1).
VSF spectra discussed within are obtained using either the ssp or sps polarization
scheme, where the three letters denote the polarizations of the sum frequency, visible and
IR beams respectively. The ssp scheme probes molecular dipole components
perpendicular to the air-water interface while the sps scheme probes components parallel
to the interface.
57
Laser System
The picosecond laser system used to obtain the VSF results discussed here has
been described.36, 89-90 such that only a brief description is necessary for this work. A sum
frequency (SF) beam is generated by overlapping a fixed visible beam (12500 cm-1) with
a tunable IR beam at the air-water interface in a copropagating geometry at 45˚ and 60˚,
respectively, relative to the surface normal. The SF beam leaving the interface is
collected using a curved mirror set at its focal length and directed into a
thermoelectrically cooled CCD camera (Pixas, Princeton Instruments). A LabView
program measures the CCD intensity while scanning (3 cm-1 wavelength step) over the
tunable IR range between 4000 cm-1 to 1200 cm-1. The nonresonant SF response of an
uncoated gold substrate was measured daily for each data set, and used to normalize the
experimental spectra for VSF power. Daily calibration of the tunable IR beam was
performed by measuring the absorption of a polystyrene standard and fitting to the known
assignments. Spectra presented here are averages of ~6 or more spectra taken over
multiple days. The resolution of the VSF system used herein is ≅10 cm-1.
Shallow glass dishes (≥ 8mm depth) are utilized as sample cells and are cleaned
according to the rigorous protocol described in previous works.36, 89-90 The dishes are
placed on a vertically translatable stage. The stage is adjusted between each scan to
account for any evaporation. Care was taken to ensure that evaporation did not alter the
solution concentration. All VSF measurements were acquired at room temperature (~20
°C) under ambient conditions.
58
Surface Tensiometry
Contributions to the VSF signal from number density and molecular orientation
are decoupled experimentally through the use of Wilhelmy plate91 surface tensiometry
measurements. The force exerted on the plate by the solution is measured using a force
balance (KSV). Surface tensions (γ) are converted to surface pressures (π) by subtracting
the daily-measured surface tension of neat water. The platinum plate was cleaned and
rinsed repeatedly in 18.2 MΩ nanopure water and then dried under flame between
measurements. All measurements were recorded under ambient conditions at room
temperature (~20 °C).
It is worth noting that the surface tension versus time measurements reveal an
extremely slow adsorption of HA to the interface. Equilibrium values occur after > 5
hours with a slowed increase over the next 24 hrs. This slow equilibration time is not
unexpected as it has been observed in similar systems such as aqueous methylglyoxal.36,
39 Further note that VSF itself is an extremely sensitive probe of interfacial contaminants
and that no evidence of contamination was observed. For this reason, VSF spectra were
obtained after each sample had equilibrated (for at least two hours) confirmed by the
invariance of VSF results over time.
Sample Preparation
Aqueous HA solutions (0.1 – 5M) were prepared volumetrically by diluting HA
stock solution (90 wt% in H2O, Sigma Aldrich) in nanopure (18.2 MΩ) water. Since HA
is extremely hydroscopic, the impurities contributing to the other 10% are attributed to
59
solvated water.62-63, 65 Solutions were prepared ≥ 24h before use and stored in Pyrex
flasks.
Computational Methods
A combination of computational techniques are used to generate calculated VSF
spectra. In addition to simulating spectra, the analysis also extracts structural details
about the system, such as density profiles, as well as depth-resolved orientation and
conformation information, which are vital in helping to understand the behavior of the
system. This methodology is ideal because it is both computational efficient for the
systems of interest and highly adaptable. This approach has been shown to be robust for
numerous and varied chemical systems when compared with experimental spectra.36, 89-97
Classical Molecular Dynamics
Classical molecular dynamics (MD) simulations were performed using the Amber
12 suite of programs,98 using parameters and force fields derived in the same manner as
in previous studies.92-93 PACKMOL99 was used to create starting configurations. In each
simulation, a specific number of HA and water molecules were arranged to form a 30 Å
cube within a 30 Å x 120 Å x 30 Å simulation box, with periodic boundary conditions,
forming a water slab with two surfaces. To preserve the volume of the system within the
larger simulation box, as the number of HA molecules increased the number of water
molecules was decreased, maintaining a total of ~2700 atoms. Simulations were
performed for configurations of 1, 2, 4, 8, 16, 32, 80, and 160 HA molecules,
corresponding to concentrations of ~0.05, 0.1, 0.25, 0.5, 1, 2, 5, and 10 M HA,
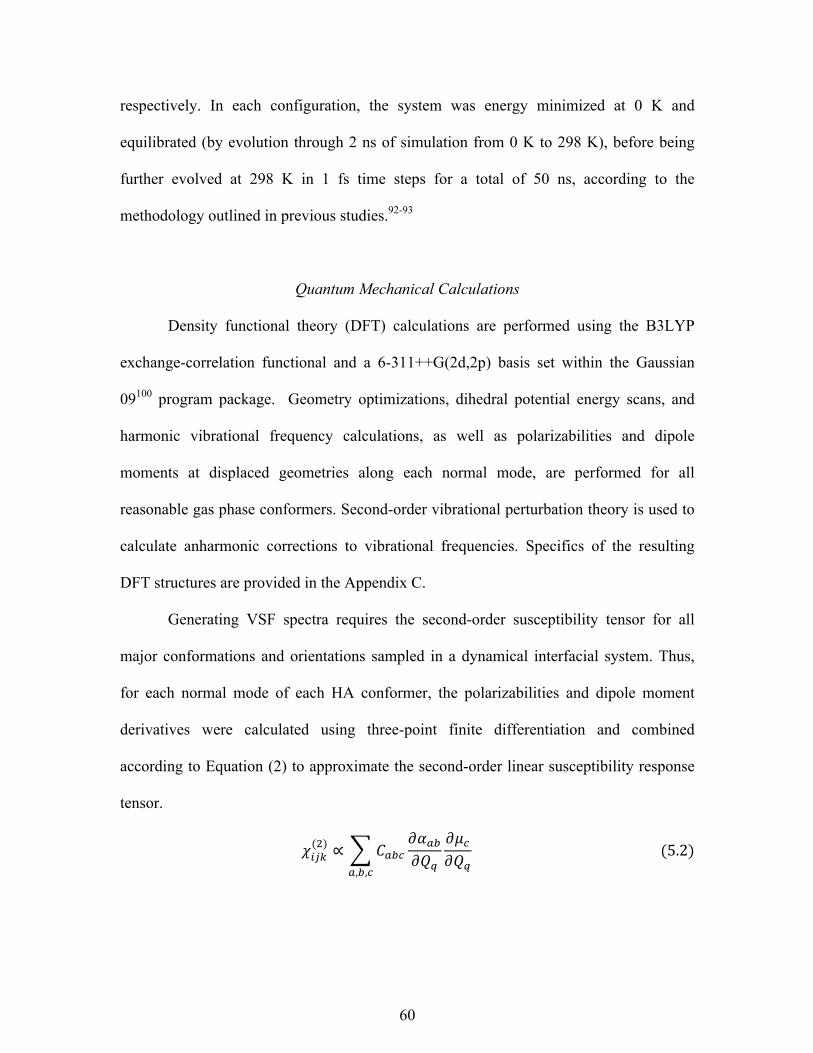
60
respectively. In each configuration, the system was energy minimized at 0 K and
equilibrated (by evolution through 2 ns of simulation from 0 K to 298 K), before being
further evolved at 298 K in 1 fs time steps for a total of 50 ns, according to the
methodology outlined in previous studies.92-93
Quantum Mechanical Calculations
Density functional theory (DFT) calculations are performed using the B3LYP
exchange-correlation functional and a 6-311++G(2d,2p) basis set within the Gaussian
09100 program package. Geometry optimizations, dihedral potential energy scans, and
harmonic vibrational frequency calculations, as well as polarizabilities and dipole
moments at displaced geometries along each normal mode, are performed for all
reasonable gas phase conformers. Second-order vibrational perturbation theory is used to
calculate anharmonic corrections to vibrational frequencies. Specifics of the resulting
DFT structures are provided in the Appendix C.
Generating VSF spectra requires the second-order susceptibility tensor for all
major conformations and orientations sampled in a dynamical interfacial system. Thus,
for each normal mode of each HA conformer, the polarizabilities and dipole moment
derivatives were calculated using three-point finite differentiation and combined
according to Equation (2) to approximate the second-order linear susceptibility response
tensor.
!!"#(!) ∝ !!"#!!!"!!!
!!!!!!!,!,!
(5.2)
61
Here, α is the molecular polarizability, µ is the dipole moment, Qq, is the normal
coordinate of the mode q, and C is a geometrical factor relating the molecular and
laboratory reference frames.
Using an in-house code,97 VSF intensities and phases were then calculated by
inspecting the second-order susceptibility tensor and assigning the static gas phase DFT
structures with the molecular orientations and conformations populated in the MD
simulations. The calculated intensities were empirically broadened using Lorentzian and
Gaussian widths informed by the experimental VSF spectral fits.
Experimental VSF Spectra
VSF spectra were acquired for neat water and a series of HA concentrations (0.1,
0.25, 0.50, 1, and 2 M) in the ssp and sps polarizations for the COH/CH bending, C=O
stretching, and CH/OH stretching regions. For clarity, a subset of these solutions (0.25,
0.5 and 2M, along with neat water) is shown in Figure 5.1. Spectra of the full
concentration series are provided in the Appendix C, along with a description of the neat
water VSF spectra. The strong VSF response in each spectral region confirms that HA
has a high degree of surface activity and is oriented at the interface. As shown in Figure
5.1, features associated with CH and C=O modes grow in above the neat water spectra
with increasing HA concentration, [HA]. The spectra shown in Figure 5.1 also contain
contributions from oriented water at the interface, complicating their interpretation.
Spectra of HA in D2O were acquired in the COH/CH bending and C=O stretching
regions (Figure 5.2) to help isolate and confirm the assignment of water and COH modes.
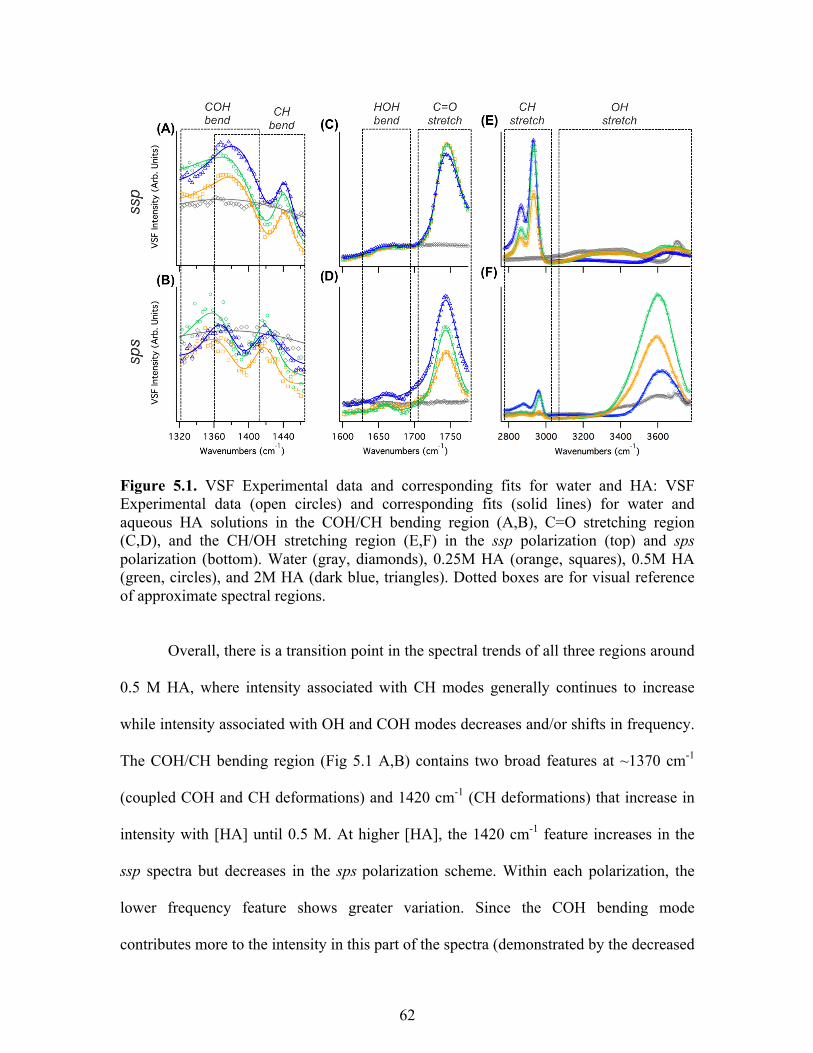
62
Figure 5.1. VSF Experimental data and corresponding fits for water and HA: VSF Experimental data (open circles) and corresponding fits (solid lines) for water and aqueous HA solutions in the COH/CH bending region (A,B), C=O stretching region (C,D), and the CH/OH stretching region (E,F) in the ssp polarization (top) and sps polarization (bottom). Water (gray, diamonds), 0.25M HA (orange, squares), 0.5M HA (green, circles), and 2M HA (dark blue, triangles). Dotted boxes are for visual reference of approximate spectral regions.
Overall, there is a transition point in the spectral trends of all three regions around
0.5 M HA, where intensity associated with CH modes generally continues to increase
while intensity associated with OH and COH modes decreases and/or shifts in frequency.
The COH/CH bending region (Fig 5.1 A,B) contains two broad features at ~1370 cm-1
(coupled COH and CH deformations) and 1420 cm-1 (CH deformations) that increase in
intensity with [HA] until 0.5 M. At higher [HA], the 1420 cm-1 feature increases in the
ssp spectra but decreases in the sps polarization scheme. Within each polarization, the
lower frequency feature shows greater variation. Since the COH bending mode
contributes more to the intensity in this part of the spectra (demonstrated by the decreased
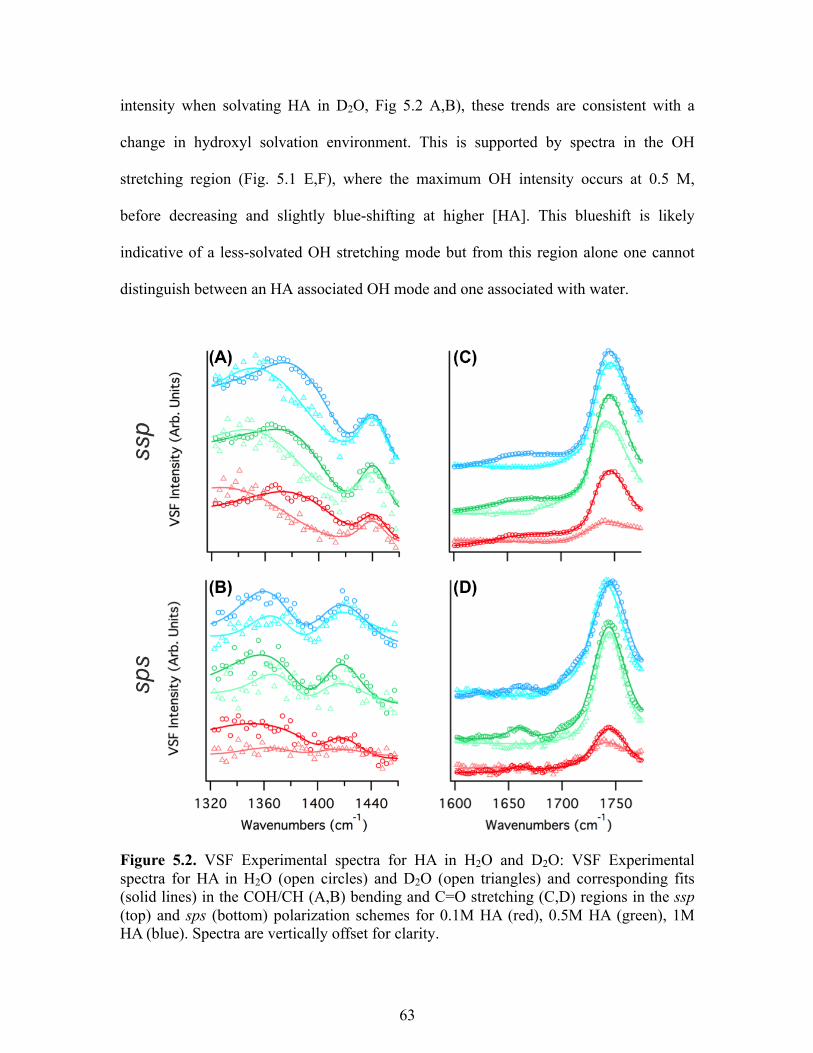
63
intensity when solvating HA in D2O, Fig 5.2 A,B), these trends are consistent with a
change in hydroxyl solvation environment. This is supported by spectra in the OH
stretching region (Fig. 5.1 E,F), where the maximum OH intensity occurs at 0.5 M,
before decreasing and slightly blue-shifting at higher [HA]. This blueshift is likely
indicative of a less-solvated OH stretching mode but from this region alone one cannot
distinguish between an HA associated OH mode and one associated with water.
Figure 5.2. VSF Experimental spectra for HA in H2O and D2O: VSF Experimental spectra for HA in H2O (open circles) and D2O (open triangles) and corresponding fits (solid lines) in the COH/CH (A,B) bending and C=O stretching (C,D) regions in the ssp (top) and sps (bottom) polarization schemes for 0.1M HA (red), 0.5M HA (green), 1M HA (blue). Spectra are vertically offset for clarity.
64
In the CH stretching region (Fig. 5.1E,F), there are two dominant bands of
intensity present in both ssp and sps polarizations. These features are around ~2900 cm-1
and ~2950 cm-1 respectively. Their likely origins are discussed later in this paper. They
increase in amplitude with increasing [HA] until 0.5 M. Above that concentration, the
~2900 cm-1 feature continues to rise with [HA], but the ~2950 cm-1 feature plateaus. In
the C=O stretching region (Fig. 5.1C,D), the carbonyl mode at ~1745 cm-1 increases with
[HA] above 0.5 M in the sps polarization, while decreasing in the ssp polarization.
Some of these changes can be simply explained by a loss of water from the
interface with increasing HA surface coverage. Yet, it is interesting to note that water is
not completely excluded above 0.5 M HA, as evidenced by the continued presence of
interfacial water modes. In Figures 5.1 C and D, in addition to the intense C=O stretching
mode (~1745 cm-1), there is also a low intensity feature centered around ~1650 cm-1,
which is attributed the bending mode of water.69, 101-103 This assignment is confirmed by
the loss of the feature when solvating HA in D2O (Fig. 5.2 A,B). The persistence of some
interfacial water at higher [HA] is not unexpected given the well-known hygroscopicity
of HA.62-63, 65
This interfacial water can have significant spectral implications, as shown by
further analysis of the C=O stretching mode (Fig. 5.2 C,D). Initial fitting of the main
feature to a single carbonyl mode yielded peak positions of ~1742 and ~1752 cm-1 for the
ssp and sps polarizations respectively. These assignments are somewhat implausible,
since they are higher frequencies than any of the gas phase IR or Raman literature
assignments.62-63, 65 However allowing a second feature of opposite phase resulted in
more plausible frequency positions at ~1725 cm-1 (negative phase, more H-bonded) and
65
~1737 cm-1 (positive phase, less H-bonded). These fits also suggest that the apparent
frequency shift between polarization schemes is due to differing relative intensities of the
two C=O stretching modes. If correct, such fits imply the existence of either carbonyl
moieties in more than one solvation environment and/or more than one conformation. To
investigate this further computational studies were pursued. (discussed further below).
However, variations in water content, alone, cannot explain why spectral features
arising from relatively solvation-insensitive CH stretching and bending modes do not
increase concomitantly with increasing [HA]. The complexity of the system is further
highlighted by attempts to fit the two main features in the CH stretching region, which
are shown in greater detail in Figure 5.3. Comparing the VSF spectra of the same [HA] in
each polarization scheme reveals a shift in peak position of both features. Following the
typical fitting protocol of using the minimum number of peaks, it is possible to fit these
features to only two modes, but the fit does not converge to the same frequency positions
between polarizations and yields implausibly high Gaussian broadenings. In fact, the full-
width-half-max (FWHM) of these features are > 45 cm-1, significantly higher than would
be expected from singular a CH stretching mode, which are generally more on the order
of ~10 cm-1. 80 The shift in peak position, combined with the broad FWHM, signifies
spectral congestion arising from the overlap of multiple CH stretching modes and/or
environments that contribute to each of the two observed features.
The spectral congestion in this region could potentially be due to the presence of
more than one HA conformer at the interface, and as previously mentioned, additional
HA conformers could also explain the pair of carbonyls modes found in the C=O
stretching region. The conformational distribution of HA has been the focus of many of
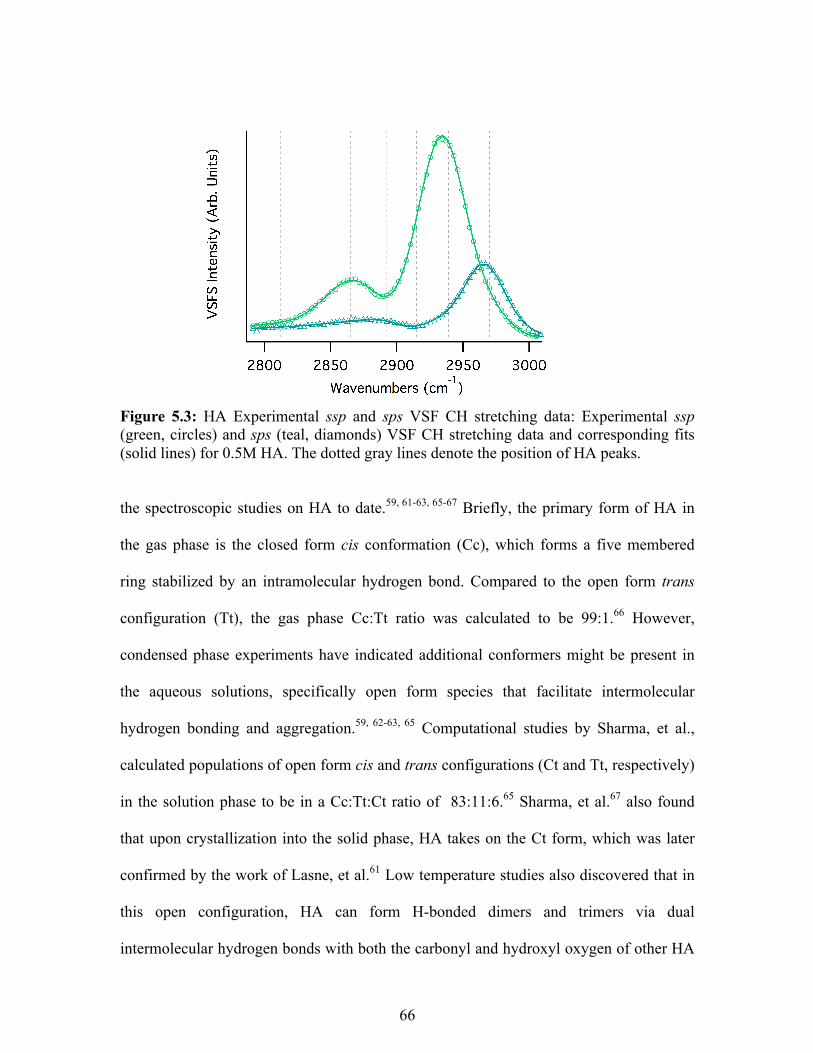
66
Figure 5.3: HA Experimental ssp and sps VSF CH stretching data: Experimental ssp (green, circles) and sps (teal, diamonds) VSF CH stretching data and corresponding fits (solid lines) for 0.5M HA. The dotted gray lines denote the position of HA peaks.
the spectroscopic studies on HA to date.59, 61-63, 65-67 Briefly, the primary form of HA in
the gas phase is the closed form cis conformation (Cc), which forms a five membered
ring stabilized by an intramolecular hydrogen bond. Compared to the open form trans
configuration (Tt), the gas phase Cc:Tt ratio was calculated to be 99:1.66 However,
condensed phase experiments have indicated additional conformers might be present in
the aqueous solutions, specifically open form species that facilitate intermolecular
hydrogen bonding and aggregation.59, 62-63, 65 Computational studies by Sharma, et al.,
calculated populations of open form cis and trans configurations (Ct and Tt, respectively)
in the solution phase to be in a Cc:Tt:Ct ratio of 83:11:6.65 Sharma, et al.67 also found
that upon crystallization into the solid phase, HA takes on the Ct form, which was later
confirmed by the work of Lasne, et al.61 Low temperature studies also discovered that in
this open configuration, HA can form H-bonded dimers and trimers via dual
intermolecular hydrogen bonds with both the carbonyl and hydroxyl oxygen of other HA
67
molecules.67 This implies the potential for multiple solvation environments per
conformer.
Examining each vibrational mode in both polarization schemes and D2O
uncovered some of the complexities of HA at the air-water interface. In particular, the
systematic shift in the spectral behavior above 0.5 M HA and the presence of multiple
HA conformations. Nonetheless, uncertainty in the assignments of the underlying modes
precludes using the experimental fits for further spectral analysis without more
information. To address outstanding concerns about the interfacial conformations and
orientations of HA, complementary experimental and computational techniques are
employed. The information gained from these techniques provides the context necessary
to understand the interfacial trends giving rise to the experimental VSF spectra.
Experimental Surface Tensiometry
Equilibrium surface pressure data for aqueous solutions (0.1 to 5 M) are plotted in
Figure 5.4A. The surface pressure data follow a Langmuir isotherm indicating adsorption
of HA at the air-water interface: at lower [HA], the surface pressure increases linearly
until ~0.5M, when it begins to plateau at ~21 mN m-1 as the maximum surface excess of
is approached. Surface pressure values reported here are similar to the ~ 22 mN m-1
value observed for methylglyoxal,36 whose dominant diol form has a structure quite
similar to HA. Maximum surface excess was calculated from the surface pressure data
according to the Gibbs adsorption equation, as previously described.36, 90, 104 An estimate
for the minimum average area per molecule of HA was found to be ~80 Å2 mol-1 (again,
comparable to the 73 Å2 per molecule calculated for methylglyoxal). For a molecule the
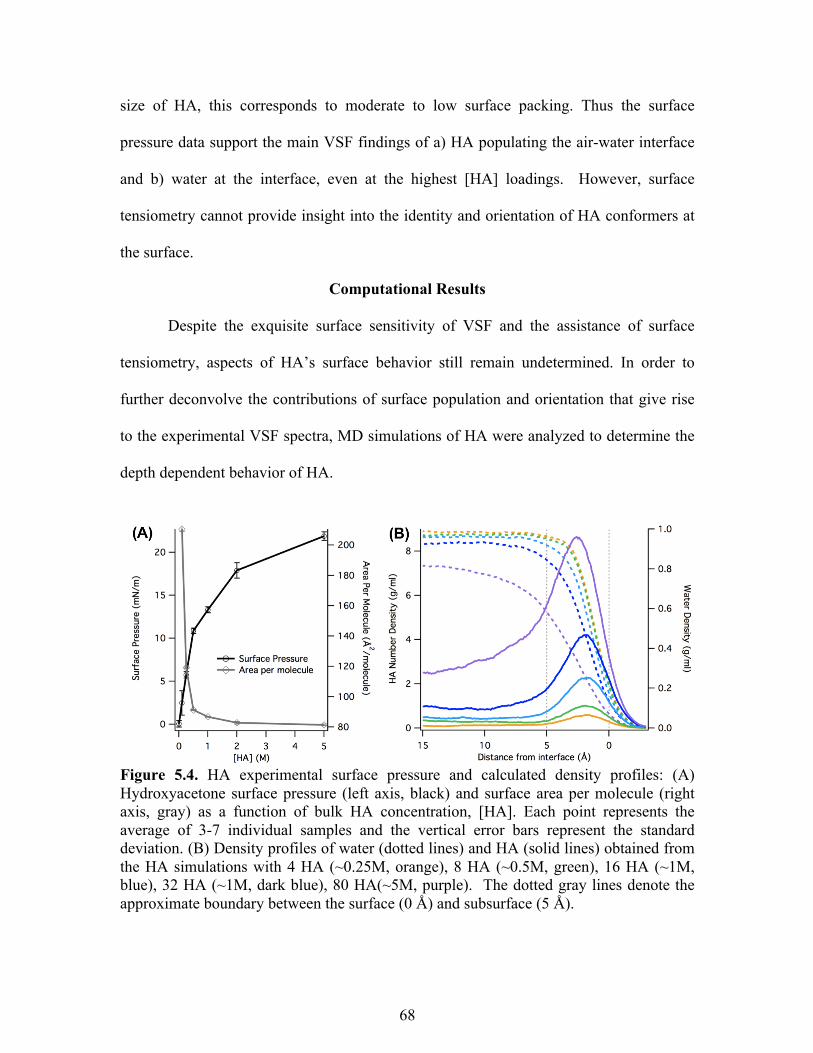
68
size of HA, this corresponds to moderate to low surface packing. Thus the surface
pressure data support the main VSF findings of a) HA populating the air-water interface
and b) water at the interface, even at the highest [HA] loadings. However, surface
tensiometry cannot provide insight into the identity and orientation of HA conformers at
the surface.
Computational Results
Despite the exquisite surface sensitivity of VSF and the assistance of surface
tensiometry, aspects of HA’s surface behavior still remain undetermined. In order to
further deconvolve the contributions of surface population and orientation that give rise
to the experimental VSF spectra, MD simulations of HA were analyzed to determine the
depth dependent behavior of HA.
Figure 5.4. HA experimental surface pressure and calculated density profiles: (A) Hydroxyacetone surface pressure (left axis, black) and surface area per molecule (right axis, gray) as a function of bulk HA concentration, [HA]. Each point represents the average of 3-7 individual samples and the vertical error bars represent the standard deviation. (B) Density profiles of water (dotted lines) and HA (solid lines) obtained from the HA simulations with 4 HA (~0.25M, orange), 8 HA (~0.5M, green), 16 HA (~1M, blue), 32 HA (~1M, dark blue), 80 HA(~5M, purple). The dotted gray lines denote the approximate boundary between the surface (0 Å) and subsurface (5 Å).
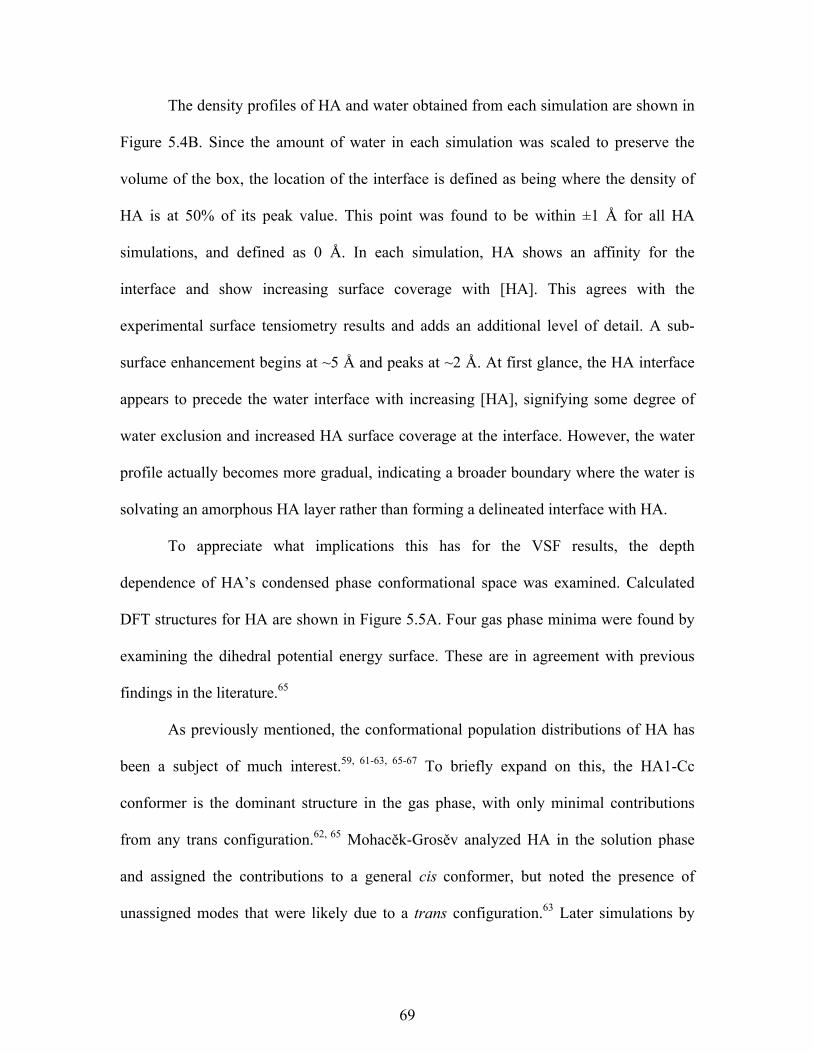
69
The density profiles of HA and water obtained from each simulation are shown in
Figure 5.4B. Since the amount of water in each simulation was scaled to preserve the
volume of the box, the location of the interface is defined as being where the density of
HA is at 50% of its peak value. This point was found to be within ±1 Å for all HA
simulations, and defined as 0 Å. In each simulation, HA shows an affinity for the
interface and show increasing surface coverage with [HA]. This agrees with the
experimental surface tensiometry results and adds an additional level of detail. A sub-
surface enhancement begins at ~5 Å and peaks at ~2 Å. At first glance, the HA interface
appears to precede the water interface with increasing [HA], signifying some degree of
water exclusion and increased HA surface coverage at the interface. However, the water
profile actually becomes more gradual, indicating a broader boundary where the water is
solvating an amorphous HA layer rather than forming a delineated interface with HA.
To appreciate what implications this has for the VSF results, the depth
dependence of HA’s condensed phase conformational space was examined. Calculated
DFT structures for HA are shown in Figure 5.5A. Four gas phase minima were found by
examining the dihedral potential energy surface. These are in agreement with previous
findings in the literature.65
As previously mentioned, the conformational population distributions of HA has
been a subject of much interest.59, 61-63, 65-67 To briefly expand on this, the HA1-Cc
conformer is the dominant structure in the gas phase, with only minimal contributions
from any trans configuration.62, 65 Mohacěk-Grosěv analyzed HA in the solution phase
and assigned the contributions to a general cis conformer, but noted the presence of
unassigned modes that were likely due to a trans configuration.63 Later simulations by
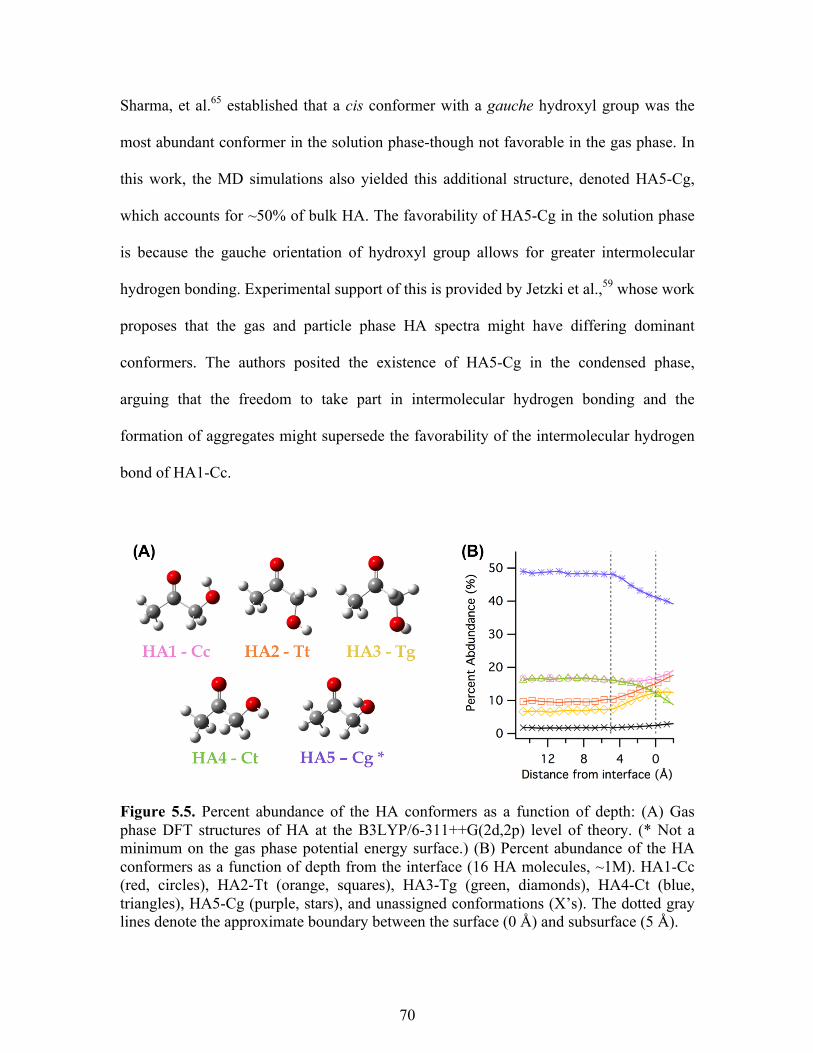
70
Sharma, et al.65 established that a cis conformer with a gauche hydroxyl group was the
most abundant conformer in the solution phase-though not favorable in the gas phase. In
this work, the MD simulations also yielded this additional structure, denoted HA5-Cg,
which accounts for ~50% of bulk HA. The favorability of HA5-Cg in the solution phase
is because the gauche orientation of hydroxyl group allows for greater intermolecular
hydrogen bonding. Experimental support of this is provided by Jetzki et al.,59 whose work
proposes that the gas and particle phase HA spectra might have differing dominant
conformers. The authors posited the existence of HA5-Cg in the condensed phase,
arguing that the freedom to take part in intermolecular hydrogen bonding and the
formation of aggregates might supersede the favorability of the intermolecular hydrogen
bond of HA1-Cc.
Figure 5.5. Percent abundance of the HA conformers as a function of depth: (A) Gas phase DFT structures of HA at the B3LYP/6-311++G(2d,2p) level of theory. (* Not a minimum on the gas phase potential energy surface.) (B) Percent abundance of the HA conformers as a function of depth from the interface (16 HA molecules, ~1M). HA1-Cc (red, circles), HA2-Tt (orange, squares), HA3-Tg (green, diamonds), HA4-Ct (blue, triangles), HA5-Cg (purple, stars), and unassigned conformations (X’s). The dotted gray lines denote the approximate boundary between the surface (0 Å) and subsurface (5 Å).
71
The MD simulations support the presence of multiple conformers at the interface.
Figure 5.5B illustrates how the relative abundance of the five conformers varies as a
function of depth from the interface. Little change was observed at different simulation
concentrations, so only the results for the HA 16 (~1M) simulation are presented. Note
that while HA5-Cg is the most abundant conformer for both the bulk and interface, its
relative abundance decreases slightly near the interface (as does HA4-Ct, to a lesser
extent). This is consistent with HA5-Cg not being a stable gas phase conformer and with
HA4-Ct being the least energetically favorable in gas phase. At ~5 Å these two
conformers decline in abundance, while the two trans conformers, HA2-Tt and HA3-Tg,
begin to increase. This is the same depth at which the sub-surface enhancement was
observed in the density profiles (Fig. 5.4B), supporting that this change in preference is
surface mediated. Intriguingly, HA5-Cg is still the dominant conformer at the interface
(accounting for ~40%); the relative abundance of the remaining conformers tracks more
closely to their gas phase hierarchy (with HA1-Cc, the dominant gas phase conformer,
leading at ~20%). The ratio between the most abundant cis and trans conformers (HA5-
Cg and HA2-Tt, respectively) is higher in the bulk (~5:1) than at the interface (~3:1),
further emphasizing the behavior changes at the interface.
The depth dependent orientation of HA was analyzed in each simulation to
determine average distributions of specific bond angles (with respect to the surface
normal) within each 1 Å slice of the box (Figure 5.6). It is important to emphasize that
the aqueous HA interface is highly dynamic and that these are very much statistical
averages. As such, the peak of the distribution signifies a preference to tend towards that
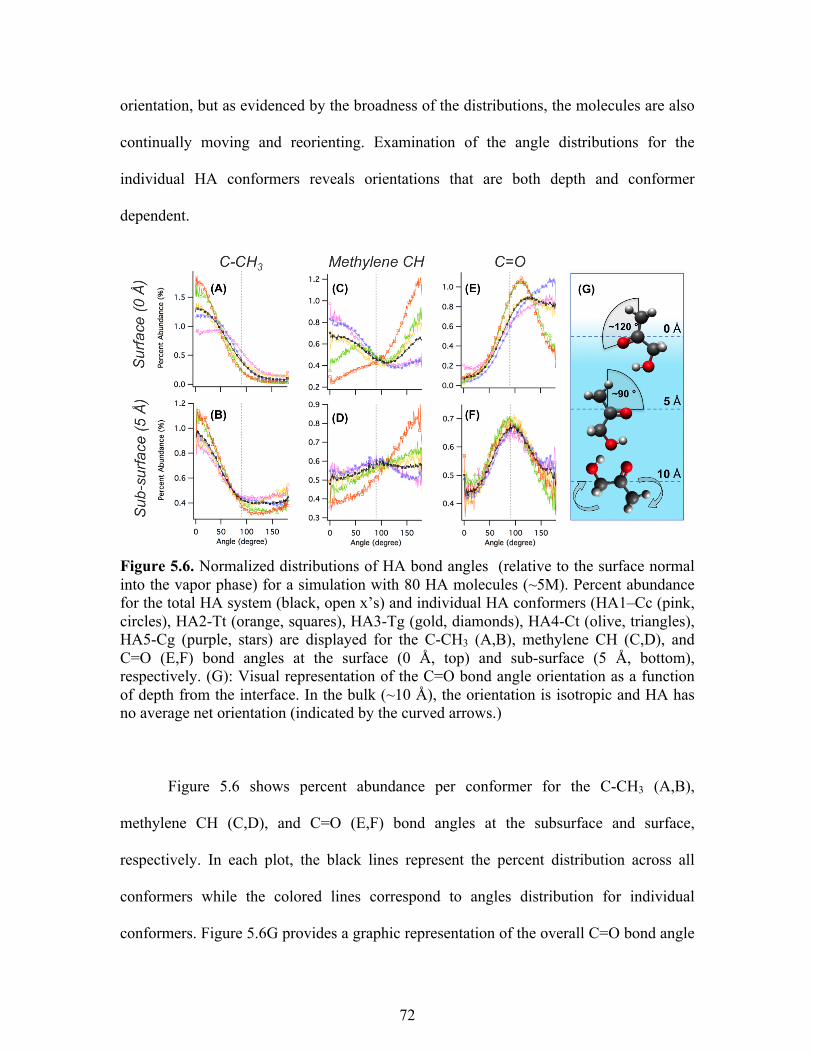
72
orientation, but as evidenced by the broadness of the distributions, the molecules are also
continually moving and reorienting. Examination of the angle distributions for the
individual HA conformers reveals orientations that are both depth and conformer
dependent.
Figure 5.6. Normalized distributions of HA bond angles (relative to the surface normal into the vapor phase) for a simulation with 80 HA molecules (~5M). Percent abundance for the total HA system (black, open x’s) and individual HA conformers (HA1–Cc (pink, circles), HA2-Tt (orange, squares), HA3-Tg (gold, diamonds), HA4-Ct (olive, triangles), HA5-Cg (purple, stars) are displayed for the C-CH3 (A,B), methylene CH (C,D), and C=O (E,F) bond angles at the surface (0 Å, top) and sub-surface (5 Å, bottom), respectively. (G): Visual representation of the C=O bond angle orientation as a function of depth from the interface. In the bulk (~10 Å), the orientation is isotropic and HA has no average net orientation (indicated by the curved arrows.)
Figure 5.6 shows percent abundance per conformer for the C-CH3 (A,B),
methylene CH (C,D), and C=O (E,F) bond angles at the subsurface and surface,
respectively. In each plot, the black lines represent the percent distribution across all
conformers while the colored lines correspond to angles distribution for individual
conformers. Figure 5.6G provides a graphic representation of the overall C=O bond angle
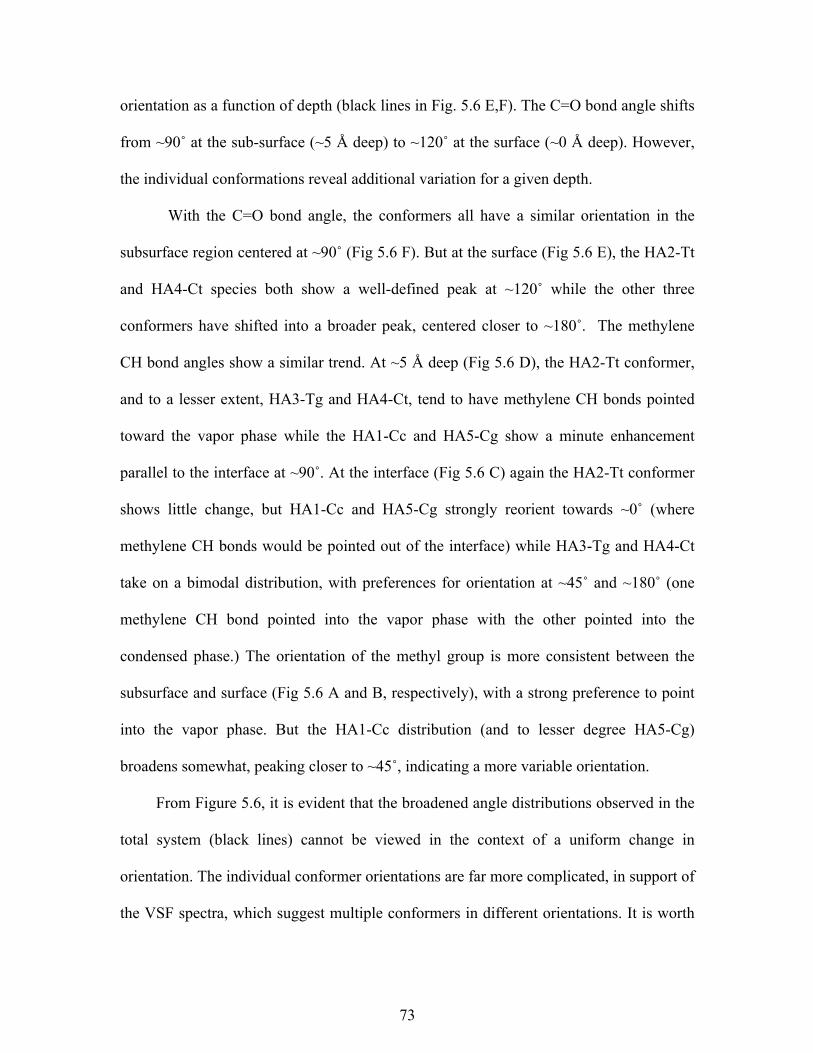
73
orientation as a function of depth (black lines in Fig. 5.6 E,F). The C=O bond angle shifts
from ~90˚ at the sub-surface (~5 Å deep) to ~120˚ at the surface (~0 Å deep). However,
the individual conformations reveal additional variation for a given depth.
With the C=O bond angle, the conformers all have a similar orientation in the
subsurface region centered at ~90˚ (Fig 5.6 F). But at the surface (Fig 5.6 E), the HA2-Tt
and HA4-Ct species both show a well-defined peak at ~120˚ while the other three
conformers have shifted into a broader peak, centered closer to ~180˚. The methylene
CH bond angles show a similar trend. At ~5 Å deep (Fig 5.6 D), the HA2-Tt conformer,
and to a lesser extent, HA3-Tg and HA4-Ct, tend to have methylene CH bonds pointed
toward the vapor phase while the HA1-Cc and HA5-Cg show a minute enhancement
parallel to the interface at ~90˚. At the interface (Fig 5.6 C) again the HA2-Tt conformer
shows little change, but HA1-Cc and HA5-Cg strongly reorient towards ~0˚ (where
methylene CH bonds would be pointed out of the interface) while HA3-Tg and HA4-Ct
take on a bimodal distribution, with preferences for orientation at ~45˚ and ~180˚ (one
methylene CH bond pointed into the vapor phase with the other pointed into the
condensed phase.) The orientation of the methyl group is more consistent between the
subsurface and surface (Fig 5.6 A and B, respectively), with a strong preference to point
into the vapor phase. But the HA1-Cc distribution (and to lesser degree HA5-Cg)
broadens somewhat, peaking closer to ~45˚, indicating a more variable orientation.
From Figure 5.6, it is evident that the broadened angle distributions observed in the
total system (black lines) cannot be viewed in the context of a uniform change in
orientation. The individual conformer orientations are far more complicated, in support of
the VSF spectra, which suggest multiple conformers in different orientations. It is worth
74
noting that the HA4-Ct conformer tracks more closely with the HA2-Tt conformer than
with the other two cis conformers, whereas the HA3-Tt conformer tends to fall
somewhere between the others. This indicates that the C-C-O-H dihedral (lower case
letter) has a larger role in the interfacial orientation of HA than the O=C-C-O dihedral
(capital letter). Since external hydrogen bonding is the factor most likely to involve the
orientation of the OH group, this arrangement signifies a tendency for HA to form
ordered hydrogen-bonded aggregates at the interface, as has been proposed in the
literature.59, 62, 65
Figure 5.7. Depth variation in concentration dependent C=O bond angle: The concentration dependence in the C=O bond angle orientation for (A) the bulk (10 Å), (B) the sub-surface (5 Å), and (C) the surface (0 Å, bottom), for simulations with 8 HA (~0.5M) (green) and 80 HA (~5M) (purple).
Intuitively, one might expect this tendency to aggregate to be amplified with
increasing [HA]: as HA further populates the interface, more water is in turn excluded
and other HA molecules become more abundant for aggregation. This increased HA
population also creates additional favorable ways for HA orient itself, as indicated in
Figure 5.7 by the broadening of the angle distributions at higher [HA]. This could explain
some of changes in intensity with [HA] observed in the experimental VSF spectra.
75
Application of Computational Results with Spectral Interpretations
The results discussed in the previous section provide a deeper understanding of
the depth, concentration, and conformation dependent population and orientation
dynamics of HA. Here the experimental VSF spectra can be reconsidered in context of
these findings and agreement with calculated VSF spectra. Assessment of calculated VSF
spectra enable further analysis by decoupling the spectral contributions arising from each
HA conformer and providing insight into how these contributions convolve together to
produce the overall spectrum. It is important to note that the current implementation of
the methodology does not include contributions to the experimental intensity arising from
water. Additionally, only contributions from fundamental vibrations are calculated, so
intensity from any Fermi Resonance, overtone or combination bands is excluded. Barring
these limitations, the calculated spectra are able to reproduce the experimental VSF data
for spectral regions arising from fundamental modes that are insensitive to solvation as
previously demonstrated.36, 89-90, 92, 97
Figure 5.8 shows both experimental and calculated 1M HA spectra in two
different vibrational regions (CO stretching and CH stretching) and for both polarizations
schemes (ssp and sps). The blue (topmost) traces in A,B,E,F are the experimental results
for 1M HA in H2O. Directly beneath each of these are the spectral individual
contributions calculated for each of the five individual HA conformers (colored traces)
plus the calculated total spectrum (black). In both polarizations and for each region, the
calculated spectra are a good overall match to experiment.
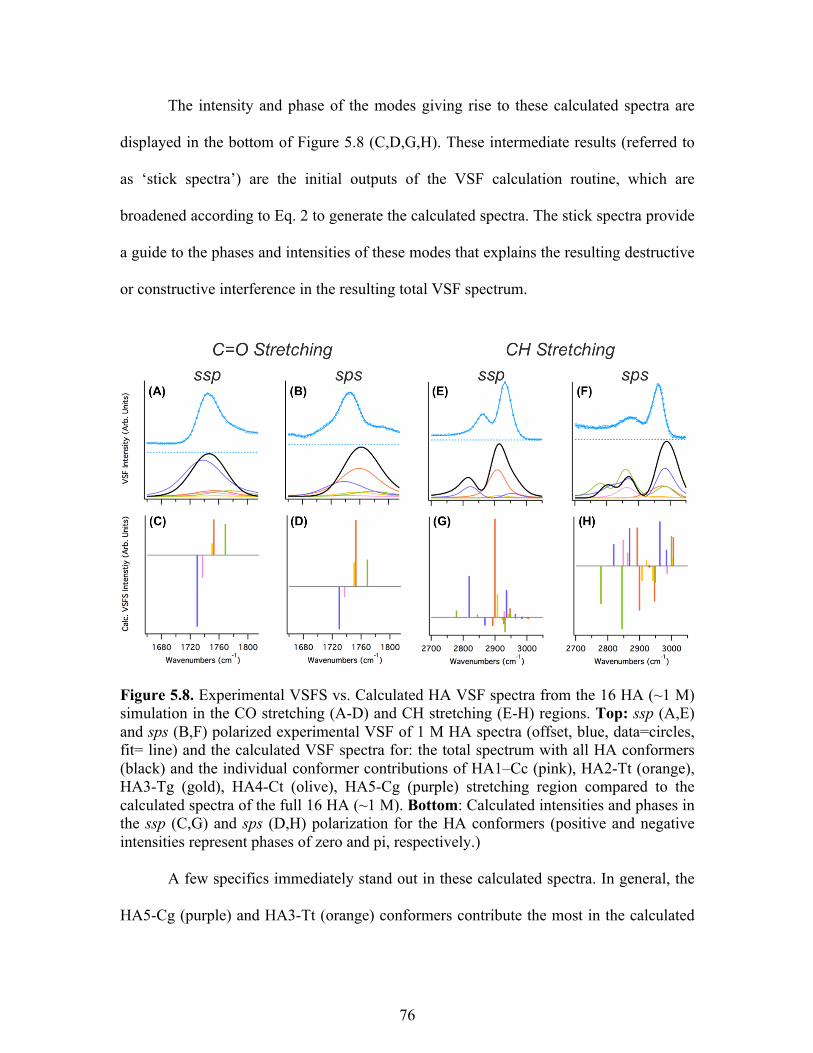
76
The intensity and phase of the modes giving rise to these calculated spectra are
displayed in the bottom of Figure 5.8 (C,D,G,H). These intermediate results (referred to
as ‘stick spectra’) are the initial outputs of the VSF calculation routine, which are
broadened according to Eq. 2 to generate the calculated spectra. The stick spectra provide
a guide to the phases and intensities of these modes that explains the resulting destructive
or constructive interference in the resulting total VSF spectrum.
Figure 5.8. Experimental VSFS vs. Calculated HA VSF spectra from the 16 HA (~1 M) simulation in the CO stretching (A-D) and CH stretching (E-H) regions. Top: ssp (A,E) and sps (B,F) polarized experimental VSF of 1 M HA spectra (offset, blue, data=circles, fit= line) and the calculated VSF spectra for: the total spectrum with all HA conformers (black) and the individual conformer contributions of HA1–Cc (pink), HA2-Tt (orange), HA3-Tg (gold), HA4-Ct (olive), HA5-Cg (purple) stretching region compared to the calculated spectra of the full 16 HA (~1 M). Bottom: Calculated intensities and phases in the ssp (C,G) and sps (D,H) polarization for the HA conformers (positive and negative intensities represent phases of zero and pi, respectively.)
A few specifics immediately stand out in these calculated spectra. In general, the
HA5-Cg (purple) and HA3-Tt (orange) conformers contribute the most in the calculated
77
VSF spectra, which agrees with the previous literature predictions regarding the dominant
condensed phase species.65 It is not surprising that HA5-Cg has a dominant conformation
since it was revealed by the MD simulations to be the most abundant conformer at the
interface. (For clarity, only these two most abundant conformers will be discussed here.)
The phase information revealed by the stick spectra provides significant new insights into
how these conformers combine to produce the resulting line shape.
In the C=O stretching region, the underlying stick spectra (Fig 5.8 C,D) displays
the frequency and phase of the C=O mode for each conformer. In both polarizations, the
HA5-Cg (and HA1-Cc) is lower in frequency with a negative phase while HA2-Tt (and
the other two conformers) is at a higher frequency with a positive phase. Additionally,
HA5-Cg has the greatest relative intensity in the ssp spectrum, while HA2-Tt is the most
intense in the sps spectrum. Recall that the experimental C=O spectra were fit to two
peaks with opposite phase: a negative peak at ~1725 cm-1 (attributed to a more strongly
H-bonded carbonyl) and a positive peak at ~1737 cm-1 (attributed to a less strongly H-
bonded carbonyl). This agreement between the calculated spectra and experimental fits
provide significant evidence of more than one species of carbonyl at the interface. Due to
the lack of solvation effects included in our methodology, this alone cannot differentiate
if the agreement is due to the conformation or solvation environment, but it does clearly
indicate that the experimental C=O is in a continuum of hydrogen bonding environments
at the interface.
In the CH stretching region (Fig 5.8 E-H), HA5-Cg and HA2-Tt also have
significant contributions in both polarizations. In fact, HA5-Cg and HA2-Tt are the main
sources of intensity in the ssp polarization calculated VSF spectra (Fig. 5.8 E), and the
78
stick spectra (Fig. 5.8 G) show that the most intense peak arises from HA2-Tt at ~2900
cm-1 (CH2 sym. stretch). Once broadened, this positive phase peak interferes
constructively with the positive HA5-Cg peak at ~2935 cm-1 (CH3 sym. stretch). Thus,
both methylene and methyl modes contribute to the single tall, broad peak to the high
frequency side of the total spectrum. The remaining feature at ~2850 cm-1 largely arises
from CH2 sym. stretching modes (positive phase) of HA5-Cg.
The CH stretching region is more complicated in the sps polarization (Fig. 5.8 F)
due to larger contributions from the other conformers, as well. Surprisingly, the low
frequency side of the HA4-Ct spectrum (Fig 5.8 F, green) is slightly more intense than
HA5-Cg, but the total calculated spectrum (Fig 5.8 F, black) does not reflect this
additional intensity. The stick spectra in Figure 5.8H reveals that these HA4-Ct modes
are out of phase with those of the other two cis conformers, bringing down the intensity
of the total VSF feature there. On the high frequency side of the CH region (~3000 cm-1),
the intensity arises from the positive phases of CH3 asymmetric stretching modes of all
five conformers interfering constructively. These two clusters of positive phase modes on
either side of the spectrum border an intense cluster of negative phase peaks between
~2900-2950 cm-1. These negative phases in the stick spectra are due to the CH2 and CH3
symmetric stretches of the two trans conformers, as well as the methyl asymmetric
stretch of HA4-Ct. These negative phase modes line up extremely well with the sharp dip
seen in the experimental spectrum.
Overall, the agreement between the calculated and experimental spectra indicates
that both the open form cis and trans conformers of HA are present at the air-water
interface. With the phase information provided by the stick spectra, the experimental
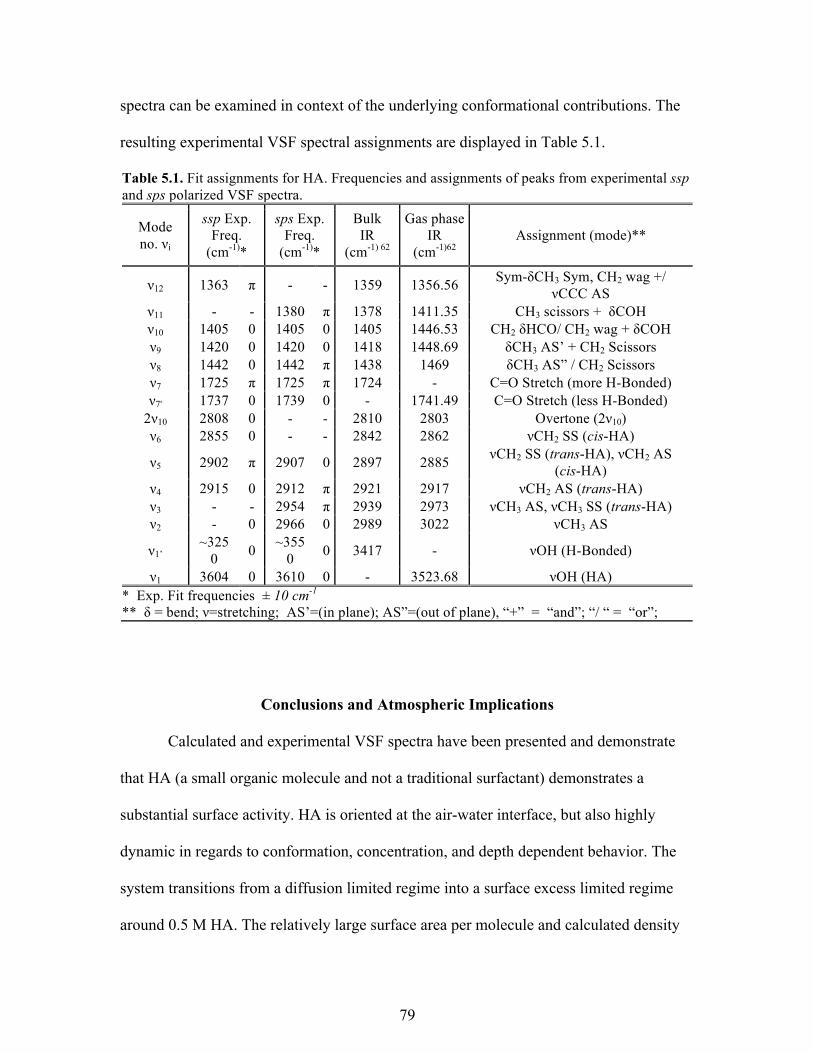
79
spectra can be examined in context of the underlying conformational contributions. The
resulting experimental VSF spectral assignments are displayed in Table 5.1.
Table 5.1. Fit assignments for HA. Frequencies and assignments of peaks from experimental ssp and sps polarized VSF spectra.
Mode no. νi
ssp Exp. Freq.
(cm-1)*
sps Exp. Freq.
(cm-1)*
Bulk IR
(cm-1) 62
Gas phase IR
(cm-1)62 Assignment (mode)**
ν12 1363 π - - 1359 1356.56 Sym-δCH3 Sym, CH2 wag +/ νCCC AS
ν11 - - 1380 π 1378 1411.35 CH3 scissors + δCOH ν10 1405 0 1405 0 1405 1446.53 CH2 δHCO/ CH2 wag + δCOH ν9 1420 0 1420 0 1418 1448.69 δCH3 AS’ + CH2 Scissors ν8 1442 0 1442 π 1438 1469 δCH3 AS” / CH2 Scissors ν7 1725 π 1725 π 1724 - C=O Stretch (more H-Bonded) ν7' 1737 0 1739 0 - 1741.49 C=O Stretch (less H-Bonded)
2ν10 2808 0 - - 2810 2803 Overtone (2ν10) ν6 2855 0 - - 2842 2862 νCH2 SS (cis-HA)
ν5 2902 π 2907 0 2897 2885 νCH2 SS (trans-HA), νCH2 AS (cis-HA)
ν4 2915 0 2912 π 2921 2917 νCH2 AS (trans-HA) ν3 - - 2954 π 2939 2973 νCH3 AS, νCH3 SS (trans-HA) ν2 - 0 2966 0 2989 3022 νCH3 AS
ν1’ ~325
0 0 ~3550 0 3417 - νOH (H-Bonded)
ν1 3604 0 3610 0 - 3523.68 νOH (HA) * Exp. Fit frequencies ± 10 cm-1 ** δ = bend; ν=stretching; AS’=(in plane); AS”=(out of plane), “+” = “and”; “/ “ = “or”;
Conclusions and Atmospheric Implications
Calculated and experimental VSF spectra have been presented and demonstrate
that HA (a small organic molecule and not a traditional surfactant) demonstrates a
substantial surface activity. HA is oriented at the air-water interface, but also highly
dynamic in regards to conformation, concentration, and depth dependent behavior. The
system transitions from a diffusion limited regime into a surface excess limited regime
around 0.5 M HA. The relatively large surface area per molecule and calculated density
80
profile support the presence of solvated water in a surface layer that is largely HA. The
continued presence of water is evidenced in experimental VSF spectra by the loss of key
spectral features when solvating HA in D2O. The contributions of water modes to the
VSF spectra demonstrates that the interfacial water is coordinating in an ordered way,
even at the highest HA concentrations.
The VSF spectra also show evidence of either multiple HA conformers or
solvation environments at the interface. Analysis of MD simulations shows that the open
cis form of HA (with the hydroxyl H at a gauche offset to the carbonyl) is the most
abundant conformer in the bulk (~50%) and at the interface (~40%). The lack of an
internal H-bond in the open form signifies the formation of H-bonded aggregates
throughout the system. This cis conformer and the open form trans conformer (with the
hydroxyl H fully trans to the carbonyl) contribute most strongly to the calculated VSF
spectra. These two conformers exhibit differing orientations as well as depth dependent
reorientations between the subsurface and surface. Interestingly, the position of the
hydroxyl group was shown to have a greater effect on interfacial orientation than the cis
or trans configuration. This suggests that the resulting orientation of HA may be
dependent on its aggregation interactions. The ratio of open form cis to trans conformers
is lower at the interface (~3:1) than in the bulk (~5:1). Since the trans conformer is not
populated in the gas phase, this may be a sign of stabilizing interactions unique to the
interface.
Together, these results create a picture of a coordinated interface composed of HA
forming dynamic external hydrogen bonds with other HA and water. Furthermore, they
suggest that there may be one or more preferred aggregation structures at the interface. In
81
the future, aggregation structures could potentially be investigated by incorporating
explicit micro-solvation into the computational methodology and examining HA H-
bonded dimer and trimer systems. This would also serve to further isolate spectral
features arising from the external solvation environment from internal conformational
dependencies.
HA’s tendency to form surface specific coordinated aggregates may have
significant implication for atmospheric interfaces, as it could impact surface properties,
such as gas-to-particle partitioning and cloud condensation nuclei activity. Furthermore,
because of the potential variability of these H-bonded aggregates, unanticipated
cooperative effects may arise in systems of mixed organics. This work provides the
foundation for HA as a quantified organic model system to use as a control in future
studies of organic-salt or mixed organic systems at the air-water interface.
82
CHAPTER VI
PYRUVIC ACID AND ITS SURFACE-ACTIVE OLIGOMERS
The contents of this chapter have been previously published in whole or in part. The text presented here has been modified from the publication below:
Gordon, B. P., Moore, F. G., Scatena, L. F., Richmond, G. L. On the Rise: Experimental and Computational VSFS Studies of Pyruvic Acid and its Surface Active Oligomer Species at the Air-Water Interface. J. Phys. Chem. A 2019, Just Accepted Manuscript (DOI: 10.1021/acs.jpca.9b0885)
Bridge
It is well known that atmospheric aerosol play important roles in the environment.
However, there is still much to learn about the processes that form aerosols, particularly
aqueous secondary organic aerosols (aqSOA). While pyruvic acid (PA) is often better
known for its biological significance, it is also an abundant atmospheric secondary
organic. It has been shown that in bulk aqueous environments, PA exists in equilibrium
between unhydrated α-keto carboxylic acid (PYA) and singly hydrated geminal diol
carboxylic acid (PYT), favoring the diol. These studies have also identified oligomer
products in the bulk, including zymonic acid (ZYA) and parapyruvic acid (PPA). The
surface behavior of these oligomers has not been studied and their contributions (if any)
to the interface are unknown. Here, we address this knowledge gap by examining the
molecular species present at the interface of aqueous PA systems using vibrational sum-
frequency spectroscopy (VSFS), a surface sensitive technique. VSFS provides
information about interfacial molecular populations, orientations and behaviors.
Computational studies using classical molecular dynamics (MD) and quantum
mechanical density functional theory (DFT) are employed in combination to afford
further insights into these systems. Our studies indicate populations of at least two
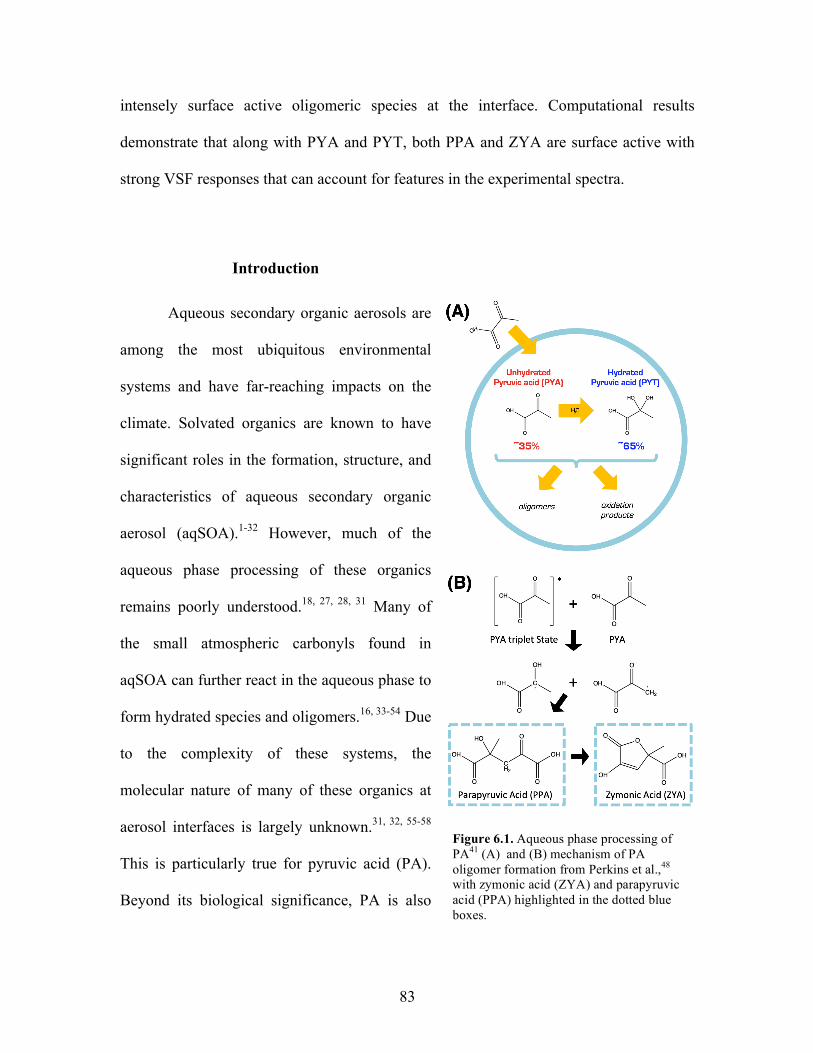
83
intensely surface active oligomeric species at the interface. Computational results
demonstrate that along with PYA and PYT, both PPA and ZYA are surface active with
strong VSF responses that can account for features in the experimental spectra.
Introduction
Aqueous secondary organic aerosols are
among the most ubiquitous environmental
systems and have far-reaching impacts on the
climate. Solvated organics are known to have
significant roles in the formation, structure, and
characteristics of aqueous secondary organic
aerosol (aqSOA).1-32 However, much of the
aqueous phase processing of these organics
remains poorly understood.18, 27, 28, 31 Many of
the small atmospheric carbonyls found in
aqSOA can further react in the aqueous phase to
form hydrated species and oligomers.16, 33-54 Due
to the complexity of these systems, the
molecular nature of many of these organics at
aerosol interfaces is largely unknown.31, 32, 55-58
This is particularly true for pyruvic acid (PA).
Beyond its biological significance, PA is also
Figure 6.1. Aqueous phase processing of PA41 (A) and (B) mechanism of PA oligomer formation from Perkins et al.,48 with zymonic acid (ZYA) and parapyruvic acid (PPA) highlighted in the dotted blue boxes.
84
one of the most abundant atmospheric secondary organic ketoacids and is known to be
involved in aqSOA formation.41-54, 59-63 Because of this, PA has been studied extensively
in this context and as a model atmospheric α-dicarbonyl.
In aqueous solutions PA has two populated hydration species (depicted in Figure
6.1A): the unhydrated α-keto acid (PYA) and the singly hydrated triol (PYT).41 However,
the factors that determine equilibrium conditions and corresponding abundances of these
hydration species are known to be complex. For example, in a nonpolar solvent as well as
low pH aqueous solutions the PYA:PYT ratio is 35%:65%.41 Whereas in dilute solutions
or at higher pH this ratio has been reported to vary by as much as 50%:50% to
90%:10%.50 Compounding this complexity, it is likely there is a depth-dependent shift in
the hydration equilibrium between the bulk and the interface. Such behavior has been
reported in similar a system by Wren et al. in which methylglyoxal (MG) was determined
to exhibit preference for its less-hydrated diol form at the interface relative to the bulk.34
As surface properties are plausibly related to the ratio of these species, characterizing the
nature of this equilibrium at the air-water interface will provide valuable information to
atmospheric scientists.
Furthermore, PA has recently been established to favorably form oligomeric
species.45, 47, 48, 50, 53, 54 The Vaida group has pioneered the characterization and
mechanistic studies of PA and its oligomer species, demonstrating that due to the variety
of favorable pathways through which each monomeric hydration species can react, these
higher order oligomer products are numerous.45, 48, 50 The abundance of these reaction
products can vary greatly depending on solution and environmental conditions (such as
pH48, 50 and photochemistry42-54) and some of these oligomer species are also in
85
equilibrium with favorable hydration species.48 Aqueous PA favorably forms larger
molecular weight oligomeric species, as demonstrated in Figure 6.1B,48 where the polar
medium lessens the tendency to form intramolecular hydrogen bonds and enhances
intermolecular hydrogen bonding.41 In fact, the formation of such oligomeric species is
favorable enough to occur on metal oxide surfaces where unhydrated PA reacts with
surface hydroxyl groups to produce pyruvate, which can go on to yield several higher-
molar-mass oligomeric species.54
For purposes of clarity, this work focuses on only two of the unhydrated oligomer
products highlighted in Figure 6.1B: the keto acid parapyruvic acid, (PPA), and PPA’s
closed ring lactone enol form zymonic acid, (ZYA). PPA and ZYA were chosen because
they have repeatedly been established to form spontaneously from PA precursors, even in
the dark.42-54
While these literature studies provide precedence and insight into the PA
oligomeric reaction products, the relative surface affinity of such species at the air-water
interface has not been previously studied. Here, we report novel insights obtained using
vibrational sum-frequency spectroscopy (VSFS) in combination with surface tensiometry
and computational chemistry to examine the molecular species present at the air-water
interface of aqueous PA systems. VSFS is a surface sensitive technique, which provides
information about interfacial molecular character, population, and orientation.
In the present study, aqueous PA solutions reveal higher than anticipated surface
activity at the air-water interface. Moreover, VSF spectra provide significant evidence of
ordered, surface-active oligomeric species (PPA and ZYA) in addition to the monomeric
PYA and PYT. Computational results demonstrate that along with PYA and PYT, both
86
PPA and ZYA are surface active and that they have strong VSF responses that can
account for the increased surface-activity and additional features observed in the
experimental spectra.
Experimental Methods
Vibrational Sum Frequency Spectroscopy
Vibrational sum frequency (VSF) spectroscopy is an inherently surface-selective
nonlinear optical technique that provides a vibrational spectrum of surface–active
molecules that are anisotropically ordered, and noncentrosymmetric.64-67 at asymmetric
interfaces VSF spectroscopy is a well-established technique has been used extensively by
the Richmond lab34, 68-79 and others80-99 to study liquid interfaces. By overlapping a fixed
visible and a tunable-frequency IR beam in time and space, a third sum frequency beam
is generated, which is the sum of the incident frequencies.
Depending on the polarizations of the incident beams, VSF can probe molecular
dipole components perpendicular (ssp) or parallel (sps) to the air-water interface, where
the three letters denote the polarizations of the sum frequency, visible and IR beams
respectively. All VSF spectra discussed within were collected in either the ssp or sps
polarization scheme.
The intensity of the VSF response is proportional to the absolute square of the
nonlinear second-order macroscopic susceptibility (χ(2)), which contains both resonant
(χRν(2)) and non-resonant (χNR
(2)) components. Included within the resonant component is
molecular information regarding both population and orientation at the interface. The

87
numerous contributions to the VSF spectra is described as a convolution of a Gaussian
and Lorentzian distribution described by Bain et al.64:
!(!) = !!"(!)!!! +!!!!"!!!(!!!!!/!!!)!
!! − !!" + !!!!!!
!
!!! (7.1)
Equation 1 is utilized as the fitting equation for spectral analysis of the VSF data. As
per convention, reported vibrational lifetimes of the specific transitions are used to
inform mode specific fixed Lorentzian widths for the CH (2 cm-1), coordinated OH and
C=O (5 cm-1), and ‘free’ OH (12 cm-1) modes.100-103
Laser System
The VSF spectra discussed within were acquired using a picosecond laser system,
which has been previously described.78 In short, the sum frequency (SF) beam is
generated by overlapping a fixed visible beam (12500 cm-1) with a tunable IR beam
(4000 cm-1 to 1200 cm-1, with a 3 cm-1 wavenumber step) at the air-water interface. The
resolution of the VSF system used herein is ~18 cm-1. The incident angles of the visible
and IR beams are set relative to the surface normal at 45˚ and 60˚, respectively. The
resulting SF beam is collected using a curved mirror set at its focal length and directed
into a thermoelectrically cooled CCD camera (Pixas, Princeton Instruments). All
experimental spectra are normalized for VSF power using that day’s nonresonant SF
response of an uncoated gold substrate. Daily frequency calibration of the tunable IR
beam is accomplished by measuring the absorption of a polystyrene standard and fitting
to the known assignments.
All VSF measurements were acquired at room temperature (~22 °C) under
ambient conditions in sample cells consisting of shallow glass dishes (≥ 8mm depth) that
88
are cleaned according to a rigorous protocol.34, 78 No changes in intensity or spectral
shape were observed between scans of the equilibrated sample for any PA concentration.
This indicates that if the laser is inducing photoinitiated reactions, any resulting reaction
products at the interface are not ordered and/or abundant enough to be detectable by
VSFS. Furthermore, any resulting perturbations to the net interfacial orientation or
populations of the reactant species are not significantly deviating within the ~1 to 3 hours
required for data collection. For these reasons, laser induced reactions are not considered
to be a concern in this work.
Surface Tension
Experimental Wilhelmy plate
surface tensiometry measurements provide a
measure of surface population, which is used to decouple contributions from number
density and molecular orientation in the VSF signal. This technique uses a force balance
(KSV) to quantify surface tension (γ) by measuring the force exerted on the plate by the
solution under ambient conditions at room temperature (~22°C). Surface tension is
converted to surface pressure (π) by subtracting the daily-measured surface tension of
neat water. The platinum plate is cleaned in 18.2 MΩ cm nanopure water and then dried
under flame between measurements.
Sample Preparation
Aqueous PA solutions (0.05 – 1M) were prepared volumetrically by diluting PA
stock solution (98%, Sigma Aldrich) with nanopure (18.2 MΩ cm) water or D2O (99.9%,
Cambridge Isotope Laboratories, Inc.). Solutions were prepared ≥ 24h before use and
stored in Pyrex flasks, since PA is known to have numerous photoinitiated reaction
mechanisms.42-54 Therefore, solutions were kept in the dark when not in use.
89
Computational Methods
Calculated VSF responses are generated using a combination of computational
techniques. These techniques also provide vital structural and behavioral insights about
the simulated system, such as depth dependent molecular partitioning. This approach has
been shown to be robust, efficient, and highly adaptable for numerous and varied
chemical systems when compared with experimental spectra.34, 71-78
Classical Molecular Dynamics
Molecular dynamics (MD) simulations are performed using the Amber 12 suite of
programs,104 using parameters and force fields derived in the same manner as in previous
studies34, 71-78 and starting configurations were generated by PACKMOL.105 In each
simulation, a specific number of PA and water molecules are arranged to form a 30 Å
cube within a 30 Å x 120 Å x 30 Å simulation box, with periodic boundary conditions,
forming a water slab with two interfaces. To maintain a consistent simulation volume
with a total of ~2700 atoms, the number of water molecules is decreased as the number of
is PA molecules is increased. Simulations were performed for configurations of 2, 4, 8,
and 16 PA molecules per box, corresponding to concentrations of ~0.125, 0.25, 0.5 and 1
M PA, respectively. Each simulation was energy minimized at 0 K and equilibrated from
0 K to 298 K over 2 ns. The simulations were then further evolved at 298 K in 1 fs time
steps for a minimum of 10 ns, which was evaluated to be sufficient as the conformational
sampling of these initial studies has been intentionally limited by design.
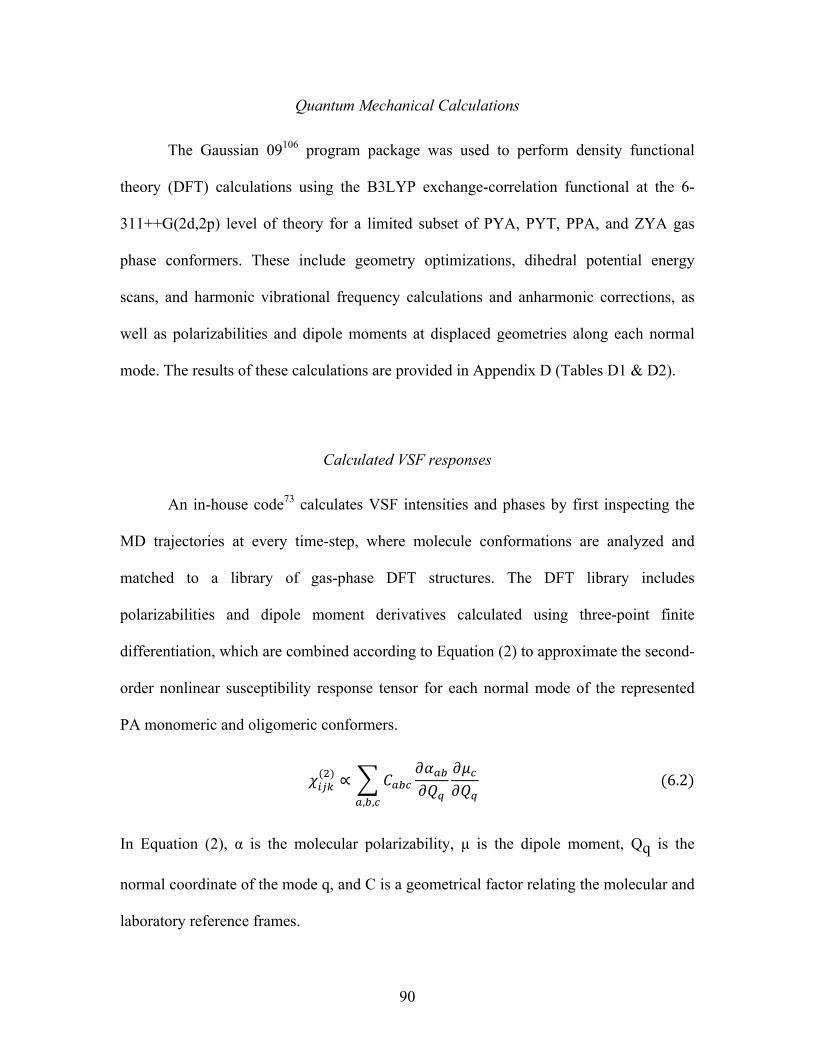
90
Quantum Mechanical Calculations
The Gaussian 09106 program package was used to perform density functional
theory (DFT) calculations using the B3LYP exchange-correlation functional at the 6-
311++G(2d,2p) level of theory for a limited subset of PYA, PYT, PPA, and ZYA gas
phase conformers. These include geometry optimizations, dihedral potential energy
scans, and harmonic vibrational frequency calculations and anharmonic corrections, as
well as polarizabilities and dipole moments at displaced geometries along each normal
mode. The results of these calculations are provided in Appendix D (Tables D1 & D2).
Calculated VSF responses
An in-house code73 calculates VSF intensities and phases by first inspecting the
MD trajectories at every time-step, where molecule conformations are analyzed and
matched to a library of gas-phase DFT structures. The DFT library includes
polarizabilities and dipole moment derivatives calculated using three-point finite
differentiation, which are combined according to Equation (2) to approximate the second-
order nonlinear susceptibility response tensor for each normal mode of the represented
PA monomeric and oligomeric conformers.
!!"!(!) ∝ !!"#!!!"!!!
!!!!!!!,!,!
(6.2)
In Equation (2), α is the molecular polarizability, µ is the dipole moment, Qq is the
normal coordinate of the mode q, and C is a geometrical factor relating the molecular and
laboratory reference frames.
91
Results and Discussion
Experimental VSF Spectra
VSF spectra were acquired for neat water and a series of PA concentrations (0.01,
0.05, 0.1, 0.25, 0.50, and 1 M) in the ssp and sps polarizations for the C=C/C=O (Fig.
2A,C) and CH/OH (Fig. 2B,D) stretching regions. For clarity, only a subset of spectra of
these PA solutions (0.05, 0.25 and 1M) is shown in Figure 6.2. Spectra of full
concentration series are provided in the Appendix D in Figure D1. As detailed and
thorough discussions of neat-water at the air-water interface are numerous,70, 81-99 it will
only be addressed briefly in Appendix D Figure D1. This work will focus primarily on
the organic contribution to the VSF spectra presented within. The strong VSF response in
each spectral region demonstrates a large, oriented surface population. However, some of
these responses cannot be attributed to modes from either of the PA hydration species, as
is discussed below.
In the OH stretching region, both the ssp and sps spectra of PA solutions show
strong features centered at ~3600 cm-1 that are attributed to the OH stretching modes of
PA. The loss of intensity in the coordinated-OH stretching region (~3000-3400 cm-1),70
most clearly observed in the ssp polarization scheme, indicates that the addition of PA
suppresses the coordination of and/or excludes water. However, it is possible that less
coordinated interfacial water still present and oriented at the interface is also contributing
to the ~3600 cm-1 feature in PA solutions, as has been demonstrated with HA.78 This can
be further investigated by examining the water bending modes, as is discussed below.
It is worth briefly discussing pH considerations at this point. Aqueous solutions of
PA are known to be acidic, even at lowconcentrations.ThebulkpHoftheaqueousPA
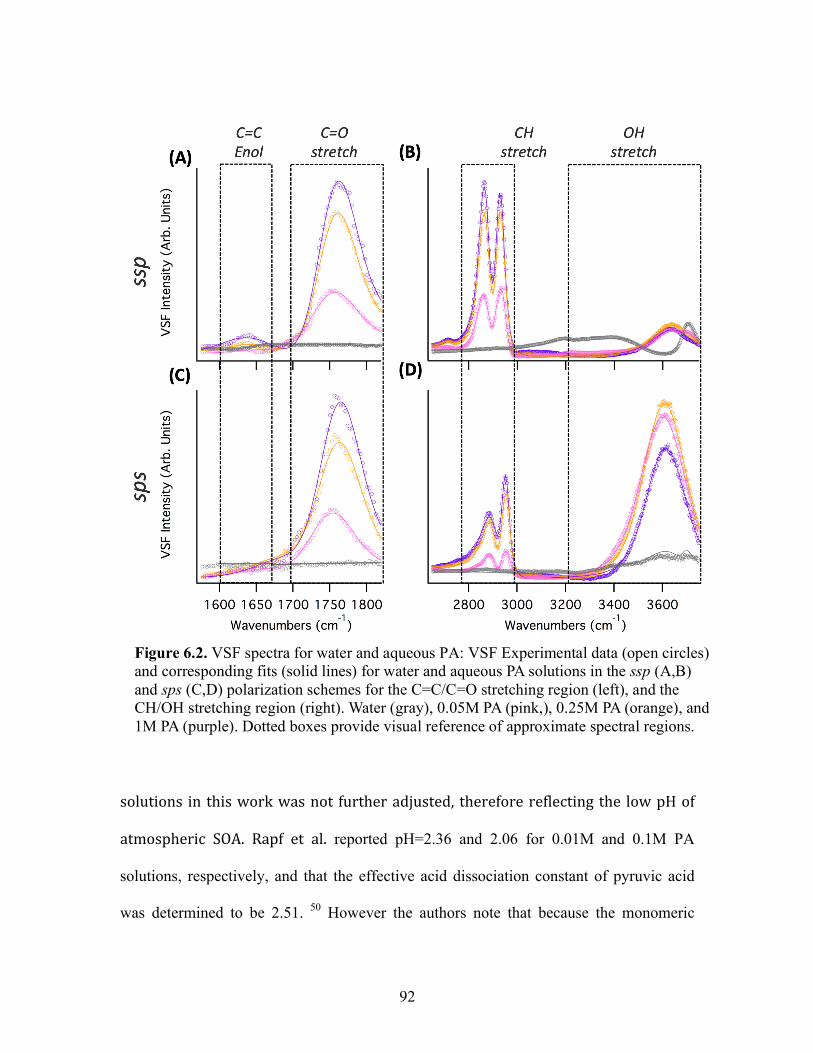
92
solutions in thisworkwasnot furtheradjusted, thereforereflecting the lowpHof
atmospheric SOA. Rapf et al. reported pH=2.36 and 2.06 for 0.01M and 0.1M PA
solutions, respectively, and that the effective acid dissociation constant of pyruvic acid
was determined to be 2.51. 50 However the authors note that because the monomeric
Figure 6.2. VSF spectra for water and aqueous PA: VSF Experimental data (open circles) and corresponding fits (solid lines) for water and aqueous PA solutions in the ssp (A,B) and sps (C,D) polarization schemes for the C=C/C=O stretching region (left), and the CH/OH stretching region (right). Water (gray), 0.05M PA (pink,), 0.25M PA (orange), and 1M PA (purple). Dotted boxes provide visual reference of approximate spectral regions.
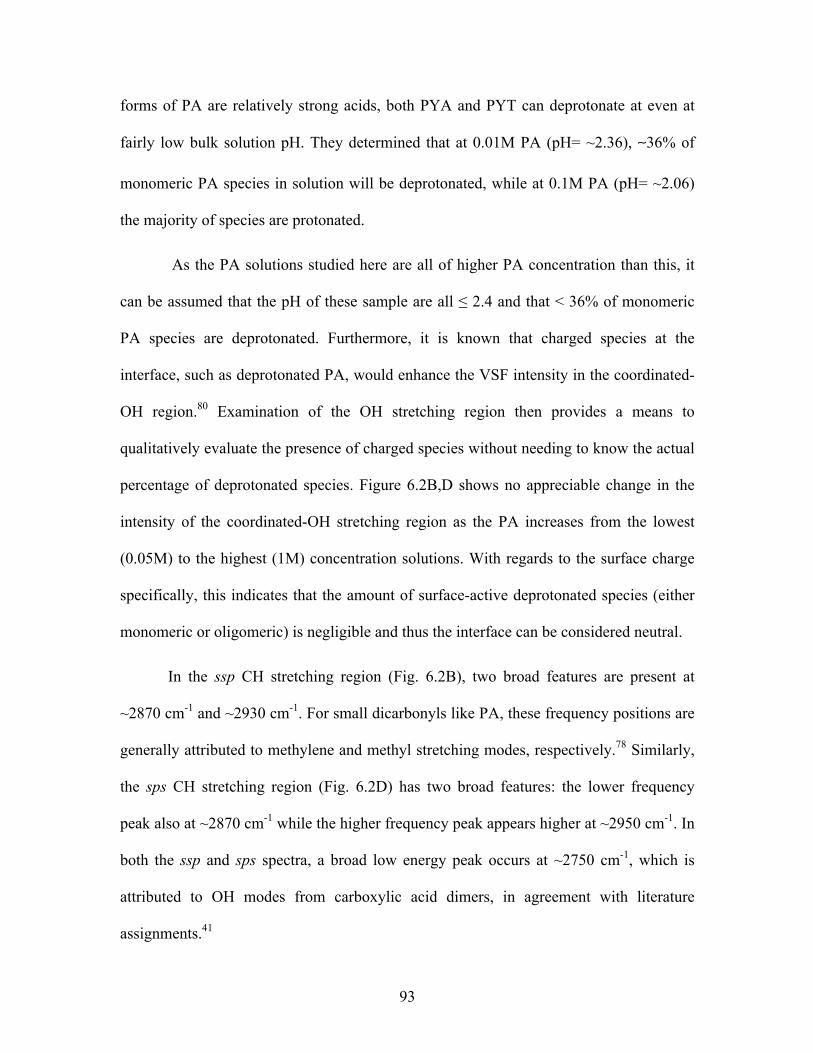
93
forms of PA are relatively strong acids, both PYA and PYT can deprotonate at even at
fairly low bulk solution pH. They determined that at 0.01M PA (pH= ~2.36), ∼36% of
monomeric PA species in solution will be deprotonated, while at 0.1M PA (pH= ~2.06)
the majority of species are protonated.
As the PA solutions studied here are all of higher PA concentration than this, it
can be assumed that the pH of these sample are all ≤ 2.4 and that < 36% of monomeric
PA species are deprotonated. Furthermore, it is known that charged species at the
interface, such as deprotonated PA, would enhance the VSF intensity in the coordinated-
OH region.80 Examination of the OH stretching region then provides a means to
qualitatively evaluate the presence of charged species without needing to know the actual
percentage of deprotonated species. Figure 6.2B,D shows no appreciable change in the
intensity of the coordinated-OH stretching region as the PA increases from the lowest
(0.05M) to the highest (1M) concentration solutions. With regards to the surface charge
specifically, this indicates that the amount of surface-active deprotonated species (either
monomeric or oligomeric) is negligible and thus the interface can be considered neutral.
In the ssp CH stretching region (Fig. 6.2B), two broad features are present at
~2870 cm-1 and ~2930 cm-1. For small dicarbonyls like PA, these frequency positions are
generally attributed to methylene and methyl stretching modes, respectively.78 Similarly,
the sps CH stretching region (Fig. 6.2D) has two broad features: the lower frequency
peak also at ~2870 cm-1 while the higher frequency peak appears higher at ~2950 cm-1. In
both the ssp and sps spectra, a broad low energy peak occurs at ~2750 cm-1, which is
attributed to OH modes from carboxylic acid dimers, in agreement with literature
assignments.41
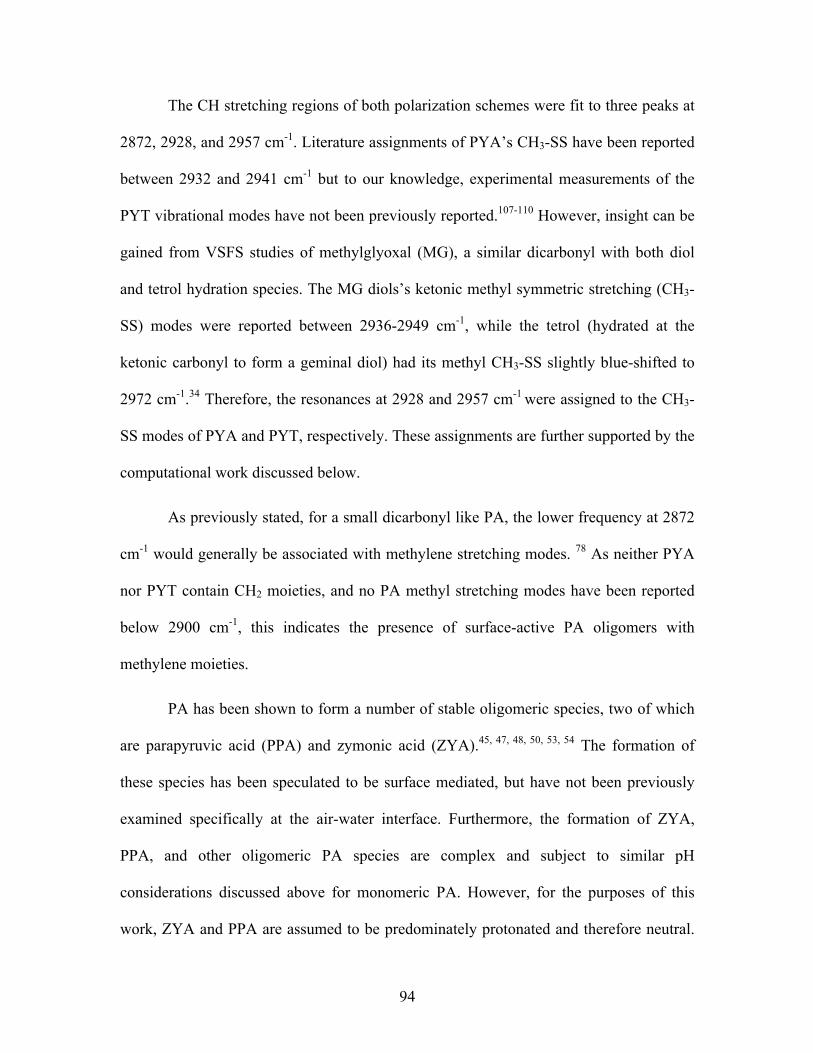
94
The CH stretching regions of both polarization schemes were fit to three peaks at
2872, 2928, and 2957 cm-1. Literature assignments of PYA’s CH3-SS have been reported
between 2932 and 2941 cm-1 but to our knowledge, experimental measurements of the
PYT vibrational modes have not been previously reported.107-110 However, insight can be
gained from VSFS studies of methylglyoxal (MG), a similar dicarbonyl with both diol
and tetrol hydration species. The MG diols’s ketonic methyl symmetric stretching (CH3-
SS) modes were reported between 2936-2949 cm-1, while the tetrol (hydrated at the
ketonic carbonyl to form a geminal diol) had its methyl CH3-SS slightly blue-shifted to
2972 cm-1.34 Therefore, the resonances at 2928 and 2957 cm-1 were assigned to the CH3-
SS modes of PYA and PYT, respectively. These assignments are further supported by the
computational work discussed below.
As previously stated, for a small dicarbonyl like PA, the lower frequency at 2872
cm-1 would generally be associated with methylene stretching modes. 78 As neither PYA
nor PYT contain CH2 moieties, and no PA methyl stretching modes have been reported
below 2900 cm-1, this indicates the presence of surface-active PA oligomers with
methylene moieties.
PA has been shown to form a number of stable oligomeric species, two of which
are parapyruvic acid (PPA) and zymonic acid (ZYA).45, 47, 48, 50, 53, 54 The formation of
these species has been speculated to be surface mediated, but have not been previously
examined specifically at the air-water interface. Furthermore, the formation of ZYA,
PPA, and other oligomeric PA species are complex and subject to similar pH
considerations discussed above for monomeric PA. However, for the purposes of this
work, ZYA and PPA are assumed to be predominately protonated and therefore neutral.
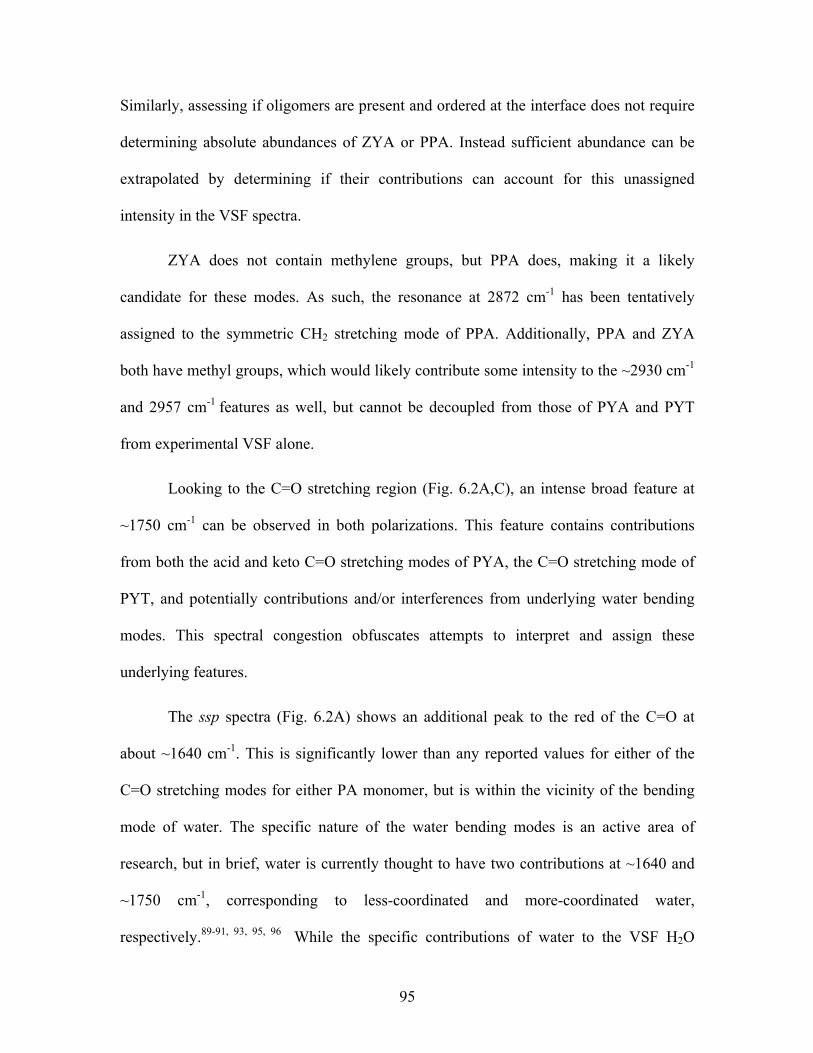
95
Similarly, assessing if oligomers are present and ordered at the interface does not require
determining absolute abundances of ZYA or PPA. Instead sufficient abundance can be
extrapolated by determining if their contributions can account for this unassigned
intensity in the VSF spectra.
ZYA does not contain methylene groups, but PPA does, making it a likely
candidate for these modes. As such, the resonance at 2872 cm-1 has been tentatively
assigned to the symmetric CH2 stretching mode of PPA. Additionally, PPA and ZYA
both have methyl groups, which would likely contribute some intensity to the ~2930 cm-1
and 2957 cm-1 features as well, but cannot be decoupled from those of PYA and PYT
from experimental VSF alone.
Looking to the C=O stretching region (Fig. 6.2A,C), an intense broad feature at
~1750 cm-1 can be observed in both polarizations. This feature contains contributions
from both the acid and keto C=O stretching modes of PYA, the C=O stretching mode of
PYT, and potentially contributions and/or interferences from underlying water bending
modes. This spectral congestion obfuscates attempts to interpret and assign these
underlying features.
The ssp spectra (Fig. 6.2A) shows an additional peak to the red of the C=O at
about ~1640 cm-1. This is significantly lower than any reported values for either of the
C=O stretching modes for either PA monomer, but is within the vicinity of the bending
mode of water. The specific nature of the water bending modes is an active area of
research, but in brief, water is currently thought to have two contributions at ~1640 and
~1750 cm-1, corresponding to less-coordinated and more-coordinated water,
respectively.89-91, 93, 95, 96 While the specific contributions of water to the VSF H2O
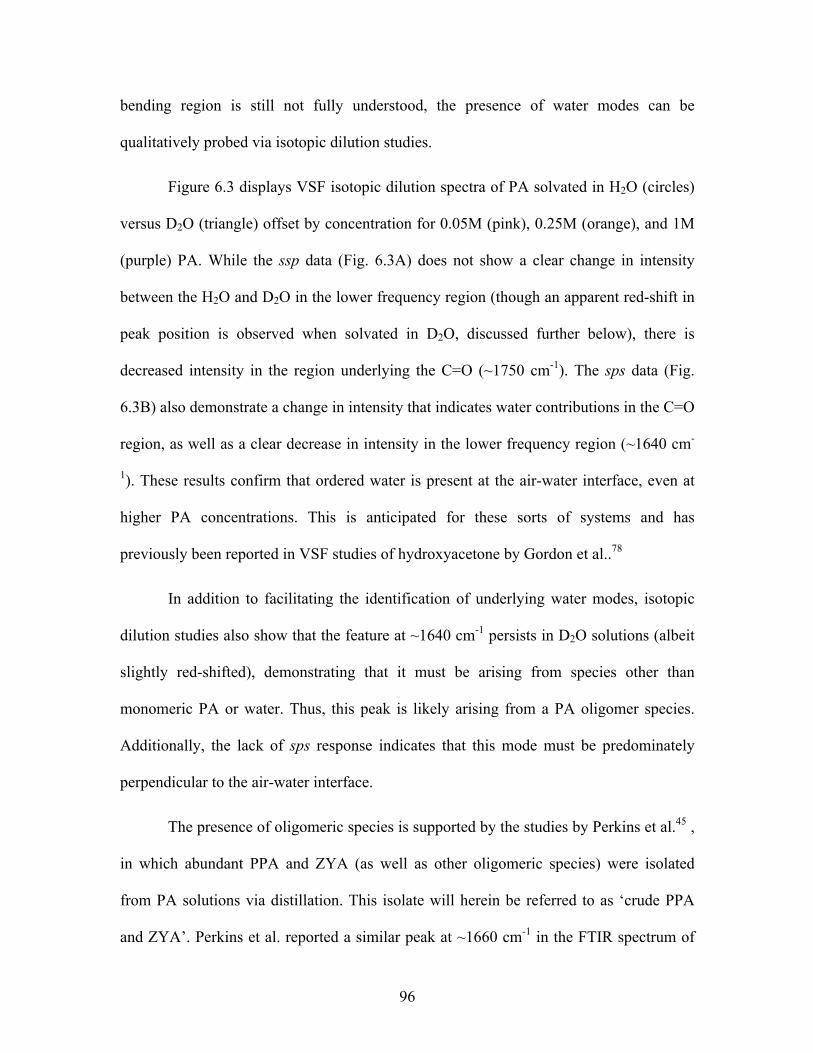
96
bending region is still not fully understood, the presence of water modes can be
qualitatively probed via isotopic dilution studies.
Figure 6.3 displays VSF isotopic dilution spectra of PA solvated in H2O (circles)
versus D2O (triangle) offset by concentration for 0.05M (pink), 0.25M (orange), and 1M
(purple) PA. While the ssp data (Fig. 6.3A) does not show a clear change in intensity
between the H2O and D2O in the lower frequency region (though an apparent red-shift in
peak position is observed when solvated in D2O, discussed further below), there is
decreased intensity in the region underlying the C=O (~1750 cm-1). The sps data (Fig.
6.3B) also demonstrate a change in intensity that indicates water contributions in the C=O
region, as well as a clear decrease in intensity in the lower frequency region (~1640 cm-
1). These results confirm that ordered water is present at the air-water interface, even at
higher PA concentrations. This is anticipated for these sorts of systems and has
previously been reported in VSF studies of hydroxyacetone by Gordon et al..78
In addition to facilitating the identification of underlying water modes, isotopic
dilution studies also show that the feature at ~1640 cm-1 persists in D2O solutions (albeit
slightly red-shifted), demonstrating that it must be arising from species other than
monomeric PA or water. Thus, this peak is likely arising from a PA oligomer species.
Additionally, the lack of sps response indicates that this mode must be predominately
perpendicular to the air-water interface.
The presence of oligomeric species is supported by the studies by Perkins et al.45 ,
in which abundant PPA and ZYA (as well as other oligomeric species) were isolated
from PA solutions via distillation. This isolate will herein be referred to as ‘crude PPA
and ZYA’. Perkins et al. reported a similar peak at ~1660 cm-1 in the FTIR spectrum of
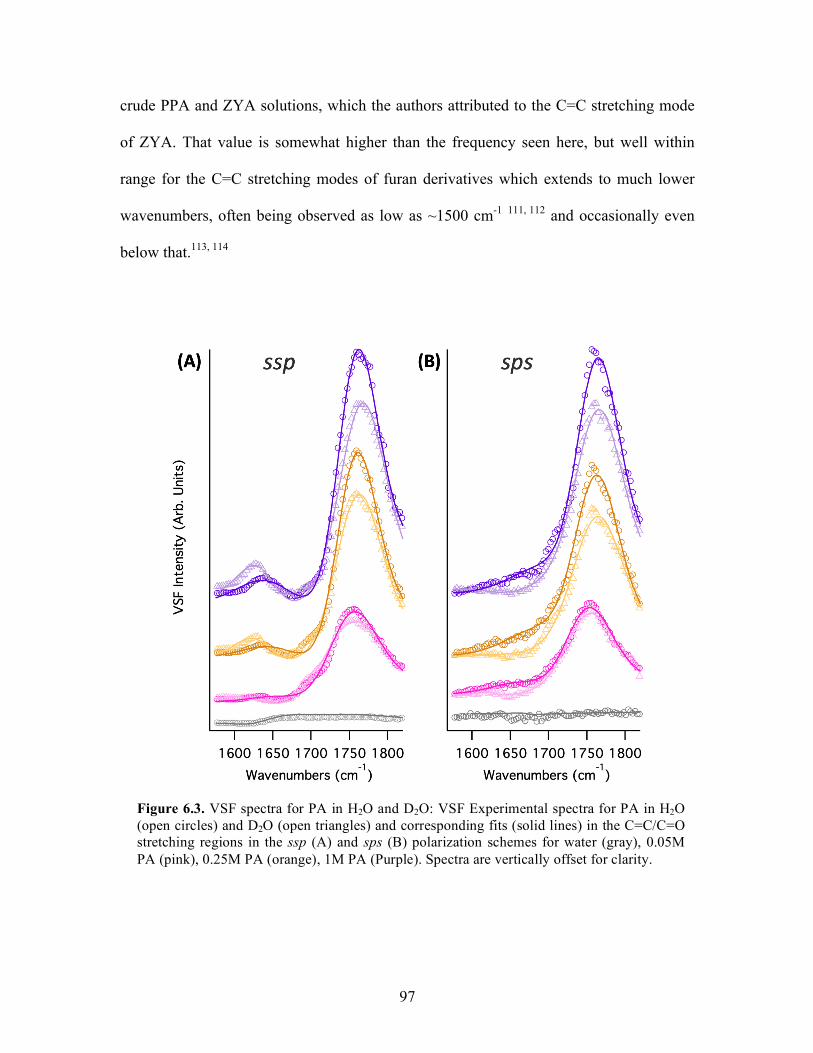
97
crude PPA and ZYA solutions, which the authors attributed to the C=C stretching mode
of ZYA. That value is somewhat higher than the frequency seen here, but well within
range for the C=C stretching modes of furan derivatives which extends to much lower
wavenumbers, often being observed as low as ~1500 cm-1 111, 112 and occasionally even
below that.113, 114
Figure 6.3. VSF spectra for PA in H2O and D2O: VSF Experimental spectra for PA in H2O (open circles) and D2O (open triangles) and corresponding fits (solid lines) in the C=C/C=O stretching regions in the ssp (A) and sps (B) polarization schemes for water (gray), 0.05M PA (pink), 0.25M PA (orange), 1M PA (Purple). Spectra are vertically offset for clarity.
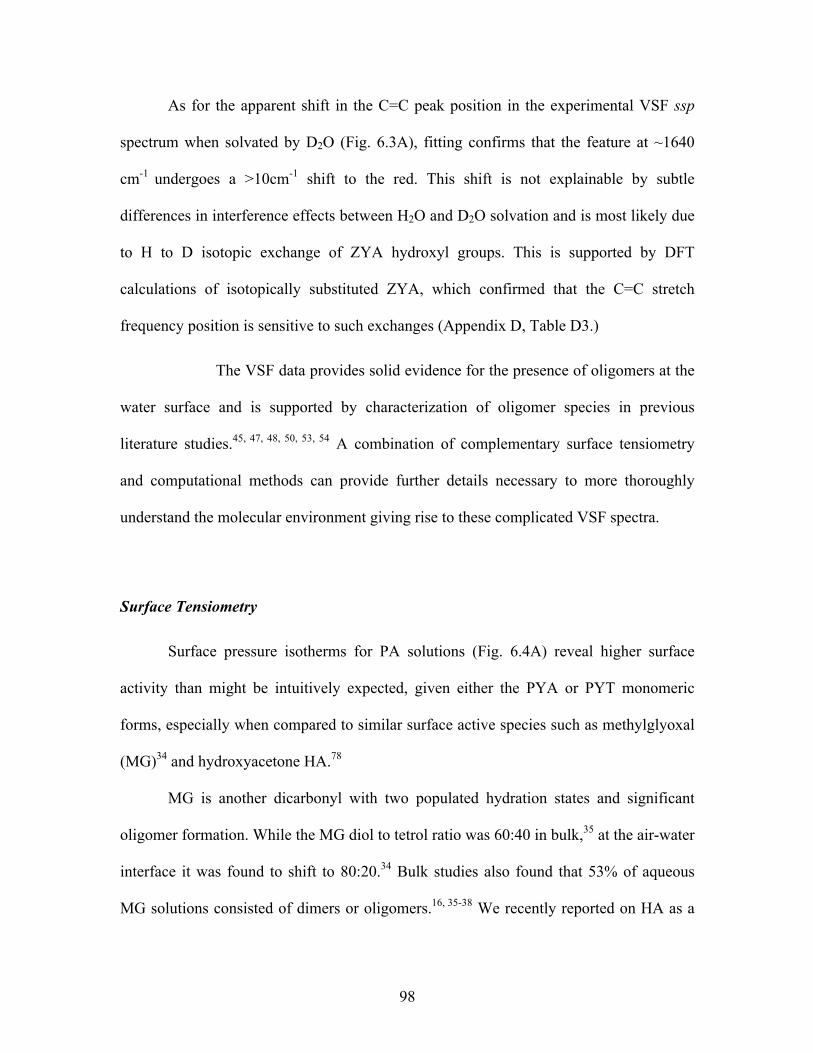
98
As for the apparent shift in the C=C peak position in the experimental VSF ssp
spectrum when solvated by D2O (Fig. 6.3A), fitting confirms that the feature at ~1640
cm-1 undergoes a >10cm-1 shift to the red. This shift is not explainable by subtle
differences in interference effects between H2O and D2O solvation and is most likely due
to H to D isotopic exchange of ZYA hydroxyl groups. This is supported by DFT
calculations of isotopically substituted ZYA, which confirmed that the C=C stretch
frequency position is sensitive to such exchanges (Appendix D, Table D3.)
The VSF data provides solid evidence for the presence of oligomers at the
water surface and is supported by characterization of oligomer species in previous
literature studies.45, 47, 48, 50, 53, 54 A combination of complementary surface tensiometry
and computational methods can provide further details necessary to more thoroughly
understand the molecular environment giving rise to these complicated VSF spectra.
Surface Tensiometry
Surface pressure isotherms for PA solutions (Fig. 6.4A) reveal higher surface
activity than might be intuitively expected, given either the PYA or PYT monomeric
forms, especially when compared to similar surface active species such as methylglyoxal
(MG)34 and hydroxyacetone HA.78
MG is another dicarbonyl with two populated hydration states and significant
oligomer formation. While the MG diol to tetrol ratio was 60:40 in bulk,35 at the air-water
interface it was found to shift to 80:20.34 Bulk studies also found that 53% of aqueous
MG solutions consisted of dimers or oligomers.16, 35-38 We recently reported on HA as a
99
model system, due to its relative
simplicity of being 96-98% in an
unhydrated monomeric state.78, 115
It is interesting to note that HA,
which has the most hydrophobic
moieties of these organics, actually has
the lowest surface activity. As
previously stated, HA is also the only
molecule that does not favor oligomer
formation. With the context provided
by MG and HA, it does appear as
though surface activity and oligomer
formation are correlated, the presence
of interfacially active PA oligomers is
likely the cause of this relatively high
surface pressure.
Computational Results
The experimental results discussed in the previous section provide substantial
evidence of additional molecular diversity at the surface of aqueous PA solutions.
However, due to the complex equilibria (both hydration and oligomerization) and
resulting spectral congestion endemic to this system, experiments alone cannot fully
isolate the individual contribution and behavior of each species.
Figure 6.4. Experimental surface pressure isotherms and calculated density profiles: (A) Surface pressure as a function of organic concentration for PA, MG34, and HA78 at the air/water interface. (B) Density profiles of water (black) and organic residues obtained from the mixed PA simulation of 4 PYA (red), 4 PYT (blue), 4 PPA (green), and 4 ZYA. Each PA species has approximated 0.25M concentration and the four combined results in 16 total organics for ~1M total concentration. The dotted gray lines denote the approximate boundary between the surface (0 Å) and subsurface (5 Å).
100
To bridge this gap, classical molecular dynamics (MD) simulations and quantum
mechanical density functional theory (DFT) were used in combination to explore the
depth dependent dynamics of each species considered in this work. Simulations of
aqueous PYA, PYT, PPA, and ZYA in isolation (not shown) where not found to differ
appreciably from mixed simulations containing one or more of the above residues. As
such, this discussion will focus only on the mixed system of equal parts PYA, PYT, PPA,
and ZYA, containing 4 of each species and totaling 16 molecules per simulation
(corresponding to ~1M organic concentration.)
Density Profiles
Figure 6.4B displays the density profiles from the mixed simulation of PYA,
PYT, PPA, and ZYA (left) as well as that of water (right). The interface, 0 Å, is defined
as the 50% dividing line of the density profile of water.
PYA and PYT show a surface enhancement and a subsurface depletion,
respectively. This depth dependent behavior of PYA and PYT is strikingly similar to that
of the methylglyoxal diol (MGD) and tetrol (MGT), respectively.34 That work concluded
that the interfacial ratio of MGD to MGT was deviated from that of the bulk to favor the
less hydrated MGD. Given the aforementioned similarities, it is plausible that a similar
shift is occurring here, with a higher ratio of PYA to PYT at the air-water interface
relative to the bulk.
What is notable however, are the density profiles of PPA and ZYA, which show
substantial surface enhancement similar to that of PYA. Given the results of Figure 4B,
101
PPA and ZYA would have enhanced surface population relative to the bulk, as well. This
supports the conclusion that the presence of oligomeric PA species at the interface likely
accounts for the higher than expected surface activity observed in experimental surface
tensiometry of PA solutions shown in Figure 4A.
Calculated VSF responses
The density profiles demonstrated the favorable surface partitioning of the
oligomeric PPA and ZYA species, in addition to PYA, but does not explain how they
contribute to the observed experimental VSF spectrum. This question has been explored
by calculating the VSF response for a representative subset of conformers of PYA, PYT,
PPA, and ZYA. While significant work has been done in the literature on the
conformational space of the monomeric forms of PA,109, 110, 116-119 the same has yet to be
done for ZYA and PPA. With the degree of spectral congestion arising from the
numerous PA species, the interfacial conformational space of PYA and PYT cannot be
computationally evaluated without considering ZYA and PPA, as well. However,
generating responses for each of the multitude of conformers populated by PA and its
oligomeric products is a significant undertaking and beyond the scope of the present
work. Thus, for this initial treatment, the VSF responses have been calculated for a
limited subset of conformers of PYA, PYT, PPA, and ZYA. The results of the DFT
calculations and computed VSF responses for each of these is provided in Appendix E
(Tables D1-D3).
Calculated VSF spectra generated using the computational methodology utilized
here have been shown to reproduce the experimental VSF data for spectral regions
102
arising from modes that are insensitive to solvation (such as CH stretching modes). 34, 71-
78 This technique references only the gas-phase DFT structures of the organics and does
not include contributions arising from water nor variations in those organic modes
sensitive to their solvation environment. For this reason, the calculated response of the
OH stretching region cannot be relied upon to the reproduce the experimental spectra.
While not shown here, the calculated VSF responses of the organic OH stretching modes
(as well as those of the other modes discussed here) are provided in Table D2.
Figure 6.5 shows the experimental VSF spectra for solutions of 1M PA
(compared to the published FTIR spectrum of crude PPA and ZYA 45) and calculated
VSF responses for the mixed PA species simulation in the C=C/C=O stretching (Fig.
6.5A,B) and CH stretching regions (Fig. 6.5 C-F) and for both the ssp (Fig. 6.5 A-D) and
sps (Fig. 6.5 E,F) polarization schemes. The calculated VSF responses in Figure 6.5
(B,D,F) are displayed in the form of ‘stick spectra’. These stick spectra represent
intensities and phases (positive intensity indicating positive phase, and vice versa) of the
VSF response for the individual modes of each conformation of each species. This allows
for comparison of pertinent areas of the experimental spectra with the corresponding stick
spectra. As VSF is highly sensitive to phase, variations in local intensity can be explained
by a superposition of resonances with mixed positive and negative amplitude (i.e.
constructive or destructive interference). Examination of the phases and relative
intensities of the calculated stick spectra can provide the context needed to decouple such
interactions in the experimental results.
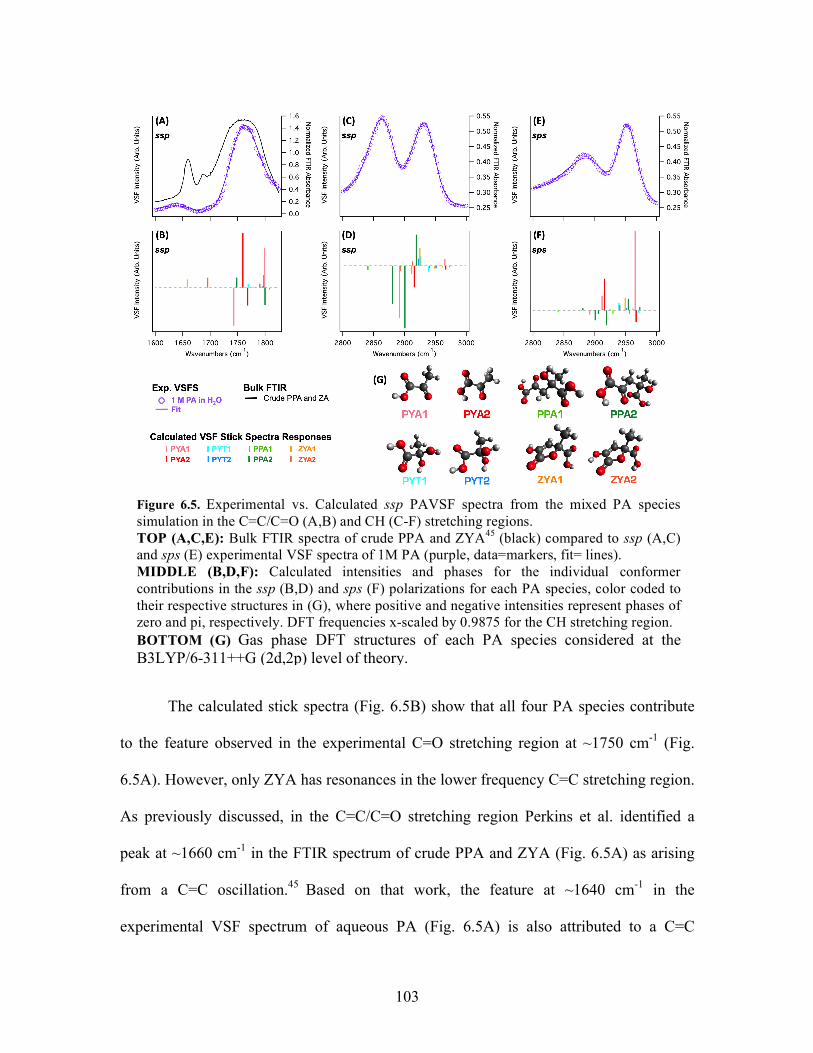
103
The calculated stick spectra (Fig. 6.5B) show that all four PA species contribute
to the feature observed in the experimental C=O stretching region at ~1750 cm-1 (Fig.
6.5A). However, only ZYA has resonances in the lower frequency C=C stretching region.
As previously discussed, in the C=C/C=O stretching region Perkins et al. identified a
peak at ~1660 cm-1 in the FTIR spectrum of crude PPA and ZYA (Fig. 6.5A) as arising
from a C=C oscillation.45 Based on that work, the feature at ~1640 cm-1 in the
experimental VSF spectrum of aqueous PA (Fig. 6.5A) is also attributed to a C=C
Figure 6.5. Experimental vs. Calculated ssp PAVSF spectra from the mixed PA species simulation in the C=C/C=O (A,B) and CH (C-F) stretching regions. TOP (A,C,E): Bulk FTIR spectra of crude PPA and ZYA45 (black) compared to ssp (A,C) and sps (E) experimental VSF spectra of 1M PA (purple, data=markers, fit= lines). MIDDLE (B,D,F): Calculated intensities and phases for the individual conformer contributions in the ssp (B,D) and sps (F) polarizations for each PA species, color coded to their respective structures in (G), where positive and negative intensities represent phases of zero and pi, respectively. DFT frequencies x-scaled by 0.9875 for the CH stretching region. BOTTOM (G) Gas phase DFT structures of each PA species considered at the B3LYP/6-311++G (2d,2p) level of theory.
104
stretching mode of ZYA oligomers naturally occurring within PA solutions. Figure 6.5B
shows that the calculated VSF responses support this assignment, as the C=C modes of
ZYA1 and ZYA2 at 1658 and 1695 cm-1, respectively, are the only spectral contributions
of any species below 1700 cm-1. Interestingly, closer examination of the FTIR spectrum
shows a second peak at ~1685 cm-1, which is intriguingly close to both the dip centered at
~1685 cm-1 in the experimental VSF spectrum and the calculated VSF response at 1695
cm-1 from the C=C stretching mode of ZYA2. Further work will need to be done to
explore if in fact a second, higher frequency C=C resonance could be present at the
interface, and if so, perhaps destructively interfering with adjacent modes to produce the
dip observed in the experimental VSF spectrum.
In the CH stretching region, the experimental ssp VSF spectra (Fig. 6.5C) shows
two regions of significant intensity (~2860 and ~2940 cm-1) on either side of a lower
intensity region (~2900 cm-1). Insight is gained once again from the calculated VSF
responses: the corresponding stick spectra (Fig. 6.5D) show both PYA and PYT
contribute little to no intensity to the feature at ~2860 cm-1, while PPA does, particularly
the PYA2 conformer. Furthermore, it can be seen that when including the resonances of
both monomeric and oligomeric species, the combined phase interactions reproduce the
observed experimental intensities: the responses in the ~2860 and ~2940 cm-1 are largely
negative in phase while the ~2900 cm-1 is predominantly positive, resulting in
constructive interferences in the high and low frequency sides of the spectrum and
destructive interferences in the central region.
Similar results are seen for the sps CH stretching region (Fig. 6.5 E,F), where
once again the inclusion of PPA resonances provide intensity to the lower frequency
105
region where a feature is observed at ~2860 cm-1 in the experimental VSF spectrum.
Likewise, destructive interference from the intense and oppositely phased responses at
~2920 cm-1 line up well with the dip in the experimental spectrum at the same position.
Notably, in both the ssp and sps calculated CH spectra, it can be seen that the
CH3-SS modes of PYT occur slightly to the blue of PYA’s (supporting the experimental
fits). Additionally, the calculated responses indicate the asymmetric stretching (AS)
modes of all constituents have strong sps responses, but are negligible in the ssp. This is
in agreement with known selection rules of VSFS84 and could account for the apparent
frequency shift between polarization schemes of the ~2940 cm-1 feature in the
experimental VSF spectra. While AS modes have not been included in the experimental
fits, these results indicate their likely contribution to the sps spectrum.
The computational results demonstrate that along with PYA and PYT, both PPA
and ZYA are surface active. With this additional evidence, it becomes clear that these
oligomers are significant contributors to interfacial population. Even with only a limited
subset of conformers, PPA and ZYA have been shown to have strong VSF responses that
can account for the additional features observed in the experimental spectra, and thus
merit a full computational workup in the future.
Conclusions
Surface tensiometry (ST) and vibrational sum frequency (VSF) experimental
results of aqueous PA solutions along with computational results for simulations of
monomeric PA (PYA, PYT) and two PA oligomer species (PPA and ZYA) have been
106
presented. These results demonstrate that the experimental VSF spectra contain strong
responses arising from vibrational modes of functional groups not found in the
monomeric forms, suggesting the presence of oligomeric species at the interface. ST of
the neat-PA systems revealed higher than anticipated surface activity, further indicating
the contributions of additional interfacially active species. While the formation of
favorable PA oligomeric reaction products in the bulk have been well documented, their
presence at the air-water interface and relative surface affinity had not been previously
established. The computational results demonstrate that along with PYA and PYT, both
PPA and ZYA are surface active and have strong VSF responses that can account for the
additional features observed in the experimental spectra.
As previously stated, PPA and ZYA are just two of many possible oligomeric
species known to form from PA. Furthermore, numerous other secondary organics have
been shown to form favorable oligomer species This system and many others would
benefit from further and more detailed exploration using more focused experimental and
computational techniques, such as, respectively, phase sensitive Heterodyne-Detected
sum frequency generation spectroscopy (HD-SFG) 93,98 and DFT calculations of
microsolvated structures.75
As larger molecular weight species can have substantial impact on aerosol
properties, these are significant findings for the atmospheric community. The specific
implications of the presence of interfacially active oligomers and their affect on the
chemistry of said interfaces will require further work, but the current finding are
sufficient to demonstrate the presence of these oligomers at the interface.
107
CHAPTER VII
The Influence of NaCl on Methylglyoxal Surface Adsorption and Hydration State at
the Air-Water Interface
The contents of this chapter have been or are intended to be published in whole or in part. The text presented here has been modified from the publication below:
Gordon, B. P., Wren, S. N., Moore, F. G., Scatena, L. F., Richmond, G. L. Diol it up: The Influence of NaCl on Methylglyoxal Surface Adsorption and Hydration State at the Air-Water Interface. *To be submitted to Journal of Physical Chemistry A in December 2019
Bridge
Methylglyoxal (MG) – an atmospherically important α-dicarbonyl
implicated in the aqueous-phase secondary organic aerosol formation – is known to be
surface active. Due to the presence of carbonyl moieties, MG can hydrate to form
geminal diols in solution. Recently, it has been shown that MG exists predominantly as
methylglyoxal monohydrate at the neat air-water interface. However, inorganic aerosol
constituents have the potential to ‘salt-out’ methylglyoxal to the interface, shift its
hydration equilibria, and catalyze self- and cross-oligomerization reactions. Here, we
study the influence of the non-reactive salt, sodium chloride (NaCl), on MG’s surface
adsorption and hydration state using vibrational sum frequency (VSF) spectroscopy. We
show that the presence of NaCl significantly enhances MG’s surface activity, while
perturbing the water structure at the interface. Possible shifts in MG’s hydration state are
discussed. This work builds on the published studies on MG in pure water and allows
identification of how the system is perturbed by the presence of NaCl, which has
important implications for understanding MG’s atmospheric fate.
Introduction
Secondary organic aerosols (SOA) have far reaching effects on both the climate
and human health. Aerosols influence the climate directly by scattering and absorbing
108
light and indirectly by acting as nucleation sites in cloud formation. 1, 2 Aerosol
composition is complex and varied, and consists of both inorganic and organic
constituents. 3-6 Due to the high surface area to volume ratio of aerosols, molecules at
aerosol surfaces play a particularly large role in their atmospheric chemistry. 7,8
Additionally, the presence of organics and salts can significantly affect SOA properties.1-
8 However, because of the complexity of SOA, much of how these components
(individually or in concert) affect aerosol behavior remains unknown. This lack of
knowledge makes predicting formation and aging of SOA in the atmosphere very
challenging and currently a large source of error in atmospheric modeling.
Methylglyoxal (MG) is an atmospherically import and abundant α-dicarbonyl and
the uptake and aqueous phase processing of MG has been shown to be an important
source SOA. However, the chemistry underlying this SOA formation and subsequent
aging is still uncertain due to the inherent complexity of MG, as it has multiple populated
hydration states (a single hydrated diol and a doubly hydrated tetrol) 9, 10 and also forms
stable oligomer products with itself and other molecules.[x]5, 11-14
The unhydrated methylglyoxal monomer (MGM) hydrates preferably at the
aldehydic carbon (α-C) to form methylglyoxal monohydrate (or methylglyoxal diol,
MGD) in aqueous solution. The monohydrate can subsequently be hydrated at the ketonic
carbon (β-C) to form methylglyoxal dihydrate (or methylglyoxal tetrol, MGT). Both
experimental studies 9 and thermodynamic calculations 15 suggest that methylglyoxal
exists in a hydrated form in the bulk, with a MGD to MGT ratio of ~60:40. The hydration
of MG has also been shown to be depth dependent as well. Wren et al. 10 demonstrated
that this ratio is shifted at the air-water interface to favor the diol (~90% MGD to ~10%
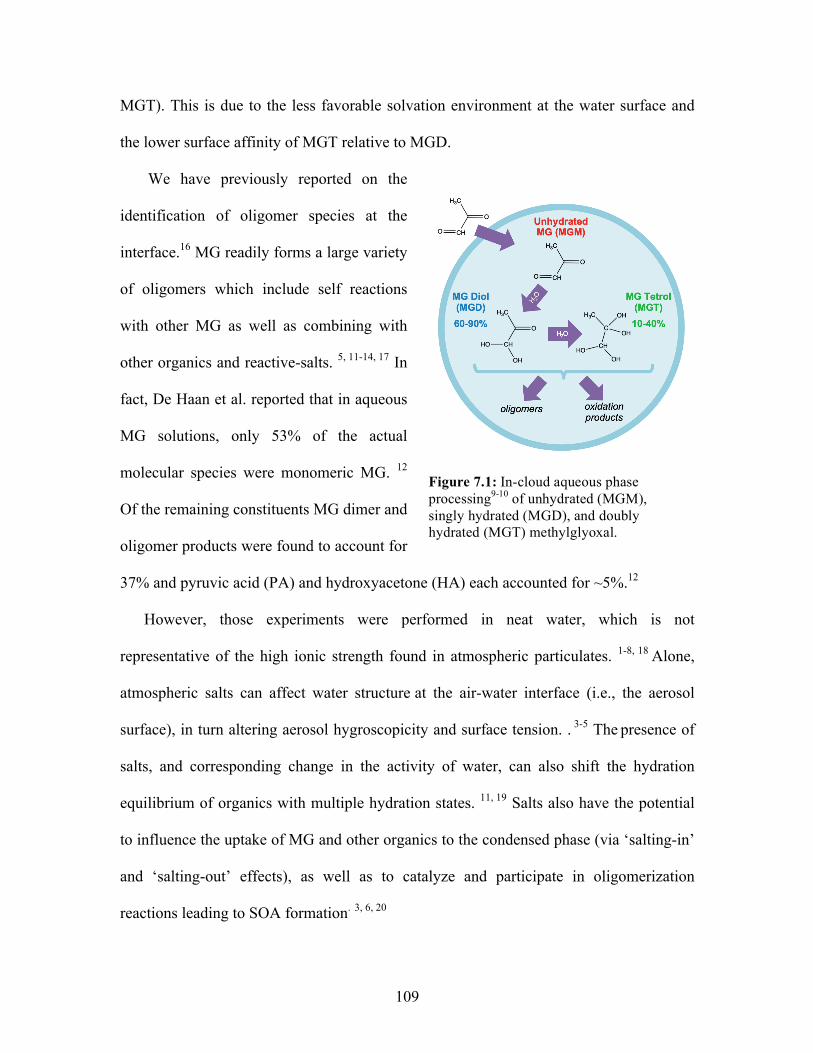
109
Figure 7.1: In-cloud aqueous phase processing9-10 of unhydrated (MGM), singly hydrated (MGD), and doubly hydrated (MGT) methylglyoxal.
MGT). This is due to the less favorable solvation environment at the water surface and
the lower surface affinity of MGT relative to MGD.
We have previously reported on the
identification of oligomer species at the
interface.16 MG readily forms a large variety
of oligomers which include self reactions
with other MG as well as combining with
other organics and reactive-salts. 5, 11-14, 17 In
fact, De Haan et al. reported that in aqueous
MG solutions, only 53% of the actual
molecular species were monomeric MG. 12
Of the remaining constituents MG dimer and
oligomer products were found to account for
37% and pyruvic acid (PA) and hydroxyacetone (HA) each accounted for ~5%.12
However, those experiments were performed in neat water, which is not
representative of the high ionic strength found in atmospheric particulates. 1-8, 18 Alone,
atmospheric salts can affect water structure at the air-water interface (i.e., the aerosol
surface), in turn altering aerosol hygroscopicity and surface tension. . 3-5 The presence of
salts, and corresponding change in the activity of water, can also shift the hydration
equilibrium of organics with multiple hydration states. 11, 19 Salts also have the potential
to influence the uptake of MG and other organics to the condensed phase (via ‘salting-in’
and ‘salting-out’ effects), as well as to catalyze and participate in oligomerization
reactions leading to SOA formation. 3, 6, 20
110
Here, ‘salting-out’ refers to enhanced bulk to surface partitioning of organics
component to the interface. Conversely, ‘salting-in’ refers to instances where salt
increases the solubility of a molecule, which can increase uptake of organics to aerosol
from the gas phase. 3, 6, 18, 20-22
Considering the multiple favorable hydration and oligomer species that form
spontaneously in MG solutions, it is clear that this system cannot be treated as a single
organic and instead should be viewed as a mixed system. This distinction is important as
it has been observed that aerosols with multiple organic species can have unpredicted
synergistic effects on aerosol surface tension and hygroscopicity, particularly in the
presence of salt. 6, 23 These effects have been ascribed to the adsorption of mixed organics
to the particle interface and exceed what would be expected based on predictions from
bulk properties.6,23 Changes in these properties can have important atmospheric
consequences, such as enhancing aerosol cloud nucleation activity. 1-3, 6, 23
In this study, the influence of the non-reactive salt NaCl on MG’s surface behavior at
the air-water interface is examined using vibrational sum frequency (VSF) spectroscopy
and surface tensiometry. A combination of computational density functional theory
(DFT) and molecular dynamics (MD) are employed to further decouple and understand
the interfacial species of this system. The results indicated the hydration equilibrium of
MG is further shifted to favor the diol as the predominant species at the interface, with
lesser amounts MGT. However, MGD is not alone at the interface and is joined by what
is likely a multitude of oligomeric species in lower concentrations. This work has
implications for understanding the atmospheric fate of methylglyoxal and other important
α-dicarbonyls.
111
Methods
Vibrational Sum Frequency (VSF) Spectroscopy Theory
Vibrational sum frequency (VSF) spectroscopy is a surface selective technique
ideally suited to the study of molecules at interfaces. VSF spectroscopy is a well-
established technique .10, 24-59 and only a brief description is provided here. A fixed-
frequency visible (VIS) is overlapped spatially and temporally with a tunable IR beam at
an aqueous surface, producing a third beam at the sum of the two incident frequencies
(the sum frequency beam). When the IR field is coincident with a vibrational mode that is
both IR and Raman active there is a resonant enhancement in the intensity of the sum
frequency (SF) beam. Selection rules additionally require that the vibrational mode reside
in a region of broken symmetry, hence molecules residing in an asymmetric environment
(such as that present at an interface) give rise to a SF response while those residing in a
symmetric environment (the isotropic bulk) do not.
The intensity of generated SF signal is proportional to the square modulus of the
second-order susceptibility, χ(2), which has both resonant and nonresonant components.
The resonant component is proportional to the number of contributing molecules, N, and
the orientational average of the molecular hyperpolarizability, β. Therefore VSF spectra
contain information about surface population and orientation.
VSF spectroscopy is a coherence technique leading to the constructive and
destructive interference of overlapping modes. A standard fitting routine is used to
deconvolve the nonresonant signal and the individual resonant modes.24:
!(!) = !!"(!)!!" +!!!!!!!! !!!!!/!!!
!
!!!!!"!!!!!!!!
!!! (7.1)
112
The first term is the nonresonant second-order susceptibility and is described by an
amplitude and a phase, ψ. The second term describes the resonant contribution and is a
sum over the individual resonant vibrational modes. The line shape of each mode is fit as
convolution of empirical homogenous, ΓL, and inhomogeneous broadening, Γν. The
amplitude, Aν, describes the transition strength and contains the product of the number of
contributing molecules and the IR and Raman transition probabilities. The frequencies of
the Lorentzian, IR, and resonant vibrational mode are given by ωL, ωIR, and ων
respectively. The phase of each resonant mode is given by φν and is either 0 or π. In this
work, Lorentzians of 2 cm-1, 5 cm-1 and 12 cm-1 were used to describe the CH, both the
coordinated OH and C=O, and the ‘free OH’ vibrational modes respectively. 60-63
Laser System
VSF spectra were obtained using a picosecond sum frequency system that has been
fully described elsewhere. Gordon, 2018 #326; Gordon, 2019 #373} Briefly, a mode-
locked Ti:Sapphire system in tandem with an ultrafast regenerative amplifier is used to
produce a pulsed visible (VIS) beam centered at 800 nm. A portion of the visible beam is
sent through an optical parametric amplifier (OPA) in tandem with a difference frequency
generator (DFG) to produce a tunable IR beam (2.5 – 12 µm). The visible and IR beams
are copropagated to the interface at 63˚ and 55˚from the surface normal, respectively.
The resulting sum frequency beam is detected using a thermoelectrically-cooled CCD
camera. Samples are held in scrupulously clean, shallow glass dishes on a translatable
stage.
113
Spectral Analysis
VSF spectra were acquired by measuring the intensity of the SF beam as the tunable
IR beam was scanned in 3 cm-1 increments over the relevant spectral range (~2700 –
3850 cm-1 for the CH/OH stretching region, ~1500 – 1850 cm-1 for the C=C/C=O
stretching region). Spectra were acquired in the ssp and sps polarization schemes where
the three letters denote the polarizations of the sum frequency, visible and IR beams
respectively. The different polarization schemes allow different molecular orientations to
be probed with ssp and sps probing molecular dipole components perpendicular and
parallel to the interface respectively. All spectra presented here have been normalized to
the nonresonant response off an uncoated gold surface. IR wavelengths were calibrated
daily against a polystyrene standard. Presented spectra are averages from > 3 scans. All
measurements were performed at ambient temperature (~20 ˚C).
Surface Tensions Measurements
Surface tension measurements were performed using the Wilhelmy plate method.
Solutions were placed in a clean glass dish, and a Pt plate was lowered to the air-water
water interface. A force balance (KSV Instruments) measuring the force acting on the Pt
plate, was used to obtain surface tension (mN m-1) data as a function of time (s). Surface
tensions (γ) were converted to surface pressures (π) by subtracting the daily-measured
surface tension of water. The Pt plate was rinsed with nanopure water and cleaned under
flame between measurements.
114
Sample Preparation
Aqueous MG solutions were prepared volumetrically by diluting an aqueous stock
MG solution (40 wt%, Sigma Aldrich) in nanopure (18.2 MΩ cm) water. The NaCl salt
(ACS grade > 99.0%, EMD Chemicals) was baked at 220 ˚C for at least 48 hours before
use to eliminate organic contaminants. Solutions were prepared ≥ 24 hours before use and
stored in Pyrex glass flasks. Solutions were not further protected since photochemical
degradation was not a concern. 3
Computational Methods
Molecular dynamics (MD) simulations are performed using the Amber 1264 suite
of programs from starting configurations generated by PACKMOL. .65 Parameters and
force fields are derived in the same manner described in previous studies. 10, 31-38
Simulations of pure systems refer to those previously reported for neat-MG and were not
repeated here. Classical molecular dynamics (MD) simulations were performed for
systems of isolated nonreactive MG hydration species and 1M NaCl. In each simulation,
16 MG, 16 NaCl, and 900 water molecules are arranged to form a 30 Å cube within a 30
Å x 120 Å x 30 Å simulation box (corresponding to ~1M organic and salt concentrations)
with periodic boundary conditions, creating a water slab with two interfaces. These
simulations are energy minimized at 0 K and then equilibrated from 0 K to 298 K over 2
ns followed by subsequent evolution at 298 K for 50 ns in 1 fs time steps.
The results of these simulations were combined with quantum mechanical density
functional theory (DFT) conformer libraries created for the previously reported neat-MG
using the Gaussian 0966 program package at the B3LYP /6-311++G(2d,2p) level of
115
theory. These DFT libraries include energy optimized stationary point structures,
harmonic frequencies and anharmonic correction, as well as polarizabilities and dipole
moment derivatives calculated using three-point finite differentiation. MD trajectories are
analyzed at every time-step to match molecule conformations the library of gas-phase
DFT structures using an in-house code. 31 Density profiles, and bond angle orientations
are determined for each MG hydration species.
To generate VSF intensities and phases, the code combines the MD and DFT
results to approximate the second-order nonlinear susceptibility response tensor for each
normal mode of a given MG conformer according to Equation (2).
!!"#(!) ∝ !!"#!!!"!!!
!!!!!!!,!,!
(7.2)
In Equation (2), α is the molecular polarizability, µ is the dipole moment, Qq is the
normal coordinate of the mode q, and C is a geometrical factor relating the molecular and
laboratory reference frames.
The results from simulations of mixed MGD and MGT were not found to differ
appreciably from simulations of “pure” hydration species. As such, this discussion will
include only the results of the pure simulations of 16 molecules (~1M organic
concentration) of MGM, MGD, or MGT (only one type of hydration species per
simulation.)
116
Experimental Results and Discussion
Surface Tension
Surface pressure isotherms at constant NaCl concentration (0 M and 3 M) and
varying MG concentration are shown in Figure 7.2A. Methylglyoxal in neat water has
previously 3, 10 been shown to be strongly surface active, with a maximum surface
pressure > 15 mN/m. The addition of 1M NaCl further increases this surface activity by
~3 to 5 mN/m on average. Sareen et al. 3 also measured the surface tension of mixed
NaCl-MG systems and found that the presence of NaCl enhances MG’s surface activity
(up to 10 mN/m for 5.1M salt). They attribute the enhanced surface activity to a salting-
out influence of NaCl. However, it is important to note that the salting-out affect of NaCl
is significantly less than other salts. 3, 18 Indeed, the overall increase in SP with the
addition of salt is somewhat minimal when viewed in context of the surface pressure
isotherm of other similar organics.
The surface pressures isotherms of pyruvic acid (PA)16 and hydroxyacetone (HA) 38
are also displayed in Figure 7.2A. Similar to MG, PA is a dicarboxylic acid with two
favorable hydration states (unhydrated PA and a hydrated PA triol, Fig. 7.2B, top) as well
as a multitude of oligomer products such as zymonic acid and parapyruvic acid. 16, 19, 67-79
Conversely, HA is an α-hydroxyketone that is known to exist 96-98% in its unhydrated
monomeric form in aqueous solutions (Fig. 7.2B, bottom). 38, 80 HA is very similar in
structure to the MG diol, differing only in having a second hydrogen atom in place of one
of MGD’s geminal diols.
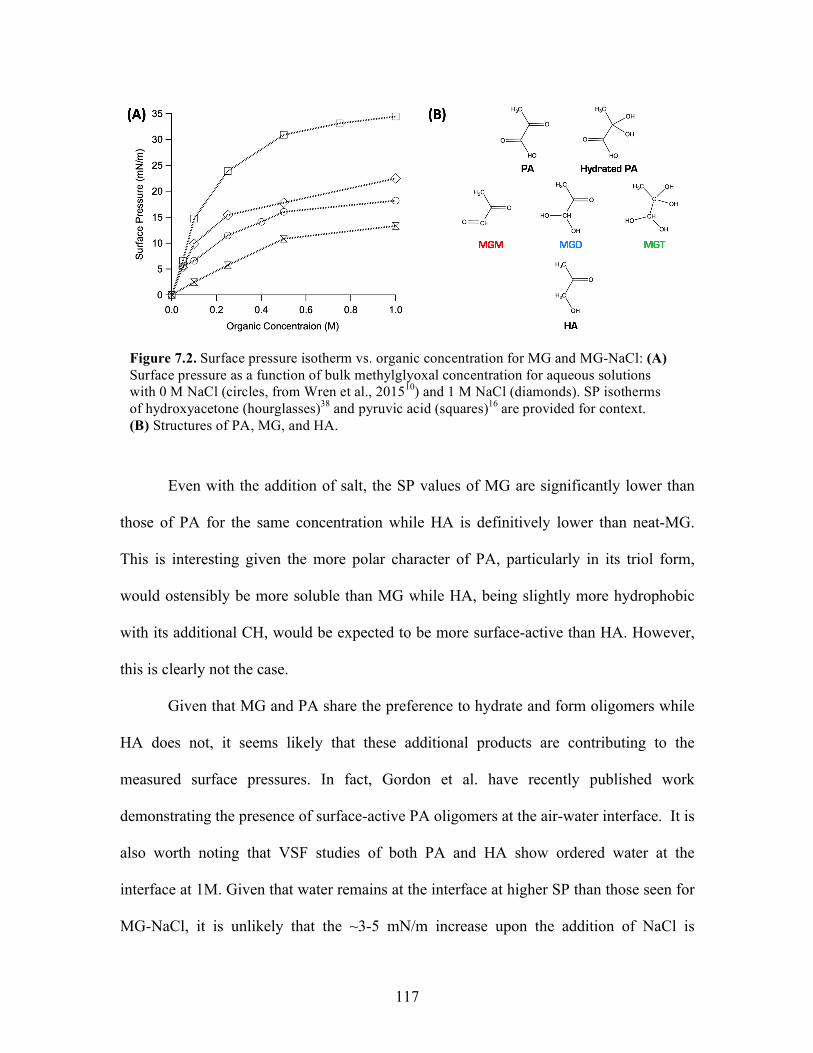
117
Even with the addition of salt, the SP values of MG are significantly lower than
those of PA for the same concentration while HA is definitively lower than neat-MG.
This is interesting given the more polar character of PA, particularly in its triol form,
would ostensibly be more soluble than MG while HA, being slightly more hydrophobic
with its additional CH, would be expected to be more surface-active than HA. However,
this is clearly not the case.
Given that MG and PA share the preference to hydrate and form oligomers while
HA does not, it seems likely that these additional products are contributing to the
measured surface pressures. In fact, Gordon et al. have recently published work
demonstrating the presence of surface-active PA oligomers at the air-water interface. It is
also worth noting that VSF studies of both PA and HA show ordered water at the
interface at 1M. Given that water remains at the interface at higher SP than those seen for
MG-NaCl, it is unlikely that the ~3-5 mN/m increase upon the addition of NaCl is
Figure 7.2. Surface pressure isotherm vs. organic concentration for MG and MG-NaCl: (A) Surface pressure as a function of bulk methylglyoxal concentration for aqueous solutions with 0 M NaCl (circles, from Wren et al., 201510) and 1 M NaCl (diamonds). SP isotherms of hydroxyacetone (hourglasses)38 and pyruvic acid (squares)16 are provided for context. (B) Structures of PA, MG, and HA.

118
enough to exclude water from the interface in MG solutions. Overall, it becomes clear
that while salt definitely increases surface partitioning in MG solutions, other factors are
at play as well.
VSF Spectroscopy Results
We have previously reported on MG’s surface behavior at the air-water interface.
10 However, since that time a significant number of improvements to the picosecond laser
system have resulted in much-increased signal to noise, yielding superior data and
revealing spectral features previously buried in, or nearly in, the noise level. This has
allowed for a more in-depth analysis and resulting fits than was previously available. As
such, updated spectra (Figure 7.3) and fitting assignments (Table 7.1) of the MG-Neat
water system will be included this discussion.
VSF spectra were acquired in the ssp and sps polarizations of the C=C/C=O (Fig.
7.3A,D), C-H (Fig. 7.3B,E), and O-H (Fig. 7.3C,F) stretching regions for neat water and
1M MG with varying NaCl concentration (0.01, 0.05, 0.1, 0.25, 0.50, and 1 M). A brief
discussion on the VSF spectra of neat water is provided in the Appendix E. Each spectral
region contains strong VSF responses arising from MG and dramatic changes are
observed upon the addition of NaCl.
In Brief, at the neat air-water interface, shows strong contributions from MG are
visible in the C=O, CH, and OH stretching regions. A notable feature in the neat-MG
spectrum is the enhancement of coordinated OH stretching modes between 3100 -3600
cm-1. The additional of salt appears to suppress this coordination while also the intensity
of the lower frequency CH stretching modes increases. While the reasons for these
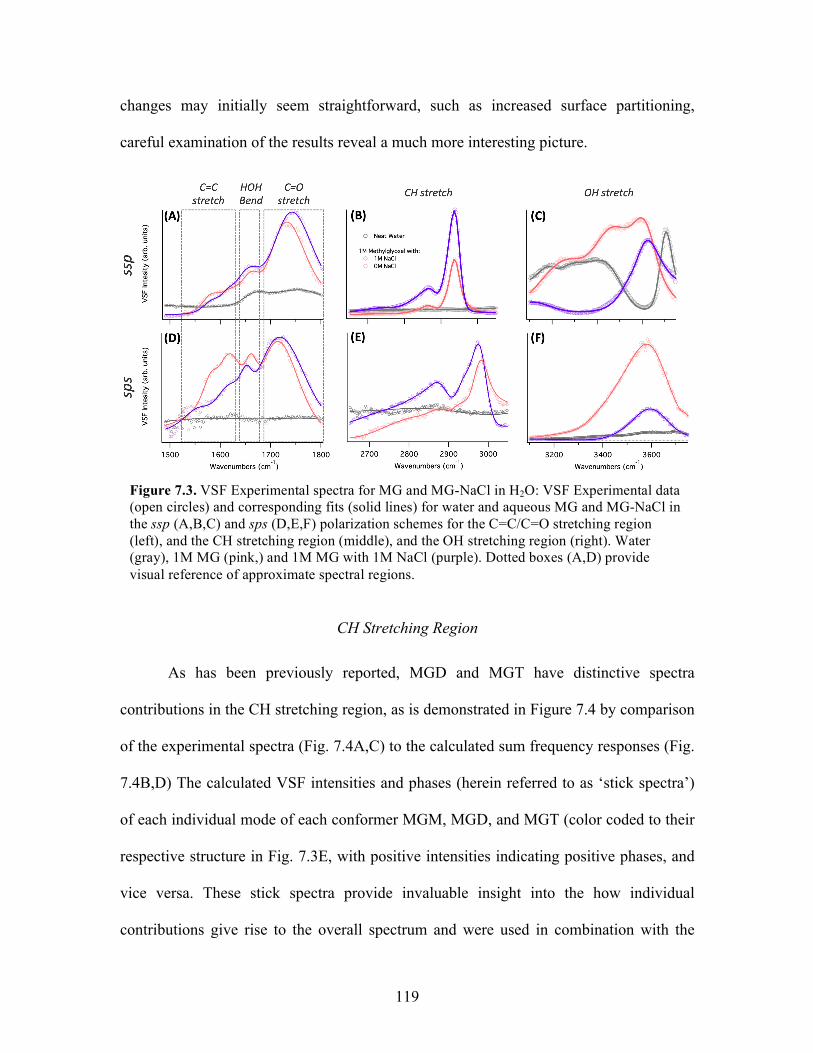
119
changes may initially seem straightforward, such as increased surface partitioning,
careful examination of the results reveal a much more interesting picture.
CH Stretching Region
As has been previously reported, MGD and MGT have distinctive spectra
contributions in the CH stretching region, as is demonstrated in Figure 7.4 by comparison
of the experimental spectra (Fig. 7.4A,C) to the calculated sum frequency responses (Fig.
7.4B,D) The calculated VSF intensities and phases (herein referred to as ‘stick spectra’)
of each individual mode of each conformer MGM, MGD, and MGT (color coded to their
respective structure in Fig. 7.3E, with positive intensities indicating positive phases, and
vice versa. These stick spectra provide invaluable insight into the how individual
contributions give rise to the overall spectrum and were used in combination with the
Figure 7.3. VSF Experimental spectra for MG and MG-NaCl in H2O: VSF Experimental data (open circles) and corresponding fits (solid lines) for water and aqueous MG and MG-NaCl in the ssp (A,B,C) and sps (D,E,F) polarization schemes for the C=C/C=O stretching region (left), and the CH stretching region (middle), and the OH stretching region (right). Water (gray), 1M MG (pink,) and 1M MG with 1M NaCl (purple). Dotted boxes (A,D) provide visual reference of approximate spectral regions.

120
calculated density profiles to determine he diol to tetrol ratio is greater at the interface
than in the bulk, favoring the diol (40% MGD to 60% MGT in the bulk 9 versus 90%
MGD to 10% MGT at the interface10
For the neat-MG system, two broad features dominate the CH stretching region
(Fig 7.4A,C). In both polarizations, a broad lower frequency peak between 2860 cm-1 and
2870 cm-1 is attributed primarily to the α-CH stretching mode of MGD (blue). The higher
frequency peak is centered at ~2935 cm-1 and ~2975 cm-1 for the ssp and sps
polarizations, respectively, and is contains contributions from both the symmetric methyl
stretching mode of MGD (blue) and the α-CH stretching mode of MGT (MGT). Another
important feature in the ssp polarization, spectrum is the lower energy shoulder centered
at ~2980 cm-1 which has previously been found to primarily arise from the symmetric
methyl stretching mode of MGT. Similarly, the sps polarization spectrum also exhibits a
shoulder on the high energy side of the region. This shoulder is centered at ~3000 cm-1
and contains responses from the asymmetric methyl stretching modes of both MGD and
MGT.
The addition of salt creates distinct intensity changes in CH stretching region, but
fits revealed no appreciable shift in frequency position. In both polarizations, the two
dominant spectral features dramatically increase in intensity with increasing salt but the
intensity of the high frequency shoulders also sharply decreases. Spectral fitting indicates
the intensity changes observed in the coordinated OH region (discussed further below) do
not affect the CH stretching fit intensities and thus do not account for this behavior. As
these intensity changes are consistent between polarizations, they cannot be explained by
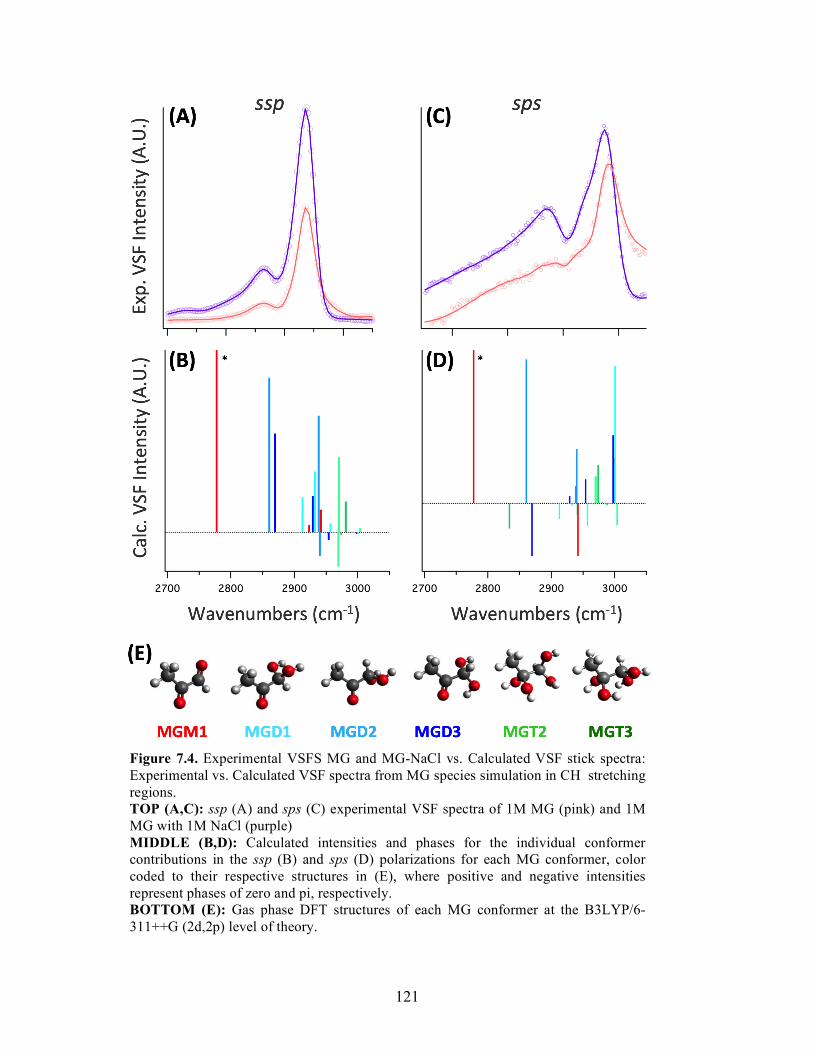
121
Figure 7.4. Experimental VSFS MG and MG-NaCl vs. Calculated VSF stick spectra: Experimental vs. Calculated VSF spectra from MG species simulation in CH stretching regions. TOP (A,C): ssp (A) and sps (C) experimental VSF spectra of 1M MG (pink) and 1M MG with 1M NaCl (purple) MIDDLE (B,D): Calculated intensities and phases for the individual conformer contributions in the ssp (B) and sps (D) polarizations for each MG conformer, color coded to their respective structures in (E), where positive and negative intensities represent phases of zero and pi, respectively. BOTTOM (E): Gas phase DFT structures of each MG conformer at the B3LYP/6-311++G (2d,2p) level of theory.
122
reorientation. Likewise, the intensity does not uniformly increase and so cannot be
entirely justified by increased surface population, either.
As previously stated and demonstrated in Figure 7.4B,D, the lower frequency
feature at 2870 cm-1 is arises primarily from MGD while the majority of MGT
contribution occur above 2940 cm-1. Given this, it becomes clear in the MG-NaCl system,
there is an overall increase in intensity for modes associated with MGD (and potentially
MGM). Conversely, modes associated with MGT decreased in intensity, indicating that
these changes are related to MG’s hydration equilibrium.
It is worth noting that in both polarizations a broad low intensity region centered
around ~2725 cm-1 extends to the low frequency side of the spectrum, which also
increases with added NaCl. This intensity could be arising from two potential sources: (1)
the aldehydic CH stretching mode of MGM10 and/or (2) OH stretching modes from
hydrogen bonded carboxylic acid dimers of MG oligomer products. 67 Option 1 would be
in line with a shift in the MG equilibrium towards its less hydrated forms while option 2
could indicate an increase in MG oligomer formation, which has been observed with the
loss of water in drying studies of MG. While the source of this mode cannot be resolved
here, either of these options indicates noteworthy chemistry is occurring at the interface.
C=C/C=O Stretching & HOH Bending Region
The region from ~1500-1800cm-1 has a high degree of spectral density, containing
modes from MG C=O stretching, water bending, and (as will be demonstrated below)
C=C stretching modes from MG oligomers.
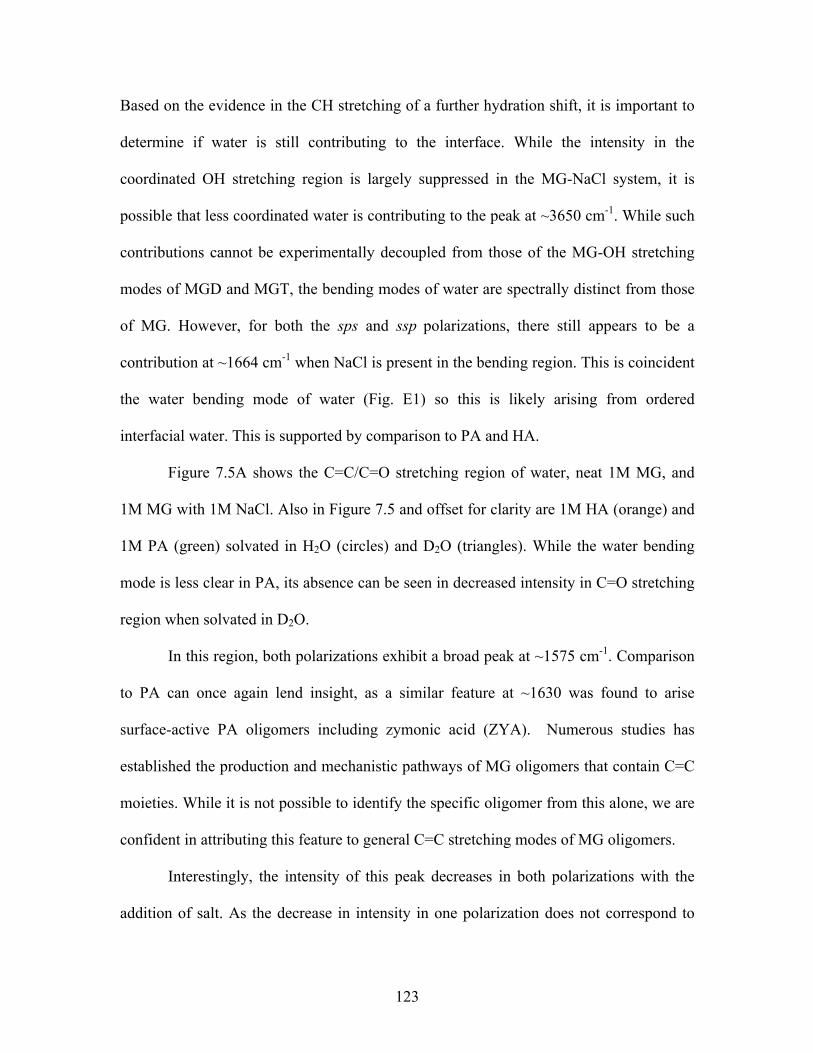
123
Based on the evidence in the CH stretching of a further hydration shift, it is important to
determine if water is still contributing to the interface. While the intensity in the
coordinated OH stretching region is largely suppressed in the MG-NaCl system, it is
possible that less coordinated water is contributing to the peak at ~3650 cm-1. While such
contributions cannot be experimentally decoupled from those of the MG-OH stretching
modes of MGD and MGT, the bending modes of water are spectrally distinct from those
of MG. However, for both the sps and ssp polarizations, there still appears to be a
contribution at ~1664 cm-1 when NaCl is present in the bending region. This is coincident
the water bending mode of water (Fig. E1) so this is likely arising from ordered
interfacial water. This is supported by comparison to PA and HA.
Figure 7.5A shows the C=C/C=O stretching region of water, neat 1M MG, and
1M MG with 1M NaCl. Also in Figure 7.5 and offset for clarity are 1M HA (orange) and
1M PA (green) solvated in H2O (circles) and D2O (triangles). While the water bending
mode is less clear in PA, its absence can be seen in decreased intensity in C=O stretching
region when solvated in D2O.
In this region, both polarizations exhibit a broad peak at ~1575 cm-1. Comparison
to PA can once again lend insight, as a similar feature at ~1630 was found to arise
surface-active PA oligomers including zymonic acid (ZYA). Numerous studies has
established the production and mechanistic pathways of MG oligomers that contain C=C
moieties. While it is not possible to identify the specific oligomer from this alone, we are
confident in attributing this feature to general C=C stretching modes of MG oligomers.
Interestingly, the intensity of this peak decreases in both polarizations with the
addition of salt. As the decrease in intensity in one polarization does not correspond to
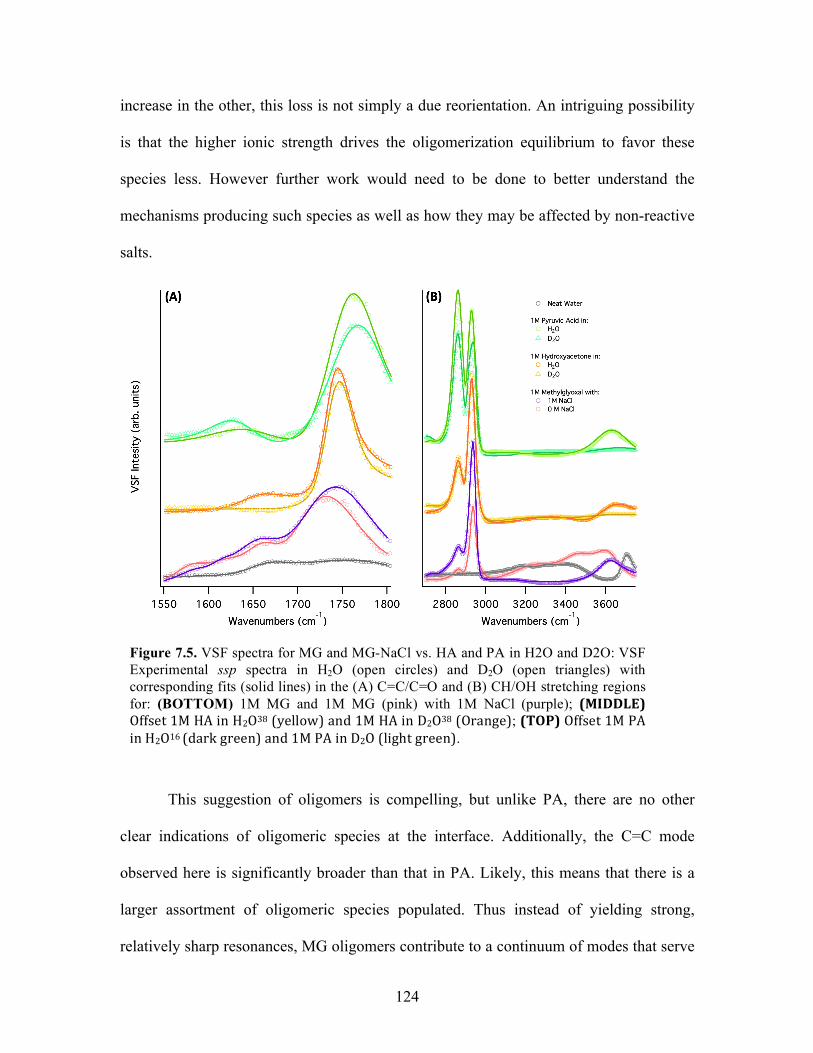
124
increase in the other, this loss is not simply a due reorientation. An intriguing possibility
is that the higher ionic strength drives the oligomerization equilibrium to favor these
species less. However further work would need to be done to better understand the
mechanisms producing such species as well as how they may be affected by non-reactive
salts.
This suggestion of oligomers is compelling, but unlike PA, there are no other
clear indications of oligomeric species at the interface. Additionally, the C=C mode
observed here is significantly broader than that in PA. Likely, this means that there is a
larger assortment of oligomeric species populated. Thus instead of yielding strong,
relatively sharp resonances, MG oligomers contribute to a continuum of modes that serve
Figure 7.5. VSF spectra for MG and MG-NaCl vs. HA and PA in H2O and D2O: VSF Experimental ssp spectra in H2O (open circles) and D2O (open triangles) with corresponding fits (solid lines) in the (A) C=C/C=O and (B) CH/OH stretching regions for: (BOTTOM) 1M MG and 1M MG (pink) with 1M NaCl (purple); (MIDDLE)Offset1MHAinH2O38(yellow)and1MHAinD2O38(Orange); (TOP)Offset1MPAinH2O16(darkgreen)and1MPAinD2O(lightgreen).
125
to further broaden and obscure the spectra. Likewise, any MG oligomer species present
that share similar resonance frequencies to those of the monomeric MG will contribute to
the overall spectral broadening and congestion in their respective regions. Exploring the
potential oligomeric products of MG is beyond the scope of this work, significant insight
can be gained by computationally examining the MG hydration equilibrium.
OH stretching region
In both polarizations, the OH stretching region of neat MG is substantially
enhanced above that of neat water. This was previously observed for MG but a definitive
cause could not be identified.
In the more distinctive ssp spectra, much of the characteristic spectral shape and
underlying frequencies of coordinated OH modes are preserved in the enhanced MG OH
stretching spectra. Additionally, this region’s intensity is not extended to lower
frequencies, as is generally seen when the response of coordinated OH modes is
enhanced due to field effects from charged species. However, here it can be seen that this
enhancement diminishes with increasing salt concentration, as shown in Figure 7.6,
providing us insight into this previously enigmatic observation.

126
Figure 7.5B shows the CH/OH stretching region of water, neat 1M MG, and 1M
MG with 1M NaCl compared to offset 1M HA (orange) and 1M PA (green) solvated in
H2O (circles) versus D2O (triangles). Looking at the OH stretching region of both HA
and PA, it is clear that the enhancement observed with neat-MG and low ionic strength
Figure 7.6. VSF spectra of MG and MG-NaCl CH/OH stretching region: Offset VSF Experimental data (open circles) and corresponding fits (solid lines) for water (gray) and aqueous 1 M MG solutions with increasing NaCl concentration in the ssp CH/OH stretching region. Offset traces correspond to 1M MG with 0M NaCl (pink), 0.01M NaCl (red), 0.05M NaCl (orange), 0.1M NaCl (yellow), 0.25M NaCl (greener), 0.5M NaCl (blue), and 1M NaCl (purple).
127
MG-NaCl is not the norm for these system. Again, this suggests that the loss of
coordinated OH intensity with increasing salt is actually a return to the conventional line
shape for these kinds of molecule.
Given this as well as the changes observed in the CH stretching region provides a
potential explanation: The salt, as well as the increased overall MG surface presence from
salting out effects, has decreased the total amount of water at the interface available for
hydration, making it less favorable to hydrate MGD an additional time to form MGT. As
MGT has four OH groups, it has the ability enhance the ordered hydrogen bonding
beyond that of any of the other hydration species of MG and PA or of HA. As the
hydration equilibrium shifts with increasing NaCl to further favor MGD, this heightened
H-bonding is decreases until the coordinated OH stretching returns to the more expected
line shape at ~0.1M NaCl and above.
Thus, we conclude that the presence of salt, as well as the increased overall MG
surface presence from salting out effects, has decreased the total amount/activity of water
at the interface available for hydration, making it less favorable to hydrate MGD an
additional time to form MGT.
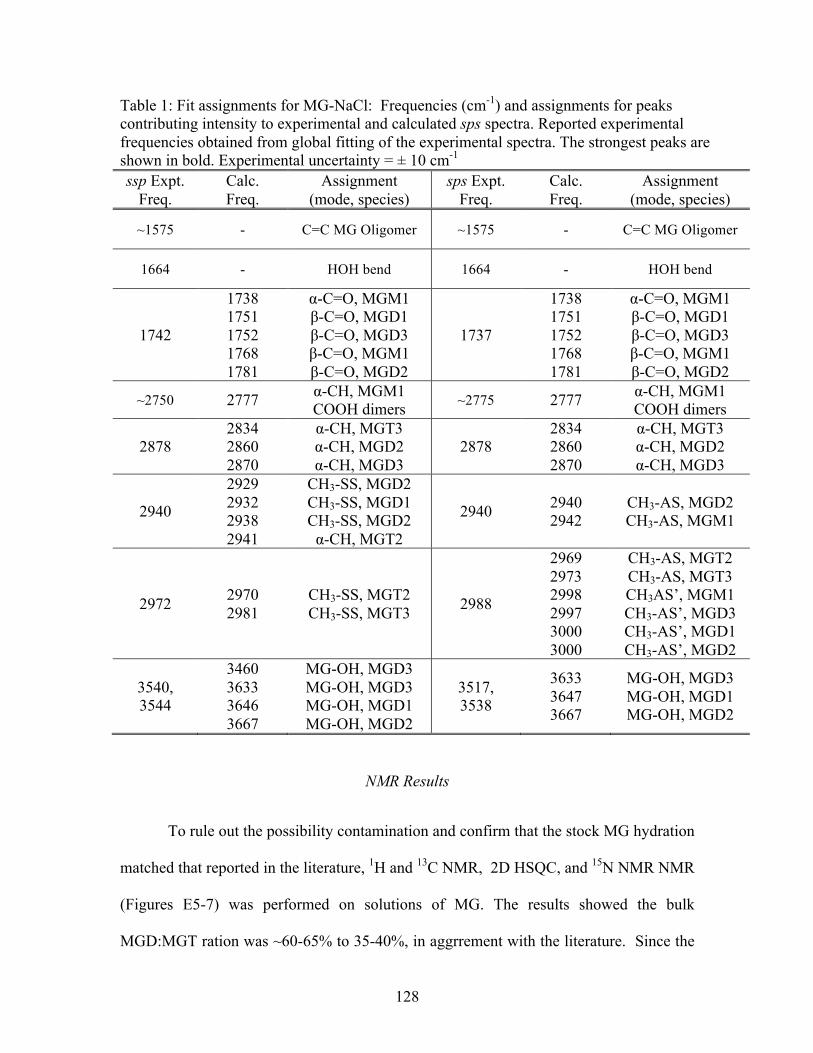
128
Table 1: Fit assignments for MG-NaCl: Frequencies (cm-1) and assignments for peaks contributing intensity to experimental and calculated sps spectra. Reported experimental frequencies obtained from global fitting of the experimental spectra. The strongest peaks are shown in bold. Experimental uncertainty = ± 10 cm-1 ssp Expt.
Freq. Calc. Freq.
Assignment (mode, species)
sps Expt. Freq.
Calc. Freq.
Assignment (mode, species)
~1575 - C=C MG Oligomer ~1575 - C=C MG Oligomer
1664 - HOH bend 1664 - HOH bend
1742
1738 1751 1752 1768 1781
α-C=O, MGM1 β-C=O, MGD1 β-C=O, MGD3 β-C=O, MGM1 β-C=O, MGD2
1737
1738 1751 1752 1768 1781
α-C=O, MGM1 β-C=O, MGD1 β-C=O, MGD3 β-C=O, MGM1 β-C=O, MGD2
~2750 2777 α-CH, MGM1 COOH dimers ~2775 2777 α-CH, MGM1
COOH dimers
2878 2834 2860 2870
α-CH, MGT3 α-CH, MGD2 α-CH, MGD3
2878 2834 2860 2870
α-CH, MGT3 α-CH, MGD2 α-CH, MGD3
2940
2929 2932 2938 2941
CH3-SS, MGD2 CH3-SS, MGD1 CH3-SS, MGD2 α-CH, MGT2
2940 2940 2942
CH3-AS, MGD2 CH3-AS, MGM1
2972 2970 2981
CH3-SS, MGT2 CH3-SS, MGT3 2988
2969 2973 2998 2997 3000 3000
CH3-AS, MGT2 CH3-AS, MGT3 CH3AS’, MGM1 CH3-AS’, MGD3 CH3-AS’, MGD1 CH3-AS’, MGD2
3540, 3544
3460 3633 3646 3667
MG-OH, MGD3 MG-OH, MGD3 MG-OH, MGD1 MG-OH, MGD2
3517, 3538
3633 3647 3667
MG-OH, MGD3 MG-OH, MGD1 MG-OH, MGD2
NMR Results
To rule out the possibility contamination and confirm that the stock MG hydration
matched that reported in the literature, 1H and 13C NMR, 2D HSQC, and 15N NMR NMR
(Figures E5-7) was performed on solutions of MG. The results showed the bulk
MGD:MGT ration was ~60-65% to 35-40%, in aggrrement with the literature. Since the
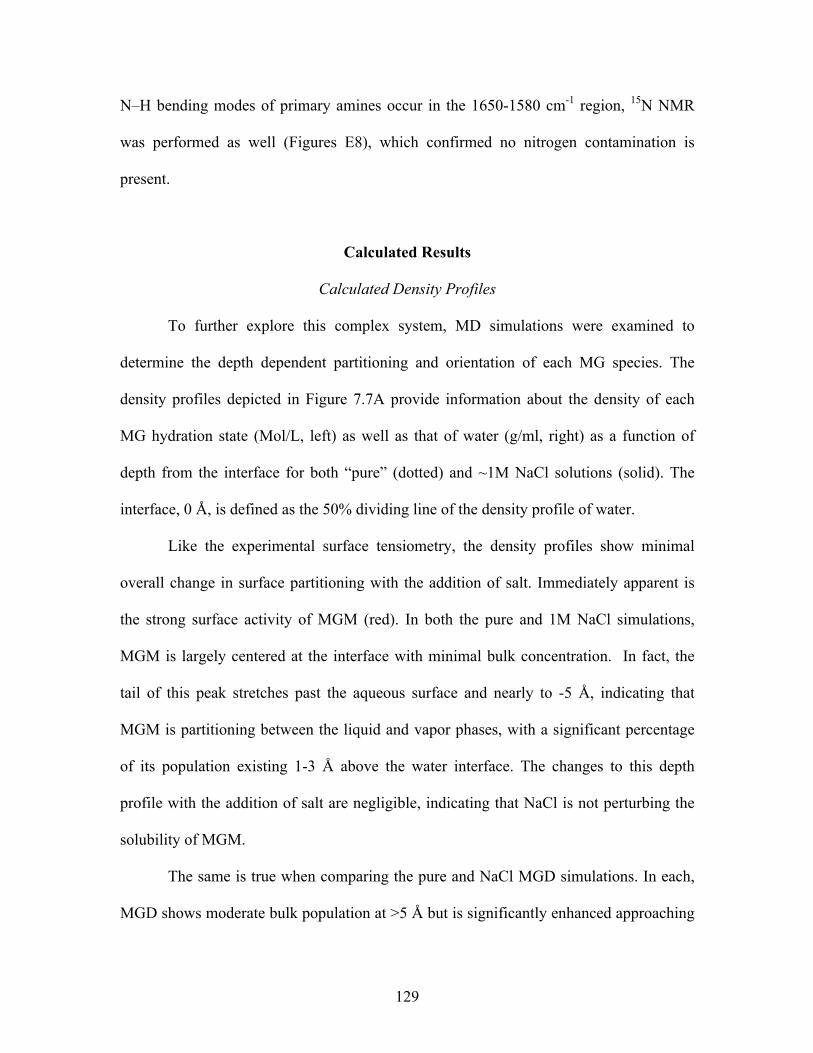
129
N–H bending modes of primary amines occur in the 1650-1580 cm-1 region, 15N NMR
was performed as well (Figures E8), which confirmed no nitrogen contamination is
present.
Calculated Results
Calculated Density Profiles
To further explore this complex system, MD simulations were examined to
determine the depth dependent partitioning and orientation of each MG species. The
density profiles depicted in Figure 7.7A provide information about the density of each
MG hydration state (Mol/L, left) as well as that of water (g/ml, right) as a function of
depth from the interface for both “pure” (dotted) and ~1M NaCl solutions (solid). The
interface, 0 Å, is defined as the 50% dividing line of the density profile of water.
Like the experimental surface tensiometry, the density profiles show minimal
overall change in surface partitioning with the addition of salt. Immediately apparent is
the strong surface activity of MGM (red). In both the pure and 1M NaCl simulations,
MGM is largely centered at the interface with minimal bulk concentration. In fact, the
tail of this peak stretches past the aqueous surface and nearly to -5 Å, indicating that
MGM is partitioning between the liquid and vapor phases, with a significant percentage
of its population existing 1-3 Å above the water interface. The changes to this depth
profile with the addition of salt are negligible, indicating that NaCl is not perturbing the
solubility of MGM.
The same is true when comparing the pure and NaCl MGD simulations. In each,
MGD shows moderate bulk population at >5 Å but is significantly enhanced approaching
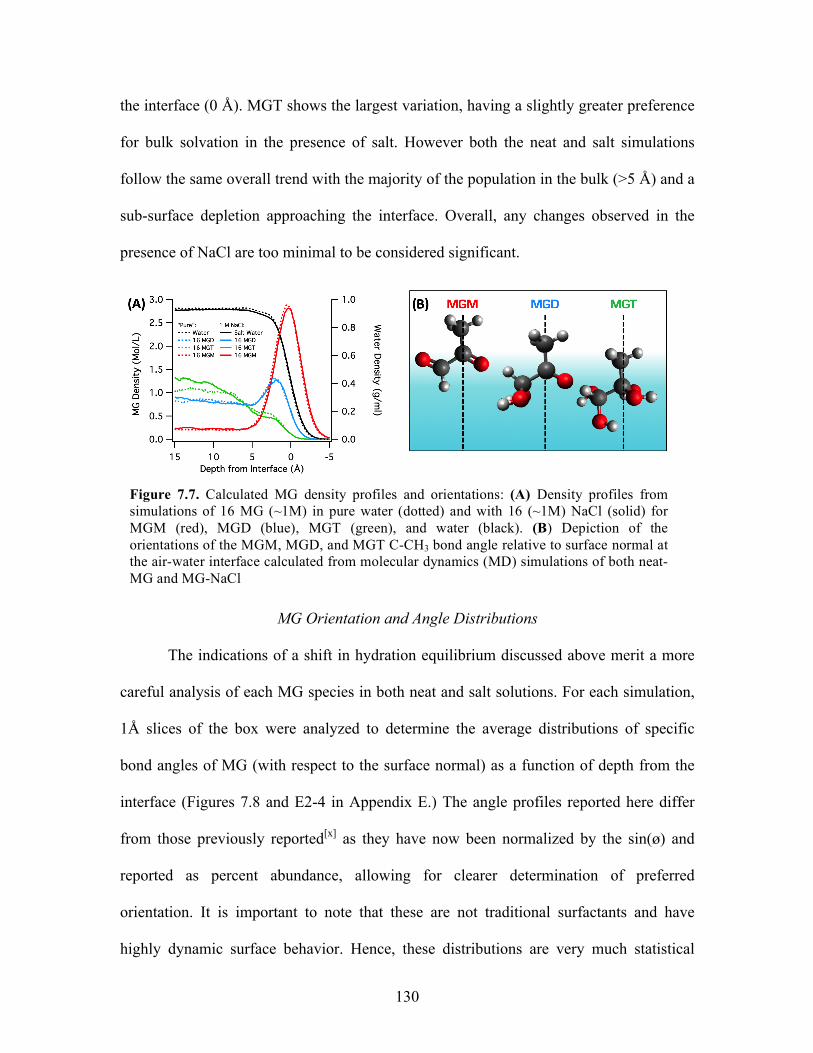
130
the interface (0 Å). MGT shows the largest variation, having a slightly greater preference
for bulk solvation in the presence of salt. However both the neat and salt simulations
follow the same overall trend with the majority of the population in the bulk (>5 Å) and a
sub-surface depletion approaching the interface. Overall, any changes observed in the
presence of NaCl are too minimal to be considered significant.
MG Orientation and Angle Distributions
The indications of a shift in hydration equilibrium discussed above merit a more
careful analysis of each MG species in both neat and salt solutions. For each simulation,
1Å slices of the box were analyzed to determine the average distributions of specific
bond angles of MG (with respect to the surface normal) as a function of depth from the
interface (Figures 7.8 and E2-4 in Appendix E.) The angle profiles reported here differ
from those previously reported[x] as they have now been normalized by the sin(ø) and
reported as percent abundance, allowing for clearer determination of preferred
orientation. It is important to note that these are not traditional surfactants and have
highly dynamic surface behavior. Hence, these distributions are very much statistical
Figure 7.7. Calculated MG density profiles and orientations: (A) Density profiles from simulations of 16 MG (~1M) in pure water (dotted) and with 16 (~1M) NaCl (solid) for MGM (red), MGD (blue), MGT (green), and water (black). (B) Depiction of the orientations of the MGM, MGD, and MGT C-CH3 bond angle relative to surface normal at the air-water interface calculated from molecular dynamics (MD) simulations of both neat-MG and MG-NaCl
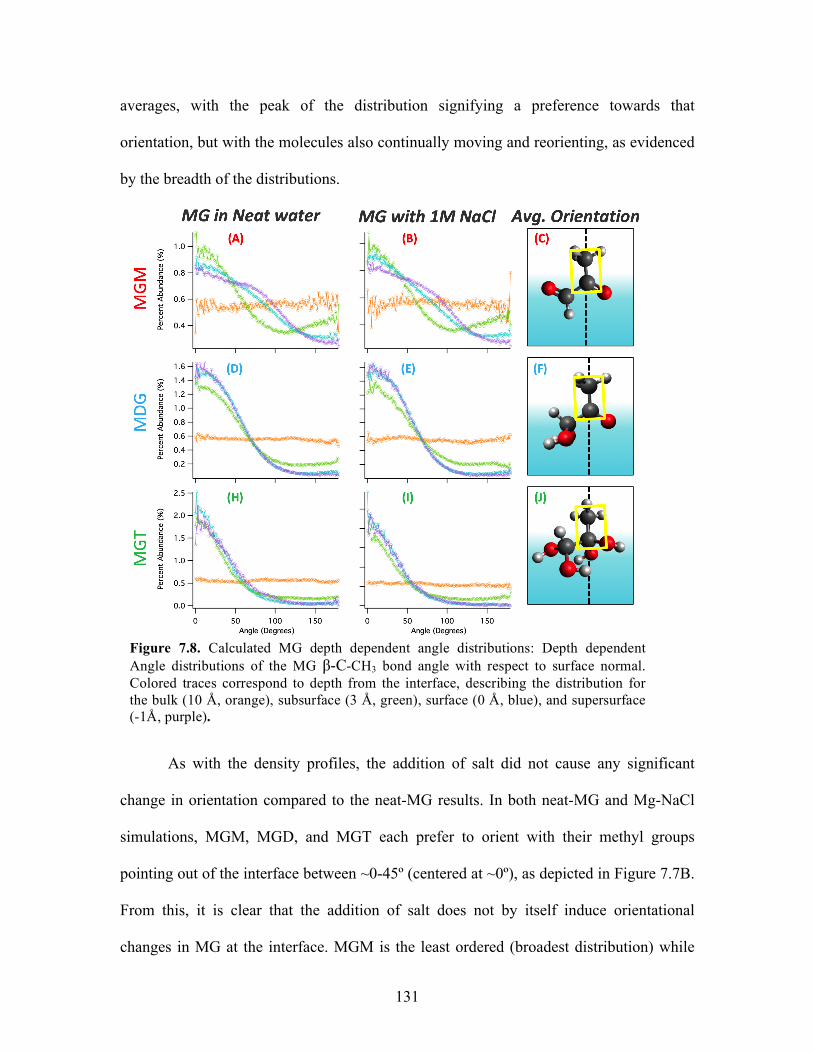
131
averages, with the peak of the distribution signifying a preference towards that
orientation, but with the molecules also continually moving and reorienting, as evidenced
by the breadth of the distributions.
As with the density profiles, the addition of salt did not cause any significant
change in orientation compared to the neat-MG results. In both neat-MG and Mg-NaCl
simulations, MGM, MGD, and MGT each prefer to orient with their methyl groups
pointing out of the interface between ~0-45º (centered at ~0º), as depicted in Figure 7.7B.
From this, it is clear that the addition of salt does not by itself induce orientational
changes in MG at the interface. MGM is the least ordered (broadest distribution) while
Figure 7.8. Calculated MG depth dependent angle distributions: Depth dependent Angle distributions of the MG β-C-CH3 bond angle with respect to surface normal. Colored traces correspond to depth from the interface, describing the distribution for the bulk (10 Å, orange), subsurface (3 Å, green), surface (0 Å, blue), and supersurface (-1Å, purple).
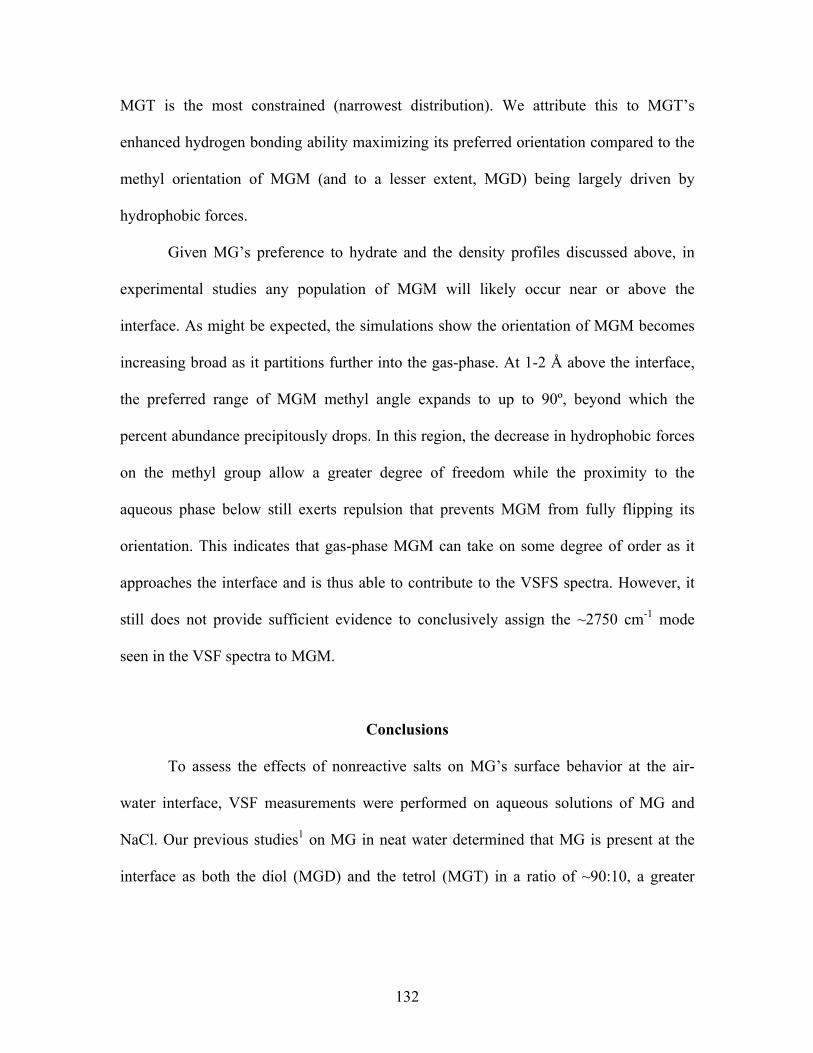
132
MGT is the most constrained (narrowest distribution). We attribute this to MGT’s
enhanced hydrogen bonding ability maximizing its preferred orientation compared to the
methyl orientation of MGM (and to a lesser extent, MGD) being largely driven by
hydrophobic forces.
Given MG’s preference to hydrate and the density profiles discussed above, in
experimental studies any population of MGM will likely occur near or above the
interface. As might be expected, the simulations show the orientation of MGM becomes
increasing broad as it partitions further into the gas-phase. At 1-2 Å above the interface,
the preferred range of MGM methyl angle expands to up to 90º, beyond which the
percent abundance precipitously drops. In this region, the decrease in hydrophobic forces
on the methyl group allow a greater degree of freedom while the proximity to the
aqueous phase below still exerts repulsion that prevents MGM from fully flipping its
orientation. This indicates that gas-phase MGM can take on some degree of order as it
approaches the interface and is thus able to contribute to the VSFS spectra. However, it
still does not provide sufficient evidence to conclusively assign the ~2750 cm-1 mode
seen in the VSF spectra to MGM.
Conclusions
To assess the effects of nonreactive salts on MG’s surface behavior at the air-
water interface, VSF measurements were performed on aqueous solutions of MG and
NaCl. Our previous studies1 on MG in neat water determined that MG is present at the
interface as both the diol (MGD) and the tetrol (MGT) in a ratio of ~90:10, a greater
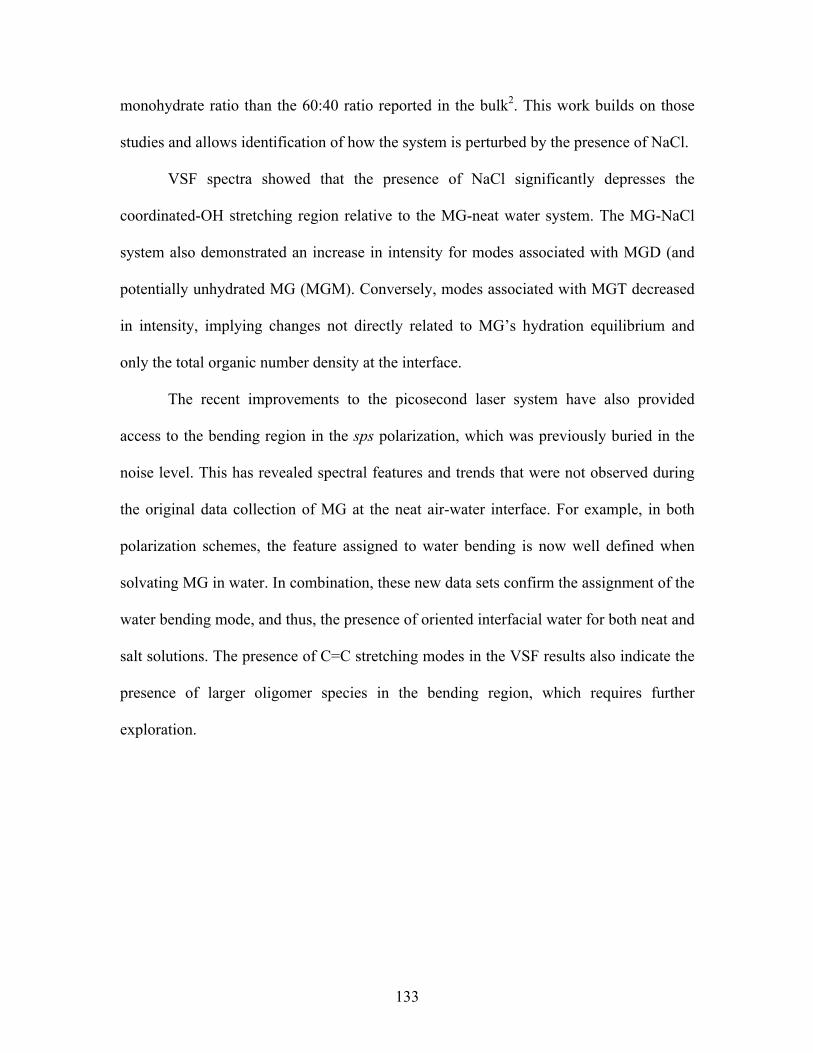
133
monohydrate ratio than the 60:40 ratio reported in the bulk2. This work builds on those
studies and allows identification of how the system is perturbed by the presence of NaCl.
VSF spectra showed that the presence of NaCl significantly depresses the
coordinated-OH stretching region relative to the MG-neat water system. The MG-NaCl
system also demonstrated an increase in intensity for modes associated with MGD (and
potentially unhydrated MG (MGM). Conversely, modes associated with MGT decreased
in intensity, implying changes not directly related to MG’s hydration equilibrium and
only the total organic number density at the interface.
The recent improvements to the picosecond laser system have also provided
access to the bending region in the sps polarization, which was previously buried in the
noise level. This has revealed spectral features and trends that were not observed during
the original data collection of MG at the neat air-water interface. For example, in both
polarization schemes, the feature assigned to water bending is now well defined when
solvating MG in water. In combination, these new data sets confirm the assignment of the
water bending mode, and thus, the presence of oriented interfacial water for both neat and
salt solutions. The presence of C=C stretching modes in the VSF results also indicate the
presence of larger oligomer species in the bending region, which requires further
exploration.
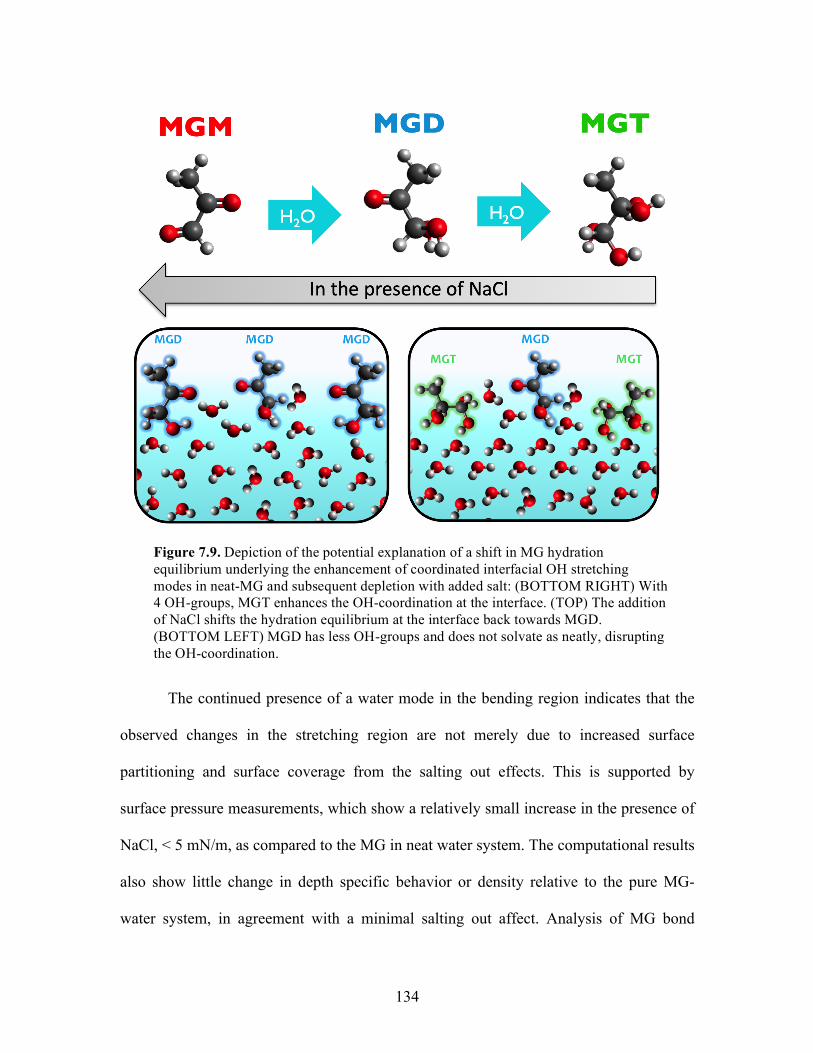
134
The continued presence of a water mode in the bending region indicates that the
observed changes in the stretching region are not merely due to increased surface
partitioning and surface coverage from the salting out effects. This is supported by
surface pressure measurements, which show a relatively small increase in the presence of
NaCl, < 5 mN/m, as compared to the MG in neat water system. The computational results
also show little change in depth specific behavior or density relative to the pure MG-
water system, in agreement with a minimal salting out affect. Analysis of MG bond
Figure 7.9. Depiction of the potential explanation of a shift in MG hydration equilibrium underlying the enhancement of coordinated interfacial OH stretching modes in neat-MG and subsequent depletion with added salt: (BOTTOM RIGHT) With 4 OH-groups, MGT enhances the OH-coordination at the interface. (TOP) The addition of NaCl shifts the hydration equilibrium at the interface back towards MGD. (BOTTOM LEFT) MGD has less OH-groups and does not solvate as neatly, disrupting the OH-coordination.
135
angles also shows that orientational changes were minimal for both the all three MG
hydration species. In combination, these results demonstrate that the local hydration
equilibrium is shifted to even further favor MGD (and potentially minimal amounts of
MGM) at the air-water interface, with little to none MGT, present at the interface.
This exploration of perturbations to MG by non-reactive NaCl salts will serve as a
foundation for investigating aqueous systems of MG in the presence of atmospherically
relevant reactive salts, such as ammonium sulfate (AS).
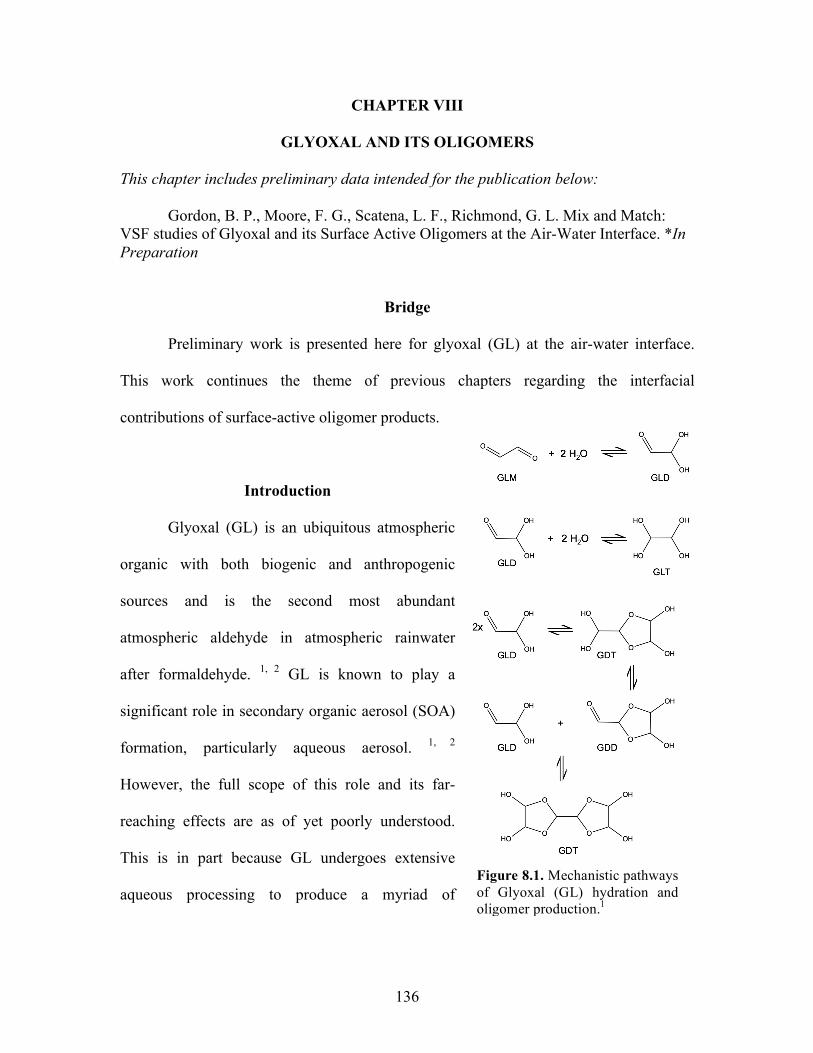
136
CHAPTER VIII
GLYOXAL AND ITS OLIGOMERS
This chapter includes preliminary data intended for the publication below:
Gordon, B. P., Moore, F. G., Scatena, L. F., Richmond, G. L. Mix and Match: VSF studies of Glyoxal and its Surface Active Oligomers at the Air-Water Interface. *In Preparation
Bridge
Preliminary work is presented here for glyoxal (GL) at the air-water interface.
This work continues the theme of previous chapters regarding the interfacial
contributions of surface-active oligomer products.
Introduction
Glyoxal (GL) is an ubiquitous atmospheric
organic with both biogenic and anthropogenic
sources and is the second most abundant
atmospheric aldehyde in atmospheric rainwater
after formaldehyde. 1, 2 GL is known to play a
significant role in secondary organic aerosol (SOA)
formation, particularly aqueous aerosol. 1, 2
However, the full scope of this role and its far-
reaching effects are as of yet poorly understood.
This is in part because GL undergoes extensive
aqueous processing to produce a myriad of Figure 8.1. Mechanistic pathways of Glyoxal (GL) hydration and oligomer production.1
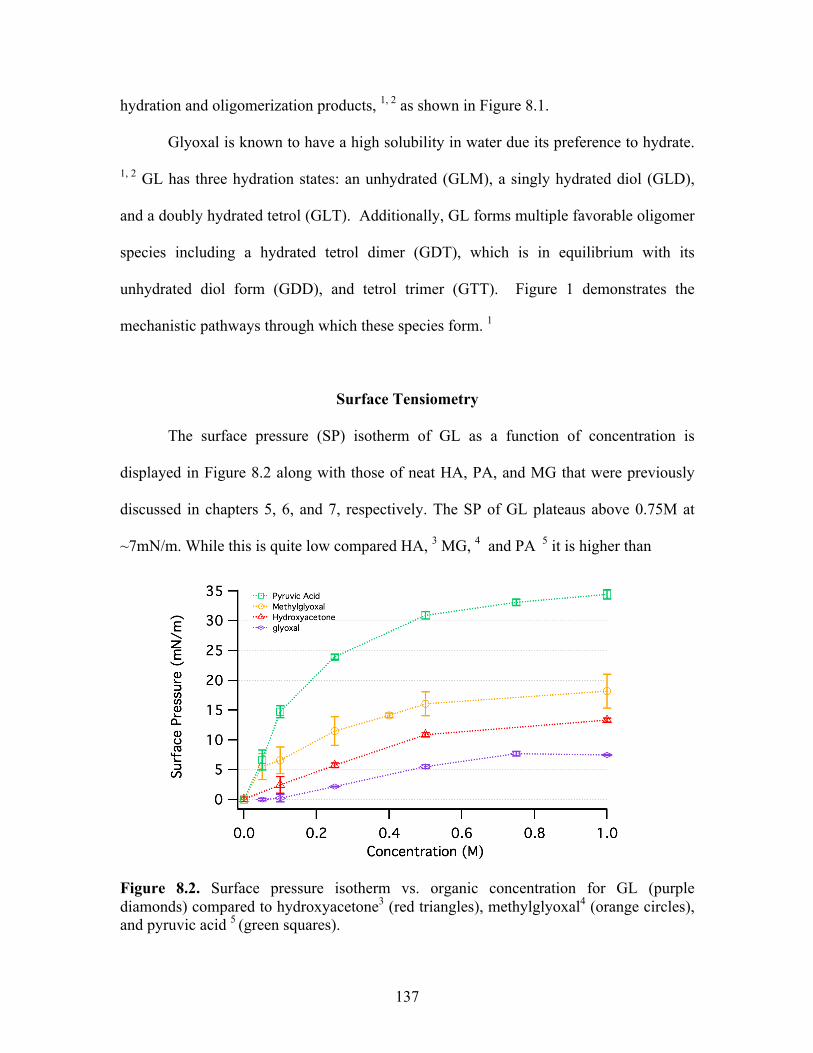
137
hydration and oligomerization products, 1, 2 as shown in Figure 8.1.
Glyoxal is known to have a high solubility in water due its preference to hydrate.
1, 2 GL has three hydration states: an unhydrated (GLM), a singly hydrated diol (GLD),
and a doubly hydrated tetrol (GLT). Additionally, GL forms multiple favorable oligomer
species including a hydrated tetrol dimer (GDT), which is in equilibrium with its
unhydrated diol form (GDD), and tetrol trimer (GTT). Figure 1 demonstrates the
mechanistic pathways through which these species form. 1
Surface Tensiometry
The surface pressure (SP) isotherm of GL as a function of concentration is
displayed in Figure 8.2 along with those of neat HA, PA, and MG that were previously
discussed in chapters 5, 6, and 7, respectively. The SP of GL plateaus above 0.75M at
~7mN/m. While this is quite low compared HA, 3 MG, 4 and PA 5 it is higher than
Figure 8.2. Surface pressure isotherm vs. organic concentration for GL (purple diamonds) compared to hydroxyacetone3 (red triangles), methylglyoxal4 (orange circles), and pyruvic acid 5 (green squares).
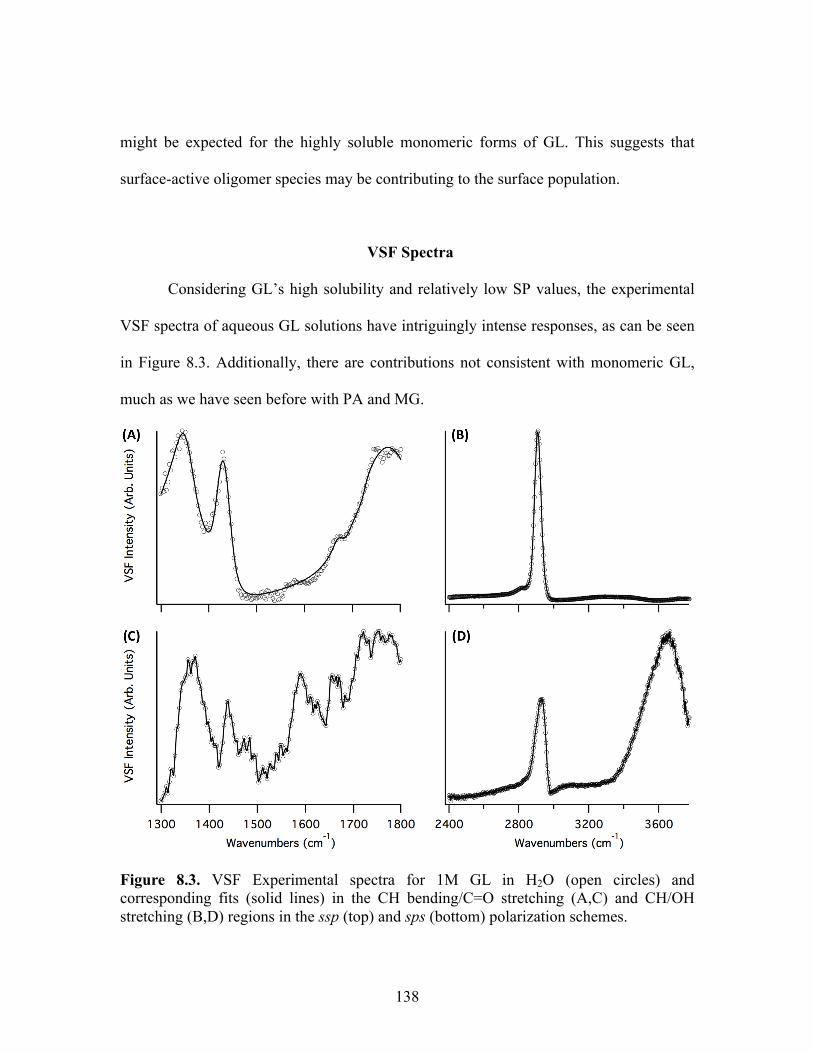
138
might be expected for the highly soluble monomeric forms of GL. This suggests that
surface-active oligomer species may be contributing to the surface population.
VSF Spectra
Considering GL’s high solubility and relatively low SP values, the experimental
VSF spectra of aqueous GL solutions have intriguingly intense responses, as can be seen
in Figure 8.3. Additionally, there are contributions not consistent with monomeric GL,
much as we have seen before with PA and MG.
Figure 8.3. VSF Experimental spectra for 1M GL in H2O (open circles) and corresponding fits (solid lines) in the CH bending/C=O stretching (A,C) and CH/OH stretching (B,D) regions in the ssp (top) and sps (bottom) polarization schemes.
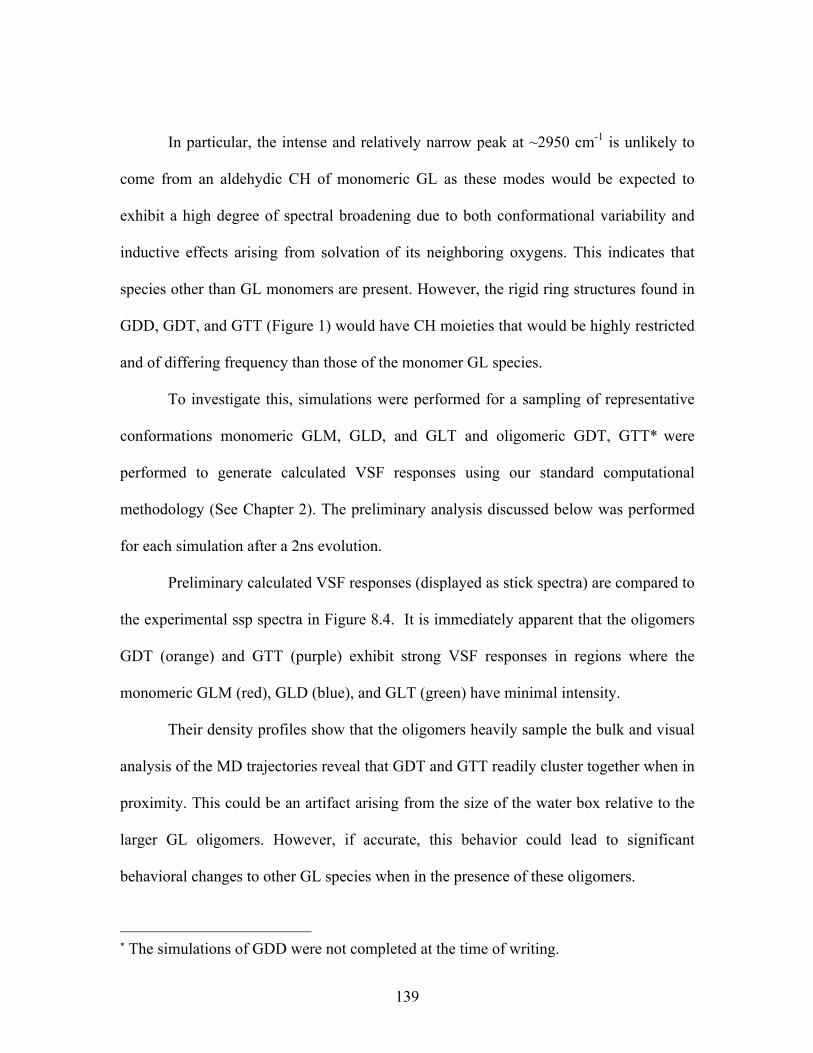
139
In particular, the intense and relatively narrow peak at ~2950 cm-1 is unlikely to
come from an aldehydic CH of monomeric GL as these modes would be expected to
exhibit a high degree of spectral broadening due to both conformational variability and
inductive effects arising from solvation of its neighboring oxygens. This indicates that
species other than GL monomers are present. However, the rigid ring structures found in
GDD, GDT, and GTT (Figure 1) would have CH moieties that would be highly restricted
and of differing frequency than those of the monomer GL species.
To investigate this, simulations were performed for a sampling of representative
conformations monomeric GLM, GLD, and GLT and oligomeric GDT, GTT*1were
performed to generate calculated VSF responses using our standard computational
methodology (See Chapter 2). The preliminary analysis discussed below was performed
for each simulation after a 2ns evolution.
Preliminary calculated VSF responses (displayed as stick spectra) are compared to
the experimental ssp spectra in Figure 8.4. It is immediately apparent that the oligomers
GDT (orange) and GTT (purple) exhibit strong VSF responses in regions where the
monomeric GLM (red), GLD (blue), and GLT (green) have minimal intensity.
Their density profiles show that the oligomers heavily sample the bulk and visual
analysis of the MD trajectories reveal that GDT and GTT readily cluster together when in
proximity. This could be an artifact arising from the size of the water box relative to the
larger GL oligomers. However, if accurate, this behavior could lead to significant
behavioral changes to other GL species when in the presence of these oligomers.
* The simulations of GDD were not completed at the time of writing.
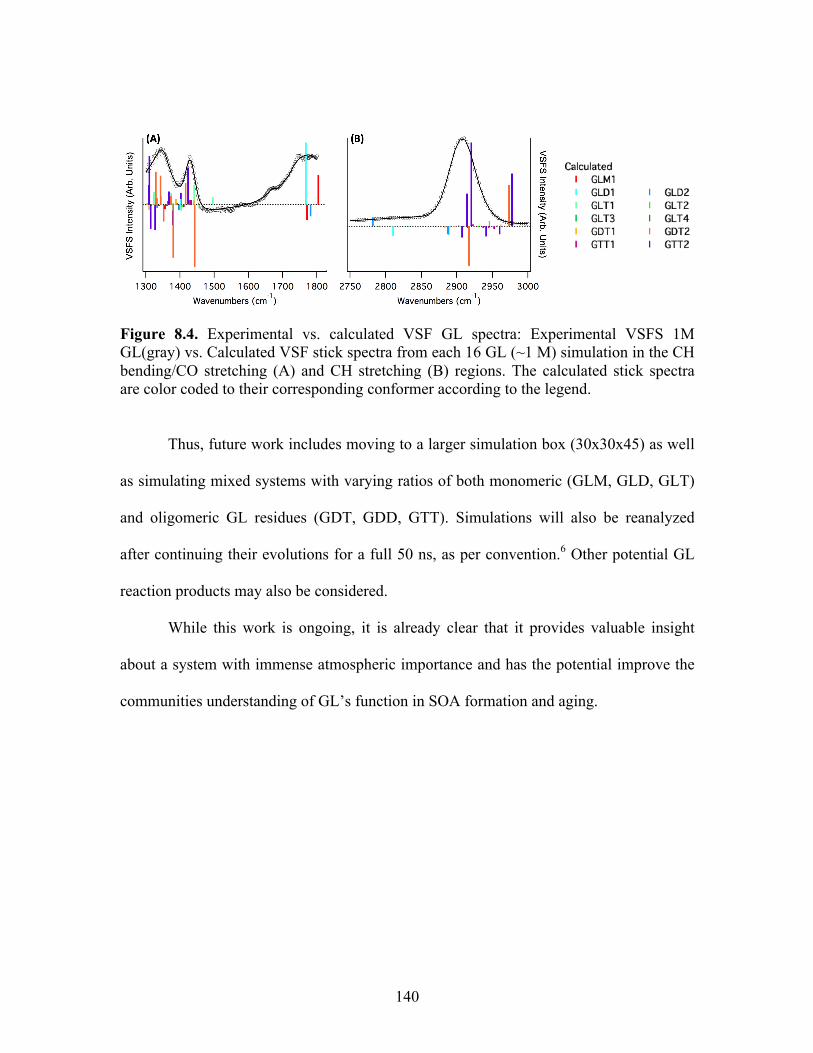
140
Figure 8.4. Experimental vs. calculated VSF GL spectra: Experimental VSFS 1M GL(gray) vs. Calculated VSF stick spectra from each 16 GL (~1 M) simulation in the CH bending/CO stretching (A) and CH stretching (B) regions. The calculated stick spectra are color coded to their corresponding conformer according to the legend.
Thus, future work includes moving to a larger simulation box (30x30x45) as well
as simulating mixed systems with varying ratios of both monomeric (GLM, GLD, GLT)
and oligomeric GL residues (GDT, GDD, GTT). Simulations will also be reanalyzed
after continuing their evolutions for a full 50 ns, as per convention.6 Other potential GL
reaction products may also be considered.
While this work is ongoing, it is already clear that it provides valuable insight
about a system with immense atmospheric importance and has the potential improve the
communities understanding of GL’s function in SOA formation and aging.
141
CHAPTER IX
COMPUTATIONAL METHODOLOGY IMPROVEMENTS
This chapter includes contents that are currently being prepared for the publication below:
Gordon, B. P., Moore, F. G., Valley, N. A., Richmond, G. L. Level Up: Methodology Improvements for Calculation of VSF Spectra of Aqueous Organic Interfaces Using Gas-Phase Water Microclusters. *In Preparation
Bridge
To complement our experimental work, we are also improving our computational
methodology. In order to generate calculated VSF spectra of coordinated water, we are building
a library of gas-phase density functional theory (DFT) microclusters. Improvements to the
description of the organic molecules in the classical molecular dynamics (MD) simulations are
also currently being pursued, and several MD water models for the simulation of the air-water
interface
Simulating VSF Water Spectra with Gas-Phase DFT Water Microclusters
In order to better describe calculated VSF spectra for solvated organics, we seek to
improve the underlying methodology used for calculating VSF water spectra. Since organic-OH
and water modes interfere with each other, experimental VSF spectra in the OH-region are
convolutions of contributions from both types of modes. Prior to this work, our computational
methodology did not inherently include solvation effects, thus we have been unable to make use
of calculated spectra in those regions.
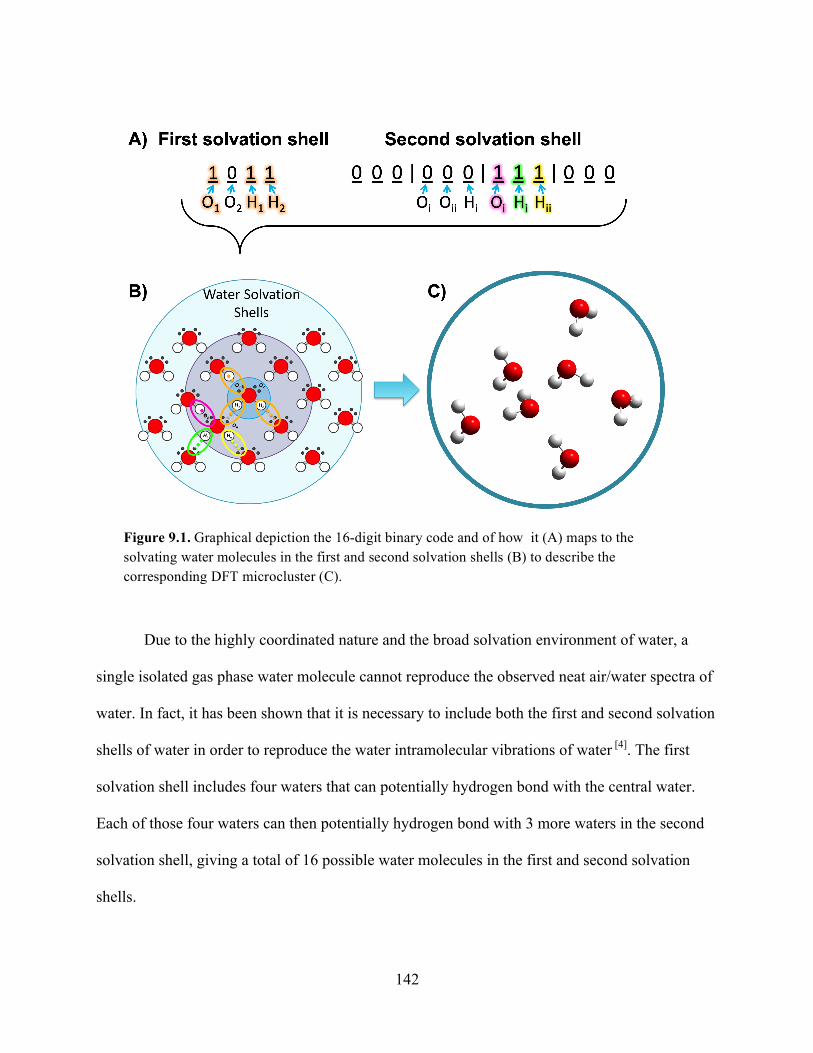
142
Due to the highly coordinated nature and the broad solvation environment of water, a
single isolated gas phase water molecule cannot reproduce the observed neat air/water spectra of
water. In fact, it has been shown that it is necessary to include both the first and second solvation
shells of water in order to reproduce the water intramolecular vibrations of water [4]. The first
solvation shell includes four waters that can potentially hydrogen bond with the central water.
Each of those four waters can then potentially hydrogen bond with 3 more waters in the second
solvation shell, giving a total of 16 possible water molecules in the first and second solvation
shells.
Figure 9.1. Graphical depiction the 16-digit binary code and of how it (A) maps to the solvating water molecules in the first and second solvation shells (B) to describe the corresponding DFT microcluster (C).
143
In order to define these various solvation environments, a 16-digit binary code was
developed to describe the solvation shells, where 1 indicates the presence of a water molecule in
a given position and 0 indicates an empty position. Digits 1-4 define the first solvation shell and
digits 5-16 define the second solvation shell. Using this 16-digit code, an initial library of 191
DFT structures was created spanning 8 possible first solvation shell environments, each with
various second solvation shell water environments, allowing us to represent the coordinated
nature of water in a controlled way.
An initial library of 191 DFT structures has been created at the B3LYP/6-311++G(2d,2p)
level of theory, allowing us to represent the coordinated nature of water in a controlled way. The
DFT microcluster library is currently being extended to include additional microclusters,
currently totaling 304 conformers and which will eventually total 500 in all. This allows us to
reproduce both the coordinated nature of water as well as the homogenous broadening produced
by the varying solvation environments.
Investigating the MD Water Models
In addition our efforts to improve the underlying methodology used for calculating VSF
water spectra, we are also investigating the impact of the molecular descriptions of water in the
classical MD. With this work, we investigate the applicability of various MD water models for
systems with small organics. Conventionally, we have utilized a three-point polarizable water
model (POL3 5) for our MD simulations. However, four-point non-polarizable models, which
have an additional point to describe electron density, can be better at reproducing structural
characteristics of water. It is possible that improved descriptions of water structure afforded by
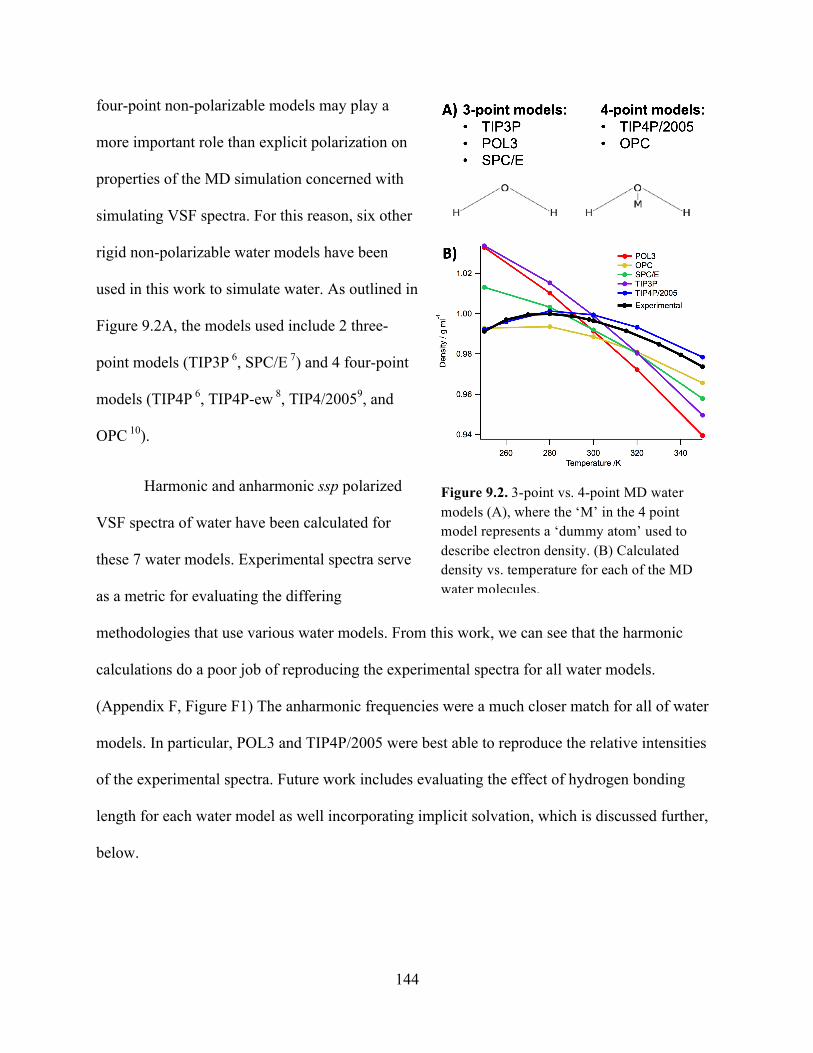
144
four-point non-polarizable models may play a
more important role than explicit polarization on
properties of the MD simulation concerned with
simulating VSF spectra. For this reason, six other
rigid non-polarizable water models have been
used in this work to simulate water. As outlined in
Figure 9.2A, the models used include 2 three-
point models (TIP3P 6, SPC/E 7) and 4 four-point
models (TIP4P 6, TIP4P-ew 8, TIP4/20059, and
OPC 10).
Harmonic and anharmonic ssp polarized
VSF spectra of water have been calculated for
these 7 water models. Experimental spectra serve
as a metric for evaluating the differing
methodologies that use various water models. From this work, we can see that the harmonic
calculations do a poor job of reproducing the experimental spectra for all water models.
(Appendix F, Figure F1) The anharmonic frequencies were a much closer match for all of water
models. In particular, POL3 and TIP4P/2005 were best able to reproduce the relative intensities
of the experimental spectra. Future work includes evaluating the effect of hydrogen bonding
length for each water model as well incorporating implicit solvation, which is discussed further,
below.
Figure 9.2. 3-point vs. 4-point MD water models (A), where the ‘M’ in the 4 point model represents a ‘dummy atom’ used to describe electron density. (B) Calculated density vs. temperature for each of the MD water molecules.
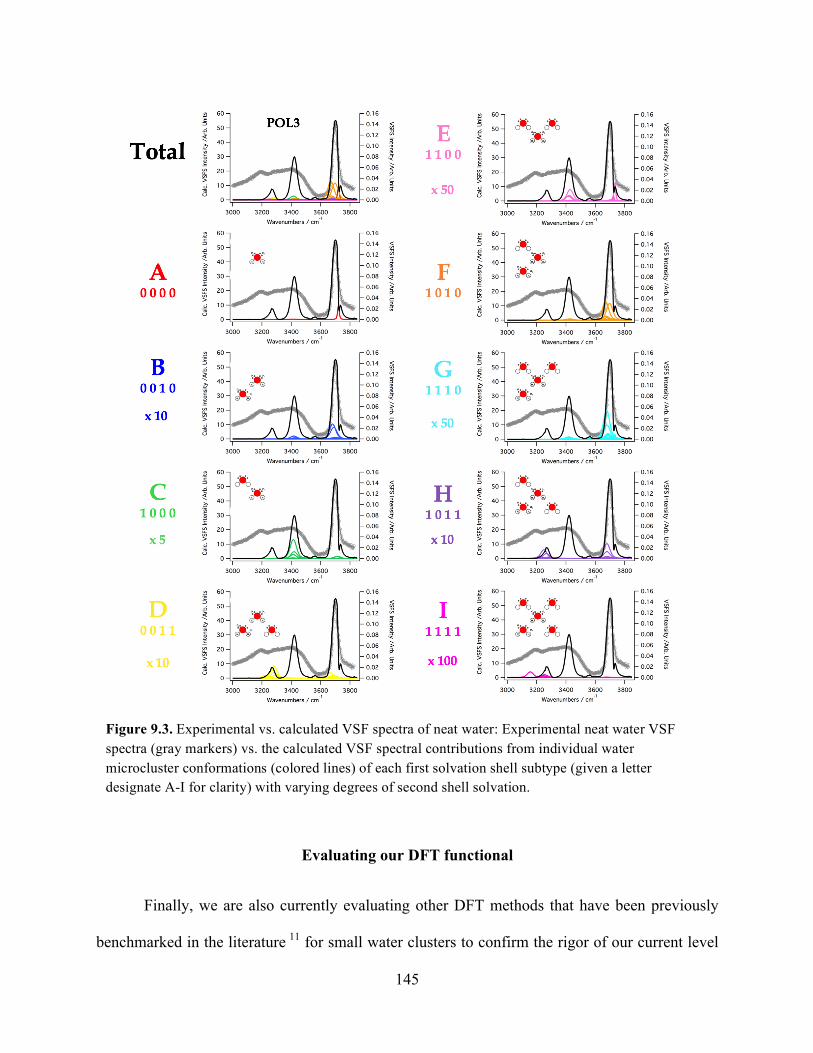
145
Evaluating our DFT functional
Finally, we are also currently evaluating other DFT methods that have been previously
benchmarked in the literature 11 for small water clusters to confirm the rigor of our current level
Figure 9.3. Experimental vs. calculated VSF spectra of neat water: Experimental neat water VSF spectra (gray markers) vs. the calculated VSF spectral contributions from individual water microcluster conformations (colored lines) of each first solvation shell subtype (given a letter designate A-I for clarity) with varying degrees of second shell solvation.
146
of theory for calculating the frequencies and response properties of these microclusters
compared. These DFT functionals include a pure functional (M06L), a hybrid functional
(SOGGA11X), and 2 range-separated hybrid functional (ωB97 and ωB97X). These functionals,
as well as the B3LYP hybrid functional we employ for our library, will be calculated for a subset
of 24 microclusters using a mixed aug-cc-pVX Z: cc-pVX Z basis set (aug-cc-pVX Z for O and
cc-pVX Z for H). We will examine harmonic frequencies as well as the resulting calculated VSF
spectra as our metric for accuracy.
Linear least squares regression fits of the resulting harmonic frequencies from each
higher-level calculation versus our standard level of theory have been calculated for each of the
24 conformers. Differences in fundamental frequencies were found to be different only by a
linear offset, as shown in Appendix F for two representative structures containing seven and
eleven water molecules. (Figure F2) This demonstrates that for our purposes, our current level of
theory is sufficient and can simply be linearly scaled to match the results of more these
expensive functionals and basis sets. Future analysis includes calculating VSF spectra and
compared to both experiment as a metric for performance with regards to the response
calculations used to generate our calculated beta tensor.
Evaluation of Improvements: Hydroxyacetone as a Model System
A more accurate description of the water structure in our MD simulations will allow us to
improve our simulated VSF spectra, including all resonant modes due to both the solute and
solvent molecules, by convolving the organic modes with the water modes. This may also allow
us to analyze the effects organics have on water structure. In order to evaluate the success of the
147
aforementioned methodology improvements, we need a well-behaved model system that we can
use as a metric.
As previously discussed in Chapter 5, Hydroxyacetone (HA) is a common semi-volatile
surface-active atmospheric secondary organic that we have released published on.12 It has been
observed experimentally in situ in aerosol along with other atmospheric organics of interest, such
as methylglyoxal and acetaldehyde.13 HA can be hydrated to form a geminal diol, but the
hydration is not favorable: 96-98% of HA is unhydrated in the bulk only 2-4% in the hydrated
form.3 This allows us to make the assumption that HA is entirely in its unhydrated state, meaning
that HA is not subject to the same hydration equilibrium complications as methylglyoxal. For
this reason, direct comparison can be made between the calculated free energy of simulated non-
reactive HA-water systems and experimental values. Thus, in additon to being an excellent
model system for our ongoing atmospheric research, HA is also ideal for testing new
computational methodologies.
To that end, both a polarized and an un-polarized force field were created for
Hydroxyacetone MD simulations. Seven separate MD simulations were performed with HA and
each of the water models discussed above. For simulations with non-polarizable water models,
the organic force fields are parameterized using the FF99SB non-polarizable force field14 without
charge scaling. The simulations were analyzed to generate VSF spectra using the same DFT
optimizations, frequency calculations, and aharmonic frequency corrections created for our
initial published treatment of HA.
The experimental HA-neat water VSF spectra were used to directly compare to the
calculated spectra to gauge the applicability of each water model for the calculation of VSF
148
spectra of the organics. Here, it was also found that the POL3 and TIP4/2005 models best
reproduced the observed spectral features.
Future work involves running analogous MD simulations with implicitly polarized HA.
Implicit polarization effects can be produced by scaling parameters to reproduce experimentally
determined solvation free energies, as previously demonstrated by the Roeselova group.15 This
will be done for each water model by pushing a single HA molecule through a water slab and
using the weighted histogram algorithm method (WHAM) to calculate a potential of mean force
from which we can derive calculated free energies of hydration. The process will be repeated
while iteratively scaling the charges on the organic until the calculated free energy of hydration
is in good agreement with the experimental values.
Conclusions
Upon the completion of this work, we intend to use the HA, MG, PA, and GL and
systems as a foundation to build upon for future studies. In particular, we are interested in
furthering our understanding of how the hydration equilibrium and oligomer products of these
species affect water coordination at the interface. Another avenue of interest is any potential
effects of temperature. Literature studies on similar small geminal diols have shown a shift in
hydration equilibrium with varying temperature and having water models more suited to a wider
temperature range will be beneficial for these studies.
Once we are able to simulate water and improve our organic representation, we can begin
to incorporate these improvements into our future simulations. The ability to depict changes in
water structure in the presence of organics will be vital for understanding the chemistry of the
149
interface. The surface chemistry at the air-water interface is of great atmospheric significance
since it could greatly influence aerosol hydrophobicity and gas to bulk phase partitioning. With
this improved methodology and experimental knowledge base, we can move towards
investigating more complicated systems.
150
CHAPTER X
CONCLUSIONS
An improved understanding of the interfacial chemistry of aqueous secondary organic
aerosols is needed to address the current knowledge gaps in atmospheric representations. This
research will help to lower the uncertainties associated with atmospheric aerosol formation by
providing results that can inform atmospheric chemists about complex cooperative behaviors,
thereby aiding the development of more accurate models. These studies of glyoxal (GL),
methylglyoxal (MG), hydroxyacetone (HA), and Pyruvic acid (PA) in neat water and MG with
NaCl have made valuable strides towards this goal. Furthermore, they have laid the foundation
for future studies of more complicated systems that are more representative the chemical
diversity inherent to SOA. These studies will be aided by the new computational methodologies
developed in this work.
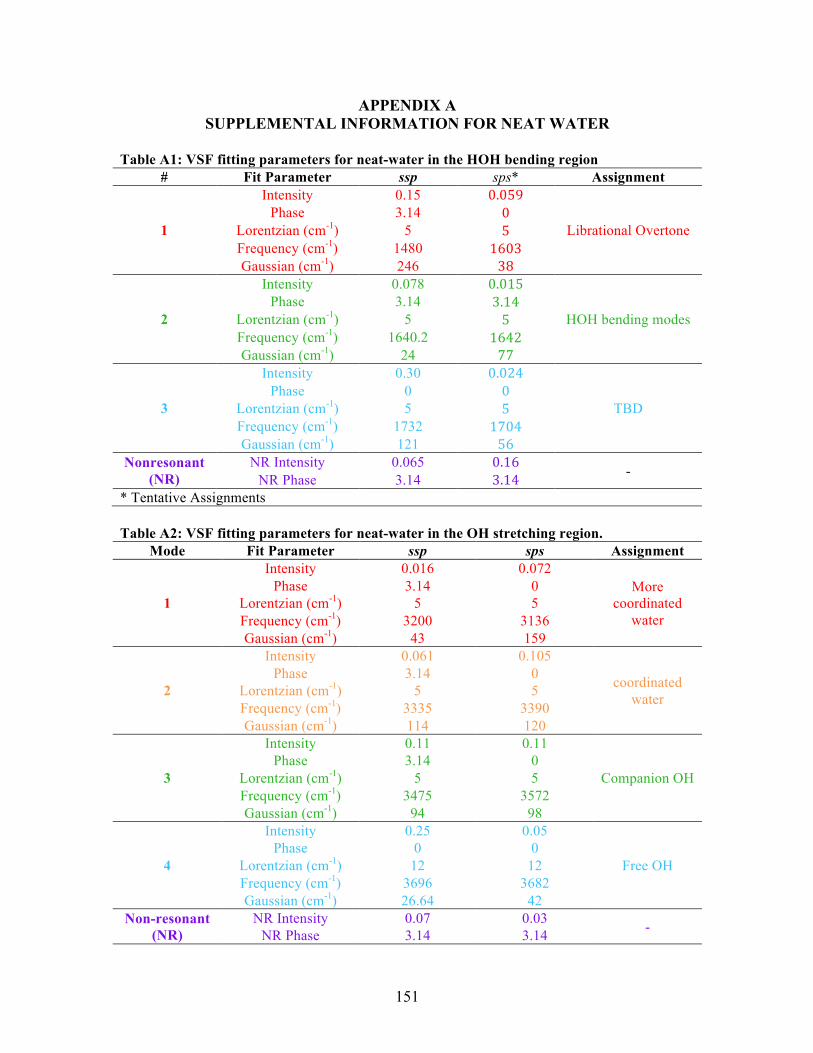
151
APPENDIX A SUPPLEMENTAL INFORMATION FOR NEAT WATER
Table A1: VSF fitting parameters for neat-water in the HOH bending region
# Fit Parameter ssp sps* Assignment
1
Intensity 0.15 0.059
Librational Overtone Phase 3.14 0
Lorentzian (cm-1) 5 5 Frequency (cm-1) 1480 1603 Gaussian (cm-1) 246 38
2
Intensity 0.078 0.015
HOH bending modes Phase 3.14 3.14
Lorentzian (cm-1) 5 5 Frequency (cm-1) 1640.2 1642 Gaussian (cm-1) 24 77
3
Intensity 0.30 0.024
TBD Phase 0 0
Lorentzian (cm-1) 5 5 Frequency (cm-1) 1732 1704 Gaussian (cm-1) 121 56
Nonresonant (NR)
NR Intensity 0.065 0.16 - NR Phase 3.14 3.14 * Tentative Assignments Table A2: VSF fitting parameters for neat-water in the OH stretching region.
Mode Fit Parameter ssp sps Assignment
1
Intensity 0.016 0.072 More
coordinated water
Phase 3.14 0 Lorentzian (cm-1) 5 5 Frequency (cm-1) 3200 3136 Gaussian (cm-1) 43 159
2
Intensity 0.061 0.105
coordinated water
Phase 3.14 0 Lorentzian (cm-1) 5 5 Frequency (cm-1) 3335 3390 Gaussian (cm-1) 114 120
3
Intensity 0.11 0.11
Companion OH Phase 3.14 0
Lorentzian (cm-1) 5 5 Frequency (cm-1) 3475 3572 Gaussian (cm-1) 94 98
4
Intensity 0.25 0.05
Free OH Phase 0 0
Lorentzian (cm-1) 12 12 Frequency (cm-1) 3696 3682 Gaussian (cm-1) 26.64 42
Non-resonant (NR)
NR Intensity 0.07 0.03 - NR Phase 3.14 3.14

152
APPENDIX B
SUPPLEMENTAL INFROMATION FOR MG
The contents of this appendix have been previously published in whole or in part.
Wren, S. N., Gordon, B. P., Valley, N. A., McWilliams, L. E., Richmond, G. L. Hydration, Orientation, and Conformation of Methylglyoxal at the Air-Water Interface. J. Phys. Chem. A 2015 119 (24), 6391-6403
B1. Quantum Mechanical Calculations
Table B1. DFT structures and energies calculated at B3LYP/6-311++G(2d,2p) level of theory. Conformer definitions and percent abundances for MD simulations. MD
Conformer DFT
energy (Hartree)
Relative DFT
energya (kcal mol-1)
DFT Dihedral Angleb (˚)
Dihedral Range (˚) for MD assignmentsc
% Abundanced
D1 D2 D1 D2
MGM1 -267.242 0 0 - 0 – 30 - 100
MGD1 -343.713 4.7 180 - 150 – 180 - 26
MGD2e -343.705 9.9 0 - 0 – 30 - 3 MGD3 -343.720 0 56.5 - 30 – 90 - 26 MGD4 - - NF - 90 – 150 - 12 MGT1 - - NF NF 0 – 120 0 – 120 0 MGT2 -420.185 0.2 34 156 0 – 60 120 – 180 52 MGT3 -420.186 0 76 165 60 – 120 120 – 180 47
aRelative to the lowest energy structure for each MG species bD1 for MGM is γC-βC-αC=O, D1 for MGD is γC-βC-αC-H, D1 and D2 for MGT are both γC-βC-αC-OH cAngles apply to rotation in both directions dBased on MD simulation with 16 MG molecules, integrated over entire box eConverged at saddle point on potential energy landscape NF = not found (no minimum located)
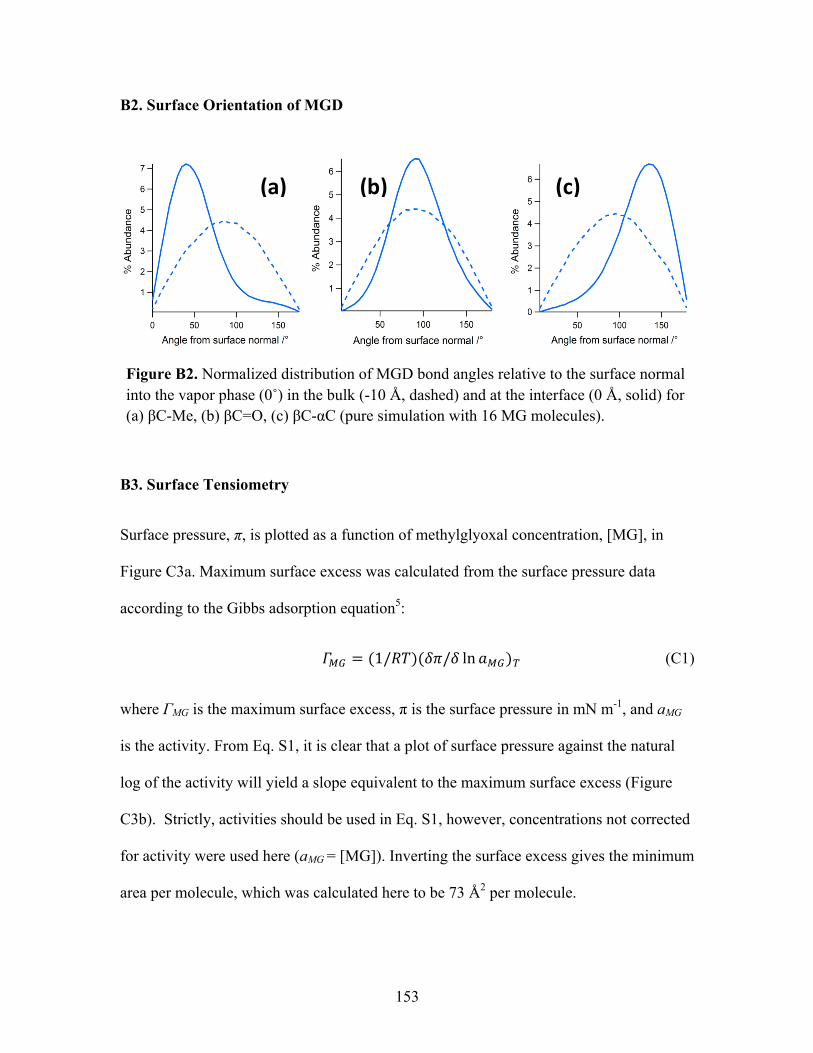
153
B2. Surface Orientation of MGD
Figure B2. Normalized distribution of MGD bond angles relative to the surface normal into the vapor phase (0˚) in the bulk (-10 Å, dashed) and at the interface (0 Å, solid) for (a) βC-Me, (b) βC=O, (c) βC-αC (pure simulation with 16 MG molecules).
B3. Surface Tensiometry
Surface pressure, π, is plotted as a function of methylglyoxal concentration, [MG], in
Figure C3a. Maximum surface excess was calculated from the surface pressure data
according to the Gibbs adsorption equation5:
!!" = (1/!")(!"/! ln!!")! (C1)
where ΓMG is the maximum surface excess, π is the surface pressure in mN m-1, and aMG
is the activity. From Eq. S1, it is clear that a plot of surface pressure against the natural
log of the activity will yield a slope equivalent to the maximum surface excess (Figure
C3b). Strictly, activities should be used in Eq. S1, however, concentrations not corrected
for activity were used here (aMG = [MG]). Inverting the surface excess gives the minimum
area per molecule, which was calculated here to be 73 Å2 per molecule.
(a) (b) (c)
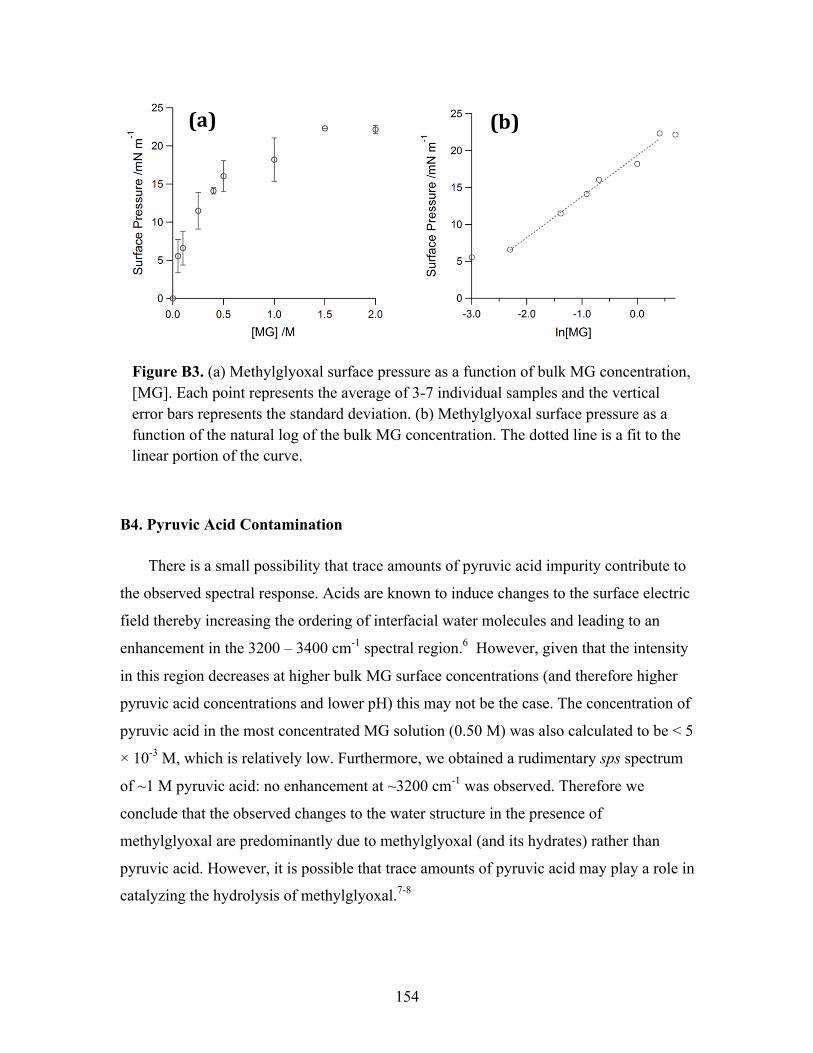
154
Figure B3. (a) Methylglyoxal surface pressure as a function of bulk MG concentration, [MG]. Each point represents the average of 3-7 individual samples and the vertical error bars represents the standard deviation. (b) Methylglyoxal surface pressure as a function of the natural log of the bulk MG concentration. The dotted line is a fit to the linear portion of the curve.
B4. Pyruvic Acid Contamination
There is a small possibility that trace amounts of pyruvic acid impurity contribute to
the observed spectral response. Acids are known to induce changes to the surface electric
field thereby increasing the ordering of interfacial water molecules and leading to an
enhancement in the 3200 – 3400 cm-1 spectral region.6 However, given that the intensity
in this region decreases at higher bulk MG surface concentrations (and therefore higher
pyruvic acid concentrations and lower pH) this may not be the case. The concentration of
pyruvic acid in the most concentrated MG solution (0.50 M) was also calculated to be < 5
× 10-3 M, which is relatively low. Furthermore, we obtained a rudimentary sps spectrum
of ~1 M pyruvic acid: no enhancement at ~3200 cm-1 was observed. Therefore we
conclude that the observed changes to the water structure in the presence of
methylglyoxal are predominantly due to methylglyoxal (and its hydrates) rather than
pyruvic acid. However, it is possible that trace amounts of pyruvic acid may play a role in
catalyzing the hydrolysis of methylglyoxal.7-8
(a) (b)
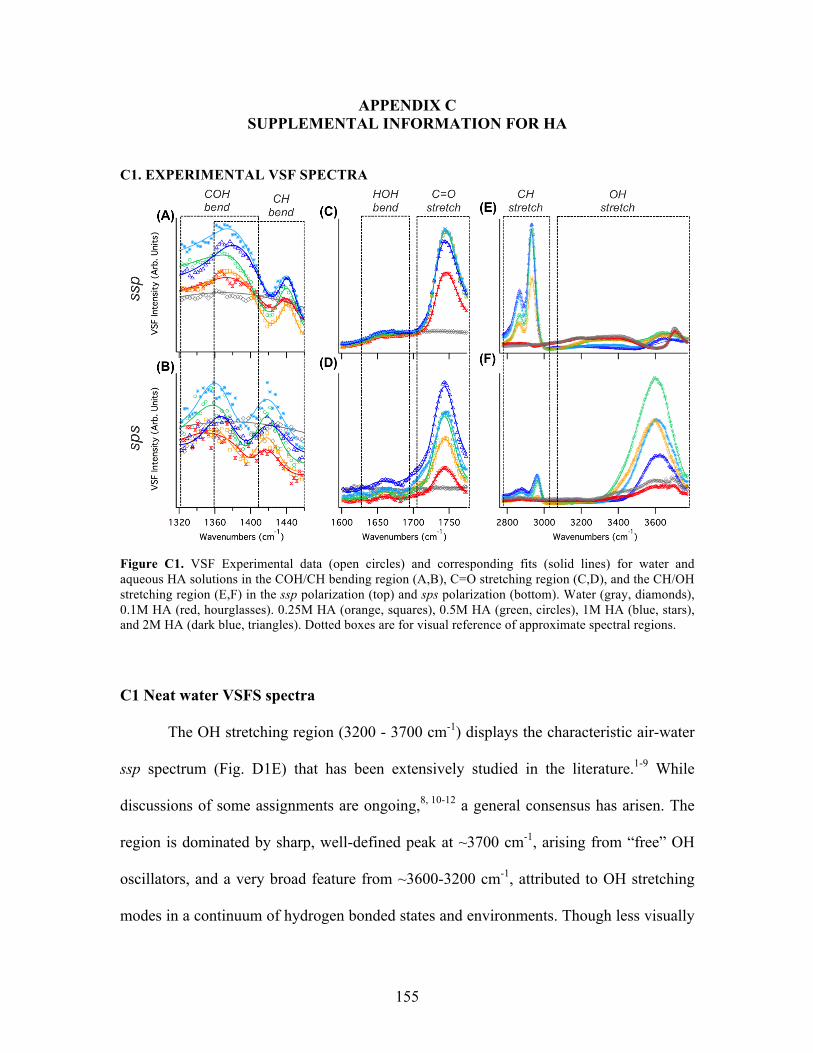
155
APPENDIX C SUPPLEMENTAL INFORMATION FOR HA
C1. EXPERIMENTAL VSF SPECTRA
Figure C1. VSF Experimental data (open circles) and corresponding fits (solid lines) for water and aqueous HA solutions in the COH/CH bending region (A,B), C=O stretching region (C,D), and the CH/OH stretching region (E,F) in the ssp polarization (top) and sps polarization (bottom). Water (gray, diamonds), 0.1M HA (red, hourglasses). 0.25M HA (orange, squares), 0.5M HA (green, circles), 1M HA (blue, stars), and 2M HA (dark blue, triangles). Dotted boxes are for visual reference of approximate spectral regions.
C1 Neat water VSFS spectra
The OH stretching region (3200 - 3700 cm-1) displays the characteristic air-water
ssp spectrum (Fig. D1E) that has been extensively studied in the literature.1-9 While
discussions of some assignments are ongoing,8, 10-12 a general consensus has arisen. The
region is dominated by sharp, well-defined peak at ~3700 cm-1, arising from “free” OH
oscillators, and a very broad feature from ~3600-3200 cm-1, attributed to OH stretching
modes in a continuum of hydrogen bonded states and environments. Though less visually
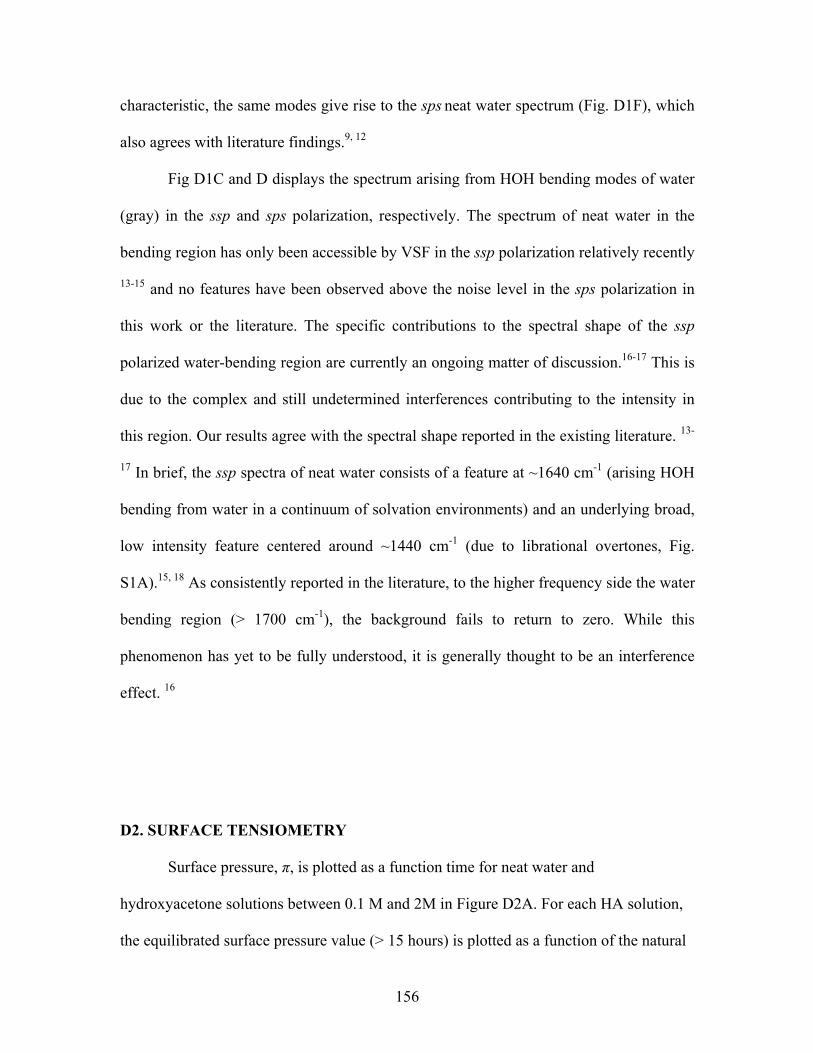
156
characteristic, the same modes give rise to the sps neat water spectrum (Fig. D1F), which
also agrees with literature findings.9, 12
Fig D1C and D displays the spectrum arising from HOH bending modes of water
(gray) in the ssp and sps polarization, respectively. The spectrum of neat water in the
bending region has only been accessible by VSF in the ssp polarization relatively recently
13-15 and no features have been observed above the noise level in the sps polarization in
this work or the literature. The specific contributions to the spectral shape of the ssp
polarized water-bending region are currently an ongoing matter of discussion.16-17 This is
due to the complex and still undetermined interferences contributing to the intensity in
this region. Our results agree with the spectral shape reported in the existing literature. 13-
17 In brief, the ssp spectra of neat water consists of a feature at ~1640 cm-1 (arising HOH
bending from water in a continuum of solvation environments) and an underlying broad,
low intensity feature centered around ~1440 cm-1 (due to librational overtones, Fig.
S1A).15, 18 As consistently reported in the literature, to the higher frequency side the water
bending region (> 1700 cm-1), the background fails to return to zero. While this
phenomenon has yet to be fully understood, it is generally thought to be an interference
effect. 16
D2. SURFACE TENSIOMETRY
Surface pressure, π, is plotted as a function time for neat water and
hydroxyacetone solutions between 0.1 M and 2M in Figure D2A. For each HA solution,
the equilibrated surface pressure value (> 15 hours) is plotted as a function of the natural
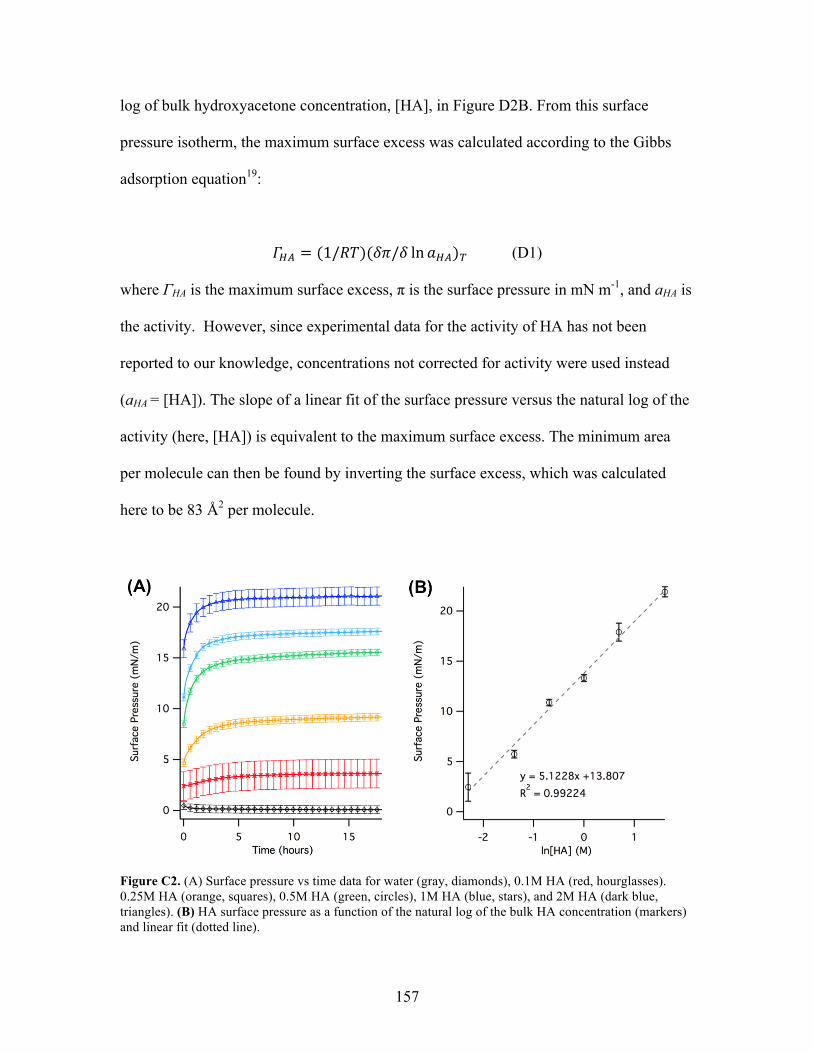
157
log of bulk hydroxyacetone concentration, [HA], in Figure D2B. From this surface
pressure isotherm, the maximum surface excess was calculated according to the Gibbs
adsorption equation19:
!!" = (1/!")(!"/! ln!!")! (D1)
where ΓHA is the maximum surface excess, π is the surface pressure in mN m-1, and aHA is
the activity. However, since experimental data for the activity of HA has not been
reported to our knowledge, concentrations not corrected for activity were used instead
(aHA = [HA]). The slope of a linear fit of the surface pressure versus the natural log of the
activity (here, [HA]) is equivalent to the maximum surface excess. The minimum area
per molecule can then be found by inverting the surface excess, which was calculated
here to be 83 Å2 per molecule.
Figure C2. (A) Surface pressure vs time data for water (gray, diamonds), 0.1M HA (red, hourglasses). 0.25M HA (orange, squares), 0.5M HA (green, circles), 1M HA (blue, stars), and 2M HA (dark blue, triangles). (B) HA surface pressure as a function of the natural log of the bulk HA concentration (markers) and linear fit (dotted line).
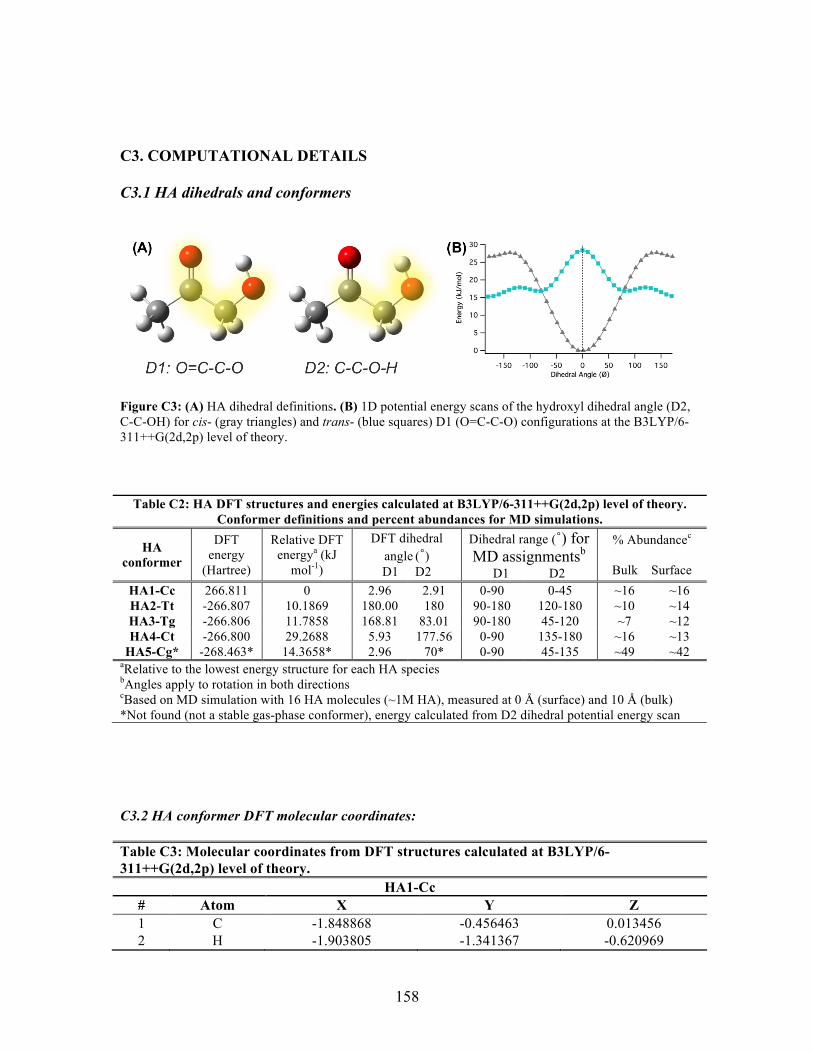
158
C3. COMPUTATIONAL DETAILS C3.1 HA dihedrals and conformers
Figure C3: (A) HA dihedral definitions. (B) 1D potential energy scans of the hydroxyl dihedral angle (D2, C-C-OH) for cis- (gray triangles) and trans- (blue squares) D1 (O=C-C-O) configurations at the B3LYP/6-311++G(2d,2p) level of theory.
Table C2: HA DFT structures and energies calculated at B3LYP/6-311++G(2d,2p) level of theory. Conformer definitions and percent abundances for MD simulations.
HA conformer
DFT energy
(Hartree)
Relative DFT energya (kJ
mol-1)
DFT dihedral angle (˚) D1 D2
Dihedral range (˚) for MD assignmentsb
D1 D2
% Abundancec
Bulk Surface
HA1-Cc 266.811 0 2.96 2.91 0-90 0-45 ~16 ~16 HA2-Tt -266.807 10.1869 180.00 180 90-180 120-180 ~10 ~14 HA3-Tg -266.806 11.7858 168.81 83.01 90-180 45-120 ~7 ~12 HA4-Ct -266.800 29.2688 5.93 177.56 0-90 135-180 ~16 ~13
HA5-Cg* -268.463* 14.3658* 2.96 70* 0-90 45-135 ~49 ~42 aRelative to the lowest energy structure for each HA species bAngles apply to rotation in both directions cBased on MD simulation with 16 HA molecules (~1M HA), measured at 0 Å (surface) and 10 Å (bulk) *Not found (not a stable gas-phase conformer), energy calculated from D2 dihedral potential energy scan C3.2 HA conformer DFT molecular coordinates: Table C3: Molecular coordinates from DFT structures calculated at B3LYP/6-311++G(2d,2p) level of theory.
HA1-Cc # Atom X Y Z 1 C -1.848868 -0.456463 0.013456 2 H -1.903805 -1.341367 -0.620969
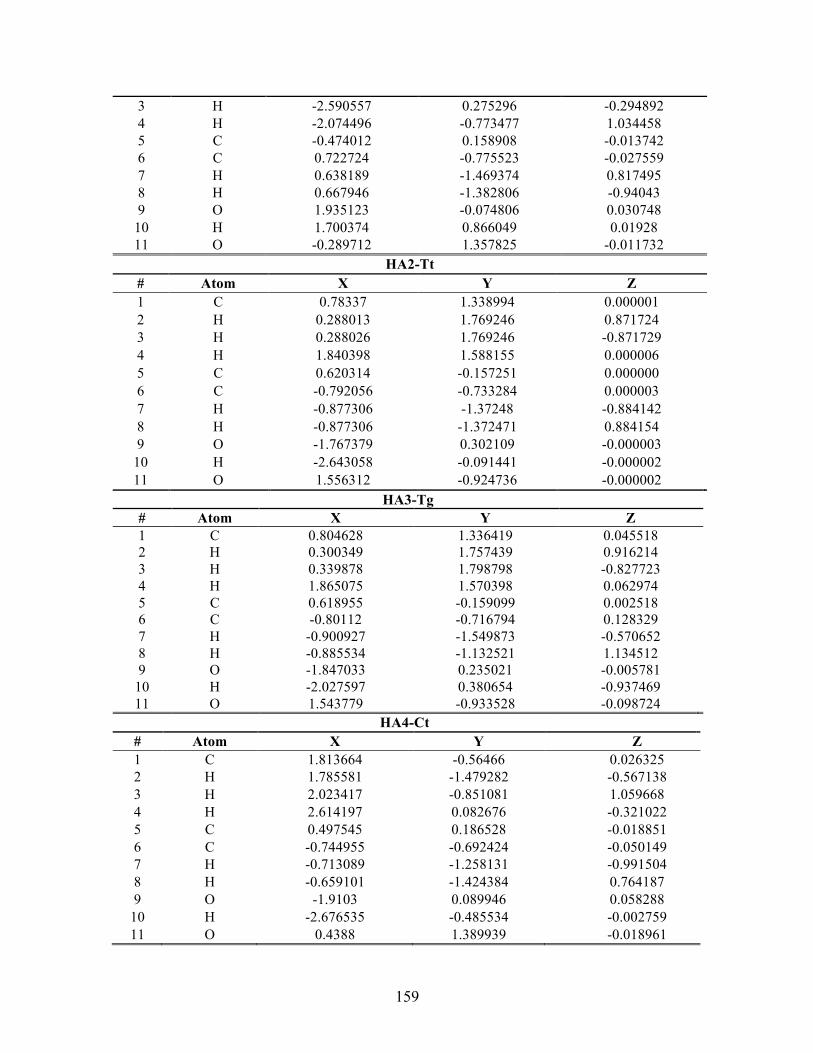
159
3 H -2.590557 0.275296 -0.294892 4 H -2.074496 -0.773477 1.034458 5 C -0.474012 0.158908 -0.013742 6 C 0.722724 -0.775523 -0.027559 7 H 0.638189 -1.469374 0.817495 8 H 0.667946 -1.382806 -0.94043 9 O 1.935123 -0.074806 0.030748
10 H 1.700374 0.866049 0.01928 11 O -0.289712 1.357825 -0.011732
HA2-Tt # Atom X Y Z 1 C 0.78337 1.338994 0.000001 2 H 0.288013 1.769246 0.871724 3 H 0.288026 1.769246 -0.871729 4 H 1.840398 1.588155 0.000006 5 C 0.620314 -0.157251 0.000000 6 C -0.792056 -0.733284 0.000003 7 H -0.877306 -1.37248 -0.884142 8 H -0.877306 -1.372471 0.884154 9 O -1.767379 0.302109 -0.000003
10 H -2.643058 -0.091441 -0.000002 11 O 1.556312 -0.924736 -0.000002
HA3-Tg # Atom X Y Z 1 C 0.804628 1.336419 0.045518 2 H 0.300349 1.757439 0.916214 3 H 0.339878 1.798798 -0.827723 4 H 1.865075 1.570398 0.062974 5 C 0.618955 -0.159099 0.002518 6 C -0.80112 -0.716794 0.128329 7 H -0.900927 -1.549873 -0.570652 8 H -0.885534 -1.132521 1.134512 9 O -1.847033 0.235021 -0.005781
10 H -2.027597 0.380654 -0.937469 11 O 1.543779 -0.933528 -0.098724
HA4-Ct # Atom X Y Z 1 C 1.813664 -0.56466 0.026325 2 H 1.785581 -1.479282 -0.567138 3 H 2.023417 -0.851081 1.059668 4 H 2.614197 0.082676 -0.321022 5 C 0.497545 0.186528 -0.018851 6 C -0.744955 -0.692424 -0.050149 7 H -0.713089 -1.258131 -0.991504 8 H -0.659101 -1.424384 0.764187 9 O -1.9103 0.089946 0.058288
10 H -2.676535 -0.485534 -0.002759 11 O 0.4388 1.389939 -0.018961
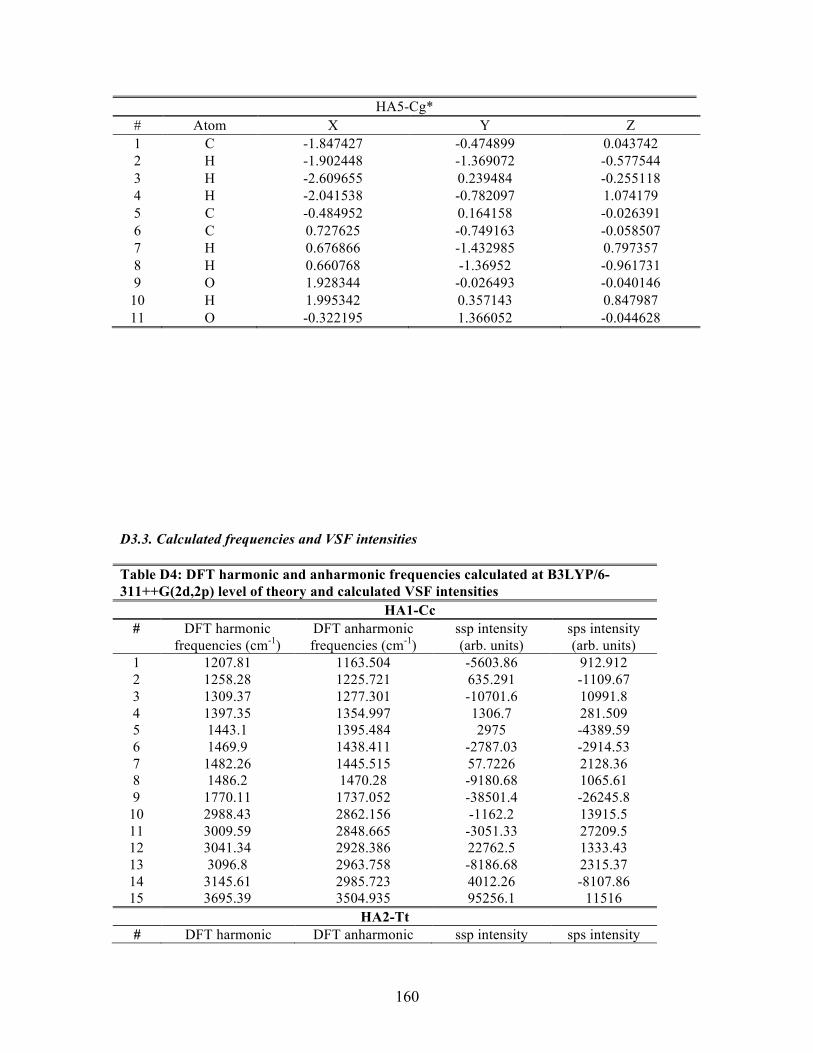
160
HA5-Cg* # Atom X Y Z 1 C -1.847427 -0.474899 0.043742 2 H -1.902448 -1.369072 -0.577544 3 H -2.609655 0.239484 -0.255118 4 H -2.041538 -0.782097 1.074179 5 C -0.484952 0.164158 -0.026391 6 C 0.727625 -0.749163 -0.058507 7 H 0.676866 -1.432985 0.797357 8 H 0.660768 -1.36952 -0.961731 9 O 1.928344 -0.026493 -0.040146
10 H 1.995342 0.357143 0.847987 11 O -0.322195 1.366052 -0.044628
D3.3. Calculated frequencies and VSF intensities Table D4: DFT harmonic and anharmonic frequencies calculated at B3LYP/6-311++G(2d,2p) level of theory and calculated VSF intensities HA1-Cc
# DFT harmonic frequencies (cm-1)
DFT anharmonic frequencies (cm-1)
ssp intensity (arb. units)
sps intensity (arb. units)
1 1207.81 1163.504 -5603.86 912.912 2 1258.28 1225.721 635.291 -1109.67 3 1309.37 1277.301 -10701.6 10991.8 4 1397.35 1354.997 1306.7 281.509 5 1443.1 1395.484 2975 -4389.59 6 1469.9 1438.411 -2787.03 -2914.53 7 1482.26 1445.515 57.7226 2128.36 8 1486.2 1470.28 -9180.68 1065.61 9 1770.11 1737.052 -38501.4 -26245.8
10 2988.43 2862.156 -1162.2 13915.5 11 3009.59 2848.665 -3051.33 27209.5 12 3041.34 2928.386 22762.5 1333.43 13 3096.8 2963.758 -8186.68 2315.37 14 3145.61 2985.723 4012.26 -8107.86 15 3695.39 3504.935 95256.1 11516
HA2-Tt # DFT harmonic DFT anharmonic ssp intensity sps intensity
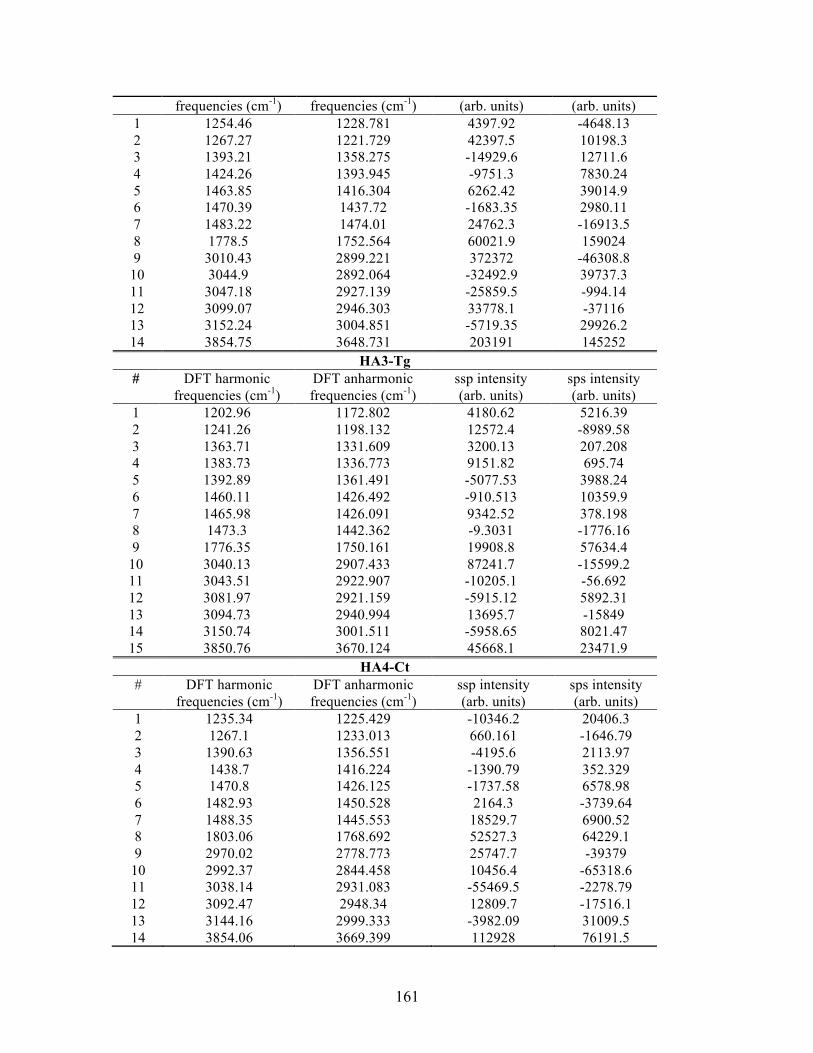
161
frequencies (cm-1) frequencies (cm-1) (arb. units) (arb. units) 1 1254.46 1228.781 4397.92 -4648.13 2 1267.27 1221.729 42397.5 10198.3 3 1393.21 1358.275 -14929.6 12711.6 4 1424.26 1393.945 -9751.3 7830.24 5 1463.85 1416.304 6262.42 39014.9 6 1470.39 1437.72 -1683.35 2980.11 7 1483.22 1474.01 24762.3 -16913.5 8 1778.5 1752.564 60021.9 159024 9 3010.43 2899.221 372372 -46308.8
10 3044.9 2892.064 -32492.9 39737.3 11 3047.18 2927.139 -25859.5 -994.14 12 3099.07 2946.303 33778.1 -37116 13 3152.24 3004.851 -5719.35 29926.2 14 3854.75 3648.731 203191 145252
HA3-Tg # DFT harmonic
frequencies (cm-1) DFT anharmonic frequencies (cm-1)
ssp intensity (arb. units)
sps intensity (arb. units)
1 1202.96 1172.802 4180.62 5216.39 2 1241.26 1198.132 12572.4 -8989.58 3 1363.71 1331.609 3200.13 207.208 4 1383.73 1336.773 9151.82 695.74 5 1392.89 1361.491 -5077.53 3988.24 6 1460.11 1426.492 -910.513 10359.9 7 1465.98 1426.091 9342.52 378.198 8 1473.3 1442.362 -9.3031 -1776.16 9 1776.35 1750.161 19908.8 57634.4
10 3040.13 2907.433 87241.7 -15599.2 11 3043.51 2922.907 -10205.1 -56.692 12 3081.97 2921.159 -5915.12 5892.31 13 3094.73 2940.994 13695.7 -15849 14 3150.74 3001.511 -5958.65 8021.47 15 3850.76 3670.124 45668.1 23471.9
HA4-Ct # DFT harmonic
frequencies (cm-1) DFT anharmonic frequencies (cm-1)
ssp intensity (arb. units)
sps intensity (arb. units)
1 1235.34 1225.429 -10346.2 20406.3 2 1267.1 1233.013 660.161 -1646.79 3 1390.63 1356.551 -4195.6 2113.97 4 1438.7 1416.224 -1390.79 352.329 5 1470.8 1426.125 -1737.58 6578.98 6 1482.93 1450.528 2164.3 -3739.64 7 1488.35 1445.553 18529.7 6900.52 8 1803.06 1768.692 52527.3 64229.1 9 2970.02 2778.773 25747.7 -39379
10 2992.37 2844.458 10456.4 -65318.6 11 3038.14 2931.083 -55469.5 -2278.79 12 3092.47 2948.34 12809.7 -17516.1 13 3144.16 2999.333 -3982.09 31009.5 14 3854.06 3669.399 112928 76191.5
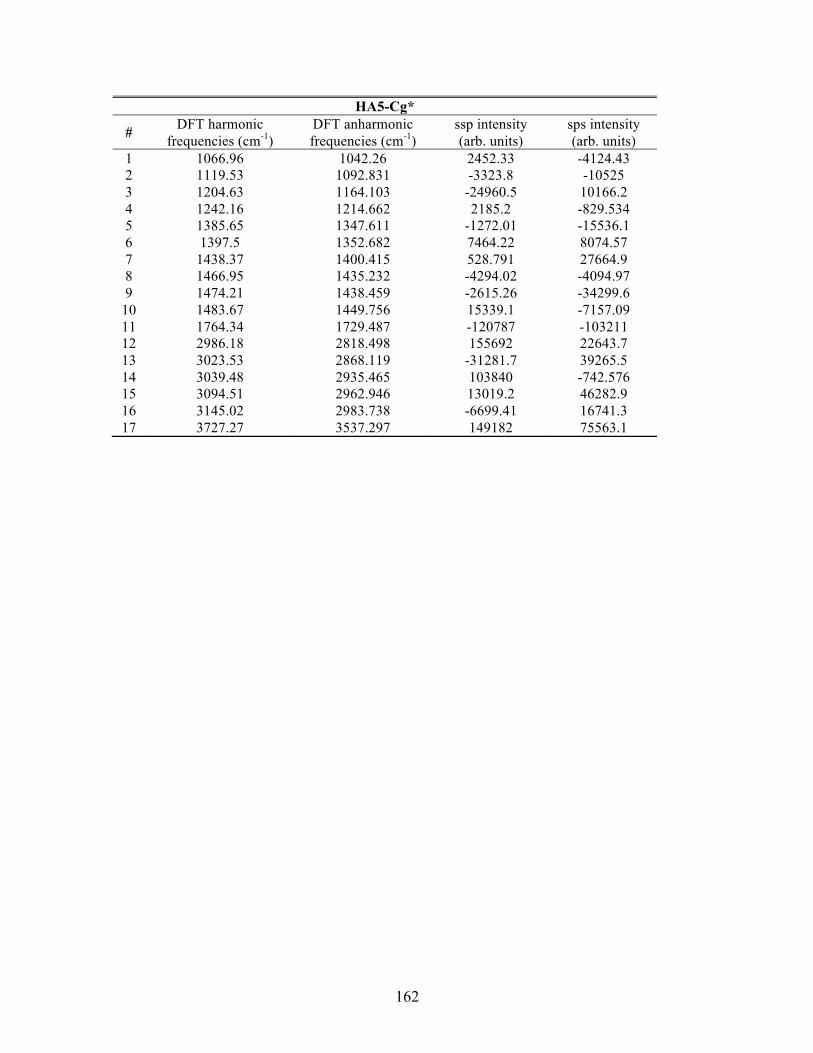
162
HA5-Cg*
# DFT harmonic frequencies (cm-1)
DFT anharmonic frequencies (cm-1)
ssp intensity (arb. units)
sps intensity (arb. units)
1 1066.96 1042.26 2452.33 -4124.43 2 1119.53 1092.831 -3323.8 -10525 3 1204.63 1164.103 -24960.5 10166.2 4 1242.16 1214.662 2185.2 -829.534 5 1385.65 1347.611 -1272.01 -15536.1 6 1397.5 1352.682 7464.22 8074.57 7 1438.37 1400.415 528.791 27664.9 8 1466.95 1435.232 -4294.02 -4094.97 9 1474.21 1438.459 -2615.26 -34299.6
10 1483.67 1449.756 15339.1 -7157.09 11 1764.34 1729.487 -120787 -103211 12 2986.18 2818.498 155692 22643.7 13 3023.53 2868.119 -31281.7 39265.5 14 3039.48 2935.465 103840 -742.576 15 3094.51 2962.946 13019.2 46282.9 16 3145.02 2983.738 -6699.41 16741.3 17 3727.27 3537.297 149182 75563.1
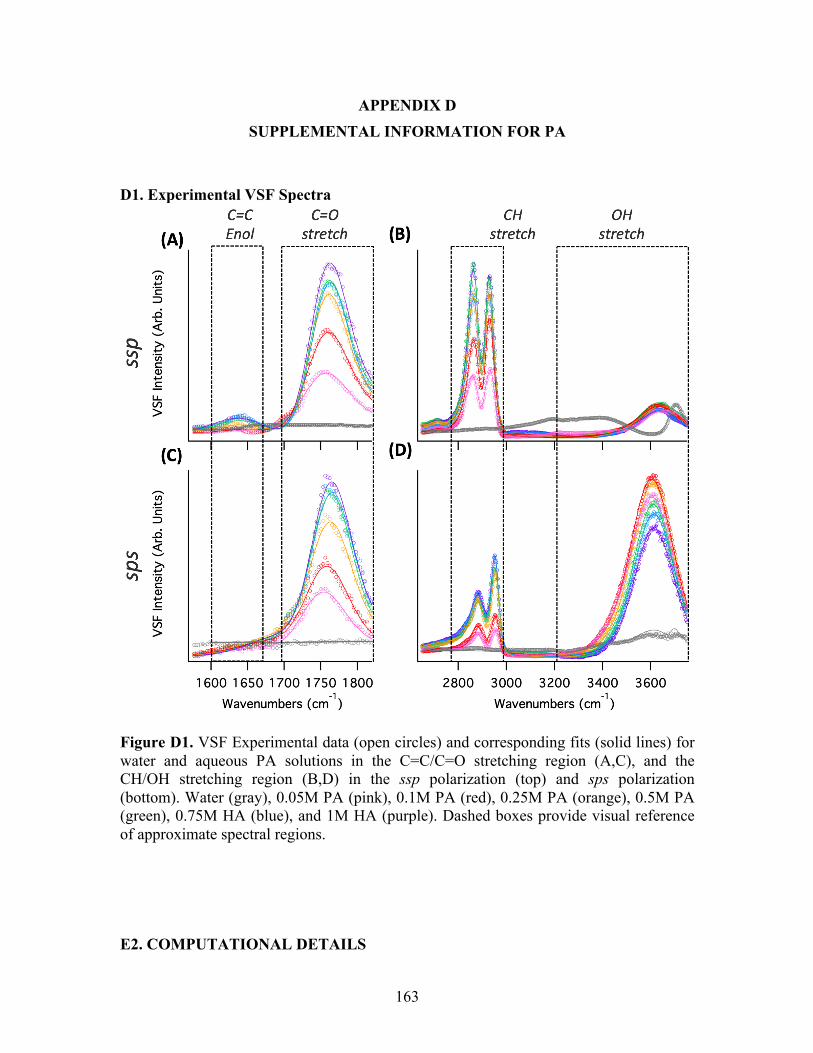
163
APPENDIX D
SUPPLEMENTAL INFORMATION FOR PA
D1. Experimental VSF Spectra
Figure D1. VSF Experimental data (open circles) and corresponding fits (solid lines) for water and aqueous PA solutions in the C=C/C=O stretching region (A,C), and the CH/OH stretching region (B,D) in the ssp polarization (top) and sps polarization (bottom). Water (gray), 0.05M PA (pink), 0.1M PA (red), 0.25M PA (orange), 0.5M PA (green), 0.75M HA (blue), and 1M HA (purple). Dashed boxes provide visual reference of approximate spectral regions. E2. COMPUTATIONAL DETAILS
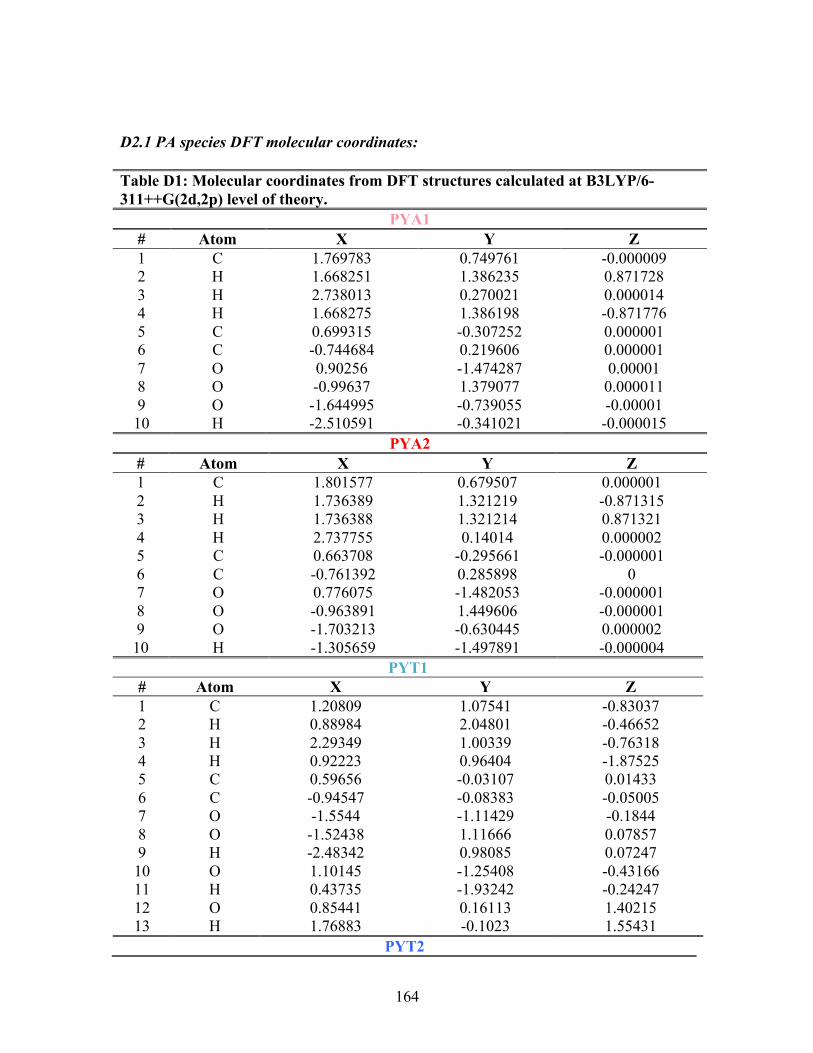
164
D2.1 PA species DFT molecular coordinates: Table D1: Molecular coordinates from DFT structures calculated at B3LYP/6-311++G(2d,2p) level of theory.
PYA1 # Atom X Y Z 1 C 1.769783 0.749761 -0.000009 2 H 1.668251 1.386235 0.871728 3 H 2.738013 0.270021 0.000014 4 H 1.668275 1.386198 -0.871776 5 C 0.699315 -0.307252 0.000001 6 C -0.744684 0.219606 0.000001 7 O 0.90256 -1.474287 0.00001 8 O -0.99637 1.379077 0.000011 9 O -1.644995 -0.739055 -0.00001 10 H -2.510591 -0.341021 -0.000015
PYA2 # Atom X Y Z 1 C 1.801577 0.679507 0.000001 2 H 1.736389 1.321219 -0.871315 3 H 1.736388 1.321214 0.871321 4 H 2.737755 0.14014 0.000002 5 C 0.663708 -0.295661 -0.000001 6 C -0.761392 0.285898 0 7 O 0.776075 -1.482053 -0.000001 8 O -0.963891 1.449606 -0.000001 9 O -1.703213 -0.630445 0.000002
10 H -1.305659 -1.497891 -0.000004 PYT1
# Atom X Y Z 1 C 1.20809 1.07541 -0.83037 2 H 0.88984 2.04801 -0.46652 3 H 2.29349 1.00339 -0.76318 4 H 0.92223 0.96404 -1.87525 5 C 0.59656 -0.03107 0.01433 6 C -0.94547 -0.08383 -0.05005 7 O -1.5544 -1.11429 -0.1844 8 O -1.52438 1.11666 0.07857 9 H -2.48342 0.98085 0.07247 10 O 1.10145 -1.25408 -0.43166 11 H 0.43735 -1.93242 -0.24247 12 O 0.85441 0.16113 1.40215 13 H 1.76883 -0.1023 1.55431
PYT2
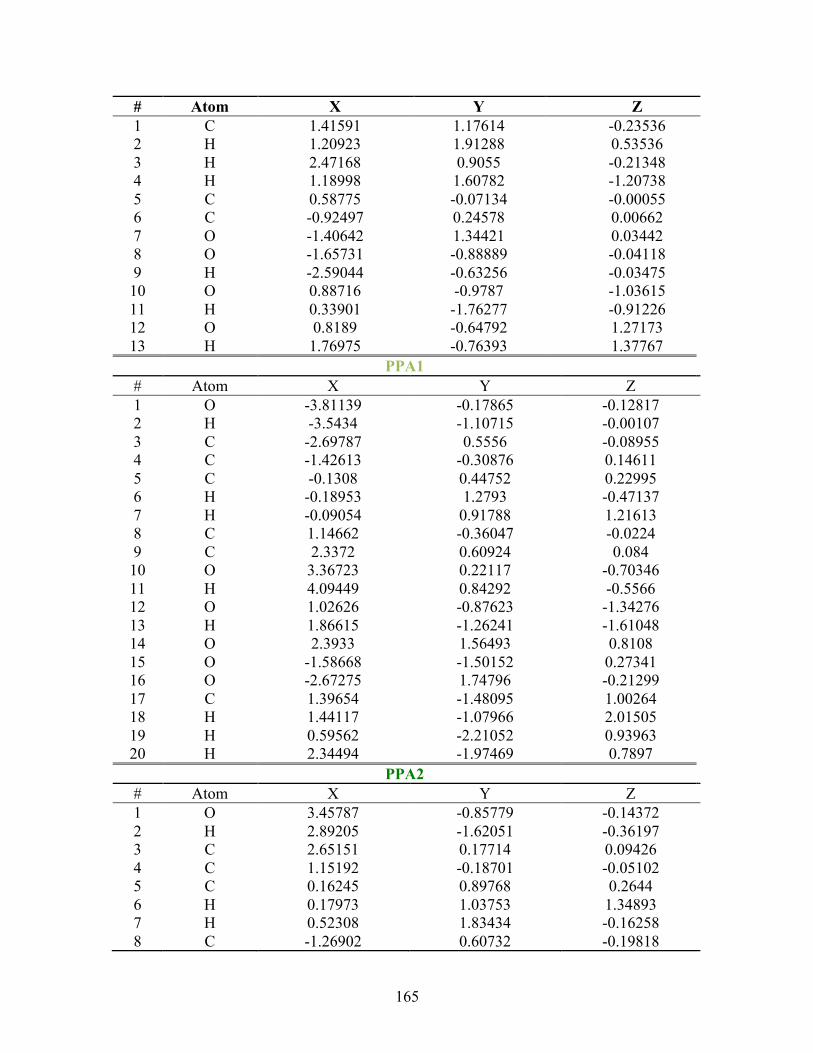
165
# Atom X Y Z 1 C 1.41591 1.17614 -0.23536 2 H 1.20923 1.91288 0.53536 3 H 2.47168 0.9055 -0.21348 4 H 1.18998 1.60782 -1.20738 5 C 0.58775 -0.07134 -0.00055 6 C -0.92497 0.24578 0.00662 7 O -1.40642 1.34421 0.03442 8 O -1.65731 -0.88889 -0.04118 9 H -2.59044 -0.63256 -0.03475
10 O 0.88716 -0.9787 -1.03615 11 H 0.33901 -1.76277 -0.91226 12 O 0.8189 -0.64792 1.27173 13 H 1.76975 -0.76393 1.37767
PPA1 # Atom X Y Z 1 O -3.81139 -0.17865 -0.12817 2 H -3.5434 -1.10715 -0.00107 3 C -2.69787 0.5556 -0.08955 4 C -1.42613 -0.30876 0.14611 5 C -0.1308 0.44752 0.22995 6 H -0.18953 1.2793 -0.47137 7 H -0.09054 0.91788 1.21613 8 C 1.14662 -0.36047 -0.0224 9 C 2.3372 0.60924 0.084
10 O 3.36723 0.22117 -0.70346 11 H 4.09449 0.84292 -0.5566 12 O 1.02626 -0.87623 -1.34276 13 H 1.86615 -1.26241 -1.61048 14 O 2.3933 1.56493 0.8108 15 O -1.58668 -1.50152 0.27341 16 O -2.67275 1.74796 -0.21299 17 C 1.39654 -1.48095 1.00264 18 H 1.44117 -1.07966 2.01505 19 H 0.59562 -2.21052 0.93963 20 H 2.34494 -1.97469 0.7897
PPA2 # Atom X Y Z 1 O 3.45787 -0.85779 -0.14372 2 H 2.89205 -1.62051 -0.36197 3 C 2.65151 0.17714 0.09426 4 C 1.15192 -0.18701 -0.05102 5 C 0.16245 0.89768 0.2644 6 H 0.17973 1.03753 1.34893 7 H 0.52308 1.83434 -0.16258 8 C -1.26902 0.60732 -0.19818
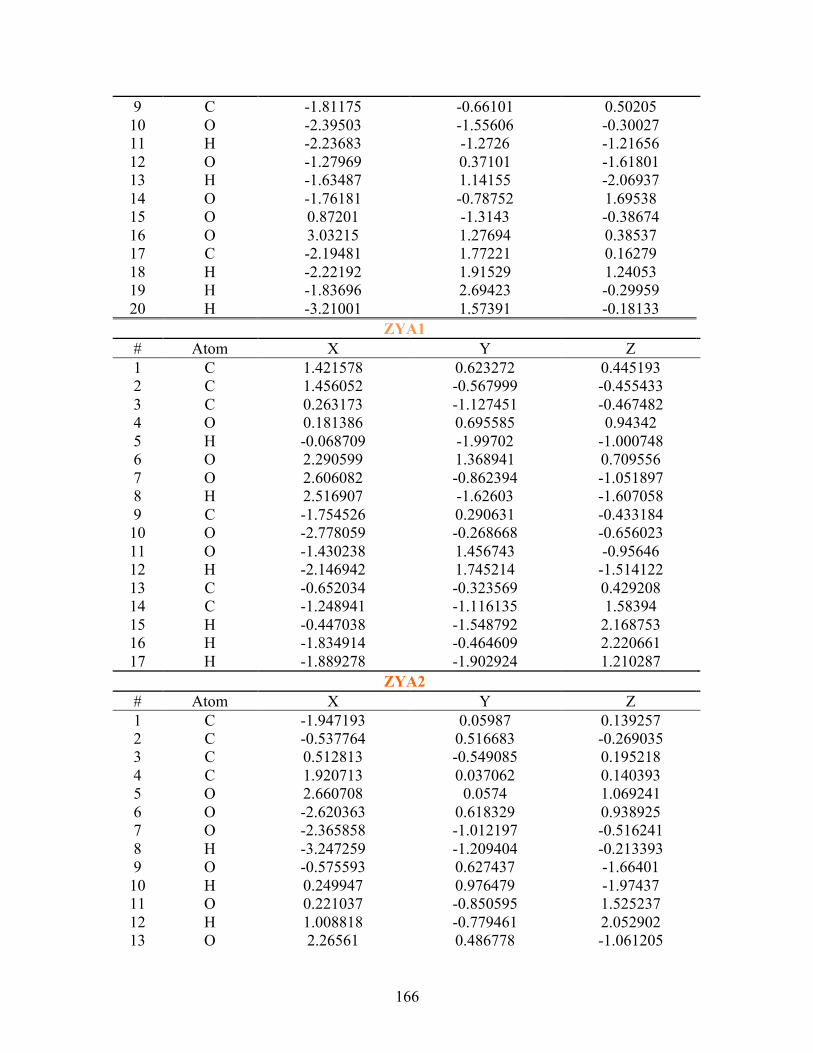
166
9 C -1.81175 -0.66101 0.50205 10 O -2.39503 -1.55606 -0.30027 11 H -2.23683 -1.2726 -1.21656 12 O -1.27969 0.37101 -1.61801 13 H -1.63487 1.14155 -2.06937 14 O -1.76181 -0.78752 1.69538 15 O 0.87201 -1.3143 -0.38674 16 O 3.03215 1.27694 0.38537 17 C -2.19481 1.77221 0.16279 18 H -2.22192 1.91529 1.24053 19 H -1.83696 2.69423 -0.29959 20 H -3.21001 1.57391 -0.18133
ZYA1 # Atom X Y Z 1 C 1.421578 0.623272 0.445193 2 C 1.456052 -0.567999 -0.455433 3 C 0.263173 -1.127451 -0.467482 4 O 0.181386 0.695585 0.94342 5 H -0.068709 -1.99702 -1.000748 6 O 2.290599 1.368941 0.709556 7 O 2.606082 -0.862394 -1.051897 8 H 2.516907 -1.62603 -1.607058 9 C -1.754526 0.290631 -0.433184
10 O -2.778059 -0.268668 -0.656023 11 O -1.430238 1.456743 -0.95646 12 H -2.146942 1.745214 -1.514122 13 C -0.652034 -0.323569 0.429208 14 C -1.248941 -1.116135 1.58394 15 H -0.447038 -1.548792 2.168753 16 H -1.834914 -0.464609 2.220661 17 H -1.889278 -1.902924 1.210287
ZYA2 # Atom X Y Z 1 C -1.947193 0.05987 0.139257 2 C -0.537764 0.516683 -0.269035 3 C 0.512813 -0.549085 0.195218 4 C 1.920713 0.037062 0.140393 5 O 2.660708 0.0574 1.069241 6 O -2.620363 0.618329 0.938925 7 O -2.365858 -1.012197 -0.516241 8 H -3.247259 -1.209404 -0.213393 9 O -0.575593 0.627437 -1.66401
10 H 0.249947 0.976479 -1.97437 11 O 0.221037 -0.850595 1.525237 12 H 1.008818 -0.779461 2.052902 13 O 2.26561 0.486778 -1.061205
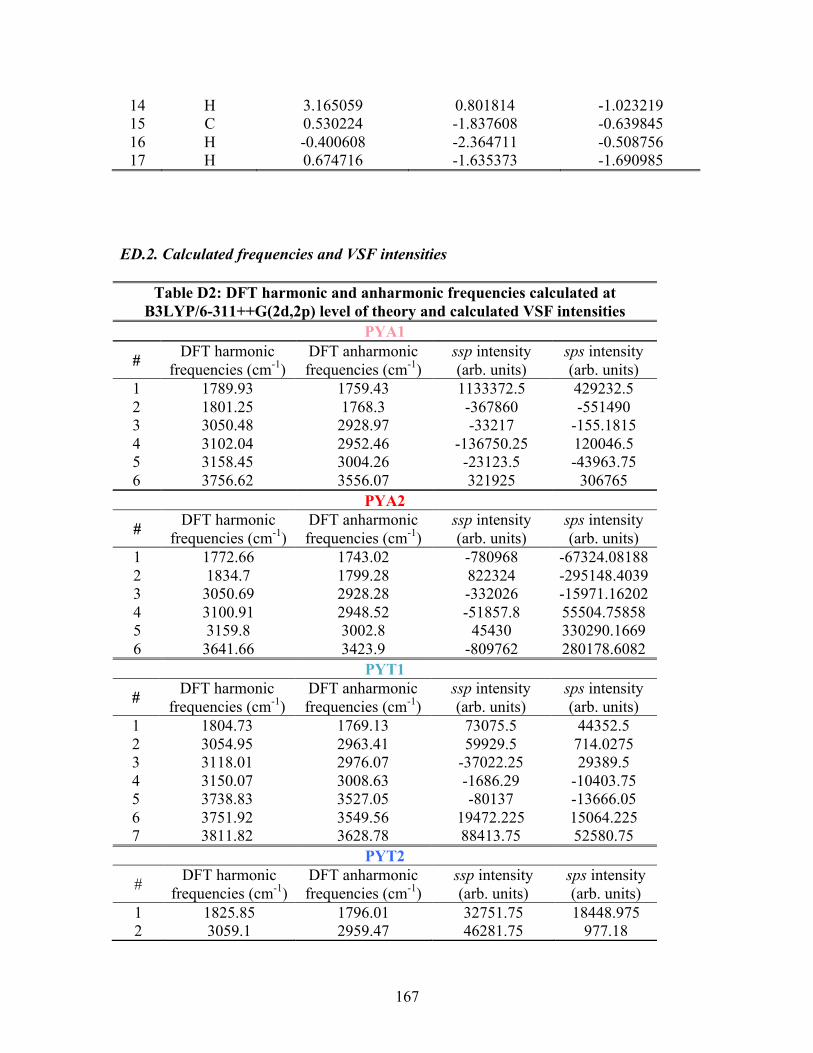
167
14 H 3.165059 0.801814 -1.023219 15 C 0.530224 -1.837608 -0.639845 16 H -0.400608 -2.364711 -0.508756 17 H 0.674716 -1.635373 -1.690985
ED.2. Calculated frequencies and VSF intensities
Table D2: DFT harmonic and anharmonic frequencies calculated at B3LYP/6-311++G(2d,2p) level of theory and calculated VSF intensities
PYA1
# DFT harmonic frequencies (cm-1)
DFT anharmonic frequencies (cm-1)
ssp intensity (arb. units)
sps intensity (arb. units)
1 1789.93 1759.43 1133372.5 429232.5 2 1801.25 1768.3 -367860 -551490 3 3050.48 2928.97 -33217 -155.1815 4 3102.04 2952.46 -136750.25 120046.5 5 3158.45 3004.26 -23123.5 -43963.75 6 3756.62 3556.07 321925 306765
PYA2
# DFT harmonic frequencies (cm-1)
DFT anharmonic frequencies (cm-1)
ssp intensity (arb. units)
sps intensity (arb. units)
1 1772.66 1743.02 -780968 -67324.08188 2 1834.7 1799.28 822324 -295148.4039 3 3050.69 2928.28 -332026 -15971.16202 4 3100.91 2948.52 -51857.8 55504.75858 5 3159.8 3002.8 45430 330290.1669 6 3641.66 3423.9 -809762 280178.6082
PYT1
# DFT harmonic frequencies (cm-1)
DFT anharmonic frequencies (cm-1)
ssp intensity (arb. units)
sps intensity (arb. units)
1 1804.73 1769.13 73075.5 44352.5 2 3054.95 2963.41 59929.5 714.0275 3 3118.01 2976.07 -37022.25 29389.5 4 3150.07 3008.63 -1686.29 -10403.75 5 3738.83 3527.05 -80137 -13666.05 6 3751.92 3549.56 19472.225 15064.225 7 3811.82 3628.78 88413.75 52580.75
PYT2
# DFT harmonic frequencies (cm-1)
DFT anharmonic frequencies (cm-1)
ssp intensity (arb. units)
sps intensity (arb. units)
1 1825.85 1796.01 32751.75 18448.975 2 3059.1 2959.47 46281.75 977.18
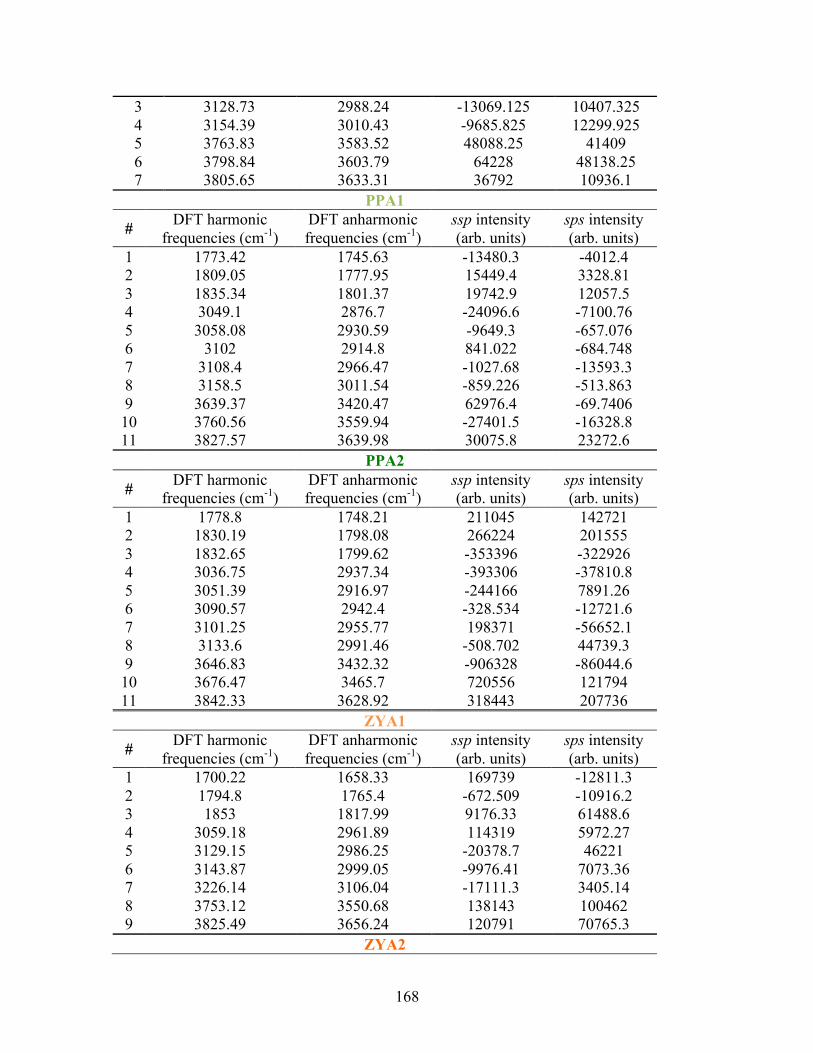
168
3 3128.73 2988.24 -13069.125 10407.325 4 3154.39 3010.43 -9685.825 12299.925 5 3763.83 3583.52 48088.25 41409 6 3798.84 3603.79 64228 48138.25 7 3805.65 3633.31 36792 10936.1
PPA1
# DFT harmonic frequencies (cm-1)
DFT anharmonic frequencies (cm-1)
ssp intensity (arb. units)
sps intensity (arb. units)
1 1773.42 1745.63 -13480.3 -4012.4 2 1809.05 1777.95 15449.4 3328.81 3 1835.34 1801.37 19742.9 12057.5 4 3049.1 2876.7 -24096.6 -7100.76 5 3058.08 2930.59 -9649.3 -657.076 6 3102 2914.8 841.022 -684.748 7 3108.4 2966.47 -1027.68 -13593.3 8 3158.5 3011.54 -859.226 -513.863 9 3639.37 3420.47 62976.4 -69.7406 10 3760.56 3559.94 -27401.5 -16328.8 11 3827.57 3639.98 30075.8 23272.6
PPA2
# DFT harmonic frequencies (cm-1)
DFT anharmonic frequencies (cm-1)
ssp intensity (arb. units)
sps intensity (arb. units)
1 1778.8 1748.21 211045 142721 2 1830.19 1798.08 266224 201555 3 1832.65 1799.62 -353396 -322926 4 3036.75 2937.34 -393306 -37810.8 5 3051.39 2916.97 -244166 7891.26 6 3090.57 2942.4 -328.534 -12721.6 7 3101.25 2955.77 198371 -56652.1 8 3133.6 2991.46 -508.702 44739.3 9 3646.83 3432.32 -906328 -86044.6 10 3676.47 3465.7 720556 121794 11 3842.33 3628.92 318443 207736
ZYA1
# DFT harmonic frequencies (cm-1)
DFT anharmonic frequencies (cm-1)
ssp intensity (arb. units)
sps intensity (arb. units)
1 1700.22 1658.33 169739 -12811.3 2 1794.8 1765.4 -672.509 -10916.2 3 1853 1817.99 9176.33 61488.6 4 3059.18 2961.89 114319 5972.27 5 3129.15 2986.25 -20378.7 46221 6 3143.87 2999.05 -9976.41 7073.36 7 3226.14 3106.04 -17111.3 3405.14 8 3753.12 3550.68 138143 100462 9 3825.49 3656.24 120791 70765.3
ZYA2
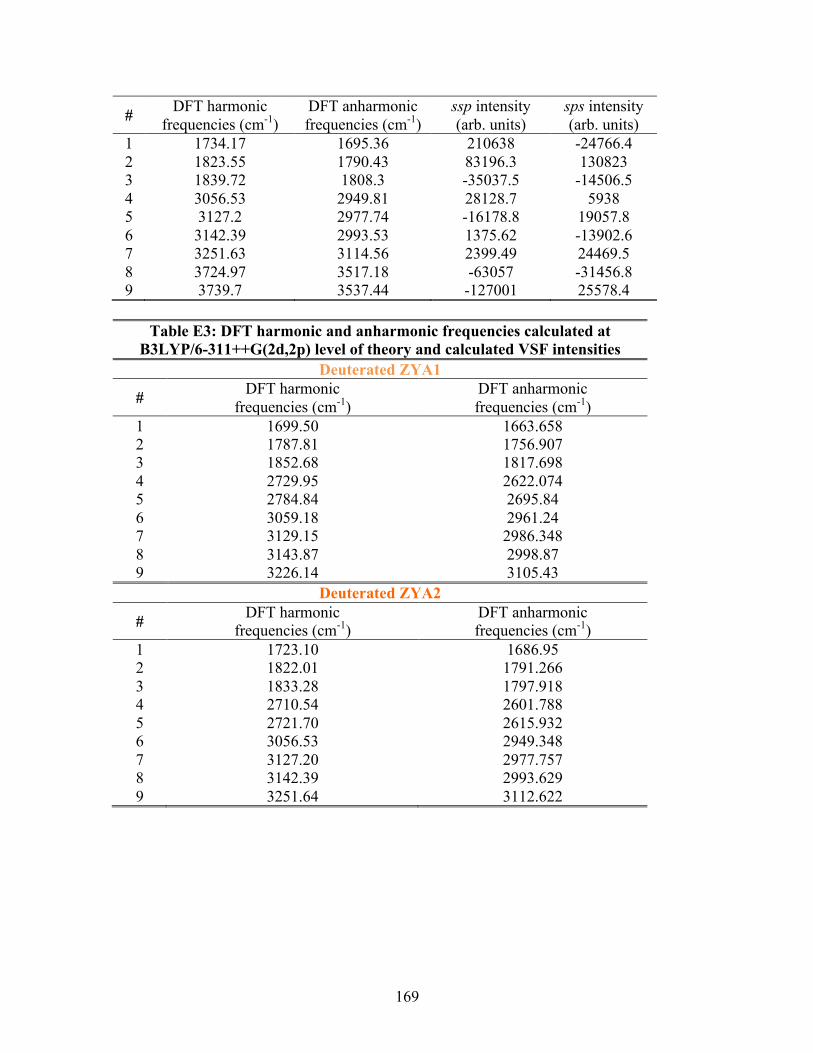
169
# DFT harmonic frequencies (cm-1)
DFT anharmonic frequencies (cm-1)
ssp intensity (arb. units)
sps intensity (arb. units)
1 1734.17 1695.36 210638 -24766.4 2 1823.55 1790.43 83196.3 130823 3 1839.72 1808.3 -35037.5 -14506.5 4 3056.53 2949.81 28128.7 5938 5 3127.2 2977.74 -16178.8 19057.8 6 3142.39 2993.53 1375.62 -13902.6 7 3251.63 3114.56 2399.49 24469.5 8 3724.97 3517.18 -63057 -31456.8 9 3739.7 3537.44 -127001 25578.4
Table E3: DFT harmonic and anharmonic frequencies calculated at
B3LYP/6-311++G(2d,2p) level of theory and calculated VSF intensities Deuterated ZYA1
# DFT harmonic frequencies (cm-1)
DFT anharmonic frequencies (cm-1)
1 1699.50 1663.658 2 1787.81 1756.907 3 1852.68 1817.698 4 2729.95 2622.074 5 2784.84 2695.84 6 3059.18 2961.24 7 3129.15 2986.348 8 3143.87 2998.87 9 3226.14 3105.43
Deuterated ZYA2
# DFT harmonic frequencies (cm-1)
DFT anharmonic frequencies (cm-1)
1 1723.10 1686.95 2 1822.01 1791.266 3 1833.28 1797.918 4 2710.54 2601.788 5 2721.70 2615.932 6 3056.53 2949.348 7 3127.20 2977.757 8 3142.39 2993.629 9 3251.64 3112.622
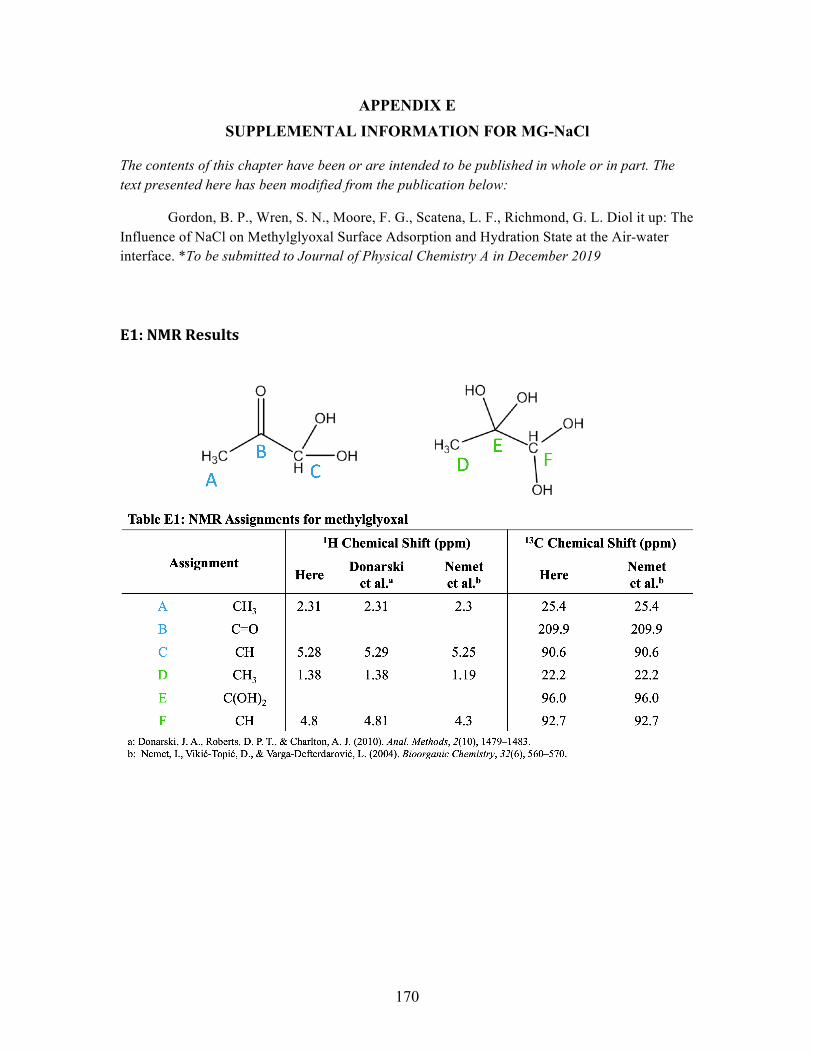
170
APPENDIX E SUPPLEMENTAL INFORMATION FOR MG-NaCl
The contents of this chapter have been or are intended to be published in whole or in part. The text presented here has been modified from the publication below:
Gordon, B. P., Wren, S. N., Moore, F. G., Scatena, L. F., Richmond, G. L. Diol it up: The Influence of NaCl on Methylglyoxal Surface Adsorption and Hydration State at the Air-water interface. *To be submitted to Journal of Physical Chemistry A in December 2019
E1:NMRResults
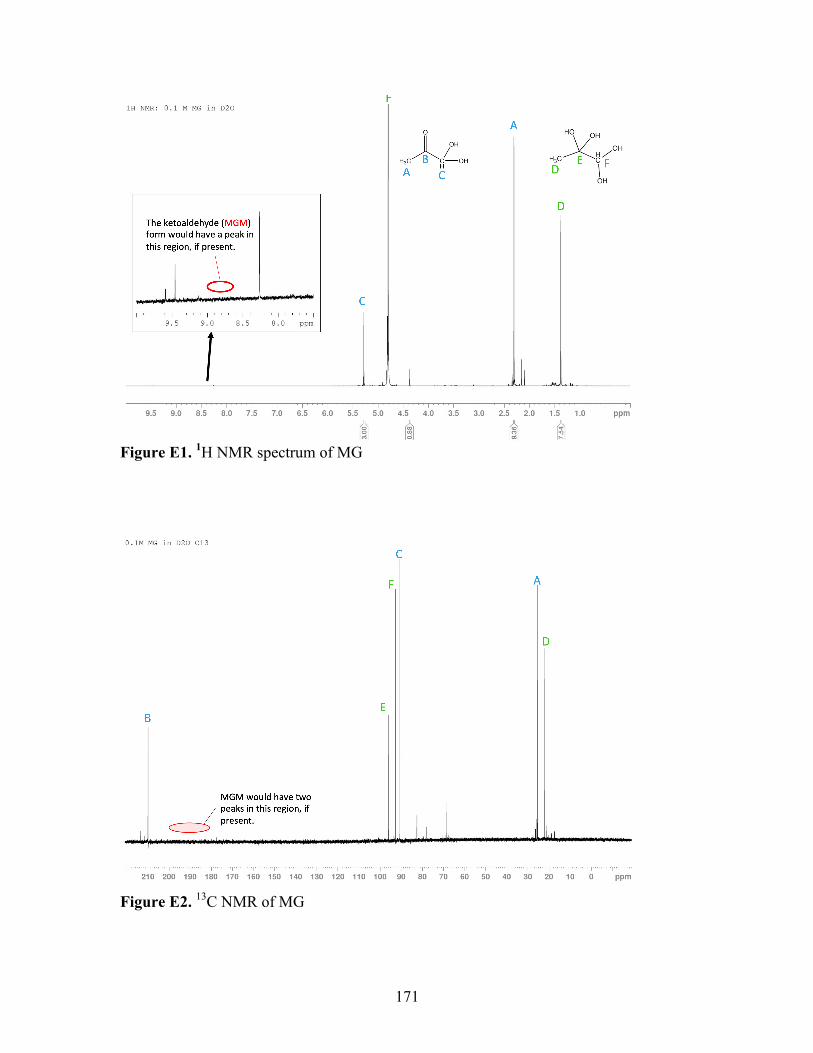
171
Figure E1. 1H NMR spectrum of MG
Figure E2. 13C NMR of MG
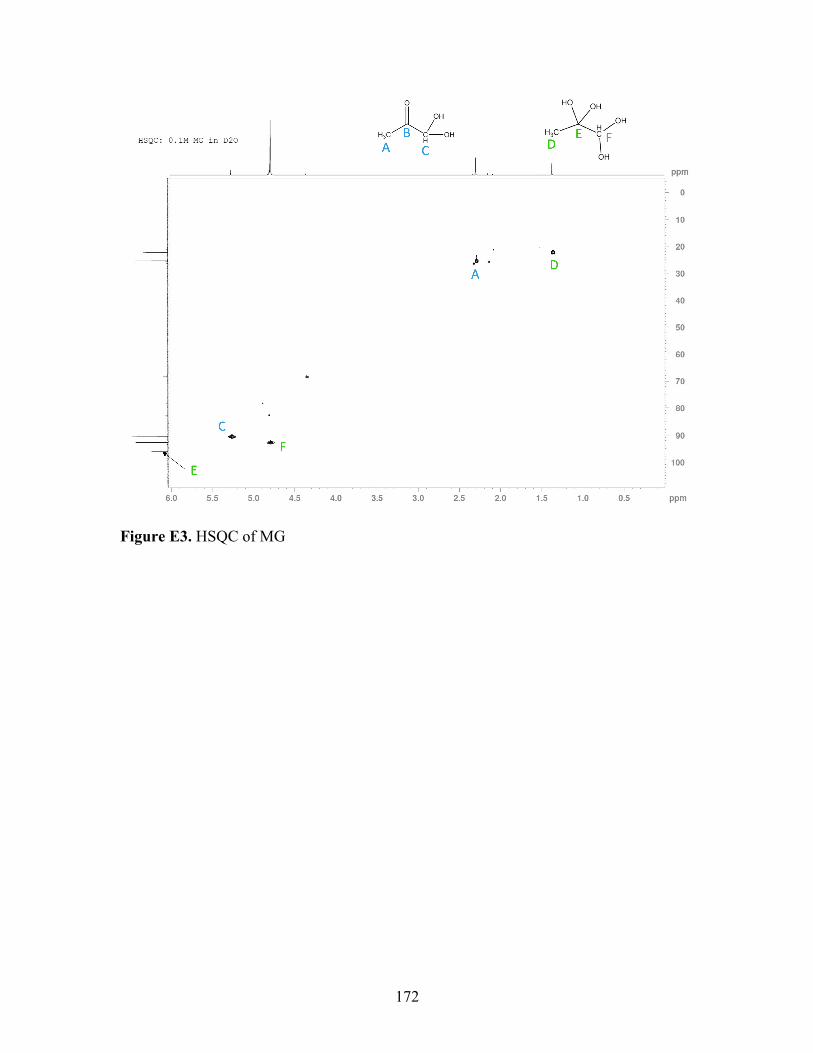
172
Figure E3. HSQC of MG
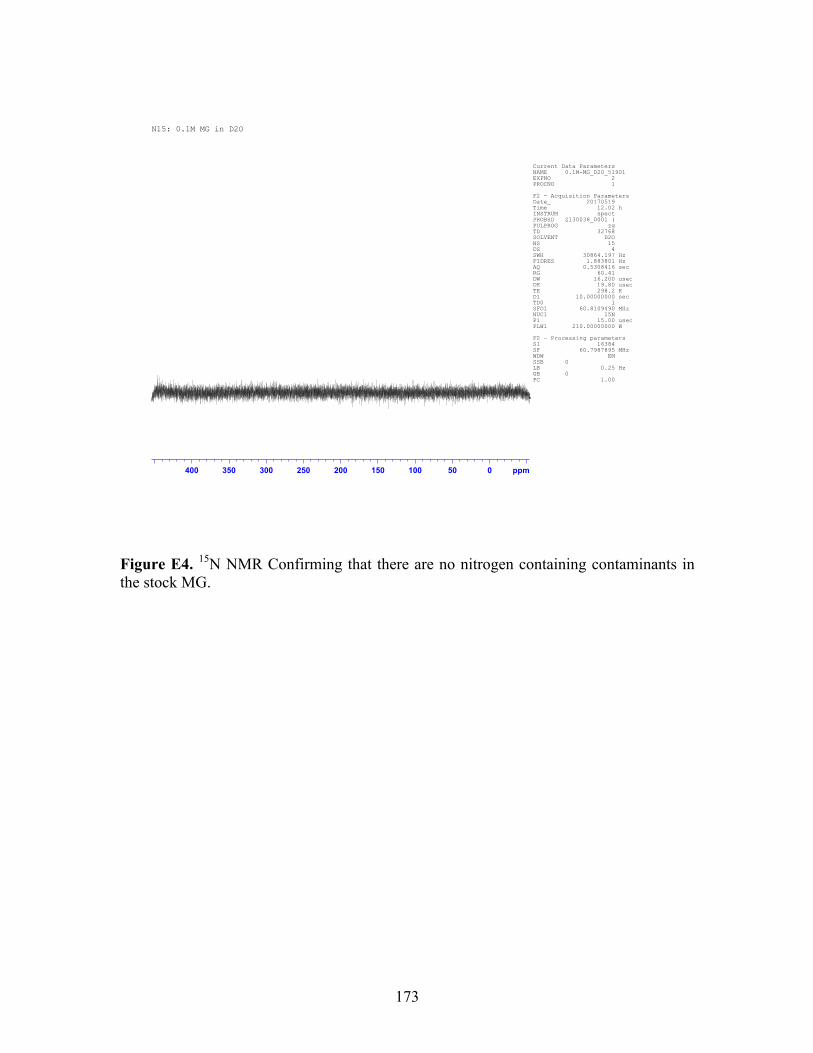
173
Figure E4. 15N NMR Confirming that there are no nitrogen containing contaminants in the stock MG.
400 350 300 250 200 150 100 50 0 ppm
Current Data ParametersNAME 0.1M-MG_D2O_51901EXPNO 2PROCNO 1
F2 - Acquisition ParametersDate_ 20170519Time 12.02 hINSTRUM spectPROBHD Z130038_0001 (PULPROG zgTD 32768SOLVENT D2ONS 15DS 4SWH 30864.197 HzFIDRES 1.883801 HzAQ 0.5308416 secRG 60.41DW 16.200 usecDE 19.80 usecTE 298.2 KD1 10.00000000 secTD0 1SFO1 60.8109490 MHzNUC1 15NP1 15.00 usecPLW1 210.00000000 W
F2 - Processing parametersSI 16384SF 60.7987895 MHzWDW EMSSB 0LB 0.25 HzGB 0PC 1.00
N15: 0.1M MG in D2O
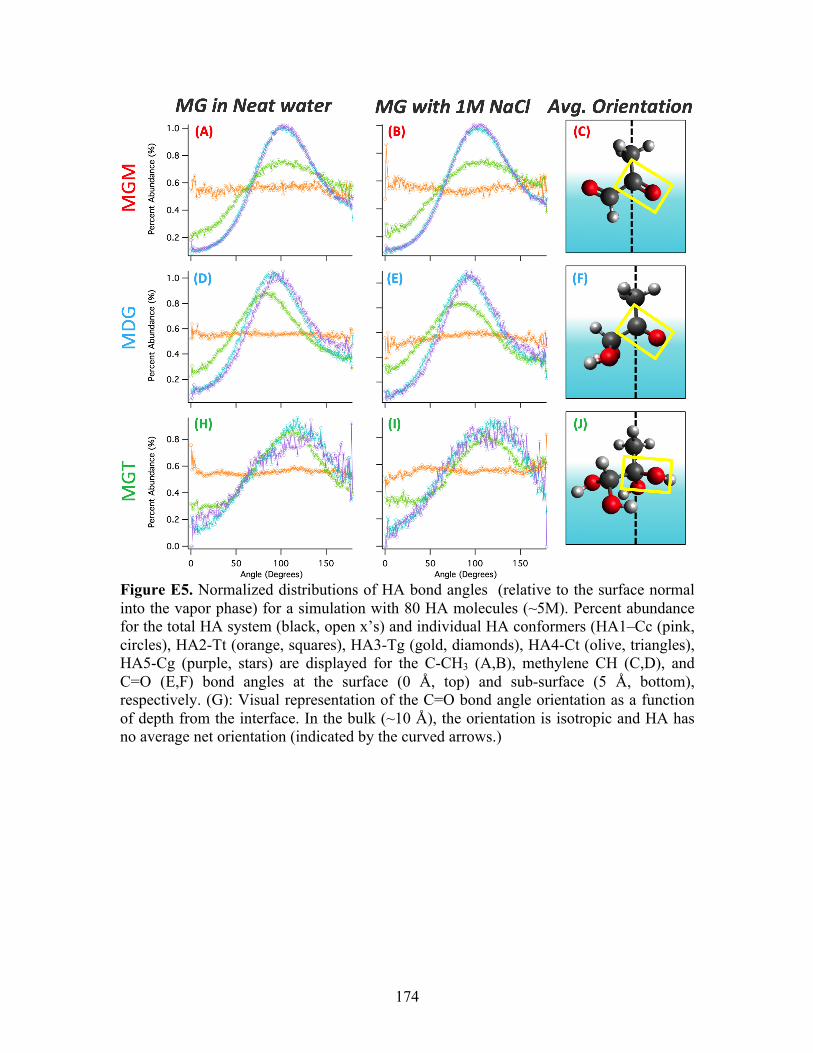
174
Figure E5. Normalized distributions of HA bond angles (relative to the surface normal into the vapor phase) for a simulation with 80 HA molecules (~5M). Percent abundance for the total HA system (black, open x’s) and individual HA conformers (HA1–Cc (pink, circles), HA2-Tt (orange, squares), HA3-Tg (gold, diamonds), HA4-Ct (olive, triangles), HA5-Cg (purple, stars) are displayed for the C-CH3 (A,B), methylene CH (C,D), and C=O (E,F) bond angles at the surface (0 Å, top) and sub-surface (5 Å, bottom), respectively. (G): Visual representation of the C=O bond angle orientation as a function of depth from the interface. In the bulk (~10 Å), the orientation is isotropic and HA has no average net orientation (indicated by the curved arrows.)
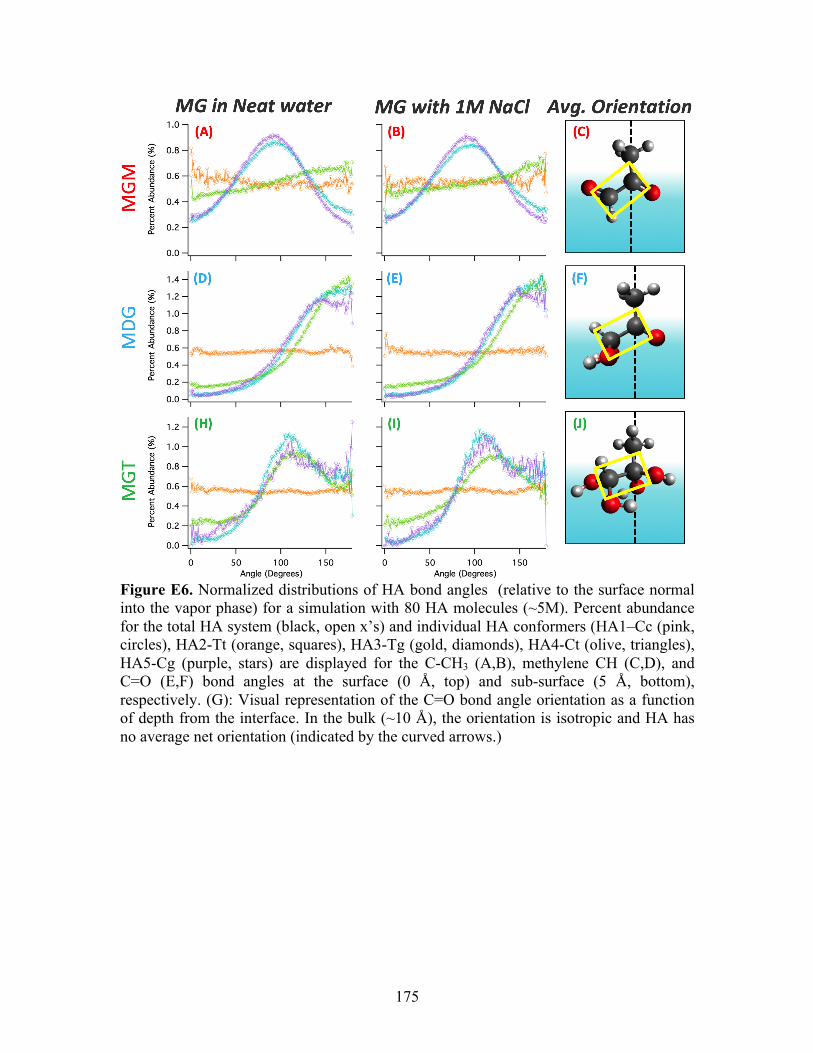
175
Figure E6. Normalized distributions of HA bond angles (relative to the surface normal into the vapor phase) for a simulation with 80 HA molecules (~5M). Percent abundance for the total HA system (black, open x’s) and individual HA conformers (HA1–Cc (pink, circles), HA2-Tt (orange, squares), HA3-Tg (gold, diamonds), HA4-Ct (olive, triangles), HA5-Cg (purple, stars) are displayed for the C-CH3 (A,B), methylene CH (C,D), and C=O (E,F) bond angles at the surface (0 Å, top) and sub-surface (5 Å, bottom), respectively. (G): Visual representation of the C=O bond angle orientation as a function of depth from the interface. In the bulk (~10 Å), the orientation is isotropic and HA has no average net orientation (indicated by the curved arrows.)

176
Figure E7. Normalized distributions of HA bond angles (relative to the surface normal into the vapor phase) for a simulation with 80 HA molecules (~5M). Percent abundance for the total HA system (black, open x’s) and individual HA conformers (HA1–Cc (pink, circles), HA2-Tt (orange, squares), HA3-Tg (gold, diamonds), HA4-Ct (olive, triangles), HA5-Cg (purple, stars) are displayed for the C-CH3 (A,B), methylene CH (C,D), and C=O (E,F) bond angles at the surface (0 Å, top) and sub-surface (5 Å, bottom), respectively. (G): Visual representation of the C=O bond angle orientation as a function of depth from the interface. In the bulk (~10 Å), the orientation is isotropic and HA has no average net orientation (indicated by the curved arrows.)
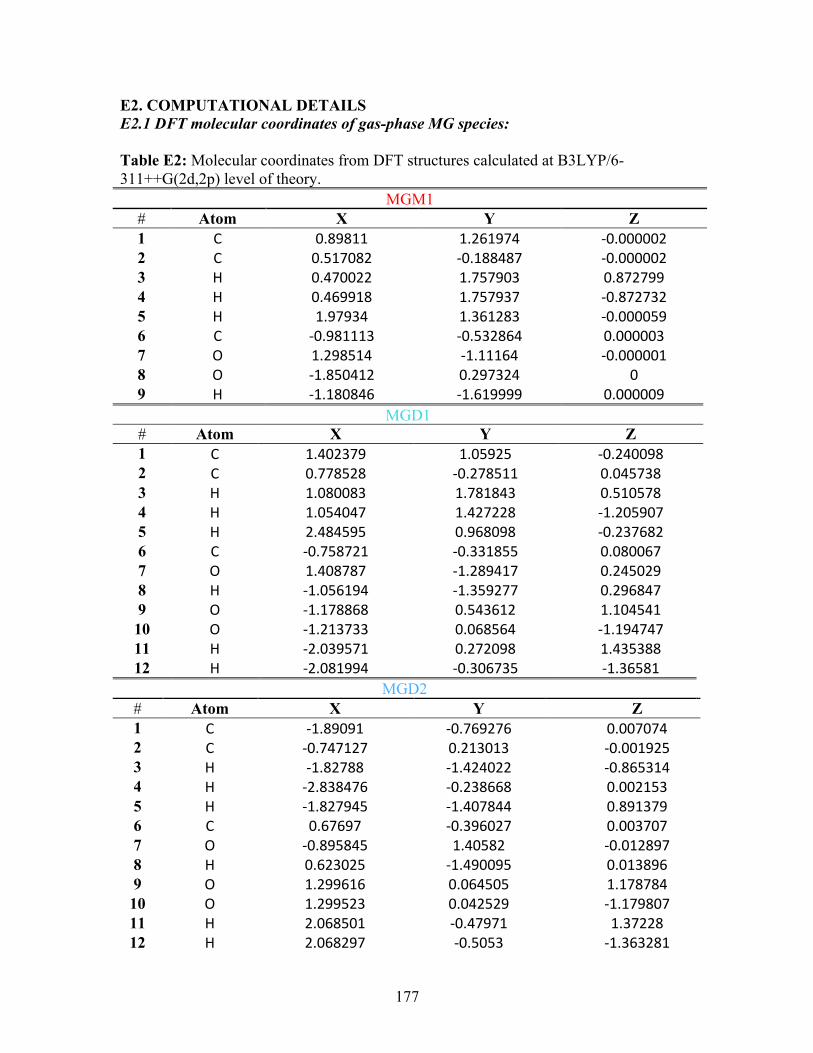
177
E2. COMPUTATIONAL DETAILS E2.1 DFT molecular coordinates of gas-phase MG species: Table E2: Molecular coordinates from DFT structures calculated at B3LYP/6-311++G(2d,2p) level of theory.
MGM1 # Atom X Y Z 1 C 0.89811 1.261974 -0.000002 2 C 0.517082 -0.188487 -0.000002 3 H 0.470022 1.757903 0.872799 4 H 0.469918 1.757937 -0.872732 5 H 1.97934 1.361283 -0.000059 6 C -0.981113 -0.532864 0.000003 7 O 1.298514 -1.11164 -0.000001 8 O -1.850412 0.297324 0 9 H -1.180846 -1.619999 0.000009
MGD1 # Atom X Y Z 1 C 1.402379 1.05925 -0.240098 2 C 0.778528 -0.278511 0.045738 3 H 1.080083 1.781843 0.510578 4 H 1.054047 1.427228 -1.205907 5 H 2.484595 0.968098 -0.237682 6 C -0.758721 -0.331855 0.080067 7 O 1.408787 -1.289417 0.245029 8 H -1.056194 -1.359277 0.296847 9 O -1.178868 0.543612 1.104541 10 O -1.213733 0.068564 -1.194747 11 H -2.039571 0.272098 1.435388 12 H -2.081994 -0.306735 -1.36581
MGD2 # Atom X Y Z 1 C -1.89091 -0.769276 0.007074 2 C -0.747127 0.213013 -0.001925 3 H -1.82788 -1.424022 -0.865314 4 H -2.838476 -0.238668 0.002153 5 H -1.827945 -1.407844 0.891379 6 C 0.67697 -0.396027 0.003707 7 O -0.895845 1.40582 -0.012897 8 H 0.623025 -1.490095 0.013896 9 O 1.299616 0.064505 1.178784
10 O 1.299523 0.042529 -1.179807 11 H 2.068501 -0.47971 1.37228 12 H 2.068297 -0.5053 -1.363281
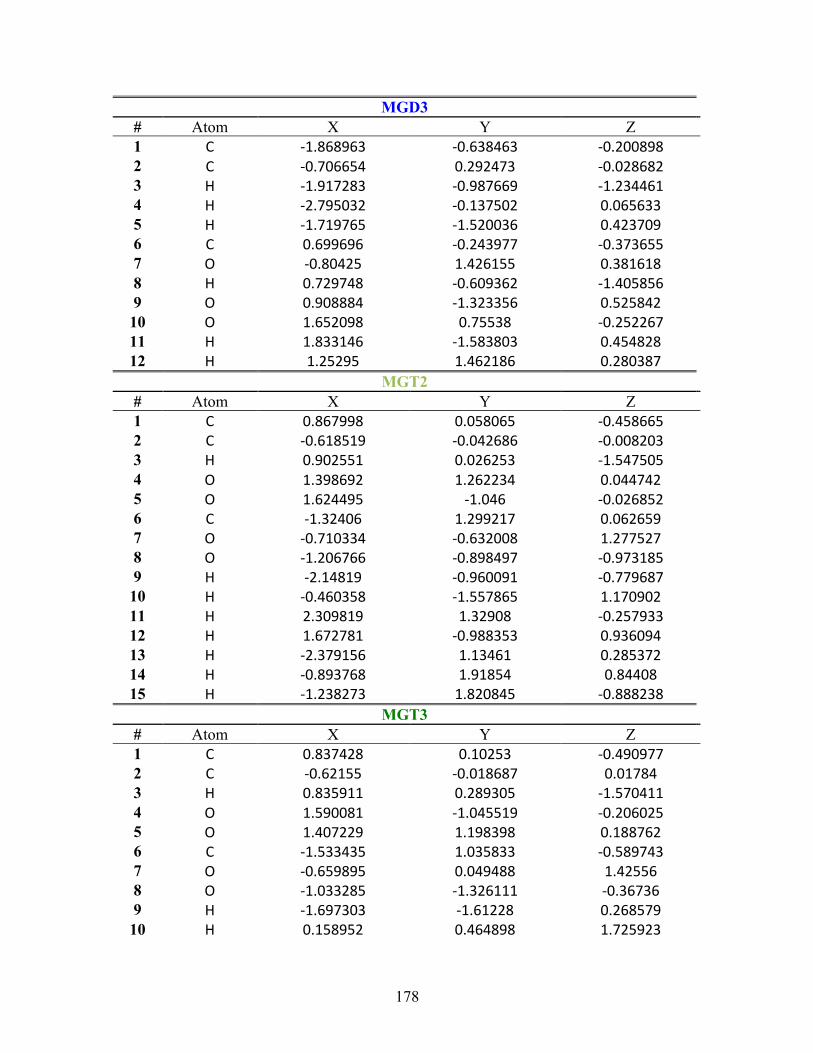
178
MGD3 # Atom X Y Z 1 C -1.868963 -0.638463 -0.200898 2 C -0.706654 0.292473 -0.028682 3 H -1.917283 -0.987669 -1.234461 4 H -2.795032 -0.137502 0.065633 5 H -1.719765 -1.520036 0.423709 6 C 0.699696 -0.243977 -0.373655 7 O -0.80425 1.426155 0.381618 8 H 0.729748 -0.609362 -1.405856 9 O 0.908884 -1.323356 0.525842
10 O 1.652098 0.75538 -0.252267 11 H 1.833146 -1.583803 0.454828 12 H 1.25295 1.462186 0.280387
MGT2 # Atom X Y Z 1 C 0.867998 0.058065 -0.458665 2 C -0.618519 -0.042686 -0.008203 3 H 0.902551 0.026253 -1.547505 4 O 1.398692 1.262234 0.044742 5 O 1.624495 -1.046 -0.026852 6 C -1.32406 1.299217 0.062659 7 O -0.710334 -0.632008 1.277527 8 O -1.206766 -0.898497 -0.973185 9 H -2.14819 -0.960091 -0.779687
10 H -0.460358 -1.557865 1.170902 11 H 2.309819 1.32908 -0.257933 12 H 1.672781 -0.988353 0.936094 13 H -2.379156 1.13461 0.285372 14 H -0.893768 1.91854 0.84408 15 H -1.238273 1.820845 -0.888238
MGT3 # Atom X Y Z 1 C 0.837428 0.10253 -0.490977 2 C -0.62155 -0.018687 0.01784 3 H 0.835911 0.289305 -1.570411 4 O 1.590081 -1.045519 -0.206025 5 O 1.407229 1.198398 0.188762 6 C -1.533435 1.035833 -0.589743 7 O -0.659895 0.049488 1.42556 8 O -1.033285 -1.326111 -0.36736 9 H -1.697303 -1.61228 0.268579
10 H 0.158952 0.464898 1.725923
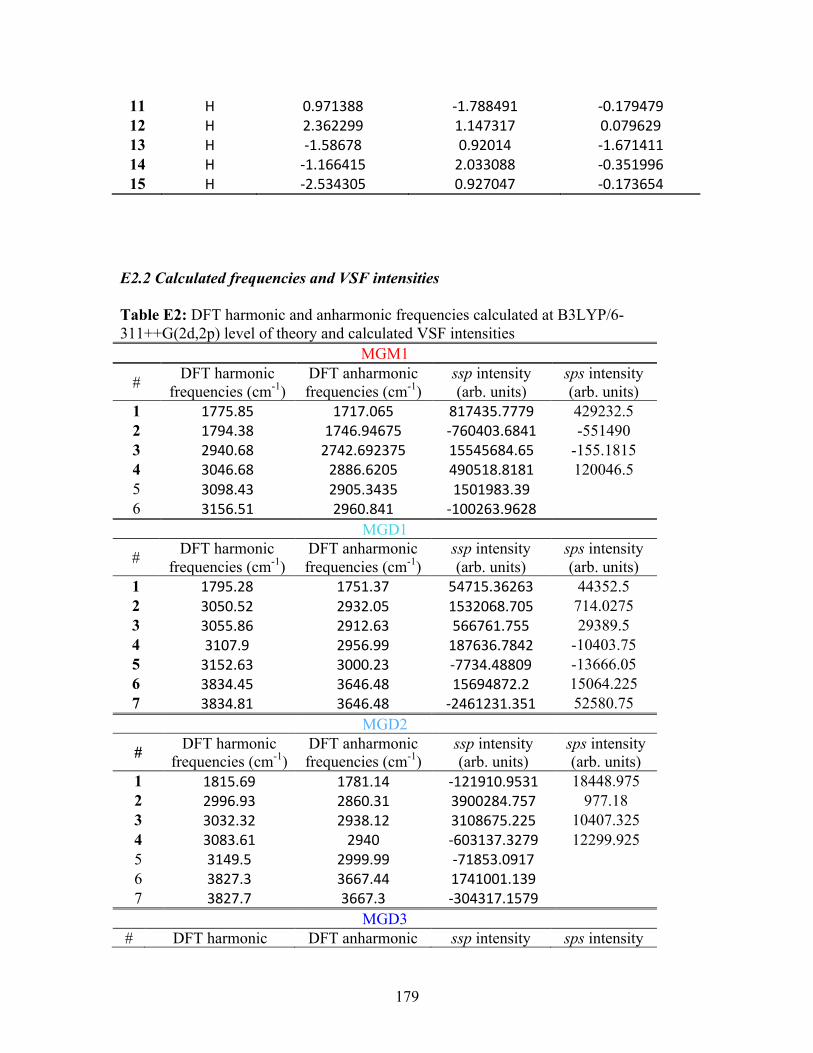
179
11 H 0.971388 -1.788491 -0.179479 12 H 2.362299 1.147317 0.079629 13 H -1.58678 0.92014 -1.671411 14 H -1.166415 2.033088 -0.351996 15 H -2.534305 0.927047 -0.173654
E2.2 Calculated frequencies and VSF intensities Table E2: DFT harmonic and anharmonic frequencies calculated at B3LYP/6-311++G(2d,2p) level of theory and calculated VSF intensities
MGM1
# DFT harmonic frequencies (cm-1)
DFT anharmonic frequencies (cm-1)
ssp intensity (arb. units)
sps intensity (arb. units)
1 1775.85 1717.065 817435.7779 429232.5 2 1794.38 1746.94675 -760403.6841 -551490 3 2940.68 2742.692375 15545684.65 -155.1815 4 3046.68 2886.6205 490518.8181 120046.5 5 3098.43 2905.3435 1501983.39 6 3156.51 2960.841 -100263.9628
MGD1
# DFT harmonic frequencies (cm-1)
DFT anharmonic frequencies (cm-1)
ssp intensity (arb. units)
sps intensity (arb. units)
1 1795.28 1751.37 54715.36263 44352.5 2 3050.52 2932.05 1532068.705 714.0275 3 3055.86 2912.63 566761.755 29389.5 4 3107.9 2956.99 187636.7842 -10403.75 5 3152.63 3000.23 -7734.48809 -13666.05 6 3834.45 3646.48 15694872.2 15064.225 7 3834.81 3646.48 -2461231.351 52580.75
MGD2
# DFT harmonic frequencies (cm-1)
DFT anharmonic frequencies (cm-1)
ssp intensity (arb. units)
sps intensity (arb. units)
1 1815.69 1781.14 -121910.9531 18448.975 2 2996.93 2860.31 3900284.757 977.18 3 3032.32 2938.12 3108675.225 10407.325 4 3083.61 2940 -603137.3279 12299.925 5 3149.5 2999.99 -71853.0917 6 3827.3 3667.44 1741001.139 7 3827.7 3667.3 -304317.1579
MGD3 # DFT harmonic DFT anharmonic ssp intensity sps intensity
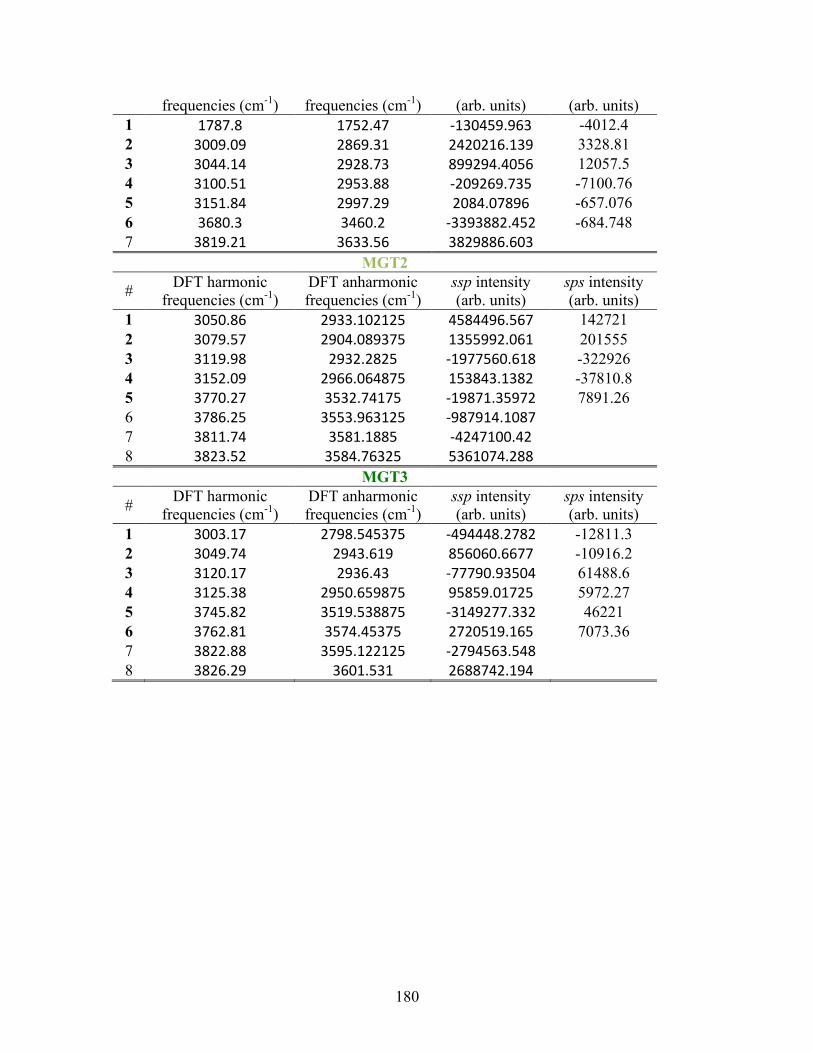
180
frequencies (cm-1) frequencies (cm-1) (arb. units) (arb. units) 1 1787.8 1752.47 -130459.963 -4012.4 2 3009.09 2869.31 2420216.139 3328.81 3 3044.14 2928.73 899294.4056 12057.5 4 3100.51 2953.88 -209269.735 -7100.76 5 3151.84 2997.29 2084.07896 -657.076 6 3680.3 3460.2 -3393882.452 -684.748 7 3819.21 3633.56 3829886.603
MGT2
# DFT harmonic frequencies (cm-1)
DFT anharmonic frequencies (cm-1)
ssp intensity (arb. units)
sps intensity (arb. units)
1 3050.86 2933.102125 4584496.567 142721 2 3079.57 2904.089375 1355992.061 201555 3 3119.98 2932.2825 -1977560.618 -322926 4 3152.09 2966.064875 153843.1382 -37810.8 5 3770.27 3532.74175 -19871.35972 7891.26 6 3786.25 3553.963125 -987914.1087 7 3811.74 3581.1885 -4247100.42 8 3823.52 3584.76325 5361074.288
MGT3
# DFT harmonic frequencies (cm-1)
DFT anharmonic frequencies (cm-1)
ssp intensity (arb. units)
sps intensity (arb. units)
1 3003.17 2798.545375 -494448.2782 -12811.3 2 3049.74 2943.619 856060.6677 -10916.2 3 3120.17 2936.43 -77790.93504 61488.6 4 3125.38 2950.659875 95859.01725 5972.27 5 3745.82 3519.538875 -3149277.332 46221 6 3762.81 3574.45375 2720519.165 7073.36 7 3822.88 3595.122125 -2794563.548 8 3826.29 3601.531 2688742.194
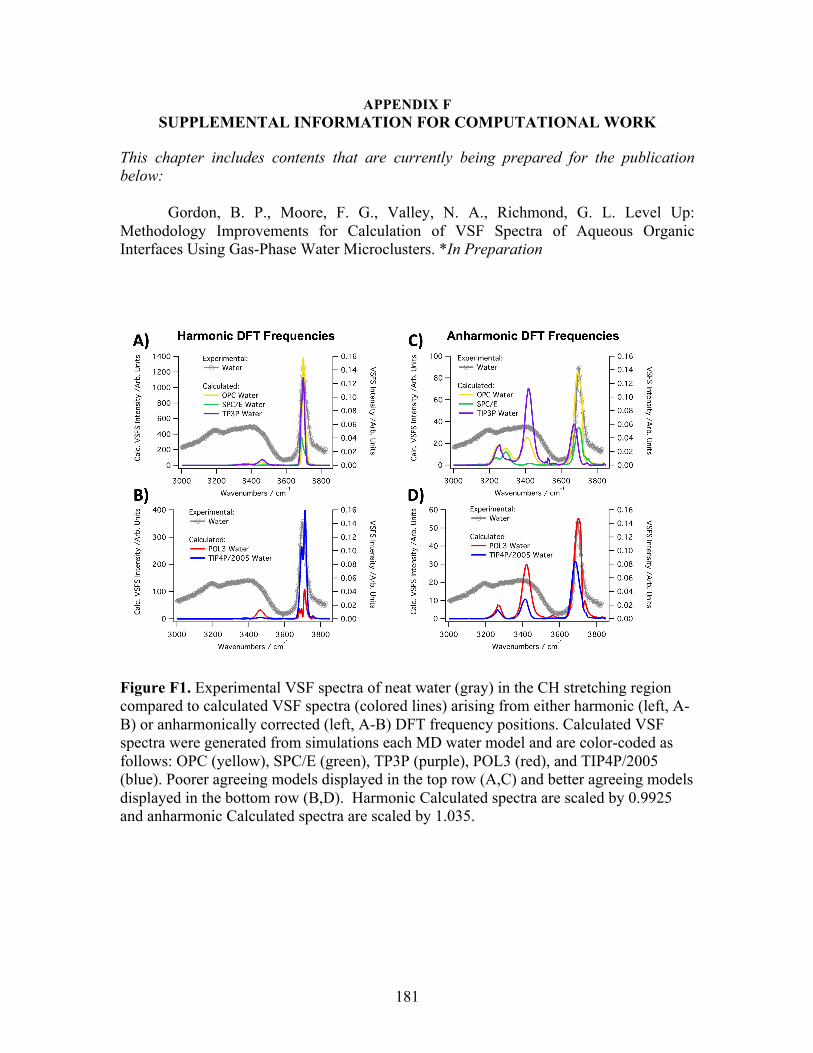
181
APPENDIX F SUPPLEMENTAL INFORMATION FOR COMPUTATIONAL WORK
This chapter includes contents that are currently being prepared for the publication below:
Gordon, B. P., Moore, F. G., Valley, N. A., Richmond, G. L. Level Up: Methodology Improvements for Calculation of VSF Spectra of Aqueous Organic Interfaces Using Gas-Phase Water Microclusters. *In Preparation
Figure F1. Experimental VSF spectra of neat water (gray) in the CH stretching region compared to calculated VSF spectra (colored lines) arising from either harmonic (left, A-B) or anharmonically corrected (left, A-B) DFT frequency positions. Calculated VSF spectra were generated from simulations each MD water model and are color-coded as follows: OPC (yellow), SPC/E (green), TP3P (purple), POL3 (red), and TIP4P/2005 (blue). Poorer agreeing models displayed in the top row (A,C) and better agreeing models displayed in the bottom row (B,D). Harmonic Calculated spectra are scaled by 0.9925 and anharmonic Calculated spectra are scaled by 1.035.

182
Figure F2. Testing a subset of 24 micro-clusters with our current method and basis set against the same clusters calculated with 5 DFT methods benchmarked to be better in the literature for representative clusters of 7 (TOP) and 11 (BOTTOM) water molecules.
183
REFERENCES CITED
CHAPTER I: Introduction
1 Ervens, B.; Volkamer, R., Glyoxal Processing by Aerosol Multiphase Chemistry: Towards a Kinetic Modeling Framework of Secondary Organic Aerosol Formation in Aqueous Particles. Atmos. Chem. Phys. 2010, 10, 8219-8244.
2 Ervens, B.; Turpin, B. J.; Weber, R. J., Secondary Organic Aerosol Formation in Cloud Droplets and Aqueous Particles (AqSOA): A Review of Laboratory, Field and Model Studies. Atmos. Chem. Phys. 2011, 11, 11069-11102.
3 Sareen, N.; Schwier, A. N.; Shapiro, E. L.; Mitroo, D.; McNeill, V. F., Secondary Organic Material Formed by Methylglyoxal in Aqueous Aerosol Mimics. Atmos. Chem. Phys. 2010, 10, 997-1016.
4 Noziere, B.; Dziedzic, P.; Cordova, A., Inorganic Ammonium Salts and Carbonate Salts Are Efficient Catalysts for Aldol Condensation in Atmospheric Aerosols. Phys. Chem. Chem. Phys. 2010, 12, 3864-3872.
5 De Haan, D. O.; Hawkins, L. N.; Kononenko, J. A.; Turley, J. J.; Corrigan, A. L.; Tolbert, M. A.; Jimenez, J. L., Formation of Nitrogen-Containing Oligomers by Methylglyoxal and Amines in Simulated Evaporating Cloud Droplets. Environ. Sci. Technol. 2011, 45, 984-991.
6 Sareen, N.; Schwier, A. N.; Lathem, T. L.; Nenes, A.; McNeill, V. F., Surfactants from the Gas Phase May Promote Cloud Droplet Formation. P. Natl. Acad. Sci. USA 2013, 110, 2723-2728.
7 Gopalakrishnan, S.; Jungwirth, P.; Tobias, D. J.; Allen, H. C., Air-Liquid Interfaces of Aqueous Solution Containing Ammonium and Sulfate: Spectroscopic and Molecular Dynamics Studies. J. Phys. Chem. B. 2005, 109, 8861-8872.
8 Jungwirth, P.; Tobias, D. J., Specific Ion Effects at the Air/Water Interface. Chem. Review. 2006, 106, 1259-1281.
9 Heald, C. L.; Jacob, D. J.; Park, R. J.; Russell, L. M.; Huebert, B. J.; Seinfeld, J. H.; Liao, H.; Weber, R. J., A Large Organic Aerosol Source in the Free Troposphere Missing from Current Models. Geophys. Res. Lett. 2005, 32, No. L188091.
10 Kroll, J. H.; Ng, N. L.; Murphy, S. M.; Varutbangkul, V.; Flagan, R. C.; Seinfeld, J. H., Chamber Studies of Secondary Organic Aerosol Growth by Reactive Uptake of Simple Carbonyl Compound. J. Geophys. Res.-Atmos. 2005, 110, No. D23207.
184
11 Loeffler, K. W.; Koehler, C. A.; Paul, N. M.; De Haan, D. O., Oligomer Formation in Evaporating Aqueous Glyoxal and Methyl Glyoxal Solutions. Environ. Sci. Technol. 2006, 40, 6318-6323.
12 Yu, G.; Bayer, A. R.; Galloway, M. M.; Korshavn, K. J.; Fry, C. G.; Keutsch, F. N., Glyoxal in Aqueous Ammonium Sulfate Solutions: Products, Kinetics, and Hydration Effects. Environ. Sci. Technol. 2011, 45, 6336–6342.
13 Li, Z.; Schwier, A.N.; Sareen, N.; McNeill, V. F., Reactive processing of formaldehyde and acetaldehyde in aqueous aerosol mimics: Surface tension depression and secondary organic products. Atmos. Chem. Phys. 2011, 11, 11617-11629.
14 Cappa, C. D.; Edward, R. L.; Ravishankara, A. R., Evidence for Liquid-Like and Nonideal Behavior of a Mixture of Organic Aerosol Components. P.N.A.S. 2008, 105, 18687-18691.
15 Prisle, N. L.; Raatikainen, T.; Laaksonen, A.; Bilde, M., Surfactants in Cloud Droplet Activation: Mixed Organic-Inorganic Particles. Atmos. Chem. Phys. 2010, 10, 5663-5683.
16 Romakkaniemi, S.; Kokkola, H.; Smith, J. N.; Prisle, N. L.; Schwier, A. N.; McNeill, V. F.; Laaksonen, A., Partitioning of Semivolatile Surface-Active Compounds between Bulk, Surface and Gas Phase. Geophys. Res. Lett. 2011, 38, No. L03807.
17 Kampf, C. J.; Waxman, E. M.; Slowik, J. G.; Dommen, J.; Pfaffenberger, L.; Praplan, A. P.; Prevot, A. S. H.; Baltensperger, U.; Hoffmann, T.; Volkamer, R., Effective Henry's Law Partitioning and the Salting Constant of Glyoxal in Aerosols Containing Sulfate. Environ. Sci. Technol. 2013, 47, 4236-4244.
18 Wren, S. N.; Valley, N. A.; Gordon, B. P.; McWilliams, L. E.; Richmond, G. L. Hydration, Orientation, and Conformation of Methylglyoxal at the Air-Water Interface. J. Phys. Chem. A 2015, 119, 6391-6403.
CHAPTER II
1. Bain, C. D.; Davies, P. B.; Ong, T. H.; Ward, R. N.; Brown, M. A. Quantitative Analysis of Monolayer Composition by Sum-Frequency Vibrational Spectroscopy. Langmuir 1991, 7, 1563-1566.
2. Moore, F. G.; Becraft, K. A.; Richmond, G. L. Challenges in Interpreting Vibrational Sum Frequency Spectra: Deconvoluting Spectral Features as Demonstrated in the Calcium Fluoride-Water-Sodium Dodecylsulfate System. Appl. Spectrosc. 2002, 56, 1575-1578.
185
3. Chieffo, L.; Shattuck, J.; Amsden, J. J.; Erramilli, S.; Ziegler, L. D. Ultrafast Vibrational Relaxation of Liquid H2O Following Librational Combination Band Excitation. Chem. Phys. 2007, 341, 71-80.
4. Knop, S.; Lindner, J.; Vöhringer, P. OH and NH Stretching Vibrational Relaxation of Liquid Ethanolamine. Z. Phys. Chem. 2011, 225, 913-926.
5. Monson, P. R.; Patumtev, S.; Kaufmann, K. J.; Robinson, G. W. Dominance of Methyl-Groups in Picosecond Vibrational-Relaxation in Hydrocarbons. Chem. Phys. Lett. 1974, 28, 312-315.
6. Nienhuys, H. K.; van Santen, R. A.; Bakker, H. J. Orientational Relaxation of Liquid Water Molecules as an Activated Process. J. Chem. Phys. 2000, 112, 8487-8494.
7. Woutersen, S.; Emmerichs, U.; Bakker, H. J. Femtosecond mid-IR pump-probe spectroscopy of liquid water: Evidence for a two-component structure. Science 1997, 278, 658-660.
8. Wren, S. N.; Valley, N. A.; Gordon, B. P.; McWilliams, L. E.; Richmond, G. L. Hydration, Orientation, and Conformation of Methylglyoxal at the Air-Water Interface. J. Phys. Chem. A 2015, 119, 6391-6403.
9. McWilliams, L. E.; Valley, N. A.; Vincent, N. M.; Richmond, G. L. Interfacial Insights into a Carbon Capture System: CO2 Uptake to an Aqueous Monoethanolamine Surface. J. Phys. Chem. A 2017, 121, 7956-7967.
10. McWilliams, L. E.; Valley, N. A.; Wren, S. N.; Richmond, G. L. A Means to an Interface: Investigating Monoethanolamine Behavior at an Aqueous Surface. Phys. Chem. Chem. Phys. 2015, 17, 21458-21469.
11. Gordon, B. P.; Moore, F. G.; Scatena, L. F.; Valley, N. A.; Wren, S. N.; Richmond, G. L., Model Behavior: Characterization of Hydroxyacetone at the Air–Water Interface Using Experimental and Computational Vibrational Sum Frequency Spectroscopy. J. Phys. Chem. A 2018, 122 (15), 3837-3849.
12. Gordon, B. P.; Moore, F. G.; Scatena, L. F.; Richmond, G. L., On the Rise: Experimental and Computational Vibrational Sum Frequency Spectroscopy Studies of Pyruvic Acid and Its Surface-Active Oligomer Species at the Air–Water Interface. J. Phys. Chem. A 2019, 123(49),10609-10619.
13. Blower, P. G.; Ota, S. T.; Valley, N. A.; Wood, S. R.; Richmond, G. L. Sink or Surf: Atmospheric Implications for Succinic Acid at Aqueous Surfaces. J. Phys. Chem. A 2013, 117, 7887-7903.
14. Valley, N. A.; Richmond, G. L. Solvation Station: Microsolvation for Modeling Vibrational Sum-Frequency Spectra of Acids at Aqueous Interfaces. J. Chem. Theory Comput. 2015, 11, 4780-4790.
186
15. Valley, N. A.; Robertson, E. J.; Richmond, G. L. Twist and Turn: Effect of Stereoconfiguration on the Interfacial Assembly of Polyelectrolytes. Langmuir 2014, 30, 14226-14233.
16. Valley, N. V.; Blower, P. G.; Wood, S. R.; Plath, K. L.; McWilliams, L. E.; Richmond, G. L. Doubling Down: Delving into the Details of Diacid Adsorption at Aqueous Surfaces. J. Phys. Chem. A 2014, 118, 4778-4789.
17. Davies, J. T.; Rideal, E. K. Interfacial Phenomena. Academic Press: New York, 1963.
18. Rosen, M. J., In Surfactants and Interfacial Phenomena 3rd ed., John Wiley & Sons, Inc.: New York, 2004.
19 Case, D. A.; Darden, T. A.; Cheatham, T. E., III; Simmerling, C. L.; Wang, J.; Duke, R. E.; Luo, R.; Walker, R. C.; Zhang, W.; Merz, K. M., et al., Amber 12. University of Californa, San Francisco: 2012.
20 Calwell, J. W.; Kollman, P. A., Structure and Properties of Neat Liquids Using Nonadditive Molecular Dynamics: Water, Methanol, and N-Methylacetamide. J. Phys. Chem. 1995, 99, 6208-6219.
21 Case, D. A.; Cheatham, E. J.; Gohlke, H.; Luo, R.; Merz, K. M.; Onufriev, A.; Simmerlinfg, C.; Wang, B.; Woods, R. J., The Amber Biomolecular Simulation Programs. J. Comp. Chem. 2006, 26, 1668-1688.
22 Bayly, C. I.; Cieplak, P.; Cornell, W. D.; Kollman, P. A., A Well-Behaved Electrostatic Potential Based Method Using Charge Restraints for Deriving Atomic Charges: The RESP Model. J. Phys. Chem. 1993, 97, 10269-10280.
23 Martinez, L.; Andrade, R.; Birgin, E. G., Martinez, J. M., Packmol: A Package for Building Initial Configurations for Molecular Dynamics Simulations. J. Comput. Chem. 2009, 30, 2157-2164.
24 Valiev, M.; Bylaska, E. J.; Govind, N.; Kowalski, K.; Straatsma, T. P.; Dam, H. J. J. V.; Wang, D.; Nieplocha, J.; Apra, E.; Windus, T. L., et al., Nwchem: A Comprehensive and Scalable Open-Source Solution for Large Scale Molecular Simulations. Comput. Phys. Commun. 2010, 181, 1477 - 1489.
25 Frisch, M. J.; Trucks, G. W.; Schlegel, H. G.; Scuseria, G. E.; Robb, M. A.; Cheeseman, J. R.; Scalmani, G.; Barone, V.; Mennucci, B.; Petersson, G. A., et al., Gaussian 09. Gaussian Inc.: Wallingford CT, 2009.
26 Sulpizi, M.; Salanne, M.; Sprik, M.; Gaigeot, M. P., Vibrational Sum Frequency Generation Spectroscopy of the Water Liquid−Vapor Interface from Density Functional Theory-Based Molecular Dynamics Simulations. J. Phys. Chem. Lett. 2013, 4, 83-87.
187
27 Ishiyama, T.; Takahashi, H.; Morita, A., Vibrational Spectrum at a Water Surface: A Hybrid Quantum Mechanics/Molecular Mechanics Molecular Dynamics Approach. J. Phys.: Condens. Matter, 2012, 24, 124107.
28 Ishiyama, T.; Imamura, T.; Morita, A., Theoretical Studies of Structures and Vibrational Sum Frequency Generation Spectra at Aqueous Interfaces. Chem. Rev. 2014, 114, 8447-8470.
29 Valley, N. V.; Blower, P. G.; Wood, S. R.; Plath, K. L.; McWilliams, L. E.; Richmond, G. L., Doubling Down: Delving into the Details of Diacid Adsorption at Aqueous Surfaces. J. Phys. Chem. A 2014, 118, 4778-4789.
30 Blower, P. G.; Ota, S. T.; Valley, N. A.; Wood, S. R.; Richmond, G. L., Sink or Surf: Atmospheric Implications for Succinic Acid at Aqueous Surfaces. J. Phys. Chem. A 2013, 117, 7887-7903.
31 Blower, P. G.; Shamay, E. S.; Kringle, L.; Ota, S. T.; Richmond, G. L., Surface Behavior of Malonic Acid Adsorption at the Air/Water Interface. J. Phys. Chem. A 2013, 117, 2529-2542.
CHAPER III: Water
1. Du, Q.; Superfine, R.; Freysz, E.; Shen, Y. R. Vibrational Spectroscopy of Water at the Vapor/Water Interface. Phys. Rev. Lett. 1993, 70, 2313-2316.
2. Ishiyama, T.; Imamura, T.; Morita, A. Theoretical Studies of Structures and Vibrational Sum Frequency Generation Spectra at Aqueous Interfaces. Chem. Rev. 2014, 114, 8447-8470.
3. Medders, G. R.; Paesani, F. Dissecting the Molecular Structure of the Air/Water Interface from Quantum Simulations of the Sum-Frequency Generation Spectrum. J. Am.Chem. Soc. 2016, 138, 3912-3919.
4. Perakis, F.; Marco, L. D.; Shalit, A.; Tang, F.; Kann, Z. R.; Kühne, T. D.; Torre, R.; Bonn, M.; Nagata, Y. Vibrational Spectroscopy and Dynamics of Water. Chem. Rev. 2016, 116, 7590-7607.
5. Raymond, E. A.; Tarbuck, T. L.; Brown, M. G.; Richmond, G. L. Hydrogen-Bonding Interactions at the Vapor/Water Interface Investigated by Vibrational Sum-Frequency Spectroscopy of HOD/H2O/D2O Mixtures and Molecular Dynamics Simulations. J. Phys. Chem. B 2003, 107, 546-556.
6. Raymond, E. A.; Tarbuck, T. L.; Richmond, G. L. Isotopic Dilution Studies of the Vapor/Water Interface as Investigated by Vibrational Sum-Frequency Spectroscopy. J. Phys. Chem. B 2002, 106, 2817-2820.
188
7. Richmond, G. L. Molecular Bonding and Interactions at Aqueous Surfaces as Probed by Vibrational Sum Frequency Spectroscopy. Chem. Rev. 2002, 102, 2693-2724.
8. Tang, F.; Ohto, T.; Hasegawa, T.; Xie, W. J.; Xu, L.; Bonn, M.; Nagata, Y. Definition of Free O–H Groups of Water at the Air–Water Interface. J. Chem. Theory Comput. 2018, 14, 357-364.
9. Shen, Y. R.; Ostroverkhov, V. Sum-Frequency Vibrational Spectroscopy on Water Interfaces: Polar Orientation of Water Molecules at Interfaces. Chem. Rev. 2006, 106, 1140-1154.
10. Pezzotti, S.; Galimberti, D. R.; Gaigeot, M.P. 2D H-Bond Network as the Topmost Skin to the Air–Water Interface. J. Phys. Chem. Lett 2017, 8, 3133-3141.
11. Schaefer, J.; Backus, E. H. G.; Nagata, Y.; Bonn, M. Both Inter- and Intramolecular Coupling of O–H Groups Determine the Vibrational Response of the Water/Air Interface. J. Phys. Chem. Lett. 2016, 7, 4591-4595.
12. Suzuki, Y.; Nojima, Y.; Yamaguchi, S. Vibrational Coupling at the Topmost Surface of Water Revealed by Heterodyne-Detected Sum Frequency Generation Spectroscopy. J. Phys. Chem. Lett. 2017, 8, 1396-1401.
13. Nagata, Y.; Hsieh, C.S.; Hasegawa, T.; Voll, J.; Backus, E. H. G.; Bonn, M. Water Bending Mode at the Water–Vapor Interface Probed by Sum-Frequency Generation Spectroscopy: A Combined Molecular Dynamics Simulation and Experimental Study. J. Phys. Chem. Lett. 2013, 4, 1872-1877.
14. Ni, Y.; Skinner, J. L. IR and SFG vibrational spectroscopy of the water bend in the bulk liquid and at the liquid-vapor interface, respectively. J. Chem. Phys. 2015, 143 (1), 014502.
15. Vinaykin, M.; Benderskii, A. V. Vibrational Sum-Frequency Spectrum of the Water Bend at the Air/Water Interface. J. Phys. Chem. Lett. 2012, 3, 3348-3352.
16. Dutta, C.; Benderskii, A. V. On the Assignment of the Vibrational Spectrum of the Water Bend at the Air/Water Interface. J. Phys. Chem. Lett. 2017, 8, 801-804.
17. Kundu, A.; Tanaka, S.; Ishiyama, T.; Ahmed, M.; Inoue, K.I.; Nihonyanagi, S.; Sawai, H.; Yamaguchi, S.; Morita, A.; Tahara, T. Bend Vibration of Surface Water Investigated by Heterodyne-Detected Sum Frequency Generation and Theoretical Study: Dominant Role of Quadrupole. J. Phys. Chem. Lett. 2016, 7, 2597-2601.
18. Khatib, R.; Hasegawa, T.; Sulpizi, M.; Backus, E. H. G.; Bonn, M.; Nagata, Y. Molecular Dynamics Simulations of SFG Librational Modes Spectra of Water at the Water–Air Interface. J. Phys. Chem. C 2016, 120, 18665-18673.
189
19. Rosen, M. J., In Surfactants and Interfacial Phenomena 3rd ed., John Wiley & Sons, Inc.: New York, 2004.
CHAPTER IV: Neat -MG
1. Pankow, J. F., An Absorption-Model of the Gas Aerosol Partitioning Involved in the Formation of Secondary Organic Aerosol. Atmos. Environ. 1994, 28, 189-193.
2. Odum, J. R.; Hoffmann, T.; Bowman, F.; Collins, D.; Flagan, R. C.; Seinfeld, J. H., Gas/Particle Partitioning and Secondary Organic Aerosol Yields. Environ. Sci. Technol. 1996, 30, 2580-2585.
3. Pankow, J. F., An Absorption-Model of Gas-Particle Partitioning of Organic-Compounds in the Atmosphere. Atmos. Environ. 1994, 28, 185-188.
4. Volkamer, R.; Jimenez, J. L.; San Martini, F.; Dzepina, K.; Zhang, Q.; Salcedo, D.; Molina, L. T.; Worsnop, D. R.; Molina, M. J., Secondary Organic Aerosol Formation from Anthropogenic Air Pollution: Rapid and Higher Than Expected. Geophys. Res. Lett. 2006, 33, No. L17811.
5. Volkamer, R.; Martini, F. S.; Molina, L. T.; Salcedo, D.; Jimenez, J. L.; Molina, M. J., A Missing Sink for Gas-Phase Glyoxal in Mexico City: Formation of Secondary Organic Aerosol. Geophys. Res. Lett. 2007, 34, No. L19807.
6. Heald, C. L.; Jacob, D. J.; Park, R. J.; Russell, L. M.; Huebert, B. J.; Seinfeld, J. H.; Liao, H.; Weber, R. J., A Large Organic Aerosol Source in the Free Troposphere Missing from Current Models. Geophys. Res. Lett. 2005, 32, No. L188091.
7. de Gouw, J. A.; Middlebrook, A. M.; Warneke, C.; Goldan, P. D.; Kuster, W. C.; Roberts, J. M.; Fehsenfeld, F. C.; Worsnop, D. R.; Canagaratna, M. R.; Pszenny, A. A. P., et al., Budget of Organic Carbon in a Polluted Atmosphere: Results from the New England Air Quality Study in 2002. J. Geophys. Res.-Atmos. 2005, 110, No. D16305.
8. Trainic, M.; Riziq, A. A.; Lavi, A.; Rudich, Y., Role of Interfacial Water in the Heterogeneous Uptake of Glyoxal by Mixed Glycine and Ammonium Sulfate Aerosols. J. Phys. Chem. A 2012, 116, 5948-5957.
9. Ervens, B.; Volkamer, R., Glyoxal Processing by Aerosol Multiphase Chemistry: Towards a Kinetic Modeling Framework of Secondary Organic Aerosol Formation in Aqueous Particles. Atmos. Chem. Phys. 2010, 10, 8219-8244.
190
10. Waxman, E. M.; Dzepina, K.; Ervens, B.; Lee-Taylor, J.; Aumont, B.; Jimenez, J. L.; Madronich, S.; Volkamer, R., Secondary Organic Aerosol Formation from Semi- and Intermediate-Volatility Organic Compounds and Glyoxal: Relevance of O/C as a Tracer for Aqueous Multiphase Chemistry. Geophys. Res. Lett. 2013, 40, 978-982.
11. Fu, T. M.; Jacob, D. J.; Wittrock, F.; Burrows, J. P.; Vrekoussis, M.; Henze, D. K., Global Budgets of Atmospheric Glyoxal and Methylglyoxal, and Implications for Formation of Secondary Organic Aerosols. J. Geophys. Res.-Atmos. 2008, 113, No. D15303.
12. Ervens, B.; Turpin, B. J.; Weber, R. J., Secondary Organic Aerosol Formation in Cloud Droplets and Aqueous Particles (AqSOA): A Review of Laboratory, Field and Model Studies. Atmos. Chem. Phys. 2011, 11, 11069-11102.
13. Betterton, E. A.; Hoffmann, M. R., Henry Law Constants of Some Environmentally Important Aldehydes. Environ. Sci. Technol. 1988, 22, 1415-1418.
14. Zhou, X. L.; Mopper, K., Apparent Partition-Coefficients of 15 Carbonyl-Compounds between Air and Seawater and between Air and Fresh-Water - Implications for Air Sea Exchange. Environ. Sci. Technol. 1990, 24, 1864-1869.
15. Lim, Y. B.; Tan, Y.; Turpin, B. J., Chemical Insights, Explicit Chemistry, and Yields of Secondary Organic Aerosol from OH Radical Oxidation of Methylglyoxal and Glyoxal in the Aqueous Phase. Atmos. Chem. Phys. 2013, 13, 8651-8667.
16. Ervens, B.; Sorooshian, A.; Lim, Y. B.; Turpin, B. J., Key Parameters Controlling Oh-Initiated Formation of Secondary Organic Aerosol in the Aqueous Phase (AqSOA). J. Geophys. Res.-Atmos. 2014, 119, 3997-4016.
17. Zhao, R.; Lee, A. K. Y.; Abbatt, J. P. D., Investigation of Aqueous-Phase Photooxidation of Glyoxal and Methylglyoxal by Aerosol Chem. Ionization Mass Spectrometry: Observation of Hydroxyhydroperoxide Formation. J. Phys. Chem. A 2012, 116, 6253-6263.
18. Sareen, N.; Moussa, S. G.; McNeill, V. F., Photochemical Aging of Light-Absorbing Secondary Organic Aerosol Material. J. Phys. Chem. A 2013, 117, 2987-2996.
19. Sareen, N.; Schwier, A. N.; Shapiro, E. L.; Mitroo, D.; McNeill, V. F., Secondary Organic Material Formed by Methylglyoxal in Aqueous Aerosol Mimics. Atmos. Chem. Phys. 2010, 10, 997-1016.
20. Schwier, A. N.; Sareen, N.; Mitroo, D.; Shapiro, E. L.; McNeill, V. F., Glyoxal-Methylglyoxal Cross-Reactions in Secondary Organic Aerosol Formation. Environ. Sci. Technol. 2010, 44, 6174-6182.

191
21. Shapiro, E. L.; Szprengiel, J.; Sareen, N.; Jen, C. N.; Giordano, M. R.; McNeill, V. F., Light-Absorbing Secondary Organic Material Formed by Glyoxal in Aqueous Aerosol Mimics. Atmos. Chem. Phys. 2009, 9, 2289-2300.
22. Sedehi, N.; Takano, H.; Blasic, V. A.; Sullivan, K. A.; De Haan, D. O., Temperature- and Ph-Dependent Aqueous-Phase Kinetics of the Reactions of Glyoxal and Methylglyoxal with Atmospheric Amines and Ammonium Sulfate. Atmos. Environ. 2013, 77, 656-663.
23. Yu, G.; Bayer, A. R.; Galloway, M. M.; Korshavn, K. J.; Fry, C. G.; Keutsch, F. N., Glyoxal in Aqueous Ammonium Sulfate Solutions: Products, Kinetics, and Hydration Effects. Environ. Sci. Technol. 2011, 45, 6336–6342.
24. Galloway, M. M.; Chhabra, P. S.; Chan, A. W. H.; Surratt, J. D.; Flagan, R. C.; Seinfeld, J. H.; Keutsch, F. N., Glyoxal Uptake on Ammonium Sulphate Seed Aerosol: Reaction Products and Reversibility of Uptake under Dark and Irradiated Conditions. Atmos. Chem. Phys. 2009, 9, 3331-3345.
25. Noziere, B.; Cordova, A., A Kinetic and Mechanistic Study of the Amino Acid Catalyzed Aldol Condensation of Acetaldehyde in Aqueous and Salt Solutions. J. Phys. Chem. A 2008, 112, 2827-2837.
26. Noziere, B.; Dziedzic, P.; Cordova, A., Inorganic Ammonium Salts and Carbonate Salts Are Efficient Catalysts for Aldol Condensation in Atmospheric Aerosols. Phys. Chem. Chem. Phys. 2010, 12, 3864-3872.
27. Nozière, B.; Dziedzic, P.; Còrdova, A., Products and Kinetics of the Liquid-Phase Reaction of Glyoxal Catalyzed by Ammonium Ions (NH4
+). J Phys Chem A 2009, 113, 231-237.
28. Noziere, B.; Esteve, W., Light-Absorbing Aldol Condensation Products in Acidic Aerosols: Spectra, Kinetics, and Contribution to the Absorption Index. Atmos. Environ. 2007, 41, 1150-1163.
29. Barsanti, K. C.; Pankow, J. F., Thermodynamics of the Formation of Atmospheric Organic Particulate Matter by Accretion Reactions - 2. Dialdehydes, Methylglyoxal, and Diketones. Atmos. Environ. 2005, 39, 6597-6607.
30. Connelly, B. M.; De Haan, D. O.; Tolbert, M. A., Heterogeneous Glyoxal Oxidation: A Potential Source of Secondary Organic Aerosol. J. Phys. Chem. A 2012, 116, 6180-6187.
31. Corrigan, A. L.; Hanley, S. W.; Haan, D. O., Uptake of Glyoxal by Organic and Inorganic Aerosol. Environ. Sci. Technol. 2008, 42, 4428-4433.
192
32. De Haan, D. O.; Corrigan, A. L.; Smith, K. W.; Stroik, D. R.; Turley, J. J.; Lee, F. E.; Tolbert, M. A.; Jimenez, J. L.; Cordova, K. E.; Ferrell, G. R., Secondary Organic Aerosol-Forming Reactions of Glyoxal with Amino Acids. Environ. Sci. Technol. 2009, 43, 2818-2824.
33. De Haan, D. O.; Corrigan, A. L.; Tolbert, M. A.; Jimenez, J. L.; Wood, S. E.; Turley, J. J., Secondary Organic Aerosol Formation by Self-Reactions of Methylglyoxal and Glyoxal in Evaporating Droplets. Environ. Sci. Technol. 2009, 43, 8184-8190.
34. De Haan, D. O.; Hawkins, L. N.; Kononenko, J. A.; Turley, J. J.; Corrigan, A. L.; Tolbert, M. A.; Jimenez, J. L., Formation of Nitrogen-Containing Oligomers by Methylglyoxal and Amines in Simulated Evaporating Cloud Droplets. Environ. Sci. Technol. 2011, 45, 984-991.
35. De Haan, D. O.; Tolbert, M. A.; Jimenez, J. L., Atmospheric Condensed-Phase Reactions of Glyoxal with Methylamine. Geophys. Res. Lett. 2009, 36, No. L11819.
36. Hastings, W. P.; Koehler, C. A.; Bailey, E. L.; De Haan, D. O., Secondary Organic Aerosol Formation by Glyoxal Hydration and Oligomer Formation: Humidity Effects and Equilibrium Shifts During Analysis. Environ. Sci. Technol. 2005, 39, 8728-8735.
37. Loeffler, K. W.; Koehler, C. A.; Paul, N. M.; De Haan, D. O., Oligomer Formation in Evaporating Aqueous Glyoxal and Methyl Glyoxal Solutions. Environ. Sci. Technol. 2006, 40, 6318-6323.
38. Galloway, M. M.; Powelson, M. H.; Sedehi, N.; Wood, S. E.; Millage, K. D.; Kononenko, J. A.; Rynaski, A. D.; De Haan, D. O., Secondary Organic Aerosol Formation During Evaporation of Droplets Containing Atmospheric Aldehydes, Amines, and Ammonium Sulfate. Environ. Sci. Technol. 2014, 48, 14417-14425.
39. Lee, A. K. Y.; Zhao, R.; Li, R.; Liggio, J.; Li, S. M.; Abbatt, J. P. D., Formation of Light Absorbing Organo-Nitrogen Species from Evaporation of Droplets Containing Glyoxal and Ammonium Sulfate. Environ. Sci. Technol. 2013, 47, 12819-12826.
40. Esteve, W.; Noziere, B., Uptake and Reaction Kinetics of Acetone, 2-Butanone, 2,4-Pentanedione, and Acetaldehyde in Sulfuric Acid Solutions. J. Phys. Chem. A 2005, 109, 10920-10928.
41. Casale, M. T.; Richman, A. R.; Elrod, M. J.; Garland, R. M.; Beaver, M. R.; Tolbert, M. A., Kinetics of Acid-Catalyzed Aldol Condensation Reactions of Aliphatic Aldehydes. Atmos. Environ. 2007, 41, 6212-6224.
42. Liggio, J.; Li, S. M.; Mclaren, R., Reactive Uptake of Glyoxal by Particulate Matter. J. Geophys. Res.-Atmos. 2005, 110, No. D10304.
193
43. Ortiz-Montalvo, D. L.; Hakkinen, S. A. K.; Schwier, A. N.; Lim, Y. B.; McNeill, V. F.; Turpin, B. J., Ammonium Addition (and Aerosol pH) Has a Dramatic Impact on the Volatility and Yield of Glyoxal Secondary Organic Aerosol. Environ. Sci. Technol. 2014, 48, 255-262.
44. Liggio, J.; Li, S. M.; Mclaren, R., Heterogeneous Reactions of Glyoxal on Particulate Matter: Identification of Acetals and Sulfate Esters. Environ. Sci. Technol. 2005, 39, 1532-1541.
45. Noziere, B.; Chabert, P., Abiotic C-C Bond Formation under Environmental Conditions: Kinetics of the Aldol Condensation of Acetaldehyde in Water Catalyzed by Carbonate Ions (CO3
2-). Int. J. Chem. Kinet. 2010, 42, 676-686.
46. Woo, J. L.; Kim, D. D.; Schwier, A. N.; Li, R. Z.; McNeill, V. F., Aqueous Aerosol SOA Formation: Impact on Aerosol Physical Properties. Faraday Discuss. 2013, 165, 357-367.
47. Trainic, M.; Riziq, A. A.; Lavi, A.; Flores, J. M.; Rudich, Y., The Optical, Physical and Chemical Properties of the Products of Glyoxal Uptake on Ammonium Sulfate Seed Aerosols. Atmos. Chem. Phys. 2011, 11, 9697-9707.
48. Kampf, C. J.; Jakob, R.; Hoffmann, T., Identification and Characterization of Aging Products in the Glyoxal/Ammonium Sulfate System - Implications for Light-Absorbing Material in Atmospheric Aerosols. Atmos. Chem. Phys. 2012, 12, 6323-6333.
49. Drozd, G. T.; McNeill, V. F., Organic Matrix Effects on the Formation of Light-Absorbing Compounds from Alpha-Dicarbonyls in Aqueous Salt Solution. Environ. Sci. Process. Impact 2014, 16, 741-747.
50. Kroll, J. H.; Ng, N. L.; Murphy, S. M.; Varutbangkul, V.; Flagan, R. C.; Seinfeld, J. H., Chamber Studies of Secondary Organic Aerosol Growth by Reactive Uptake of Simple Carbonyl Compound. J. Geophys. Res.-Atmos. 2005, 110, No. D23207.
51. Kampf, C. J.; Waxman, E. M.; Slowik, J. G.; Dommen, J.; Pfaffenberger, L.; Praplan, A. P.; Prevot, A. S. H.; Baltensperger, U.; Hoffmann, T.; Volkamer, R., Effective Henry's Law Partitioning and the Salting Constant of Glyoxal in Aerosols Containing Sulfate. Environ. Sci. Technol. 2013, 47, 4236-4244.
52. Romakkaniemi, S.; Kokkola, H.; Smith, J. N.; Prisle, N. L.; Schwier, A. N.; McNeill, V. F.; Laaksonen, A., Partitioning of Semivolatile Surface-Active Compounds between Bulk, Surface and Gas Phase. Geophys. Res. Lett. 2011, 38, No. L03807.
53. Köhler, H., The Nucleus in the Growth of Hygroscopic Droplets. J. Chem. Soc, Faraday Trans. 1936, 32, 1152 - 1161.
194
54. Prisle, N. L.; Raatikainen, T.; Laaksonen, A.; Bilde, M., Surfactants in Cloud Droplet Activation: Mixed Organic-Inorganic Particles. Atmos. Chem. Phys. 2010, 10, 5663-5683.
55. Prisle, N. L.; Asmi, A.; Topping, D.; Partanen, A. I.; Romakkaniemi, S.; Dal Maso, M.; Kulmala, M.; Laaksonen, A.; Lehtinen, K. E. J.; McFiggans, G., et al., Surfactant Effects in Global Simulations of Cloud Droplet Activation. Geophys. Res. Lett. 2012, 39, No. L05802.
56. Sorjamaa, R.; Svenningsson, B.; Raatikainen, T.; Henning, S.; Bilde, M.; Laaksonen, A., The Role of Surfactants in Kohler Theory Reconsidered. Atmos. Chem. Phys. 2004, 4, 2107-2117.
57. Sareen, N.; Schwier, A. N.; Lathem, T. L.; Nenes, A.; McNeill, V. F., Surfactants from the Gas Phase May Promote Cloud Droplet Formation. P. Natl. Acad. Sci. USA 2013, 110, 2723-2728.
58. Donaldson, D. J.; Vaida, V., The Influence of Organic Films at the Air-Aqueous Boundary on Atmospheric Processes. Chem. Rev. 2006, 106, 1445-1461.
59. Krizner, H. E.; De Haan, D. O.; Kua, J., Thermodynamics and Kinetics of Methylglyoxal Dimer Formation: A Computational Study. J. Phys. Chem. A 2009, 113, 6994-7001.
60. Jang, M.; Czoschke, N. M.; Lee, S.; Kamens, R. M., Heterogeneous Atmospheric Aerosol Production by Acid-Catalyzed Particle-Phase Reactions. Science 2002, 298, 814-817.
61. Hazra, M. K.; Francisco, J. S.; Sinha, A., Hydrolysis of Glyoxal in Water-Restricted Environments: Formation of Organic Aerosol Precursors through Formic Acid Catalysis. J. Phys. Chem. A 2014, 118, 4095-4105.
62. Nemet, I.; Vikic-Topic, D.; Varga-Defterdarovic, L., Spectroscopic Studies of Methylglyoxal in Water and Dimethylsulfoxide. Bioorg. Chem. 2004, 32, 560-570.
63. Raymond, E. A.; Tarbuck, T. L.; Brown, M. G.; Richmond, G. L., Hydrogen-Bonding Interactions at the Vapor/Water Interface Investigated by Vibrational Sum-Frequency Spectroscopy of HOD/H2O/D2O Mixtures and Molecular Dynamics Simulations. J. Phys. Chem. B 2003, 107, 546-556.
64. Raymond, E. A.; Tarbuck, T. L.; Richmond, G. L., Isotopic Dilution Studies of the Vapor/Water Interface as Investigated by Vibrational Sum-Frequency Spectroscopy. J. Phys. Chem. B 2002, 106, 2817-2820.
195
65. Walker, D. S.; Hore, D. K.; Richmond, G. L., Understanding the Population, Coordination, and Orientation of Water Species Contributing to the Nonlinear Optical Spectroscopy of the Vapor-Water Interface through Molecular Dynamics Simulations. J. Phys. Chem. B 2006, 110, 20451-20459.
66. Walker, D. S.; Richmond, G. L., Understanding the Effects of Hydrogen Bonding at the Vapor-Water Interface: Vibrational Sum Frequency Spectroscopy of H2O/HOD/D2O Mixtures Studied Using Molecular Dynamics Simulations. J. Phys. Chem. C 2007, 111, 8321-8330.
67. Du, Q.; Superfine, R.; Freysz, E.; Shen, Y. R., Vibrational Spectroscopy of Water at the Vapor/Water Interface. Phys. Rev. Lett. 1993, 70, 2313-2316.
68. Tian, C. S.; Shen, Y. R., Sum-Frequency Vibrational Spectroscopic Studies of Water/Vapor Interfaces. Chem. Phys. Lett. 2009, 470, 1-6.
69. Lambert, A. G.; Davies, P. B.; Neivandt, D. J., Implementing the Theory of Sum Frequency Generation Vibrational Spectroscopy: A Tutorial Review. Appl. Spectrosc. Rev. 2005, 40, 103-145.
70. Bain, C. D.; Davies, P. B.; Ong, T. H.; Ward, R. N.; Brown, M. A., Quantitative-Analysis of Monolayer Composition by Sum-Frequency Vibrational Spectroscopy. Langmuir 1991, 7, 1563-1566.
71. Case, D. A.; Darden, T. A.; Cheatham, T. E., III; Simmerling, C. L.; Wang, J.; Duke, R. E.; Luo, R.; Walker, R. C.; Zhang, W.; Merz, K. M., et al., Amber 12. University of Californa, San Francisco: 2012.
72. Valley, N. V.; Blower, P. G.; Wood, S. R.; Plath, K. L.; McWilliams, L. E.; Richmond, G. L., Doubling Down: Delving into the Details of Diacid Adsorption at Aqueous Surfaces. J. Phys. Chem. A 2014, 118, 4778-4789.
73. Blower, P. G.; Ota, S. T.; Valley, N. A.; Wood, S. R.; Richmond, G. L., Sink or Surf: Atmospheric Implications for Succinic Acid at Aqueous Surfaces. J. Phys. Chem. A 2013, 117, 7887-7903.
74. Blower, P. G.; Shamay, E. S.; Kringle, L.; Ota, S. T.; Richmond, G. L., Surface Behavior of Malonic Acid Adsorption at the Air/Water Interface. J. Phys. Chem. A 2013, 117, 2529-2542.
75. Plath, K. L.; Valley, N. A.; Richmond, G. L., Ion-Induced Reorientation and Distribution of Pentanone in the Air-Water Boundary Layer. J. Phys. Chem. A 2013, 117, 11514-11527.
76. Martinez, L.; Andrade, R.; Birgin, E. G.; Martinez, J. M., Packmol: A Package for Building Initial Configurations for Molecular Dynamics Simulations. J. Comput. Chem. 2009, 30, 2157-2164.
196
77. Valiev, M.; Bylaska, E. J.; Govind, N.; Kowalski, K.; Straatsma, T. P.; Dam, H. J. J. V.; Wang, D.; Nieplocha, J.; Apra, E.; Windus, T. L., et al., Nwchem: A Comprehensive and Scalable Open-Source Solution for Large Scale Molecular Simulations. Comput. Phys. Commun. 2010, 181, 1477 - 1489.
78. Frisch, M. J.; Trucks, G. W.; Schlegel, H. G.; Scuseria, G. E.; Robb, M. A.; Cheeseman, J. R.; Scalmani, G.; Barone, V.; Mennucci, B.; Petersson, G. A., et al., Gaussian 09. Gaussian Inc.: Wallingford CT, 2009.
79. Profeta, L. T. M.; Sams, R. L.; Johnson, T. J., Quantitative Infrared Intensity Studies of Vapor-Phase Glyoxal, Methylglyoxal, and 2,3-Butanedione (Diacetyl) with Vibrational Assignments. J. Phys. Chem. A 2011, 115, 9886-9900.
80. Mucha, M.; Mielke, Z., Complexes of Atmospheric Alpha-Dicarbonyls with Water: Ftir Matrix Isolation and Theoretical Study. J. Phys. Chem. A 2007, 111, 2398-2406.
81. Axson, J. L.; Takahashi, K.; De Haan, D. O.; Vaida, V., Gas-Phase Water-Mediated Equilibrium between Methylglyoxal and Its Geminal Diol. P. Natl. Acad. Sci. USA 2010, 107, 6687-6692.
82. Vinaykin, M.; Benderskii, A. V., Vibrational Sum-Frequency Spectrum of the Water Bend at the Air/Water Interface. J. Phys. Chem. Lett. 2012, 3, 3348-3352.
83. Richmond, G. L., Molecular Bonding and Interactions at Aqueous Surfaces as Probed by Vibrational Sum Frequency Spectroscopy. Chem. Rev. 2002, 102, 2693-2724.
84. Johnson, C. M.; Tyrode, E.; Leygraf, C., Atmospheric Corrosion of Zinc by Organic Constituents I. The Role of the Zinc/Water and Water/Air Interfaces Studied by Infrared Reflection/Absorption Spectroscopy and Vibrational Sum Frequency Spectroscopy. J. Electrochem. Soc. 2006, 153, B113-B120.
85. Gopalakrishnan, S.; Liu, D.; Allen, H. C.; Kuo, M.; Shultz, M. J., Vibrational Spectroscopic Studies of Aqueous Interfaces: Salts, Acids, Bases, and Nanodrops. Chem. Rev. 2006, 106, 1155-1175.
86. Plath, K. L.; Axson, J. L.; Nelson, G. C.; Takahashi, K.; Skodje, R. T.; Vaida, V., Gas-Phase Vibrational Spectra of Glyoxylic Acid and Its Gem Diol Monohydrate. Implications for Atmospheric Chemistry. React. Kinet. Catal. Lett. 2009, 96, 209-224.
87. Maron, M. K.; Takahashi, K.; Shoemaker, R. K.; Vaida, V., Hydration of Pyruvic Acid to Its Geminal-Diol, 2,2-Dihydroxypropanoic Acid, in a Water-Restricted Environment. Chem. Phys. Lett. 2011, 513, 184-190.
197
88. Mikhailov, E.; Vlasenko, S.; Martin, S. T.; Koop, T.; Poschl, U., Amorphous and Crystalline Aerosol Particles Interacting with Water Vapor: Conceptual Framework and Experimental Evidence for Restructuring, Phase Transitions and Kinetic Limitations. Atmos. Chem. Phys. 2009, 9, 9491-9522.
CHAPTER V: HA
1. Kawamura, K.; Okuzawa, K.; Aggarwal, S. G.; Irie, H.; Kanaya, Y.; Wang, Z. Determination of Gaseous and Particulate Carbonyls (Glycolaldehyde, Hydroxyacetone, Glyoxal, Methylglyoxal, Nonanal and Decanal) in the Atmosphere at Mt. Tai. Atmos. Chem. Phys. 2013, 13, 5369-5380.
2. Waxman, E. M.; Dzepina, K.; Ervens, B.; Lee-Taylor, J.; Aumont, B.; Jimenez, J. L.; Madronich, S.; Volkamer, R. Secondary Organic Aerosol Formation from Semi- and Intermediate-Volatility Organic Compounds and Glyoxal: Relevance of O/C as a Tracer for Aqueous Multiphase Chemistry. Geophys. Res. Lett. 2013, 40, 978-982.
3. Ervens, B.; Turpin, B. J.; Weber, R. J. Secondary Organic Aerosol Formation in Cloud Droplets and Aqueous Particles (AqSOA): A Review of Laboratory, Field and Model Studies. Atmos. Chem. Phys. 2011, 11, 11069-11102.
4. Ervens, B.; Volkamer, R. Glyoxal Processing by Aerosol Multiphase Chemistry: Towards a Kinetic Modeling Framework of Secondary Organic Aerosol Formation in Aqueous Particles. Atmos. Chem. Phys. 2010, 10, 8219-8244.
5. Fu, T. M.; Jacob, D. J.; Wittrock, F.; Burrows, J. P.; Vrekoussis, M.; Henze, D. K. Global Budgets of Atmospheric Glyoxal and Methylglyoxal, and Implications for Formation of Secondary Organic Aerosols. J. Geophys. Res. 2008, 113, No. D15303.
6. Ervens, B.; Sorooshian, A.; Lim, Y. B.; Turpin, B. J. Key Parameters Controlling OH-Initiated Formation of Secondary Organic Aerosol in the Aqueous Phase (AqSOA). J. Geophys. Res.-Atmos. 2014, 119, 3997-4016.
7. Galloway, M. M.; Chhabra, P. S.; Chan, A. W. H.; Surratt, J. D.; Flagan, R. C.; Seinfeld, J. H.; Keutsch, F. N. Glyoxal Uptake on Ammonium Sulphate Seed Aerosol: Reaction Products and Reversibility of Uptake under Dark and Irradiated Conditions. Atmos. Chem. Phys. 2009, 9, 3331-3345.
8. Galloway, M. M.; Powelson, M. H.; Sedehi, N.; Wood, S. E.; Millage, K. D.; Kononenko, J. A.; Rynaski, A. D.; De Haan, D. O. Secondary Organic Aerosol Formation During Evaporation of Droplets Containing Atmospheric Aldehydes, Amines, and Ammonium Sulfate. Environ. Sci. Technol. 2014, 48, 14417-14425.
198
9. Jang, M.; Czoschke, N. M.; Lee, S.; Kamens, R. M. Heterogeneous Atmospheric Aerosol Production by Acid-Catalyzed Particle-Phase Reactions. Science 2002, 298, 814-817.
10. Odum, J. R.; Hoffmann, T.; Bowman, F.; Collins, D.; Flagan, R. C.; Seinfeld, J. H. Gas/Particle Partitioning and Secondary Organic Aerosol Yields. Environ. Sci. Technol. 1996, 30, 2580-85.
11. Sareen, N.; Schwier, A. N.; Lathem, T. L.; Nenes, A.; McNeill, V. F. Surfactants from the Gas Phase May Promote Cloud Droplet Formation. Proc. Natl. Acad. Sci. U. S. A. 2013, 110, 2723-2728.
12. Woo, J. L.; Kim, D. D.; Schwier, A. N.; Li, R. Z.; McNeill, V. F. Aqueous Aerosol SOA Formation: Impact on Aerosol Physical Properties. Faraday Discuss. 2013, 165, 357-367.
13. McNeill, V. F. Aqueous Organic Chemistry in the Atmosphere: Sources and Chemical Processing of Organic Aerosols. Environ. Sci. Technol. 2015, 49, 1237-1244.
14. Kroll, J. H.; Ng, N. L.; Murphy, S. M.; Varutbangkul, V.; Flagan, R. C.; Seinfeld, J. H. Chamber Studies of Secondary Organic Aerosol Growth by Reactive Uptake of Simple Carbonyl Compound. J. Geophys. Res. 2005, 110, No. 23207.
15. Heald, C. L.; Jacob, D. J.; Park, R. J.; Russell, L. M.; Huebert, B. J.; Seinfeld, J. H.; Liao, H.; Weber, R. J. A Large Organic Aerosol Source in the Free Troposphere Missing from Current Models. Geophys. Res. Lett. 2005, 32, L18809.
16. Volkamer, R.; San Martini, F.; Molina, L.; Salcedo, D.; L Jimenez, J.; Molina, M.; Martini, S. A Missing Sink for Gas-Phase Glyoxal in Mexico City: Formation of Secondary Organic Aerosol. Geophys. Res. Lett. 2007, 34, L19807.
17. Volkamer, R.; Jimenez, J. L.; San Martini, F.; Dzepina, K.; Zhang, Q.; Salcedo, D.; Molina, L. T.; Worsnop, D. R.; Molina, M. J. Secondary Organic Aerosol Formation from Anthropogenic Air Pollution: Rapid and Higher than Expected. Geophys. Res. Lett. 2006, 33, L17811.
18. Axson, J. L.; Takahashi, K.; De Haan, D. O.; Vaida, V. Gas-Phase Water-Mediated Equilibrium between Methylglyoxal and Its Geminal Diol. Proc. Natl. Acad. Sci. U. S. A. 2010, 107, 6687-6692.
19. Corrigan, A. L.; Hanley, S. W.; Haan, D. O. Uptake of Glyoxal by Organic and Inorganic Aerosol. Environ. Sci. Technol. 2008, 42, 4428-4433.
199
20. De Haan, D. O.; Corrigan, A. L.; Smith, K. W.; Stroik, D. R.; Turley, J. J.; Lee, F. E.; Tolbert, M. A.; Jimenez, J. L.; Cordova, K. E.; Ferrell, G. R. Secondary Organic Aerosol-Forming Reactions of Glyoxal with Amino Acids. Environ. Sci. Technol. 2009, 43, 2818-2824.
21. De Haan, D. O.; Corrigan, A. L.; Tolbert, M. A.; Jimenez, J. L.; Wood, S. E.; Turley, J. J. Secondary Organic Aerosol Formation by Self-Reactions of Methylglyoxal and Glyoxal in Evaporating Droplets. Environ. Sci. Technol. 2009, 43, 8184-8190.
22. De Haan, D. O.; Hawkins, L. N.; Kononenko, J. A.; Turley, J. J.; Corrigan, A. L.; Tolbert, M. A.; Jimenez, J. L. Formation of Nitrogen-Containing Oligomers by Methylglyoxal and Amines in Simulated Evaporating Cloud Droplets. Environ. Sci. Technol. 2011, 45, 984-991.
23. De Haan, D. O.; Tolbert, M. A.; Jimenez, J. L. Atmospheric Condensed-Phase Reactions of Glyoxal with Methylamine. Geophys. Res. Lett. 2009, 36, L11819.
24. Hastings, W. P.; Koehler, C. A.; Bailey, E. L.; De Haan, D. O. Secondary Organic Aerosol Formation by Glyoxal Hydration and Oligomer Formation: Humidity Effects and Equilibrium Shifts During Analysis. Environ. Sci. Technol. 2005, 39, 8728-8735.
25. Hazra, M. K.; Francisco, J. S.; Sinha, A. Hydrolysis of Glyoxal in Water-Restricted Environments: Formation of Organic Aerosol Precursors through Formic Acid Catalysis. J. Phys. Chem. A 2014, 118, 4095-4105.
26. Johnson, C. M.; Tyrode, E.; Leygraf, C. Atmospheric Corrosion of Zinc by Organic Constituents I. The Role of the Zinc/Water and Water/Air Interfaces Studied by Infrared Reflection/Absorption Spectroscopy and Vibrational Sum Frequency Spectroscopy. J. Electrochem. Soc. 2006, 153, B113-B120.
27. Krizner, H. E.; De Haan, D. O.; Kua, J. Thermodynamics and Kinetics of Methylglyoxal Dimer Formation: A Computational Study. J. Phys. Chem. A 2009, 113, 6994-7001.
28. Liggio, J.; Li, S. M.; McLaren, R. Reactive Uptake of Glyoxal by Particulate Matter. J. Geophys. Res. 2005, 110, No. D10304.
29. Liggio, J.; Li, S. M.; McLaren, R. Heterogeneous Reactions of Glyoxal on Particulate Matter: Identification of Acetals and Sulfate Esters. Environ. Sci. Technol. 2005, 39, 1532-1541.
30. Loeffler, K. W.; Koehler, C. A.; Paul, N. M.; De Haan, D. O. Oligomer Formation in Evaporating Aqueous Glyoxal and Methyl Glyoxal Solutions. Environ. Sci. Technol. 2006, 40, 6318-6323.
200
31. Maron, M. K.; Takahashi, K.; Shoemaker, R. K.; Vaida, V. Hydration of Pyruvic Acid to Its Geminal-Diol, 2,2-Dihydroxypropanoic Acid, in a Water-Restricted Environment. Chem. Phys. Lett. 2011, 513, 184-190.
32. Mucha, M.; Mielke, Z. Complexes of Atmospheric Alpha-Dicarbonyls with Water: FTIR Matrix Isolation and Theoretical Study. J. Phys. Chem. A 2007, 111, 2398-2406.
33. Nemet, I.; Vikic-Topic, D.; Varga-Defterdarovic, L. Spectroscopic Studies of Methylglyoxal in Water and Dimethylsulfoxide. Bioorg. Chem. 2004, 32, 560-570.
34. Plath, K. L.; Axson, J. L.; Nelson, G. C.; Takahashi, K.; Skodje, R. T.; Vaida, V. Gas-Phase Vibrational Spectra of Glyoxylic Acid and Its Gem Diol Monohydrate. Implications for Atmospheric Chemistry. React. Kinet. Catal. Lett. 2009, 96, 209-224.
35. Romakkaniemi, S.; Kokkola, H.; Smith, J. N.; Prisle, N. L.; Schwier, A. N.; McNeill, V. F.; Laaksonen, A. Partitioning of Semivolatile Surface-Active Compounds between Bulk, Surface and Gas Phase. Geophys. Res. Lett. 2011, 38, No. L03807.
36. Wren, S. N.; Valley, N. A.; Gordon, B. P.; McWilliams, L. E.; Richmond, G. L. Hydration, Orientation, and Conformation of Methylglyoxal at the Air-Water Interface. J. Phys. Chem. A 2015, 119, 6391-6403.
37. Pocker, Y.; Meany, J. E.; Nist, B. J.; Zadorojny, C. Reversible Hydration of Pyruvic Acid. I. Equilibrium Studies. J. Phys. Chem. 1969, 73, 2879-2882.
38. Betterton, E. A.; Hoffmann, M. R. Henry Law Constants of Some Environmentally Important Aldehydes. Environ. Sci. Technol. 1988, 22, 1415-1418.
39. Sareen, N.; Schwier, A. N.; Shapiro, E. L.; Mitroo, D.; McNeill, V. F. Secondary Organic Material Formed by Methylglyoxal in Aqueous Aerosol Mimics. Atmos. Chem. Phys. 2010, 10, 997-1016.
40. Casale, M. T.; Richman, A. R.; Elrod, M. J.; Garland, R. M.; Beaver, M. R.; Tolbert, M. A. Kinetics of Acid-Catalyzed Aldol Condensation Reactions of Aliphatic Aldehydes. Atmos. Environ. 2007, 41, 6212-6224.
41. Renard, P.; Reed Harris, A. E.; Rapf, R. J.; Ravier, S.; Demelas, C.; Coulomb, B.; Quivet, E.; Vaida, V.; Monod, A. Aqueous Phase Oligomerization of Methyl Vinyl Ketone by Atmospheric Radical Reactions. J. Phys. Chem. C 2014, 118, 29421-29430.
201
42. Schwier, A. N.; Sareen, N.; Mitroo, D.; Shapiro, E. L.; McNeill, V. F. Glyoxal-Methylglyoxal Cross-Reactions in Secondary Organic Aerosol Formation. Environ. Sci. Technol. 2010, 44, 6174-6182.
43. Yu, G.; Bayer, A. R.; Galloway, M. M.; Korshavn, K. J.; Fry, C. G.; Keutsch, F. N. Glyoxal in Aqueous Ammonium Sulfate Solutions: Products, Kinetics, and Hydration Effects. Environ. Sci. Technol. 2011, 45, 6336-6342.
44. Zhao, R.; Lee, A. K. Y.; Abbatt, J. P. D. Investigation of Aqueous-Phase Photooxidation of Glyoxal and Methylglyoxal by Aerosol Chemical Ionization Mass Spectrometry: Observation of Hydroxyhydroperoxide Formation. J. Phys. Chem. A 2012, 116, 6253-6263.
45. Rapf, R. J.; Perkins, R. J.; Carpenter, B. K.; Vaida, V. Mechanistic Description of Photochemical Oligomer Formation from Aqueous Pyruvic Acid. J. Phys. Chem. A 2017, 121, 4272-4282.
46. Donaldson, D. J.; Vaida, V. The Influence of Organic Films at the Air-Aqueous Boundary on Atmospheric Processes. Chem. Rev. 2006, 106, 1445-1461.
47. Donaldson, D. J.; Valsaraj, K. T. Adsorption and Reaction of Trace Gas-Phase Organic Compounds on Atmospheric Water Film Surfaces: A Critical Review. Environ. Sci. Technol. 2010, 44, 865-873.
48. Köhler, H. The Nucleus in the Growth of Hygroscopic Droplets. Trans. Faraday Soc. 1936, 32, 1152-1161.
49. Prisle, N. L.; Asmi, A.; Topping, D.; Partanen, A. I.; Romakkaniemi, S.; Dal Maso, M.; Kulmala, M.; Laaksonen, A.; Lehtinen, K. E. J.; McFiggans, G. Surfactant Effects in Global Simulations of Cloud Droplet Activation. Geophys. Res. Lett. 2012, 39, L05802.
50. Prisle, N. L.; Raatikainen, T.; Laaksonen, A.; Bilde, M. Surfactants in Cloud Droplet Activation: Mixed Organic-Inorganic Particles. Atmos. Chem. Phys. 2010, 10, 5663-5683.
51. Sorjamaa, R.; Svenningsson, B.; Raatikainen, T.; Henning, S.; Bilde, M.; Laaksonen, A. The Role of Surfactants in Kohler Theory Reconsidered. Atmos. Chem. Phys. 2004, 4, 2107-2117.
52. Rapf, R. J.; Dooley, M. R.; Kappes, K.; Perkins, R. J.; Vaida, V. pH Dependence of the Aqueous Photochemistry of α-Keto Acids. J. Phys. Chem. A 2017, 121, 8368-8379.
53. Reed Harris, A. E.; Pajunoja, A.; Cazaunau, M.; Gratien, A.; Pangui, E.; Monod, A.; Griffith, E. C.; Virtanen, A.; Doussin, J.-F.; Vaida, V. Multiphase Photochemistry of Pyruvic Acid under Atmospheric Conditions. J. Phys. Chem. A 2017, 121, 3327-3339.
202
54. Rodriguez, A. A.; de Loera, A.; Powelson, M. H.; Galloway, M. M.; De Haan, D. O. Formaldehyde and Acetaldehyde Increase Aqueous-Phase Production of Imidazoles in Methylglyoxal/Amine Mixtures: Quantifying a Secondary Organic Aerosol Formation Mechanism. Environ. Sci. Technol. Lett. 2017, 4, 234-239.
55. Shrivastava, M.; Cappa, C. D.; Fan, J.; Goldstein, A. H.; Guenther, A. B.; Jimenez, J. L.; Kuang, C.; Laskin, A.; Martin, S. T.; Ng, N. L.; et al. Recent Advances in Understanding Secondary Organic Aerosol: Implications for Global Climate Forcing. Rev. Geophys. 2017, 55, 509-559.
56. Ortiz-Montalvo, D. L.; Hakkinen, S. A. K.; Schwier, A. N.; Lim, Y. B.; McNeill, V. F.; Turpin, B. J. Ammonium Addition (and Aerosol pH) Has a Dramatic Impact on the Volatility and Yield of Glyoxal Secondary Organic Aerosol. Environ. Sci. Technol. 2014, 48, 255-262.
57. Bell, S. Ab Initio Study of the Barriers to Methyl Torsion and Torsional Frequencies of Acetyl Molecules. Spectrochim. Acta, Part A 2005, 61, 1471-1477.
58. Braakman, R.; Drouin, B. J.; Widicus Weaver, S. L.; Blake, G. A. Extended Analysis of Hydroxyacetone in the Torsional Ground State. J. Mol. Spectros. 2010, 264, 43-49.
59. Jetzki, M.; Luckhaus, D.; Signorell, R. Fermi Resonance and Conformation in Glycolaldehyde Particles. Can. J. Chem. 2004, 82, 915-924.
60. Kattija-Ari, M.; Harmony, M. D. The Microwave Spectrum and Conformation of Hydroxyacetone: The Influence of Hydrogen Bonding on the Barrier to Internal Rotation of the Methyl Group. Int. J. Quantum Chem. 1980, 18, 443-453.
61. Lasne, J.; Laffon, C.; Parent, P. Interaction of Acetone, Hydroxyacetone, Acetaldehyde and Benzaldehyde with the Surface of Water Ice and HNO3�3H2O Ice. Phys. Chem. Chem. Phys. 2012, 14, 697-704.
62. Lindenmaier, R.; Tipton, N.; Sams, R. L.; Brauer, C. S.; Blake, T. A.; Williams, S. D.; Johnson, T. J. Assignment of the Fundamental Modes of Hydroxyacetone Using Gas-Phase Infrared, Far-Infrared, Raman, and ab Initio Methods: Band Strengths for Atmospheric Measurements. J. Phys. Chem. A 2016, 120, 5993-6003.
63. Mohaček-Grošev, V. Vibrational Analysis of Hydroxyacetone. Spectrochim. Acta, Part A 2005, 61, 477-484.
64. Petitjean, M.; Darvas, M.; Picaud, S.; Jedlovszky, P.; Le Calve, S. Adsorption of Hydroxyacetone on Pure Ice Surfaces. Chemphyschem 2010, 11, 3921-3927.
203
65. Sharma, A.; Reva, I.; Fausto, R. Matrix-insolation Study and Ab Initio Calculations of the Structure and Spectra of Hydroxyacetone. J. Phys. Chem. A 2008, 112, 5935-5946.
66. Sharma, A.; Reva, I.; Fausto, R. Conformational Switching Induced by Near-infrared Laser Irradiation. J. Am. Chem. Soc. 2009, 131, 8752-8753.
67. Sharma, A.; Reva, I.; Fausto, R.; Hesse, S.; Xue, Z.; Suhm, M. A.; Nayak, S. K.; Sathishkumar, R.; Pal, R.; Guru Row, T. N. Conformation-changing Aggregation in Hydroxyacetone: A Combined Low-temperature FTIR, Jet, and Crystallographic Study. J. Am. Chem. Soc. 2011, 133, 20194-20207.
68. Glushonok, G. K.; Glushonok, T. G.; Maslovskaya, L. A.; Shadyro, O. I. A 1H and 13C NMR and UV Study of the State of Hydroxyacetone in Aqueous Solutions. Russ. J. Gen. Chem. 2003, 73, 1027-1031.
69. Dutta, C.; Benderskii, A. V. On the Assignment of the Vibrational Spectrum of the Water Bend at the Air/Water Interface. J. Phys. Chem. Lett. 2017, 8, 801-804.
70. Eisenthal, K. B. Liquid Interfaces Probed by Second-Harmonic and Sum-Frequency Spectroscopy. Chem. Rev. 1996, 96, 1343-1360.
71. Feng, R. R.; Guo, Y.; Lü, R.; Velarde, L.; Wang, H. F. Consistency in the Sum Frequency Generation Intensity and Phase Vibrational Spectra of the Air/Neat Water Interface. J. Phys. Chem. A 2011, 115, 6015-6027.
72. Lambert, A. G.; Davies, P. B.; Neivandt, D. J. Implementing the Theory of Sum Frequency Generation Vibrational Spectroscopy: A Tutorial Review. Appl. Spectrosc. Rev. 2005, 40, 103-145.
73. Morita, A.; Hynes, J. T. A Theoretical Analysis of the Sum Frequency Generation Spectrum of the Water Surface. Chem. Phys. 2000, 258, 371-390.
74. Perakis, F.; Marco, L. D.; Shalit, A.; Tang, F.; Kann, Z. R.; Kühne, T. D.; Torre, R.; Bonn, M.; Nagata, Y. Vibrational Spectroscopy and Dynamics of Water. Chem. Rev. 2016, 116, 7590-7607.
75. Richmond, G. L. Molecular Bonding and Interactions at Aqueous Surfaces as Probed by Vibrational Sum Frequency Spectroscopy. Chem. Rev. 2002, 102, 2693-2724.
76. Schaefer, J.; Backus, E. H. G.; Nagata, Y.; Bonn, M. Both Inter- and Intramolecular Coupling of O–H Groups Determine the Vibrational Response of the Water/Air Interface. J. Phys. Chem. Lett. 2016, 7, 4591-4595.
77. Shen, Y. R. Basic Theory of Surface Sum-Frequency Generation. J. Phys. Chem. C 2012, 116, 15505-15509.
204
78. Tian, C. S.; Shen, Y. R. Sum-Frequency Vibrational Spectroscopic Studies of Water/Vapor Interfaces. Chem. Phys. Lett. 2009, 470, 1-6.
79. Verreault, D.; Hua, W.; Allen, H. C. From Conventional to Phase-Sensitive Vibrational Sum Frequency Generation Spectroscopy: Probing Water Organization at Aqueous Interfaces. J. Phys. Chem. Lett. 2012, 3, 3012-3028.
80. Lu, R.; Gan, W.; Wu, B.H.; Zhang, Z.; Guo, Y.; Wang, H.F. C−H Stretching Vibrations of Methyl, Methylene and Methine Groups at the Vapor/Alcohol (n = 1−8) Interfaces. J. Phys. Chem. B 2005, 109, 14118-14129.
81. Ishiyama, T.; Imamura, T.; Morita, A. Theoretical Studies of Structures and Vibrational Sum Frequency Generation Spectra at Aqueous Interfaces. Chem. Rev. 2014, 114, 8447-8470.
82. Bain, C. D.; Davies, P. B.; Ong, T. H.; Ward, R. N.; Brown, M. A. Quantitative Analysis of Monolayer Composition by Sum-Frequency Vibrational Spectroscopy. Langmuir 1991, 7, 1563-1566.
83. Moore, F. G.; Becraft, K. A.; Richmond, G. L. Challenges in Interpreting Vibrational Sum Frequency Spectra: Deconvoluting Spectral Features as Demonstrated in the Calcium Fluoride-Water-Sodium Dodecylsulfate System. Appl. Spectrosc. 2002, 56, 1575-1578.
84. Chieffo, L.; Shattuck, J.; Amsden, J. J.; Erramilli, S.; Ziegler, L. D. Ultrafast Vibrational Relaxation of Liquid H2O Following Librational Combination Band Excitation. Chem. Phys. 2007, 341, 71-80.
85. Knop, S.; Lindner, J.; Vöhringer, P. OH and NH Stretching Vibrational Relaxation of Liquid Ethanolamine. Z. Phys. Chem. 2011, 225, 913-926.
86. Monson, P. R.; Patumtev, S.; Kaufmann, K. J.; Robinson, G. W. Dominance of Methyl-Groups in Picosecond Vibrational-Relaxation in Hydrocarbons. Chem. Phys. Lett. 1974, 28, 312-315.
87. Nienhuys, H. K.; van Santen, R. A.; Bakker, H. J. Orientational Relaxation of Liquid Water Molecules as an Activated Process. J. Chem. Phys. 2000, 112, 8487-8494.
88. Woutersen, S.; Emmerichs, U.; Bakker, H. J. Femtosecond mid-IR pump-probe spectroscopy of liquid water: Evidence for a two-component structure. Science 1997, 278, 658-660.
89. McWilliams, L. E.; Valley, N. A.; Vincent, N. M.; Richmond, G. L. Interfacial Insights into a Carbon Capture System: CO2 Uptake to an Aqueous Monoethanolamine Surface. J. Phys. Chem. A 2017, 121, 7956-7967.
205
90. McWilliams, L. E.; Valley, N. A.; Wren, S. N.; Richmond, G. L. A Means to an Interface: Investigating Monoethanolamine Behavior at an Aqueous Surface. Phys. Chem. Chem. Phys. 2015, 17, 21458-21469.
91. Davies, J. T.; Rideal, E. K. Interfacial Phenomena. Academic Press: New York, 1963.
92. Blower, P. G.; Ota, S. T.; Valley, N. A.; Wood, S. R.; Richmond, G. L. Sink or Surf: Atmospheric Implications for Succinic Acid at Aqueous Surfaces. J. Phys. Chem. A 2013, 117, 7887-7903.
93. Plath, K. L.; Valley, N. A.; Richmond, G. L. Ion-Induced Reorientation and Distribution of Pentanone in the Air–Water Boundary Layer. J. Phys. Chem. A 2013, 117, 11514-11527.
94. Valley, N. A.; Richmond, G. L. Solvation Station: Microsolvation for Modeling Vibrational Sum-Frequency Spectra of Acids at Aqueous Interfaces. J. Chem. Theory Comput. 2015, 11, 4780-4790.
95. Valley, N. A.; Richmond, G. L. Computational Vibrational Sum Frequency Spectra of Formaldehyde and Hydroxymethanesulfonate at Aqueous Interfaces. J. Phys. Chem. C 2016, 120, 14122-14129.
96. Valley, N. A.; Robertson, E. J.; Richmond, G. L. Twist and Turn: Effect of Stereoconfiguration on the Interfacial Assembly of Polyelectrolytes. Langmuir 2014, 30, 14226-14233.
97. Valley, N. V.; Blower, P. G.; Wood, S. R.; Plath, K. L.; McWilliams, L. E.; Richmond, G. L. Doubling Down: Delving into the Details of Diacid Adsorption at Aqueous Surfaces. J. Phys. Chem. A 2014, 118, 4778-4789.
98. Case, D. A.; Darden, T. A.; T.E. Cheatham, I.; Simmerling, C. L.; Wang, J.; Duke, R. E.; Luo, R.; Walker, R. C.; Zhang, W.; Merz, K. M. Amber 12; University of California: San Francisco, 2012.
99. Martinez, L.; Andrade, R.; Birgin, E.; Martinez, J. Packmol: A Package for Building Initial Configurations for Molecular Dynamics Simulations. J. Comput. Chem. 2009, 30, 2157-2164.
100. Frisch, M. J.; Trucks, G. W.; Schlegel, H. B.; Scuseria, G. E.; Robb, M. A.; Cheeseman, J. R.; Scalmani, G.; Barone, V.; Mennucci, B.; Petersson, G. A.; et al., Gaussian 09; Gaussian Inc.: Wallingford, CT. 2009.
101. Nagata, Y.; Hsieh, C.S.; Hasegawa, T.; Voll, J.; Backus, E. H. G.; Bonn, M. Water Bending Mode at the Water–Vapor Interface Probed by Sum-Frequency Generation Spectroscopy: A Combined Molecular Dynamics Simulation and Experimental Study. J. Phys. Chem. Lett. 2013, 4, 1872-1877.
206
102. Ni, Y.; Skinner, J. L. IR and SFG Vibrational Spectroscopy of the Water Bend in the Bulk Liquid and at the Liquid-Vapor Interface, Respectively. J. Chem. Phys. 2015, 143 (1), 014502.
103. Vinaykin, M.; Benderskii, A. V. Vibrational Sum-Frequency Spectrum of the Water Bend at the Air/Water Interface. J. Phys. Chem. Lett. 2012, 3, 3348-3352.
104. Rosen, M. J. In Surfactants and Interfacial Phenomena 3rd ed., John Wiley & Sons, Inc.: New York, 2004.
CHAPTER VI: PA
1. Talbot, R. W.; Andreae, M. O.; Berresheim, H.; Jacob, D. J.; Beecher, K. M., Sources and Sinks of Formic, Acetic, and Pyruvic Acids Over Central Amazonia: 2. Wet Season. J. Geophys. Res.-Atmos. 1990, 95 (D10), 16799-16811.
2. Odum, J. R.; Hoffmann, T.; Bowman, F.; Collins, D.; Flagan, R. C.; Seinfeld, J. H., Gas/Particle Partitioning and Secondary Organic Aerosol Yields. Environ. Sci. Technol. 1996, 30 (8), 2580-2585.
3. Betterton, E. A.; Hoffmann, M. R., Henry Law Constants of Some Environmentally Important Aldehydes. Environ. Sci. Technol. 1988, 22 (12), 1415-1418.
4. Ellison, G. B.; Tuck, A. F.; Vaida, V., Atmospheric Processing of Organic Aerosols. J. Geophys. Res.-Atmos. 1999, 104 (D9), 11633-11641.
5. Jang, M.; Czoschke, N. M.; Lee, S.; Kamens, R. M., Heterogeneous Atmospheric Aerosol Production by Acid-Catalyzed Particle-Phase Reactions. Science 2002, 298 (5594), 814-817.
6. Gao, S.; Ng, N. L.; Keywood, M.; Varutbangkul, V.; Bahreini, R.; Nenes, A.; He, J.; Yoo, K. Y.; Beauchamp, J. L.; Hodyss, R. P.; Flagan, R. C.; Seinfeld, J. H., Particle Phase Acidity and Oligomer Formation in Secondary Organic Aerosol. Environ. Sci. Technol. 2004, 38 (24), 6582-6589.
7. Kalberer, M.; Paulsen, D.; Sax, M.; Steinbacher, M.; Dommen, J.; Prevot, A. S. H.; Fisseha, R.; Weingartner, E.; Frankevich, V.; Zenobi, R.; Baltensperger, U., Identification of Polymers as Major Components of Atmospheric Organic Aerosols. Science 2004, 303 (5664), 1659-1662.
8. Tolocka, M. P.; Jang, M.; Ginter, J. M.; Cox, F. J.; Kamens, R. M.; Johnston, M. V., Formation of Oligomers in Secondary Organic Aerosol. Environ. Sci. Technol. 2004, 38 (5), 1428-1434.
207
9. Hastings, W. P.; Koehler, C. A.; Bailey, E. L.; De Haan, D. O., Secondary Organic Aerosol Formation by Glyoxal Hydration and Oligomer Formation: Humidity Effects and Equilibrium Shifts During Analysis. Environ. Sci. Technol. 2005, 39 (22), 8728-8735.
10. Kroll, J. H.; Ng, N. L.; Murphy, S. M.; Varutbangkul, V.; Flagan, R. C.; Seinfeld, J. H., Chamber Studies of Secondary Organic Aerosol Growth by Reactive Uptake of Simple Carbonyl Compound. J. Geophys. Res.-Atmos. 2005, 110 (D23), No. 23207.
11. Heald, C. L.; Jacob, D. J.; Park, R. J.; Russell, L. M.; Huebert, B. J.; Seinfeld, J. H.; Liao, H.; Weber, R. J., A Large Organic Aerosol Source in the Free Troposphere Missing from Current Models. Geophys. Res. Lett. 2005, 32 (18), No. L18809.
12. Altieri, K. E.; Carlton, A. G.; Lim, H. J.; Turpin, B. J.; Seitzinger, S. P., Evidence for Oligomer Formation in Clouds: Reactions of Isoprene Oxidation Products. Environ. Sci. Technol. 2006, 40 (16), 4956-4960.
13. Carlton, A. G.; Turpin, B. J.; Lim, H. J.; Altieri, K. E.; Seitzinger, S., Link Between Isoprene and Secondary Organic Aerosol (SOA): Pyruvic Acid Oxidation Yields Low Volatility Organic Acids in Clouds. Geophys. Res. Lett. 2006, 33 (6), No. L06822.
14. Donaldson, D. J.; Vaida, V., The Influence of Organic Films at the Air-Aqueous Boundary on Atmospheric Processes. Chem. Rev. 2006, 106 (4), 1445-1461.
15. Guzman, M. I.; Colussi, A. J.; Hoffmann, M. R., Photoinduced Oligomerization of Aqueous Pyruvic Acid. J. Phys. Chem. A 2006, 110 (10), 3619-3626.
16. Loeffler, K. W.; Koehler, C. A.; Paul, N. M.; De Haan, D. O., Oligomer Formation in Evaporating Aqueous Glyoxal and Methyl Glyoxal Solutions. Environ. Sci. Technol. 2006, 40 (20), 6318-6323.
17. Volkamer, R.; Jimenez, J. L.; San Martini, F.; Dzepina, K.; Zhang, Q.; Salcedo, D.; Molina, L. T.; Worsnop, D. R.; Molina, M. J., Secondary Organic Aerosol Formation from Anthropogenic Air Pollution: Rapid and Higher Than Expected. Geophys. Res. Lett. 2006, 33 (17), No. L17811.
18. Volkamer, R.; San Martini, F.; Molina, L.; Salcedo, D.; L Jimenez, J.; Molina, M.; Martini, S., A missing sink for gas-phase glyoxal in Mexico City: Formation of secondary organic aerosol. Geophys. Res. Lett. 2007, 34 (19), No. L19807.
19. Mucha, M.; Mielke, Z., Complexes of Atmospheric α-Dicarbonyls with Water: FTIR Matrix Isolation and Theoretical Study. J. Phys. Chem. A 2007, 111 (12), 2398-2406.
208
20. Fu, T. M.; Jacob, D. J.; Wittrock, F.; Burrows, J. P.; Vrekoussis, M.; Henze, D. K., Global Budgets of Atmospheric Glyoxal and Methylglyoxal, and Implications for Formation of Secondary Organic Aerosols. J. Geophys. Res.-Atmos. 2008, 113 (D15), No. D15303.
21. De Haan, D. O.; Corrigan, A. L.; Tolbert, M. A.; Jimenez, J. L.; Wood, S. E.; Turley, J. J., Secondary Organic Aerosol Formation by Self-Reactions of Methylglyoxal and Glyoxal in Evaporating Droplets. Environ. Sci. Technol. 2009, 43 (21), 8184-8190.
22. Donaldson, D. J.; Valsaraj, K. T., Adsorption and Reaction of Trace Gas-Phase Organic Compounds on Atmospheric Water Film Surfaces: A Critical Review. Environ. Sci. Technol. 2010, 44 (3), 865-873.
23. Ervens, B.; Volkamer, R., Glyoxal Processing by Aerosol Multiphase Chemistry: Towards a Kinetic Modeling Framework of Secondary Organic Aerosol Formation in Aqueous Particles. Atmos. Chem. Phys. 2010, 10 (17) 8219-8244.
24. Ervens, B.; Turpin, B. J.; Weber, R. J., Secondary Organic Aerosol Formation in Cloud Droplets and Aqueous Particles (AqSOA): A Review of Laboratory, Field and Model Studies. Atmos. Chem. Phys. 2011, 11 (21), 11069-11102.
25. Kawamura, K.; Okuzawa, K.; Aggarwal, S. G.; Irie, H.; Kanaya, Y.; Wang, Z., Determination of Gaseous and Particulate Carbonyls (Glycolaldehyde, Hydroxyacetone, Glyoxal, Methylglyoxal, Nonanal and Decanal) in the Atmosphere at Mt. Tai. Atmos. Chem. Phys. 2013, 13 (10), 5369-5380.
26. Waxman, E. M.; Dzepina, K.; Ervens, B.; Lee-Taylor, J.; Aumont, B.; Jimenez, J. L.; Madronich, S.; Volkamer, R., Secondary Organic Aerosol Formation from Semi- and Intermediate-Volatility Organic Compounds and Glyoxal: Relevance of O/C as a Tracer for Aqueous Multiphase Chemistry. Geophys. Res. Lett. 2013, 40 (5), 978-982.
27. Woo, J. L.; Kim, D. D.; Schwier, A. N.; Li, R. Z.; McNeill, V. F., Aqueous Aerosol SOA Formation: Impact on Aerosol Physical Properties. Faraday Discuss. 2013, 165, 357-367.
28. Sareen, N.; Schwier, A. N.; Lathem, T. L.; Nenes, A.; McNeill, V. F., Surfactants from the Gas Phase May Promote Cloud Droplet Formation. Proc. Natl. Acad. Sci. U. S. A. 2013, 110,(8), 2723-2728.
29. Ervens, B.; Sorooshian, A.; Lim, Y. B.; Turpin, B. J., Key Parameters Controlling OH-Initiated Formation of Secondary Organic Aerosol in the Aqueous Phase (Aqsoa). J. Geophys. Res.-Atmos. 2014, 119 (7), 3997-4016.
209
30. Galloway, M. M.; Powelson, M. H.; Sedehi, N.; Wood, S. E.; Millage, K. D.; Kononenko, J. A.; Rynaski, A. D.; De Haan, D. O., Secondary Organic Aerosol Formation During Evaporation of Droplets Containing Atmospheric Aldehydes, Amines, and Ammonium Sulfate. Environ. Sci. Technol. 2014, 48 (24), 14417-14425.
31. McNeill, V. F., Aqueous Organic Chemistry in the Atmosphere: Sources and Chemical Processing of Organic Aerosols. Environ. Sci. Technol. 2015, 49 (3), 1237-1244.
32. Kawamura, K.; Bikkina, S., A Review of Dicarboxylic Acids and Related Compounds in Atmospheric Aerosols: Molecular Distributions, Sources and Transformation. Atmos. Res. 2016, 170, 140-160.
33. Kua, J.; Hanley, S. W.; De Haan, D. O., Thermodynamics and Kinetics of Glyoxal Dimer Formation: A Computational Study. J. Phys. Chem. A 2008, 112 (1), 66-72.
34. Wren, S. N.; Valley, N. A.; Gordon, B. P.; McWilliams, L. E.; Richmond, G. L., Hydration, Orientation, and Conformation of Methylglyoxal at the Air-Water Interface. J. Phys. Chem. A 2015, 119 (24), 6391-6403.
35. Axson, J. L.; Takahashi, K.; De Haan, D. O.; Vaida, V., Gas-Phase Water-Mediated Equilibrium between Methylglyoxal and Its Geminal Diol. Proc. Natl. Acad. Sci. U. S. A. 2010, 107 (15), 6687-6692.
36. Nemet, I.; Vikic-Topic, D.; Varga-Defterdarovic, L., Spectroscopic Studies of Methylglyoxal in Water and Dimethylsulfoxide. Bioorg. Chem. 2004, 32, (6) 560-570.
37. Krizner, H. E.; De Haan, D. O.; Kua, J., Thermodynamics and Kinetics of Methylglyoxal Dimer Formation: A Computational Study. J. Phys. Chem. A 2009, 113 (25), 6994-7001.
38. Schwier, A. N.; Sareen, N.; Mitroo, D.; Shapiro, E. L.; McNeill, V. F., Glyoxal-Methylglyoxal Cross-Reactions in Secondary Organic Aerosol Formation. Environ. Sci. Technol. 2010, 44 (16), 6174-6182.
39. Schnitzler, E. G.; Seifert, N. A.; Ghosh, S.; Thomas, J.; Xu, Y. J.; Jager, W., Hydration of the Simplest α-Keto Acid: a Rotational Spectroscopic and Ab Initio Study of the Pyruvic Acid-Water Complex. Phys. Chem. Chem. Phys. 2017, 19 (6), 4440-4446.
40. Rodigast, M.; Mutzel, A.; Herrmann, H., A Quantification Method for Heat-Decomposable Methylglyoxal Oligomers and its Application on 1,3,5-Trimethylbenzene SOA. Atmos. Chem. Phys. 2017, 17 (6), 3929-3943.
210
41. Maron, M. K.; Takahashi, K.; Shoemaker, R. K.; Vaida, V., Hydration of Pyruvic Acid to Its Geminal-Diol, 2,2-Dihydroxypropanoic Acid, in a Water-Restricted Environment. Chem. Phys. Lett. 2011, 513 (4-6), 184-190.
42. Larsen, M. C.; Vaida, V., Near Infrared Photochemistry of Pyruvic Acid in Aqueous Solution. J. Phys. Chem. A 2012, 116 (24), 5840-5846.
43. Griffith, E. C.; Carpenter, B. K.; Shoemaker, R. K.; Vaida, V., Photochemistry of Aqueous Pyruvic Acid. Proc. Natl. Acad. Sci. U. S. A. 2013, 110 (29), 11714-11719.
44. Reed Harris, A. E.; Ervens, B.; Shoemaker, R. K.; Kroll, J. A.; Rapf, R. J.; Griffith, E. C.; Monod, A.; Vaida, V., Photochemical Kinetics of Pyruvic Acid in Aqueous Solution. J. Phys. Chem. A 2014, 118 (37), 8505-8516.
45. Perkins, R. J.; Shoemaker, R. K.; Carpenter, B. K.; Vaida, V., Chemical Equilibria and Kinetics in Aqueous Solutions of Zymonic Acid. J. Phys. Chem. A 2016, 120 (51), 10096-10107.
46. Reed Harris, A. E.; Doussin, J. F.; Carpenter, B. K.; Vaida, V., Gas-Phase Photolysis of Pyruvic Acid: The Effect of Pressure on Reaction Rates and Products. J. Phys. Chem. A 2016, 120 (51), 10123-10133.
47. Reed Harris, A. E.; Pajunoja, A.; Cazaunau, M.; Gratien, A.; Pangui, E.; Monod, A.; Griffith, E. C.; Virtanen, A.; Doussin, J. F.; Vaida, V., Multiphase Photochemistry of Pyruvic Acid under Atmospheric Conditions. J. Phys. Chem. A 2017, 121 (18), 3327-3339.
48. Rapf, R. J.; Perkins, R. J.; Carpenter, B. K.; Vaida, V., Mechanistic Description of Photochemical Oligomer Formation from Aqueous Pyruvic Acid. J. Phys. Chem. A 2017, 121 (22), 4272-4282.
49. Rapf, R. J.; Perkins, R. J.; Yang, H. S.; Miyake, G.; Carpenter, B. K.; Vaida, V., Photochemical Synthesis of Oligomeric Amphiphiles from Alkyl Oxoacids in Aqueous Environments. J. Am. Chem. Soc. 2017, 139 (20), 6946-6959.
50. Rapf, R. J.; Dooley, M. R.; Kappes, K.; Perkins, R. J.; Vaida, V., pH Dependence of the Aqueous Photochemistry of α-Keto Acids. J. Phys. Chem. A 2017, 121 (44), 8368-8379.
51. Reed Harris, A. E.; Cazaunau, M.; Gratien, A.; Pangui, E.; Doussin, J. F.; Vaida, V., Atmospheric Simulation Chamber Studies of the Gas-Phase Photolysis of Pyruvic Acid. J. Phys. Chem. A 2017, 121 (44), 8348-8358.
52. Rapf, R. J.; Perkins, R. J.; Dooley, M. R.; Kroll, J. A.; Carpenter, B. K.; Vaida, V., Environmental Processing of Lipids Driven by Aqueous Photochemistry of α-Keto Acids. Acs Central Science 2018, 4 (5), 624-630.
211
53. Fang, Y.; Lesnicki, D.; Wall, K. J.; Gaigeot, M. P.; Sulpizi, M.; Vaida, V.; Grassian, V. H., Heterogeneous Interactions between Gas-Phase Pyruvic Acid and Hydroxylated Silica Surfaces: A Combined Experimental and Theoretical Study. J. Phys. Chem. A 2019, 123 (5), 983-991.
54. Alves, M. R.; Fang, Y.; Wall, K. J.; Vaida, V.; Grassian, V. H., Chemistry and Photochemistry of Pyruvic Acid Adsorbed on Oxide Surfaces. J. Phys. Chem. A 2019, 123 (35), 7661-7671.
55. Salameh, A.; Vorka, F.; Daskalakis, V., Correlation between Surface Tension and the Bulk Dynamics in Salty Atmospheric Aquatic Droplets. J. Phys. Chem. C 2016, 120 (21), 11508-11518.
56. Tang, M. J.; Larish, W. A.; Fang, Y.; Gankanda, A.; Grassian, V. H., Heterogeneous Reactions of Acetic Acid with Oxide Surfaces: Effects of Mineralogy and Relative Humidity. J. Phys. Chem. A 2016, 120 (28), 5609-5616.
57. Han, Y.; Kawamura, K.; Chen, Q.; Mochida, M., Formation of High-Molecular-Weight Compounds Via the Heterogeneous Reactions of Gaseous C8–C10 n-Aldehydes in the Presence of Atmospheric Aerosol Components. Atmos. Environ. 2016, 126, 290-297.
58. Shrivastava, M.; Cappa, C. D.; Fan, J.; Goldstein, A. H.; Guenther, A. B.; Jimenez, J. L.; Kuang, C.; Laskin, A.; Martin, S. T.; Ng, N. L.; et al., Recent Advances in Understanding Secondary Organic Aerosol: Implications for Global Climate Forcing. Revs. Geophys. 2017, 55 (2), 509-559.
59. Eugene, A. J.; Guzman, M. I., Reactivity of Ketyl and Acetyl Radicals from Direct Solar Actinic Photolysis of Aqueous Pyruvic Acid. J. Phys. Chem. A 2017, 121 (15), 2924-2935.
60. Mekic, M.; Brigante, M.; Vione, D.; Gligorovski, S., Exploring the Ionic Strength Effects on the Photochemical Degradation of Pyruvic Acid in Atmospheric Deliquescent Aerosol Particles. Atmos. Environ. 2018, 185, 237-242.
61. Mekic, M.; Loisel, G.; Zhou, W. T.; Jiang, B.; Vione, D.; Gligorovski, S., Ionic-Strength Effects on the Reactive Uptake of Ozone on Aqueous Pyruvic Acid: Implications for Air-Sea Ozone Deposition. Environ. Sci. Technol. 2018, 52 (21), 12306-12315.
62. Eugene, A. J.; Pillar, E. A.; Colussi, A. J.; Guzman, M. I., Enhanced Acidity of Acetic and Pyruvic Acids on the Surface of Water. Langmuir 2018, 34 (31), 9307-9313.
63. Fu, Y.; Zhang, Y. Y.; Zhang, F.; Chen, J. M.; Zhu, Z. H.; Yu, X. Y., Does Interfacial Photochemistry Play a Role in the Photolysis of Pyruvic Acid in Water? Atmos. Environ. 2018, 191, 36-45.
212
64. Bain, C. D.; Davies, P. B.; Ong, T. H.; Ward, R. N.; Brown, M. A., Quantitative Analysis of Monolayer Composition by Sum-Frequency Vibrational Spectroscopy. Langmuir 1991, 7 (8), 1563-1566.
65. Eisenthal, K. B., Liquid Interfaces Probed by Second-Harmonic and Sum-Frequency Spectroscopy. Chem. Rev. 1996, 96 (4), 1343-1360.
66. Lambert, A. G.; Davies, P. B.; Neivandt, D. J., Implementing the Theory of Sum Frequency Generation Vibrational Spectroscopy: A Tutorial Review. Appl. Spectrosc. Rev. 2005, 40 (2), 103-145.
67. Shen, Y. R., Basic Theory of Surface Sum-Frequency Generation. J. Phys. Chem. C 2012, 116 (29), 15505-15509.
68. Scatena, L. F.; Brown, M. G.; Richmond, G. L., Water at Hydrophobic Surfaces: Weak Hydrogen Bonding and Strong Orientation Effects. Science 2001, 292 (5518), 908-912.
69. Moore, F. G.; Becraft, K. A.; Richmond, G. L., Challenges in interpreting vibrational sum frequency spectra: Deconvoluting spectral features as demonstrated in the calcium fluoride-water-sodium dodecylsulfate system. Appl. Spectrosc. 2002, 56 (12), 1575-1578.
70. Richmond, G. L., Molecular Bonding and Interactions at Aqueous Surfaces as Probed by Vibrational Sum Frequency Spectroscopy. Chem. Rev. 2002, 102 (8), 2693-2724.
71. Blower, P. G.; Ota, S. T.; Valley, N. A.; Wood, S. R.; Richmond, G. L., Sink or Surf: Atmospheric Implications for Succinic Acid at Aqueous Surfaces. J. Phys. Chem. A 2013, 117 (33), 7887-7903.
72. Valley, N. A.; Robertson, E. J.; Richmond, G. L., Twist and Turn: Effect of Stereoconfiguration on the Interfacial Assembly of Polyelectrolytes. Langmuir 2014, 30 (47), 14226-14233.
73. Valley, N. V.; Blower, P. G.; Wood, S. R.; Plath, K. L.; McWilliams, L. E.; Richmond, G. L., Doubling Down: Delving into the Details of Diacid Adsorption at Aqueous Surfaces. J. Phys. Chem. A 2014, 118 (26), 4778-4789.
74. McWilliams, L. E.; Valley, N. A.; Wren, S. N.; Richmond, G. L., A Means to an Interface: Investigating Monoethanolamine Behavior at an Aqueous Surface. Phys. Chem. Chem. Phys. 2015, 17, 21458-21469.
75. Valley, N. A.; Richmond, G. L., Solvation Station: Microsolvation for Modeling Vibrational Sum-Frequency Spectra of Acids at Aqueous Interfaces. J. Chem. Theory Comput. 2015, 11 (10), 4780-4790.
213
76. Valley, N. A.; Richmond, G. L., Computational Vibrational Sum Frequency Spectra of Formaldehyde and Hydroxymethanesulfonate at Aqueous Interfaces. J. Phys. Chem. C 2016, 120 (26), 14122-14129.
77. McWilliams, L. E.; Valley, N. A.; Vincent, N. M.; Richmond, G. L., Interfacial Insights into a Carbon Capture System: CO2 Uptake to an Aqueous Monoethanolamine Surface. J. Phys. Chem. A 2017, 121 (41), 7956-7967.
78. Gordon, B. P.; Moore, F. G.; Scatena, L. F.; Valley, N. A.; Wren, S. N.; Richmond, G. L., Model Behavior: Characterization of Hydroxyacetone at the Air–Water Interface Using Experimental and Computational Vibrational Sum Frequency Spectroscopy. J. Phys. Chem. A 2018, 122 (15), 3837-3849.
79. Schabes, B. K.; Altman, R. M.; Richmond, G. L., Come Together: Molecular Details into the Synergistic Effects of Polymer–Surfactant Adsorption at the Oil/Water Interface. J. Phys. Chem. B 2018, 122 (36), 8582-8590.
80. Wen, Y.; Zha, S.; Xing, L.; Yang, S.; Guo, P.; Shi, G.; Fang, H.; Shen, Y. R.; Tian, C., Unveiling Microscopic Structures of Charged Water Interfaces by Surface-Specific Vibrational Spectroscopy. Phys. Rev. Lett. 2016, 116 (1-8), 016101.
81. Du, Q.; Superfine, R.; Freysz, E.; Shen, Y. R., Vibrational Spectroscopy of Water at the Vapor/Water Interface. Phys. Rev. Lett. 1993, 70 (15), 2313-1316.
82. Morita, A.; Hynes, J. T., A theoretical analysis of the sum frequency generation spectrum of the water surface. Chem. Phys. 2000, 258 (2-3), 371-390.
83. Raymond, E. A.; Tarbuck, T. L.; Brown, M. G.; Richmond, G. L., Hydrogen-Bonding Interactions at the Vapor/Water Interface Investigated by Vibrational Sum-Frequency Spectroscopy of HOD/H2O/D2O Mixtures and Molecular Dynamics Simulations. J. Phys. Chem. B 2003, 107 (2), 546-556.
84. Lu, R.; Gan, W.; Wu, B.-h.; Chen, H.; Wang, H.-f., Vibrational Polarization Spectroscopy of CH Stretching Modes of the Methylene Group at the Vapor/Liquid Interfaces with Sum Frequency Generation. J. Phys. Chem. B 2004, 108 (22), 7297-7306.
85. Shen, Y. R.; Ostroverkhov, V., Sum-Frequency Vibrational Spectroscopy on Water Interfaces: Polar Orientation of Water Molecules at Interfaces. Chem. Rev. 2006, 106 (4), 1140-1154.
86. Tian, C. S.; Shen, Y. R., Sum-Frequency Vibrational Spectroscopic Studies of Water/Vapor Interfaces. Chem. Phys. Lett. 2009, 470 (1-3), 1-6.
87. Feng, R. r.; Guo, Y.; Lü, R.; Velarde, L.; Wang, H. f., Consistency in the Sum Frequency Generation Intensity and Phase Vibrational Spectra of the Air/Neat Water Interface. J. Phys. Chem. A 2011, 115 (23), 6015-6027.

214
88. Verreault, D.; Hua, W.; Allen, H. C., From Conventional to Phase-Sensitive Vibrational Sum Frequency Generation Spectroscopy: Probing Water Organization at Aqueous Interfaces. J. Phys. Chem. Lett. 2012, 3 (20), 3012-3028.
89. Vinaykin, M.; Benderskii, A. V., Vibrational Sum-Frequency Spectrum of the Water Bend at the Air/Water Interface. J. Phys. Chem. Lett. 2012, 3 (22), 3348-3352.
90. Nagata, Y.; Hsieh, C.-S.; Hasegawa, T.; Voll, J.; Backus, E. H. G.; Bonn, M., Water Bending Mode at the Water–Vapor Interface Probed by Sum-Frequency Generation Spectroscopy: A Combined Molecular Dynamics Simulation and Experimental Study. J. Phys. Chem. Lett. 2013, 4 (11), 1872-1877.
91. Ni, Y.; Skinner, J. L., IR and SFG Vibrational Spectroscopy of the Water Bend in the Bulk Liquid and at the Liquid-Vapor Interface, Respectively. J. Chem. Phys. 2015, 143 (1), 014502.
92. Medders, G. R.; Paesani, F., Dissecting the Molecular Structure of the Air/Water Interface from Quantum Simulations of the Sum-Frequency Generation Spectrum. J. Am. Chem. Soc. 2016, 138 (11), 3912-3919.
93. Kundu, A.; Tanaka, S.; Ishiyama, T.; Ahmed, M.; Inoue, K.-i.; Nihonyanagi, S.; Sawai, H.; Yamaguchi, S.; Morita, A.; Tahara, T., Bend Vibration of Surface Water Investigated by Heterodyne-Detected Sum Frequency Generation and Theoretical Study: Dominant Role of Quadrupole. J. Phys. Chem. Lett. 2016, 7 (13), 2597-2601.
94. Perakis, F.; Marco, L. D.; Shalit, A.; Tang, F.; Kann, Z. R.; Kühne, T. D.; Torre, R.; Bonn, M.; Nagata, Y., Vibrational Spectroscopy and Dynamics of Water. Chem. Rev. 2016, 116 (13), 7590-7607.
95. Khatib, R.; Hasegawa, T.; Sulpizi, M.; Backus, E. H. G.; Bonn, M.; Nagata, Y., Molecular Dynamics Simulations of SFG Librational Modes Spectra of Water at the Water–Air Interface. J. Phys. Chem. C 2016, 120 (33), 18665-18673.
96. Dutta, C.; Benderskii, A. V., On the Assignment of the Vibrational Spectrum of the Water Bend at the Air/Water Interface. J. Phys. Chem. Lett. 2017, 8 (4), 801-804.
97. Pezzotti, S.; Galimberti, D. R.; Gaigeot, M.-P., 2D H-Bond Network as the Topmost Skin to the Air–Water Interface. J. Phys. Chem. Lett. 2017, 8 (13), 3133-3141.
98. Suzuki, Y.; Nojima, Y.; Yamaguchi, S., Vibrational Coupling at the Topmost Surface of Water Revealed by Heterodyne-Detected Sum Frequency Generation Spectroscopy. J. Phys. Chem. Lett. 2017, 8 (7), 1396-1401.
215
99. Tang, F.; Ohto, T.; Hasegawa, T.; Xie, W. J.; Xu, L.; Bonn, M.; Nagata, Y., Definition of Free O–H Groups of Water at the Air–Water Interface. J. Chem. Theory Comput. 2018, 14 (1), 357-364.
100. Woutersen, S.; Emmerichs, U.; Bakker, H. J., Femtosecond mid-IR pump-probe spectroscopy of liquid water: Evidence for a two-component structure. Science 1997, 278 (5338), 658-660.
101. Monson, P. R.; Patumtev, S.; Kaufmann, K. J.; Robinson, G. W., Dominance of Methyl-Groups in Picosecond Vibrational-Relaxation in Hydrocarbons. Chem. Phys. Lett. 1974, 28 (3), 312-315.
102. Chieffo, L.; Shattuck, J.; Amsden, J. J.; Erramilli, S.; Ziegler, L. D., Ultrafast Vibrational Relaxation of Liquid H2O Following Librational Combination Band Excitation. Chem. Phys. 2007, 341 (3), 71-80.
103. Knop, S.; Lindner, J.; Vöhringer, P., OH and NH Stretching Vibrational Relaxation of Liquid Ethanolamine. Z. Phys. Chem. 2011, 225, (9-10) 913-926.
104. Case, D. A.; Darden, T. A.; T.E. Cheatham, I.; Simmerling, C. L.; Wang, J.; Duke, R. E.; Luo, R.; Walker, R. C.; Zhang, W.; Merz, K. M., AMBER 12; University of California: San Francisco. 2012.
105. Martinez, L.; Andrade, R.; Birgin, E.; Martinez, J., PACKMOL: A Package for Building Initial Configurations for Molecular Dynamics Simulations. J. Comput. Chem. 2009, 30 (13), 2157-2164.
106. Frisch, M. J.; Trucks, G. W.; Schlegel, H. B.; Scuseria, G. E.; Robb, M. A.; Cheeseman, J. R.; Scalmani, G.; Barone, V.; Mennucci, B.; Petersson, G. A.; et al., Gaussian 09. 2009.
107. Plath, K. L.; Takahashi, K.; Skodje, R. T.; Vaida, V., Fundamental and Overtone Vibrational Spectra of Gas-Phase Pyruvic Acid. J. Phys. Chem. A 2009, 113 (26), 7294-7303.
108. Hollenstein, H.; Akermann, F.; Gunthard, H. H., Vibrational analysis of pyruvic acid and D−, 13C− and 18O-labelled species: Matrix spectra, assignments, valence force field and normal coordinate analysis. Spectrochim. Acta A 1978, 34 (11), 1041-1063.
109. Reva, I. D.; Stepanian, S. G.; Adamowicz, L.; Fausto, R., Combined FTIR matrix isolation and ab initio studies of pyruvic acid: Proof for existence of the second conformer. J. Phys. Chem. A 2001, 105 (19), 4773-4780.
110. Reva, I.; Nunes, C. M.; Biczysko, M.; Fausto, R., Conformational Switching in Pyruvic Acid Isolated in Ar and N2 Matrixes: Spectroscopic Analysis, Anharmonic Simulation, and Tunneling. J. Phys. Chem. A 2015, 119 (11), 2614-2627.
216
111. Tsilomelekis, G.; Josephson, T. R.; Nikolakis, V.; Caratzoulas, S., Origin of 5-Hydroxymethylfurfural Stability in Water/Dimethyl Sulfoxide Mixtures. ChemSusChem 2014, 7 (1), 117-126.
112. Khemalapure, S. S.; Katti, V. S.; Hiremath, C. S.; Hiremath, S. M.; Basanagouda, M.; Radder, S. B., Spectroscopic (FT-IR, FT-Raman, NMR and UV-Vis), ELF, LOL, NBO, and Fukui Function Investigations on (5-bromo-benzofuran-3-yl)-Acetic Acid Hydrazide (5BBAH): Experimental and Theoretical Approach. J. Mol. Struct. 2019, 1196, 280-290.
113. Vimalraj, V.; Vijayalakshmi, S.; Umayaparvathi, S.; Krishnan, A. R., Vibrational, NMR spectral studies of 2-furoic hydrazide by DFT and ab initio HF methods. Spectrochim. Acta A 2011, 78 (2), 670-675.
114. Luňák, S.; Frumarová, B.; Vyňuchal, J.; Hrdina, R., Geometry and Raman Spectra of P.R. 255 and its Furo-Furanone Analogue. Chem. Phys. 2009, 359 (1), 45-52.
115. Glushonok, G. K.; Glushonok, T. G.; Maslovskaya, L. A.; Shadyro, O. I., A 1H and 13C NMR and UV Study of the State of Hydroxyacetone in Aqueous Solutions. Russ. J. Gen. Chem. 2003, 73 (7), 1027-1031.
116. Murto, J.; Raaska, T.; Kunttu, H.; Rasanen, M., Conformers and Vibrational Spectra of Pyruvic Acid: An Ab Initio Study. J. Mol. Struct.-Theochem. 1989, 59, 93-101.
117. Raczynska, E. D.; Duczmal, K.; Darowska, M., Experimental (FT-IR) and Theoretical (DFT-IR) Studies of Keto-Enol Tautomerism in Pyruvic Acid. Vib. Spectrosc. 2005, 39 (1), 37-45.
118. Kakkar, R.; Pathak, M.; Radhika, N. P., A DFT Study of the Structures of Pyruvic Acid Isomers and Their Decarboxylation. Org. Biomol. Chem. 2006, 4 (5), 886-895.
119. Barone, V.; Biczysko, M.; Bloino, J.; Cimino, P.; Penocchio, E.; Puzzarini, C., CC/DFT Route toward Accurate Structures and Spectroscopic Features for Observed and Elusive Conformers of Flexible Molecules: Pyruvic Acid as a Case Study. J. Chem. Theory Comput. 2015, 11 (9), 4342-4363.
CHAPTER VIII: MG-NaCl
1. Ervens, B.; Volkamer, R., Glyoxal Processing by Aerosol Multiphase Chemistry: Towards a Kinetic Modeling Framework of Secondary Organic Aerosol Formation in Aqueous Particles. Atmos. Chem. Phys. 2010, 10 (17), 8219-8244.
217
2. Ervens, B.; Turpin, B. J.; Weber, R. J., Secondary Organic Aerosol Formation in Cloud Droplets and Aqueous Particles (AqSOA): A Review of Laboratory, Field and Model Studies. Atmos. Chem. Phys. 2011, 11 (21), 11069-11102.
3. Sareen, N.; Schwier, A. N.; Shapiro, E. L.; Mitroo, D.; McNeill, V. F., Secondary Organic Material Formed by Methylglyoxal in Aqueous Aerosol Mimics. Atmos. Chem. Phys. 2010, 10, 997.
4. Noziere, B.; Dziedzic, P.; Cordova, A., Inorganic Ammonium Salts and Carbonate Salts Are Efficient Catalysts for Aldol Condensation in Atmospheric Aerosols. Phys. Chem. Chem. Phys. 2010, 12, 3864.
5. De Haan, D. O.; Hawkins, L. N.; Kononenko, J. A.; Turley, J. J.; Corrigan, A. L.; Tolbert, M. A.; Jimenez, J. L., Formation of Nitrogen-Containing Oligomers by Methylglyoxal and Amines in Simulated Evaporating Cloud Droplets. Environ. Sci. Technol. 2011, 45 (3), 984-991.
6. Sareen, N.; Schwier, A. N.; Lathem, T. L.; Nenes, A.; McNeill, V. F., Surfactants from the Gas Phase May Promote Cloud Droplet Formation. Proc. Natl. Acad. Sci. U. S. A. 2013, 110 (8), 2723-2728.
7. Gopalakrishnan, S.; Jungwirth, P.; Tobias, D. J.; Allen, H. C., Air−Liquid Interfaces of Aqueous Solutions Containing Ammonium and Sulfate: Spectroscopic and Molecular Dynamics Studies. The Journal of Physical Chemistry B 2005, 109 (18), 8861-8872.
8. Jungwirth, P.; Tobias, D. J., Specific Ion Effects at the Air/Water Interface. Chemical Reviews 2006, 106 (4), 1259-1281.
9. Nemet, I.; Vikic-Topic, D.; Varga-Defterdarovic, L., Spectroscopic Studies of Methylglyoxal in Water and Dimethylsulfoxide. Bioorg. Chem. 2004, 32 (6), 560-570.
10. Wren, S. N.; Valley, N. A.; Gordon, B. P.; McWilliams, L. E.; Richmond, G. L., Hydration, Orientation, and Conformation of Methylglyoxal at the Air-Water Interface. J. Phys. Chem. A 2015, 119 (24), 6391-6403.
11. Loeffler, K. W.; Koehler, C. A.; Paul, N. M.; De Haan, D. O., Oligomer Formation in Evaporating Aqueous Glyoxal and Methyl Glyoxal Solutions. Environ. Sci. Technol. 2006, 40 (20), 6318-6323.
12. De Haan, D. O.; Corrigan, A. L.; Tolbert, M. A.; Jimenez, J. L.; Wood, S. E.; Turley, J. J., Secondary Organic Aerosol Formation by Self-Reactions of Methylglyoxal and Glyoxal in Evaporating Droplets. Environ. Sci. Technol. 2009, 43 (21), 8184-8190.
218
13. Tan, Y.; Carlton, A. G.; Seitzinger, S. P.; Turpin, B. J., SOA From Methylglyoxal in Clouds and Wet Aerosols: Measurement and Prediction of Key Products. Atmos. Environ. 2010, 44 (39), 5218-5226.
14. Yasmeen, F.; Sauret, N.; Gal, J. F.; Maria, P. C.; Massi, L.; Maenhaut, W.; Claeys, M., Characterization of Oligomers from Methylglyoxal Under Dark Conditions: A Pathway to Produce Secondary Organic Aerosol Through Cloud Processing During Nighttime. Atmos. Chem. Phys. 2010, 10 (8), 3803-3812.
15. Krizner, H. E.; De Haan, D. O.; Kua, J., Thermodynamics and Kinetics of Methylglyoxal Dimer Formation: A Computational Study. J. Phys. Chem. A 2009, 113 (25), 6994-7001.
16. Gordon, B. P.; Moore, F. G.; Scatena, L. F.; Richmond, G. L., On the Rise: Experimental and Computational Vibrational Sum Frequency Spectroscopy Studies of Pyruvic Acid and Its Surface-Active Oligomer Species at the Air–Water Interface. J. Phys. Chem. A 2019, 123(49),10609-10619.
17. Schwier, A. N.; Sareen, N.; Mitroo, D.; Shapiro, E. L.; McNeill, V. F., Glyoxal-Methylglyoxal Cross-Reactions in Secondary Organic Aerosol Formation. Environ. Sci. Technol. 2010, 44 (16), 6174-6182.
18. Waxman, E. M.; Elm, J.; Kurtén, T.; Mikkelsen, K. V.; Ziemann, P. J.; Volkamer, R., Glyoxal and Methylglyoxal Setschenow Salting Constants in Sulfate, Nitrate, and Chloride Solutions: Measurements and Gibbs Energies. Environmental Science & Technology 2015, 49 (19), 11500-11508.
19. Rapf, R. J.; Dooley, M. R.; Kappes, K.; Perkins, R. J.; Vaida, V., pH Dependence of the Aqueous Photochemistry of α-Keto Acids. J. Phys. Chem. A 2017, 121 (44), 8368-8379.
20. McNeill, V. F., Aqueous Organic Chemistry in the Atmosphere: Sources and Chemical Processing of Organic Aerosols. Environ. Sci. Technol. 2015, 49 (3), 1237-1244.
21. Waxman, E. M.; Dzepina, K.; Ervens, B.; Lee-Taylor, J.; Aumont, B.; Jimenez, J. L.; Madronich, S.; Volkamer, R., Secondary Organic Aerosol Formation from Semi- and Intermediate-Volatility Organic Compounds and Glyoxal: Relevance of O/C as a Tracer for Aqueous Multiphase Chemistry. Geophys. Res. Lett. 2013, 40 (5), 978-982.
22. Kampf, C. J.; Jakob, R.; Hoffmann, T., Identification and Characterization of Aging Products in the Glyoxal/Ammonium Sulfate System - Implications for Light-Absorbing Material in Atmospheric Aerosols. Atmos. Chem. Phys. 2012, 12, 6323.
219
23. Li, S. Y.; Du, L.; Wei, Z. M.; Wang, W. X., Aqueous-Phase Aerosols on the Air-Water Interface: Response of Fatty Acid Langmuir Monolayers to Atmospheric Inorganic Ions. Sci. Total. Environ. 2017, 580, 1155-1161.
24. Bain, C. D.; Davies, P. B.; Ong, T. H.; Ward, R. N.; Brown, M. A., Quantitative Analysis of Monolayer Composition by Sum-Frequency Vibrational Spectroscopy. Langmuir 1991, 7 (8), 1563-1566.
25. Eisenthal, K. B., Liquid Interfaces Probed by Second-Harmonic and Sum-Frequency Spectroscopy. Chem. Rev. 1996, 96 (4), 1343-1360.
26. Lambert, A. G.; Davies, P. B.; Neivandt, D. J., Implementing the Theory of Sum Frequency Generation Vibrational Spectroscopy: A Tutorial Review. Appl. Spectrosc. Rev. 2005, 40 (2), 103-145.
27. Shen, Y. R., Basic Theory of Surface Sum-Frequency Generation. J. Phys. Chem. C 2012, 116 (29), 15505-15509.
28. Scatena, L. F.; Brown, M. G.; Richmond, G. L., Water at Hydrophobic Surfaces: Weak Hydrogen Bonding and Strong Orientation Effects. Science 2001, 292 (5518), 908-912.
29. Moore, F. G.; Becraft, K. A.; Richmond, G. L., Challenges in interpreting vibrational sum frequency spectra: Deconvoluting spectral features as demonstrated in the calcium fluoride-water-sodium dodecylsulfate system. Appl. Spectrosc. 2002, 56 (12), 1575-1578.
30. Richmond, G. L., Molecular Bonding and Interactions at Aqueous Surfaces as Probed by Vibrational Sum Frequency Spectroscopy. Chem. Rev. 2002, 102 (8), 2693-2724.
31. Blower, P. G.; Ota, S. T.; Valley, N. A.; Wood, S. R.; Richmond, G. L., Sink or Surf: Atmospheric Implications for Succinic Acid at Aqueous Surfaces. J. Phys. Chem. A 2013, 117 (33), 7887-7903.
32. Valley, N. A.; Robertson, E. J.; Richmond, G. L., Twist and Turn: Effect of Stereoconfiguration on the Interfacial Assembly of Polyelectrolytes. Langmuir 2014, 30 (47), 14226-14233.
33. Valley, N. V.; Blower, P. G.; Wood, S. R.; Plath, K. L.; McWilliams, L. E.; Richmond, G. L., Doubling Down: Delving into the Details of Diacid Adsorption at Aqueous Surfaces. J. Phys. Chem. A 2014, 118 (26), 4778-4789.
34. McWilliams, L. E.; Valley, N. A.; Wren, S. N.; Richmond, G. L., A Means to an Interface: Investigating Monoethanolamine Behavior at an Aqueous Surface. Phys. Chem. Chem. Phys. 2015, 17, 21458-21469.
220
35. Valley, N. A.; Richmond, G. L., Solvation Station: Microsolvation for Modeling Vibrational Sum-Frequency Spectra of Acids at Aqueous Interfaces. J. Chem. Theory Comput. 2015, 11 (10), 4780-4790.
36. Valley, N. A.; Richmond, G. L., Computational Vibrational Sum Frequency Spectra of Formaldehyde and Hydroxymethanesulfonate at Aqueous Interfaces. J. Phys. Chem. C 2016, 120 (26), 14122-14129.
37. McWilliams, L. E.; Valley, N. A.; Vincent, N. M.; Richmond, G. L., Interfacial Insights into a Carbon Capture System: CO2 Uptake to an Aqueous Monoethanolamine Surface. J. Phys. Chem. A 2017, 121 (41), 7956-7967.
38. Gordon, B. P.; Moore, F. G.; Scatena, L. F.; Valley, N. A.; Wren, S. N.; Richmond, G. L., Model Behavior: Characterization of Hydroxyacetone at the Air–Water Interface Using Experimental and Computational Vibrational Sum Frequency Spectroscopy. J. Phys. Chem. A 2018, 122 (15), 3837-3849.
39. Schabes, B. K.; Altman, R. M.; Richmond, G. L., Come Together: Molecular Details into the Synergistic Effects of Polymer–Surfactant Adsorption at the Oil/Water Interface. J. Phys. Chem. B 2018, 122 (36), 8582-8590.
40. Schabes, B. K.; Hopkins, E. J.; Richmond, G. L., Molecular Interactions Leading to the Coadsorption of Surfactant Dodecyltrimethylammonium Bromide and Poly(styrenesulfonate) at the Oil/Water Interface. Langmuir 2019, 35 (22), 7268-7276.
41. Du, Q.; Superfine, R.; Freysz, E.; Shen, Y. R., Vibrational Spectroscopy of Water at the Vapor/Water Interface. Phys. Rev. Lett. 1993, 70 (15), 2313-1316.
42. Morita, A.; Hynes, J. T., A theoretical analysis of the sum frequency generation spectrum of the water surface. Chem. Phys. 2000, 258 (2-3), 371-390.
43. Raymond, E. A.; Tarbuck, T. L.; Brown, M. G.; Richmond, G. L., Hydrogen-Bonding Interactions at the Vapor/Water Interface Investigated by Vibrational Sum-Frequency Spectroscopy of HOD/H2O/D2O Mixtures and Molecular Dynamics Simulations. J. Phys. Chem. B 2003, 107 (2), 546-556.
44. Lu, R.; Gan, W.; Wu, B.-h.; Chen, H.; Wang, H.-f., Vibrational Polarization Spectroscopy of CH Stretching Modes of the Methylene Group at the Vapor/Liquid Interfaces with Sum Frequency Generation. J. Phys. Chem. B 2004, 108 (22), 7297-7306.
45. Shen, Y. R.; Ostroverkhov, V., Sum-Frequency Vibrational Spectroscopy on Water Interfaces: Polar Orientation of Water Molecules at Interfaces. Chem. Rev. 2006, 106 (4), 1140-1154.
46. Tian, C. S.; Shen, Y. R., Sum-Frequency Vibrational Spectroscopic Studies of Water/Vapor Interfaces. Chem. Phys. Lett. 2009, 470 (1-3), 1-6.
221
47. Feng, R. r.; Guo, Y.; Lü, R.; Velarde, L.; Wang, H. f., Consistency in the Sum Frequency Generation Intensity and Phase Vibrational Spectra of the Air/Neat Water Interface. J. Phys. Chem. A 2011, 115 (23), 6015-6027.
48. Verreault, D.; Hua, W.; Allen, H. C., From Conventional to Phase-Sensitive Vibrational Sum Frequency Generation Spectroscopy: Probing Water Organization at Aqueous Interfaces. J. Phys. Chem. Lett. 2012, 3 (20), 3012-3028.
49. Vinaykin, M.; Benderskii, A. V., Vibrational Sum-Frequency Spectrum of the Water Bend at the Air/Water Interface. J. Phys. Chem. Lett. 2012, 3 (22), 3348-3352.
50. Nagata, Y.; Hsieh, C.-S.; Hasegawa, T.; Voll, J.; Backus, E. H. G.; Bonn, M., Water Bending Mode at the Water–Vapor Interface Probed by Sum-Frequency Generation Spectroscopy: A Combined Molecular Dynamics Simulation and Experimental Study. J. Phys. Chem. Lett. 2013, 4 (11), 1872-1877.
51. Ni, Y.; Skinner, J. L., IR and SFG Vibrational Spectroscopy of the Water Bend in the Bulk Liquid and at the Liquid-Vapor Interface, Respectively. J. Chem. Phys. 2015, 143 (1), 014502.
52. Medders, G. R.; Paesani, F., Dissecting the Molecular Structure of the Air/Water Interface from Quantum Simulations of the Sum-Frequency Generation Spectrum. J. Am. Chem. Soc. 2016, 138 (11), 3912-3919.
53. Kundu, A.; Tanaka, S.; Ishiyama, T.; Ahmed, M.; Inoue, K.-i.; Nihonyanagi, S.; Sawai, H.; Yamaguchi, S.; Morita, A.; Tahara, T., Bend Vibration of Surface Water Investigated by Heterodyne-Detected Sum Frequency Generation and Theoretical Study: Dominant Role of Quadrupole. J. Phys. Chem. Lett. 2016, 7 (13), 2597-2601.
54. Perakis, F.; Marco, L. D.; Shalit, A.; Tang, F.; Kann, Z. R.; Kühne, T. D.; Torre, R.; Bonn, M.; Nagata, Y., Vibrational Spectroscopy and Dynamics of Water. Chem. Rev. 2016, 116 (13), 7590-7607.
55. Khatib, R.; Hasegawa, T.; Sulpizi, M.; Backus, E. H. G.; Bonn, M.; Nagata, Y., Molecular Dynamics Simulations of SFG Librational Modes Spectra of Water at the Water–Air Interface. J. Phys. Chem. C 2016, 120 (33), 18665-18673.
56. Dutta, C.; Benderskii, A. V., On the Assignment of the Vibrational Spectrum of the Water Bend at the Air/Water Interface. J. Phys. Chem. Lett. 2017, 8 (4), 801-804.
57. Pezzotti, S.; Galimberti, D. R.; Gaigeot, M.-P., 2D H-Bond Network as the Topmost Skin to the Air–Water Interface. J. Phys. Chem. Lett. 2017, 8 (13), 3133-3141.
222
58. Suzuki, Y.; Nojima, Y.; Yamaguchi, S., Vibrational Coupling at the Topmost Surface of Water Revealed by Heterodyne-Detected Sum Frequency Generation Spectroscopy. J. Phys. Chem. Lett. 2017, 8 (7), 1396-1401.
59. Tang, F.; Ohto, T.; Hasegawa, T.; Xie, W. J.; Xu, L.; Bonn, M.; Nagata, Y., Definition of Free O–H Groups of Water at the Air–Water Interface. J. Chem. Theory Comput. 2018, 14 (1), 357-364.
60. Woutersen, S.; Emmerichs, U.; Bakker, H. J., Femtosecond mid-IR pump-probe spectroscopy of liquid water: Evidence for a two-component structure. Science 1997, 278 (5338), 658-660.
61. Monson, P. R.; Patumtev, S.; Kaufmann, K. J.; Robinson, G. W., Dominance of Methyl-Groups in Picosecond Vibrational-Relaxation in Hydrocarbons. Chem. Phys. Lett. 1974, 28 (3), 312-315.
62. Chieffo, L.; Shattuck, J.; Amsden, J. J.; Erramilli, S.; Ziegler, L. D., Ultrafast Vibrational Relaxation of Liquid H2O Following Librational Combination Band Excitation. Chem. Phys. 2007, 341 (3), 71-80.
63. Knop, S.; Lindner, J.; Vöhringer, P., OH and NH Stretching Vibrational Relaxation of Liquid Ethanolamine. Z. Phys. Chem. 2011, 225 (9-10), 913-926.
64. Case, D. A.; Darden, T. A.; T.E. Cheatham, I.; Simmerling, C. L.; Wang, J.; Duke, R. E.; Luo, R.; Walker, R. C.; Zhang, W.; Merz, K. M., AMBER 12; University of California: San Francisco. 2012.
65. Martinez, L.; Andrade, R.; Birgin, E.; Martinez, J., PACKMOL: A Package for Building Initial Configurations for Molecular Dynamics Simulations. J. Comput. Chem. 2009, 30 (13), 2157-2164.
66. Frisch, M. J.; Trucks, G. W.; Schlegel, H. B.; Scuseria, G. E.; Robb, M. A.; Cheeseman, J. R.; Scalmani, G.; Barone, V.; Mennucci, B.; Petersson, G. A.; Nakatsuji, H.; Caricato, M.; Li, X.; Hratchian, H. P.; Izmaylov, A. F.; Bloino, J.; Zheng, G.; Sonnenberg, J. L.; Hada, M.; Ehara, M.; Toyota, K.; Fukuda, R.; Hasegawa, J.; Ishida, M.; Nakajima, T.; Honda, Y.; Kitao, O.; Nakai, H.; Vreven, T.; Montgomery, J. A.; Peralta, J. E.; Ogliaro, F.; Bearpark, M.; Heyd, J. J.; Brothers, E.; Kudin, K. N.; Staroverov, V. N.; Kobayashi, R.; Normand, J.; Raghavachari, K.; Rendell, A.; Burant, J. C.; Iyengar, S. S.; Tomasi, J.; Cossi, M.; Rega, N.; Millam, J. M.; Klene, M.; Knox, J. E.; Cross, J. B.; Bakken, V.; Adamo, C.; Jaramillo, J.; Gomperts, R.; Stratmann, R. E.; Yazyev, O.; Austin, A. J.; Cammi, R.; Pomelli, C.; Ochterski, J. W.; Martin, R. L.; Morokuma, K.; Zakrzewski, V. G.; Voth, G. A.; Salvador, P.; Dannenberg, J. J.; Dapprich, S.; Daniels, A. D.; Farkas, O.; Foresman, J. B.; Ortiz, J. V.; Cioslowski, J.; Fox, D. J., Gaussian 09. 2009.
223
67. Maron, M. K.; Takahashi, K.; Shoemaker, R. K.; Vaida, V., Hydration of Pyruvic Acid to Its Geminal-Diol, 2,2-Dihydroxypropanoic Acid, in a Water-Restricted Environment. Chem. Phys. Lett. 2011, 513 (4-6), 184-190.
68. Larsen, M. C.; Vaida, V., Near Infrared Photochemistry of Pyruvic Acid in Aqueous Solution. J. Phys. Chem. A 2012, 116 (24), 5840-5846.
69. Griffith, E. C.; Carpenter, B. K.; Shoemaker, R. K.; Vaida, V., Photochemistry of Aqueous Pyruvic Acid. Proc. Natl. Acad. Sci. U. S. A. 2013, 110 (29), 11714-11719.
70. Reed Harris, A. E.; Ervens, B.; Shoemaker, R. K.; Kroll, J. A.; Rapf, R. J.; Griffith, E. C.; Monod, A.; Vaida, V., Photochemical Kinetics of Pyruvic Acid in Aqueous Solution. J. Phys. Chem. A 2014, 118 (37), 8505-8516.
71. Perkins, R. J.; Shoemaker, R. K.; Carpenter, B. K.; Vaida, V., Chemical Equilibria and Kinetics in Aqueous Solutions of Zymonic Acid. J. Phys. Chem. A 2016, 120 (51), 10096-10107.
72. Reed Harris, A. E.; Doussin, J. F.; Carpenter, B. K.; Vaida, V., Gas-Phase Photolysis of Pyruvic Acid: The Effect of Pressure on Reaction Rates and Products. J. Phys. Chem. A 2016, 120 (51), 10123-10133.
73. Reed Harris, A. E.; Pajunoja, A.; Cazaunau, M.; Gratien, A.; Pangui, E.; Monod, A.; Griffith, E. C.; Virtanen, A.; Doussin, J. F.; Vaida, V., Multiphase Photochemistry of Pyruvic Acid under Atmospheric Conditions. J. Phys. Chem. A 2017, 121 (18), 3327-3339.
74. Rapf, R. J.; Perkins, R. J.; Carpenter, B. K.; Vaida, V., Mechanistic Description of Photochemical Oligomer Formation from Aqueous Pyruvic Acid. J. Phys. Chem. A 2017, 121 (22), 4272-4282.
75. Rapf, R. J.; Perkins, R. J.; Yang, H. S.; Miyake, G.; Carpenter, B. K.; Vaida, V., Photochemical Synthesis of Oligomeric Amphiphiles from Alkyl Oxoacids in Aqueous Environments. J. Am. Chem. Soc. 2017, 139 (20), 6946-6959.
76. Reed Harris, A. E.; Cazaunau, M.; Gratien, A.; Pangui, E.; Doussin, J. F.; Vaida, V., Atmospheric Simulation Chamber Studies of the Gas-Phase Photolysis of Pyruvic Acid. J. Phys. Chem. A 2017, 121 (44), 8348-8358.
77. Rapf, R. J.; Perkins, R. J.; Dooley, M. R.; Kroll, J. A.; Carpenter, B. K.; Vaida, V., Environmental Processing of Lipids Driven by Aqueous Photochemistry of α-Keto Acids. Acs Central Science 2018, 4 (5), 624-630.
78. Fang, Y.; Lesnicki, D.; Wall, K. J.; Gaigeot, M. P.; Sulpizi, M.; Vaida, V.; Grassian, V. H., Heterogeneous Interactions between Gas-Phase Pyruvic Acid and Hydroxylated Silica Surfaces: A Combined Experimental and Theoretical Study. J. Phys. Chem. A 2019, 123 (5), 983-991.
224
79. Alves, M. R.; Fang, Y.; Wall, K. J.; Vaida, V.; Grassian, V. H., Chemistry and Photochemistry of Pyruvic Acid Adsorbed on Oxide Surfaces. J. Phys. Chem. A 2019, 123 (35), 7661-7671.
80. Glushonok, G. K.; Glushonok, T. G.; Maslovskaya, L. A.; Shadyro, O. I., A 1H and 13C NMR and UV Study of the State of Hydroxyacetone in Aqueous Solutions. Russ. J. Gen. Chem. 2003, 73 (7), 1027-1031.
CHAPTER VIII: GL
1. Loeffler, K. W.; Koehler, C. A.; Paul, N. M.; De Haan, D. O., Oligomer Formation in Evaporating Aqueous Glyoxal and Methyl Glyoxal Solutions. Environ. Sci. Technol. 2006, 40 (20), 6318-6323.
2. De Haan, D. O.; Corrigan, A. L.; Tolbert, M. A.; Jimenez, J. L.; Wood, S. E.; Turley, J. J., Secondary Organic Aerosol Formation by Self-Reactions of Methylglyoxal and Glyoxal in Evaporating Droplets. Environ. Sci. Technol. 2009, 43 (21), 8184-8190.
3. Gordon, B. P.; Moore, F. G.; Scatena, L. F.; Valley, N. A.; Wren, S. N.; Richmond, G. L., Model Behavior: Characterization of Hydroxyacetone at the Air–Water Interface Using Experimental and Computational Vibrational Sum Frequency Spectroscopy. J. Phys. Chem. A 2018, 122 (15), 3837-3849.
4. Wren, S. N.; Valley, N. A.; Gordon, B. P.; McWilliams, L. E.; Richmond, G. L., Hydration, Orientation, and Conformation of Methylglyoxal at the Air-Water Interface. J. Phys. Chem. A 2015, 119 (24), 6391-6403.
5. Gordon, B. P.; Moore, F. G.; Scatena, L. F.; Richmond, G. L., On the Rise: Experimental and Computational Vibrational Sum Frequency Spectroscopy Studies of Pyruvic Acid and Its Surface-Active Oligomer Species at the Air–Water Interface. J. Phys. Chem. A 2019, 123(49),10609-10619.
6. Valley, N. V.; Blower, P. G.; Wood, S. R.; Plath, K. L.; McWilliams, L. E.; Richmond, G. L., Doubling Down: Delving into the Details of Diacid Adsorption at Aqueous Surfaces. J. Phys. Chem. A 2014, 118 (26), 4778-4789.
225
CHAPTER IX: Computational Improvements
1. Nemet, I.; Vikic-Topic, D.; Varga-Defterdarovic, L., Spectroscopic Studies of Methylglyoxal in Water and Dimethylsulfoxide. Bioorg. Chem. 2004, 32, (6) 560-570.
2 Wren, S. N.; Gordon, B. P.; Valley, N. A.; McWilliams, L. E.; Richmond, G. L., Hydration, Orientation, and Conformation of Methylglyoxal at the Air-Water Interface. J. Phys. Chem. A. 2015, 119, 6391-6403.
3 Glushonok, G. K.; Glushonok, T. G.; Maslovskaya, L. A.; Shadyro, O. I., 1H- and 13C-NMR and UV Study of the State of Hydroxyacetone in Aqueous Solutions. Russ. J. Gen. Chem. 2001, 73, No. 7, 1027-1031.
4 Smiechowski, M.; Sun, J.; Forbert, H.; and Marx., Solvation shell resolved THz spectra of simple aqua ions – distinct distance- and frequency- dependent contributions of solvation shells. Phys.Chem.Chem.Phys., 2015, 17, 8323-8329.
5 Calwell, J. W.; Kollman, P. A., Structure and Properties of Neat Liquids Using Nonadditive Molecular Dynamics: Water, Methanol, and N-Methylacetamide. J. Phys. Chem. 1995, 99, 6208-6219.
6 Jorgensen, W. L.; Chandrasekhar, J.; Madura, J. D.; Impey, R. W.; Klein, W., Comparison of simple potential functions for simulating liquid water. J. Chem. Phys, 1983, 79, 926–935.
7 Berendsen, H. J. C.; Grigera, J. R.; Straatsma, T. P., The missing term in effective pair potentials. J. Phys. Chem, 1987, 91, 6269–6271.
8 Horn, H.; Swope, W. C.; Pitera, J. W.; Madura, J. D.; Dick, T. J.; Hura, G. L.; Head-Gordon, T., Development of an improved four-site water model for biomolecular simulations: TIP4P-Ew. J. Chem. Phys., 2004, 120, 9665-9678.
9 Vega, C.; Abascal, J. L. F., Simulating Water With Rigid Non-Polarizable Model: A General Perspective. Phys. Chem. Chem. Phys. 2011, 13, 19663-19688.
10 Zadi, S.; Building Water Models: A Different Approach". J. Phys.Chem. Lett., 2014, 21, 3863–3871.
11 Howard, J. C..; Enyard, J. D.; Tschumpe, G. S., Assessing the accuracy of some popular DFT methods for computing harmonic vibrational frequencies of water clusters. J. Chem. Phys. 2015,143, 214103.
12 Gordon, B. P.; Moore, F. G.; Scatena, L. F.; Valley, N. A.; Wren, S. N.; Richmond, G. L., Model Behavior: Characterization of Hydroxyacetone at the Air–Water Interface Using Experimental and Computational Vibrational Sum Frequency Spectroscopy. J. Phys. Chem. A 2018, 122 (15), 3837-3849.
226
13 Kawamura, K.; Okuzawa, K.; Aggarwal, S. G.; Irie, H.; Kanaya. Y.; Wang, Z.; Determination of Gaseous and Particulate Carbonyls (Glycoaldehyde, hydroxyacetone, glyoxal, methylglyoxal, nonal and decanal) in the atmosphere at Mt. Tai. Atmos. Chem. Phys. 2013, 13, 5369-5380.
14 Hornak, V.; Abel, R.; Okur, A.; Strockbine, B.; Roitberg, A.; Simmerling, C.; Comparison of multiple Amber force fields and development of improved protein backbone parameters. Proteins, 2006, 65, 712-725.
15 Habartova, A.; Valsaraj, K. T.; Roeselova, M., Molecular Dynamics Simulations of Small Halogenated Organics at the Air-Water Interface: Implications in Water Treatment and Atmospheric Chemistry. J. Phys. Chem. A. 2013, 117, 9205-9215.
APPENDIX B: Neat-MG
1. Gan, W.; Wu, D.; Zhang, Z.; Feng, R. R.; Wang, H. F., Polarization and Experimental Configuration Analyses of Sum Frequency Generation Vibrational Spectra, Structure, and Orientational Motion of the Air/Water Interface. J. Chem. Phys. 2006, 124, No. 114705.
2. Blower, P. G.; Ota, S. T.; Valley, N. A.; Wood, S. R.; Richmond, G. L., Sink or Surf: Atmospheric Implications for Succinic Acid at Aqueous Surfaces. J. Phys. Chem. A 2013, 117, 7887-7903.
3. Blower, P. G.; Shamay, E. S.; Kringle, L.; Ota, S. T.; Richmond, G. L., Surface Behavior of Malonic Acid Adsorption at the Air/Water Interface. J. Phys. Chem. A 2013, 117, 2529-2542.
4. Valley, N. V.; Blower, P. G.; Wood, S. R.; Plath, K. L.; McWilliams, L. E.; Richmond, G. L., Doubling Down: Delving into the Details of Diacid Adsorption at Aqueous Surfaces. J. Phys. Chem. A 2014, 118, 4778-4789.
5. Rosen, M. J., Surfactants and Interfacial Phenomena. 3rd ed.; John Wiley & Sons, Inc.: New York, 2004.
6. Gopalakrishnan, S.; Liu, D.; Allen, H. C.; Kuo, M.; Shultz, M. J., Vibrational Spectroscopic Studies of Aqueous Interfaces: Salts, Acids, Bases, and Nanodrops. Chem. Rev. 2006, 106, 1155-1175.
7. Jang, M.; Czoschke, N. M.; Lee, S.; Kamens, R. M., Heterogeneous Atmospheric Aerosol Production by Acid-Catalyzed Particle-Phase Reactions. Science 2002, 298, 814-817.
8. Hazra, M. K.; Francisco, J. S.; Sinha, A., Hydrolysis of Glyoxal in Water-Restricted Environments: Formation of Organic Aerosol Precursors Through Formic Acid Catalysis. J. Phys. Chem. A 2014, 118, 4095-4105.
227
APPENDIX C: HA SI
1. Du, Q.; Superfine, R.; Freysz, E.; Shen, Y. R. Vibrational Spectroscopy of Water at the Vapor/Water Interface. Phys. Rev. Lett. 1993, 70, 2313-2316.
2. Ishiyama, T.; Imamura, T.; Morita, A. Theoretical Studies of Structures and Vibrational Sum Frequency Generation Spectra at Aqueous Interfaces. Chem. Rev. 2014, 114, 8447-8470.
3. Medders, G. R.; Paesani, F. Dissecting the Molecular Structure of the Air/Water Interface from Quantum Simulations of the Sum-Frequency Generation Spectrum. J. Am.Chem. Soc. 2016, 138, 3912-3919.
4. Perakis, F.; Marco, L. D.; Shalit, A.; Tang, F.; Kann, Z. R.; Kühne, T. D.; Torre, R.; Bonn, M.; Nagata, Y. Vibrational Spectroscopy and Dynamics of Water. Chem. Rev. 2016, 116, 7590-7607.
5. Raymond, E. A.; Tarbuck, T. L.; Brown, M. G.; Richmond, G. L. Hydrogen-Bonding Interactions at the Vapor/Water Interface Investigated by Vibrational Sum-Frequency Spectroscopy of HOD/H2O/D2O Mixtures and Molecular Dynamics Simulations. J. Phys. Chem. B 2003, 107, 546-556.
6. Raymond, E. A.; Tarbuck, T. L.; Richmond, G. L. Isotopic Dilution Studies of the Vapor/Water Interface as Investigated by Vibrational Sum-Frequency Spectroscopy. J. Phys. Chem. B 2002, 106, 2817-2820.
7. Richmond, G. L. Molecular Bonding and Interactions at Aqueous Surfaces as Probed by Vibrational Sum Frequency Spectroscopy. Chem. Rev. 2002, 102, 2693-2724.
8. Tang, F.; Ohto, T.; Hasegawa, T.; Xie, W. J.; Xu, L.; Bonn, M.; Nagata, Y. Definition of Free O–H Groups of Water at the Air–Water Interface. J. Chem. Theory Comput. 2018, 14, 357-364.
9. Shen, Y. R.; Ostroverkhov, V. Sum-Frequency Vibrational Spectroscopy on Water Interfaces: Polar Orientation of Water Molecules at Interfaces. Chem. Rev. 2006, 106, 1140-1154.
10. Pezzotti, S.; Galimberti, D. R.; Gaigeot, M.P. 2D H-Bond Network as the Topmost Skin to the Air–Water Interface. J. Phys. Chem. Lett 2017, 8, 3133-3141.
11. Schaefer, J.; Backus, E. H. G.; Nagata, Y.; Bonn, M. Both Inter- and Intramolecular Coupling of O–H Groups Determine the Vibrational Response of the Water/Air Interface. J. Phys. Chem. Lett. 2016, 7, 4591-4595.
228
12. Suzuki, Y.; Nojima, Y.; Yamaguchi, S. Vibrational Coupling at the Topmost Surface of Water Revealed by Heterodyne-Detected Sum Frequency Generation Spectroscopy. J. Phys. Chem. Lett. 2017, 8, 1396-1401.
13. Nagata, Y.; Hsieh, C.S.; Hasegawa, T.; Voll, J.; Backus, E. H. G.; Bonn, M. Water Bending Mode at the Water–Vapor Interface Probed by Sum-Frequency Generation Spectroscopy: A Combined Molecular Dynamics Simulation and Experimental Study. J. Phys. Chem. Lett. 2013, 4, 1872-1877.
14. Ni, Y.; Skinner, J. L. IR and SFG vibrational spectroscopy of the water bend in the bulk liquid and at the liquid-vapor interface, respectively. J. Chem. Phys. 2015, 143 (1), 014502.
15. Vinaykin, M.; Benderskii, A. V. Vibrational Sum-Frequency Spectrum of the Water Bend at the Air/Water Interface. J. Phys. Chem. Lett. 2012, 3, 3348-3352.
16. Dutta, C.; Benderskii, A. V. On the Assignment of the Vibrational Spectrum of the Water Bend at the Air/Water Interface. J. Phys. Chem. Lett. 2017, 8, 801-804.
17. Kundu, A.; Tanaka, S.; Ishiyama, T.; Ahmed, M.; Inoue, K.I.; Nihonyanagi, S.; Sawai, H.; Yamaguchi, S.; Morita, A.; Tahara, T. Bend Vibration of Surface Water Investigated by Heterodyne-Detected Sum Frequency Generation and Theoretical Study: Dominant Role of Quadrupole. J. Phys. Chem. Lett. 2016, 7, 2597-2601.
18. Khatib, R.; Hasegawa, T.; Sulpizi, M.; Backus, E. H. G.; Bonn, M.; Nagata, Y. Molecular Dynamics Simulations of SFG Librational Modes Spectra of Water at the Water–Air Interface. J. Phys. Chem. C 2016, 120, 18665-18673.
19. Rosen, M. J., In Surfactants and Interfacial Phenomena 3rd ed., John Wiley & Sons, Inc.: New York, 2004.
APPENDIX E: PA SI
1. Du, Q.; Superfine, R.; Freysz, E.; Shen, Y. R. Vibrational Spectroscopy of Water at the Vapor/Water Interface. Phys. Rev. Lett. 1993, 70, 2313-2316.
2. Ishiyama, T.; Imamura, T.; Morita, A. Theoretical Studies of Structures and Vibrational Sum Frequency Generation Spectra at Aqueous Interfaces. Chem. Rev. 2014, 114, 8447-8470.
3. Medders, G. R.; Paesani, F. Dissecting the Molecular Structure of the Air/Water Interface from Quantum Simulations of the Sum-Frequency Generation Spectrum. J. Am.Chem. Soc. 2016, 138, 3912-3919.
229
4. Perakis, F.; Marco, L. D.; Shalit, A.; Tang, F.; Kann, Z. R.; Kühne, T. D.; Torre, R.; Bonn, M.; Nagata, Y. Vibrational Spectroscopy and Dynamics of Water. Chem. Rev. 2016, 116, 7590-7607.
5. Raymond, E. A.; Tarbuck, T. L.; Brown, M. G.; Richmond, G. L. Hydrogen-Bonding Interactions at the Vapor/Water Interface Investigated by Vibrational Sum-Frequency Spectroscopy of HOD/H2O/D2O Mixtures and Molecular Dynamics Simulations. J. Phys. Chem. B 2003, 107, 546-556.
6. Raymond, E. A.; Tarbuck, T. L.; Richmond, G. L. Isotopic Dilution Studies of the Vapor/Water Interface as Investigated by Vibrational Sum-Frequency Spectroscopy. J. Phys. Chem. B 2002, 106, 2817-2820.
7. Richmond, G. L. Molecular Bonding and Interactions at Aqueous Surfaces as Probed by Vibrational Sum Frequency Spectroscopy. Chem. Rev. 2002, 102, 2693-2724.
8. Tang, F.; Ohto, T.; Hasegawa, T.; Xie, W. J.; Xu, L.; Bonn, M.; Nagata, Y. Definition of Free O–H Groups of Water at the Air–Water Interface. J. Chem. Theory Comput. 2018, 14, 357-364.
9. Shen, Y. R.; Ostroverkhov, V. Sum-Frequency Vibrational Spectroscopy on Water Interfaces: Polar Orientation of Water Molecules at Interfaces. Chem. Rev. 2006, 106, 1140-1154.
10. Pezzotti, S.; Galimberti, D. R.; Gaigeot, M.P. 2D H-Bond Network as the Topmost Skin to the Air–Water Interface. J. Phys. Chem. Lett 2017, 8, 3133-3141.
11. Schaefer, J.; Backus, E. H. G.; Nagata, Y.; Bonn, M. Both Inter- and Intramolecular Coupling of O–H Groups Determine the Vibrational Response of the Water/Air Interface. J. Phys. Chem. Lett. 2016, 7, 4591-4595.
12. Suzuki, Y.; Nojima, Y.; Yamaguchi, S. Vibrational Coupling at the Topmost Surface of Water Revealed by Heterodyne-Detected Sum Frequency Generation Spectroscopy. J. Phys. Chem. Lett. 2017, 8, 1396-1401.
13. Nagata, Y.; Hsieh, C.S.; Hasegawa, T.; Voll, J.; Backus, E. H. G.; Bonn, M. Water Bending Mode at the Water–Vapor Interface Probed by Sum-Frequency Generation Spectroscopy: A Combined Molecular Dynamics Simulation and Experimental Study. J. Phys. Chem. Lett. 2013, 4, 1872-1877.
14. Ni, Y.; Skinner, J. L. IR and SFG vibrational spectroscopy of the water bend in the bulk liquid and at the liquid-vapor interface, respectively. J. Chem. Phys. 2015, 143 (1), 014502.
15. Vinaykin, M.; Benderskii, A. V. Vibrational Sum-Frequency Spectrum of the Water Bend at the Air/Water Interface. J. Phys. Chem. Lett. 2012, 3, 3348-3352.
230
16. Dutta, C.; Benderskii, A. V. On the Assignment of the Vibrational Spectrum of the Water Bend at the Air/Water Interface. J. Phys. Chem. Lett. 2017, 8, 801-804.
17. Kundu, A.; Tanaka, S.; Ishiyama, T.; Ahmed, M.; Inoue, K.I.; Nihonyanagi, S.; Sawai, H.; Yamaguchi, S.; Morita, A.; Tahara, T. Bend Vibration of Surface Water Investigated by Heterodyne-Detected Sum Frequency Generation and Theoretical Study: Dominant Role of Quadrupole. J. Phys. Chem. Lett. 2016, 7, 2597-2601.
18. Khatib, R.; Hasegawa, T.; Sulpizi, M.; Backus, E. H. G.; Bonn, M.; Nagata, Y. Molecular Dynamics Simulations of SFG Librational Modes Spectra of Water at the Water–Air Interface. J. Phys. Chem. C 2016, 120, 18665-18673.
19. Rosen, M. J., In Surfactants and Interfacial Phenomena 3rd ed., John Wiley & Sons, Inc.: New York, 2004.