EXHIBIT A San Francisco Public Utilities Commission's ...
51
EXHIBIT A San Francisco Public Utilities Commission’s Quarterly Report to the Board of Supervisors on the Status of Applications to PG&E for Electric Service (April 23, 2021)
-
Upload
khangminh22 -
Category
Documents
-
view
0 -
download
0
Transcript of EXHIBIT A San Francisco Public Utilities Commission's ...

EXHIBIT A
San Francisco Public Utilities Commission’s Quarterly Report to
the Board of Supervisors on the Status of Applications to PG&E for
Electric Service (April 23, 2021)

Page 1 of 5
525 Golden Gate Avenue San Francisco, CA 94102
T 415.554.0725 [email protected]
April 23, 2021
Ms. Angela Calvillo Clerk of the Board of Supervisors City Hall, Room 244 1 Dr. Carlton B. Goodlett Place San Francisco, CA 94102-4689
RE: San Francisco Public Utilities Commission’s Quarterly Report to the Board of Supervisors on the Status of Applications to PG&E for Electric Service.
Dear Ms. Calvillo:
The attached quarterly report has been prepared for the Board of Supervisors (Board) in accordance with Resolution No. 227-18, approved by the Board on July 10, 2018 (File No. 180693) and adopted on July 20, 2018.
Pursuant to Resolution No. 227-18, the San Francisco Public Utilities Commission (SFPUC) is required to “provide the Board a quarterly report for the next two years that identifies the following: status of all City projects with applications to SFPUC for electric service, including project schedules and financing and other deadlines; project sponsor and SFPUC concerns in securing temporary and permanent power, including obstacles that could increase costs or delay service to City customers; and the status of disputes with PG&E before the Federal Energy Regulatory Commission (FERC) or in other forums.” This resolution was re-affirmed by the Board on April 6, 2021. The SFPUC provides retail electric service from our Hetch Hetchy Power public utility to over 4,000 accounts, relying on our Hetch Hetchy generation and other sources for supply and purchased transmission and distribution services from PG&E. The SFPUC pays PG&E about $10 million a year for this distribution service and another $25 million to wheel the power on PG&E’s transmission lines. The terms and conditions of the purchased distribution service are described in PG&E’s Wholesale Distribution Tariff (WDT), as approved by the Federal Energy Regulatory Commission (FERC). The SFPUC purchases PG&E’s transmission services through the California Independent System Operator.
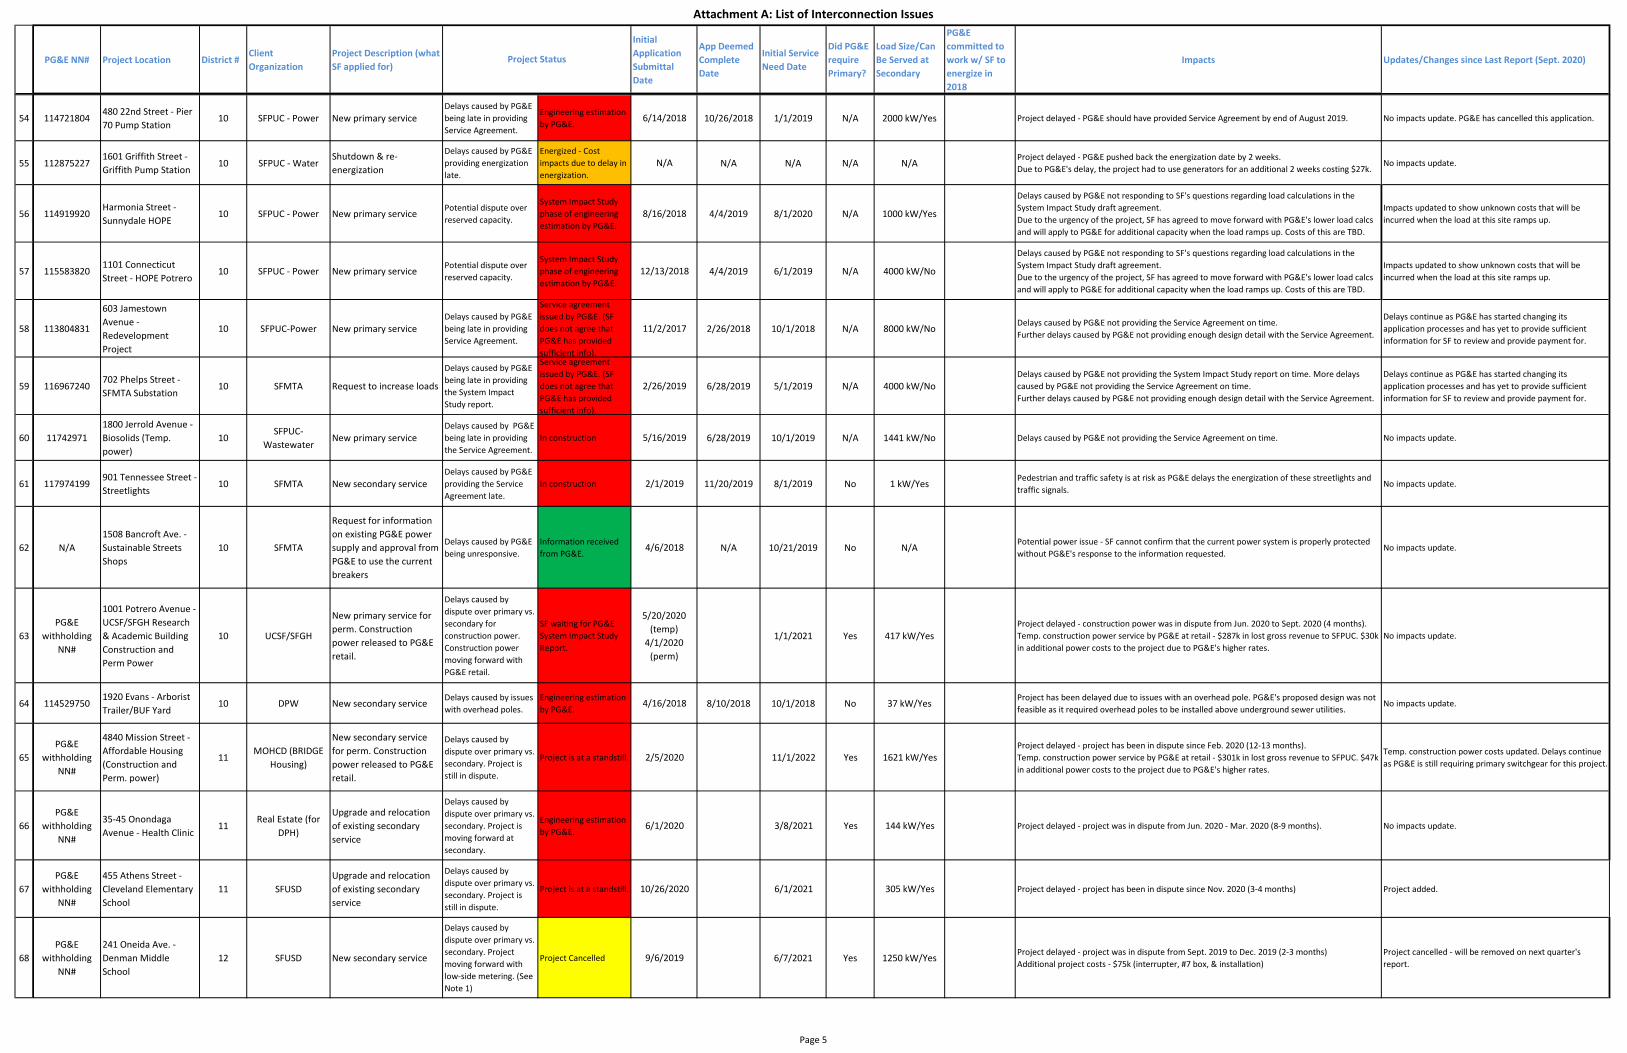
REPORT SUMMARY: For the reporting period of September 2020 through March 2021, the SFPUC has identified 72 projects that have experienced interconnection delays, requests for additional and/or unnecessary information, or increased project costs, as listed in
Page 2 of 5
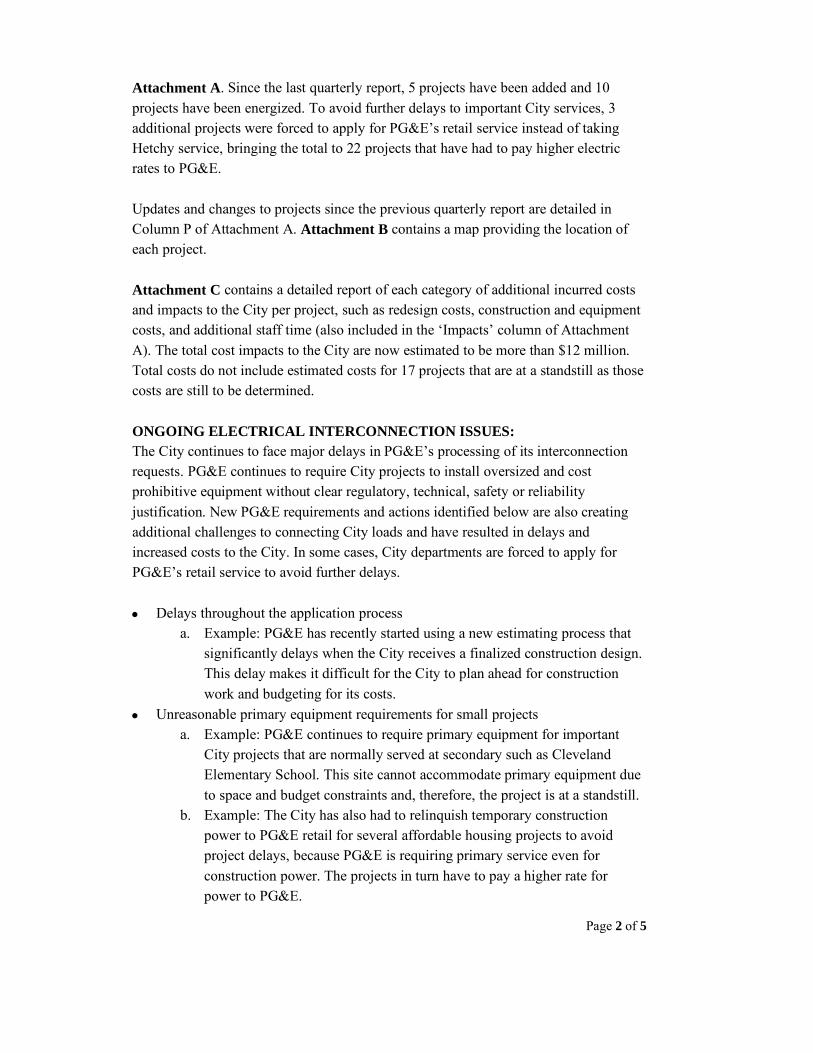
Attachment A. Since the last quarterly report, 5 projects have been added and 10 projects have been energized. To avoid further delays to important City services, 3 additional projects were forced to apply for PG&E’s retail service instead of taking Hetchy service, bringing the total to 22 projects that have had to pay higher electric rates to PG&E.
Updates and changes to projects since the previous quarterly report are detailed in Column P of Attachment A. Attachment B contains a map providing the location of each project.
Attachment C contains a detailed report of each category of additional incurred costs and impacts to the City per project, such as redesign costs, construction and equipment costs, and additional staff time (also included in the ‘Impacts’ column of Attachment A). The total cost impacts to the City are now estimated to be more than $12 million. Total costs do not include estimated costs for 17 projects that are at a standstill as those costs are still to be determined.
ONGOING ELECTRICAL INTERCONNECTION ISSUES: The City continues to face major delays in PG&E’s processing of its interconnection requests. PG&E continues to require City projects to install oversized and cost prohibitive equipment without clear regulatory, technical, safety or reliability justification. New PG&E requirements and actions identified below are also creating additional challenges to connecting City loads and have resulted in delays and increased costs to the City. In some cases, City departments are forced to apply for PG&E’s retail service to avoid further delays.
• Delays throughout the application processa. Example: PG&E has recently started using a new estimating process that
significantly delays when the City receives a finalized construction design.This delay makes it difficult for the City to plan ahead for constructionwork and budgeting for its costs.
• Unreasonable primary equipment requirements for small projectsa. Example: PG&E continues to require primary equipment for important
City projects that are normally served at secondary such as ClevelandElementary School. This site cannot accommodate primary equipment dueto space and budget constraints and, therefore, the project is at a standstill.
b. Example: The City has also had to relinquish temporary constructionpower to PG&E retail for several affordable housing projects to avoidproject delays, because PG&E is requiring primary service even forconstruction power. The projects in turn have to pay a higher rate forpower to PG&E.
Page 3 of 5
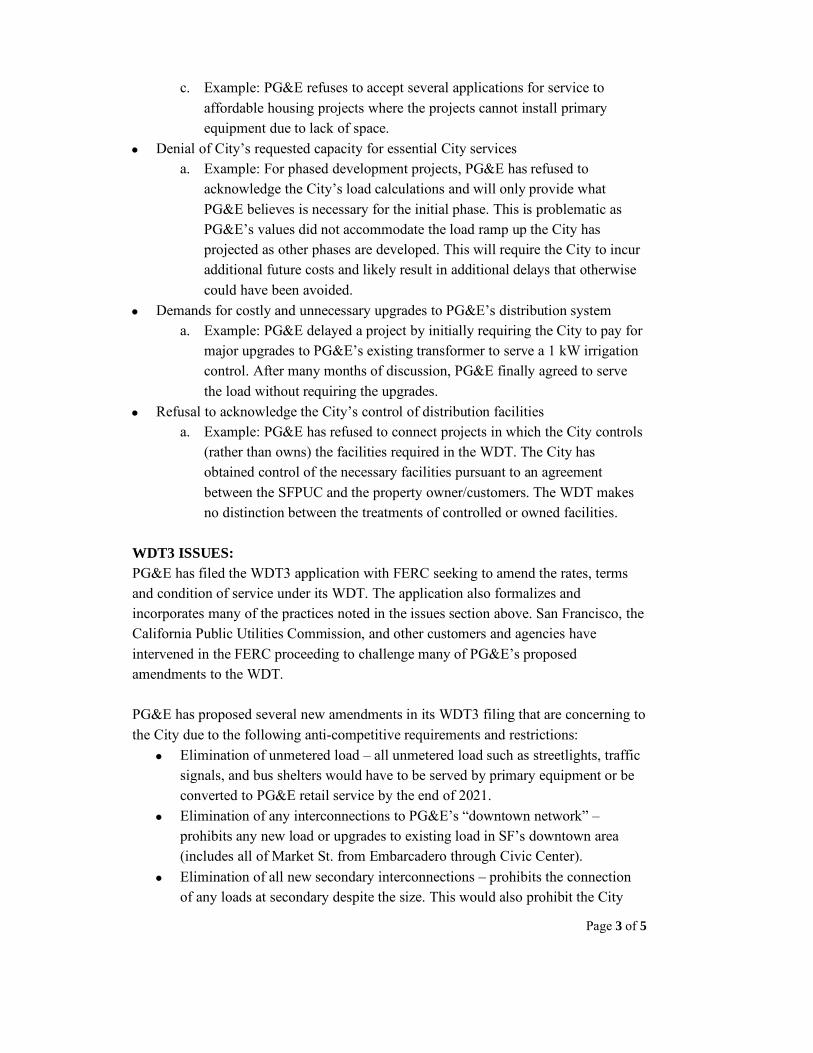
c. Example: PG&E refuses to accept several applications for service toaffordable housing projects where the projects cannot install primaryequipment due to lack of space.
• Denial of City’s requested capacity for essential City servicesa. Example: For phased development projects, PG&E has refused to
acknowledge the City’s load calculations and will only provide whatPG&E believes is necessary for the initial phase. This is problematic asPG&E’s values did not accommodate the load ramp up the City hasprojected as other phases are developed. This will require the City to incuradditional future costs and likely result in additional delays that otherwisecould have been avoided.
• Demands for costly and unnecessary upgrades to PG&E’s distribution systema. Example: PG&E delayed a project by initially requiring the City to pay for
major upgrades to PG&E’s existing transformer to serve a 1 kW irrigationcontrol. After many months of discussion, PG&E finally agreed to servethe load without requiring the upgrades.
• Refusal to acknowledge the City’s control of distribution facilitiesa. Example: PG&E has refused to connect projects in which the City controls
(rather than owns) the facilities required in the WDT. The City hasobtained control of the necessary facilities pursuant to an agreementbetween the SFPUC and the property owner/customers. The WDT makesno distinction between the treatments of controlled or owned facilities.
WDT3 ISSUES: PG&E has filed the WDT3 application with FERC seeking to amend the rates, terms and condition of service under its WDT. The application also formalizes and incorporates many of the practices noted in the issues section above. San Francisco, the California Public Utilities Commission, and other customers and agencies have intervened in the FERC proceeding to challenge many of PG&E’s proposed amendments to the WDT.
PG&E has proposed several new amendments in its WDT3 filing that are concerning to the City due to the following anti-competitive requirements and restrictions:
• Elimination of unmetered load – all unmetered load such as streetlights, trafficsignals, and bus shelters would have to be served by primary equipment or beconverted to PG&E retail service by the end of 2021.
• Elimination of any interconnections to PG&E’s “downtown network” –prohibits any new load or upgrades to existing load in SF’s downtown area(includes all of Market St. from Embarcadero through Civic Center).
• Elimination of all new secondary interconnections – prohibits the connectionof any loads at secondary despite the size. This would also prohibit the City

Page 4 of 5
from providing secondary service to any existing customers with secondary interconnections if their facilities are being modified for reasons such as building renovations or decarbonization (increased electrification) of existing buildings.
• Major Increase in Distribution Rates – the City expects to see a doubling ormore of distribution costs under PG&E’s newly filed rates. There are alsomajor concerns about how PG&E’s proposed rate design inequitably over-allocates costs to wholesale customers.
STATUS OF DISPUTES WITH PG&E BEFORE FERC: As we previously informed you, on November 21, 2019, FERC issued an order in the City’s 2014 complaint and related cases rejecting the City’s claim that all of its load is eligible for service under the Federal Power Act without adding new facilities because the City had been serving the same customers for decades. On December 20, 2019, the City filed a request for rehearing of FERC’s order. On June 4, 2020, FERC issued an order on rehearing that, for the most part, affirmed its prior order. The City has filed petitions to review these FERC orders with the Court of Appeals for the District of Columbia Circuit. These matters have been fully briefed. We anticipate that the Court will schedule an oral argument in these matters sometime this year.
In January 2020, the City and PG&E participated in an evidentiary hearing before a FERC Administrative Law Judge (ALJ) in a dispute over WDT service to an SFMTA substation at 6 Berry Street. The issues in that proceeding are: (i) whether PG&E is wrongfully charging the City for upgrades to its system; and (ii) whether PG&E’s cost estimates lack sufficient detail. On July 2, 2020, the ALJ issued an initial decision in which the ALJ found for PG&E on the issue concerning the cost of upgrades and for the City on the issue concerning the cost estimates. Both the City and PG&E have filed exceptions to the initial decision asking FERC to reject the ALJ’s rulings against them. We await a FERC decision.
On April 16, 2020, FERC issued an order dismissing the City’s second complaint against PG&E in which the City claimed that PG&E violated its WDT by demanding primary service for small loads. FERC found that PG&E has the discretion to grant or deny a request for secondary service based on the specifics of each particular request. On May 18, 2020, the City filed a request for rehearing of FERC’s order. On September 17, 2020, FERC issued an order on rehearing sustaining its dismissal of the complaint. The City has filed petitions to review these FERC orders with the Court of Appeals for the District of Columbia Circuit. The final brief in these matters is due on May 28, 2021. The Court has ordered that the oral argument in these matters will be on the same day as the prior appeal discussed above.
Page 5 of 5
The City received a favorable ruling from FERC following the City’s protest over PG&E’s rejection of the City’s request to serve a customer that had requested a transfer from PG&E retail service to SFPUC service. FERC found that “PG&E’s WDT does not permit it to refuse to grant a customer’s requested reserved capacity when available distribution capacity exists to meet the request.”
Please find attached copies of the following documents related to this report:
• Attachment A: List of projects with active interconnection applications toPG&E for electric service as of April 2021
• Attachment B: Map of projects with PG&E power connection delays as ofApril 2021
• Attachment C: Cost impacts
Should you have any questions, please contact Barbara Hale, SFPUC Assistant General Manager for Power, at [email protected] and 415-613-6341.
Sincerely,
Michael P. Carlin Acting General Manager

Attachment A: List of Interconnection Issues
PG&E NN# Project Location District #Client Organization
Project Description (what SF applied for)
Initial Application Submittal Date
App Deemed Complete Date
Initial Service Need Date
Did PG&E require Primary?
Load Size/Can Be Served at Secondary
PG&E committed to work w/ SF to energize in 2018
Impacts Updates/Changes since Last Report (Sept. 2020)
1 114449998600 32nd Avenue - George Washington High School
1 SFUSDUpgrading and relocating existing secondary service
Delays caused by dispute over primary vs. secondary. Project moving forward with low-side metering. (See Note 1)Further delays caused by dispute over PG&E's proposed design.
Energized 3/27/2018 7/3/2019 9/1/2018 Yes 500 kW/Yes X
Project delayed - project was in dispute from Feb. 2018 - Jun. 2018. (3-4 months). PG&E is currently delaying energization, SF is waiting for PG&E to finish its portion of work. Additional project costs - $150k (2 interrupters, 2 #7 boxes, & installation) PG&E's proposed design would require an additional $1M in trenching/construction costs. SF is disputing this design as PG&E is applying design requirements inconsistently.
No impacts update. Project was energized in Sept. 2020 and will be removed on next quarter's report.
2115047431/11
53227494545 Anza Street - Lafayette Elementary
1 SFUSD
New temporary service for interim trailers and replacing existing secondary service
Delays caused by dispute over primary vs. secondary. Project moving forward with secondary service.
Energized 10/9/2018 3/20/2020 7/1/2019 Yes 150 kW /Yes
Project delayed - project was in dispute from Oct. 2018 - Oct. 2019 (1 year). Temp. power service for classroom trailers will be served by PG&E at retail - $14k in lost gross revenue to SFPUC. $31k in additional power costs to the project due to PG&E's higher rates. 50,000 lbs. of CO2 emissions (temporary period of 17 months)
No impacts update. Project was energized in Sept. 2020 and will be removed on next quarter's report.
3 1181550733401 Geary Blvd. - Streetlights and Traffic Controller
1 SFMTA
New temporary service for interim trailers and replacing existing secondary service
Delays caused by PG&E providing the Service Agreement late.
Energized 11/7/2019 11/19/2019 2/3/2020 No 1 kW/Yes Pedestrian and traffic safety is at risk as PG&E delays the energization of these streetlights and traffic signals.
No impacts update. Project was energized in Jan. 2021 and will be removed on next quarter's report.
4 120533309600 Arguello Blvd. - Rossi Pool
1 SFRPDRequest for shutdown (for meter replacement)
Delays caused by PG&E providing the Service Agreement late.
Engineering estimation by PG&E.
12/11/2020 2/12/2021 4/4/2021 N/A N/A Overhead/delays costs TBD. Pool will also not be available for public use until work is done. Project added.
5 1124349423455 Van Ness Avenue - AWSS Pump Station No. 2
2 SFPUC - WaterRemove two existing services and replace with one secondary service
Delays caused by dispute over primary vs. secondary. Project moving forward with low-side metering. (See Note 1)
In construction 12/9/2016 1/5/2017 8/1/2017 Yes 144 kW/Yes X
Seismic improvements and architectural upgrades to increase reliability of the pumping station have been delayed. Additional project costs - $75k (interrupter, #7 box, & installation) Further delays caused by PG&E still not providing necessary cost detail to the Service Agreement (7 month delay).
No impacts update.
6 1147136662110 Greenwich Street - Tule Elk Elementary
2 SFUSDUpgrading and relocating existing secondary service
Delays caused by dispute over primary vs. secondary. Project moving forward with low-side metering. (See Note 1)
In construction 6/15/2018 4/2/2020 6/1/2019 Yes 300 kW/Yes Project delayed - project was in dispute from Jun. 2018 - Oct. 2019 (14-15 months)Additional project costs - $150k (2 interrupters, 2 #7 boxes, & installation)
No impacts update.
7 1156759112445 Hyde St. - Francisco Park
2 SFRPD New secondary service
Delays caused by dispute over primary vs. secondary. Project moving forward with low-side metering. (See Note 1)
In construction 1/9/2019 4/7/2020 12/27/2019 Yes 70 kW/YesProject delayed - project was in dispute from Jun. 2019 - Oct. 2019 (3-4 months). Additional project costs - $75k (interrupter, #7 box, & installation)The project expects overhead/delay costs of at least $168k (assuming a 30-day delay).
No impacts update.
8PG&E
withholding NN#
102 Marina Blvd. - Fort Mason (EVGo)
2 EVGo New secondary service
Delays caused by dispute over primary vs. secondary. Project is still in dispute.
Project is at a standstill. 12/13/2018 7/15/2019 Yes 600 kW/Yes Project delayed - project has been in dispute since Dec. 2018 (17-18 months). If required, primary switchgear would cost the project an additional $500k.
No update - project remains at a standstill.
9 117492329950 Golden Gate Avenue - Margaret Hayward Park
3 SFRPD
Remove/replace existing transformer and utility boxes and provide new single secondary service
Delays caused by dispute over primary vs. secondary. Project moving forward with low-side metering. (See Note 1)
Energized 3/15/2018 6/5/2018 4/1/2020 Yes 100 kW/Yes
Project slightly delayed - project was in dispute from Mar. 2018 - May 2018. (2-3 months)Additional project costs - $150k (2 interrupters, 2 #7 boxes, & installation)Further delays (6-8 weeks) as PG&E has informed the project of more inspections and work. The project expects overhead/delay costs of at least $330k (assuming a 40-day delay).
No impacts update. Project was energized in Sept. 2020 and will be removed on next quarter's report.
10 11502067788 Broadway - Affordable Housing (125 units)
3MOHCD (BRIDGE
Housing)
New secondary service for perm. Construction power released to PG&E retail.
Delays caused by dispute over primary vs. secondary. Project moving forward with low-side metering. (See Note 1)Further delays caused by PG&E mistake.
Energized 10/1/2018 3/19/2019 12/2/2019 N/A 500 kW/Yes
Temp. construction power service by PG&E at retail - $68k in lost gross revenue to SFPUC. $15k in additional power costs to PG&E's higher rates. Additional project costs - $150k (2 interrupters, 2 #7 boxes, & installation)90,625 lbs. of CO2 emissions (construction period of 18 months)
Temp. construction power costs updated. Project was energized in Jan. 2021 and will be removed on next quarter's report.
11 115019804735 Davis - Affordable Housing (53 units)
3MOHCD (BRIDGE
Housing)
New secondary service for perm. Construction power released to PG&E retail.
Delays caused by dispute over primary vs. secondary. Project moving forward with low-side metering. (See Note 1)
Energized 10/1/2018 3/8/2019 12/2/2019 N/A 683 kW/Yes
Temp. construction power service by PG&E at retail - $114k in lost gross revenue to SFPUC. $25k in additional power costs to the project due to PG&E's higher rates.Additional project costs - $150k (2 interrupters, 2 #7 boxes, & installation)148,837 lbs. of CO2 emissions (construction period of 19 months)
Temp. construction power costs updated. Project was energized in Nov. 2020 and will be removed on next quarter's report.
Project Status
Page 1

Attachment A: List of Interconnection Issues
PG&E NN# Project Location District #Client Organization
Project Description (what SF applied for)
Initial Application Submittal Date
App Deemed Complete Date
Initial Service Need Date
Did PG&E require Primary?
Load Size/Can Be Served at Secondary
PG&E committed to work w/ SF to energize in 2018
Impacts Updates/Changes since Last Report (Sept. 2020)Project Status
12 114088011Lake Merced Blvd & Sunset Blvd - Restroom
4 SFRPD New secondary serviceDelays caused by dispute over primary vs. secondary.
Project Cancelled 12/8/2017 1/15/2019 Yes 10 kW/Yes
Project delayed - project has been in dispute since late Aug. 2018. (4-5 months)Bathroom will not be available for public use at Lake Merced. Primary switchgear will cost the project an additional $500k in equipment costs and take the space of parking spots.
Project cancelled due to PG&E's new policy of requiring underground service for the area. The extensive costs of underground service for this bathroom is not feasible. Project will be removed in next quarter's report.
13Several
applications submitted
L Taraval - Streetlights 4 SFMTANew secondary service (several streetlights)
Delays caused by PG&E being unresponsive.
In construction 3/19/2019 4/27/2019 1/1/2020 No9.6 kW (per
service point)/Yes
Pedestrian and traffic safety is at risk as PG&E delays the energization of these streetlights. Delays continue as SF has not received construction drawings form PG&E. Project delayed - impacts TBD.
Further delays caused by PG&E.
14PG&E
withholding NN#
1351 42nd Street - Francis Scott Key Educator Housing (Construction and Perm. Power)
4MOHCD (MidPen
Housing)
New secondary service for perm. Construction power released to PG&E retail.
Delays caused by dispute over primary vs. secondary. Project is still in dispute.
Project is at a standstill.
3/30/2020 (temp)
2/24/2020 (perm)
12/7/2020 (temp)
12/6/2021 (perm)
Yes
417 kW/Yes (temp)
678 kW/Yes (perm)
Project delayed - project has been in dispute since Apr. 2020 (10-11 months). Temp. construction power service by PG&E at retail - $118k in lost gross revenue to SFPUC. $25k in additional power costs to the project due to PG&E's higher rates.
Impacts updated to show cost impact of construction power being turned over to PG&E to avoid further delays.
15 11457107950 Bowling Green Drive - GGP Tennis Center
5 SFRPD New secondary service
Delays caused by dispute over primary vs. secondary. Project moving forward with low-side metering. (See Note 1)
Energized 5/3/2018 10/3/2018 2/1/2019 Yes 160 kW/Yes X
Project delayed - project was in dispute from May-July. 2018. (2-3 months)Additional project costs - $150k (2 interrupters, 2 #7 boxes, & installation), $275k (for upgrades to PG&E's system) Lost gross revenue to SFPUC due to delays: $1kFurther delays may lead to possible funding issues.
No impacts update. Project was energized in Oct. 2020 and will be removed on next quarter's report.
16 1149079231251 Turk Street - Affordable Housing Fire Pump
5 MOHCD (TNDC) New secondary serviceDelays caused by PG&E not providing necessary cost detail.
SF working on updated application. 8/17/2018 8/10/2019 2/17/2019 No 27 kW/Yes
Project delayed - PG&E initially required distribution upgrades of $250k plus trenching costs for a fire pump service that brings the existing affordable housing development up to code. For over a year, SF was waiting for further cost justification from PG&E. PG&E and SF have now agreed to an electrical design that will not require the extra upgrades to PG&E's system.
No impacts update.
17 1181550151805 Geary Blvd. -Streetlights and Traffic Signal
5 SFMTA New secondary serviceDelays caused by PG&E providing the Service Agreement late.
Energized 11/7/2019 11/19/2019 2/2/2020 No 1 kW/Yes Pedestrian and traffic safety is at risk as PG&E delays the energization of these streetlights and traffic signals.
No impacts update. Project was energized in Oct. 2020 and will be removed on next quarter's report.
18PG&E
withholding NN#
78 Haight Street - Affordable Housing
5 MOHCD (TNDC)
New secondary service for perm. Construction power released to PG&E retail.
Delays caused by dispute over primary vs. secondary. Project is still in dispute.
Project is at a standstill. 6/15/2020 12/15/2021 Yes 315 kW/Yes
Project delayed - project has been in dispute since Jun. 2020 (8-9 months) PG&E is requiring primary for the construction power and the permanent service. Temp. construction power service by PG&E at retail - $38k in lost gross revenue to SFPUC. $6k in additional power costs to the project due to PG&E's higher rates.
Impacts updated to show cost impact of construction power being turned over to PG&E to avoid further delays.
19Several
applications submitted
Haight Street Traffic Signals
5 SFMTANew secondary services (several traffic signals)
Delays caused by PG&E cancelling the initial applications.
In construction 4/22/2020 7/16/2020 11/30/2020 Yes
Project delayed as PG&E cancelled the original applications. Public safety is at risk as the traffic signal infrastructure is completed and are just awaiting energization. The public has been inquiring about signal activation status. The traffic signals are moving forward, but there are disagreements on whether or not unmetered holiday lighting can be added to these poles.
Impacts updated to include possible issues with holiday lighting.
20 1117296956 Berry Street - Substation
6 SFMTAUpgrade existing primary service
Delays caused by PG&E being unresponsive, changing requirements, and being non-transparent with costs and design changes.
Energized 6/17/2016 12/12/2016 5/1/2017 N/A 3000 kW/Yes
SFMTA completed the conduit boring under the rails prior to PG&E's approval. As such, parties disagree on costs and design requirements. SFMTA claims that they are incurring delay claims costs from contractor due to PG&E's failure to approve design and equipment submittals. (actual costs are still to be determined, but the costs continue to increase on a daily basis)
No impacts update. Project was energized in June 2020. The project team will be reaching out to connect the power the permanent substation in early 2021.
21 113826990750 Brannan - Main Library Repository
6 SFPW for SFPLIncrease load request (237 kW to 500 kW)
Dispute over how to process increase in load request.
Service Agreement returned with payment by SFPUC.
11/14/2017 1/18/2018 1/1/2018 No 500 kW/YesPlans for a new HVAC system at the library repository have been delayed. No monetary impact - however, SF believes that PG&E's requirements for approving load increase for muni loads is extensive and will cause delays to projects.
No impacts update.
22 118152147399 The Embarcadero - Fire Boat #35
6 SFFD New secondary service
Delays caused by dispute over primary vs. secondary. Project moving forward with low-side metering. (See Note 1)
In construction 1/14/2019 2/8/2020 12/27/2019 Yes 430 kW/Yes Project delayed - project was in dispute from Jan. 2019 - Oct. 2019 (8-9 months). Additional project costs - $150k (2 interrupters, 2 #7 boxes, & installation)
No impacts update.
23 115071498555 Larkin (formerly 500 Turk) - Affordable Housing (108 units)
6 MOHCD (TNDC)
New secondary service for perm. Construction power released to PG&E retail.
Delays caused by dispute over primary vs. secondary. Project moving forward with low-side metering. (See Note 1)
In construction 10/15/2018 12/18/2019 7/1/2020 Yes 890 kW/Yes
Project delayed - project was in dispute from Nov. 2018 - Oct. 2019 (11-12 months). Temp. construction power service by PG&E at retail - $196k in lost gross revenue to SFPUC. $24k in additional power costs to the project due to PG&E's higher rates.Additional project costs - $150k (2 interrupters, 2 #7 boxes, & installation)243,000 lbs. of CO2 emissions (construction period of 22 months)
Temp. construction power costs updated.
24 116790877Market St. & 7th St - BMS Switch
6 SFMTA New secondary service
Delays caused by PG&E not following WDT timelines and not providing cost explanations.
Service Agreement issued by PG&E.
3/6/2019 4/9/2019 1/4/2021 No 48 kW/Yes Project delayed - PG&E was late in providing the service agreement and has been unresponsive in providing further cost explanation.
No impacts update.
25 TBD1064 Mission St. - Affordable Housing (256 units)
6MOHCD (Mercy
Housing)
New secondary service for perm. Construction power released to PG&E retail.
Delays caused by dispute over primary vs. secondary. Project moving forward with low-side metering. (See Note 1)
In construction 3/28/2019 12/18/2019 4/1/2021 Yes 678 kW/Yes
Project delayed - project was in dispute from Feb. 2019 to Oct. 2019 (7-8 months). Additional project costs - $150k (2 interrupters, 2 #7 boxes, & installation)Temp. construction power service by PG&E at retail - $105k in lost gross revenue to SFPUC. $23k in additional power costs to the project due to PG&E's higher rates. 142,000 lbs. of CO2 emissions (construction period of 18 months)
Temp. construction power costs updated.
Page 2

Attachment A: List of Interconnection Issues
PG&E NN# Project Location District #Client Organization
Project Description (what SF applied for)
Initial Application Submittal Date
App Deemed Complete Date
Initial Service Need Date
Did PG&E require Primary?
Load Size/Can Be Served at Secondary
PG&E committed to work w/ SF to energize in 2018
Impacts Updates/Changes since Last Report (Sept. 2020)Project Status
26 N/ATransbay Transit Center - Transbay Joint Powers Authority
6 SFPUC - PowerTwo new primary services (5 MW each)
Potential dispute over reserved capacity.
Energized - PG&E reviewing SF's request. 9/12/2018 2/6/2019 10/1/2018 N/A 10 MW/No
PG&E is currently reviewing SF's request to use 10 MW of reserved capacity that SF applied and paid for. If PG&E denies request, SF may incur additional costs or have to limit the tenants. PG&E is holding up the project by not explaining the discrepancies between its System Impact Study draft agreement to what SF had requested.
Delays continue as PG&E has still not adequately responded to SF's questions regarding load calculations in the System Impact Study draft agreement.
27 114491666
Mission Rock & Terry Francois Blvd. - Redevelopment Project
6 SFPUC - Power New primary serviceDelays caused by PG&E being late in providing Service Agreement.
Draft Facility Study agreement issued by PG&E.
4/9/2018 4/20/2018 8/1/2019 N/A 7300 kW/No Project delayed - PG&E should have provided the Service Agreement by end of August 2019. No impacts update.
28 11779502416 Sherman Street - Victoria Park Lighting
6 SFRPDUpgrading existing secondary service
Delays caused by PG&E providing the Service Agreement late.
In construction 10/30/2019 11/20/2019 2/15/2020 N/A 42 kW/Yes Park safety is at risk as PG&E caused delays to the energization of these lighting fixtures. Further delays will prevent re-opening of the park and leave SFUSD students without a playground.
No impacts update.
29PG&E
withholding NN#
180 Jones Street - Affordable Housing
6 MOHCD (TNDC)
New secondary service for perm. Construction power released to PG&E retail.
Delays caused by dispute over primary vs. secondary. Project is still in dispute.
Project is at a standstill. 4/28/2020 9/5/2022 Yes 576 kW/YesProject delayed - project has been in dispute since May 2020 (9-10 months). Temp. construction power service by PG&E at retail - $89k in lost gross revenue to SFPUC. $20k in additional power costs to the project due to PG&E's higher rates.
Impacts updated to show cost impact of construction power being turned over to PG&E to avoid further delays.
30PG&E
withholding NN#
266 4th Street - Affordable Housing
6 MOHCD (TNDC) New secondary service
Delays caused by dispute over primary vs. secondary. Project is still in dispute.
Project is at a standstill. 6/15/2020 12/1/2021 Yes 700 kW/Yes Project delayed - project has been in dispute since June 2020 (8-9 months). No impacts update.
31PG&E
withholding NN#
750 Eddy Street - City College Building
6 CCSFUpgrade and relocation of existing secondary service
Delays caused by dispute over primary vs. secondary. Project is still in dispute.
Project is at a standstill. 11/9/2020 12/30/2021 258 kW/Yes Project delayed - project has been in dispute since Nov. 2020 (2-3 months) Project added.
32PG&E
withholding NN#
600 7th Street - Affordable Housing
6 MOHCD New secondary service
Delays caused by dispute over primary vs. secondary. Project is still in dispute.
Project is at a standstill. 1/19/2021 5/21/2023 847 kW/Yes Project delayed - project has been in dispute since Feb. 2021 (1-2 months) Project added.
33PG&E
withholding NN#
2685 Ocean Ave. - EV Charging Station
7 SFMTA & EVGo New secondary service
Delays caused by dispute over primary vs. secondary. Project is still in dispute.
Project is at a standstill. 2/4/2019 7/22/2019 Yes 600 kW/Yes Project delayed - project has been in dispute since Feb. 2019 (16-17 months). If required, primary switchgear would cost the project an additional $500k.
No impacts update. PG&E has cancelled this application.
34 TBD5 Lenox Way - West Portal Elementary School
7 SFUSDUpgrade existing secondary service
Delays caused by dispute over primary vs. secondary. Project moving forward with low-side metering. (See Note 1)
Service Agreement issued by PG&E.
7/26/2019 3/10/2020 6/14/2021 N/A 400 kW/Yes Project delayed - project was in dispute from July 2019 - Oct. 2019 (2-3 months)Additional project costs - $150k (interrupter, #7 box, & installation)
No impacts update.
35PG&E
withholding NN#
2101 Sloat Boulevard - Construction Trailers (Westside Pump Station)
7 SFPUC New secondary service
Delays caused by dispute over primary vs. secondary. Project will move forward with secondary service.
SF preparing revised application.
12/17/2020 2/1/2021 75 kW/YesProject delayed - project was in dispute from Jan. 2021-Mar.2021 (2-3 months)Due to the urgency of the project, the project team will need to use generators while PG&E processes the service application (estimated generator costs of $6000/month)
Project added.
36 113135782350 Amber Drive - Police Academy
8 SFPW for SFPDUpgrade existing secondary service
Delays caused by dispute over primary vs. secondary. Project moving forward with low-side metering. (See Note 1)
Service Agreement returned with payment by SFPUC.
8/8/2017 5/22/2018 TBD FYE22 Yes 160 kW/Yes XProject delayed - project was in dispute from Dec. 2017 - May 2018 (6 months). Additional project costs - $75k (interrupter, #7 box, & installation)
No impacts update. SF has asked PG&E for a project extension.
37 1137739961419 Bryant Street - Animal Care & Control
9 SFPW for GSA New secondary service
Delays caused by dispute over primary vs. secondary. Project moving forward with primary.
Energized 10/25/2017 2/12/2019 8/1/2020 Yes 818 kW/YesAdded costs for primary equipment - $353kAdditional construction costs - $150kCosts of redesign - $23k
No impacts update. Project was energized in Oct. 2020 and will be removed on next quarter's report.
38 1146711412060 Folsom Street - Affordable Housing (127 units)
9 MOHCD (MEDA)
New secondary service for perm. Construction power released to PG&E retail.
Delays caused by dispute over primary vs. secondary. Project moving forward with low-side metering. (See Note 1)
Energized 5/18/2018 3/14/2019 1/15/2020 Yes 1387 kW/Yes
Project delayed - project was in dispute from Jun. 2018 - Nov. 2018 (4-5 months)Costs for redesign (primary service with low-side metering) - $2-3kTemp. construction power service by PG&E at retail - $295k in lost gross revenue to SFPUC. $53k in additional power costs to project due to PG&E's higher rates.Additional project costs - $150k (2 interrupters, 2 #7 boxes, & installation)385,000 lbs. of CO2 emissions (construction period of 22 months)
Temp. construction power costs updated. Project was energized in Feb. 2021 and will be removed on next quarter's report.
39PG&E
withholding NN#
681 Florida Street - Affordable Housing (131 units)
9 MOHCD (MEDA)
New secondary service for perm. Construction power released to PG&E retail.
Delays caused by dispute over primary vs. secondary. Project moving forward with low-side metering. (See Note 1)
In construction 2/6/2019 8/3/2020 Yes 785 kW/Yes
Project delayed - project was in dispute from Feb. 2019 - Oct. 2019 (7-8 months). Temp. construction power service by PG&E at retail - $59k in lost gross revenue to SFPUC. $12k in additional power costs to project due to PG&E's higher rates. Additional project costs - $150k (2 interrupters, 2 #7 boxes, & installation)77,000 lbs. of CO2 emissions (construction period of 15 months)
Temp. construction power costs updated.
Page 3

Attachment A: List of Interconnection Issues
PG&E NN# Project Location District #Client Organization
Project Description (what SF applied for)
Initial Application Submittal Date
App Deemed Complete Date
Initial Service Need Date
Did PG&E require Primary?
Load Size/Can Be Served at Secondary
PG&E committed to work w/ SF to energize in 2018
Impacts Updates/Changes since Last Report (Sept. 2020)Project Status
40 1143450331990 Folsom Street - Affordable Housing (143 units)
9 MOHCD (MEDA)
New secondary service for perm. Construction power released to PG&E retail.
Delays caused by dispute over primary vs. secondary. Project moving forward with low-side metering. (See Note 1)
In construction 2/26/2018 3/14/2019 9/1/2020 Yes 920 kW/Yes
Project delayed - project was in dispute from Mar. 2018 - Nov. 2018. (7-8 months)Costs for redesign (primary service with low-side metering) - $2-3kTemp. construction power service by PG&E at retail - $181k in lost gross revenue to SFPUC. $38k in additional power costs to project due to PG&E's higher rates. Additional project costs - $150k (2 interrupters, 2 #7 boxes, & installation)247,000 lbs. of CO2 emissions (construction period of 21 months)
Temp. construction power costs updated.
41 1151484463001-3021 24th St. - Affordable Housing (44 units)
9MOHCD (Mercy
Housing)New secondary service
Delays caused by dispute over primary vs. secondary. Project moving forward with low-side metering. (See Note 1)
Project went to PG&E retail.
11/1/2018 9/1/2020 Yes 362 kW/Yes Project delayed - project was in dispute from Nov. 2018 to Oct. 2019 (10-11 months).
This project will take PG&E retail power. PG&E has agreed to low-side metering for this project, but the project has been delayed for too long and the process/planning time for low-side metering is no longer viable to meet project deadlines. Cost impacts TBD.
42PG&E
withholding NN#
300 Bartlett Street - Mission Branch Library
9 SFPL New secondary service
Delays caused by dispute over primary vs. secondary. Project is still in dispute.
Project is at a standstill. 2/26/2020 9/1/2020 Yes 190 kW/Yes Project delayed - project has been in dispute since Feb. 2020 (12-13 months). If required, primary switchgear would cost the project an additional $500k.
Delays continue as PG&E is still requiring primary switchgear for this project.
43 111975801800 Amador Street - Pier 94 - Backlands
10 SFPORT New secondary service
PG&E required primary. Project is moving forward with primary service.
Service Agreement issued by PG&E, but issues remain on land rights. (Project now on hold due to COVID emergency response)
8/19/2016 8/28/2018 2/1/2017 Yes 166 kW/Yes X
Added costs for primary equipment (overhead) - $500kThe Port is investing over $8M in upgrading the 16-acre parcel in the Backlands project site. The Port is expected to generate approximately $250k in monthly rent revenue from this site. Significant delays to this project can cause the Port to lose $3M in revenue annually. Additional staff time for Port - $50kCosts of redesign - $50k
This project is now on hold. This location has been used for the emergency shelters for the homeless in response to COVID. The issues regarding the permanent power service still remain. The Port plans to maintain the temporary service until the permanent service is available.
44 112774763Illinois St. & Terry Francois - Mariposa Pump Station
10SFPUC -
Wastewater
Relocate existing secondary service (for construction)
Delays caused by PG&E requiring primary. Project went to PG&E retail to avoid anymore delays.
Due to the delays, the project is going to take PG&E retail service.
4/13/2017 6/1/2018 Yes 169 kW/Yes X
Temp. construction power service by PG&E at retail - $588k in lost gross revenue to SFPUC. PG&E delaying temp. power - project team is potentially facing contract delay costs of $1k/day. $22k in additional power costs to the project due to PG&E's higher rates. 554,000 lbs. of CO2 emissions (construction period of 36 months)SF anticipates that generators will cost $100k/month until PG&E energizes retail power.
Further delays - PG&E is not providing temporary power on time. The project team is looking into mitigating construction contract delay costs by using a generator.
45 114408260684 23rd Street - Potrero North
10 SFPUC - Power New primary serviceDelays caused by PG&E cancelling the application.
Project is at a standstill. 3/12/2018 10/1/2018 N/A 12,000 kW/No Project delayed - PG&E denied this service request citing inadequate capacity and cancelled the application.
No impacts update - PG&E refuses to provide service.
46 114408263638 23rd Street - Potrero South
10 SFPUC - Power New primary serviceDelays caused by PG&E cancelling the application.
Project is at a standstill. 3/12/2018 10/1/2018 N/A 12,000 kW/No Project delayed - PG&E denied this service request citing inadequate capacity and cancelled the application.
No impacts update - PG&E refuses to provide service.
47 1147137871001 22nd Street - Bus Electrification Pilot
10 SFMTA New primary serviceDelays caused by PG&E being late in providing the Service Agreement.
Service agreement issued by PG&E. 6/18/2018 2/14/2019 5/1/2019 N/A 2400 kW/Yes
Initially, PG&E was unresponsive in scheduling a pre-application meeting which has caused some delays. PG&E was also late in providing a deemed complete date for the application and several months late in providing the Service Agreement. PG&E caused another 4-month delay to redesign for a PG&E error in the original design.
Further delays incurred as PG&E had to perform a redesign due to a PG&E error in the initial design. SF needs this to be energized as the charge stations will be finished with construction in May 2021.
48 1146712001995 Evans - Traffic Controls and Forensics
10 SFPW for SFPD New secondary service
Delays caused by dispute over primary vs. secondary. Project moving forward with low-side metering. (See Note 1)
In construction 5/18/2018 9/3/2019 3/1/2020 Yes 2100 kW/Yes
Project delayed - project was in dispute from Jun. 2018 to August. 2019 (13-14 months). Temp. construction power service by PG&E at retail has been delayed causing the project team to use generatorsAdditional project costs - $75k (interrupter, #7 box, & installation) Generator costs for temp power: $578kAdditional delays caused by pole location issues.
No impacts update.
49 110162018750 Phelps - Southeast Plant
10SFPUC-
WastewaterNew primary service
Potential delay as PG&E is late in providing SIS agreement.
Service agreement issued by PG&E. (SF does not agree that PG&E has provided sufficient info).
IN FLIGHT (Prior to July 2015)
7/14/2018 5/20/2020 N/A 12000 kW/noIf delays continue and jeopardize the project energization date, the project team will incur a liquidated damage amount of $3000/day. Further delays caused by PG&E not providing enough design detail with the Service Agreement.
Delays continue as PG&E has started changing its application processes and has yet to provide sufficient information for SF to review and provide payment for.
50 1145465732401/2403 Keith Street - Southeast Health Center
10 SFPW for SFDPH New secondary service
Delays caused by dispute over primary vs. secondary. Project moving forward with low-side metering. (See Note 1)
In construction 4/27/2018 11/14/2019 7/26/2020 Yes 200 kW/Yes Project delayed - project was in dispute from May 2018 - Oct. 2019 (16-17 months).Additional project costs - $150k (2 interrupters, #7 box, & installation)
No impacts update.
51 1154151161550 Evans Ave. - Southeast Community Center
10 SFPUCRelocation and upgrade of existing secondary service
Delays caused by dispute over primary vs. secondary. Project moving forward at low-side metering. (See Note 1)
In construction 11/26/2018 5/22/2019 1/4/2021 Yes 800 kW/Yes
Project delayed - project was in dispute from Dec. 2018 - Oct. 2019 (8-9 months). PG&E is now 2 months late in providing the Service Agreement. Added costs for primary equipment - $500kTemp. construction power service by PG&E at retail - $187k in lost gross revenue to SFPUC. $9k in additional power costs to project due to PG&E's higher rates.
No impacts update.
52 TBDIslais Creek Bridge Rehab (3rd Street)
10 SFPW New secondary service
Delays caused by dispute over primary vs. secondary. Project moving forward with low-side metering. (See Note 1)
Updated application submitted to PG&E.
4/2/2019 5/1/2021 Yes 104 kW/Yes Project delayed - project was in dispute from Mar. 2019 - Oct. 2019 (6-7 months). Additional project costs - $75k (interrupter, #7 box, & installation)
No impacts update.
53PG&E
withholding NN#
1150 Phelps - Construction Trailers
10 SFPUC New secondary service
Delays caused by dispute over primary vs. secondary. Project is still in dispute.
Project is at a standstill. 5/1/2019 6/1/2019 N/A 472 kW/Yes Project delayed - project has been in dispute since May 2019 (14-15 months)If required, primary switchgear would cost the project an additional $500k.
No update - project is still at a standstill. PG&E has cancelled this application.
Page 4
Attachment A: List of Interconnection Issues
PG&E NN# Project Location District #Client Organization
Project Description (what SF applied for)
Initial Application Submittal Date
App Deemed Complete Date
Initial Service Need Date
Did PG&E require Primary?
Load Size/Can Be Served at Secondary
PG&E committed to work w/ SF to energize in 2018
Impacts Updates/Changes since Last Report (Sept. 2020)Project Status
54 114721804480 22nd Street - Pier 70 Pump Station
10 SFPUC - Power New primary serviceDelays caused by PG&E being late in providing Service Agreement.
Engineering estimation by PG&E.
6/14/2018 10/26/2018 1/1/2019 N/A 2000 kW/Yes Project delayed - PG&E should have provided Service Agreement by end of August 2019. No impacts update. PG&E has cancelled this application.
55 1128752271601 Griffith Street - Griffith Pump Station
10 SFPUC - WaterShutdown & re-energization
Delays caused by PG&E providing energization late.
Energized - Cost impacts due to delay in energization.
N/A N/A N/A N/A N/AProject delayed - PG&E pushed back the energization date by 2 weeks. Due to PG&E's delay, the project had to use generators for an additional 2 weeks costing $27k.
No impacts update.
56 114919920Harmonia Street - Sunnydale HOPE
10 SFPUC - Power New primary service Potential dispute over reserved capacity.
System Impact Study phase of engineering estimation by PG&E.
8/16/2018 4/4/2019 8/1/2020 N/A 1000 kW/Yes
Delays caused by PG&E not responding to SF's questions regarding load calculations in the System Impact Study draft agreement. Due to the urgency of the project, SF has agreed to move forward with PG&E's lower load calcs and will apply to PG&E for additional capacity when the load ramps up. Costs of this are TBD.
Impacts updated to show unknown costs that will be incurred when the load at this site ramps up.
57 1155838201101 Connecticut Street - HOPE Potrero
10 SFPUC - Power New primary service Potential dispute over reserved capacity.
System Impact Study phase of engineering estimation by PG&E.
12/13/2018 4/4/2019 6/1/2019 N/A 4000 kW/No
Delays caused by PG&E not responding to SF's questions regarding load calculations in the System Impact Study draft agreement. Due to the urgency of the project, SF has agreed to move forward with PG&E's lower load calcs and will apply to PG&E for additional capacity when the load ramps up. Costs of this are TBD.
Impacts updated to show unknown costs that will be incurred when the load at this site ramps up.
58 113804831
603 Jamestown Avenue - Redevelopment Project
10 SFPUC-Power New primary serviceDelays caused by PG&E being late in providing Service Agreement.
Service agreement issued by PG&E. (SF does not agree that PG&E has provided sufficient info).
11/2/2017 2/26/2018 10/1/2018 N/A 8000 kW/No Delays caused by PG&E not providing the Service Agreement on time. Further delays caused by PG&E not providing enough design detail with the Service Agreement.
Delays continue as PG&E has started changing its application processes and has yet to provide sufficient information for SF to review and provide payment for.
59 116967240702 Phelps Street - SFMTA Substation
10 SFMTA Request to increase loads
Delays caused by PG&E being late in providing the System Impact Study report.
Service agreement issued by PG&E. (SF does not agree that PG&E has provided sufficient info).
2/26/2019 6/28/2019 5/1/2019 N/A 4000 kW/NoDelays caused by PG&E not providing the System Impact Study report on time. More delays caused by PG&E not providing the Service Agreement on time. Further delays caused by PG&E not providing enough design detail with the Service Agreement.
Delays continue as PG&E has started changing its application processes and has yet to provide sufficient information for SF to review and provide payment for.
60 117429711800 Jerrold Avenue - Biosolids (Temp. power)
10SFPUC-
WastewaterNew primary service
Delays caused by PG&E being late in providing the Service Agreement.
In construction 5/16/2019 6/28/2019 10/1/2019 N/A 1441 kW/No Delays caused by PG&E not providing the Service Agreement on time. No impacts update.
61 117974199901 Tennessee Street - Streetlights
10 SFMTA New secondary serviceDelays caused by PG&E providing the Service Agreement late.
In construction 2/1/2019 11/20/2019 8/1/2019 No 1 kW/Yes Pedestrian and traffic safety is at risk as PG&E delays the energization of these streetlights and traffic signals.
No impacts update.
62 N/A1508 Bancroft Ave. - Sustainable Streets Shops
10 SFMTA
Request for information on existing PG&E power supply and approval from PG&E to use the current breakers
Delays caused by PG&E being unresponsive.
Information received from PG&E.
4/6/2018 N/A 10/21/2019 No N/A Potential power issue - SF cannot confirm that the current power system is properly protected without PG&E's response to the information requested.
No impacts update.
63PG&E
withholding NN#
1001 Potrero Avenue - UCSF/SFGH Research & Academic Building Construction and Perm Power
10 UCSF/SFGH
New primary service for perm. Construction power released to PG&E retail.
Delays caused by dispute over primary vs. secondary for construction power. Construction power moving forward with PG&E retail.
SF waiting for PG&E System Impact Study Report.
5/20/2020 (temp)
4/1/2020 (perm)
1/1/2021 Yes 417 kW/YesProject delayed - construction power was in dispute from Jun. 2020 to Sept. 2020 (4 months).Temp. construction power service by PG&E at retail - $287k in lost gross revenue to SFPUC. $30k in additional power costs to the project due to PG&E's higher rates.
No impacts update.
64 1145297501920 Evans - Arborist Trailer/BUF Yard
10 DPW New secondary service Delays caused by issues with overhead poles.
Engineering estimation by PG&E.
4/16/2018 8/10/2018 10/1/2018 No 37 kW/Yes Project has been delayed due to issues with an overhead pole. PG&E's proposed design was not feasible as it required overhead poles to be installed above underground sewer utilities.
No impacts update.
65PG&E
withholding NN#
4840 Mission Street - Affordable Housing (Construction and Perm. power)
11MOHCD (BRIDGE
Housing)
New secondary service for perm. Construction power released to PG&E retail.
Delays caused by dispute over primary vs. secondary. Project is still in dispute.
Project is at a standstill. 2/5/2020 11/1/2022 Yes 1621 kW/YesProject delayed - project has been in dispute since Feb. 2020 (12-13 months).Temp. construction power service by PG&E at retail - $301k in lost gross revenue to SFPUC. $47k in additional power costs to the project due to PG&E's higher rates.
Temp. construction power costs updated. Delays continue as PG&E is still requiring primary switchgear for this project.
66PG&E
withholding NN#
35-45 Onondaga Avenue - Health Clinic
11Real Estate (for
DPH)
Upgrade and relocation of existing secondary service
Delays caused by dispute over primary vs. secondary. Project is moving forward at secondary.
Engineering estimation by PG&E.
6/1/2020 3/8/2021 Yes 144 kW/Yes Project delayed - project was in dispute from Jun. 2020 - Mar. 2020 (8-9 months). No impacts update.
67PG&E
withholding NN#
455 Athens Street - Cleveland Elementary School
11 SFUSDUpgrade and relocation of existing secondary service
Delays caused by dispute over primary vs. secondary. Project is still in dispute.
Project is at a standstill. 10/26/2020 6/1/2021 305 kW/Yes Project delayed - project has been in dispute since Nov. 2020 (3-4 months) Project added.
68PG&E
withholding NN#
241 Oneida Ave. - Denman Middle School
12 SFUSD New secondary service
Delays caused by dispute over primary vs. secondary. Project moving forward with low-side metering. (See Note 1)
Project Cancelled 9/6/2019 6/7/2021 Yes 1250 kW/Yes Project delayed - project was in dispute from Sept. 2019 to Dec. 2019 (2-3 months)Additional project costs - $75k (interrupter, #7 box, & installation)
Project cancelled - will be removed on next quarter's report.
Page 5

Attachment A: List of Interconnection Issues
PG&E NN# Project Location District #Client Organization
Project Description (what SF applied for)
Initial Application Submittal Date
App Deemed Complete Date
Initial Service Need Date
Did PG&E require Primary?
Load Size/Can Be Served at Secondary
PG&E committed to work w/ SF to energize in 2018
Impacts Updates/Changes since Last Report (Sept. 2020)Project Status
69PG&E
withholding NN#
2340 San Jose Ave. - Affordable Housing
12MOHCD (Mission
Housing)New secondary service
Delays caused by dispute over primary vs. secondary. Project is still in dispute.
Project is at a standstill. 11/21/2019 5/1/2020 Yes 800 kW/YesProject delayed - project has been in dispute since Jan. 2020 (13-14 months)Temp. construction power service by PG&E at retail - $191k in lost gross revenue to SFPUC. $34k in additional power costs to the project due to PG&E's higher rates.
Temp. construction power costs updated. Delays continue as PG&E is still requiring primary switchgear for this project.
70 N/AMultiple Locations - Guy Wires (Franchise Issue)
N/ASFMTA, SFPW, &
SFPUCPG&E's guy wires are impeding on SF projects.
Franchise disputeProject is moving forward. N/A N/A N/A N/A N/A
PG&E's unresponsiveness in removing guy wires is an obstruction to SF projects. 1) SFMTA cannot install a pole replacement to promote safety. 2) SFPW cannot construct a new ADA curb ramp. 3) SFPUC cannot finish parts of construction at the Southeast Water Treatment Plant.
Delay continues for two of the requests. SF and PG&E will continue to work together to get these resolved.
71 N/AMultiple Service Transfers
N/A Various City Depts. Service Transfers
Delays caused by PG&E requiring unnecessary equipment or information for service transfer requests.
Project is at a standstill. N/A N/A N/A N/A N/A
Additional costs and staff resources can be incurred if PG&E continues to create barriers for SF service transfer requests. SF continues to experience loss of revenue and increased greenhouse gas emissions as PG&E is refusing to transfer over City department loads.
Delays continue as projects remain at a standstill.
72 N/A10501 Warnerville Road - Substation Rehabilitation Project
N/A - Oakdale
SFPUCRemove two existing services and replace with one secondary service
Delays caused by dispute over primary vs. secondary. Project is still in dispute.
Project went to PG&E retail.
12/26/2018 N/A 3/1/2019 Yes 160 kW/Yes Project delayed - project was in dispute from Jan.- May 2019 (4 -5 months). Project will now be served by PG&E retail service to avoid delays. Cost impacts and greenhouse gas emission impacts are TBD.
73 N/A951 Antoinette Lane - Well Pump & Control Panel
N/A - South SF
SFPUCRemove two existing services and replace with one secondary service
Delays caused by dispute over primary vs. secondary. Project is still in dispute.
Project is at a standstill. 11/20/2020 N/A 12/6/2021 Yes 50 kW/Yes Project delayed - project was in dispute since Feb. 2021 (1 month). Project added.
Notes: 1. Low-side metering is not the same as secondary service. Low-side metering requires extra equipment costs (i.e. an interrupter, approx. $75k). The SFPUC believes that many of these loads should be served with secondary service, but has compromised with PG&E to move projects forward. 2. Cost impacts related to lost revenue are estimates calculated off of projected load values. 3. Not all cost impacts are reflected here as increased facility and construction costs are still to be determined. 3. CO2 emissions are calculated using estimated loads with PG&E's 2016 emissions factor. 4. Delay impacts are only calculated off of the time in which PG&E and SF were in dispute. (Other delays are not included)5. Primary switchgear is estimated to cost an additional $500k.
KeyProject is currently being disputed or has been delayed due to a dispute/issue and is past the Initial Service Need Date (Column K).Energized, but still facing issues. Project is moving forward, but not yet energized. Some are still facing major delays. Please review the impact column for further descriptions.Project has been energized - no outstanding issues.
Page 6

!
!
!
!!
!
!
!
!
!!
!!
!
!
!
!
!
!
!
!
!
!
!
!
!
!
!
!!
!
!
!
!
!
!
!
!!
!
! !!
!
!!
!
!
!
!
!
!
!
!
!
!
!
!
!
!
!
!
!!
!
!
!!!!!
!
!
!!!!
!!
!
!
!!
!!
!
!
!
!!!
!
!!!! !
!!
! !!!! !
!
! !!!!
!!!
!
!!
!
!!!
!
!!
!
!!!!!!!!!!!
!
!!!!!!!!!!!!!
!
!
!
!
!
!!
!
!
!
!
HOUSING INFRASTRUCTURE HEALTH AND SAFETY
INSTITUTION RECREATION
LAFAYETTE ELEMENTARY
SFPUC METERED SERVICE POINT
ATTACHMENT B – MAP OF INTERCONNECTION ISSUES
Renovations or upgrades to any of these service points could trigger service disputes and delays.
AS OF APRIL 2021
EV CHARGING
EV CHARGING
WEST PORTALSCHOOL
DENMAN MIDDLE SCHOOL
TRAFFIC CONTROLTRAFFIC CONTROL
TRAFFIC SIGNALS
CONSTRUCTION TRAILERS
CLEVELAND ELEMENTARY
ARBORIST TRAILER
HEALTH RESEARCH BUILDING
AFFORDABLE HOUSING
AFFORDABLE HOUSING
SFMTA SUBSTATION
VICTORIA PARK
CITY COLLEGE
FIRE PUMP
POTRERO NORTH
POTRERO SOUTH
SOUTHEAST HEALTH CENTER
POLICE ACADEMY
MARIPOSA PUMP STATION
TRAFFIC CONTROL & FORENSICS
GEORGE WASHINGTON HIGH SCHOOL
SOUTHEAST COMMUNITY CENTER SOUTHEAST PLANT
BACKLANDS POWER
MARGARET HAYWARD PARK GGP TENNIS
CENTER
AFFORDABLEHOUSING
AFFORDABLEHOUSING TRANSBAY
TRANSIT CENTER
AFFORDABLE HOUSING
AFFORDABLE HOUSING
AFFORDABLE HOUSING
FIRE BOAT BERTHING
MTA SUBSTATION
FRANCISCO PARK
PARK RESTROOM
AFFORDABLEHOUSING
TULE ELK SCHOOL
BUS ELECTRICIFICATION PILOT
LIBRARY REPOSITORY
AFFORDABLEHOUSING
ANIMAL CARE& CONTROL
AFFORDABLEHOUSING
BRIDGE REHAB
TRAFFICCONTROL
CONSTRUCTIONTRAILERS
REDEVELOPMENT/HOUSING
PIER 70 PUMP STATION
GRIFFITH PUMP STATION
AFFORDABLE HOUSING
AFFORDABLE HOUSING
REDEVELOPMENT/HOUSING
BIOSOLIDS TEMP. POWER
AFFORDABLE HOUSING
STREETLIGHTS
SUSTAINABLE STREET SHOPS
MISSION BRANCH LIBRARY STREETLIGHTS
AFFORDABLE HOUSING
AFFORDABLE HOUSING
AFFORDABLEHOUSING
HEALTH CLINIC
AFFORDABLEHOUSING
ROSSI POOL

Attachment C: Cost Impacts
A B C D E F G H I J
Project Location Redesign
Costs
Primary or Low-side Metering
Equipment Costs
Additional Construction
Costs
Additional Costs to
Project for PG&E retail
service
Additional Const./Project
Mgmt Costs Due to Delay
Additional Staff Time
Costs
Total Additional Project Costs
(B+C+D+E+F+G)
Lost gross revenue to
SFPUC
CO2 Emissions (lbs.) from PG&E retail service
1 600 32nd Avenue - George Washington High School $ 150,000 1,000,000$ $ 1,150,000 2 4545 Anza - Lafayette Elementary $ 31,000 $ 31,000 $ 14,000 50,000 3 3401 Geary Boulevard - Streetlights & Traffic Controller $ - 4 600 Arguello Blvd. - Rossi Pool $ - 5 3455 Van Ness Avenue - AWSS Pump Station No. 2 $ 75,000 $ 75,000 6 2110 Greenwich Street - Tule Elk Elementary $ 150,000 $ 150,000 7 2445 Hyde Street - Francisco Park $ 75,000 $ 168,000 $ 243,000 8 102 Marina Boulevard - Fort Mason (EVGo) $ - 9 950 Golden Gate Avenue - Margaret Hayward Park $ 150,000 $ 330,000 $ 480,000
10 88 Broadway - Affordable Housing $ 150,000 $ 15,000 $ 165,000 $ 68,000 90,625 11 735 Davis - Affordable Housing $ 150,000 $ 25,000 $ 175,000 $ 114,000 148,837 12 Lake Merced Blvd & Sunset Blvd - Restroom $ - 13 L Taraval - Streetlights $ -
141351 42nd Street - Affordable Housing (Francis Scott Key Educator Housing) $ 25,000 $ 25,000 $ 118,000
15 50 Bowling Green Drive - GGP Tennis Center $ 150,000 275,000$ $ 425,000 $ 1,000 16 1251 Turk Street - Affordable Housing Fire Pump $ - 17 1805 Geary Blvd. - Streetlights and Traffic Signal $ - 18 78 Haight Street - Affordable Housing 6,000$ $ 6,000 $ 38,000 19 Haight Street Traffic Signals $ - 20 6 Berry Street - Substation $ - 21 750 Brannan - Main Library Repository $ - 22 399 The Embarcadero - Fire Boat #35 $ 150,000 1,800,000$ $ 500,000 $ 2,450,000
23 555 Larkin (formerly 500 Turk Street) - Affordable Housing $ 150,000 $ 24,000 $ 174,000 $ 196,000 243,000
24 Market St. & 7th St. - BMS Switch $ - 25 1064 Mission Street - Affordable Housing $ 150,000 $ 23,000 $ 173,000 $ 105,000 142,000
26 Transbay Transit Center - Transbay Joint Powers Authority $ -
27 Mission Rock & Terry Francois Blvd. - Redevelopment Project $ -
28 16 Sherman Street - Victoria Park Lighting $ - 29 180 Jones Street - Affordable Housing $ 20,000 $ 20,000 $ 89,000 30 266 4th Street - Affordable Housing $ - 31 750 Eddy Street - City College (Alemany) $ - 32 600 7th Street - Affordable Housing $ - 33 2685 Ocean Ave. - EV Charging Station $ - 34 5 Lenox Way - West Portal Elementary School $ 150,000 $ 150,000 35 2101 Sloat Boulevard - Construction Trailers 6,000$ $ 6,000
36 350 Amber Drive - Police Academy $ 75,000 $ 75,000
Additional Costs to Project Other Impacts to SF

Attachment C: Cost Impacts
Project Location Redesign
Costs
Primary or Low-side Metering
Equipment Costs
Additional Construction
Costs
Additional Costs to
Project for PG&E retail
service
Additional Const./Project
Mgmt Costs Due to Delay
Additional Staff Time
Costs
Total Additional Project Costs
(B+C+D+E+F+G)
Lost gross revenue to
SFPUC
CO2 Emissions (lbs.) from PG&E retail service
Additional Costs to Project Other Impacts to SF
37 1419 Bryant Street - Animal Care & Control $ 23,000 $ 353,000 150,000$ $ 526,000 38 2060 Folsom Street - Affordable Housing $ 2,000 $ 150,000 $ 53,000 $ 205,000 $ 295,000 385,000 39 681 Florida Street - Affordable Housing $ 150,000 $ 12,000 $ 162,000 $ 59,000 77,000 40 1990 Folsom Street - Affordable Housing $ 2,000 $ 150,000 $ 38,000 $ 190,000 $ 181,000 247,000 41 3001-3021 24th Street - Affordable Housing $ - 42 300 Bartlett Street - Mission Branch Library $ - 43 800 Amador Street - Pier 94 - Backlands $ 50,000 $ 500,000 $ 50,000 $ 600,000 44 Illinois St. & Terry Francois - Mariposa Pump Station $ 22,000 $ 100,000 $ 122,000 $ 588,000 554,000 45 684 23rd Street - Potrero North $ - 46 638 23rd Street - Potrero South $ - 47 1001 22nd Street - Bus Electrification Pilot $ - 48 1995 Evans - Traffic Controls and Forensics $ 75,000 $ 578,000 $ 653,000 49 750 Phelps - Southeast Plant $ - 50 2401/2403 Keith Street - Southeast Health Center $ 150,000 $ 150,000 51 1550 Evans Ave - Southeast Community Center $ 500,000 $ 500,000 52 Islais Creek Bridge Rehab (3rd Street) $ 75,000 $ 75,000 53 1150 Phelps - Construction Trailers $ - 54 480 22nd Street - Pier 70 Pump Station $ - 55 1601 Griffith Street - Griffith Pump Station $ 27,000 $ 27,000 56 Harmonia Street - Sunnydale HOPE $ - 57 1101 Connecticut Street - HOPE Potrero $ - 58 603 Jamestown Avenue - Redevelopment Project $ - 59 702 Phelps Street - SFMTA Substation $ - 60 1800 Jerrold Avenue - Biosolids (Temp. Power) $ - 61 901 Tennessee Street $ - 62 1508 Bancroft Avenue - Sustainable Streets Shop $ -
631001 Potrero Avenue - UCSF/SFGH Research & Academic Building Construction and Permanent Power $ 30,000 $ 30,000 $ 287,000
64 1920 Evans - Arborist Trailer/BUF Yard $ - 65 4840 Mission Street - Affordable Housing $ 47,000 $ 47,000 $ 301,000 66 35-45 Onondaga Avenue - Health Clinic $ - 67 455 Athens Street - Cleveland Elementary School
68 241 Oneida Avenue - Denman Middle School $ 75,000 $ 75,000 69 2340 San Jose Avenue - Affordable Housing $ 35,000 $ 35,000 $ 191,000 70 Multiple Locations - Guy Wires (Franchise Issue) $ - 71 Multiple Service Transfers $ -
72 10501 Warnerville Road - Substation Rehabilitation Project $ -
73 951 Antoinette Lane - Well Pump & Control Panel $ - TOTAL $ 77,000 $ 3,903,000 $ 3,231,000 $ 1,011,000 $ 1,098,000 $ 50,000 $ 9,370,000 $ 2,645,000 1,937,462

Attachment C: Cost Impacts
Project Location Redesign
Costs
Primary or Low-side Metering
Equipment Costs
Additional Construction
Costs
Additional Costs to
Project for PG&E retail
service
Additional Const./Project
Mgmt Costs Due to Delay
Additional Staff Time
Costs
Total Additional Project Costs
(B+C+D+E+F+G)
Lost gross revenue to
SFPUC
CO2 Emissions (lbs.) from PG&E retail service
Additional Costs to Project Other Impacts to SF
$ 9,370,000.00 $ 2,645,000.00 $ 12,015,000.00
1,937,462
Note: These represent estimates of the costs that the City is aware of at the moment. The projects may incur additional costs going forward. The projects in RED are projects that are currently at a standstill and may face financial impacts that are TBD depending on how long they will be delayed and how they will move forward.
Total C02 Emissions (lbs.)
Total Additional Project CostsTotal Lost Gross Revenue to SFPUC
Total Cost Impact to SF (Project Costs + Lost Revenue)

EXHIBIT B
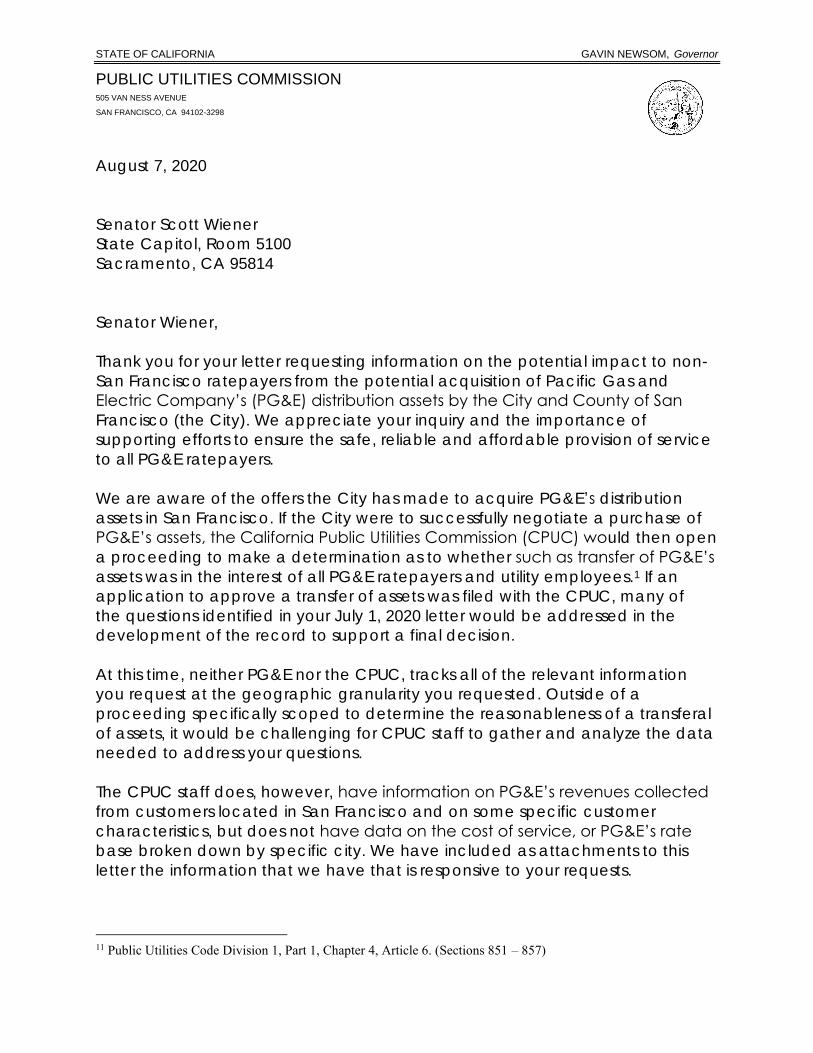
August 7, 2020 CPUC President Marybel Batjer letter to
Senator Scott Wiener
STATE OF CALIFORNIA GAVIN NEWSOM, Governor
PUBLIC UTILITIES COMMISSION 505 VAN NESS AVENUE
SAN FRANCISCO, CA 94102-3298
August 7, 2020
Senator Scott Wiener
State Capitol, Room 5100
Sacramento, CA 95814
Senator Wiener,
Thank you for your letter requesting information on the potential impact to non-
San Francisco ratepayers from the potential acquisition of Pacific Gas and
Electric Company’s (PG&E) distribution assets by the City and County of San
Francisco (the City). We appreciate your inquiry and the importance of
supporting efforts to ensure the safe, reliable and affordable provision of service
to all PG&E ratepayers.
We are aware of the offers the City has made to acquire PG&E’s distribution
assets in San Francisco. If the City were to successfully negotiate a purchase of
PG&E’s assets, the California Public Utilities Commission (CPUC) would then open
a proceeding to make a determination as to whether such as transfer of PG&E’s
assets was in the interest of all PG&E ratepayers and utility employees.1 If an
application to approve a transfer of assets was filed with the CPUC, many of
the questions identified in your July 1, 2020 letter would be addressed in the
development of the record to support a final decision.
At this time, neither PG&E nor the CPUC, tracks all of the relevant information
you request at the geographic granularity you requested. Outside of a
proceeding specifically scoped to determine the reasonableness of a transferal
of assets, it would be challenging for CPUC staff to gather and analyze the data
needed to address your questions.
The CPUC staff does, however, have information on PG&E’s revenues collected
from customers located in San Francisco and on some specific customer
characteristics, but does not have data on the cost of service, or PG&E’s rate
base broken down by specific city. We have included as attachments to this
letter the information that we have that is responsive to your requests.
11 Public Utilities Code Division 1, Part 1, Chapter 4, Article 6. (Sections 851 – 857)

2
Thank you again for your letter and for your engagement on this issue. Should
you have any further questions or concerns please contact our Office of
Governmental Affairs Director, Hazel Miranda at [email protected] or
(916) 327-3277.
Sincerely,
Marybel Batjer, President
California Public Utilities Commission

PG&E 2019 All Electric Customer Classes Total System Average Rate by County
County Annual RevenueAnnual Usage
kWh
Recorded Total System Average Rate by County (¢/kWh)
SISKIYOU Total 88,260$ 373,098 23.7
LASSEN Total 2,035,921$ 8,656,654 23.5
TRINITY Total 2,805,805$ 12,147,766 23.1
ALPINE Total 1,264,708$ 5,601,101 22.6
SIERRA Total 1,412,385$ 6,300,621 22.4
SACRAMENTO Total 7,154,955$ 32,402,697 22.1
EL DORADO Total 181,439,755$ 834,665,877 21.7
CALAVERAS Total 51,075,939$ 235,878,894 21.7
NEVADA Total 92,094,416$ 425,925,442 21.6
MARIPOSA Total 21,845,128$ 101,902,168 21.4
SUTTER Total 113,382,487$ 529,581,071 21.4
STANISLAUS Total 82,465,026$ 388,395,964 21.2
SAN LUIS OBISPO Total 304,314,685$ 1,451,558,276 21.0
YUBA Total 75,506,382$ 361,464,845 20.9
BUTTE Total 236,387,106$ 1,137,914,767 20.8
LAKE Total 84,033,421$ 411,200,758 20.4
MERCED Total 259,945,870$ 1,281,252,097 20.3
PLUMAS Total 18,974,894$ 94,319,115 20.1
TULARE Total 86,647,404$ 431,716,363 20.1
TUOLUMNE Total 69,428,083$ 346,274,705 20.1
TEHAMA Total 90,513,191$ 454,457,602 19.9
AMADOR Total 55,596,553$ 285,215,372 19.5
FRESNO Total 1,206,313,133$ 6,197,896,412 19.5
SANTA BARBARA Total 225,485,773$ 1,189,234,469 19.0
SAN JOAQUIN Total 771,235,735$ 4,079,461,624 18.9
SHASTA Total 91,977,780$ 486,886,640 18.9
MADERA Total 257,705,413$ 1,378,192,503 18.7
COLUSA Total 66,515,972$ 361,523,952 18.4
SOLANO Total 442,894,269$ 2,456,390,778 18.0
KERN Total 1,065,047,637$ 5,978,960,065 17.8
YOLO Total 213,780,788$ 1,328,347,301 16.1
MENDOCINO Total 68,555,796$ 428,754,945 16.0
MARIN Total 191,123,148$ 1,221,720,166 15.6
KINGS Total 136,991,946$ 891,435,891 15.4
GLENN Total 51,965,214$ 338,187,906 15.4
CONTRA COSTA Total 841,367,874$ 5,772,588,296 14.6
PLACER Total 184,305,267$ 1,270,914,390 14.5
NAPA Total 133,248,752$ 925,998,104 14.4
SAN FRANCISCO Total 638,927,665$ 4,546,111,564 14.1
SONOMA Total 355,268,318$ 2,540,210,173 14.0
SANTA CRUZ Total 146,452,424$ 1,064,478,227 13.8
HUMBOLDT Total 100,794,248$ 742,304,252 13.6
MONTEREY Total 290,378,548$ 2,207,592,563 13.2
SAN BENITO Total 43,770,842$ 336,485,811 13.0
ALAMEDA Total 1,112,856,294$ 8,644,355,656 12.9
SAN MATEO Total 521,929,145$ 4,087,522,553 12.8
SANTA CLARA Total 1,322,344,399$ 11,059,384,731 12.0
Removed from datasetUNINCORPORATED Total
2019 - All Customer Classes - Ranked Highest to Lowest
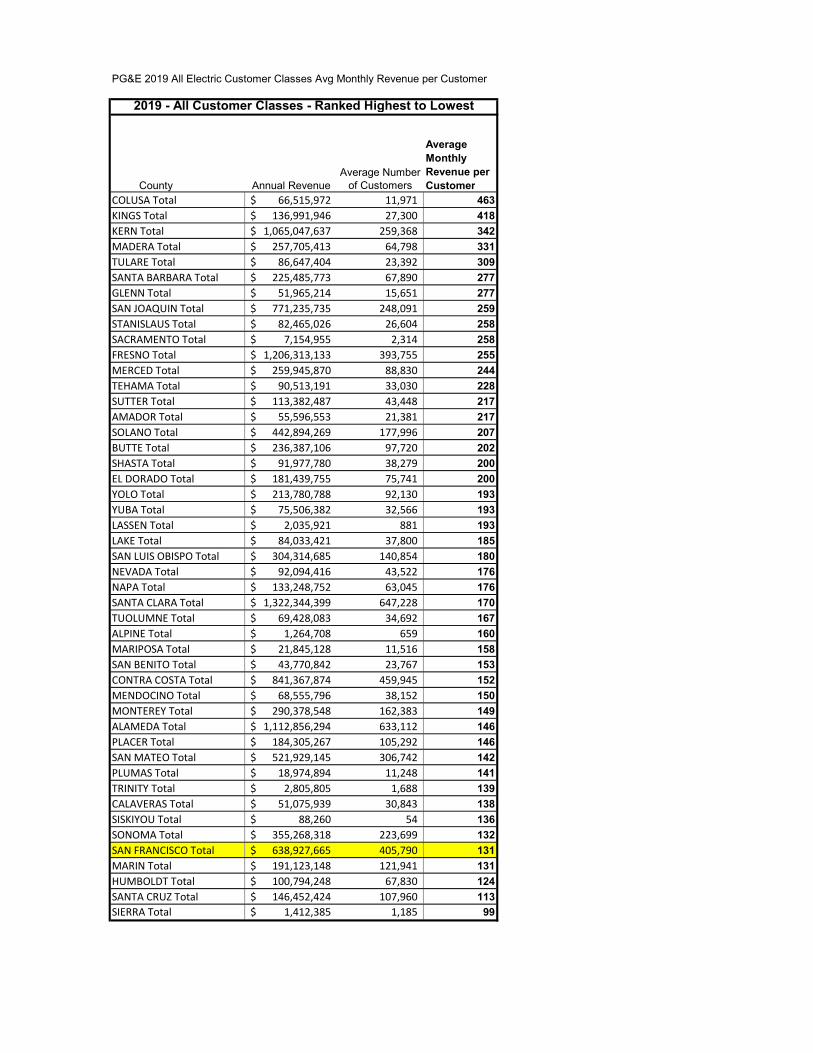
PG&E 2019 All Electric Customer Classes Avg Monthly Revenue per Customer
County Annual RevenueAverage Number
of Customers
Average Monthly Revenue per Customer
COLUSA Total 66,515,972$ 11,971 463
KINGS Total 136,991,946$ 27,300 418
KERN Total 1,065,047,637$ 259,368 342
MADERA Total 257,705,413$ 64,798 331
TULARE Total 86,647,404$ 23,392 309
SANTA BARBARA Total 225,485,773$ 67,890 277
GLENN Total 51,965,214$ 15,651 277
SAN JOAQUIN Total 771,235,735$ 248,091 259
STANISLAUS Total 82,465,026$ 26,604 258
SACRAMENTO Total 7,154,955$ 2,314 258
FRESNO Total 1,206,313,133$ 393,755 255
MERCED Total 259,945,870$ 88,830 244
TEHAMA Total 90,513,191$ 33,030 228
SUTTER Total 113,382,487$ 43,448 217
AMADOR Total 55,596,553$ 21,381 217
SOLANO Total 442,894,269$ 177,996 207
BUTTE Total 236,387,106$ 97,720 202
SHASTA Total 91,977,780$ 38,279 200
EL DORADO Total 181,439,755$ 75,741 200
YOLO Total 213,780,788$ 92,130 193
YUBA Total 75,506,382$ 32,566 193
LASSEN Total 2,035,921$ 881 193
LAKE Total 84,033,421$ 37,800 185
SAN LUIS OBISPO Total 304,314,685$ 140,854 180
NEVADA Total 92,094,416$ 43,522 176
NAPA Total 133,248,752$ 63,045 176
SANTA CLARA Total 1,322,344,399$ 647,228 170
TUOLUMNE Total 69,428,083$ 34,692 167
ALPINE Total 1,264,708$ 659 160
MARIPOSA Total 21,845,128$ 11,516 158
SAN BENITO Total 43,770,842$ 23,767 153
CONTRA COSTA Total 841,367,874$ 459,945 152
MENDOCINO Total 68,555,796$ 38,152 150
MONTEREY Total 290,378,548$ 162,383 149
ALAMEDA Total 1,112,856,294$ 633,112 146
PLACER Total 184,305,267$ 105,292 146
SAN MATEO Total 521,929,145$ 306,742 142
PLUMAS Total 18,974,894$ 11,248 141
TRINITY Total 2,805,805$ 1,688 139
CALAVERAS Total 51,075,939$ 30,843 138
SISKIYOU Total 88,260$ 54 136
SONOMA Total 355,268,318$ 223,699 132
SAN FRANCISCO Total 638,927,665$ 405,790 131
MARIN Total 191,123,148$ 121,941 131
HUMBOLDT Total 100,794,248$ 67,830 124
SANTA CRUZ Total 146,452,424$ 107,960 113
SIERRA Total 1,412,385$ 1,185 99
2019 - All Customer Classes - Ranked Highest to Lowest

PG&E 2019 All Electric Customer Classes Average Monthly Usage per Customer
CountyAnnual Usage
kWhAverage Number
of Customers
Average Monthly Usage kWh per Customer
KINGS Total 891,435,891 27,300 2,721
COLUSA Total 361,523,952 11,971 2,517
KERN Total 5,978,960,065 259,368 1,921
GLENN Total 338,187,906 15,651 1,801
MADERA Total 1,378,192,503 64,798 1,772
TULARE Total 431,716,363 23,392 1,538
SANTA BARBARA Total 1,189,234,469 67,890 1,460
SANTA CLARA Total 11,059,384,731 647,228 1,424
SAN JOAQUIN Total 4,079,461,624 248,091 1,370
FRESNO Total 6,197,896,412 393,755 1,312
NAPA Total 925,998,104 63,045 1,224
STANISLAUS Total 388,395,964 26,604 1,217
MERCED Total 1,281,252,097 88,830 1,202
YOLO Total 1,328,347,301 92,130 1,202
SAN BENITO Total 336,485,811 23,767 1,180
SACRAMENTO Total 32,402,697 2,314 1,167
SOLANO Total 2,456,390,778 177,996 1,150
TEHAMA Total 454,457,602 33,030 1,147
ALAMEDA Total 8,644,355,656 633,112 1,138
MONTEREY Total 2,207,592,563 162,383 1,133
AMADOR Total 285,215,372 21,381 1,112
SAN MATEO Total 4,087,522,553 306,742 1,110
SHASTA Total 486,886,640 38,279 1,060
CONTRA COSTA Total 5,772,588,296 459,945 1,046
SUTTER Total 529,581,071 43,448 1,016
PLACER Total 1,270,914,390 105,292 1,006
BUTTE Total 1,137,914,767 97,720 970
SONOMA Total 2,540,210,173 223,699 946
MENDOCINO Total 428,754,945 38,152 937
SAN FRANCISCO Total 4,546,111,564 405,790 934
YUBA Total 361,464,845 32,566 925
EL DORADO Total 834,665,877 75,741 918
HUMBOLDT Total 742,304,252 67,830 912
LAKE Total 411,200,758 37,800 907
SAN LUIS OBISPO Total 1,451,558,276 140,854 859
MARIN Total 1,221,720,166 121,941 835
TUOLUMNE Total 346,274,705 34,692 832
SANTA CRUZ Total 1,064,478,227 107,960 822
LASSEN Total 8,656,654 881 819
NEVADA Total 425,925,442 43,522 816
MARIPOSA Total 101,902,168 11,516 737
ALPINE Total 5,601,101 659 708
PLUMAS Total 94,319,115 11,248 699
CALAVERAS Total 235,878,894 30,843 637
TRINITY Total 12,147,766 1,688 600
SISKIYOU Total 373,098 54 576
SIERRA Total 6,300,621 1,185 443
2019 - All Customer Classes - Ranked Highest to Lowest

PG&E 2019 Residential Electric Customer Class Total System Average Rate by County
County Annual RevenueAnnual Usage
kWh
Recorded Total Residential Average Rate by County (¢/kWh)
ALPINE Total 635,659$ 2,733,432 23.25 TRINITY Total 2,141,412$ 9,397,432 22.79 SAN LUIS OBISPO Total 122,373,909$ 544,694,474 22.47 EL DORADO Total 117,446,623$ 525,678,904 22.34 NEVADA Total 62,479,999$ 289,612,170 21.57 SIERRA Total 816,911$ 3,804,614 21.47 SANTA BARBARA Total 56,416,361$ 262,946,834 21.46 CALAVERAS Total 37,664,442$ 175,631,258 21.45 SACRAMENTO Total 2,681,920$ 12,534,726 21.40 AMADOR Total 25,923,494$ 121,952,747 21.26 SHASTA Total 58,333,819$ 276,068,111 21.13 SISKIYOU Total 31,722$ 150,202 21.12 MARIPOSA Total 13,611,445$ 64,712,547 21.03 STANISLAUS Total 33,867,104$ 161,018,664 21.03 SUTTER Total 47,458,350$ 227,865,756 20.83 TUOLUMNE Total 40,245,452$ 193,456,594 20.80 SOLANO Total 191,312,764$ 922,180,529 20.75 GLENN Total 16,256,290$ 78,633,005 20.67 LASSEN Total 922,382$ 4,468,183 20.64 PLUMAS Total 10,122,030$ 49,128,184 20.60 BUTTE Total 109,817,726$ 533,731,315 20.58 COLUSA Total 11,303,977$ 55,029,242 20.54 SAN JOAQUIN Total 298,862,359$ 1,460,080,311 20.47 TEHAMA Total 43,292,865$ 213,246,988 20.30 KINGS Total 29,166,848$ 144,576,963 20.17 YUBA Total 38,200,282$ 189,550,384 20.15 FRESNO Total 458,786,939$ 2,288,403,131 20.05 KERN Total 295,419,603$ 1,475,291,135 20.02 MADERA Total 73,545,868$ 370,212,546 19.87 LAKE Total 52,114,211$ 263,410,713 19.78 MERCED Total 97,533,429$ 506,744,847 19.25 TULARE Total 21,230,361$ 112,341,450 18.90 MARIN Total 104,468,023$ 602,266,141 17.35 CONTRA COSTA Total 425,809,513$ 2,516,503,691 16.92 MENDOCINO Total 38,265,701$ 232,327,645 16.47 SAN FRANCISCO Total 209,218,074$ 1,288,761,441 16.23 YOLO Total 71,831,416$ 443,395,742 16.20 NAPA Total 53,081,422$ 330,340,986 16.07 PLACER Total 107,656,709$ 681,805,626 15.79 SONOMA Total 169,979,876$ 1,121,001,197 15.16 SAN MATEO Total 215,500,699$ 1,421,719,788 15.16 SANTA CLARA Total 477,268,155$ 3,157,496,006 15.12 ALAMEDA Total 382,583,354$ 2,615,078,252 14.63 HUMBOLDT Total 51,073,263$ 352,959,329 14.47 SANTA CRUZ Total 69,854,601$ 485,387,588 14.39 SAN BENITO Total 15,649,171$ 109,560,058 14.28 MONTEREY Total 84,689,814$ 615,482,840 13.76
Removed from datasetUNINCORPORATED Total
2019 - Residential Class - Ranked Highest to Lowest

PG&E 2019 Residential Electric Customer Class Average MonthlyRevenue per Customer
County Annual Revenue
Average Number of Customers
Average Monthly Revenue per Customer
SHASTA Total 58,333,819$ 33,343 146 EL DORADO Total 117,446,623$ 67,585 145 SACRAMENTO Total 2,681,920$ 1,600 140 NEVADA Total 62,479,999$ 38,208 136 LAKE Total 52,114,211$ 32,892 132 TEHAMA Total 43,292,865$ 27,554 131 STANISLAUS Total 33,867,104$ 21,763 130 TRINITY Total 2,141,412$ 1,456 123 GLENN Total 16,256,290$ 11,369 119 AMADOR Total 25,923,494$ 18,176 119 MADERA Total 73,545,868$ 51,771 118 SAN JOAQUIN Total 298,862,359$ 213,590 117 KINGS Total 29,166,848$ 20,897 116 LASSEN Total 922,382$ 664 116 FRESNO Total 458,786,939$ 333,855 115 MARIPOSA Total 13,611,445$ 9,949 114 CALAVERAS Total 37,664,442$ 27,586 114 SUTTER Total 47,458,350$ 34,840 114 YUBA Total 38,200,282$ 28,064 113 COLUSA Total 11,303,977$ 8,329 113 BUTTE Total 109,817,726$ 81,889 112 MERCED Total 97,533,429$ 73,091 111 KERN Total 295,419,603$ 222,742 111 TUOLUMNE Total 40,245,452$ 30,411 110 TULARE Total 21,230,361$ 16,318 108 MENDOCINO Total 38,265,701$ 31,441 101 SOLANO Total 191,312,764$ 159,737 100 PLACER Total 107,656,709$ 92,837 97 ALPINE Total 635,659$ 585 90 PLUMAS Total 10,122,030$ 9,570 88 SAN LUIS OBISPO Total 122,373,909$ 118,100 86 CONTRA COSTA Total 425,809,513$ 419,994 84 NAPA Total 53,081,422$ 53,100 83 SANTA BARBARA Total 56,416,361$ 56,800 83 MARIN Total 104,468,023$ 106,744 82 YOLO Total 71,831,416$ 79,860 75 HUMBOLDT Total 51,073,263$ 57,482 74 SONOMA Total 169,979,876$ 192,266 74 SIERRA Total 816,911$ 986 69 SANTA CLARA Total 477,268,155$ 588,249 68 SISKIYOU Total 31,722$ 40 66 SAN BENITO Total 15,649,171$ 20,034 65 SAN MATEO Total 215,500,699$ 277,116 65 SANTA CRUZ Total 69,854,601$ 94,745 61 ALAMEDA Total 382,583,354$ 568,655 56 MONTEREY Total 84,689,814$ 138,205 51 SAN FRANCISCO Total 209,218,074$ 370,994 47
2019 - Residential Class - Ranked Highest to Lowest

PG&E 2019 Residential Electric Customer Class Average Monthly Usage per Customer
2019 - Residential Class - Ranked Highest to Lowest
CountyAnnual Usage
kWh
Average Number of Customers
Average Monthly Usage kWh per Customer
SHASTA Total 276,068,111 33,343 690
LAKE Total 263,410,713 32,892 667
SACRAMENTO Total 12,534,726 1,600 653
EL DORADO Total 525,678,904 67,585 648
TEHAMA Total 213,246,988 27,554 645
NEVADA Total 289,612,170 38,208 632
STANISLAUS Total 161,018,664 21,763 617
MENDOCINO Total 232,327,645 31,441 616
PLACER Total 681,805,626 92,837 612
MADERA Total 370,212,546 51,771 596
MERCED Total 506,744,847 73,091 578
KINGS Total 144,576,963 20,897 577
GLENN Total 78,633,005 11,369 576
TULARE Total 112,341,450 16,318 574
FRESNO Total 2,288,403,131 333,855 571
SAN JOAQUIN Total 1,460,080,311 213,590 570
YUBA Total 189,550,384 28,064 563 LASSEN Total 4,468,183 664 561
AMADOR Total 121,952,747 18,176 559
KERN Total 1,475,291,135 222,742 552
COLUSA Total 55,029,242 8,329 551
SUTTER Total 227,865,756 34,840 545
BUTTE Total 533,731,315 81,889 543
MARIPOSA Total 64,712,547 9,949 542
TRINITY Total 9,397,432 1,456 538
CALAVERAS Total 175,631,258 27,586 531
TUOLUMNE Total 193,456,594 30,411 530
NAPA Total 330,340,986 53,100 518
HUMBOLDT Total 352,959,329 57,482 512
CONTRA COSTA Total 2,516,503,691 419,994 499
SONOMA Total 1,121,001,197 192,266 486
SOLANO Total 922,180,529 159,737 481
MARIN Total 602,266,141 106,744 470
YOLO Total 443,395,742 79,860 463
SAN BENITO Total 109,560,058 20,034 456
SANTA CLARA Total 3,157,496,006 588,249 447
PLUMAS Total 49,128,184 9,570 428
SAN MATEO Total 1,421,719,788 277,116 428
SANTA CRUZ Total 485,387,588 94,745 427
ALPINE Total 2,733,432 585 389
SANTA BARBARA Total 262,946,834 56,800 386
SAN LUIS OBISPO Total 544,694,474 118,100 384
ALAMEDA Total 2,615,078,252 568,655 383
MONTEREY Total 615,482,840 138,205 371
SIERRA Total 3,804,614 986 321
SISKIYOU Total 150,202 40 314
SAN FRANCISCO Total 1,288,761,441 370,994 289

PG&E 2019 All Gas Customer Classes Total System Average Rate by County
County Annual RevenueAnnual Usage
therm
Recorded Total System Average Rate by County ($/them)
EL DORADO Total 15,439,718$ 11,760,442 1.31
MARIN Total 92,648,917$ 72,310,749 1.28
NEVADA Total 12,010,839$ 9,595,781 1.25
SANTA BARBARA Total 5,976$ 4,943 1.21
SONOMA Total 126,540,315$ 114,618,294 1.10
MENDOCINO Total 11,329,314$ 10,385,266 1.09
SAN MATEO Total 242,120,755$ 224,055,752 1.08
TRINITY Total 55,101$ 51,224 1.08
SACRAMENTO Total 351,669,340$ 333,772,927 1.05
YUBA Total 12,383,616$ 11,809,312 1.05
SANTA CRUZ Total 59,587,025$ 57,287,582 1.04
BUTTE Total 41,452,333$ 40,775,919 1.02
SAN FRANCISCO Total 248,506,505$ 246,159,603 1.01
SAN LUIS OBISPO Total 355,751$ 356,769 1.00
NAPA Total 42,689,370$ 45,283,599 0.94
PLACER Total 101,850,185$ 108,219,517 0.94
SAN BENITO Total 14,051,834$ 15,700,463 0.89
ALAMEDA Total 418,374,202$ 489,892,071 0.85
TEHAMA Total 8,595,242$ 12,199,734 0.70
SHASTA Total 38,326,884$ 57,971,289 0.66
CALAVERAS Total 1,116,252$ 1,702,909 0.66
AMADOR Total 6,121,518$ 9,504,714 0.64
GLENN Total 5,702,148$ 8,952,722 0.64
SANTA CLARA Total 478,492,176$ 794,238,764 0.60
HUMBOLDT Total 39,330,702$ 68,239,338 0.58
KERN Total 95,014,036$ 179,731,114 0.53
SAN JOAQUIN Total 168,612,386$ 356,362,467 0.47
FRESNO Total 200,350,139$ 439,618,029 0.46
MERCED Total 53,887,217$ 121,001,438 0.45
KINGS Total 1,731,447$ 3,938,623 0.44
SOLANO Total 123,675,317$ 282,400,807 0.44
STANISLAUS Total 142,338,185$ 350,588,617 0.41
MADERA Total 21,906,696$ 58,708,523 0.37
SUTTER Total 30,150,502$ 81,620,835 0.37
MONTEREY Total 120,721,027$ 500,712,375 0.24
CONTRA COSTA Total 487,593,726$ 2,310,953,991 0.21
SAN BERNARDINO Total 5,824,465$ 44,933,599 0.13
YOLO Total 51,391,938$ 399,163,967 0.13
COLUSA Total 12,537,899$ 245,243,532 0.05
Removed from dataset
UNINCORPORATED Total
2019 - All Customer Classes - Ranked Highest to Lowest
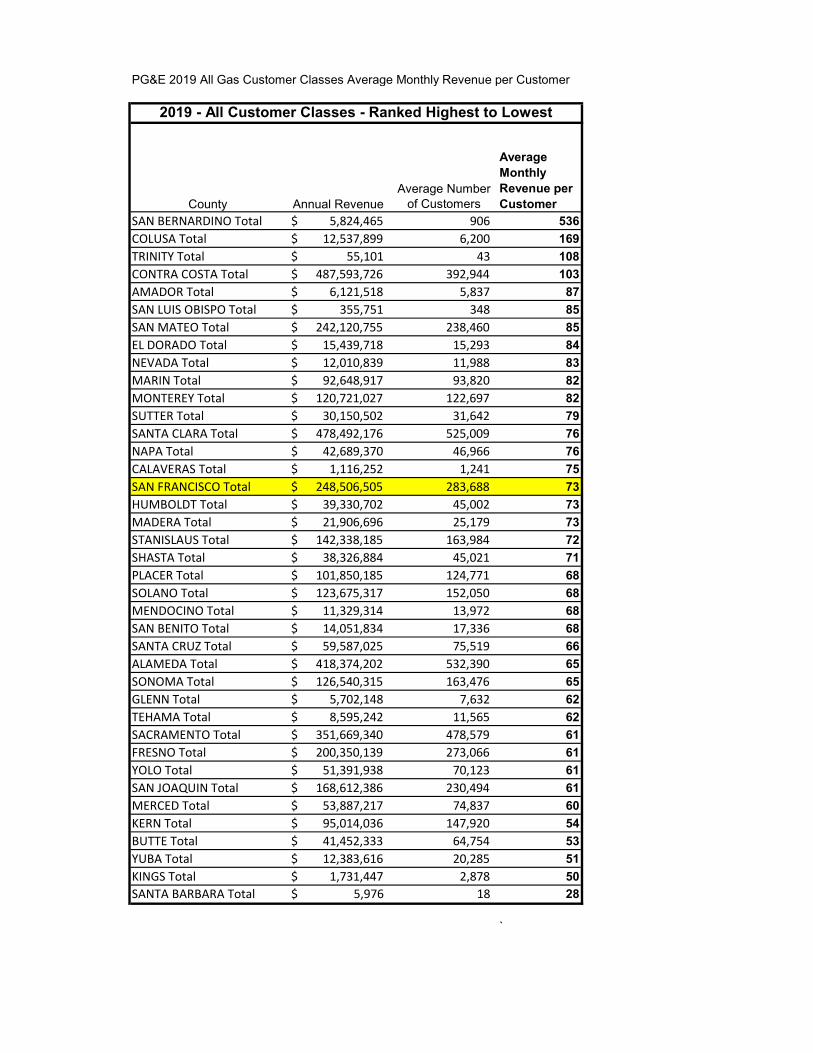
PG&E 2019 All Gas Customer Classes Average Monthly Revenue per Customer
County Annual RevenueAverage Number
of Customers
Average Monthly Revenue per Customer
SAN BERNARDINO Total 5,824,465$ 906 536
COLUSA Total 12,537,899$ 6,200 169
TRINITY Total 55,101$ 43 108
CONTRA COSTA Total 487,593,726$ 392,944 103
AMADOR Total 6,121,518$ 5,837 87
SAN LUIS OBISPO Total 355,751$ 348 85
SAN MATEO Total 242,120,755$ 238,460 85
EL DORADO Total 15,439,718$ 15,293 84
NEVADA Total 12,010,839$ 11,988 83
MARIN Total 92,648,917$ 93,820 82
MONTEREY Total 120,721,027$ 122,697 82
SUTTER Total 30,150,502$ 31,642 79
SANTA CLARA Total 478,492,176$ 525,009 76
NAPA Total 42,689,370$ 46,966 76
CALAVERAS Total 1,116,252$ 1,241 75
SAN FRANCISCO Total 248,506,505$ 283,688 73
HUMBOLDT Total 39,330,702$ 45,002 73
MADERA Total 21,906,696$ 25,179 73
STANISLAUS Total 142,338,185$ 163,984 72
SHASTA Total 38,326,884$ 45,021 71
PLACER Total 101,850,185$ 124,771 68
SOLANO Total 123,675,317$ 152,050 68
MENDOCINO Total 11,329,314$ 13,972 68
SAN BENITO Total 14,051,834$ 17,336 68
SANTA CRUZ Total 59,587,025$ 75,519 66
ALAMEDA Total 418,374,202$ 532,390 65
SONOMA Total 126,540,315$ 163,476 65
GLENN Total 5,702,148$ 7,632 62
TEHAMA Total 8,595,242$ 11,565 62
SACRAMENTO Total 351,669,340$ 478,579 61
FRESNO Total 200,350,139$ 273,066 61
YOLO Total 51,391,938$ 70,123 61
SAN JOAQUIN Total 168,612,386$ 230,494 61
MERCED Total 53,887,217$ 74,837 60
KERN Total 95,014,036$ 147,920 54
BUTTE Total 41,452,333$ 64,754 53
YUBA Total 12,383,616$ 20,285 51
KINGS Total 1,731,447$ 2,878 50
SANTA BARBARA Total 5,976$ 18 28
`
2019 - All Customer Classes - Ranked Highest to Lowest

PG&E 2019 All Gas Customer Classes Average Monthly Usage per Customer
CountyAnnual Usage
thermAverage Number
of Customers
Average Monthly Usage therm per Customer
SAN BERNARDINO Total 44,933,599 906 4,135
COLUSA Total 245,243,532 6,200 3,296
CONTRA COSTA Total 2,310,953,991 392,944 490
YOLO Total 399,163,967 70,123 474
MONTEREY Total 500,712,375 122,697 340
SUTTER Total 81,620,835 31,642 215
MADERA Total 58,708,523 25,179 194
STANISLAUS Total 350,588,617 163,984 178
SOLANO Total 282,400,807 152,050 155
AMADOR Total 9,504,714 5,837 136
MERCED Total 121,001,438 74,837 135
FRESNO Total 439,618,029 273,066 134
SAN JOAQUIN Total 356,362,467 230,494 129
HUMBOLDT Total 68,239,338 45,002 126
SANTA CLARA Total 794,238,764 525,009 126
CALAVERAS Total 1,702,909 1,241 114
KINGS Total 3,938,623 2,878 114
SHASTA Total 57,971,289 45,021 107
KERN Total 179,731,114 147,920 101
TRINITY Total 51,224 43 100
GLENN Total 8,952,722 7,632 98
TEHAMA Total 12,199,734 11,565 88
SAN LUIS OBISPO Total 356,769 348 85
NAPA Total 45,283,599 46,966 80
SAN MATEO Total 224,055,752 238,460 78
ALAMEDA Total 489,892,071 532,390 77
SAN BENITO Total 15,700,463 17,336 75
SAN FRANCISCO Total 246,159,603 283,688 72
PLACER Total 108,219,517 124,771 72
NEVADA Total 9,595,781 11,988 67
MARIN Total 72,310,749 93,820 64
EL DORADO Total 11,760,442 15,293 64
SANTA CRUZ Total 57,287,582 75,519 63
MENDOCINO Total 10,385,266 13,972 62
SONOMA Total 114,618,294 163,476 58
SACRAMENTO Total 333,772,927 478,579 58
BUTTE Total 40,775,919 64,754 52
YUBA Total 11,809,312 20,285 49
SANTA BARBARA Total 4,943 18 23
2019 - All Customer Classes - Ranked Highest to Lowest

PG&E 2019 Residential Gas Customer Class Total System Average Rate by County
County Annual RevenueAnnual Usage
therm
Recorded Total System Average Rate by County ($/them)
EL DORADO Total 13,597,827$ 8,730,199 1.56MARIN Total 75,661,684$ 50,918,597 1.49PLACER Total 78,159,221$ 54,458,500 1.44SAN MATEO Total 166,885,842$ 117,444,696 1.42NEVADA Total 8,349,373$ 5,984,333 1.40CONTRA COSTA Total 242,324,046$ 175,037,186 1.38SACRAMENTO Total 270,958,031$ 198,992,154 1.36SANTA CLARA Total 311,519,672$ 229,555,407 1.36SHASTA Total 25,138,605$ 18,527,230 1.36NAPA Total 27,780,838$ 20,575,171 1.35SAN FRANCISCO Total 170,900,698$ 127,497,840 1.34SONOMA Total 93,649,259$ 69,973,142 1.34SAN BERNARDINO Total 386,209$ 288,687 1.34AMADOR Total 2,887,744$ 2,161,365 1.34ALAMEDA Total 288,605,528$ 216,606,754 1.33SANTA CRUZ Total 43,023,574$ 32,374,261 1.33HUMBOLDT Total 26,104,206$ 19,778,665 1.32MENDOCINO Total 7,437,366$ 5,664,994 1.31STANISLAUS Total 81,688,067$ 62,279,575 1.31YOLO Total 33,472,284$ 25,566,933 1.31MONTEREY Total 66,816,875$ 51,120,188 1.31SAN LUIS OBISPO Total 176,598$ 135,461 1.30TRINITY Total 25,213$ 19,343 1.30SAN BENITO Total 8,964,042$ 6,877,878 1.30SOLANO Total 76,618,865$ 58,810,100 1.30SUTTER Total 16,251,990$ 12,555,186 1.29SAN JOAQUIN Total 113,795,944$ 88,933,094 1.28BUTTE Total 28,858,792$ 22,561,417 1.28FRESNO Total 122,327,638$ 97,713,875 1.25COLUSA Total 2,718,937$ 2,209,331 1.23CALAVERAS Total 527,143$ 429,798 1.23KERN Total 64,296,123$ 52,511,991 1.22YUBA Total 8,961,502$ 7,335,404 1.22GLENN Total 3,051,620$ 2,505,577 1.22TEHAMA Total 4,814,118$ 3,963,316 1.21MERCED Total 31,469,386$ 25,914,461 1.21SANTA BARBARA Total 5,976$ 4,943 1.21MADERA Total 9,659,018$ 8,235,837 1.17KINGS Total 968,400$ 897,405 1.08
Removed from datasetUNINCORPORATED Total
2019 - Residential Customer Class - Ranked Highest to Lowest
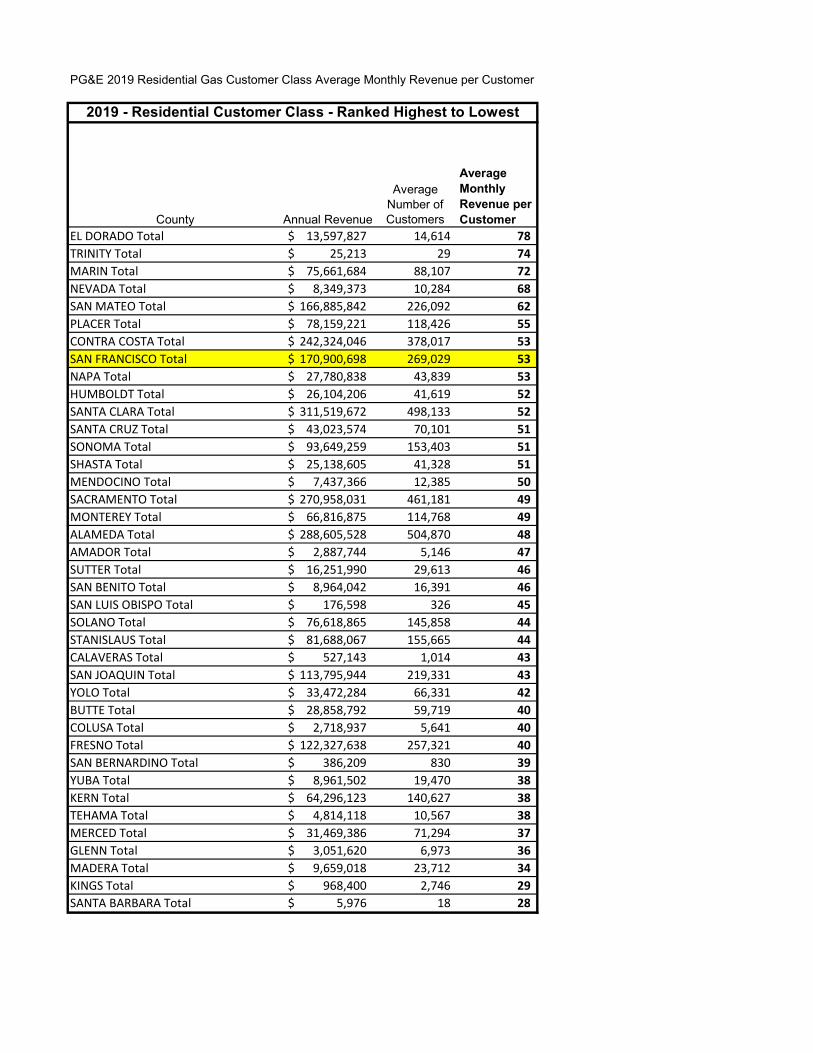
PG&E 2019 Residential Gas Customer Class Average Monthly Revenue per Customer
County Annual Revenue
Average Number of Customers
Average Monthly Revenue per Customer
EL DORADO Total 13,597,827$ 14,614 78 TRINITY Total 25,213$ 29 74 MARIN Total 75,661,684$ 88,107 72 NEVADA Total 8,349,373$ 10,284 68 SAN MATEO Total 166,885,842$ 226,092 62 PLACER Total 78,159,221$ 118,426 55 CONTRA COSTA Total 242,324,046$ 378,017 53 SAN FRANCISCO Total 170,900,698$ 269,029 53 NAPA Total 27,780,838$ 43,839 53 HUMBOLDT Total 26,104,206$ 41,619 52 SANTA CLARA Total 311,519,672$ 498,133 52 SANTA CRUZ Total 43,023,574$ 70,101 51 SONOMA Total 93,649,259$ 153,403 51 SHASTA Total 25,138,605$ 41,328 51 MENDOCINO Total 7,437,366$ 12,385 50 SACRAMENTO Total 270,958,031$ 461,181 49 MONTEREY Total 66,816,875$ 114,768 49 ALAMEDA Total 288,605,528$ 504,870 48 AMADOR Total 2,887,744$ 5,146 47 SUTTER Total 16,251,990$ 29,613 46 SAN BENITO Total 8,964,042$ 16,391 46 SAN LUIS OBISPO Total 176,598$ 326 45 SOLANO Total 76,618,865$ 145,858 44 STANISLAUS Total 81,688,067$ 155,665 44 CALAVERAS Total 527,143$ 1,014 43 SAN JOAQUIN Total 113,795,944$ 219,331 43 YOLO Total 33,472,284$ 66,331 42 BUTTE Total 28,858,792$ 59,719 40 COLUSA Total 2,718,937$ 5,641 40 FRESNO Total 122,327,638$ 257,321 40 SAN BERNARDINO Total 386,209$ 830 39 YUBA Total 8,961,502$ 19,470 38 KERN Total 64,296,123$ 140,627 38 TEHAMA Total 4,814,118$ 10,567 38 MERCED Total 31,469,386$ 71,294 37 GLENN Total 3,051,620$ 6,973 36 MADERA Total 9,659,018$ 23,712 34 KINGS Total 968,400$ 2,746 29 SANTA BARBARA Total 5,976$ 18 28
2019 - Residential Customer Class - Ranked Highest to Lowest

PG&E 2019 Residential Gas Customer Class Average Monthly Usage per Customer
County
Average Number of Customers
Average Number of Customers
Average Monthly Usage therm per Customer
TRINITY Total 19,343 29 56
EL DORADO Total 8,730,199 14,614 50
NEVADA Total 5,984,333 10,284 48
MARIN Total 50,918,597 88,107 48
SAN MATEO Total 117,444,696 226,092 43
HUMBOLDT Total 19,778,665 41,619 40
SAN FRANCISCO Total 127,497,840 269,029 39
NAPA Total 20,575,171 43,839 39
CONTRA COSTA Total 175,037,186 378,017 39
SANTA CRUZ Total 32,374,261 70,101 38
SANTA CLARA Total 229,555,407 498,133 38
PLACER Total 54,458,500 118,426 38
MENDOCINO Total 5,664,994 12,385 38
SONOMA Total 69,973,142 153,403 38
SHASTA Total 18,527,230 41,328 37
MONTEREY Total 51,120,188 114,768 37
SACRAMENTO Total 198,992,154 461,181 36
ALAMEDA Total 216,606,754 504,870 36
SUTTER Total 12,555,186 29,613 35
CALAVERAS Total 429,798 1,014 35
AMADOR Total 2,161,365 5,146 35
SAN BENITO Total 6,877,878 16,391 35
SAN LUIS OBISPO Total 135,461 326 35
SAN JOAQUIN Total 88,933,094 219,331 34
SOLANO Total 58,810,100 145,858 34
STANISLAUS Total 62,279,575 155,665 33
COLUSA Total 2,209,331 5,641 33
YOLO Total 25,566,933 66,331 32
FRESNO Total 97,713,875 257,321 32
BUTTE Total 22,561,417 59,719 31
YUBA Total 7,335,404 19,470 31
TEHAMA Total 3,963,316 10,567 31
KERN Total 52,511,991 140,627 31
MERCED Total 25,914,461 71,294 30
GLENN Total 2,505,577 6,973 30
SAN BERNARDINO Total 288,687 830 29
MADERA Total 8,235,837 23,712 29
KINGS Total 897,405 2,746 27
SANTA BARBARA Total 4,943 18 23
2019 - Residential Customer Class - Ranked Highest to Lowest
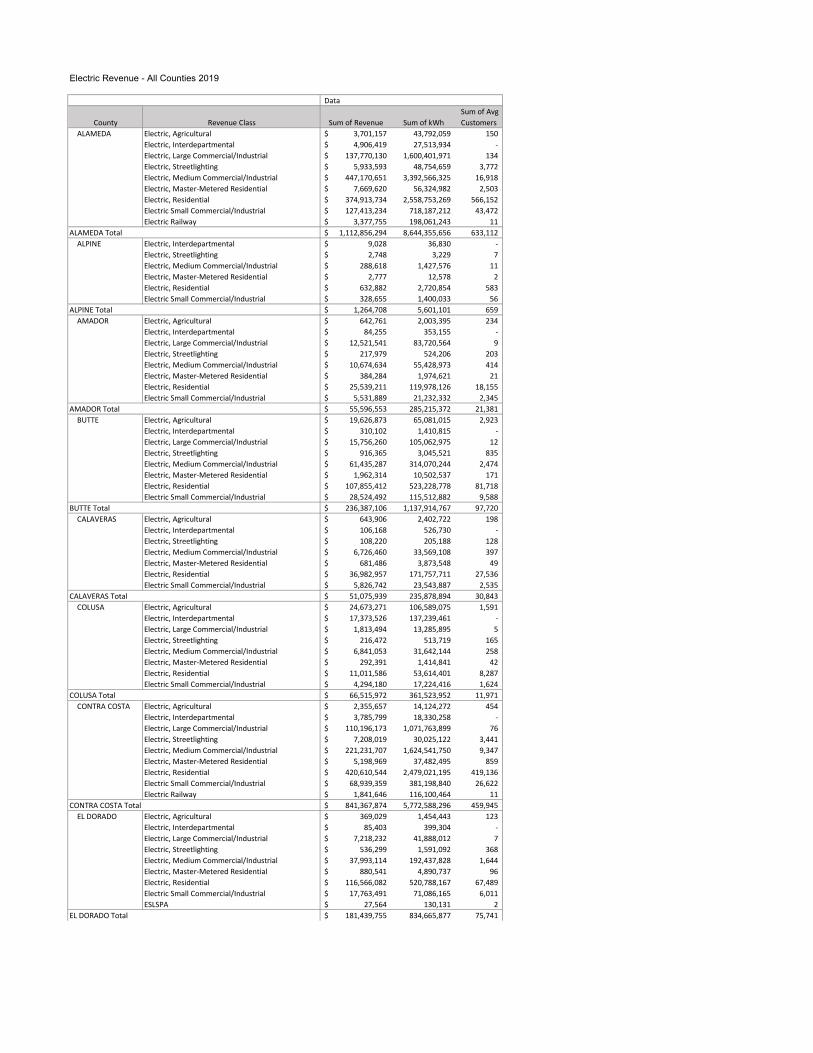
Electric Revenue - All Counties 2019
Data
County Revenue Class Sum of Revenue Sum of kWh Sum of Avg Customers
ALAMEDA Electric, Agricultural 3,701,157$ 43,792,059 150 Electric, Interdepartmental 4,906,419$ 27,513,934 - Electric, Large Commercial/Industrial 137,770,130$ 1,600,401,971 134 Electric, Streetlighting 5,933,593$ 48,754,659 3,772 Electric, Medium Commercial/Industrial 447,170,651$ 3,392,566,325 16,918 Electric, Master-Metered Residential 7,669,620$ 56,324,982 2,503 Electric, Residential 374,913,734$ 2,558,753,269 566,152 Electric Small Commercial/Industrial 127,413,234$ 718,187,212 43,472 Electric Railway 3,377,755$ 198,061,243 11
ALAMEDA Total 1,112,856,294$ 8,644,355,656 633,112 ALPINE Electric, Interdepartmental 9,028$ 36,830 -
Electric, Streetlighting 2,748$ 3,229 7 Electric, Medium Commercial/Industrial 288,618$ 1,427,576 11 Electric, Master-Metered Residential 2,777$ 12,578 2 Electric, Residential 632,882$ 2,720,854 583 Electric Small Commercial/Industrial 328,655$ 1,400,033 56
ALPINE Total 1,264,708$ 5,601,101 659 AMADOR Electric, Agricultural 642,761$ 2,003,395 234
Electric, Interdepartmental 84,255$ 353,155 - Electric, Large Commercial/Industrial 12,521,541$ 83,720,564 9 Electric, Streetlighting 217,979$ 524,206 203 Electric, Medium Commercial/Industrial 10,674,634$ 55,428,973 414 Electric, Master-Metered Residential 384,284$ 1,974,621 21 Electric, Residential 25,539,211$ 119,978,126 18,155 Electric Small Commercial/Industrial 5,531,889$ 21,232,332 2,345
AMADOR Total 55,596,553$ 285,215,372 21,381 BUTTE Electric, Agricultural 19,626,873$ 65,081,015 2,923
Electric, Interdepartmental 310,102$ 1,410,815 - Electric, Large Commercial/Industrial 15,756,260$ 105,062,975 12 Electric, Streetlighting 916,365$ 3,045,521 835 Electric, Medium Commercial/Industrial 61,435,287$ 314,070,244 2,474 Electric, Master-Metered Residential 1,962,314$ 10,502,537 171 Electric, Residential 107,855,412$ 523,228,778 81,718 Electric Small Commercial/Industrial 28,524,492$ 115,512,882 9,588
BUTTE Total 236,387,106$ 1,137,914,767 97,720 CALAVERAS Electric, Agricultural 643,906$ 2,402,722 198
Electric, Interdepartmental 106,168$ 526,730 - Electric, Streetlighting 108,220$ 205,188 128 Electric, Medium Commercial/Industrial 6,726,460$ 33,569,108 397 Electric, Master-Metered Residential 681,486$ 3,873,548 49 Electric, Residential 36,982,957$ 171,757,711 27,536 Electric Small Commercial/Industrial 5,826,742$ 23,543,887 2,535
CALAVERAS Total 51,075,939$ 235,878,894 30,843 COLUSA Electric, Agricultural 24,673,271$ 106,589,075 1,591
Electric, Interdepartmental 17,373,526$ 137,239,461 - Electric, Large Commercial/Industrial 1,813,494$ 13,285,895 5 Electric, Streetlighting 216,472$ 513,719 165 Electric, Medium Commercial/Industrial 6,841,053$ 31,642,144 258 Electric, Master-Metered Residential 292,391$ 1,414,841 42 Electric, Residential 11,011,586$ 53,614,401 8,287 Electric Small Commercial/Industrial 4,294,180$ 17,224,416 1,624
COLUSA Total 66,515,972$ 361,523,952 11,971 CONTRA COSTA Electric, Agricultural 2,355,657$ 14,124,272 454
Electric, Interdepartmental 3,785,799$ 18,330,258 - Electric, Large Commercial/Industrial 110,196,173$ 1,071,763,899 76 Electric, Streetlighting 7,208,019$ 30,025,122 3,441 Electric, Medium Commercial/Industrial 221,231,707$ 1,624,541,750 9,347 Electric, Master-Metered Residential 5,198,969$ 37,482,495 859 Electric, Residential 420,610,544$ 2,479,021,195 419,136 Electric Small Commercial/Industrial 68,939,359$ 381,198,840 26,622 Electric Railway 1,841,646$ 116,100,464 11
CONTRA COSTA Total 841,367,874$ 5,772,588,296 459,945 EL DORADO Electric, Agricultural 369,029$ 1,454,443 123
Electric, Interdepartmental 85,403$ 399,304 - Electric, Large Commercial/Industrial 7,218,232$ 41,888,012 7 Electric, Streetlighting 536,299$ 1,591,092 368 Electric, Medium Commercial/Industrial 37,993,114$ 192,437,828 1,644 Electric, Master-Metered Residential 880,541$ 4,890,737 96 Electric, Residential 116,566,082$ 520,788,167 67,489 Electric Small Commercial/Industrial 17,763,491$ 71,086,165 6,011 ESLSPA 27,564$ 130,131 2
EL DORADO Total 181,439,755$ 834,665,877 75,741
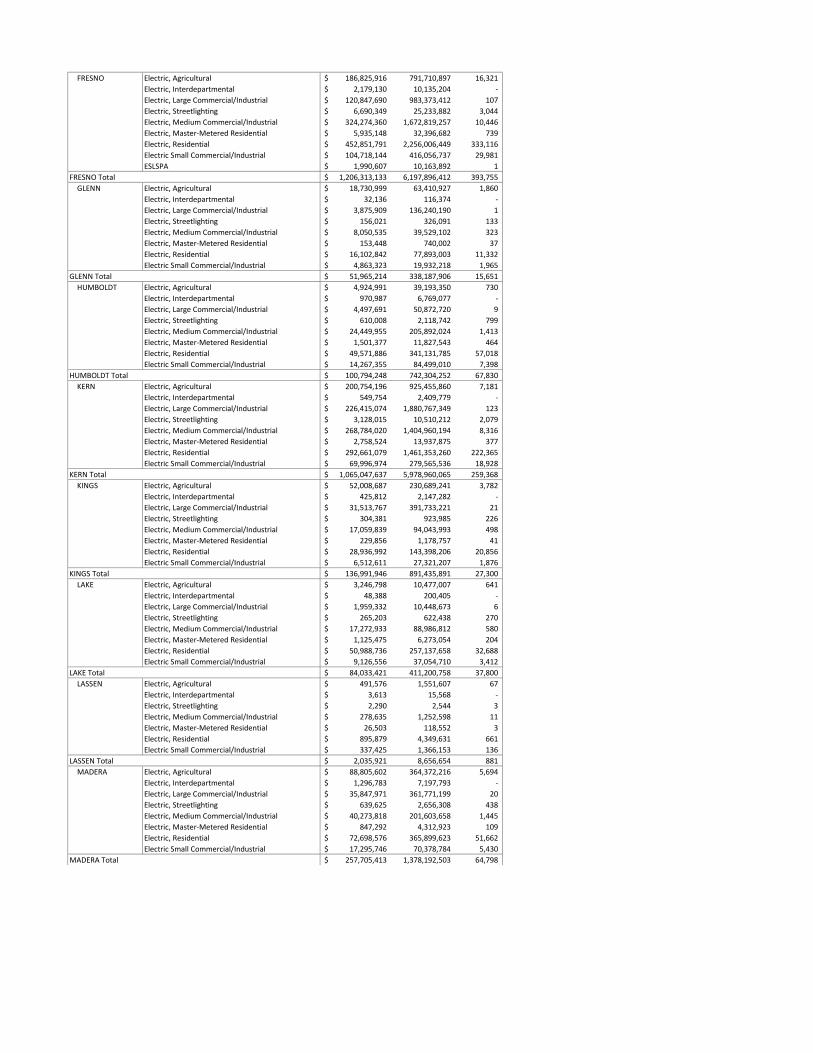
FRESNO Electric, Agricultural 186,825,916$ 791,710,897 16,321 Electric, Interdepartmental 2,179,130$ 10,135,204 - Electric, Large Commercial/Industrial 120,847,690$ 983,373,412 107 Electric, Streetlighting 6,690,349$ 25,233,882 3,044 Electric, Medium Commercial/Industrial 324,274,360$ 1,672,819,257 10,446 Electric, Master-Metered Residential 5,935,148$ 32,396,682 739 Electric, Residential 452,851,791$ 2,256,006,449 333,116 Electric Small Commercial/Industrial 104,718,144$ 416,056,737 29,981 ESLSPA 1,990,607$ 10,163,892 1
FRESNO Total 1,206,313,133$ 6,197,896,412 393,755 GLENN Electric, Agricultural 18,730,999$ 63,410,927 1,860
Electric, Interdepartmental 32,136$ 116,374 - Electric, Large Commercial/Industrial 3,875,909$ 136,240,190 1 Electric, Streetlighting 156,021$ 326,091 133 Electric, Medium Commercial/Industrial 8,050,535$ 39,529,102 323 Electric, Master-Metered Residential 153,448$ 740,002 37 Electric, Residential 16,102,842$ 77,893,003 11,332 Electric Small Commercial/Industrial 4,863,323$ 19,932,218 1,965
GLENN Total 51,965,214$ 338,187,906 15,651 HUMBOLDT Electric, Agricultural 4,924,991$ 39,193,350 730
Electric, Interdepartmental 970,987$ 6,769,077 - Electric, Large Commercial/Industrial 4,497,691$ 50,872,720 9 Electric, Streetlighting 610,008$ 2,118,742 799 Electric, Medium Commercial/Industrial 24,449,955$ 205,892,024 1,413 Electric, Master-Metered Residential 1,501,377$ 11,827,543 464 Electric, Residential 49,571,886$ 341,131,785 57,018 Electric Small Commercial/Industrial 14,267,355$ 84,499,010 7,398
HUMBOLDT Total 100,794,248$ 742,304,252 67,830 KERN Electric, Agricultural 200,754,196$ 925,455,860 7,181
Electric, Interdepartmental 549,754$ 2,409,779 - Electric, Large Commercial/Industrial 226,415,074$ 1,880,767,349 123 Electric, Streetlighting 3,128,015$ 10,510,212 2,079 Electric, Medium Commercial/Industrial 268,784,020$ 1,404,960,194 8,316 Electric, Master-Metered Residential 2,758,524$ 13,937,875 377 Electric, Residential 292,661,079$ 1,461,353,260 222,365 Electric Small Commercial/Industrial 69,996,974$ 279,565,536 18,928
KERN Total 1,065,047,637$ 5,978,960,065 259,368 KINGS Electric, Agricultural 52,008,687$ 230,689,241 3,782
Electric, Interdepartmental 425,812$ 2,147,282 - Electric, Large Commercial/Industrial 31,513,767$ 391,733,221 21 Electric, Streetlighting 304,381$ 923,985 226 Electric, Medium Commercial/Industrial 17,059,839$ 94,043,993 498 Electric, Master-Metered Residential 229,856$ 1,178,757 41 Electric, Residential 28,936,992$ 143,398,206 20,856 Electric Small Commercial/Industrial 6,512,611$ 27,321,207 1,876
KINGS Total 136,991,946$ 891,435,891 27,300 LAKE Electric, Agricultural 3,246,798$ 10,477,007 641
Electric, Interdepartmental 48,388$ 200,405 - Electric, Large Commercial/Industrial 1,959,332$ 10,448,673 6 Electric, Streetlighting 265,203$ 622,438 270 Electric, Medium Commercial/Industrial 17,272,933$ 88,986,812 580 Electric, Master-Metered Residential 1,125,475$ 6,273,054 204 Electric, Residential 50,988,736$ 257,137,658 32,688 Electric Small Commercial/Industrial 9,126,556$ 37,054,710 3,412
LAKE Total 84,033,421$ 411,200,758 37,800 LASSEN Electric, Agricultural 491,576$ 1,551,607 67
Electric, Interdepartmental 3,613$ 15,568 - Electric, Streetlighting 2,290$ 2,544 3 Electric, Medium Commercial/Industrial 278,635$ 1,252,598 11 Electric, Master-Metered Residential 26,503$ 118,552 3 Electric, Residential 895,879$ 4,349,631 661 Electric Small Commercial/Industrial 337,425$ 1,366,153 136
LASSEN Total 2,035,921$ 8,656,654 881 MADERA Electric, Agricultural 88,805,602$ 364,372,216 5,694
Electric, Interdepartmental 1,296,783$ 7,197,793 - Electric, Large Commercial/Industrial 35,847,971$ 361,771,199 20 Electric, Streetlighting 639,625$ 2,656,308 438 Electric, Medium Commercial/Industrial 40,273,818$ 201,603,658 1,445 Electric, Master-Metered Residential 847,292$ 4,312,923 109 Electric, Residential 72,698,576$ 365,899,623 51,662 Electric Small Commercial/Industrial 17,295,746$ 70,378,784 5,430
MADERA Total 257,705,413$ 1,378,192,503 64,798

MARIN Electric, Agricultural 1,159,019$ 7,589,960 183 Electric, Interdepartmental 151,440$ 666,712 - Electric, Large Commercial/Industrial 5,717,337$ 59,485,174 9 Electric, Streetlighting 636,156$ 5,105,880 555 Electric, Medium Commercial/Industrial 52,750,859$ 396,934,815 2,449 Electric, Master-Metered Residential 2,122,636$ 12,723,329 687 Electric, Residential 102,345,387$ 589,542,812 106,057 Electric Small Commercial/Industrial 26,240,313$ 149,671,484 12,001
MARIN Total 191,123,148$ 1,221,720,166 121,941 MARIPOSA Electric, Agricultural 150,835$ 580,363 46
Electric, Interdepartmental 14,193$ 59,524 - Electric, Streetlighting 33,078$ 75,674 63 Electric, Medium Commercial/Industrial 4,930,894$ 24,195,899 155 Electric, Master-Metered Residential 134,903$ 677,737 30 Electric, Residential 13,476,541$ 64,034,810 9,919 Electric Small Commercial/Industrial 3,104,683$ 12,278,161 1,302
MARIPOSA Total 21,845,128$ 101,902,168 11,516 MENDOCINO Electric, Agricultural 2,168,898$ 9,771,445 641
Electric, Interdepartmental 203,081$ 908,301 - Electric, Large Commercial/Industrial 1,741,498$ 15,603,953 2 Electric, Streetlighting 271,748$ 706,673 256 Electric, Medium Commercial/Industrial 15,683,625$ 111,913,339 852 Electric, Master-Metered Residential 834,339$ 6,122,792 147 Electric, Residential 37,431,361$ 226,204,854 31,294 Electric Small Commercial/Industrial 10,114,693$ 57,230,593 4,959 ESLSPA 106,552$ 292,996 1
MENDOCINO Total 68,555,796$ 428,754,945 38,152 MERCED Electric, Agricultural 84,193,341$ 348,084,719 6,701
Electric, Interdepartmental 279,020$ 1,147,749 - Electric, Large Commercial/Industrial 16,539,814$ 130,443,356 17 Electric, Streetlighting 1,266,809$ 4,244,518 1,208 Electric, Medium Commercial/Industrial 40,850,672$ 203,282,410 1,596 Electric, Master-Metered Residential 990,796$ 5,367,767 152 Electric, Residential 96,542,633$ 501,377,080 72,939 Electric Small Commercial/Industrial 19,282,785$ 87,304,497 6,219
MERCED Total 259,945,870$ 1,281,252,097 88,830 MONTEREY Electric, Agricultural 68,809,920$ 492,186,311 3,595
Electric, Interdepartmental 268,560$ 1,120,105 - Electric, Large Commercial/Industrial 26,904,723$ 288,265,936 40 Electric, Streetlighting 1,529,383$ 7,121,599 1,024 Electric, Medium Commercial/Industrial 74,392,300$ 602,467,952 4,025 Electric, Master-Metered Residential 2,811,236$ 20,869,291 973 Electric, Residential 81,878,578$ 594,613,549 137,232 Electric Small Commercial/Industrial 33,783,847$ 200,947,820 15,494
MONTEREY Total 290,378,548$ 2,207,592,563 162,383 NAPA Electric, Agricultural 4,753,965$ 18,755,303 1,762
Electric, Interdepartmental 60,147$ 243,130 - Electric, Large Commercial/Industrial 8,508,057$ 80,884,193 14 Electric, Streetlighting 449,072$ 2,133,069 354 Electric, Medium Commercial/Industrial 49,462,167$ 389,655,879 1,963 Electric, Master-Metered Residential 1,952,692$ 15,199,989 354 Electric, Residential 51,128,730$ 315,140,997 52,747 Electric Small Commercial/Industrial 16,933,923$ 103,985,544 5,852
NAPA Total 133,248,752$ 925,998,104 63,045 NEVADA Electric, Agricultural 206,837$ 722,290 105
Electric, Interdepartmental 89,612$ 389,509 - Electric, Streetlighting 261,454$ 791,057 254 Electric, Medium Commercial/Industrial 16,979,730$ 88,586,434 784 Electric, Master-Metered Residential 1,141,667$ 6,362,353 84 Electric, Residential 61,338,332$ 283,249,817 38,123 Electric Small Commercial/Industrial 12,076,783$ 45,823,982 4,171
NEVADA Total 92,094,416$ 425,925,442 43,522 PLACER Electric, Agricultural 1,973,300$ 10,397,395 541
Electric, Interdepartmental 696,978$ 3,088,003 - Electric, Large Commercial/Industrial 10,713,441$ 126,202,830 15 Electric, Streetlighting 1,152,874$ 6,141,374 914 Electric, Medium Commercial/Industrial 43,315,758$ 333,863,027 2,972 Electric, Master-Metered Residential 1,627,824$ 14,787,534 148 Electric, Residential 106,028,885$ 667,018,092 92,689 Electric Small Commercial/Industrial 18,736,145$ 109,124,404 8,013 ESLSPA 60,062$ 291,730 1
PLACER Total 184,305,267$ 1,270,914,390 105,292
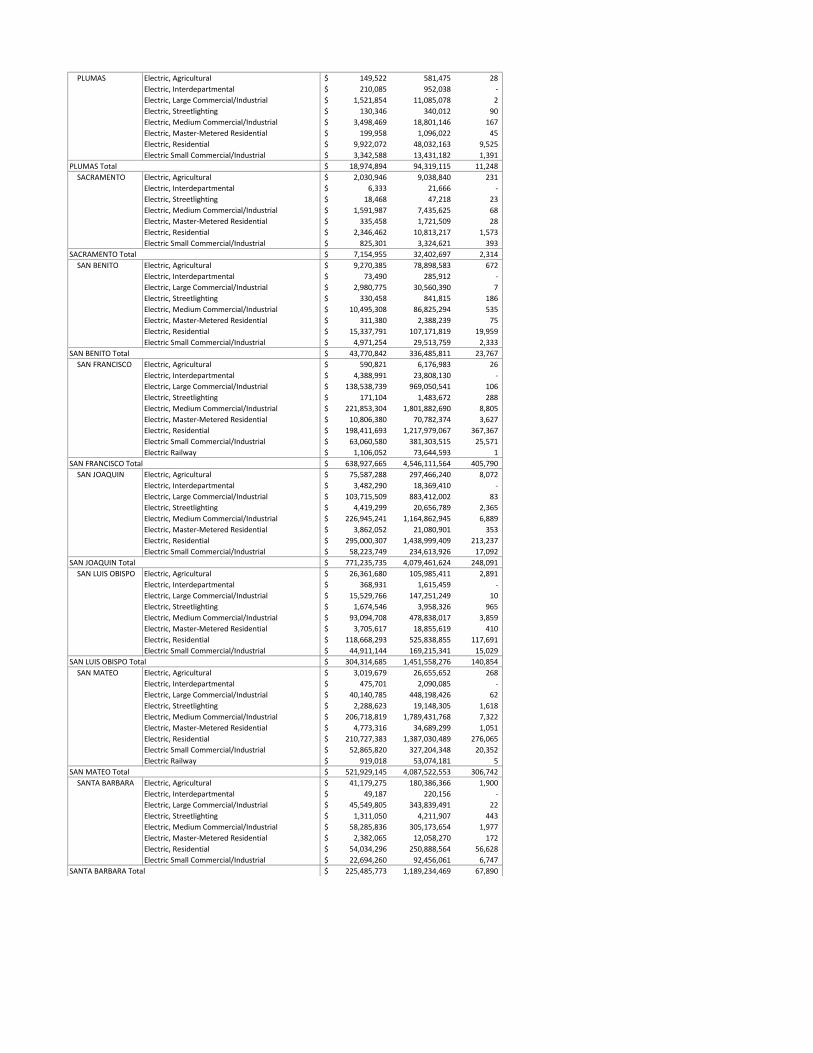
PLUMAS Electric, Agricultural 149,522$ 581,475 28 Electric, Interdepartmental 210,085$ 952,038 - Electric, Large Commercial/Industrial 1,521,854$ 11,085,078 2 Electric, Streetlighting 130,346$ 340,012 90 Electric, Medium Commercial/Industrial 3,498,469$ 18,801,146 167 Electric, Master-Metered Residential 199,958$ 1,096,022 45 Electric, Residential 9,922,072$ 48,032,163 9,525 Electric Small Commercial/Industrial 3,342,588$ 13,431,182 1,391
PLUMAS Total 18,974,894$ 94,319,115 11,248 SACRAMENTO Electric, Agricultural 2,030,946$ 9,038,840 231
Electric, Interdepartmental 6,333$ 21,666 - Electric, Streetlighting 18,468$ 47,218 23 Electric, Medium Commercial/Industrial 1,591,987$ 7,435,625 68 Electric, Master-Metered Residential 335,458$ 1,721,509 28 Electric, Residential 2,346,462$ 10,813,217 1,573 Electric Small Commercial/Industrial 825,301$ 3,324,621 393
SACRAMENTO Total 7,154,955$ 32,402,697 2,314 SAN BENITO Electric, Agricultural 9,270,385$ 78,898,583 672
Electric, Interdepartmental 73,490$ 285,912 - Electric, Large Commercial/Industrial 2,980,775$ 30,560,390 7 Electric, Streetlighting 330,458$ 841,815 186 Electric, Medium Commercial/Industrial 10,495,308$ 86,825,294 535 Electric, Master-Metered Residential 311,380$ 2,388,239 75 Electric, Residential 15,337,791$ 107,171,819 19,959 Electric Small Commercial/Industrial 4,971,254$ 29,513,759 2,333
SAN BENITO Total 43,770,842$ 336,485,811 23,767 SAN FRANCISCO Electric, Agricultural 590,821$ 6,176,983 26
Electric, Interdepartmental 4,388,991$ 23,808,130 - Electric, Large Commercial/Industrial 138,538,739$ 969,050,541 106 Electric, Streetlighting 171,104$ 1,483,672 288 Electric, Medium Commercial/Industrial 221,853,304$ 1,801,882,690 8,805 Electric, Master-Metered Residential 10,806,380$ 70,782,374 3,627 Electric, Residential 198,411,693$ 1,217,979,067 367,367 Electric Small Commercial/Industrial 63,060,580$ 381,303,515 25,571 Electric Railway 1,106,052$ 73,644,593 1
SAN FRANCISCO Total 638,927,665$ 4,546,111,564 405,790 SAN JOAQUIN Electric, Agricultural 75,587,288$ 297,466,240 8,072
Electric, Interdepartmental 3,482,290$ 18,369,410 - Electric, Large Commercial/Industrial 103,715,509$ 883,412,002 83 Electric, Streetlighting 4,419,299$ 20,656,789 2,365 Electric, Medium Commercial/Industrial 226,945,241$ 1,164,862,945 6,889 Electric, Master-Metered Residential 3,862,052$ 21,080,901 353 Electric, Residential 295,000,307$ 1,438,999,409 213,237 Electric Small Commercial/Industrial 58,223,749$ 234,613,926 17,092
SAN JOAQUIN Total 771,235,735$ 4,079,461,624 248,091 SAN LUIS OBISPO Electric, Agricultural 26,361,680$ 105,985,411 2,891
Electric, Interdepartmental 368,931$ 1,615,459 - Electric, Large Commercial/Industrial 15,529,766$ 147,251,249 10 Electric, Streetlighting 1,674,546$ 3,958,326 965 Electric, Medium Commercial/Industrial 93,094,708$ 478,838,017 3,859 Electric, Master-Metered Residential 3,705,617$ 18,855,619 410 Electric, Residential 118,668,293$ 525,838,855 117,691 Electric Small Commercial/Industrial 44,911,144$ 169,215,341 15,029
SAN LUIS OBISPO Total 304,314,685$ 1,451,558,276 140,854 SAN MATEO Electric, Agricultural 3,019,679$ 26,655,652 268
Electric, Interdepartmental 475,701$ 2,090,085 - Electric, Large Commercial/Industrial 40,140,785$ 448,198,426 62 Electric, Streetlighting 2,288,623$ 19,148,305 1,618 Electric, Medium Commercial/Industrial 206,718,819$ 1,789,431,768 7,322 Electric, Master-Metered Residential 4,773,316$ 34,689,299 1,051 Electric, Residential 210,727,383$ 1,387,030,489 276,065 Electric Small Commercial/Industrial 52,865,820$ 327,204,348 20,352 Electric Railway 919,018$ 53,074,181 5
SAN MATEO Total 521,929,145$ 4,087,522,553 306,742 SANTA BARBARA Electric, Agricultural 41,179,275$ 180,386,366 1,900
Electric, Interdepartmental 49,187$ 220,156 - Electric, Large Commercial/Industrial 45,549,805$ 343,839,491 22 Electric, Streetlighting 1,311,050$ 4,211,907 443 Electric, Medium Commercial/Industrial 58,285,836$ 305,173,654 1,977 Electric, Master-Metered Residential 2,382,065$ 12,058,270 172 Electric, Residential 54,034,296$ 250,888,564 56,628 Electric Small Commercial/Industrial 22,694,260$ 92,456,061 6,747
SANTA BARBARA Total 225,485,773$ 1,189,234,469 67,890

SANTA CLARA Electric, Agricultural 8,651,645$ 61,217,948 948 Electric, Interdepartmental 800,249$ 3,704,953 - Electric, Large Commercial/Industrial 216,142,832$ 3,070,436,758 205 Electric, Streetlighting 6,201,547$ 52,891,871 3,473 Electric, Medium Commercial/Industrial 498,054,113$ 4,101,430,424 17,784 Electric, Master-Metered Residential 16,097,412$ 110,052,727 1,710 Electric, Residential 461,170,743$ 3,047,443,279 586,539 Electric Small Commercial/Industrial 115,225,859$ 612,206,771 36,568
SANTA CLARA Total 1,322,344,399$ 11,059,384,731 647,228 SANTA CRUZ Electric, Agricultural 8,124,239$ 57,712,090 791
Electric, Interdepartmental 90,666$ 412,770 - Electric, Large Commercial/Industrial 6,790,702$ 60,845,819 12 Electric, Streetlighting 860,057$ 3,660,043 609 Electric, Medium Commercial/Industrial 39,430,868$ 326,390,288 2,246 Electric, Master-Metered Residential 3,657,477$ 28,147,312 1,512 Electric, Residential 66,197,123$ 457,240,276 93,233 Electric Small Commercial/Industrial 21,301,292$ 130,069,629 9,558
SANTA CRUZ Total 146,452,424$ 1,064,478,227 107,960 SHASTA Electric, Agricultural 2,346,703$ 8,274,699 385
Electric, Interdepartmental 447,456$ 2,225,811 - Electric, Large Commercial/Industrial 4,450,050$ 77,447,538 7 Electric, Streetlighting 219,553$ 629,617 265 Electric, Medium Commercial/Industrial 16,575,631$ 83,964,543 688 Electric, Master-Metered Residential 738,507$ 4,074,992 108 Electric, Residential 57,595,311$ 271,993,119 33,235 Electric Small Commercial/Industrial 9,604,569$ 38,276,321 3,591
SHASTA Total 91,977,780$ 486,886,640 38,279 SIERRA Electric, Interdepartmental 42,066$ 216,821 -
Electric, Streetlighting 15,357$ 21,254 24 Electric, Medium Commercial/Industrial 183,847$ 835,190 9 Electric, Master-Metered Residential 611$ 2,904 2 Electric, Residential 816,300$ 3,801,710 984 Electric Small Commercial/Industrial 354,204$ 1,422,741 166
SIERRA Total 1,412,385$ 6,300,621 1,185 SISKIYOU Electric, Medium Commercial/Industrial 5,777$ 20,268 1
Electric, Residential 31,722$ 150,202 40 Electric Small Commercial/Industrial 50,761$ 202,627 13
SISKIYOU Total 88,260$ 373,098 54 SOLANO Electric, Agricultural 15,999,454$ 68,066,884 1,443
Electric, Interdepartmental 2,476,032$ 15,464,617 - Electric, Large Commercial/Industrial 69,862,818$ 632,444,951 61 Electric, Streetlighting 2,697,493$ 12,723,896 1,085 Electric, Medium Commercial/Industrial 119,815,227$ 635,208,854 3,885 Electric, Master-Metered Residential 3,740,431$ 19,210,581 306 Electric, Residential 187,572,333$ 902,969,948 159,431 Electric Small Commercial/Industrial 40,730,481$ 170,301,047 11,786
SOLANO Total 442,894,269$ 2,456,390,778 177,996 SONOMA Electric, Agricultural 11,225,128$ 62,434,483 2,979
Electric, Interdepartmental 446,412$ 1,839,212 - Electric, Large Commercial/Industrial 16,512,266$ 210,432,471 27 Electric, Streetlighting 1,879,808$ 11,244,261 1,697 Electric, Medium Commercial/Industrial 109,525,232$ 863,952,370 5,972 Electric, Master-Metered Residential 5,728,115$ 43,028,787 982 Electric, Residential 164,251,761$ 1,077,972,410 191,284 Electric Small Commercial/Industrial 45,699,596$ 269,306,179 20,757
SONOMA Total 355,268,318$ 2,540,210,173 223,699 STANISLAUS Electric, Agricultural 23,051,210$ 90,520,815 1,701
Electric, Interdepartmental 25,702$ 102,063 - Electric, Large Commercial/Industrial 4,770,042$ 39,502,503 6 Electric, Streetlighting 419,098$ 1,404,868 404 Electric, Medium Commercial/Industrial 13,805,337$ 68,388,287 584 Electric, Master-Metered Residential 213,604$ 1,063,588 47 Electric, Residential 33,653,499$ 159,955,076 21,716 Electric Small Commercial/Industrial 6,526,535$ 27,458,764 2,146
STANISLAUS Total 82,465,026$ 388,395,964 26,604 SUTTER Electric, Agricultural 20,273,132$ 76,763,850 2,827
Electric, Interdepartmental 62,838$ 265,271 - Electric, Large Commercial/Industrial 4,442,568$ 28,958,366 7 Electric, Streetlighting 542,049$ 1,591,081 493 Electric, Medium Commercial/Industrial 27,971,871$ 144,601,684 949 Electric, Master-Metered Residential 351,663$ 1,884,919 62 Electric, Residential 47,106,687$ 225,980,838 34,778 Electric Small Commercial/Industrial 12,631,679$ 49,535,061 4,332
SUTTER Total 113,382,487$ 529,581,071 43,448

TEHAMA Electric, Agricultural 11,478,179$ 38,962,614 1,531 Electric, Interdepartmental 304,124$ 1,653,539 - Electric, Large Commercial/Industrial 9,224,627$ 75,838,763 8 Electric, Streetlighting 246,167$ 627,188 208 Electric, Medium Commercial/Industrial 17,359,595$ 91,688,701 548 Electric, Master-Metered Residential 1,061,560$ 5,811,139 76 Electric, Residential 42,231,305$ 207,435,849 27,477 Electric Small Commercial/Industrial 8,607,633$ 32,439,809 3,181
TEHAMA Total 90,513,191$ 454,457,602 33,030 TRINITY Electric, Agricultural 30,911$ 133,477 5
Electric, Streetlighting 1,459$ 5,026 5 Electric, Medium Commercial/Industrial 125,119$ 533,331 12 Electric, Master-Metered Residential 12,679$ 60,804 6 Electric, Residential 2,128,733$ 9,336,628 1,450 Electric Small Commercial/Industrial 506,904$ 2,078,500 210
TRINITY Total 2,805,805$ 12,147,766 1,688 TULARE Electric, Agricultural 44,018,845$ 200,987,878 4,900
Electric, Interdepartmental 44,527$ 179,245 - Electric, Large Commercial/Industrial 2,600,054$ 32,119,849 1 Electric, Streetlighting 303,558$ 707,637 156 Electric, Medium Commercial/Industrial 12,939,297$ 62,759,824 401 Electric, Master-Metered Residential 320,355$ 1,604,128 54 Electric, Residential 20,910,006$ 110,737,323 16,264 Electric Small Commercial/Industrial 5,510,761$ 22,620,480 1,616
TULARE Total 86,647,404$ 431,716,363 23,392 TUOLUMNE Electric, Agricultural 691,431$ 3,259,592 111
Electric, Interdepartmental 93,105$ 425,538 - Electric, Large Commercial/Industrial 5,123,821$ 32,956,595 5 Electric, Streetlighting 213,968$ 584,869 319 Electric, Medium Commercial/Industrial 14,969,285$ 83,518,856 543 Electric, Master-Metered Residential 923,377$ 5,024,768 64 Electric, Residential 39,322,075$ 188,431,826 30,348 Electric Small Commercial/Industrial 8,091,021$ 32,072,661 3,303
TUOLUMNE Total 69,428,083$ 346,274,705 34,692 UNINCORPORATED Electric, Agricultural 37$ (247) 0
Electric, Interdepartmental -$ 352 - Electric, Large Commercial/Industrial -$ 91 - Electric, Streetlighting -$ 1,175 - Electric, Medium Commercial/Industrial 10,059$ 43,726 1 Electric, Master-Metered Residential -$ 2,916 - Electric, Residential 140$ 59,617 1 Electric Small Commercial/Industrial (7,047)$ (35,651) (8) ESLSRS 1,462,736,215$ - -
UNINCORPORATED Total 1,462,739,403$ 71,979 (6) YOLO Electric, Agricultural 24,489,931$ 146,536,959 2,275
Electric, Interdepartmental 807,625$ 3,527,468 - Electric, Large Commercial/Industrial 20,639,901$ 157,001,789 25 Electric, Streetlighting 1,092,696$ 5,230,610 629 Electric, Medium Commercial/Industrial 72,938,694$ 466,830,678 2,452 Electric, Master-Metered Residential 1,586,818$ 9,872,888 144 Electric, Residential 70,244,598$ 433,522,855 79,716 Electric Small Commercial/Industrial 21,980,525$ 105,824,055 6,890
YOLO Total 213,780,788$ 1,328,347,301 92,130 YUBA Electric, Agricultural 6,702,960$ 22,345,282 1,165
Electric, Interdepartmental 168,745$ 769,684 - Electric, Large Commercial/Industrial 4,561,764$ 27,425,570 4 Electric, Streetlighting 478,675$ 1,252,953 296 Electric, Medium Commercial/Industrial 17,438,029$ 89,588,236 533 Electric, Master-Metered Residential 419,654$ 2,327,529 53 Electric, Residential 37,780,628$ 187,222,855 28,011 Electric Small Commercial/Industrial 7,955,927$ 30,532,736 2,504
YUBA Total 75,506,382$ 361,464,845 32,566 Grand Total 13,782,388,156$ 78,372,216,205 5,524,075

Gas Revenue - All Counties 2019
Data
County Revenue Class Sum of Revenue Sum of ThermsSum of Avg Customers
ALAMEDA Gas Residential Master Metered 28,184,937$ 24,144,437 9,536 Gas Residential Individually Metered 260,420,591$ 192,462,317 495,335
ALAMEDA Total 288,605,528$ 216,606,754 504,870 AMADOR Gas Residential Master Metered 67,551$ 82,560 23
Gas Residential Individually Metered 2,820,193$ 2,078,805 5,123 AMADOR Total 2,887,744$ 2,161,365 5,146
BUTTE Gas Residential Master Metered 923,543$ 1,053,214 440 Gas Residential Individually Metered 27,935,249$ 21,508,203 59,278
BUTTE Total 28,858,792$ 22,561,417 59,719 CALAVERAS Gas Residential Master Metered 49,047$ 52,854 5
Gas Residential Individually Metered 478,096$ 376,944 1,010 CALAVERAS Total 527,143$ 429,798 1,014
COLUSA Gas Residential Master Metered 41,053$ 50,562 27 Gas Residential Individually Metered 2,677,885$ 2,158,769 5,614
COLUSA Total 2,718,937$ 2,209,331 5,641 CONTRA COSTA Gas Residential Master Metered 10,466,570$ 9,017,875 3,695
Gas Residential Individually Metered 231,857,476$ 166,019,312 374,322 CONTRA COSTA Total 242,324,046$ 175,037,186 378,017
EL DORADO Gas Residential Master Metered 8,148$ 7,450 9 Gas Residential Individually Metered 13,589,678$ 8,722,749 14,605
EL DORADO Total 13,597,827$ 8,730,199 14,614 FRESNO Gas Residential Master Metered 3,898,084$ 3,546,648 911
Gas Residential Individually Metered 118,429,554$ 94,167,228 256,411 FRESNO Total 122,327,638$ 97,713,875 257,321
GLENN Gas Residential Master Metered 21,183$ 23,495 18 Gas Residential Individually Metered 3,030,437$ 2,482,082 6,955
GLENN Total 3,051,620$ 2,505,577 6,973 HUMBOLDT Gas Residential Master Metered 906,557$ 929,201 327
Gas Residential Individually Metered 25,197,648$ 18,849,464 41,292 HUMBOLDT Total 26,104,206$ 19,778,665 41,619
KERN Gas Residential Master Metered 1,976,844$ 1,669,121 458 Gas Residential Individually Metered 62,319,279$ 50,842,870 140,168
KERN Total 64,296,123$ 52,511,991 140,627 KINGS Gas Residential Master Metered 2,670$ 1,773 3
Gas Residential Individually Metered 965,730$ 895,632 2,743 KINGS Total 968,400$ 897,405 2,746
MADERA Gas Residential Master Metered 148,178$ 142,553 68 Gas Residential Individually Metered 9,510,840$ 8,093,284 23,644
MADERA Total 9,659,018$ 8,235,837 23,712 MARIN Gas Residential Master Metered 4,907,265$ 3,825,411 1,640
Gas Residential Individually Metered 70,754,419$ 47,093,186 86,467 MARIN Total 75,661,684$ 50,918,597 88,107

MENDOCINO Gas Residential Master Metered 157,891$ 184,814 46 Gas Residential Individually Metered 7,279,475$ 5,480,180 12,339
MENDOCINO Total 7,437,366$ 5,664,994 12,385 MERCED Gas Residential Master Metered 562,869$ 640,558 206
Gas Residential Individually Metered 30,906,517$ 25,273,904 71,087 MERCED Total 31,469,386$ 25,914,461 71,294
MONTEREY Gas Residential Master Metered 4,227,340$ 3,867,205 1,541 Gas Residential Individually Metered 62,589,535$ 47,252,983 113,227
MONTEREY Total 66,816,875$ 51,120,188 114,768 NAPA Gas Residential Master Metered 1,688,259$ 1,749,242 661
Gas Residential Individually Metered 26,092,579$ 18,825,929 43,179 NAPA Total 27,780,838$ 20,575,171 43,839
NEVADA Gas Residential Master Metered 373,534$ 353,769 57 Gas Residential Individually Metered 7,975,839$ 5,630,564 10,227
NEVADA Total 8,349,373$ 5,984,333 10,284 PLACER Gas Residential Master Metered 1,212,742$ 1,281,600 429
Gas Residential Individually Metered 76,946,479$ 53,176,900 117,998 PLACER Total 78,159,221$ 54,458,500 118,426
SACRAMENTO Gas Residential Master Metered 15,164,537$ 13,395,298 4,874 Gas Residential Individually Metered 255,793,494$ 185,596,857 456,307
SACRAMENTO Total 270,958,031$ 198,992,154 461,181 SAN BENITO Gas Residential Master Metered 139,193$ 162,244 69
Gas Residential Individually Metered 8,824,849$ 6,715,634 16,322 SAN BENITO Total 8,964,042$ 6,877,878 16,391
SAN BERNARDINO Gas Residential Individually Metered 386,209$ 288,687 830 SAN BERNARDINO Total 386,209$ 288,687 830
SAN FRANCISCO Gas Residential Master Metered 51,956,404$ 41,529,011 12,031 Gas Residential Individually Metered 118,944,294$ 85,968,830 256,998
SAN FRANCISCO Total 170,900,698$ 127,497,840 269,029 SAN JOAQUIN Gas Residential Master Metered 3,218,790$ 3,191,802 1,389
Gas Residential Individually Metered 110,577,154$ 85,741,292 217,942 SAN JOAQUIN Total 113,795,944$ 88,933,094 219,331
SAN LUIS OBISPO Gas Residential Individually Metered 176,598$ 135,461 326 SAN LUIS OBISPO Total 176,598$ 135,461 326
SAN MATEO Gas Residential Master Metered 15,731,023$ 13,007,853 4,966 Gas Residential Individually Metered 151,154,818$ 104,436,842 221,126
SAN MATEO Total 166,885,842$ 117,444,696 226,092 SANTA BARBARA Gas Residential Individually Metered 5,976$ 4,943 18
SANTA BARBARA Total 5,976$ 4,943 18 SANTA CLARA Gas Residential Master Metered 34,047,679$ 30,310,603 11,229
Gas Residential Individually Metered 277,471,993$ 199,244,805 486,904 SANTA CLARA Total 311,519,672$ 229,555,407 498,133
SANTA CRUZ Gas Residential Master Metered 3,462,795$ 3,326,788 1,552 Gas Residential Individually Metered 39,560,780$ 29,047,473 68,549
SANTA CRUZ Total 43,023,574$ 32,374,261 70,101 SHASTA Gas Residential Master Metered 601,901$ 734,888 205
Gas Residential Individually Metered 24,536,704$ 17,792,342 41,123 SHASTA Total 25,138,605$ 18,527,230 41,328

SOLANO Gas Residential Master Metered 2,884,544$ 2,862,716 1,166 Gas Residential Individually Metered 73,734,321$ 55,947,384 144,692
SOLANO Total 76,618,865$ 58,810,100 145,858 SONOMA Gas Residential Master Metered 4,454,069$ 4,688,298 1,308
Gas Residential Individually Metered 89,195,191$ 65,284,844 152,095 SONOMA Total 93,649,259$ 69,973,142 153,403
STANISLAUS Gas Residential Master Metered 1,459,995$ 1,410,824 549 Gas Residential Individually Metered 80,228,072$ 60,868,751 155,116
STANISLAUS Total 81,688,067$ 62,279,575 155,665 SUTTER Gas Residential Master Metered 610,490$ 528,721 219
Gas Residential Individually Metered 15,641,500$ 12,026,465 29,394 SUTTER Total 16,251,990$ 12,555,186 29,613
TEHAMA Gas Residential Master Metered 182,878$ 208,967 40 Gas Residential Individually Metered 4,631,240$ 3,754,349 10,528
TEHAMA Total 4,814,118$ 3,963,316 10,567 TRINITY Gas Residential Master Metered 6,843$ 4,022 1
Gas Residential Individually Metered 18,370$ 15,321 28 TRINITY Total 25,213$ 19,343 29
UNINCORPORATED Gas Residential Master Metered -$ 11,677 - Gas Residential Individually Metered (42)$ 115,342 0
UNINCORPORATED Total (42)$ 127,019 0 YOLO Gas Residential Master Metered 1,991,132$ 1,911,405 638
Gas Residential Individually Metered 31,481,152$ 23,655,528 65,693 YOLO Total 33,472,284$ 25,566,933 66,331
YUBA Gas Residential Master Metered 288,706$ 281,158 93 Gas Residential Individually Metered 8,672,796$ 7,054,246 19,377
YUBA Total 8,961,502$ 7,335,404 19,470 Grand Total 2,528,838,211$ 1,885,277,315 4,284,815

EXHIBIT C
January 14, 2019 Mayor London N. Breed letter to Harlan L. Kelly

EXHIBIT D
March 14, 2019 Mayor London N. Breed and
City Attorney Dennis J. Herrera
letter to PG&E

EXHIBIT E
Board Resolution 174-19

FILE NO. 190367 RESOLUTION NO. 174-19
1 [Requesting the San Francisco Public Utilities Commission to Report on Options for Improving Electric Service through Acquisition, Construction, or Completion of Public Utility]
2
3 Resolution determining that the public interest and necessity require changing the
4 electric service provided in San Francisco; and requesting a report from the San
5 Francisco Public Utilities Commission, under Charter, Section 16.101, on options for
6 improving electric service in San Francisco through acquisition, construction or
7 completion of public utility or utilities.
8
9
10
11
12
13
14
15
16
17
18
19
20
21
22
23
24
25
WHEREAS, The Board of Supervisors seeks to ensure reliable, safe, affordable, clean
electric service to all customers in San Francisco from a utility that is responsive to the needs
of its customers; and
WHEREAS, Pacific Gas & Electric Company's (PG&E) history raises questions about
whether the utility has the ability and commitment to provide such service; recent examples
that cause concern include the following:
i. PG&E's safety violations in its electric and gas operations have caused
significant suffering, loss of life, and damage to property;
ii. PG&E's repeated failure to meet the obligations and manage the risks of its
business while remaining financially healthy, as demonstrated by PG&E's
current voluntary bankruptcy, its voluntary bankruptcy in 2001, and the
bankruptcies of several affiliates in 2003;
iii. PG&E's failure to provide safe and reliable electric service in San Francisco
many years, including a major power outage in December 1998, three fires at
the Mission Substation between1996 and 2003, and several incidents of
underground explosions throughout the City;
Supervisors Ronen; Peskin, Fewer BOARD OF SUPERVISORS Page 1

1
2
3
4
5
6
7
8
9
10
11
12
13
14
iv. PG&E's primary focus on financial performance and public image and its failure
to develop an effective safety culture, as found in two reports prepared for the
California Public Utilities Commission;
v. PG&E's retail rate increases that make its electric service among the most
expensive in the nation, with more increases expected as a result of the
bankruptcy; and
vi. PG&E's consistent use of its monopoly status to delay, prevent, and increase
the cost of the wholesale service it is required to provide to the City under a tariff
approved by the Federal Energy Regulatory Commission, resulting in service
delays and increased costs to critical City facilities-including public schools,
affordable housing, health care facilities, streetlights and traffic controls, the
Port, and basic city infrastructure-and the disruption of services provided to the
public; and
15 WHEREAS, Article XI, Section 9 of the California Constitution grants cities the right to
16 supply electricity if they choose to do so; and
17 WHEREAS, The City has been operating an electric utility since 1918, and has
18 considered several times expanding service to all customers in San Francisco, as envisioned
19 by the Raker Act (Pub. L. No 41, 38 Stat. 242 1913), which granted the City the right to
20 develop the Hetch Hetchy clean water and hydropower resources for the benefit of the people
21 of San Francisco; and
22 WHEREAS, For more than 1 00 years, San Francisco has been producing 1 00%
23 greenhouse gas-free electricity to power our essential city services: hospitals, parks, schools,
24 airport, public housing, and other city properties; and
25
Supervisors Ronen; Peskin, Fewer BOARD OF SUPERVISORS Page

1 WHEREAS, In 2016, despite years of opposition funded by PG&E, San Francisco
2 launched CleanPowerSF, to provide clean renewable energy to residents and businesses,
3 another incremental step toward energy independence; and
4 WHEREAS, According to climate scientists, we must take immediate steps to make the
5 difference between catastrophe and a clean new future and cut carbon pollution in half within
6 11 years; and
7 WHEREAS, The electric power sector is the largest contributor to U.S. global warming
8 emissions and currently accounts for approximately one-third of the nation's total emissions.
9 Natural gas, while producing lower emissions than coal or oil when used, nonetheless
10 generates high levels of air pollution and other environmental impacts through extraction and
11 production; and
12 WHEREAS, In a January 14, 2019 letter, on file with the Clerk of the Board of
13 Supervisors in File No. 190367, Mayor Breed asked the San Francisco Public Utilities
14 Commission (SFPUC) to evaluate in a preliminary report all options for changing how electric
15 service is provided to ensure a safe, clean and dependable power grid; and
16 WHEREAS, Section 16.1 01 of the Charter states: "It is the declared purpose and
17 intention of the people of the City and County, when public interest and necessity demand,
18 that public utilities shall be gradually acquired and ultimately owned by the City and County.
19 Whenever the Board of Supervisors, as provided in Sections 9.1 06, 9.107 and 9.108 of this
20 Charter, shall determine that the public interest or necessity demands the acquisition,
21 construction or completion of any public utility or utilities by the City and County, or whenever
22 the electors shall petition the Board of Supervisors, as provided in Sections 9.110 and 14.101
23 of this Charter, for the acquisition of any public utility or utilities, the Supervisors must procure
24 a report from the Public Utilities Commission thereon"; now, therefore, be it
25
Supervisors Ronen; Peskin, Fewer BOARD OF SUPERVISORS Page 3

1 RESOLVED, That the Board of Supervisors determines that the public interest and
2 necessity require changing the electric service provided in San Francisco, and these changes
3 may include the acquisition of PG&E's electrical system serving San Francisco, construction
4 of new facilities by the City, or completion of the City's own electric system; and, be it
5 FURTHER RESOLVED, That the Board of Supervisors requests a report from the
6 SFPUC within 45 days of this Resolution to help City policymakers and the public understand
7 and evaluate the City's options.
8
9
10
11
12
13
14
15
16
17
18
19
20
21
22
23
24
25
Supervisors Ronen; Peskin, Fewer BOARD OF SUPERVISORS Page4

City and County of San Francisco
Tails
City Hall I Dr. Carlton B. Goodlett Place San Francisco, CA 94102-4689
Resolution
File Number: 190367 Date Passed: April 09, 2019
Resolution determining that the public interest and necessity require changing the electric service provided in San Francisco; and requesting a report from the San Francisco Public Utilities Commission, under Charter, Section 16.101, on options for improving electric service in San Francisco through acquisition, construction or completion of public utility or utilities.
April 09, 2019 Board of Supervisors -ADOPTED
Ayes: 10- Brown, Fewer, Haney, Mandelman, Peskin, Ronen, Safai, Stefani, Walton and Yee Absent: 1 - Mar
File No. 190367
London N. Breed Mayor
City and County of San Francisco Page 1
I hereby certify that the foregoing Resolution was ADOPTED on 4/9/2019 by the Board of Supervisors of the City and County of San Francisco.
Date ppr ved
Printed at 1:46pm on 4/10/19