
Excitation wavelength dependent surface enhanced Raman scattering of 4-aminothiophenol on gold...
6
Excitation wavelength dependent surface enhanced Raman scattering of 4-aminothiophenol on gold nanorings Jian Ye, * ab James Andell Hutchison, b Hiroshi Uji-i, b Johan Hofkens, b Liesbet Lagae, a Guido Maes, b Gustaaf Borghs a and Pol Van Dorpe a Received 20th November 2011, Accepted 20th December 2011 DOI: 10.1039/c2nr11805j Detailed understanding of the underlying mechanisms of surface enhanced Raman scattering (SERS) remains challenging for different experimental conditions. We report on an excitation wavelength dependent SERS of 4-aminothiophenol molecules on gold nanorings. SERS and normal Raman spectra, combined with well-characterized surface morphology, optical spectroscopy and electromagnetic (EM) field simulations of gold nanoring substrates indicate that the EM enhancement occurs at all three excitation wavelengths (532, 633 and 785 nm) employed but at short wavelengths (532 and 633 nm) charge transfer (CT) results in additional strong enhancements of particular Raman transitions. These results pave the way to further understanding the origin of the SERS mechanism. Introduction Raman scattering is typically very weak due to the small scat- tering cross-section of molecules. However, the surface enhanced Raman scattering (SERS) effect can result in the enhancement of Raman scattering by molecules adsorbed on rough metal surfaces. The enhancement factor (EF) can reach a level that enables single molecule detection. 1 The mechanisms behind SERS still remain a matter of controversy, but two mechanisms are extensively mentioned in the literature. In the electromag- netic (EM) mechanism, the excitation of localized surface plas- mons results in strongly enhanced local electric fields around the metal nanostructure, leading to a more intense Raman scattering of molecules near the metal surface. 2–4 In the EM mechanism, the EF of each molecule is approximately given by EF ¼ |EF ex | 2 |EF scat | 2 , where EF ex is the local electric field (EF) at the excitation wavelength and EF scat is the corresponding EF at the Stokes-shifted Raman scattering wavelength. More often, this expression is simplified by assuming that EF ex and EF scat are the same, and hence EF ¼ |EF ex | 4 . The second popular mecha- nism, called charge transfer (CT), involves the excitation of CT between analyte molecules and metal structures to give rise to a resonance Raman enhancement process. 5,6 A SERS substrate can be any plasmon-resonance-supporting nanostructure, for example, nanoshells, 7 nanocubes, 8 nano- triangles, 9 nanostars, 10 nanobowls, 11 nanosphere dimers 12 and aggregates. 13 Recently, plasmonic nanoring structures have also been proposed and demonstrated for SERS application, 14–16 because of their highly tunable optical properties over a broad spectral range and their efficient concentration of EM fields. 14 A particular advantage of the nanorings is that they can be fabri- cated by the nanosphere lithography technique, 14,16 which is a simple, productive, scalable and cheap method. Because the SERS effect mainly arises from the plasmon resonances of the nanostructures, it is typically wavelength dependent. A particular SERS substrate will therefore exhibit good enhancement in a limited excitation wavelength range. For example, a detailed excitation wavelength-scanned SERS spec- troscopic study of benzenethiol adsorbed on silver (Ag) nano- particle arrays, fabricated by nanosphere lithography, has been carried out by McFarland et al. 17 The SERS spectra were correlated with the corresponding localized surface plasmon resonance (LSPR) spectra of the nanoparticle arrays. The maximum SERS enhancement factor (EF max ) was shown to occur for excitation wavelengths which are slightly blue-shifted with respect to the LSPR wavelength of nanoparticle arrays. This is in agreement with the predictions of the EM enhancement mechanism of SERS. Additional work by Etchegoin’s group 18 and Van Duyne’s group 19,20 has made it extensively accepted that the EF max occurs at excitation wavelengths quite close to the spectral locations of the LSPR extinction maximum for indi- vidual non-interacting nanostructures. However, the extinction spectrum is not a good indicator of the maximum SERS enhancement in the case of complex nanostructures, e.g. dimers, quadrimers and non-ordered aggregates. 18 If other effects, such as CT or chemical transformation, are involved, the SERS mechanism becomes even more complicated. The full under- standing of the SERS mechanism remains a challenge. 4-Aminothiophenol (4-ATP), a Raman active probe, has been widely used in SERS because of its strong chemical affinity to Au and Ag and the large SERS signal. 21–28 Another reason of 4-ATP becoming increasingly important is that its b 2 -type Raman a imec vzw, Kapeldreef 75, Leuven, Belgium. E-mail: [email protected]; Fax: +32 1628 1097; Tel: +32 1628 8795 b Chemistry Department, Katholieke Universiteit Leuven, Leuven, Belgium 1606 | Nanoscale, 2012, 4, 1606–1611 This journal is ª The Royal Society of Chemistry 2012 Dynamic Article Links C < Nanoscale Cite this: Nanoscale, 2012, 4, 1606 www.rsc.org/nanoscale PAPER Downloaded by Univ Lille 1 on 08 March 2012 Published on 04 January 2012 on http://pubs.rsc.org | doi:10.1039/C2NR11805J View Online / Journal Homepage / Table of Contents for this issue
-
Upload
independent -
Category
Documents
-
view
2 -
download
0
Transcript of Excitation wavelength dependent surface enhanced Raman scattering of 4-aminothiophenol on gold...
Dynamic Article LinksC<Nanoscale
Cite this: Nanoscale, 2012, 4, 1606
www.rsc.org/nanoscale PAPER
Dow
nloa
ded
by U
niv
Lill
e 1
on 0
8 M
arch
201
2Pu
blis
hed
on 0
4 Ja
nuar
y 20
12 o
n ht
tp://
pubs
.rsc
.org
| do
i:10.
1039
/C2N
R11
805J
View Online / Journal Homepage / Table of Contents for this issue
Excitation wavelength dependent surface enhanced Raman scattering of4-aminothiophenol on gold nanorings
Jian Ye,*ab James Andell Hutchison,b Hiroshi Uji-i,b Johan Hofkens,b Liesbet Lagae,a Guido Maes,b
Gustaaf Borghsa and Pol Van Dorpea
Received 20th November 2011, Accepted 20th December 2011
DOI: 10.1039/c2nr11805j
Detailed understanding of the underlying mechanisms of surface enhanced Raman scattering (SERS)
remains challenging for different experimental conditions. We report on an excitation wavelength
dependent SERS of 4-aminothiophenol molecules on gold nanorings. SERS and normal Raman
spectra, combined with well-characterized surface morphology, optical spectroscopy and
electromagnetic (EM) field simulations of gold nanoring substrates indicate that the EM enhancement
occurs at all three excitation wavelengths (532, 633 and 785 nm) employed but at short wavelengths
(532 and 633 nm) charge transfer (CT) results in additional strong enhancements of particular Raman
transitions. These results pave the way to further understanding the origin of the SERS mechanism.
Introduction
Raman scattering is typically very weak due to the small scat-
tering cross-section of molecules. However, the surface enhanced
Raman scattering (SERS) effect can result in the enhancement of
Raman scattering by molecules adsorbed on rough metal
surfaces. The enhancement factor (EF) can reach a level that
enables single molecule detection.1 The mechanisms behind
SERS still remain a matter of controversy, but two mechanisms
are extensively mentioned in the literature. In the electromag-
netic (EM) mechanism, the excitation of localized surface plas-
mons results in strongly enhanced local electric fields around
the metal nanostructure, leading to a more intense Raman
scattering of molecules near the metal surface.2–4 In the EM
mechanism, the EF of each molecule is approximately given by
EF ¼ |EFex|2|EFscat|
2, where EFex is the local electric field (EF) at
the excitation wavelength and EFscat is the corresponding EF at
the Stokes-shifted Raman scattering wavelength. More often,
this expression is simplified by assuming that EFex and EFscat are
the same, and hence EF ¼ |EFex|4. The second popular mecha-
nism, called charge transfer (CT), involves the excitation of CT
between analyte molecules and metal structures to give rise to
a resonance Raman enhancement process.5,6
A SERS substrate can be any plasmon-resonance-supporting
nanostructure, for example, nanoshells,7 nanocubes,8 nano-
triangles,9 nanostars,10 nanobowls,11 nanosphere dimers12 and
aggregates.13 Recently, plasmonic nanoring structures have also
been proposed and demonstrated for SERS application,14–16
because of their highly tunable optical properties over a broad
aimec vzw, Kapeldreef 75, Leuven, Belgium. E-mail: [email protected];Fax: +32 1628 1097; Tel: +32 1628 8795bChemistry Department, Katholieke Universiteit Leuven, Leuven, Belgium
1606 | Nanoscale, 2012, 4, 1606–1611
spectral range and their efficient concentration of EM fields.14 A
particular advantage of the nanorings is that they can be fabri-
cated by the nanosphere lithography technique,14,16 which is
a simple, productive, scalable and cheap method.
Because the SERS effect mainly arises from the plasmon
resonances of the nanostructures, it is typically wavelength
dependent. A particular SERS substrate will therefore exhibit
good enhancement in a limited excitation wavelength range. For
example, a detailed excitation wavelength-scanned SERS spec-
troscopic study of benzenethiol adsorbed on silver (Ag) nano-
particle arrays, fabricated by nanosphere lithography, has been
carried out by McFarland et al.17 The SERS spectra were
correlated with the corresponding localized surface plasmon
resonance (LSPR) spectra of the nanoparticle arrays. The
maximum SERS enhancement factor (EFmax) was shown to
occur for excitation wavelengths which are slightly blue-shifted
with respect to the LSPR wavelength of nanoparticle arrays. This
is in agreement with the predictions of the EM enhancement
mechanism of SERS. Additional work by Etchegoin’s group18
and Van Duyne’s group19,20 has made it extensively accepted that
the EFmax occurs at excitation wavelengths quite close to the
spectral locations of the LSPR extinction maximum for indi-
vidual non-interacting nanostructures. However, the extinction
spectrum is not a good indicator of the maximum SERS
enhancement in the case of complex nanostructures, e.g. dimers,
quadrimers and non-ordered aggregates.18 If other effects, such
as CT or chemical transformation, are involved, the SERS
mechanism becomes even more complicated. The full under-
standing of the SERS mechanism remains a challenge.
4-Aminothiophenol (4-ATP), a Raman active probe, has been
widely used in SERS because of its strong chemical affinity to Au
and Ag and the large SERS signal.21–28 Another reason of 4-ATP
becoming increasingly important is that its b2-type Raman
This journal is ª The Royal Society of Chemistry 2012
Dow
nloa
ded
by U
niv
Lill
e 1
on 0
8 M
arch
201
2Pu
blis
hed
on 0
4 Ja
nuar
y 20
12 o
n ht
tp://
pubs
.rsc
.org
| do
i:10.
1039
/C2N
R11
805J
View Online
bands, for example, at 1140, 1384 and 1432 cm�1 have been
considered as crucial evidence of the CT effect in SERS.21–25
However, recent reports have reinterpreted that these Raman
bands are from 4,40-dimercaptoazobenzene which is formed
by photo-induced chemical transformation or plasmon-assisted
(or ‘‘hot electrons’’) catalytic reaction of 4-ATP.26,27 Addition-
ally, one has come up with a new observation for the appearance
of these bands that a threshold energy is required.28 In this paper,
we examine the SERS properties of 4-ATP and 4-methoxy-
thiophenol (4-MOTP) with laser excitation at 532, 633 and
785 nm on hollow Au nanorings. Au nanorings are fabricated by
the nanosphere lithography technique. Their uniform, high-
density patterning and accessibility of the surface morphology to
the surrounding media are favorable for SERS measurements.
With a similar molecular structure, 4-ATP and 4-MOTP show
distinct SERS spectra at different excitation wavelengths in
terms of the relative intensity of the Raman bands. In particular,
the intensity of b2-type Raman bands of 4-ATP is relatively
enhanced at 532 and 633 nm. A full understanding of Au
nanorings’ morphology, optical properties and local electric field
properties may help us assess the different origins of the SERS
of 4-ATP.
Experimental
The Au nanorings were fabricated according to a slightly
modified nanosphere lithography method (Fig. 1).14,29 Prior to
use, the quartz substrate was cleaned for 5 min by subsequently
submerging it in acetone (45� 2 �C) and 2-propanol (60� 2 �C),respectively, then rinsed well with deionized H2O, and dried in
a nitrogen stream. Next, the substrate surface was functionalized
by pipetting a 1 mL aqueous solution containing 0.2% poly-
diallyldimethyl-ammonium (PDDA, Mw 100 000–200 000,
Sigma Aldrich) onto the substrate, followed by careful rinsing
with deionized H2O in order to remove all excess of PDDA and
drying in a nitrogen stream. Deposition of an aqueous suspen-
sion containing 100 nm size polystyrene (PS) beads (0.2% solid,
Interfacial Dynamics Corp.) could result in the substrate surface
covered by a submonolayer of uniformly distributed PS beads as
sacrificial masks. A 30 nm thick Au film was deposited subse-
quently on top of the PS beads by sputtering, followed by a Xe
ion milling process for 1 min.30 Finally, a 30 min oxygen plasma
treatment was used to remove the remaining PS beads.
Fig. 1 Schematic illustration of the fabrication procedure for hollow Au
nanorings.
This journal is ª The Royal Society of Chemistry 2012
The extinction spectrum was measured using a Shimadzu UV-
1601PC spectrophotometer. The SEM image was taken using
a Philips XL30 FEG instrument. The AFM image was acquired
in a tapping mode on a Dimension 3100/Nanoscope IV, VEECO
under ambient conditions. All Raman spectra were recorded on
a Horiba Jobin Yvon LabRam HR 800 system in a backscat-
tering configuration using a laser illumination of 532 (0.98 mW),
633 (0.97 mW), and 785 nm (0.8 mW). A 100� objective (NA ¼0.9) mounted on an Olympus BXFM-ILHSmicroscope was used
to focus the laser. The Raman band of a silicon wafer at 520 cm�1
was used to calibrate the spectrometer. The spectral resolution of
the system was 1.5 cm�1. In order to chemisorb a monolayer of
molecules on Au nanorings, the nanoring substrates were cleaned
by UV ozone and were soaked in a fresh ethanol solution of
4-ATP (0.3 mM, Acros Organics) or 4-MOTP (1.7 mM, Acros
Organics) overnight, rinsed thoroughly with ethanol, and dried
in a nitrogen stream before the Raman measurement. All Raman
spectra were plotted and normalized to [0, 1] for comparison
except for the EF calculation.
Simulation
Numerical simulations were performed by employing a finite
difference time domain (FDTD) method (Lumerical Solutions,
Inc.). The Au nanoring is illuminated by normal incident light
with its polarization along the X-direction (Fig. 1). The whole
simulation region is assumed in air. We have used the Lumer-
ical’s multi-coefficient model (MCM) to fit the empirical Au
dielectric function from CRC.31,32
Results and discussion
Fig. 1 outlines the procedure to fabricate Au nanorings. During
the deposition of PS particles suspension, the electrostatic
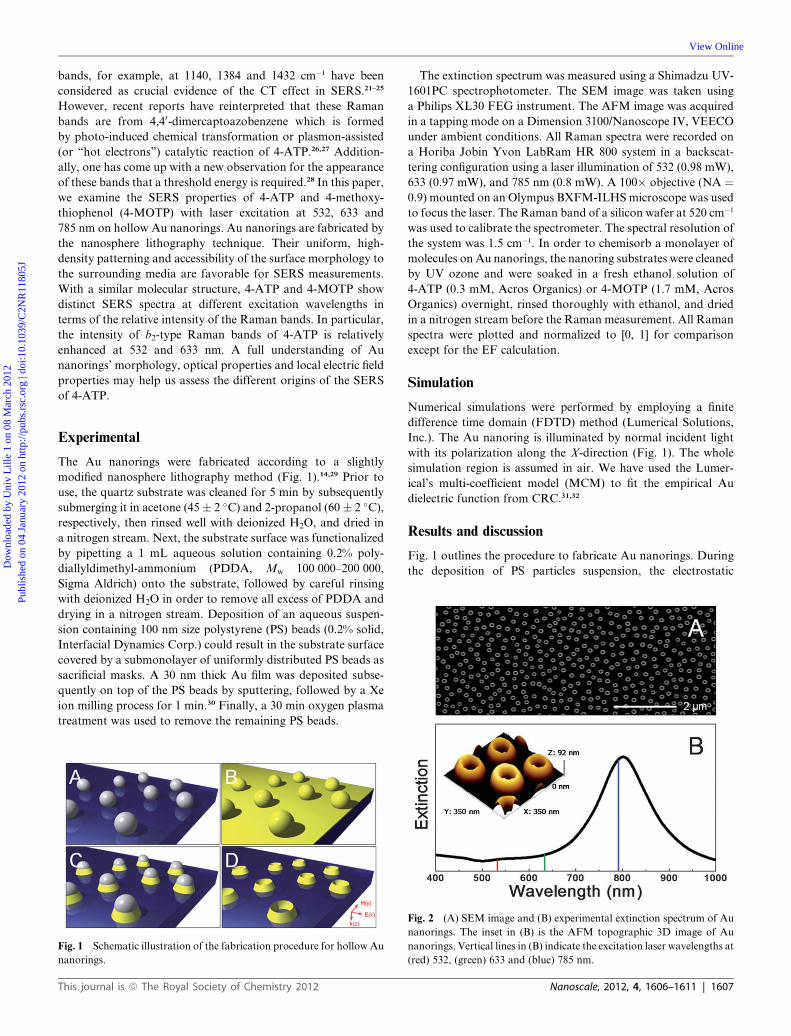
Fig. 2 (A) SEM image and (B) experimental extinction spectrum of Au
nanorings. The inset in (B) is the AFM topographic 3D image of Au
nanorings. Vertical lines in (B) indicate the excitation laser wavelengths at
(red) 532, (green) 633 and (blue) 785 nm.
Nanoscale, 2012, 4, 1606–1611 | 1607
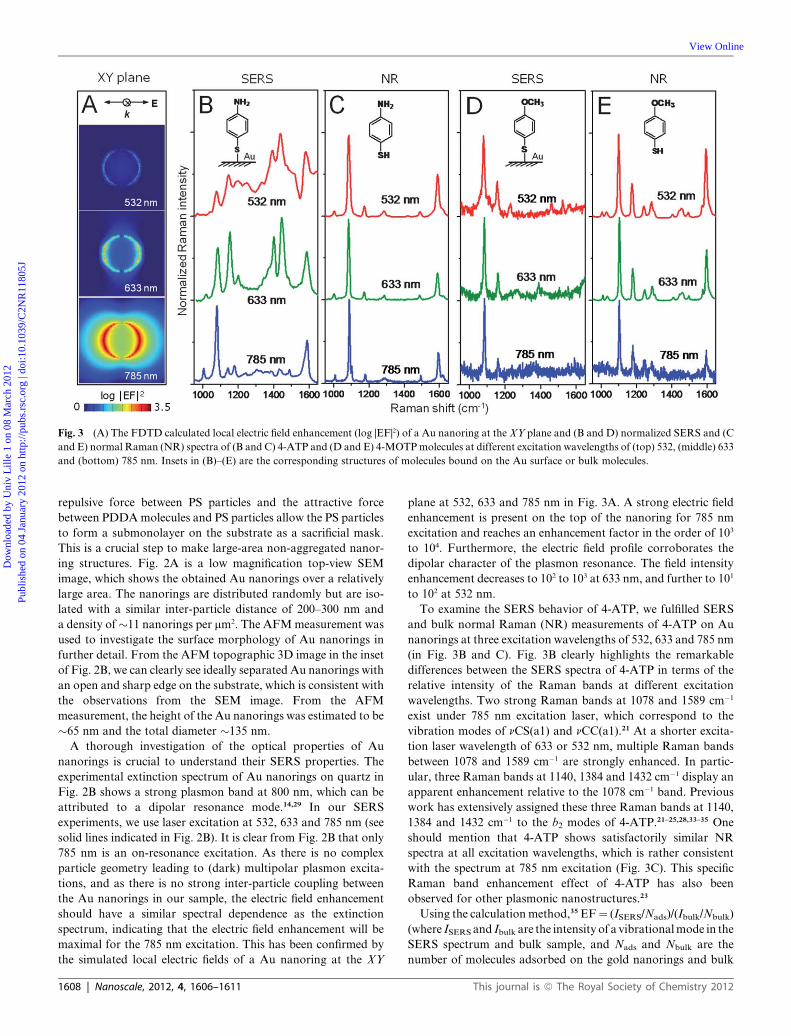
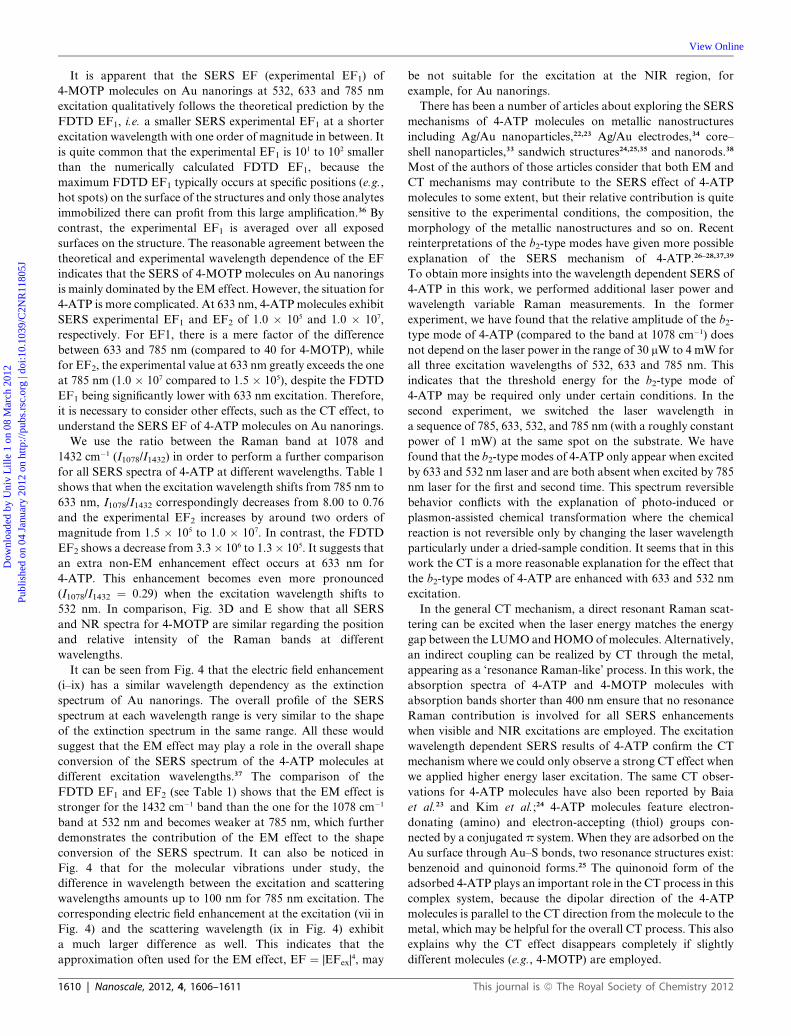
Fig. 3 (A) The FDTD calculated local electric field enhancement (log |EF|2) of a Au nanoring at the XY plane and (B and D) normalized SERS and (C
and E) normal Raman (NR) spectra of (B and C) 4-ATP and (D and E) 4-MOTPmolecules at different excitation wavelengths of (top) 532, (middle) 633
and (bottom) 785 nm. Insets in (B)–(E) are the corresponding structures of molecules bound on the Au surface or bulk molecules.
Dow
nloa
ded
by U
niv
Lill
e 1
on 0
8 M
arch
201
2Pu
blis
hed
on 0
4 Ja
nuar
y 20
12 o
n ht
tp://
pubs
.rsc
.org
| do
i:10.
1039
/C2N
R11
805J
View Online
repulsive force between PS particles and the attractive force
between PDDAmolecules and PS particles allow the PS particles
to form a submonolayer on the substrate as a sacrificial mask.
This is a crucial step to make large-area non-aggregated nanor-
ing structures. Fig. 2A is a low magnification top-view SEM
image, which shows the obtained Au nanorings over a relatively
large area. The nanorings are distributed randomly but are iso-
lated with a similar inter-particle distance of 200–300 nm and
a density of�11 nanorings per mm2. The AFMmeasurement was
used to investigate the surface morphology of Au nanorings in
further detail. From the AFM topographic 3D image in the inset
of Fig. 2B, we can clearly see ideally separated Au nanorings with
an open and sharp edge on the substrate, which is consistent with
the observations from the SEM image. From the AFM
measurement, the height of the Au nanorings was estimated to be
�65 nm and the total diameter �135 nm.
A thorough investigation of the optical properties of Au
nanorings is crucial to understand their SERS properties. The
experimental extinction spectrum of Au nanorings on quartz in
Fig. 2B shows a strong plasmon band at 800 nm, which can be
attributed to a dipolar resonance mode.14,29 In our SERS
experiments, we use laser excitation at 532, 633 and 785 nm (see
solid lines indicated in Fig. 2B). It is clear from Fig. 2B that only
785 nm is an on-resonance excitation. As there is no complex
particle geometry leading to (dark) multipolar plasmon excita-
tions, and as there is no strong inter-particle coupling between
the Au nanorings in our sample, the electric field enhancement
should have a similar spectral dependence as the extinction
spectrum, indicating that the electric field enhancement will be
maximal for the 785 nm excitation. This has been confirmed by
the simulated local electric fields of a Au nanoring at the XY
1608 | Nanoscale, 2012, 4, 1606–1611
plane at 532, 633 and 785 nm in Fig. 3A. A strong electric field
enhancement is present on the top of the nanoring for 785 nm
excitation and reaches an enhancement factor in the order of 103
to 104. Furthermore, the electric field profile corroborates the
dipolar character of the plasmon resonance. The field intensity
enhancement decreases to 102 to 103 at 633 nm, and further to 101
to 102 at 532 nm.
To examine the SERS behavior of 4-ATP, we fulfilled SERS
and bulk normal Raman (NR) measurements of 4-ATP on Au
nanorings at three excitation wavelengths of 532, 633 and 785 nm
(in Fig. 3B and C). Fig. 3B clearly highlights the remarkable
differences between the SERS spectra of 4-ATP in terms of the
relative intensity of the Raman bands at different excitation
wavelengths. Two strong Raman bands at 1078 and 1589 cm�1
exist under 785 nm excitation laser, which correspond to the
vibration modes of nCS(a1) and nCC(a1).21 At a shorter excita-
tion laser wavelength of 633 or 532 nm, multiple Raman bands
between 1078 and 1589 cm�1 are strongly enhanced. In partic-
ular, three Raman bands at 1140, 1384 and 1432 cm�1 display an
apparent enhancement relative to the 1078 cm�1 band. Previous
work has extensively assigned these three Raman bands at 1140,
1384 and 1432 cm�1 to the b2 modes of 4-ATP.21–25,28,33–35 One
should mention that 4-ATP shows satisfactorily similar NR
spectra at all excitation wavelengths, which is rather consistent
with the spectrum at 785 nm excitation (Fig. 3C). This specific
Raman band enhancement effect of 4-ATP has also been
observed for other plasmonic nanostructures.23
Using the calculationmethod,35EF¼ (ISERS/Nads)/(Ibulk/Nbulk)
(where ISERS and Ibulk are the intensity of a vibrationalmode in the
SERS spectrum and bulk sample, and Nads and Nbulk are the
number of molecules adsorbed on the gold nanorings and bulk
This journal is ª The Royal Society of Chemistry 2012
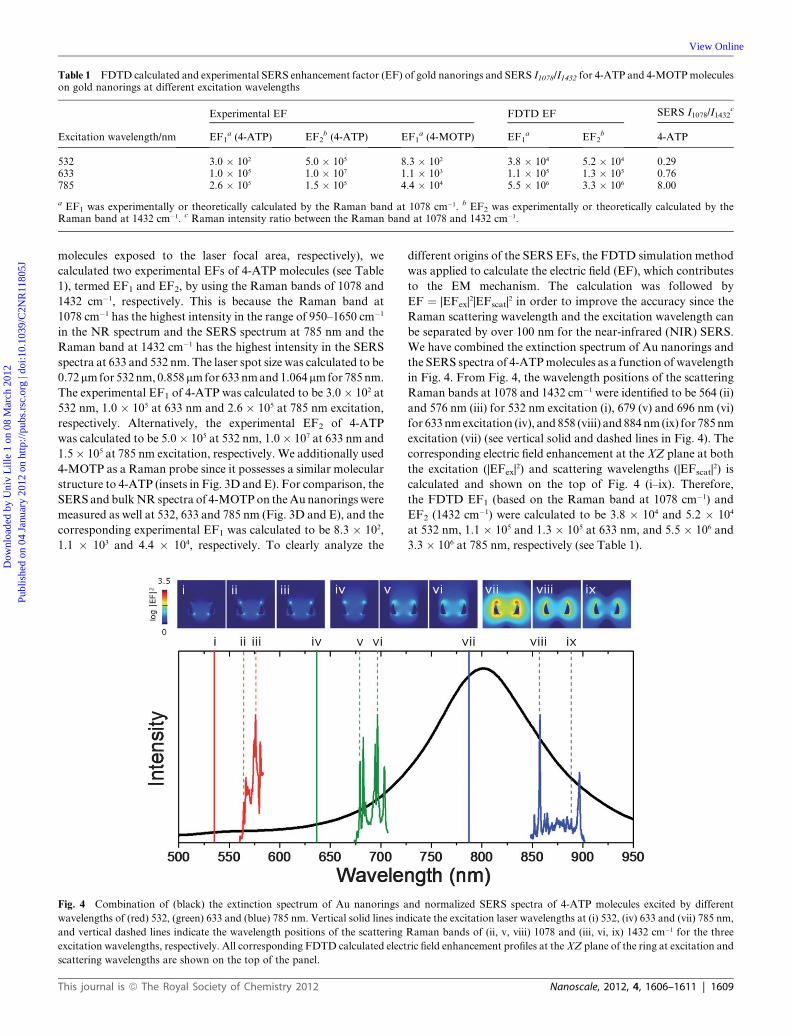
Table 1 FDTD calculated and experimental SERS enhancement factor (EF) of gold nanorings and SERS I1078/I1432 for 4-ATP and 4-MOTPmoleculeson gold nanorings at different excitation wavelengths
Excitation wavelength/nm
Experimental EF FDTD EF SERS I1078/I1432c
EF1a (4-ATP) EF2
b (4-ATP) EF1a (4-MOTP) EF1
a EF2b 4-ATP
532 3.0 � 102 5.0 � 105 8.3 � 102 3.8 � 104 5.2 � 104 0.29633 1.0 � 105 1.0 � 107 1.1 � 103 1.1 � 105 1.3 � 105 0.76785 2.6 � 105 1.5 � 105 4.4 � 104 5.5 � 106 3.3 � 106 8.00
a EF1 was experimentally or theoretically calculated by the Raman band at 1078 cm�1. b EF2 was experimentally or theoretically calculated by theRaman band at 1432 cm�1. c Raman intensity ratio between the Raman band at 1078 and 1432 cm�1.
Dow
nloa
ded
by U
niv
Lill
e 1
on 0
8 M
arch
201
2Pu
blis
hed
on 0
4 Ja
nuar
y 20
12 o
n ht
tp://
pubs
.rsc
.org
| do
i:10.
1039
/C2N
R11
805J
View Online
molecules exposed to the laser focal area, respectively), we
calculated two experimental EFs of 4-ATP molecules (see Table
1), termed EF1 and EF2, by using the Raman bands of 1078 and
1432 cm�1, respectively. This is because the Raman band at
1078 cm�1 has the highest intensity in the range of 950–1650 cm�1
in the NR spectrum and the SERS spectrum at 785 nm and the
Raman band at 1432 cm�1 has the highest intensity in the SERS
spectra at 633 and 532 nm. The laser spot size was calculated to be
0.72mmfor 532nm, 0.858mmfor 633nmand1.064mmfor 785nm.
The experimental EF1 of 4-ATP was calculated to be 3.0� 102 at
532 nm, 1.0 � 105 at 633 nm and 2.6 � 105 at 785 nm excitation,
respectively. Alternatively, the experimental EF2 of 4-ATP
was calculated to be 5.0� 105 at 532 nm, 1.0� 107 at 633 nm and
1.5� 105 at 785 nm excitation, respectively. We additionally used
4-MOTP as a Raman probe since it possesses a similar molecular
structure to 4-ATP (insets in Fig. 3D and E). For comparison, the
SERS and bulkNR spectra of 4-MOTPon theAunanorings were
measured as well at 532, 633 and 785 nm (Fig. 3D and E), and the
corresponding experimental EF1 was calculated to be 8.3 � 102,
1.1 � 103 and 4.4 � 104, respectively. To clearly analyze the
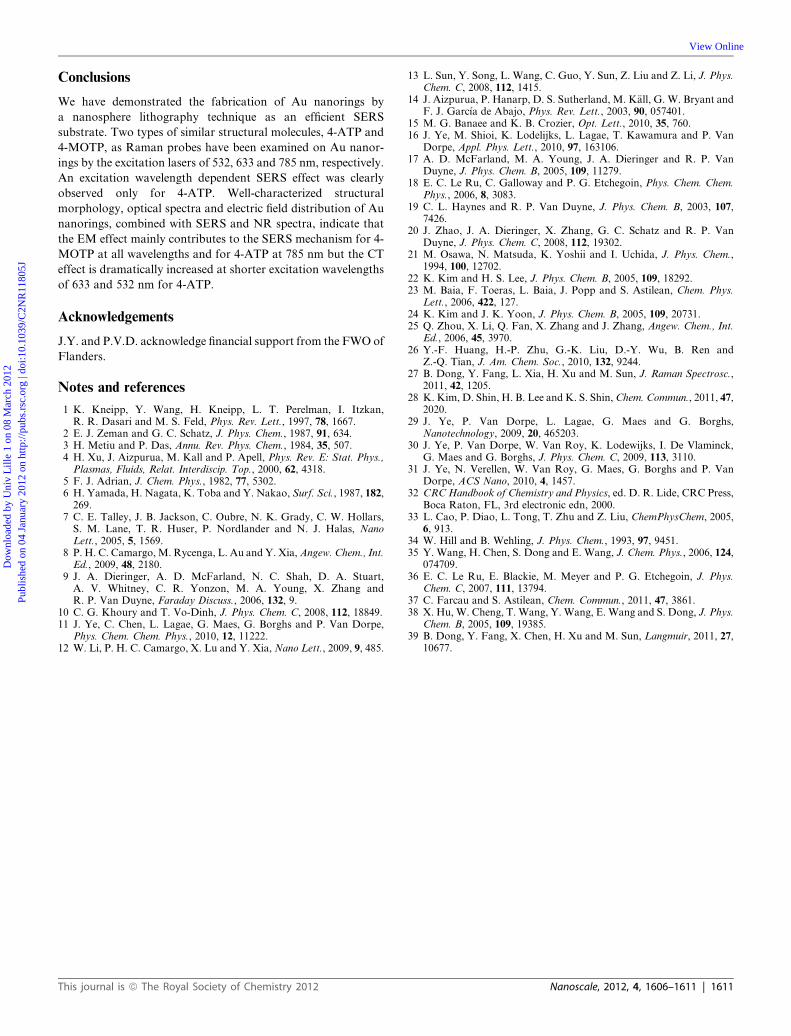
Fig. 4 Combination of (black) the extinction spectrum of Au nanorings a
wavelengths of (red) 532, (green) 633 and (blue) 785 nm. Vertical solid lines ind
and vertical dashed lines indicate the wavelength positions of the scattering
excitation wavelengths, respectively. All corresponding FDTD calculated elect
scattering wavelengths are shown on the top of the panel.
This journal is ª The Royal Society of Chemistry 2012
different origins of the SERS EFs, the FDTD simulation method
was applied to calculate the electric field (EF), which contributes
to the EM mechanism. The calculation was followed by
EF ¼ |EFex|2|EFscat|
2 in order to improve the accuracy since the
Raman scattering wavelength and the excitation wavelength can
be separated by over 100 nm for the near-infrared (NIR) SERS.
We have combined the extinction spectrum of Au nanorings and
the SERS spectra of 4-ATPmolecules as a function of wavelength
in Fig. 4. From Fig. 4, the wavelength positions of the scattering
Raman bands at 1078 and 1432 cm�1 were identified to be 564 (ii)
and 576 nm (iii) for 532 nm excitation (i), 679 (v) and 696 nm (vi)
for 633 nmexcitation (iv), and 858 (viii) and 884nm(ix) for 785 nm
excitation (vii) (see vertical solid and dashed lines in Fig. 4). The
corresponding electric field enhancement at the XZ plane at both
the excitation (|EFex|2) and scattering wavelengths (|EFscat|
2) is
calculated and shown on the top of Fig. 4 (i–ix). Therefore,
the FDTD EF1 (based on the Raman band at 1078 cm�1) and
EF2 (1432 cm�1) were calculated to be 3.8 � 104 and 5.2 � 104
at 532 nm, 1.1 � 105 and 1.3 � 105 at 633 nm, and 5.5 � 106 and
3.3 � 106 at 785 nm, respectively (see Table 1).
nd normalized SERS spectra of 4-ATP molecules excited by different
icate the excitation laser wavelengths at (i) 532, (iv) 633 and (vii) 785 nm,
Raman bands of (ii, v, viii) 1078 and (iii, vi, ix) 1432 cm�1 for the three
ric field enhancement profiles at the XZ plane of the ring at excitation and
Nanoscale, 2012, 4, 1606–1611 | 1609
Dow
nloa
ded
by U
niv
Lill
e 1
on 0
8 M
arch
201
2Pu
blis
hed
on 0
4 Ja
nuar
y 20
12 o
n ht
tp://
pubs
.rsc
.org
| do
i:10.
1039
/C2N
R11
805J
View Online
It is apparent that the SERS EF (experimental EF1) of
4-MOTP molecules on Au nanorings at 532, 633 and 785 nm
excitation qualitatively follows the theoretical prediction by the
FDTD EF1, i.e. a smaller SERS experimental EF1 at a shorter
excitation wavelength with one order of magnitude in between. It
is quite common that the experimental EF1 is 101 to 102 smaller
than the numerically calculated FDTD EF1, because the
maximum FDTD EF1 typically occurs at specific positions (e.g.,
hot spots) on the surface of the structures and only those analytes
immobilized there can profit from this large amplification.36 By
contrast, the experimental EF1 is averaged over all exposed
surfaces on the structure. The reasonable agreement between the
theoretical and experimental wavelength dependence of the EF
indicates that the SERS of 4-MOTP molecules on Au nanorings
is mainly dominated by the EM effect. However, the situation for
4-ATP is more complicated. At 633 nm, 4-ATP molecules exhibit
SERS experimental EF1 and EF2 of 1.0 � 105 and 1.0 � 107,
respectively. For EF1, there is a mere factor of the difference
between 633 and 785 nm (compared to 40 for 4-MOTP), while
for EF2, the experimental value at 633 nm greatly exceeds the one
at 785 nm (1.0 � 107 compared to 1.5 � 105), despite the FDTD
EF1 being significantly lower with 633 nm excitation. Therefore,
it is necessary to consider other effects, such as the CT effect, to
understand the SERS EF of 4-ATP molecules on Au nanorings.
We use the ratio between the Raman band at 1078 and
1432 cm�1 (I1078/I1432) in order to perform a further comparison
for all SERS spectra of 4-ATP at different wavelengths. Table 1
shows that when the excitation wavelength shifts from 785 nm to
633 nm, I1078/I1432 correspondingly decreases from 8.00 to 0.76
and the experimental EF2 increases by around two orders of
magnitude from 1.5 � 105 to 1.0 � 107. In contrast, the FDTD
EF2 shows a decrease from 3.3� 106 to 1.3� 105. It suggests that
an extra non-EM enhancement effect occurs at 633 nm for
4-ATP. This enhancement becomes even more pronounced
(I1078/I1432 ¼ 0.29) when the excitation wavelength shifts to
532 nm. In comparison, Fig. 3D and E show that all SERS
and NR spectra for 4-MOTP are similar regarding the position
and relative intensity of the Raman bands at different
wavelengths.
It can be seen from Fig. 4 that the electric field enhancement
(i–ix) has a similar wavelength dependency as the extinction
spectrum of Au nanorings. The overall profile of the SERS
spectrum at each wavelength range is very similar to the shape
of the extinction spectrum in the same range. All these would
suggest that the EM effect may play a role in the overall shape
conversion of the SERS spectrum of the 4-ATP molecules at
different excitation wavelengths.37 The comparison of the
FDTD EF1 and EF2 (see Table 1) shows that the EM effect is
stronger for the 1432 cm�1 band than the one for the 1078 cm�1
band at 532 nm and becomes weaker at 785 nm, which further
demonstrates the contribution of the EM effect to the shape
conversion of the SERS spectrum. It can also be noticed in
Fig. 4 that for the molecular vibrations under study, the
difference in wavelength between the excitation and scattering
wavelengths amounts up to 100 nm for 785 nm excitation. The
corresponding electric field enhancement at the excitation (vii in
Fig. 4) and the scattering wavelength (ix in Fig. 4) exhibit
a much larger difference as well. This indicates that the
approximation often used for the EM effect, EF ¼ |EFex|4, may
1610 | Nanoscale, 2012, 4, 1606–1611
be not suitable for the excitation at the NIR region, for
example, for Au nanorings.
There has been a number of articles about exploring the SERS
mechanisms of 4-ATP molecules on metallic nanostructures
including Ag/Au nanoparticles,22,23 Ag/Au electrodes,34 core–
shell nanoparticles,33 sandwich structures24,25,35 and nanorods.38
Most of the authors of those articles consider that both EM and
CT mechanisms may contribute to the SERS effect of 4-ATP
molecules to some extent, but their relative contribution is quite
sensitive to the experimental conditions, the composition, the
morphology of the metallic nanostructures and so on. Recent
reinterpretations of the b2-type modes have given more possible
explanation of the SERS mechanism of 4-ATP.26–28,37,39
To obtain more insights into the wavelength dependent SERS of
4-ATP in this work, we performed additional laser power and
wavelength variable Raman measurements. In the former
experiment, we have found that the relative amplitude of the b2-
type mode of 4-ATP (compared to the band at 1078 cm�1) does
not depend on the laser power in the range of 30 mW to 4 mW for
all three excitation wavelengths of 532, 633 and 785 nm. This
indicates that the threshold energy for the b2-type mode of
4-ATP may be required only under certain conditions. In the
second experiment, we switched the laser wavelength in
a sequence of 785, 633, 532, and 785 nm (with a roughly constant
power of 1 mW) at the same spot on the substrate. We have
found that the b2-type modes of 4-ATP only appear when excited
by 633 and 532 nm laser and are both absent when excited by 785
nm laser for the first and second time. This spectrum reversible
behavior conflicts with the explanation of photo-induced or
plasmon-assisted chemical transformation where the chemical
reaction is not reversible only by changing the laser wavelength
particularly under a dried-sample condition. It seems that in this
work the CT is a more reasonable explanation for the effect that
the b2-type modes of 4-ATP are enhanced with 633 and 532 nm
excitation.
In the general CT mechanism, a direct resonant Raman scat-
tering can be excited when the laser energy matches the energy
gap between the LUMO andHOMO of molecules. Alternatively,
an indirect coupling can be realized by CT through the metal,
appearing as a ‘resonance Raman-like’ process. In this work, the
absorption spectra of 4-ATP and 4-MOTP molecules with
absorption bands shorter than 400 nm ensure that no resonance
Raman contribution is involved for all SERS enhancements
when visible and NIR excitations are employed. The excitation
wavelength dependent SERS results of 4-ATP confirm the CT
mechanism where we could only observe a strong CT effect when
we applied higher energy laser excitation. The same CT obser-
vations for 4-ATP molecules have also been reported by Baia
et al.23 and Kim et al.;24 4-ATP molecules feature electron-
donating (amino) and electron-accepting (thiol) groups con-
nected by a conjugated p system. When they are adsorbed on the
Au surface through Au–S bonds, two resonance structures exist:
benzenoid and quinonoid forms.25 The quinonoid form of the
adsorbed 4-ATP plays an important role in the CT process in this
complex system, because the dipolar direction of the 4-ATP
molecules is parallel to the CT direction from the molecule to the
metal, which may be helpful for the overall CT process. This also
explains why the CT effect disappears completely if slightly
different molecules (e.g., 4-MOTP) are employed.
This journal is ª The Royal Society of Chemistry 2012
Dow
nloa
ded
by U
niv
Lill
e 1
on 0
8 M
arch
201
2Pu
blis
hed
on 0
4 Ja
nuar
y 20
12 o
n ht
tp://
pubs
.rsc
.org
| do
i:10.
1039
/C2N
R11
805J
View Online
Conclusions
We have demonstrated the fabrication of Au nanorings by
a nanosphere lithography technique as an efficient SERS
substrate. Two types of similar structural molecules, 4-ATP and
4-MOTP, as Raman probes have been examined on Au nanor-
ings by the excitation lasers of 532, 633 and 785 nm, respectively.
An excitation wavelength dependent SERS effect was clearly
observed only for 4-ATP. Well-characterized structural
morphology, optical spectra and electric field distribution of Au
nanorings, combined with SERS and NR spectra, indicate that
the EM effect mainly contributes to the SERS mechanism for 4-
MOTP at all wavelengths and for 4-ATP at 785 nm but the CT
effect is dramatically increased at shorter excitation wavelengths
of 633 and 532 nm for 4-ATP.
Acknowledgements
J.Y. and P.V.D. acknowledge financial support from the FWO of
Flanders.
Notes and references
1 K. Kneipp, Y. Wang, H. Kneipp, L. T. Perelman, I. Itzkan,R. R. Dasari and M. S. Feld, Phys. Rev. Lett., 1997, 78, 1667.
2 E. J. Zeman and G. C. Schatz, J. Phys. Chem., 1987, 91, 634.3 H. Metiu and P. Das, Annu. Rev. Phys. Chem., 1984, 35, 507.4 H. Xu, J. Aizpurua, M. Kall and P. Apell, Phys. Rev. E: Stat. Phys.,Plasmas, Fluids, Relat. Interdiscip. Top., 2000, 62, 4318.
5 F. J. Adrian, J. Chem. Phys., 1982, 77, 5302.6 H. Yamada, H. Nagata, K. Toba and Y. Nakao, Surf. Sci., 1987, 182,269.
7 C. E. Talley, J. B. Jackson, C. Oubre, N. K. Grady, C. W. Hollars,S. M. Lane, T. R. Huser, P. Nordlander and N. J. Halas, NanoLett., 2005, 5, 1569.
8 P. H. C. Camargo,M. Rycenga, L. Au and Y. Xia,Angew. Chem., Int.Ed., 2009, 48, 2180.
9 J. A. Dieringer, A. D. McFarland, N. C. Shah, D. A. Stuart,A. V. Whitney, C. R. Yonzon, M. A. Young, X. Zhang andR. P. Van Duyne, Faraday Discuss., 2006, 132, 9.
10 C. G. Khoury and T. Vo-Dinh, J. Phys. Chem. C, 2008, 112, 18849.11 J. Ye, C. Chen, L. Lagae, G. Maes, G. Borghs and P. Van Dorpe,
Phys. Chem. Chem. Phys., 2010, 12, 11222.12 W. Li, P. H. C. Camargo, X. Lu and Y. Xia, Nano Lett., 2009, 9, 485.
This journal is ª The Royal Society of Chemistry 2012
13 L. Sun, Y. Song, L. Wang, C. Guo, Y. Sun, Z. Liu and Z. Li, J. Phys.Chem. C, 2008, 112, 1415.
14 J. Aizpurua, P. Hanarp, D. S. Sutherland, M. K€all, G. W. Bryant andF. J. Garc�ıa de Abajo, Phys. Rev. Lett., 2003, 90, 057401.
15 M. G. Banaee and K. B. Crozier, Opt. Lett., 2010, 35, 760.16 J. Ye, M. Shioi, K. Lodelijks, L. Lagae, T. Kawamura and P. Van
Dorpe, Appl. Phys. Lett., 2010, 97, 163106.17 A. D. McFarland, M. A. Young, J. A. Dieringer and R. P. Van
Duyne, J. Phys. Chem. B, 2005, 109, 11279.18 E. C. Le Ru, C. Galloway and P. G. Etchegoin, Phys. Chem. Chem.
Phys., 2006, 8, 3083.19 C. L. Haynes and R. P. Van Duyne, J. Phys. Chem. B, 2003, 107,
7426.20 J. Zhao, J. A. Dieringer, X. Zhang, G. C. Schatz and R. P. Van
Duyne, J. Phys. Chem. C, 2008, 112, 19302.21 M. Osawa, N. Matsuda, K. Yoshii and I. Uchida, J. Phys. Chem.,
1994, 100, 12702.22 K. Kim and H. S. Lee, J. Phys. Chem. B, 2005, 109, 18292.23 M. Baia, F. Toeras, L. Baia, J. Popp and S. Astilean, Chem. Phys.
Lett., 2006, 422, 127.24 K. Kim and J. K. Yoon, J. Phys. Chem. B, 2005, 109, 20731.25 Q. Zhou, X. Li, Q. Fan, X. Zhang and J. Zhang, Angew. Chem., Int.
Ed., 2006, 45, 3970.26 Y.-F. Huang, H.-P. Zhu, G.-K. Liu, D.-Y. Wu, B. Ren and
Z.-Q. Tian, J. Am. Chem. Soc., 2010, 132, 9244.27 B. Dong, Y. Fang, L. Xia, H. Xu and M. Sun, J. Raman Spectrosc.,
2011, 42, 1205.28 K. Kim, D. Shin, H. B. Lee and K. S. Shin,Chem. Commun., 2011, 47,
2020.29 J. Ye, P. Van Dorpe, L. Lagae, G. Maes and G. Borghs,
Nanotechnology, 2009, 20, 465203.30 J. Ye, P. Van Dorpe, W. Van Roy, K. Lodewijks, I. De Vlaminck,
G. Maes and G. Borghs, J. Phys. Chem. C, 2009, 113, 3110.31 J. Ye, N. Verellen, W. Van Roy, G. Maes, G. Borghs and P. Van
Dorpe, ACS Nano, 2010, 4, 1457.32 CRCHandbook of Chemistry and Physics, ed. D. R. Lide, CRC Press,
Boca Raton, FL, 3rd electronic edn, 2000.33 L. Cao, P. Diao, L. Tong, T. Zhu and Z. Liu, ChemPhysChem, 2005,
6, 913.34 W. Hill and B. Wehling, J. Phys. Chem., 1993, 97, 9451.35 Y. Wang, H. Chen, S. Dong and E. Wang, J. Chem. Phys., 2006, 124,
074709.36 E. C. Le Ru, E. Blackie, M. Meyer and P. G. Etchegoin, J. Phys.
Chem. C, 2007, 111, 13794.37 C. Farcau and S. Astilean, Chem. Commun., 2011, 47, 3861.38 X. Hu, W. Cheng, T. Wang, Y. Wang, E. Wang and S. Dong, J. Phys.
Chem. B, 2005, 109, 19385.39 B. Dong, Y. Fang, X. Chen, H. Xu and M. Sun, Langmuir, 2011, 27,
10677.
Nanoscale, 2012, 4, 1606–1611 | 1611