Exane BNPP Virtual European Mid Cap CEO Conference
33
Exane BNPP Virtual European Mid Cap CEO Conference, November 16, 2020 | | Christopher Guérin, CEO | Jean-Christophe Juillard, CFO Paris November 16, 2020 Exane BNPP Virtual European Mid Cap CEO Conference
-
Upload
khangminh22 -
Category
Documents
-
view
2 -
download
0
Transcript of Exane BNPP Virtual European Mid Cap CEO Conference

Exane BNPP Virtual European Mid Cap CEO Conference, November 16, 2020|
| Christopher Guérin, CEO | Jean-Christophe Juillard, CFO
Paris November 16, 2020
Exane BNPP Virtual European Mid Cap CEO Conference
Exane BNPP Virtual European Mid Cap CEO Conference, November 16, 2020|2
NB: Any discrepancies are due to rounding
This press release contains forward-looking statements which are subject to various expected or unexpected risks and uncertainties that could have a material impact on the Company’s future performance.Readers are also invited to visit the Group’s website where they can view and download the presentation of the 2019 annual results to analysts as well as the 2019 financial statements and Nexans Universal Registration Document, which includes a description of the Group’s risk factors - particularly those related to the investigations into anti-competitive behavior launched in 2009. In addition to the risk factors described in Section 3.1 of the 2019 Universal Registration Document and the risks inherent in executing the New Nexans Transformation Plan, the uncertainties for the second half of 2020 mainly include:o The impact of protectionist trade policies globally (such as those implemented by the current US government), as well as growing pressure to increase local content requirements;o Geopolitical instability, particularly in certain countries, cities or regions such as Qatar, Libya, Lebanon, Iraq, the Persian/Arabian Gulf, Hong Kong, Ivory Coast and Nigeria; o The impact that the coronavirus pandemic and the adoption by State authorities, in many countries around the world, of national restrictive measures in particular in the context of a second wave of the pandemic such as in
Europe (including prolonged measures to control the pandemic such as travel bans, curfews and country lockdowns) could have on our Group’s business growth, operating profit and financial position;o The increase in credit risk in certain countries (like Brazil, Peru, Colombia, Morocco and Turkey) in the context of the coronavirus pandemic;o The uncertain economic environment in the United States and Europe, with the risk of growth being slowed by potential major changes in US trade policy on the one hand and the possible consequences of Brexit on the other;o Political, social and economic uncertainty in South America, such as in Brazil, Chile, Venezuela and Bolivia, which is i) affecting the building market as well as major infrastructure projects in the region (such as the Maracaibo
project in Venezuela), ii) creating exchange rate volatility and iii) increasing the risks of customer default;o A marked drop in non-ferrous metal prices resulting in the impairment of Core exposure, not having an impact on cash or operating margin, but impacting net income;o The impact of growing inflationary pressure, particularly on raw material prices (resins, steel) and labor costs, which could affect competitiveness depending on the extent to which they can be passed on to customers in selling
prices;o The sustainability of growth rates of the fiber and copper structured cabling (LAN) market and the Group’s capacity to seize opportunities relating to the move to higher performing categories in this market;o The speed of deployment of “ftth” (“fiber to the home”) solutions in Europe and North West Africa and the Group’s capacity to seize opportunities relating to the development of this market;o The impact of the coronavirus pandemic on the aeronautic industry which has led our customers to revisit their order books for the coming months and years; o The fact that automotive sales may continue to be adversely affected in the context of the coronavirus pandemic on a global basis and that the progress of electrical propulsion solutions will penetrate markets slower than
predicted;o Fluctuating oil and gas prices, and the downturn in the Oil & Gas sector which have lead Oil & Gas sector customers to revise their exploration and production capex programs. The considerable uncertainty about the
implementation of these customers’ capex programs may also affect the Group’s ability to plan for future means of producing cables and umbilicals for these customers, and for imposing changes to the agreed delivery schedules for contracted projects in the context of the coronavirus pandemic.
o The risk of the award or entry into force of subsea and land cable contracts being delayed or advanced, which could interfere with schedules in a given year; o Inherent risks related to (i) carrying out major turnkey projects for high-voltage cables, which will be exacerbated in the coming years as this business becomes increasingly concentrated and centered on a small number of large-
scale projects (NSL, Hornsea 2, Mindanao-Visayas, Seagreen, Marjan, Crete-Attica and DolWin6, the latter of which will be our first contract to supply and install HVDC extruded insulation cables), (ii) the high capacity utilization rates of the plants involved, (iii) the projects’ geographic location and the political, social and economic environments in the countries concerned (Philippines);
o The inherent risks associated with major capital projects, particularly the risk of completion delays and the risks of delays to win projects to fill the new capacities. These risks notably concern the construction of a new subsea cable laying ship, the transformation of the Charleston plant in North America to produce subsea high voltage cables, two projects that will be instrumental in ensuring that we fulfill our 2020 and 2021 objectives;
o The challenges created by the coronavirus pandemic (with subsequent measures taken by national States such as country lockdowns or travel bans) for the performance of projects in countries like the United States (e.g. to meet the defined manufacturing schedule in Charleston) as well as for turnkey projects such as Seagreen (Scotland) and Visayas-Mindanao (Philippines) and onshore projects in Europe;
o Inherent risks related to the reorganization project announced in January 2019 for the land high voltage activity that could lead to project delays or generate additional costs which could call into question a rapid return to break even.
o Material impact from the pandemic “second wave” on Nexans’ operations globally.Without having major operational impacts, the two following uncertainties may have an impact on the financial statements:o Sudden changes in metal prices that may affect customers’ buying habits in the short term;o The impact of foreign exchange fluctuations on the translation of the financial statements of the Group’s subsidiaries located outside the euro zone.INVESTOR RELATIONS:Aurélia BAUDEY-VIGNAUD+33 1 78 15 03 [email protected]
S a f e H a r b o r
Exane BNPP Virtual European Mid Cap CEO Conference, November 16, 2020|
01 02 03 04 05 0601
Exane BNPP Virtual European Mid Cap CEO Conference, November 16, 2020|
M a i n H i g h l i g h t sTransformation Plan Key Enabler of Nexans’ Underlying Profitability and Sound Cash Generation
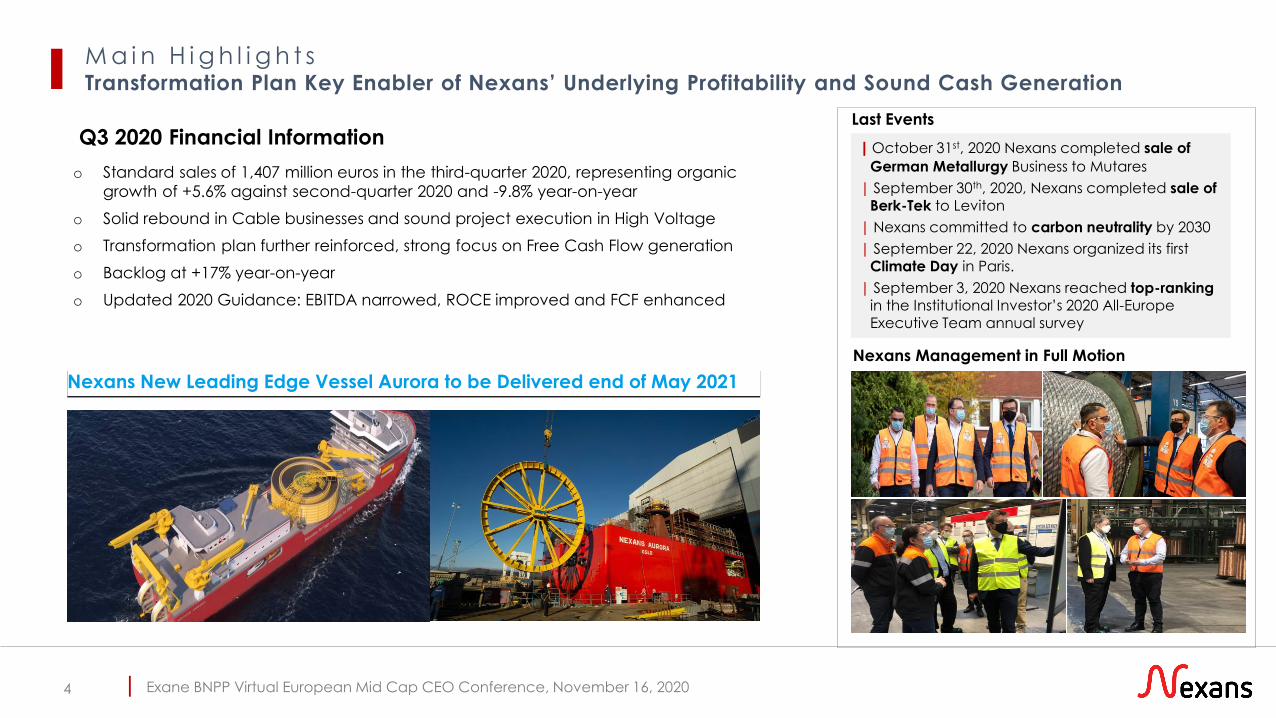
| October 31st, 2020 Nexans completed sale of
German Metallurgy Business to Mutares
| September 30th, 2020, Nexans completed sale of Berk-Tek to Leviton
| Nexans committed to carbon neutrality by 2030
| September 22, 2020 Nexans organized its first Climate Day in Paris.
| September 3, 2020 Nexans reached top-rankingin the Institutional Investor’s 2020 All-Europe Executive Team annual survey
Last Events
Q3 2020 Financial Information
o Standard sales of 1,407 million euros in the third-quarter 2020, representing organic
growth of +5.6% against second-quarter 2020 and -9.8% year-on-year
o Solid rebound in Cable businesses and sound project execution in High Voltage
o Transformation plan further reinforced, strong focus on Free Cash Flow generation
o Backlog at +17% year-on-year
o Updated 2020 Guidance: EBITDA narrowed, ROCE improved and FCF enhanced
Nexans Management in Full Motion
Nexans New Leading Edge Vessel Aurora to be Delivered end of May 2021
4
Exane BNPP Virtual European Mid Cap CEO Conference, November 16, 2020|5 I
3 Q 2 0 2 0 S a l e sDemonstrating Operational Resilience in Unprecedented Sanitary Crisis
5
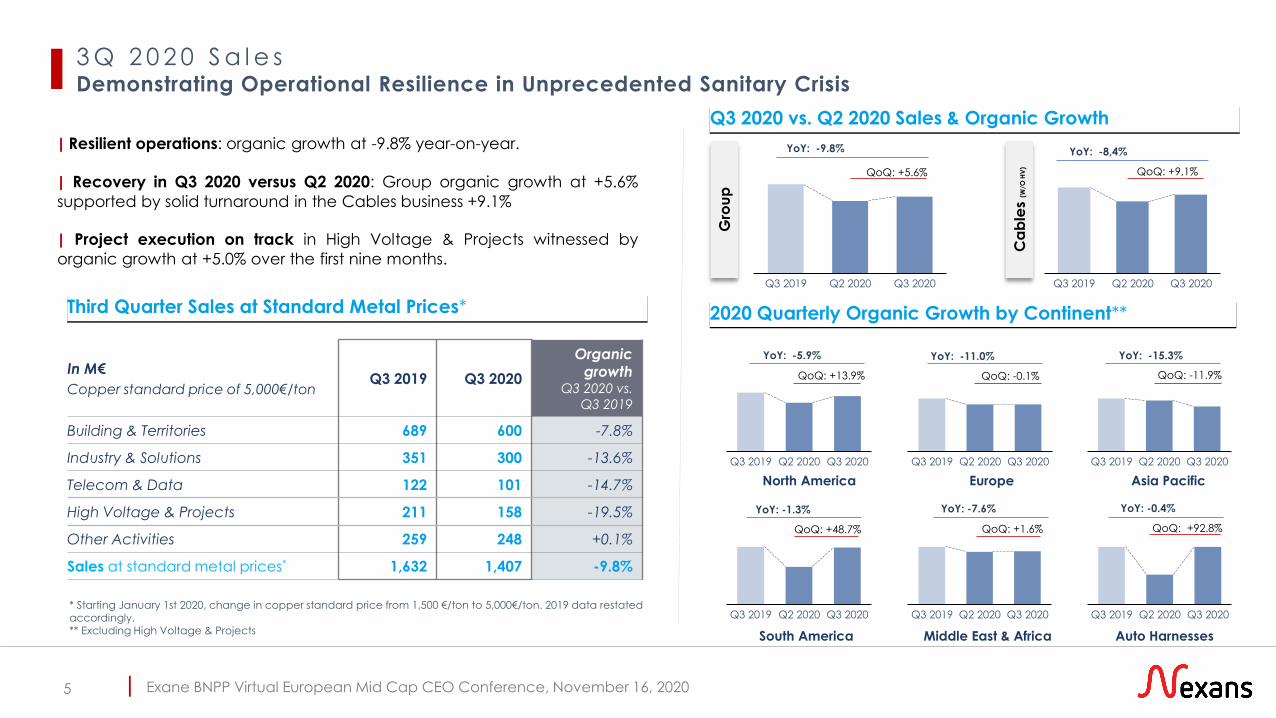
* Starting January 1st 2020, change in copper standard price from 1,500 €/ton to 5,000€/ton. 2019 data restated accordingly.** Excluding High Voltage & Projects
2020 Quarterly Organic Growth by Continent**
Q3 2019 Q3 2020Q2 2020
Q3 2019 Q2 2020 Q3 2020
Q3 2019 Q2 2020 Q3 2020 Q3 2020Q3 2019 Q2 2020
Q3 2019 Q2 2020 Q3 2020 Q3 2019 Q2 2020 Q3 2020
North America
YoY: -11.0%
QoQ: -0.1%
Europe Asia Pacific
YoY: -15.3%
QoQ: -11.9%
YoY: -1.3%
QoQ: +48.7%
YoY: -7.6%
QoQ: +1.6%
South America Middle East & Africa Auto Harnesses
YoY: -0.4%
QoQ: +92.8%
Q3 2020 vs. Q2 2020 Sales & Organic Growth
YoY: -5.9%
QoQ: +13.9%
Q3 2019 Q2 2020 Q3 2020Q3 2020Q2 2020Q3 2019
YoY: -9.8%
QoQ: +5.6%
Third Quarter Sales at Standard Metal Prices*
In M€
Copper standard price of 5,000€/tonQ3 2019 Q3 2020
Organic
growthQ3 2020 vs.
Q3 2019
Building & Territories 689 600 -7.8%
Industry & Solutions 351 300 -13.6%
Telecom & Data 122 101 -14.7%
High Voltage & Projects 211 158 -19.5%
Other Activities 259 248 +0.1%
Sales at standard metal prices* 1,632 1,407 -9.8%
| Resilient operations: organic growth at -9.8% year-on-year.
| Recovery in Q3 2020 versus Q2 2020: Group organic growth at +5.6%
supported by solid turnaround in the Cables business +9.1%
| Project execution on track in High Voltage & Projects witnessed by
organic growth at +5.0% over the first nine months.
YoY: -8,4%
QoQ: +9,1%
Gro
up
Ca
ble
s(W
/O H
V)
Exane BNPP Virtual European Mid Cap CEO Conference, November 16, 2020|
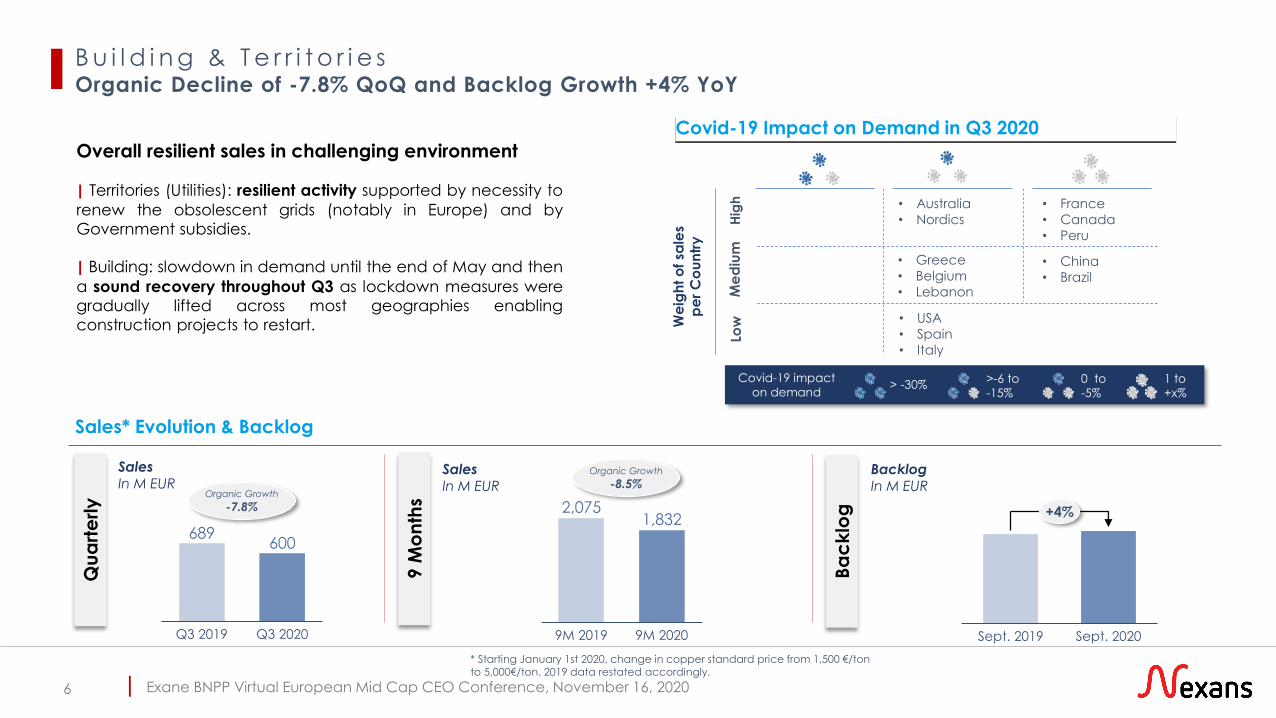
B u i l d i n g & T e r r i t o r i e sOrganic Decline of -7.8% QoQ and Backlog Growth +4% YoY
Sept. 2020Sept. 2019
+4%
• Greece
• Belgium
• Lebanon
• Australia
• Nordics
• France
• Canada
• Peru
• China
• Brazil
Hig
hM
ed
ium
LowW
eig
ht
of
sale
s p
er
Co
un
try
• USA
• Spain
• Italy
Covid-19 impact
on demand> -30%
>-6 to
-15%
0 to
-5%
1 to
+x%
689600
Q3 2019 Q3 2020
Covid-19 Impact on Demand in Q3 2020
9M 2019
2,075
9M 2020
1,832
Qu
art
erly
9 M
on
ths
Ba
ck
log
Sales* Evolution & Backlog
Overall resilient sales in challenging environment
| Territories (Utilities): resilient activity supported by necessity to
renew the obsolescent grids (notably in Europe) and by
Government subsidies.
| Building: slowdown in demand until the end of May and then
a sound recovery throughout Q3 as lockdown measures were
gradually lifted across most geographies enabling
construction projects to restart.
* Starting January 1st 2020, change in copper standard price from 1,500 €/ton to 5,000€/ton. 2019 data restated accordingly.
BacklogIn M EUR
SalesIn M EUR
Sales In M EUR
Organic Growth
-8.5%Organic Growth
-7.8%
6
Exane BNPP Virtual European Mid Cap CEO Conference, November 16, 2020|
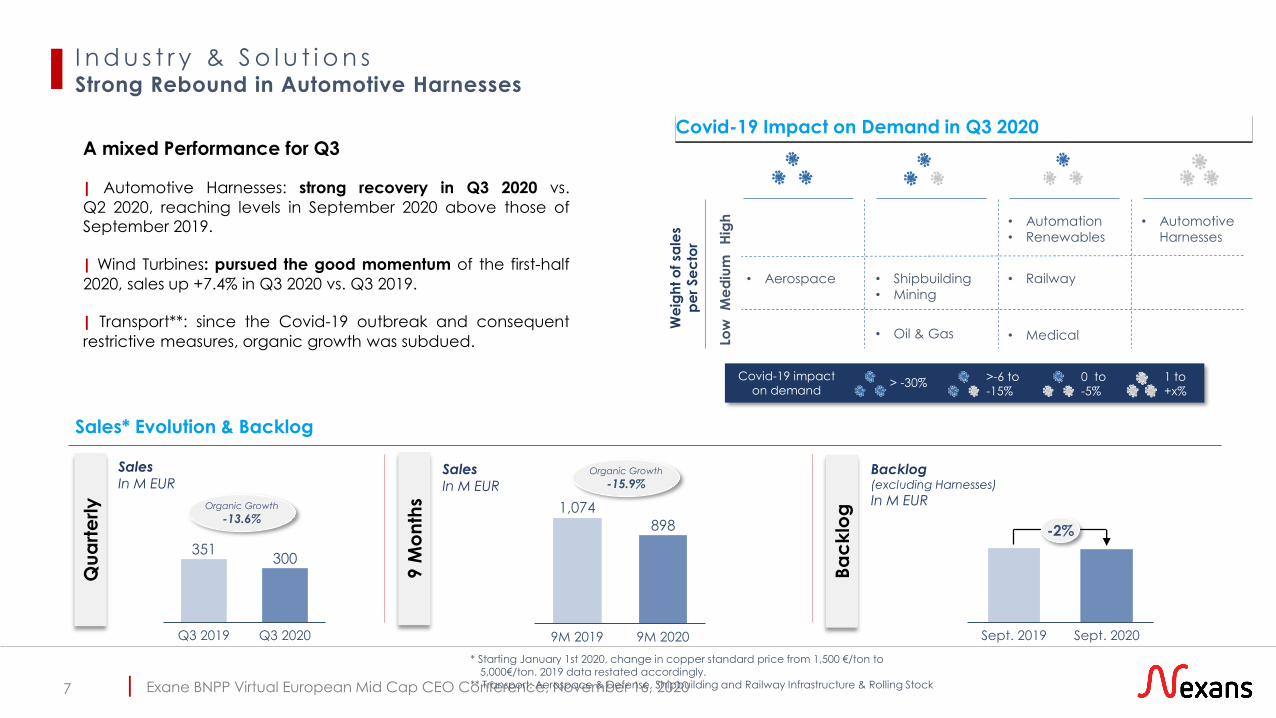
I n d u s t r y & S o l u t i o n sStrong Rebound in Automotive Harnesses
Backlog(excluding Harnesses)
In M EUR
Qu
art
erly
9 M
on
ths
Ba
ck
log
Sales* Evolution & Backlog
A mixed Performance for Q3
| Automotive Harnesses: strong recovery in Q3 2020 vs.
Q2 2020, reaching levels in September 2020 above those of
September 2019.
| Wind Turbines: pursued the good momentum of the first-half
2020, sales up +7.4% in Q3 2020 vs. Q3 2019.
| Transport**: since the Covid-19 outbreak and consequent
restrictive measures, organic growth was subdued.
• Automotive
Harnesses
• Oil & Gas
• Automation
• Renewables
• Aerospace • Railway
• Medical
• Shipbuilding
• Mining
Hig
hM
ed
ium
Low
Covid-19 Impact on Demand in Q3 2020
We
igh
t o
f sa
les
pe
r Se
cto
r
Covid-19 impact
on demand> -30%
>-6 to
-15%
0 to
-5%
1 to
+x%
Sept. 2019 Sept. 2020
-2%
351300
Q3 2019 Q3 2020
898
9M 2019 9M 2020
1,074
* Starting January 1st 2020, change in copper standard price from 1,500 €/ton to 5,000€/ton. 2019 data restated accordingly.
** Transport: Aerospace & Defense, Shipbuilding and Railway Infrastructure & Rolling Stock
Organic Growth
-15.9%
Organic Growth
-13.6%
SalesIn M EUR
Sales In M EUR
7
Exane BNPP Virtual European Mid Cap CEO Conference, November 16, 2020|
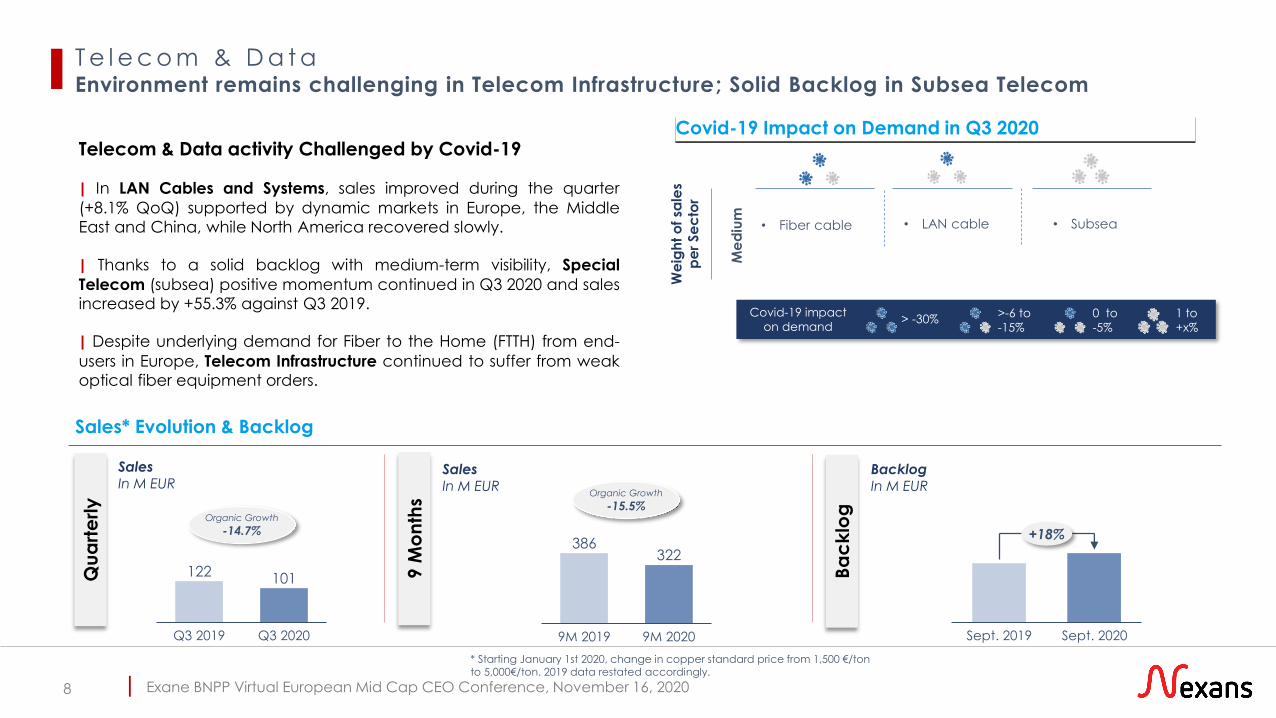
T e l e c o m & D a t aEnvironment remains challenging in Telecom Infrastructure; Solid Backlog in Subsea Telecom
Qu
art
erly
9 M
on
ths
Ba
ck
log
Sales* Evolution & Backlog
Telecom & Data activity Challenged by Covid-19
| In LAN Cables and Systems, sales improved during the quarter
(+8.1% QoQ) supported by dynamic markets in Europe, the Middle
East and China, while North America recovered slowly.
| Thanks to a solid backlog with medium-term visibility, Special
Telecom (subsea) positive momentum continued in Q3 2020 and sales
increased by +55.3% against Q3 2019.
| Despite underlying demand for Fiber to the Home (FTTH) from end-
users in Europe, Telecom Infrastructure continued to suffer from weak
optical fiber equipment orders.
Sept. 2019 Sept. 2020
+18%
122 101
Q3 2019 Q3 2020
386322
9M 2019 9M 2020
• Fiber cable • LAN cable • Subsea
Me
diu
m
We
igh
t o
f sa
les
pe
r Se
cto
r
Covid-19 Impact on Demand in Q3 2020
Covid-19 impact
on demand> -30%
>-6 to
-15%
0 to
-5%
1 to
+x%
* Starting January 1st 2020, change in copper standard price from 1,500 €/ton to 5,000€/ton. 2019 data restated accordingly.
Organic Growth
-15.5%Organic Growth
-14.7%
BacklogIn M EUR
SalesIn M EUR
Sales In M EUR
8
Exane BNPP Virtual European Mid Cap CEO Conference, November 16, 2020|
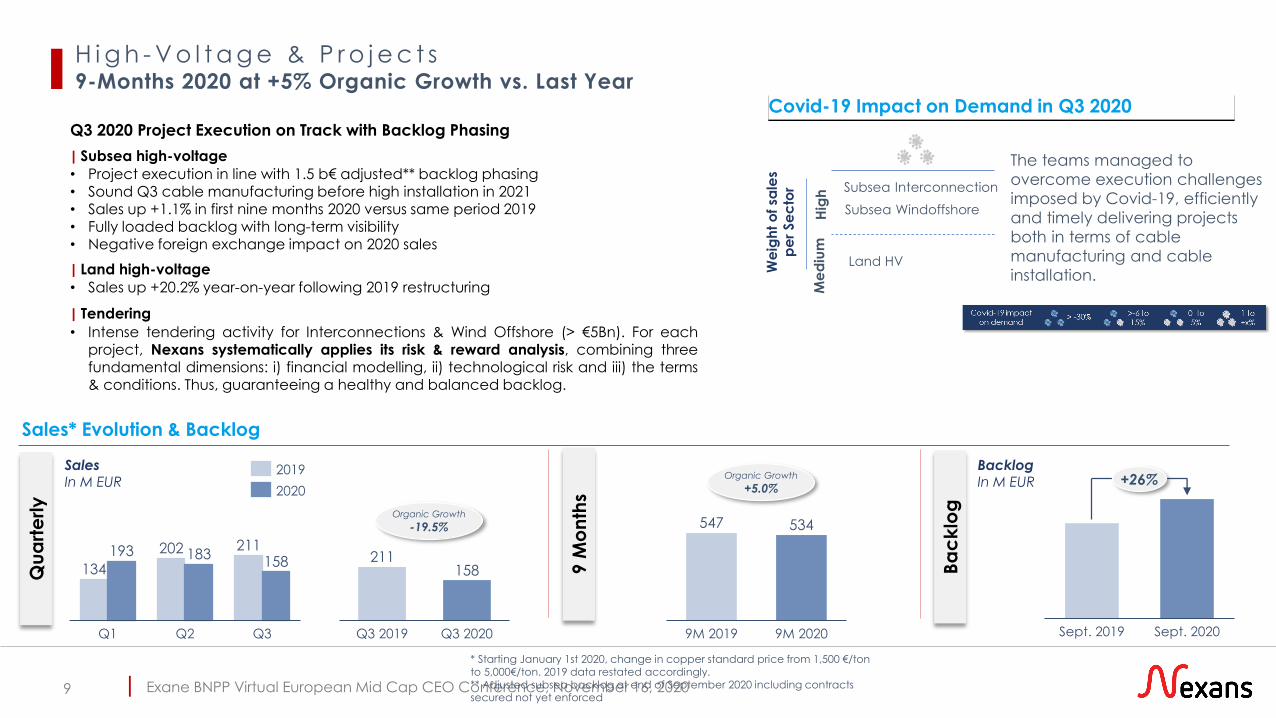
H i g h - V o l t a g e & P r o j e c t s 9-Months 2020 at +5% Organic Growth vs. Last Year
Qu
art
erly
9 M
on
ths
Ba
ck
log
Sales* Evolution & Backlog
Q3 2020 Project Execution on Track with Backlog Phasing
| Subsea high-voltage
• Project execution in line with 1.5 b€ adjusted** backlog phasing
• Sound Q3 cable manufacturing before high installation in 2021• Sales up +1.1% in first nine months 2020 versus same period 2019• Fully loaded backlog with long-term visibility• Negative foreign exchange impact on 2020 sales
| Land high-voltage
• Sales up +20.2% year-on-year following 2019 restructuring
| Tendering
• Intense tendering activity for Interconnections & Wind Offshore (> €5Bn). For eachproject, Nexans systematically applies its risk & reward analysis, combining threefundamental dimensions: i) financial modelling, ii) technological risk and iii) the terms& conditions. Thus, guaranteeing a healthy and balanced backlog.
Subsea Interconnection
Subsea Windoffshore
Land HV
The teams managed to
overcome execution challenges
imposed by Covid-19, efficiently
and timely delivering projects
both in terms of cable
manufacturing and cable
installation.
We
igh
t o
f sa
les
pe
r Se
cto
r
Hig
hM
ed
ium
Covid-19 Impact on Demand in Q3 2020
Sept. 2019 Sept. 2020
+26%
134
202 211193 183158
Q2Q1 Q3
211158
Q3 2019 Q3 2020
547 534
9M 2019 9M 2020
* Starting January 1st 2020, change in copper standard price from 1,500 €/ton to 5,000€/ton. 2019 data restated accordingly.** Adjusted subsea backlog at end of September 2020 including contracts secured not yet enforced
2019
2020
BacklogIn M EUR
SalesIn M EUR
Organic Growth
+5.0%
Organic Growth
-19.5%
9
Exane BNPP Virtual European Mid Cap CEO Conference, November 16, 2020|10 I10
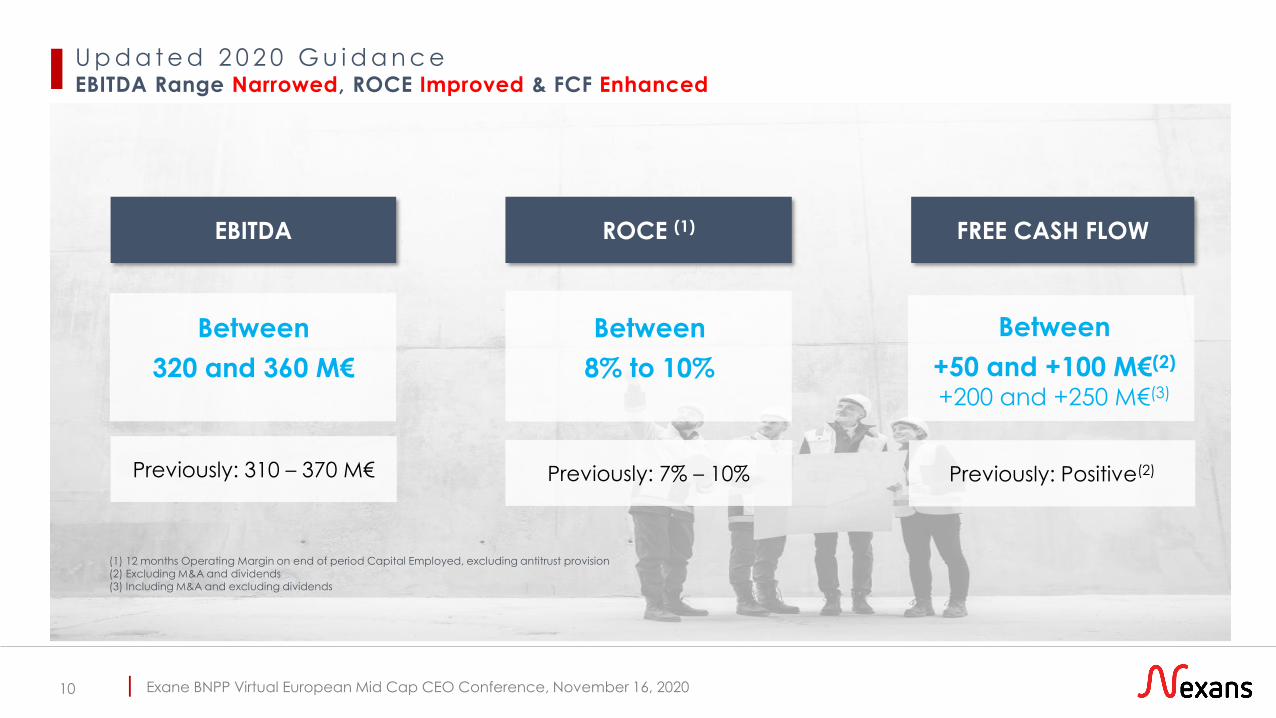
EBITDA ROCE (1) FREE CASH FLOW
(1) 12 months Operating Margin on end of period Capital Employed, excluding antitrust provision(2) Excluding M&A and dividends (3) Including M&A and excluding dividends
Between
320 and 360 M€
Between
8% to 10%
Between
+50 and +100 M€(2)
+200 and +250 M€(3)
Previously: 310 – 370 M€ Previously: 7% – 10% Previously: Positive(2)
U p d a t e d 2 0 2 0 G u i d a n c eEBITDA Range Narrowed, ROCE Improved & FCF Enhanced
Exane BNPP Virtual European Mid Cap CEO Conference, November 16, 2020|11 I11
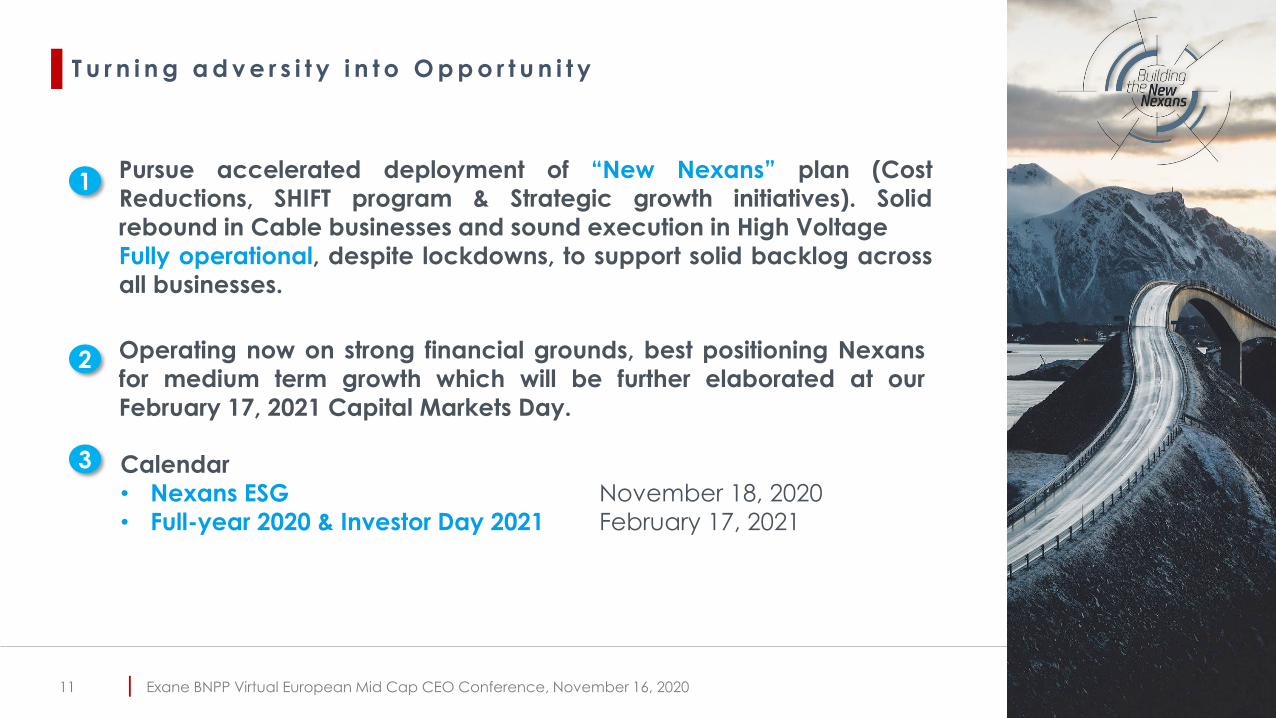
Pursue accelerated deployment of “New Nexans” plan (Cost
Reductions, SHIFT program & Strategic growth initiatives). Solid
rebound in Cable businesses and sound execution in High Voltage
Fully operational, despite lockdowns, to support solid backlog across
all businesses.
Operating now on strong financial grounds, best positioning Nexans
for medium term growth which will be further elaborated at our
February 17, 2021 Capital Markets Day.
1
2
3 Calendar
• Nexans ESG November 18, 2020
• Full-year 2020 & Investor Day 2021 February 17, 2021
T u r n i n g a d v e r s i t y i n t o O p p o r t u n i t y
Exane BNPP Virtual European Mid Cap CEO Conference, November 16, 2020|
02
Exane BNPP Virtual European Mid Cap CEO Conference, November 16, 2020|
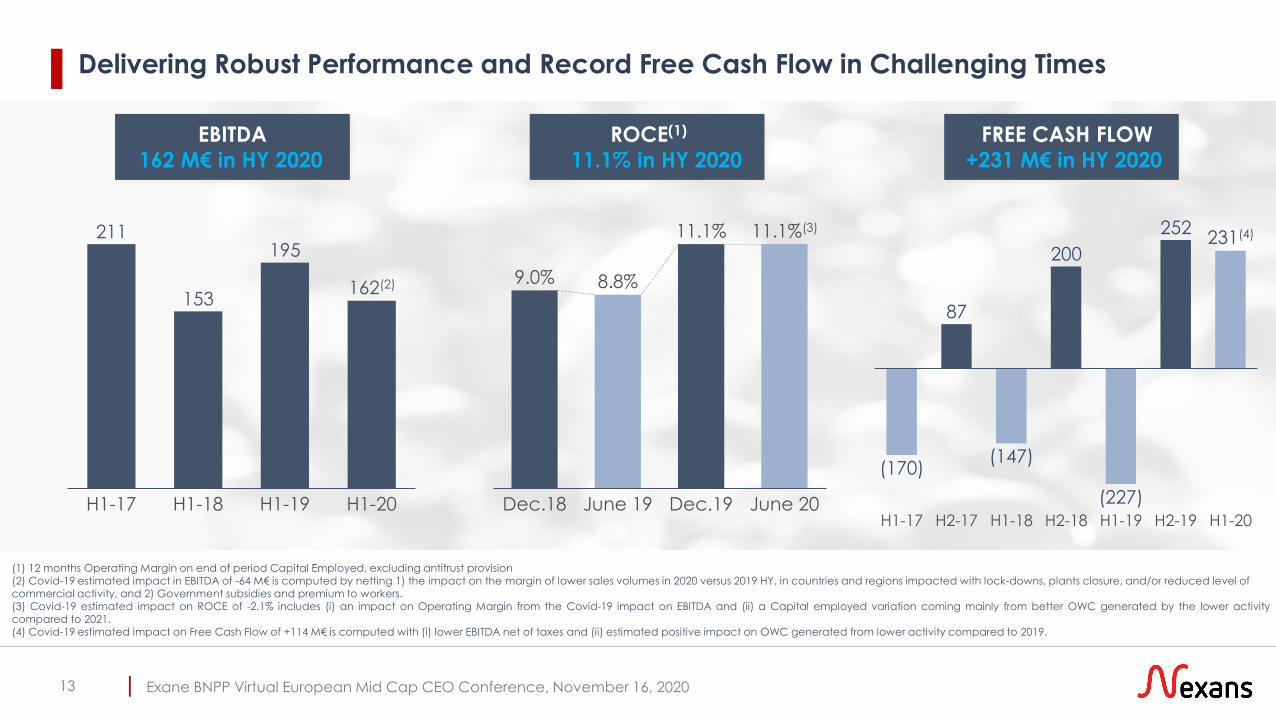
Delivering Robust Performance and Record Free Cash Flow in Challenging Times
13
June 20Dec.18 June 19
9.0%
Dec.19
8.8%
11.1% 11.1%(3)
(170)
87
(147)
200
(227)
252
H1-18 H1-20
231(4)
H1-17 H2-17 H2-18 H1-19 H2-19
EBITDA
162 M€ in HY 2020
ROCE(1)
11.1% in HY 2020
FREE CASH FLOW
+231 M€ in HY 2020
211
153
195
H1-18H1-17 H1-19
162(2)
H1-20
(1) 12 months Operating Margin on end of period Capital Employed, excluding antitrust provision(2) Covid-19 estimated impact in EBITDA of -64 M€ is computed by netting 1) the impact on the margin of lower sales volumes in 2020 versus 2019 HY, in countries and regions impacted with lock-downs, plants closure, and/or reduced level of commercial activity, and 2) Government subsidies and premium to workers.(3) Covid-19 estimated impact on ROCE of -2.1% includes (i) an impact on Operating Margin from the Covid-19 impact on EBITDA and (ii) a Capital employed variation coming mainly from better OWC generated by the lower activitycompared to 2021.(4) Covid-19 estimated impact on Free Cash Flow of +114 M€ is computed with (i) lower EBITDA net of taxes and (ii) estimated positive impact on OWC generated from lower activity compared to 2019.
Exane BNPP Virtual European Mid Cap CEO Conference, November 16, 2020|
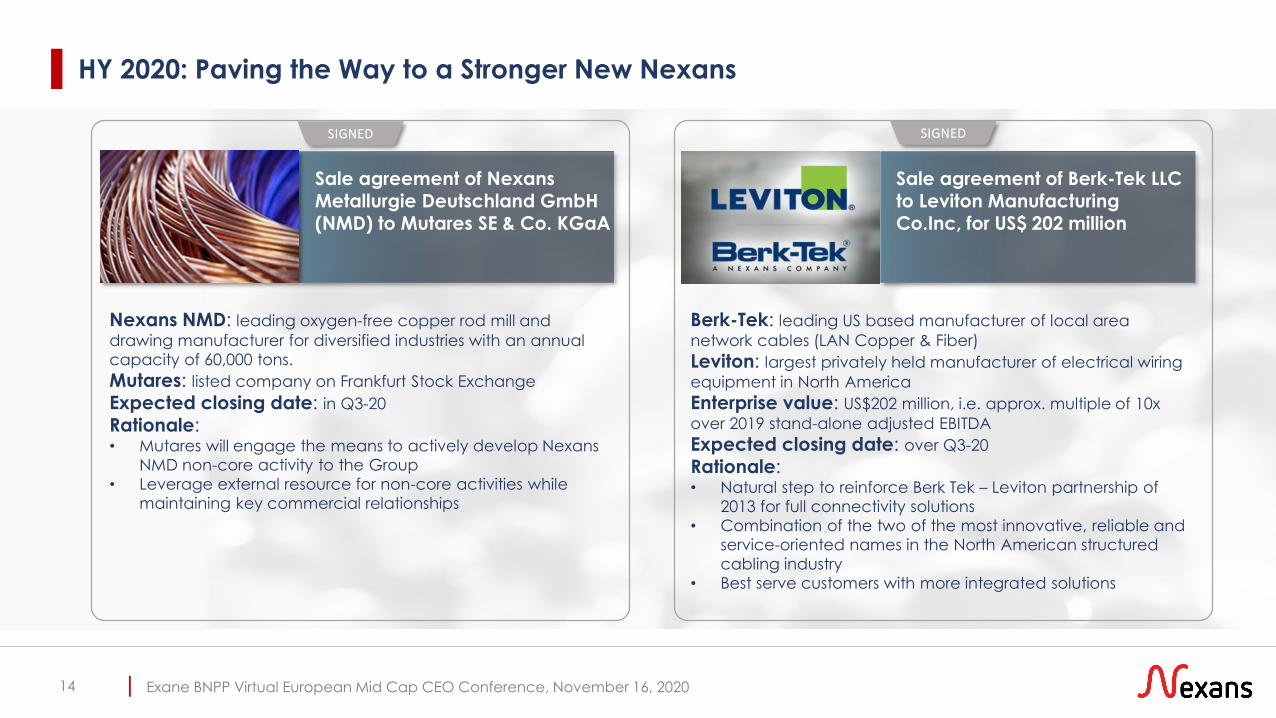
HY 2020: Paving the Way to a Stronger New Nexans
14
Sale agreement of Nexans Metallurgie Deutschland GmbH (NMD) to Mutares SE & Co. KGaA
Berk-Tek: leading US based manufacturer of local area
network cables (LAN Copper & Fiber)
Leviton: largest privately held manufacturer of electrical wiring
equipment in North America
Enterprise value: US$202 million, i.e. approx. multiple of 10x
over 2019 stand-alone adjusted EBITDA
Expected closing date: over Q3-20
Rationale: • Natural step to reinforce Berk Tek – Leviton partnership of
2013 for full connectivity solutions
• Combination of the two of the most innovative, reliable and
service-oriented names in the North American structured
cabling industry
• Best serve customers with more integrated solutions
Nexans NMD: leading oxygen-free copper rod mill and
drawing manufacturer for diversified industries with an annual
capacity of 60,000 tons.
Mutares: listed company on Frankfurt Stock Exchange
Expected closing date: in Q3-20
Rationale: • Mutares will engage the means to actively develop Nexans
NMD non-core activity to the Group
• Leverage external resource for non-core activities while
maintaining key commercial relationships
Sale agreement of Berk-Tek LLC to Leviton Manufacturing Co.Inc, for US$ 202 million
SIGNEDSIGNED
Exane BNPP Virtual European Mid Cap CEO Conference, November 16, 2020|15
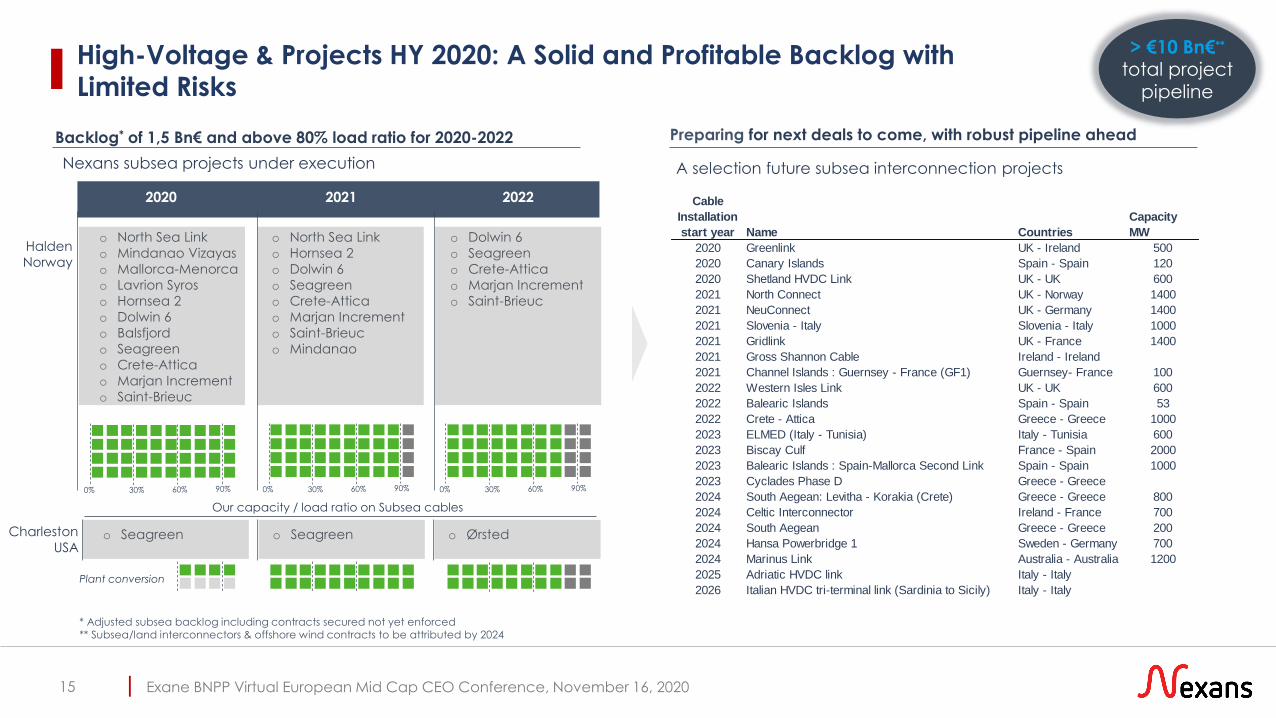
2020 2021 2022
o North Sea Link
o Mindanao Vizayas
o Mallorca-Menorca
o Lavrion Syros
o Hornsea 2
o Dolwin 6
o Balsfjord
o Seagreen
o Crete-Attica
o Marjan Increment
o Saint-Brieuc
o North Sea Link
o Hornsea 2
o Dolwin 6
o Seagreen
o Crete-Attica
o Marjan Increment
o Saint-Brieuc
o Mindanao
Nexans subsea projects under execution
Preparing for next deals to come, with robust pipeline ahead
A selection future subsea interconnection projects
Backlog* of 1,5 Bn€ and above 80% load ratio for 2020-2022
* Adjusted subsea backlog including contracts secured not yet enforced ** Subsea/land interconnectors & offshore wind contracts to be attributed by 2024
High-Voltage & Projects HY 2020: A Solid and Profitable Backlog with Limited Risks
o Dolwin 6
o Seagreen
o Crete-Attica
o Marjan Increment
o Saint-Brieuc
> €10 Bn€**
total project
pipeline
Our capacity / load ratio on Subsea cables
0% 30% 60% 90% 0% 30% 60% 90%0% 30% 60% 90%
Charleston
USAo Seagreen o Seagreen
Plant conversion
o Ørsted
Halden
Norway
Cable
Installation
start year Name Countries
Capacity
MW
2020 Greenlink UK - Ireland 500
2020 Canary Islands Spain - Spain 120
2020 Shetland HVDC Link UK - UK 600
2021 North Connect UK - Norway 1400
2021 NeuConnect UK - Germany 1400
2021 Slovenia - Italy Slovenia - Italy 1000
2021 Gridlink UK - France 1400
2021 Gross Shannon Cable Ireland - Ireland
2021 Channel Islands : Guernsey - France (GF1) Guernsey- France 100
2022 Western Isles Link UK - UK 600
2022 Balearic Islands Spain - Spain 53
2022 Crete - Attica Greece - Greece 1000
2023 ELMED (Italy - Tunisia) Italy - Tunisia 600
2023 Biscay Culf France - Spain 2000
2023 Balearic Islands : Spain-Mallorca Second Link Spain - Spain 1000
2023 Cyclades Phase D Greece - Greece
2024 South Aegean: Levitha - Korakia (Crete) Greece - Greece 800
2024 Celtic Interconnector Ireland - France 700
2024 South Aegean Greece - Greece 200
2024 Hansa Powerbridge 1 Sweden - Germany 700
2024 Marinus Link Australia - Australia 1200
2025 Adriatic HVDC link Italy - Italy
2026 Italian HVDC tri-terminal link (Sardinia to Sicily) Italy - Italy
Exane BNPP Virtual European Mid Cap CEO Conference, November 16, 2020|16
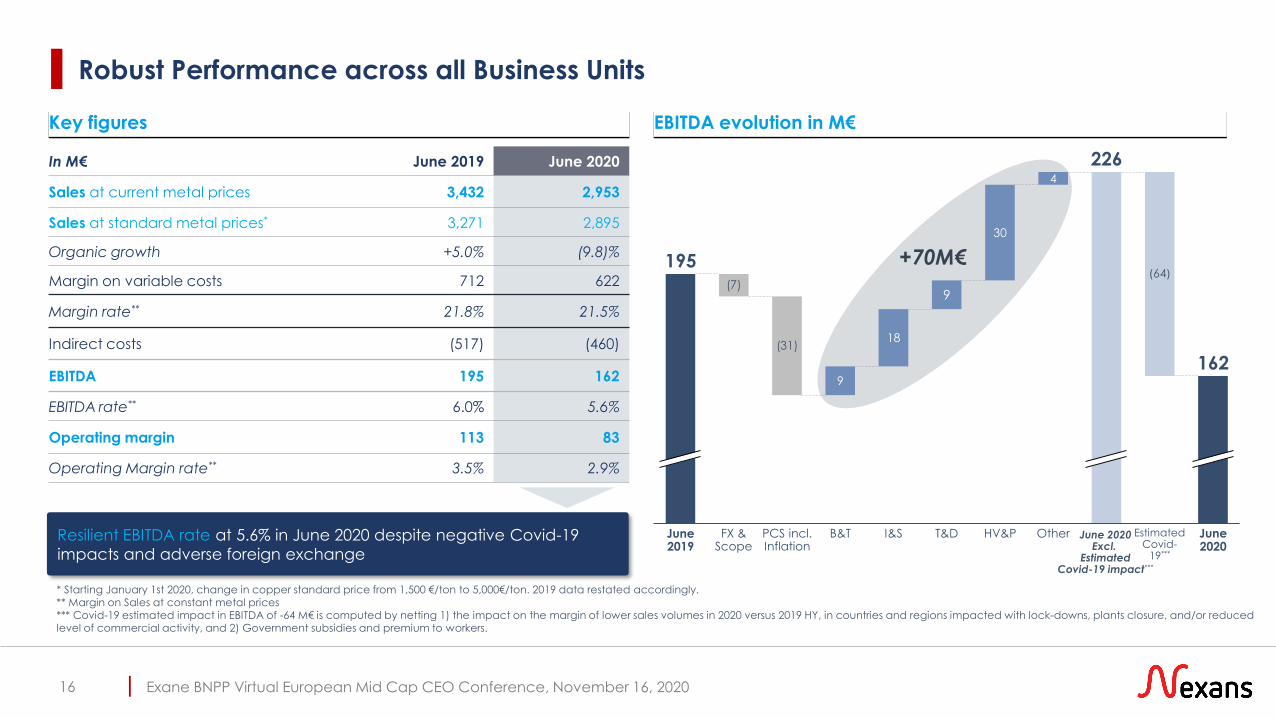
Key figures
In M€ June 2019 June 2020
Sales at current metal prices 3,432 2,953
Sales at standard metal prices* 3,271 2,895
Organic growth +5.0% (9.8)%
Margin on variable costs 712 622
Margin rate** 21.8% 21.5%
Indirect costs (517) (460)
EBITDA 195 162
EBITDA rate** 6.0% 5.6%
Operating margin 113 83
Operating Margin rate** 3.5% 2.9%
Resilient EBITDA rate at 5.6% in June 2020 despite negative Covid-19
impacts and adverse foreign exchange
EBITDA evolution in M€
9
18
9
30
4
Other
(64)
June2020
162
B&TPCS incl. Inflation
(31)
FX & Scope
(7)
226
June 2019
T&D EstimatedCovid-
19***
HV&P
195
I&S
+70M€
* Starting January 1st 2020, change in copper standard price from 1,500 €/ton to 5,000€/ton. 2019 data restated accordingly. ** Margin on Sales at constant metal prices *** Covid-19 estimated impact in EBITDA of -64 M€ is computed by netting 1) the impact on the margin of lower sales volumes in 2020 versus 2019 HY, in countries and regions impacted with lock-downs, plants closure, and/or reduced level of commercial activity, and 2) Government subsidies and premium to workers.
June 2020Excl.
EstimatedCovid-19 impact***
Robust Performance across all Business Units
Exane BNPP Virtual European Mid Cap CEO Conference, November 16, 2020|17
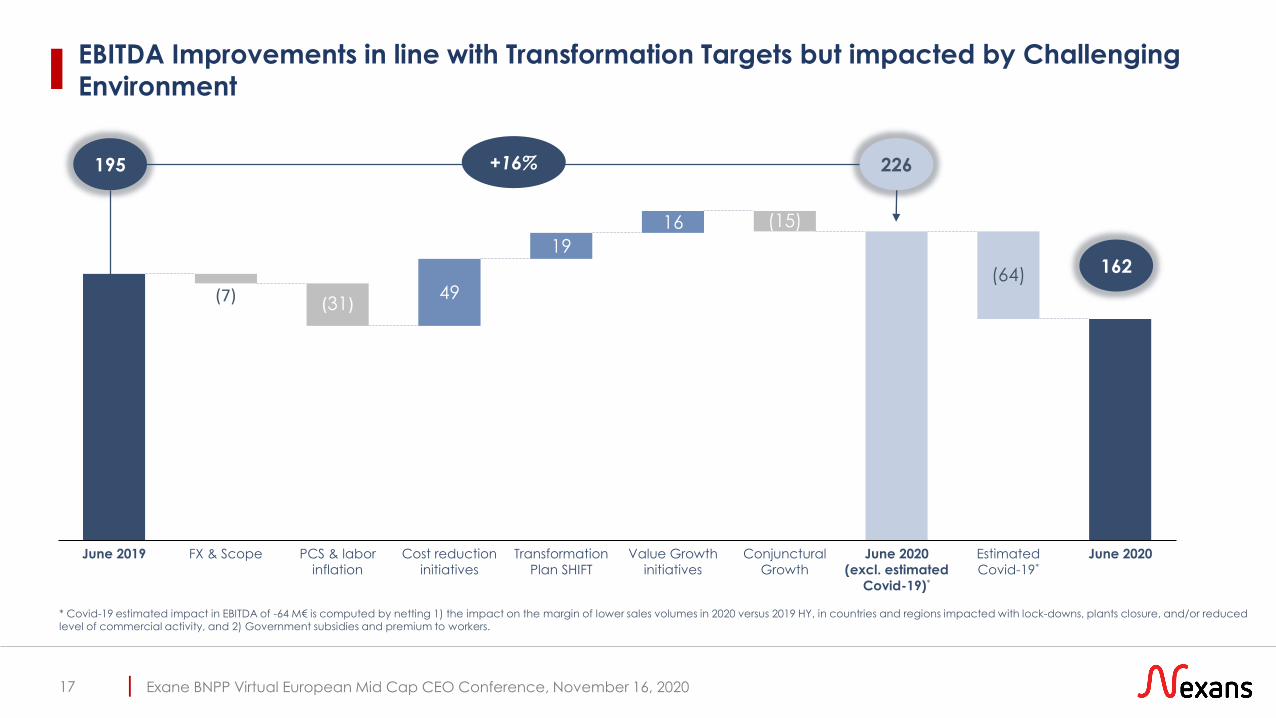
49
19
16
PCS & labor
inflation
June 2019 FX & Scope Value Growth
initiatives
(31)
Cost reduction
initiatives
Transformation
Plan SHIFT
(15)
Conjunctural
Growth
June 2020
(excl. estimated
Covid-19)*
(64)
Estimated
Covid-19*
June 2020
(7)
195
162
226
EBITDA Improvements in line with Transformation Targets but impacted by Challenging
Environment
+16%
* Covid-19 estimated impact in EBITDA of -64 M€ is computed by netting 1) the impact on the margin of lower sales volumes in 2020 versus 2019 HY, in countries and regions impacted with lock-downs, plants closure, and/or reduced level of commercial activity, and 2) Government subsidies and premium to workers.
Exane BNPP Virtual European Mid Cap CEO Conference, November 16, 2020|
Net Income
18
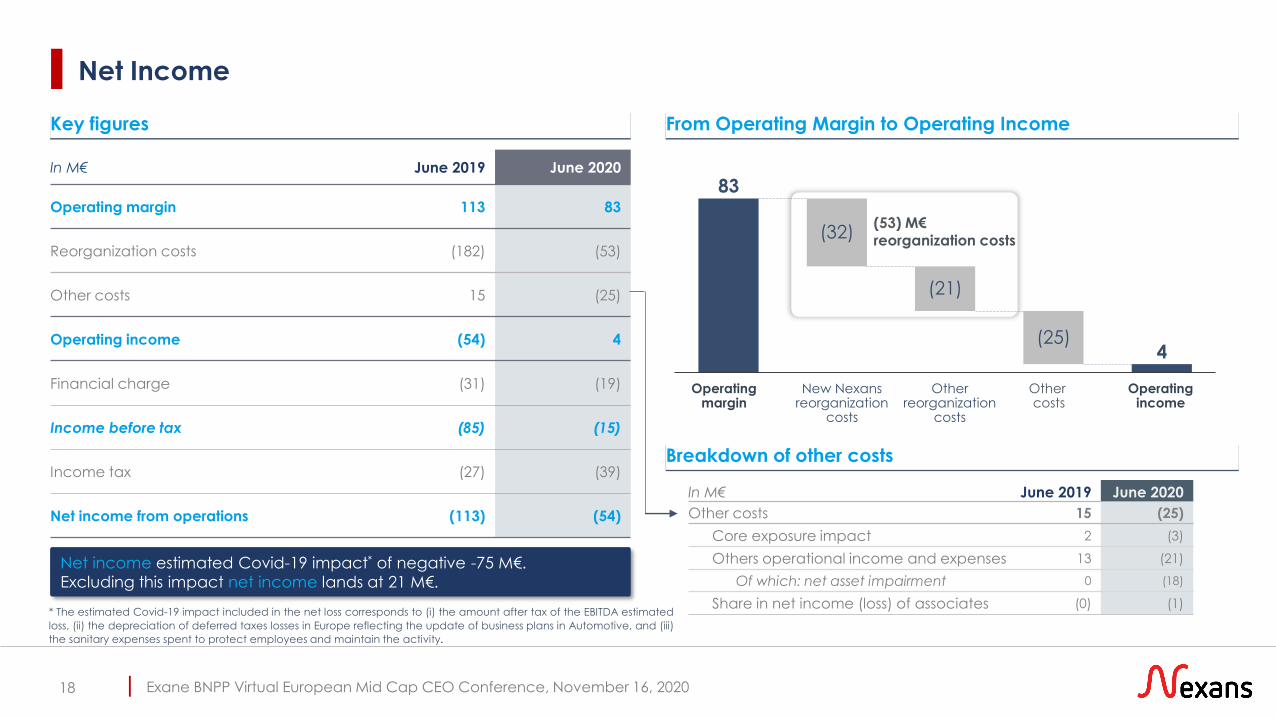
Key figures
In M€ June 2019 June 2020
Operating margin 113 83
Reorganization costs (182) (53)
Other costs 15 (25)
Operating income (54) 4
Financial charge (31) (19)
Income before tax (85) (15)
Income tax (27) (39)
Net income from operations (113) (54)
From Operating Margin to Operating Income
Othercosts
Operating margin
Otherreorganization
costs
Operating income
New Nexans reorganization
costs
(53) M€ reorganization costs
In M€ June 2019 June 2020
Other costs 15 (25)
Core exposure impact 2 (3)
Others operational income and expenses 13 (21)
Of which: net asset impairment 0 (18)
Share in net income (loss) of associates (0) (1)
Breakdown of other costs
83
4
(21)
(32)
(25)
Net income estimated Covid-19 impact* of negative -75 M€.
Excluding this impact net income lands at 21 M€.
* The estimated Covid-19 impact included in the net loss corresponds to (i) the amount after tax of the EBITDA estimated
loss, (ii) the depreciation of deferred taxes losses in Europe reflecting the update of business plans in Automotive, and (iii)
the sanitary expenses spent to protect employees and maintain the activity.
Exane BNPP Virtual European Mid Cap CEO Conference, November 16, 2020|
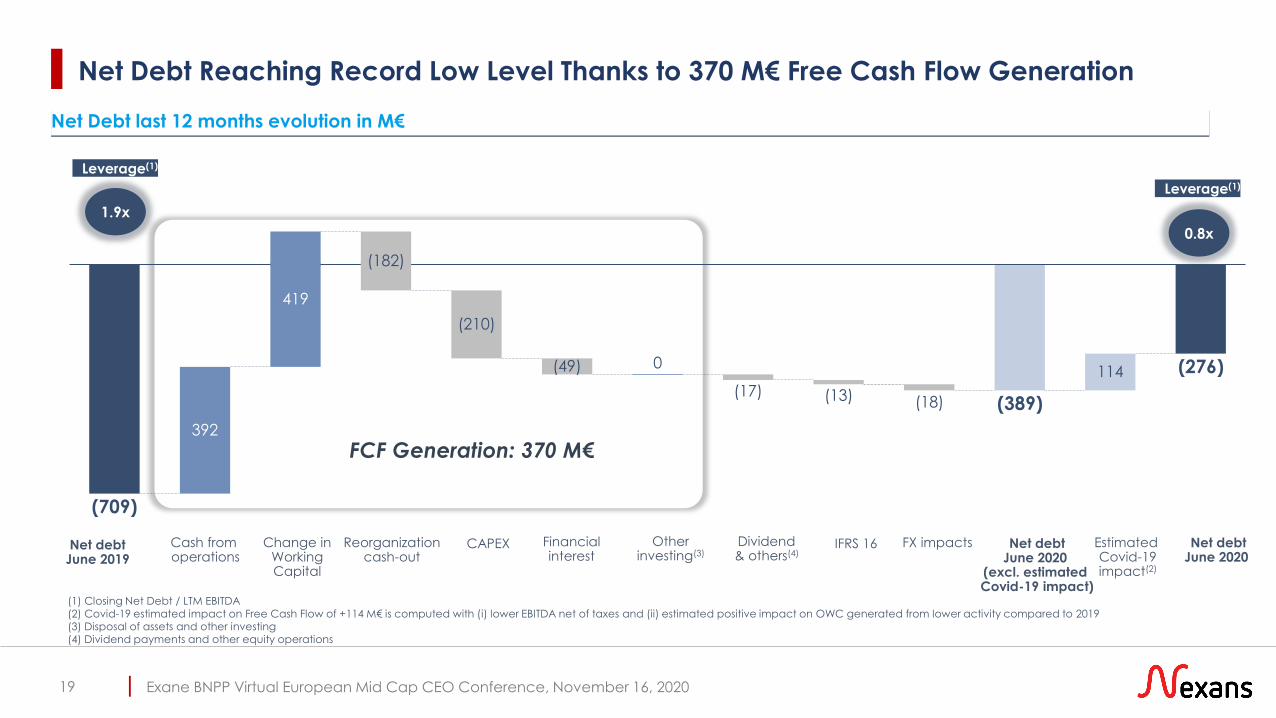
Net Debt Reaching Record Low Level Thanks to 370 M€ Free Cash Flow Generation
19
Net Debt last 12 months evolution in M€
Change in WorkingCapital
IFRS 16 Net debtJune 2020
(excl. estimatedCovid-19 impact)
Reorganizationcash-out
CAPEXCash fromoperations
Net debtJune 2019
Financial interest
(1) Closing Net Debt / LTM EBITDA(2) Covid-19 estimated impact on Free Cash Flow of +114 M€ is computed with (i) lower EBITDA net of taxes and (ii) estimated positive impact on OWC generated from lower activity compared to 2019 (3) Disposal of assets and other investing(4) Dividend payments and other equity operations
140
140
Dividend& others(4)
FCF Generation: 370 M€
Otherinvesting(3)
(709)
(389)
(276)
(18)
(49)
392
(182)
419
(210)
1140
(17) (13)
FX impacts Net debtJune 2020
EstimatedCovid-19impact(2)
1.9x
0.8x
Leverage(1)
Leverage(1)
Exane BNPP Virtual European Mid Cap CEO Conference, November 16, 2020|
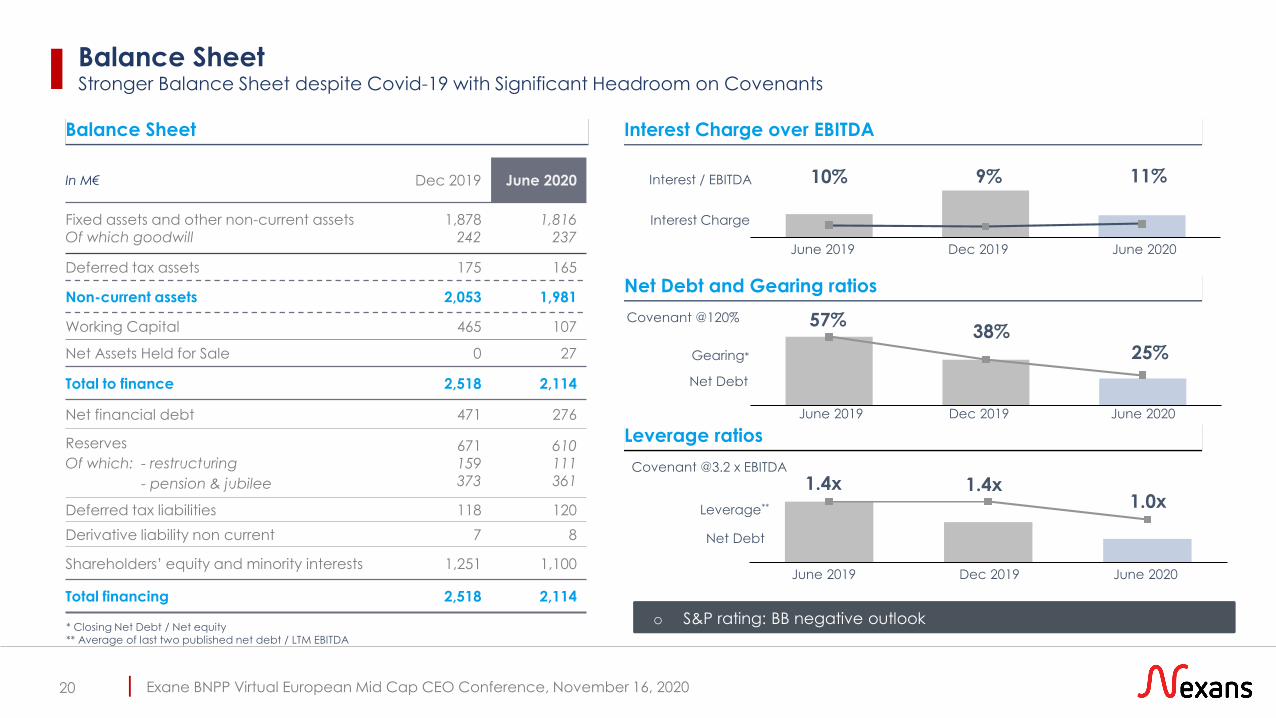
Balance SheetStronger Balance Sheet despite Covid-19 with Significant Headroom on Covenants
20
Interest Charge over EBITDA
Net Debt and Gearing ratios
Leverage ratios
10% 9% 11%
25%
57%38%
1.4x1.0x
Interest Charge
Interest / EBITDA
Net Debt
Gearing*
1.4x
Balance Sheet
In M€ Dec 2019 June 2020
Fixed assets and other non-current assetsOf which goodwill
1,878242
1,816237
Deferred tax assets 175 165
Non-current assets 2,053 1,981
Working Capital 465 107
Net Assets Held for Sale 0 27
Total to finance 2,518 2,114
Net financial debt 471 276
Reserves
Of which: - restructuring
- pension & jubilee
671159373
610111361
Deferred tax liabilities 118 120
Derivative liability non current 7 8
Shareholders’ equity and minority interests 1,251 1,100
Total financing 2,518 2,114
June 2020Dec 2019June 2019
o S&P rating: BB negative outlook
June 2020Dec 2019June 2019
June 2020Dec 2019June 2019
* Closing Net Debt / Net equity** Average of last two published net debt / LTM EBITDA
Net Debt
Leverage**
Covenant @120%
Covenant @3.2 x EBITDA
Exane BNPP Virtual European Mid Cap CEO Conference, November 16, 2020|
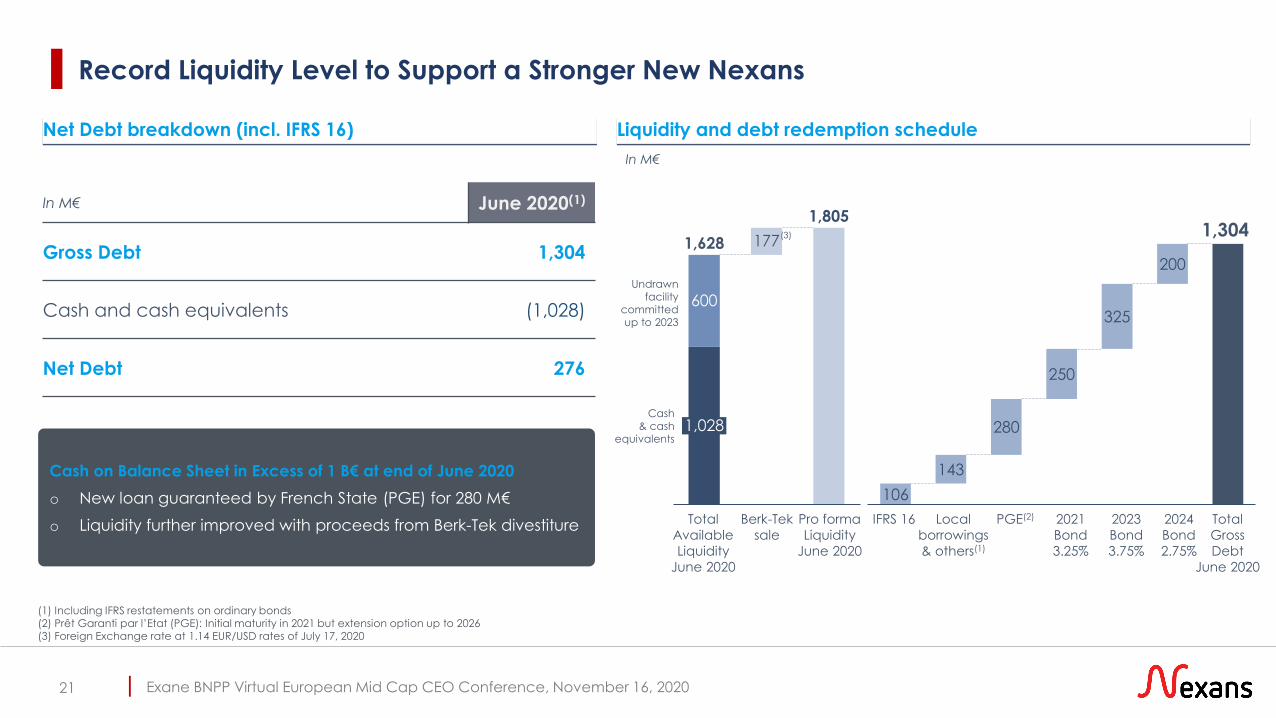
Record Liquidity Level to Support a Stronger New Nexans
21
In M€ June 2020(1)
Gross Debt 1,304
Cash and cash equivalents (1,028)
Net Debt 276
Cash& cash
equivalents
In M€
Undrawnfacility
committedup to 2023
2023
Bond
3.75%
Total
Available
Liquidity
June 2020
2021
Bond
3.25%
Total
Gross
Debt
June 2020
2024
Bond
2.75%
IFRS 16
1,304
Cash on Balance Sheet in Excess of 1 B€ at end of June 2020
o New loan guaranteed by French State (PGE) for 280 M€
o Liquidity further improved with proceeds from Berk-Tek divestiture
106
143
280
250
325
200
PGE(2)Local
borrowings
& others(1)
(1) Including IFRS restatements on ordinary bonds(2) Prêt Garanti par l’Etat (PGE): Initial maturity in 2021 but extension option up to 2026(3) Foreign Exchange rate at 1.14 EUR/USD rates of July 17, 2020
600
1,628
1,028
177
1,805
Pro forma
Liquidity
June 2020
Net Debt breakdown (incl. IFRS 16) Liquidity and debt redemption schedule
(3)
Berk-Tek
sale
Exane BNPP Virtual European Mid Cap CEO Conference, November 16, 2020|
03
Exane BNPP Virtual European Mid Cap CEO Conference, November 16, 2020|
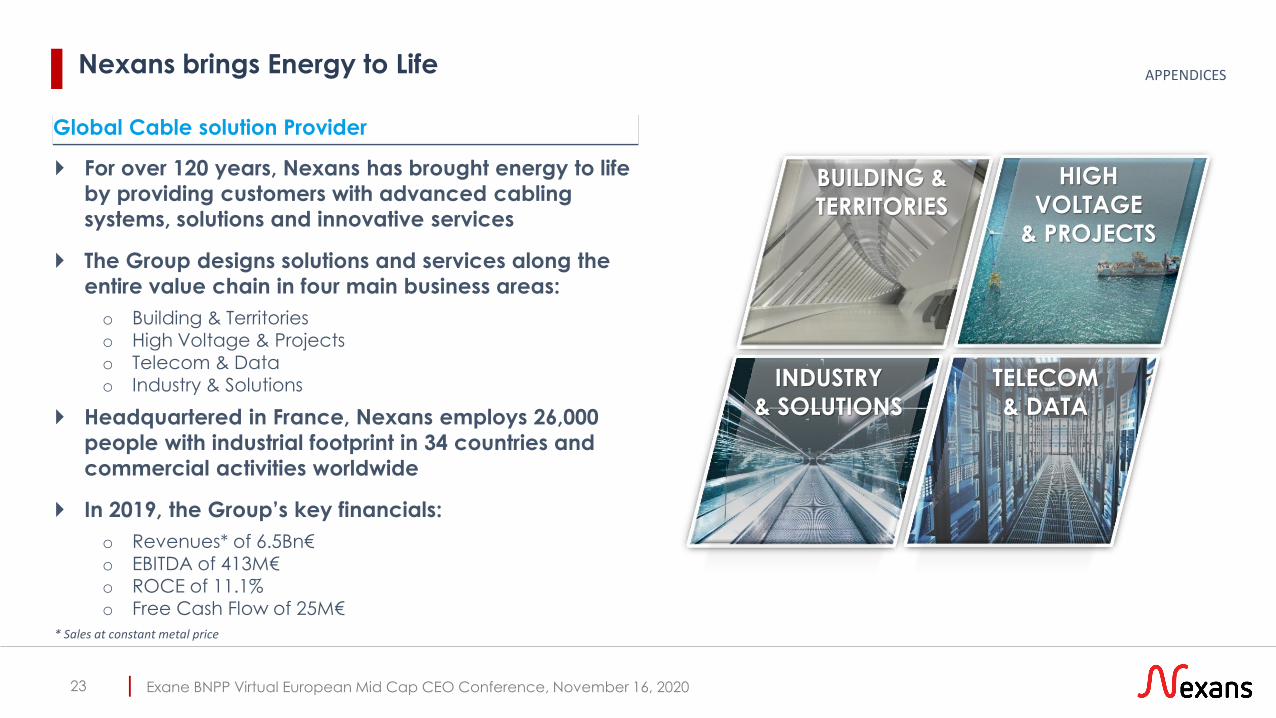
Global Cable solution Provider
For over 120 years, Nexans has brought energy to life
by providing customers with advanced cabling
systems, solutions and innovative services
The Group designs solutions and services along the
entire value chain in four main business areas:
o Building & Territories o High Voltage & Projects o Telecom & Data o Industry & Solutions
Headquartered in France, Nexans employs 26,000
people with industrial footprint in 34 countries and
commercial activities worldwide
In 2019, the Group’s key financials:
o Revenues* of 6.5Bn€o EBITDA of 413M€o ROCE of 11.1%o Free Cash Flow of 25M€
23
Nexans brings Energy to Life APPENDICES
* Sales at constant metal price
BUILDING &
TERRITORIES
HIGH
VOLTAGE
& PROJECTS
INDUSTRY
& SOLUTIONS
TELECOM
& DATA
Exane BNPP Virtual European Mid Cap CEO Conference, November 16, 2020|
APPENDICES
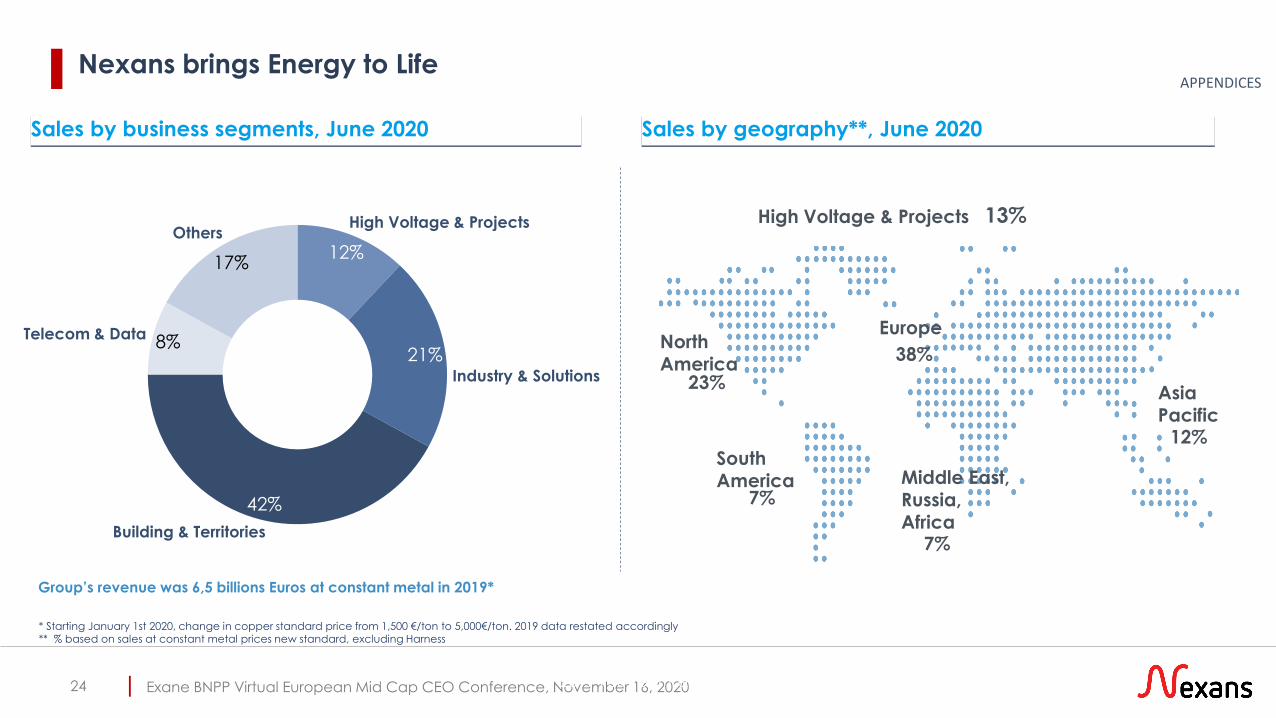
Sales by business segments, June 2020 Sales by geography**, June 2020
North America
23%
South America
7%
Europe
38%
Asia Pacific
12%
Middle East,Russia, Africa
7%
High Voltage & Projects 13%
12%
21%
42%
8%
17%
Others
Industry & Solutions
High Voltage & Projects
Building & Territories
Telecom & Data
Group’s revenue was 6,5 billions Euros at constant metal in 2019*
2019 Full Year Results24
* Starting January 1st 2020, change in copper standard price from 1,500 €/ton to 5,000€/ton. 2019 data restated accordingly ** % based on sales at constant metal prices new standard, excluding Harness
Nexans brings Energy to LifeAPPENDICES
Exane BNPP Virtual European Mid Cap CEO Conference, November 16, 2020|
Nexans brings Energy to Life APPENDICES
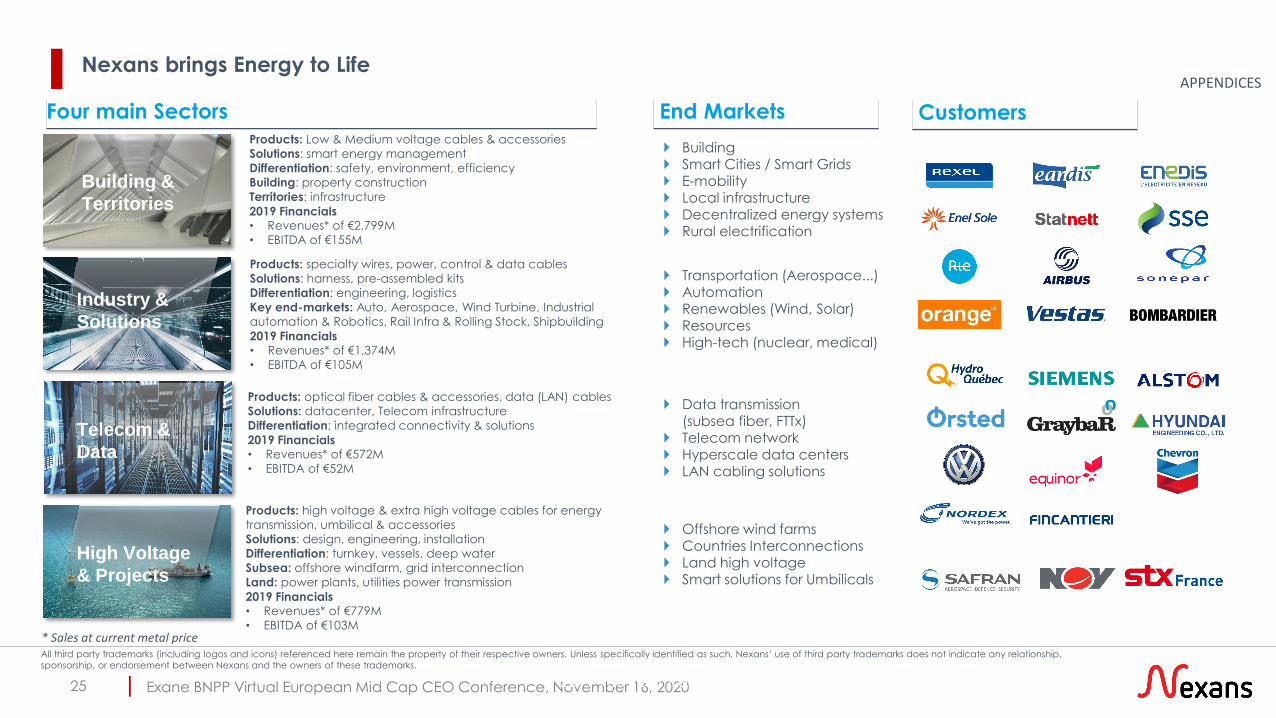
Four main Sectors End Markets
Building Smart Cities / Smart Grids E-mobility Local infrastructure Decentralized energy systems Rural electrification
Data transmission(subsea fiber, FTTx)
Telecom network Hyperscale data centers LAN cabling solutions
Transportation (Aerospace...) Automation Renewables (Wind, Solar) Resources High-tech (nuclear, medical)
All third party trademarks (including logos and icons) referenced here remain the property of their respective owners. Unless specifically identified as such, Nexans’ use of third party trademarks does not indicate any relationship,
sponsorship, or endorsement between Nexans and the owners of these trademarks.
Building &
Territories
Telecom &
Data
Industry &
Solutions
Customers
Offshore wind farms Countries Interconnections Land high voltage Smart solutions for Umbilicals
High Voltage
& Projects
2019 Full Year Results25
Products: Low & Medium voltage cables & accessories
Solutions: smart energy management
Differentiation: safety, environment, efficiency
Building: property construction
Territories: infrastructure
2019 Financials• Revenues* of €2,799M
• EBITDA of €155M
Products: specialty wires, power, control & data cables
Solutions: harness, pre-assembled kits
Differentiation: engineering, logistics
Key end-markets: Auto, Aerospace, Wind Turbine, Industrial
automation & Robotics, Rail Infra & Rolling Stock, Shipbuilding
2019 Financials• Revenues* of €1,374M
• EBITDA of €105M
Products: optical fiber cables & accessories, data (LAN) cables
Solutions: datacenter, Telecom infrastructure
Differentiation: integrated connectivity & solutions
2019 Financials• Revenues* of €572M
• EBITDA of €52M
Products: high voltage & extra high voltage cables for energy
transmission, umbilical & accessories
Solutions: design, engineering, installation
Differentiation: turnkey, vessels, deep water
Subsea: offshore windfarm, grid interconnection
Land: power plants, utilities power transmission
2019 Financials• Revenues* of €779M
• EBITDA of €103M
APPENDICES
* Sales at current metal price
Exane BNPP Virtual European Mid Cap CEO Conference, November 16, 2020|
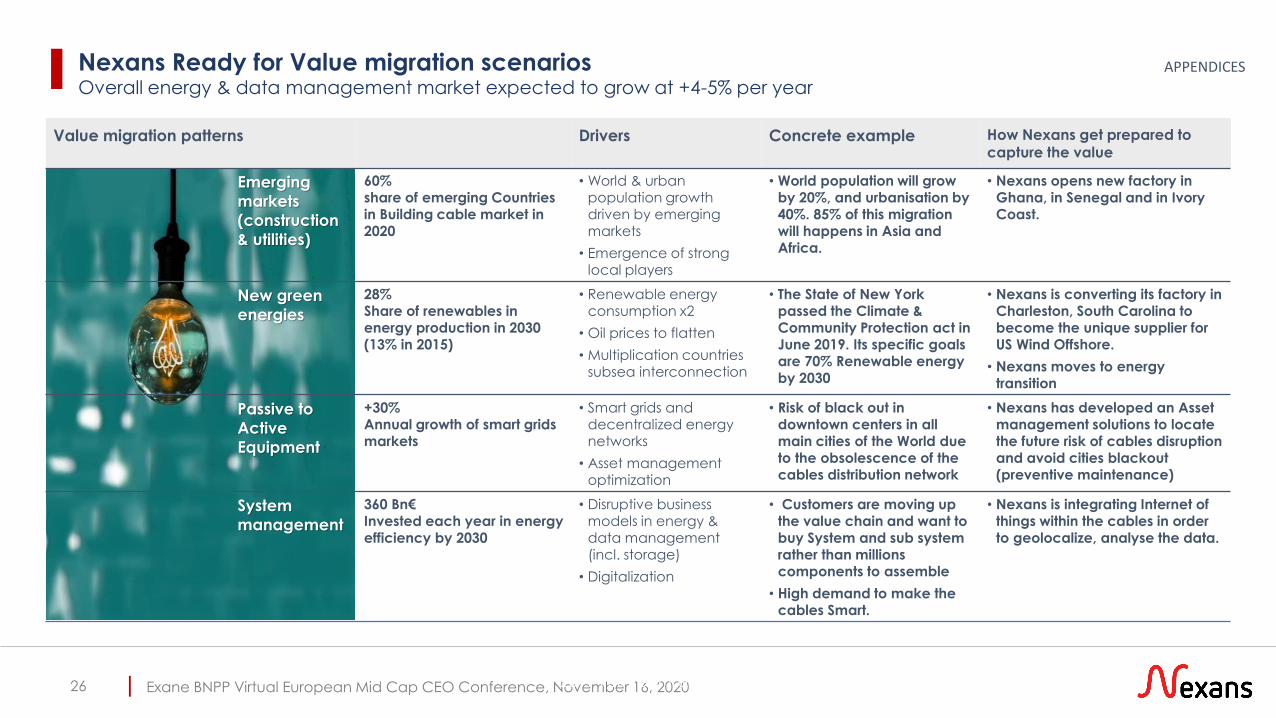
Value migration patterns Drivers Concrete example How Nexans get prepared to capture the value
Emerging
markets
(construction
& utilities)
60%share of emerging Countries in Building cable market in 2020
• World & urban population growth driven by emergingmarkets
• Emergence of strong local players
• World population will growby 20%, and urbanisation by 40%. 85% of this migration will happens in Asia and Africa.
• Nexans opens new factory in Ghana, in Senegal and in Ivory Coast.
New green
energies
28%Share of renewables in energy production in 2030 (13% in 2015)
• Renewable energy consumption x2
• Oil prices to flatten
• Multiplication countries subsea interconnection
• The State of New York passed the Climate & Community Protection act in June 2019. Its specific goals are 70% Renewable energyby 2030
• Nexans is converting its factory in Charleston, South Carolina to become the unique supplier for US Wind Offshore.
• Nexans moves to energy transition
Passive to
Active
Equipment
+30%Annual growth of smart grids markets
• Smart grids and decentralized energy networks
• Asset management optimization
• Risk of black out in downtown centers in all main cities of the World due to the obsolescence of the cables distribution network
• Nexans has developed an Asset management solutions to locate the future risk of cables disruption and avoid cities blackout (preventive maintenance)
System
management
360 Bn€Invested each year in energy efficiency by 2030
• Disruptive business models in energy & data management (incl. storage)
• Digitalization
• Customers are moving up the value chain and want to buy System and sub system rather than millions components to assemble
• High demand to make the cables Smart.
• Nexans is integrating Internet of things within the cables in order to geolocalize, analyse the data.
2019 Full Year Results26
Nexans Ready for Value migration scenariosOverall energy & data management market expected to grow at +4-5% per year
APPENDICES
Exane BNPP Virtual European Mid Cap CEO Conference, November 16, 2020|
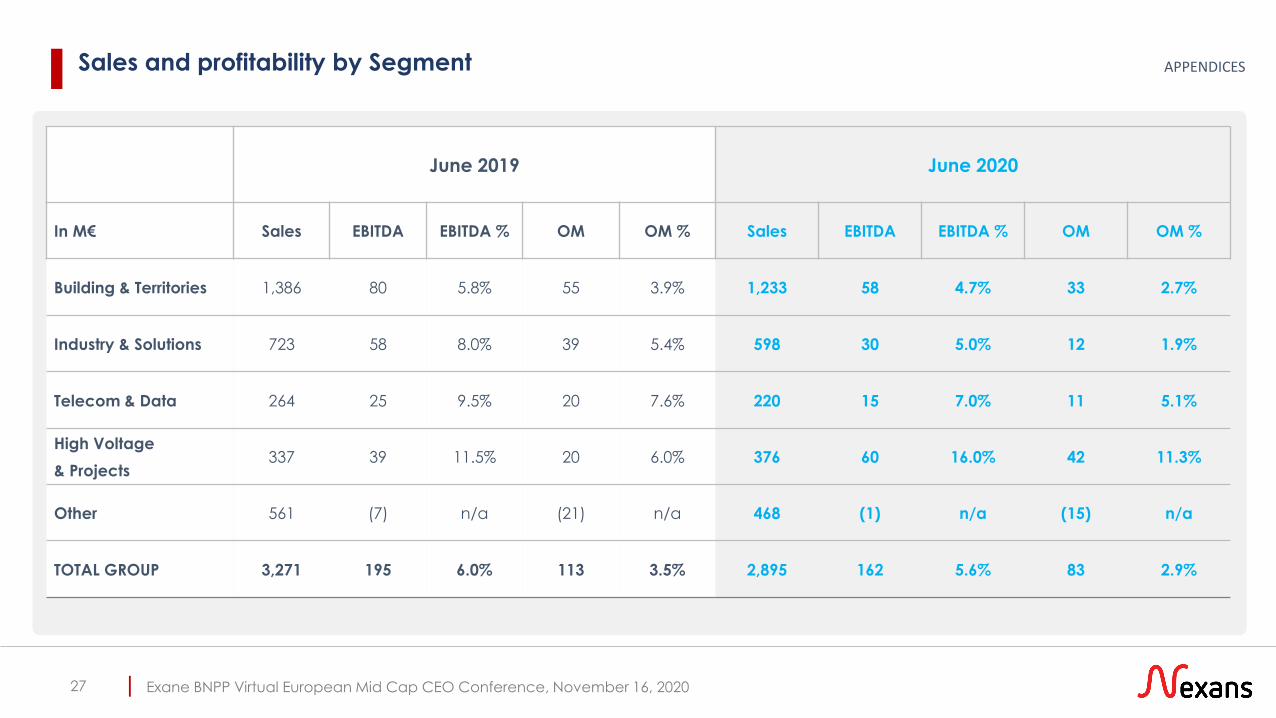
June 2019 June 2020
In M€ Sales EBITDA EBITDA % OM OM % Sales EBITDA EBITDA % OM OM %
Building & Territories 1,386 80 5.8% 55 3.9% 1,233 58 4.7% 33 2.7%
Industry & Solutions 723 58 8.0% 39 5.4% 598 30 5.0% 12 1.9%
Telecom & Data 264 25 9.5% 20 7.6% 220 15 7.0% 11 5.1%
High Voltage
& Projects337 39 11.5% 20 6.0% 376 60 16.0% 42 11.3%
Other 561 (7) n/a (21) n/a 468 (1) n/a (15) n/a
TOTAL GROUP 3,271 195 6.0% 113 3.5% 2,895 162 5.6% 83 2.9%
APPENDICES
27
Sales and profitability by Segment
Exane BNPP Virtual European Mid Cap CEO Conference, November 16, 2020|
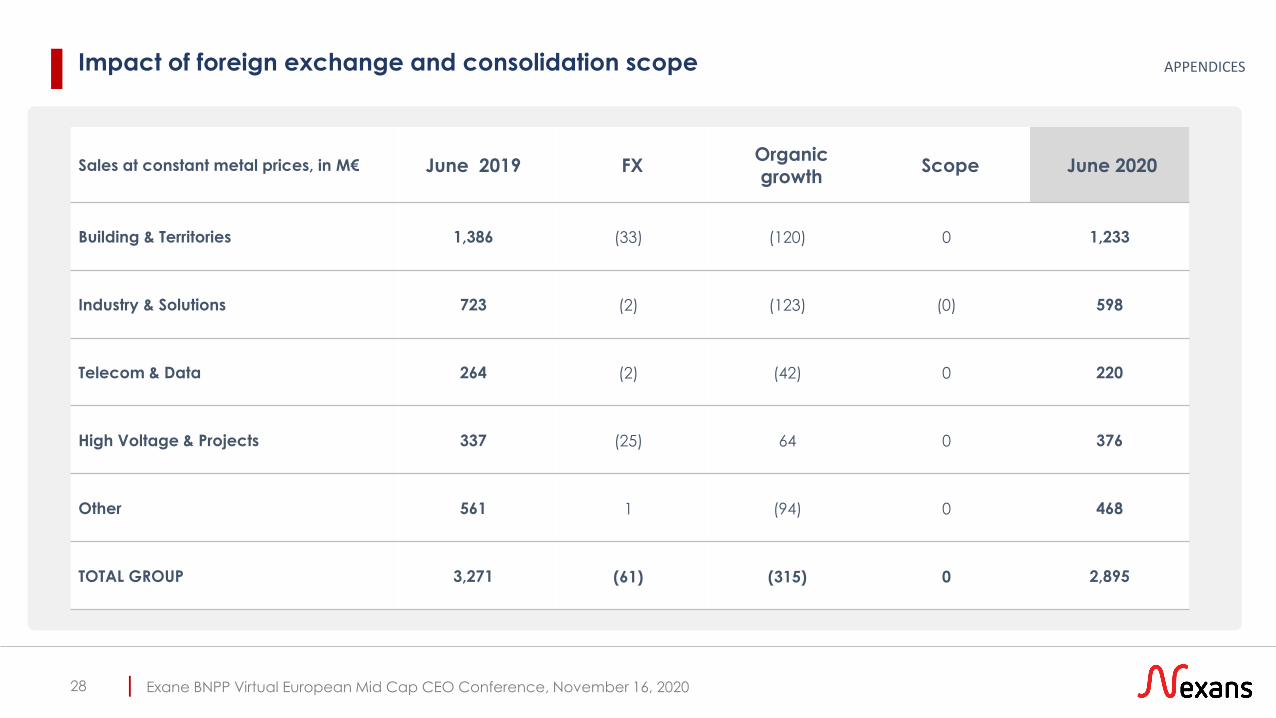
Sales at constant metal prices, in M€ June 2019 FXOrganic growth
Scope June 2020
Building & Territories 1,386 (33) (120) 0 1,233
Industry & Solutions 723 (2) (123) (0) 598
Telecom & Data 264 (2) (42) 0 220
High Voltage & Projects 337 (25) 64 0 376
Other 561 1 (94) 0 468
TOTAL GROUP 3,271 (61) (315) 0 2,895
APPENDICES
28
Impact of foreign exchange and consolidation scope
Exane BNPP Virtual European Mid Cap CEO Conference, November 16, 2020|
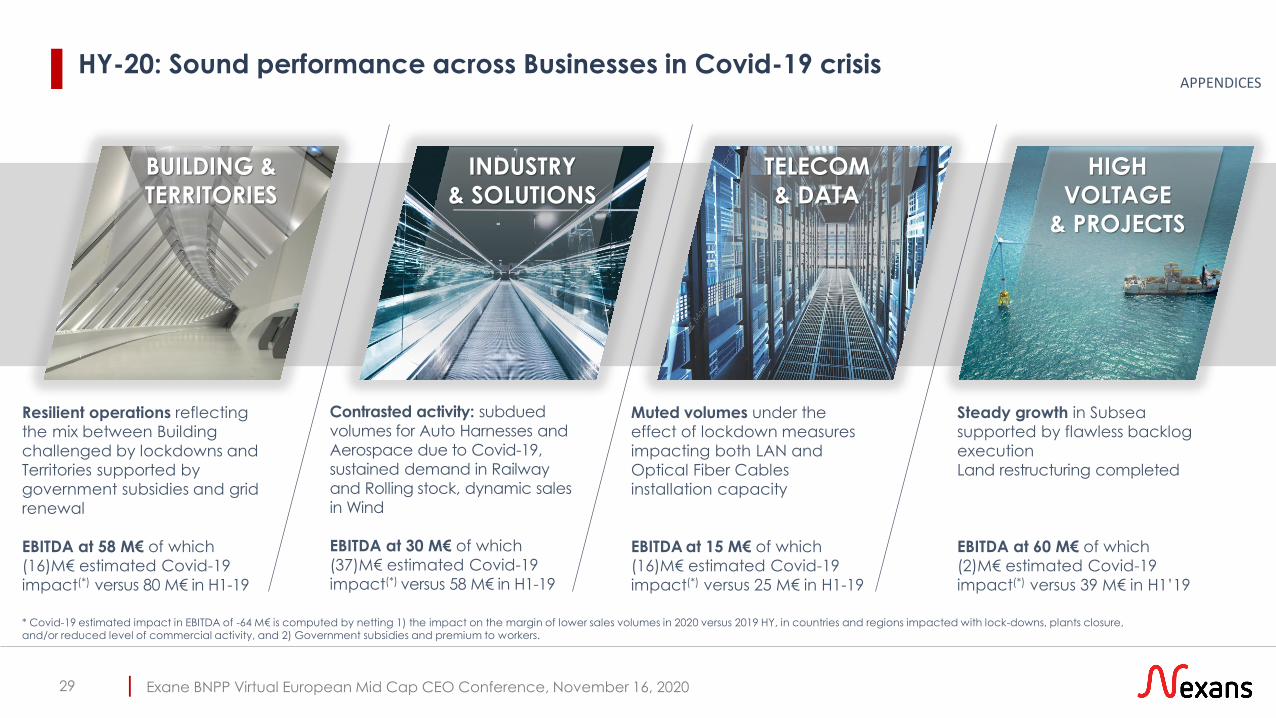
BUILDING &
TERRITORIES
HIGH
VOLTAGE
& PROJECTS
INDUSTRY
& SOLUTIONS
TELECOM
& DATA
Resilient operations reflecting
the mix between Building
challenged by lockdowns and
Territories supported by
government subsidies and grid
renewal
EBITDA at 58 M€ of which
(16)M€ estimated Covid-19
impact(*) versus 80 M€ in H1-19
Contrasted activity: subdued
volumes for Auto Harnesses and
Aerospace due to Covid-19,
sustained demand in Railway
and Rolling stock, dynamic sales
in Wind
EBITDA at 30 M€ of which
(37)M€ estimated Covid-19
impact(*) versus 58 M€ in H1-19
Muted volumes under the
effect of lockdown measures
impacting both LAN and
Optical Fiber Cables
installation capacity
EBITDA at 15 M€ of which
(16)M€ estimated Covid-19
impact(*) versus 25 M€ in H1-19
Steady growth in Subsea
supported by flawless backlog
execution
Land restructuring completed
EBITDA at 60 M€ of which
(2)M€ estimated Covid-19
impact(*) versus 39 M€ in H1’19
HY-20: Sound performance across Businesses in Covid-19 crisis
29
APPENDICES
* Covid-19 estimated impact in EBITDA of -64 M€ is computed by netting 1) the impact on the margin of lower sales volumes in 2020 versus 2019 HY, in countries and regions impacted with lock-downs, plants closure, and/or reduced level of commercial activity, and 2) Government subsidies and premium to workers.
Exane BNPP Virtual European Mid Cap CEO Conference, November 16, 2020|
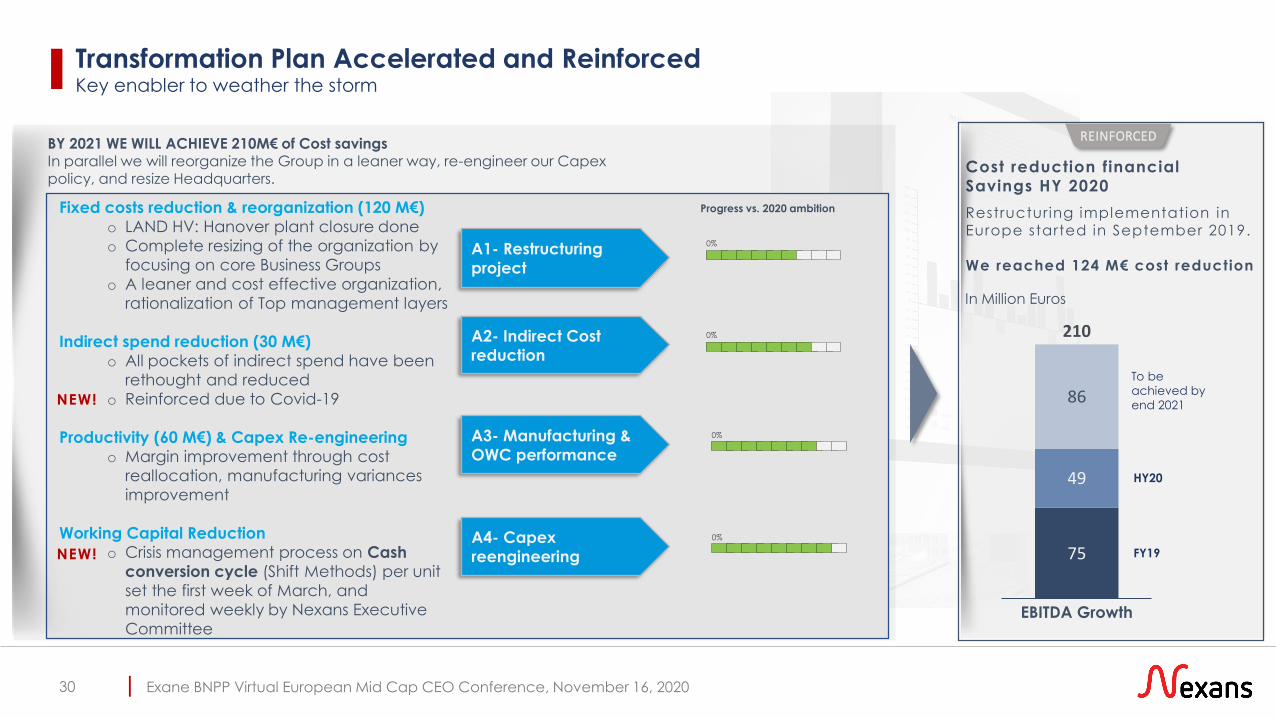
Fixed costs reduction & reorganization (120 M€)
o LAND HV: Hanover plant closure done
o Complete resizing of the organization by
focusing on core Business Groups
o A leaner and cost effective organization,
rationalization of Top management layers
Indirect spend reduction (30 M€)
o All pockets of indirect spend have been
rethought and reduced
o Reinforced due to Covid-19
Productivity (60 M€) & Capex Re-engineering
o Margin improvement through cost
reallocation, manufacturing variances
improvement
Working Capital Reduction
o Crisis management process on Cash
conversion cycle (Shift Methods) per unit
set the first week of March, and
monitored weekly by Nexans Executive
Committee
0%
0%
0%
0%
A1- Restructuring
project
A3- Manufacturing &
OWC performance
A4- Capex
reengineering
A2- Indirect Cost
reduction
Progress vs. 2020 ambition
In Million Euros
Cost reduction financial
Savings HY 2020
Restructuring implementation in Europe started in September 2019.
We reached 124 M€ cost reduction
BY 2021 WE WILL ACHIEVE 210M€ of Cost savingsIn parallel we will reorganize the Group in a leaner way, re-engineer our Capex policy, and resize Headquarters.
Transformation Plan Accelerated and Reinforced Key enabler to weather the storm
NEW!
NEW!
REINFORCED
75
49
86
EBITDA Growth
HY20
FY19
210
To be
achieved by
end 2021
30
Exane BNPP Virtual European Mid Cap CEO Conference, November 16, 2020|31
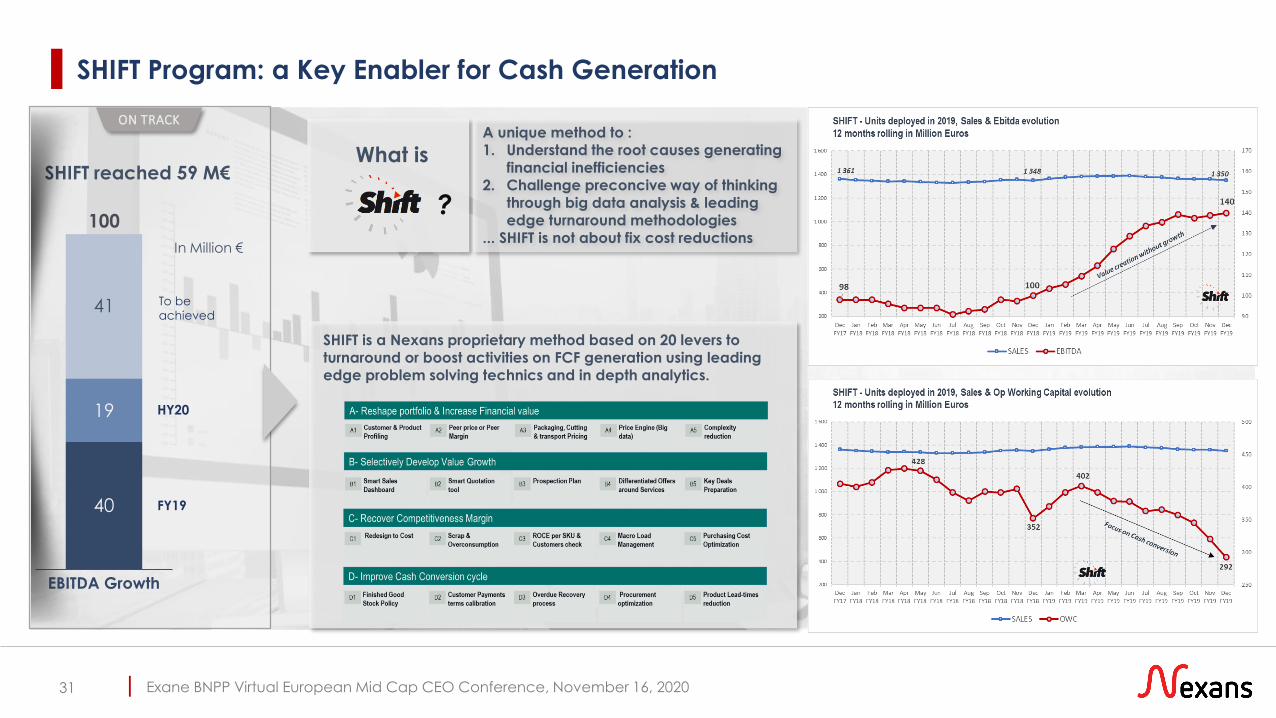
SHIFT reached 59 M€
A unique method to : 1. Understand the root causes generating
financial inefficiencies2. Challenge preconcive way of thinking
through big data analysis & leadingedge turnaround methodologies
... SHIFT is not about fix cost reductions
What is
?
SHIFT is a Nexans proprietary method based on 20 levers to turnaround or boost activities on FCF generation using leadingedge problem solving technics and in depth analytics.
In Million €
ON TRACK
19 HY20
41
100
EBITDA Growth
40 FY19
To be
achieved
SHIFT Program: a Key Enabler for Cash Generation
Exane BNPP Virtual European Mid Cap CEO Conference, November 16, 2020|
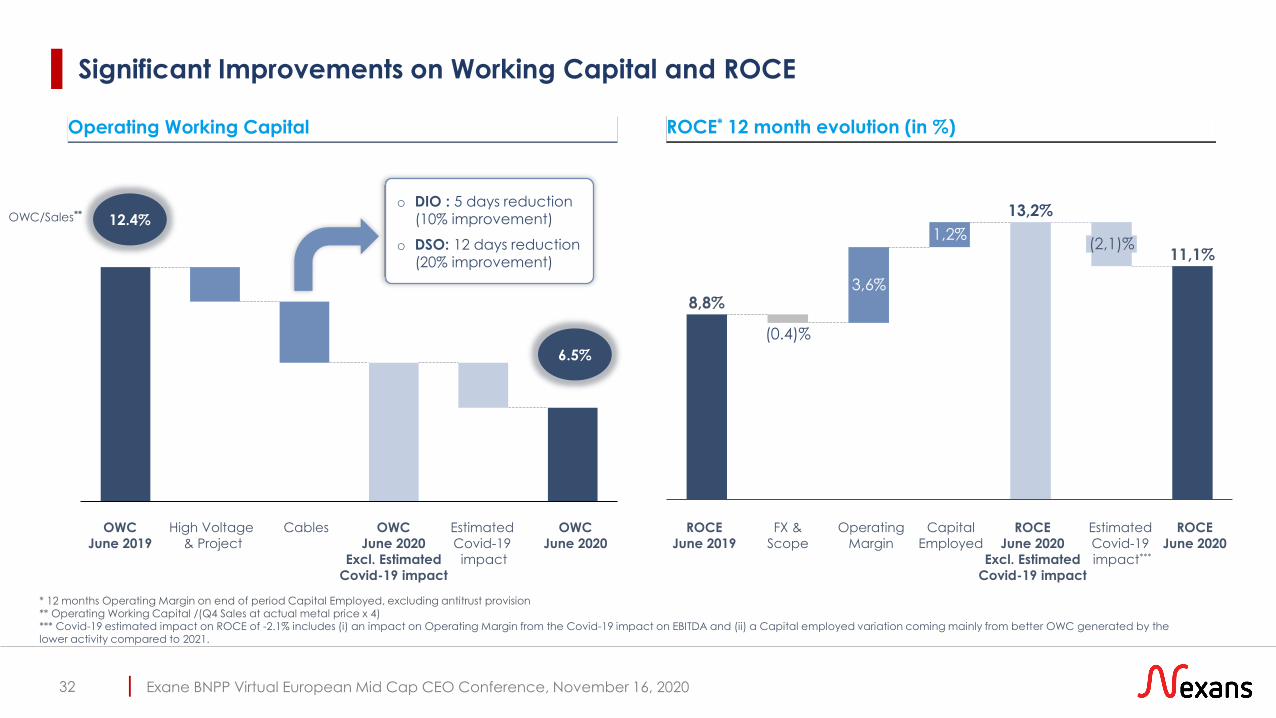
Significant Improvements on Working Capital and ROCE
32
ROCE* 12 month evolution (in %)
FX &
Scope
Operating
Margin
Capital
Employed
* 12 months Operating Margin on end of period Capital Employed, excluding antitrust provision ** Operating Working Capital /(Q4 Sales at actual metal price x 4)*** Covid-19 estimated impact on ROCE of -2.1% includes (i) an impact on Operating Margin from the Covid-19 impact on EBITDA and (ii) a Capital employed variation coming mainly from better OWC generated by the lower activity compared to 2021.
2.9%
ROCE
June 2020
ROCE
June 2019
3,6%
1,2%
11,1%(2,1)%
8,8%
(0.4)%
13,2%
Estimated
Covid-19
impact***
ROCE
June 2020
Excl. Estimated
Covid-19 impact
Operating Working Capital
OWC
June 2019
High Voltage
& Project
Cables OWC
June 2020
Excl. Estimated
Covid-19 impact
OWC
June 2020
Estimated
Covid-19
impact
12.4%
6.5%
OWC/Sales**
o DIO : 5 days reduction (10% improvement)
o DSO: 12 days reduction (20% improvement)
Exane BNPP Virtual European Mid Cap CEO Conference, November 16, 2020|
Thank you
Paris November 16, 2020