Examining the Use of the ASSURE Model by K--12 Teachers
17
Full Terms & Conditions of access and use can be found at http://www.tandfonline.com/action/journalInformation?journalCode=wcis20 Download by: [University of Central Florida] Date: 28 November 2017, At: 17:30 Computers in the Schools Interdisciplinary Journal of Practice, Theory, and Applied Research ISSN: 0738-0569 (Print) 1528-7033 (Online) Journal homepage: http://www.tandfonline.com/loi/wcis20 Examining the Use of the ASSURE Model by K–12 Teachers Daesang Kim & Steve Downey To cite this article: Daesang Kim & Steve Downey (2016) Examining the Use of the ASSURE Model by K–12 Teachers, Computers in the Schools, 33:3, 153-168, DOI: 10.1080/07380569.2016.1203208 To link to this article: https://doi.org/10.1080/07380569.2016.1203208 Published online: 15 Sep 2016. Submit your article to this journal Article views: 487 View related articles View Crossmark data
-
Upload
khangminh22 -
Category
Documents
-
view
7 -
download
0
Transcript of Examining the Use of the ASSURE Model by K--12 Teachers
Full Terms & Conditions of access and use can be found athttp://www.tandfonline.com/action/journalInformation?journalCode=wcis20
Download by: [University of Central Florida] Date: 28 November 2017, At: 17:30
Computers in the SchoolsInterdisciplinary Journal of Practice, Theory, and Applied Research
ISSN: 0738-0569 (Print) 1528-7033 (Online) Journal homepage: http://www.tandfonline.com/loi/wcis20
Examining the Use of the ASSURE Model by K–12Teachers
Daesang Kim & Steve Downey
To cite this article: Daesang Kim & Steve Downey (2016) Examining the Use of theASSURE Model by K–12 Teachers, Computers in the Schools, 33:3, 153-168, DOI:10.1080/07380569.2016.1203208
To link to this article: https://doi.org/10.1080/07380569.2016.1203208
Published online: 15 Sep 2016.
Submit your article to this journal
Article views: 487
View related articles
View Crossmark data
COMPUTERS IN THE SCHOOLS, VOL. , NO. , –http://dx.doi.org/./..
Examining the Use of the ASSURE Model by K– Teachers
Daesang Kim and Steve Downey
Valdosta State University, Valdosta, Georgia, USA
KEYWORDSASSURE; instructional design;instructional model;technology integration
ABSTRACTHeinich et al. (1999) introduced theASSUREmodel to guide teach-ers in how to plan and deliver lessons that effectively integratetechnology into their classroom teaching. Its straightforward,practical approach has made it one of the most widely taughtinstructional models in the education arena. However, for all ofits widespread use, there is very little empirical evidence examin-ing the impact the model has on K–12 learning gains. This study,over a 2-year period, examined 39 separate cases of curriculumbeingdevelopedusing theASSUREmodel and the curricula’s sub-sequent effect in promoting student learning. In addition to ana-lyzing scores on student assessments, teachers’ perceptions andinstructional strategies also were examined as part of this study.
Innovations in technology continue to challenge classroom teachers to designnew instruction and instructional materials that enhance student engagement andlearning activities (Kim, Rueckert, Kim, & Seo, 2013). Although practitioners havetraining and access to valuable information on creating learning opportunities withinstructional design models (see Dick, Carey, & Carey, 2009; Gagne, Wager, Golas,& Keller, 2005; Smith & Ragan, 2005), the effectiveness of these models to createtechnology-infused lessons that impact student learning remains an on-going nar-rative, especially when these lessons make use of emerging technologies; for exam-ple, mobile devices (Berking, Haag, Archibald, & Birthwhistle, 2012; Junqi, Yumei,& Zhibin, 2010), virtual worlds (Downey, 2011; Soto, 2013), and augmented reality(Ifenthaler & Eseryel, 2013).
In today’s classrooms, students are increasingly expecting more technology-facilitated learning activities that are not easily accommodated through traditionalinstruction. To meet these expectations, K–12 teachers often use already developedcurriculum with instructional materials including textbooks and lesson plans thatthey, in turn, adapt to provide relevant new learning experiences that enhance stu-dent engagement and learning with technology. Undoubtedly, teachers often havelimited time or support to work on innovation and improvement of teaching withtechnology and instructional resources as instructional design practices (Laurillard
CONTACT Steve Downey [email protected] Curriculum, Leadership, & Technology, Valdosta StateUniversity, N. Patterson, Valdosta, GA , USA.© Taylor & Francis Group, LLC
Dow
nloa
ded
by [
Uni
vers
ity o
f C
entr
al F
lori
da]
at 1
7:30
28
Nov
embe
r 20
17

154 D. KIM AND S. DOWNEY
et al., 2013). To compensate, teachers rely on models such as ASSURE (Heinich,Molenda, Russell, & Smaldino, 1999).
Heinich et al. (1999) introduced the ASSURE model to guide teachers in how toplan and deliver lessons that effectively integrate technology, media, and materialsinto classroom teaching (Shelly, Gunter, & Gunter, 2012). This model consists of asix-step instructional system design process:
1. Analyze learners,2. State standards, and objectives;3. Select strategies, technology, media, and materials;4. Utilize technology, media, and material;5. Require learner participation; and6. Evaluate and revise (Smaldino, Lowther, Russell, & Mims, 2015).
Through these six steps, the model demonstrates how to select, use, and evaluatetechnology and instructional resources as important parts of a systematic designprocess.
Although many teachers use the ASSUREmodel to design their lessons or learn-ing activities (Russell & Butcher, 1999; Russell, Sorge, & Brickner, 1994; Smaldinoet al., 2015), few researchers have investigated its impact on student learning as newtechnologies have emerged. This study examines how teachers use the ASSUREmodel to create technology-integrated lessons and implement these lessons withtheir students in a variety of settings. The research questions follow:
1. How do teachers use the ASSURE model to integrate technology into theirinstruction?
2. What impact on student learning resulted from the ASSURE-based instruc-tional lessons?
3. What are the teachers’ perceptions of implementing the instruction and ofstudent learning with technology?
Literature review
Over the years, numerous studies have incorporated the ASSURE model into theirinquiries. Studies by Kodali (1998) and Sun (2001) examined the frequency ofinstructional design models used in early Web-based courses but did not examinevariances in students’ learning levels. Asplund (2006) examined teacher uses andperceived benefits of technology infusion into lessons targeting students with dis-abilities. Lee and Lee (2014) examined the ASSURE model’s influence on teacherefficacy related to technology skills.
Unfortunately, while ASSURE is commonly examined in technology skills and/ordesign-oriented studies, no studies were found that carried their examinationthrough to the implementation phase of the instructional process and assessedimpact on student achievement. To ensure the lack of available literature wasnot a methodological oversight, one of the ASSURE model authors, Dr. SharonSmaldino, was contacted directly with the hope that she could provide guidancein finding ASSURE-oriented research that examined the entire process, including
Dow
nloa
ded
by [
Uni
vers
ity o
f C
entr
al F
lori
da]
at 1
7:30
28
Nov
embe
r 20
17

COMPUTERS IN THE SCHOOLS 155
implementation and assessment of student learning gains. As part of her in-depthresponse, Smaldino (personal communication, September 1, 2015) stated, “Youwould think that there would be a literature base of some sort related to ASSUREas a model; however, over the years I have not encountered any.” This confirmedearlier findings identifying a significant gap in the research literature. Bearing thisin mind, this article begins addressing this gap and serves as a prototype for studiesexamining ASSURE’s potential influence on students’ learning.
Methods
To address this study’s research questions, students enrolled in a graduate-levelinstructionalmethods coursewere taskedwith an instructional design project (IDP)in which they created technology-infused instructional units based on the ASSUREmodel, implemented their individual units, and documented student gains in learn-ing resulting from the units. Data and documents from 39 IDP cases were collectedand analyzed; additional information about the IDP and the data procedures is pro-vided below.
A mixed-methods research design with cross-case analysis (Miles, Huberman,& Saldaña, 2014) was employed for collecting and analyzing both quantitative andqualitative data in order to answer the research questions with a more multidimen-sional approach. As part of the design, unobtrusivemeasuring techniques were usedduring the data collection process. These techniques included analyses of docu-ments, personal communications, and group/class communications. The contentfrom these elements was analyzed in keeping with procedures advocated by Patton(2002), and key narrativeswere extracted to illustrate and emphasize important find-ings. These narratives are presented throughout this article. Utilizing this mixed-methods approach allowed the researchers to focus on comparative-historical dataand avoid biasing respondents’ interactions (Trochim & Donnelly, 2006).
Participants
The 39 cases examined during this study were generated by in-service teachersenrolled in an advanced graduate program (i.e., Ed.S. degree) at a regional universitylocated in the southeastern United States. Participants in the study were geograph-ically disbursed in terms of the urban versus rural schools in which the 39 projectswere conducted. They also were equally balanced in terms of years of experience.Just under half (48.7%) were new to the profession with 3 or less years of experiencewhile the remaining 51.3% were veteran teachers (see Table 1).
The projects examined in each of the cases were produced as part of their cap-stone course. The same instructor taught each of the capstone course offerings fall2013 through fall 2014 from which the projects were taken. The 39 cases and theiraccompanying IDPs resulted in 874 pages of instructional materials and documen-tation being analyzed (see Table 2). In addition, learner assessment data from 1,102students, ranging from elementary through high school grade levels, were gathered
Dow
nloa
ded
by [
Uni
vers
ity o
f C
entr
al F
lori
da]
at 1
7:30
28
Nov
embe
r 20
17
156 D. KIM AND S. DOWNEY
Table . Participants’ years of teaching experience.
School level or less – – – More than Total
Elementary Middle High Total
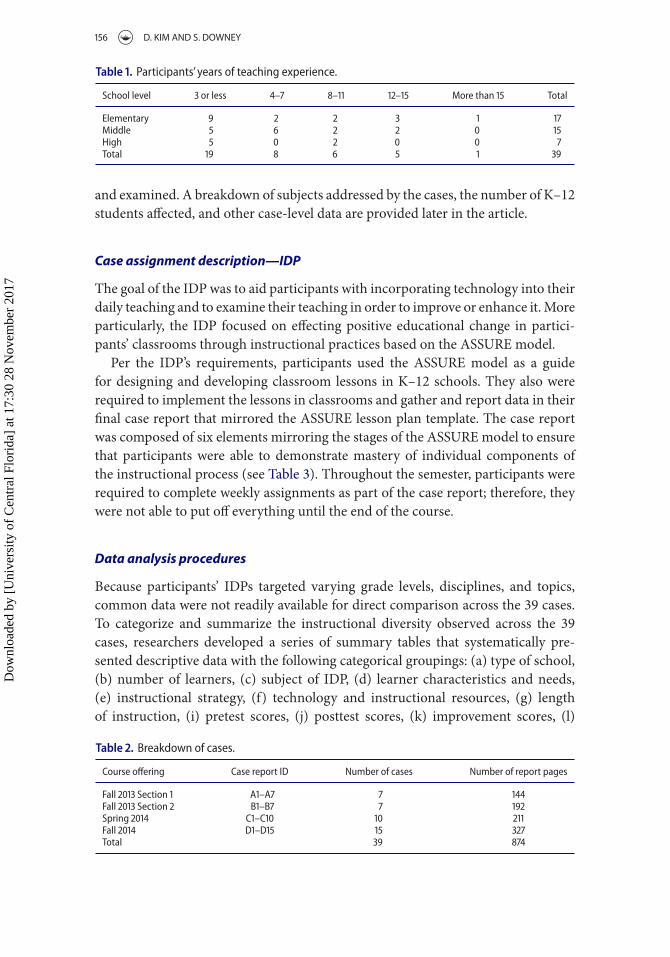
and examined. A breakdown of subjects addressed by the cases, the number of K–12students affected, and other case-level data are provided later in the article.
Case assignment description—IDP
The goal of the IDP was to aid participants with incorporating technology into theirdaily teaching and to examine their teaching in order to improve or enhance it.Moreparticularly, the IDP focused on effecting positive educational change in partici-pants’ classrooms through instructional practices based on the ASSURE model.
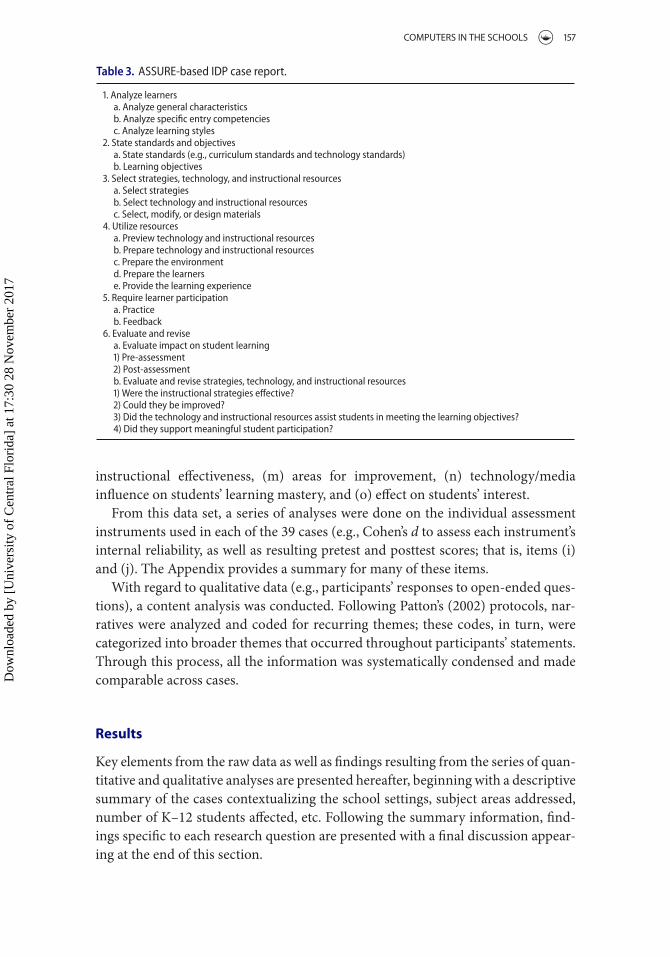
Per the IDP’s requirements, participants used the ASSURE model as a guidefor designing and developing classroom lessons in K–12 schools. They also wererequired to implement the lessons in classrooms and gather and report data in theirfinal case report that mirrored the ASSURE lesson plan template. The case reportwas composed of six elements mirroring the stages of the ASSUREmodel to ensurethat participants were able to demonstrate mastery of individual components ofthe instructional process (see Table 3). Throughout the semester, participants wererequired to complete weekly assignments as part of the case report; therefore, theywere not able to put off everything until the end of the course.
Data analysis procedures
Because participants’ IDPs targeted varying grade levels, disciplines, and topics,common data were not readily available for direct comparison across the 39 cases.To categorize and summarize the instructional diversity observed across the 39cases, researchers developed a series of summary tables that systematically pre-sented descriptive data with the following categorical groupings: (a) type of school,(b) number of learners, (c) subject of IDP, (d) learner characteristics and needs,(e) instructional strategy, (f) technology and instructional resources, (g) lengthof instruction, (i) pretest scores, (j) posttest scores, (k) improvement scores, (l)
Table . Breakdown of cases.
Course offering Case report ID Number of cases Number of report pages
Fall Section A–A Fall Section B–B Spring C–C Fall D–D Total
Dow
nloa
ded
by [
Uni
vers
ity o
f C
entr
al F
lori
da]
at 1
7:30
28
Nov
embe
r 20
17
COMPUTERS IN THE SCHOOLS 157
Table . ASSURE-based IDP case report.
. Analyze learnersa. Analyze general characteristicsb. Analyze specific entry competenciesc. Analyze learning styles
. State standards and objectivesa. State standards (e.g., curriculum standards and technology standards)b. Learning objectives
. Select strategies, technology, and instructional resourcesa. Select strategiesb. Select technology and instructional resourcesc. Select, modify, or design materials
. Utilize resourcesa. Preview technology and instructional resourcesb. Prepare technology and instructional resourcesc. Prepare the environmentd. Prepare the learnerse. Provide the learning experience
. Require learner participationa. Practiceb. Feedback
. Evaluate and revisea. Evaluate impact on student learning) Pre-assessment) Post-assessmentb. Evaluate and revise strategies, technology, and instructional resources) Were the instructional strategies effective?) Could they be improved?) Did the technology and instructional resources assist students in meeting the learning objectives?) Did they support meaningful student participation?
instructional effectiveness, (m) areas for improvement, (n) technology/mediainfluence on students’ learning mastery, and (o) effect on students’ interest.
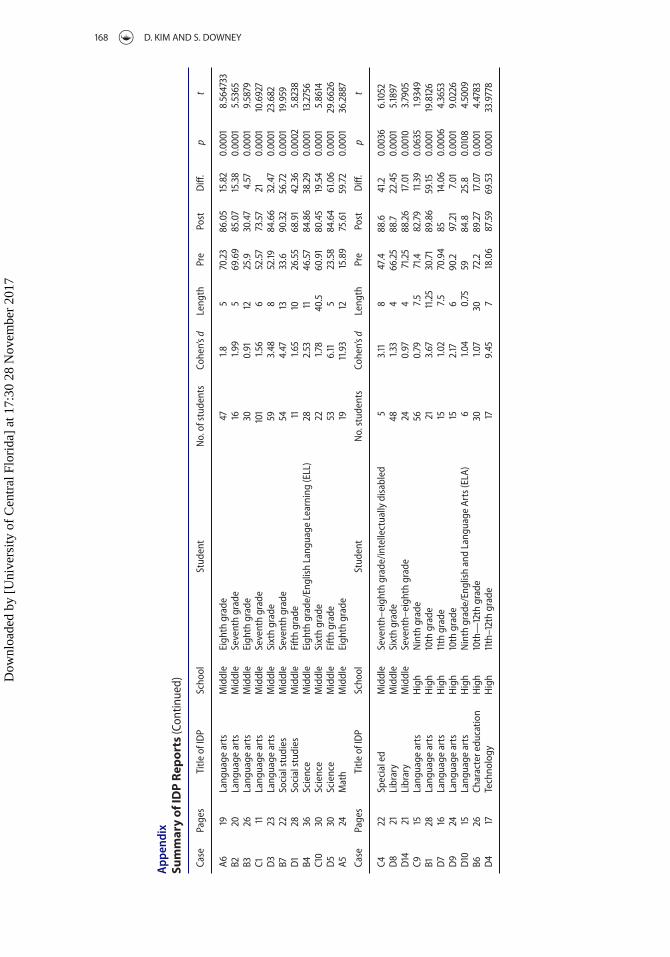
From this data set, a series of analyses were done on the individual assessmentinstruments used in each of the 39 cases (e.g., Cohen’s d to assess each instrument’sinternal reliability, as well as resulting pretest and posttest scores; that is, items (i)and (j). The Appendix provides a summary for many of these items.
With regard to qualitative data (e.g., participants’ responses to open-ended ques-tions), a content analysis was conducted. Following Patton’s (2002) protocols, nar-ratives were analyzed and coded for recurring themes; these codes, in turn, werecategorized into broader themes that occurred throughout participants’ statements.Through this process, all the information was systematically condensed and madecomparable across cases.
Results
Key elements from the raw data as well as findings resulting from the series of quan-titative and qualitative analyses are presented hereafter, beginning with a descriptivesummary of the cases contextualizing the school settings, subject areas addressed,number of K–12 students affected, etc. Following the summary information, find-ings specific to each research question are presented with a final discussion appear-ing at the end of this section.
Dow
nloa
ded
by [
Uni
vers
ity o
f C
entr
al F
lori
da]
at 1
7:30
28
Nov
embe
r 20
17

158 D. KIM AND S. DOWNEY
Summary of cases
As illustrated in Table 4, the cases examined within this study demonstrate theASSUREmodel’s adaptability to a variety of school settings and subject areas. Class-room teachers from elementary through secondary schools (variable v1) embracedtheASSUREmodel to design and implement their instructionwith students across awide range of ages and in a variety of subjects. Although the preponderance of casesfocused on language arts and middle school settings, it should not be inferred thatASSURE is best applied to these areas. As discussed later, student learning gainsbetween pretest and posttest measures were consistently observed across all ageranges and subject areas.
Question 1: How do teachers use the ASSUREmodel to integrate technologyinto their instruction?
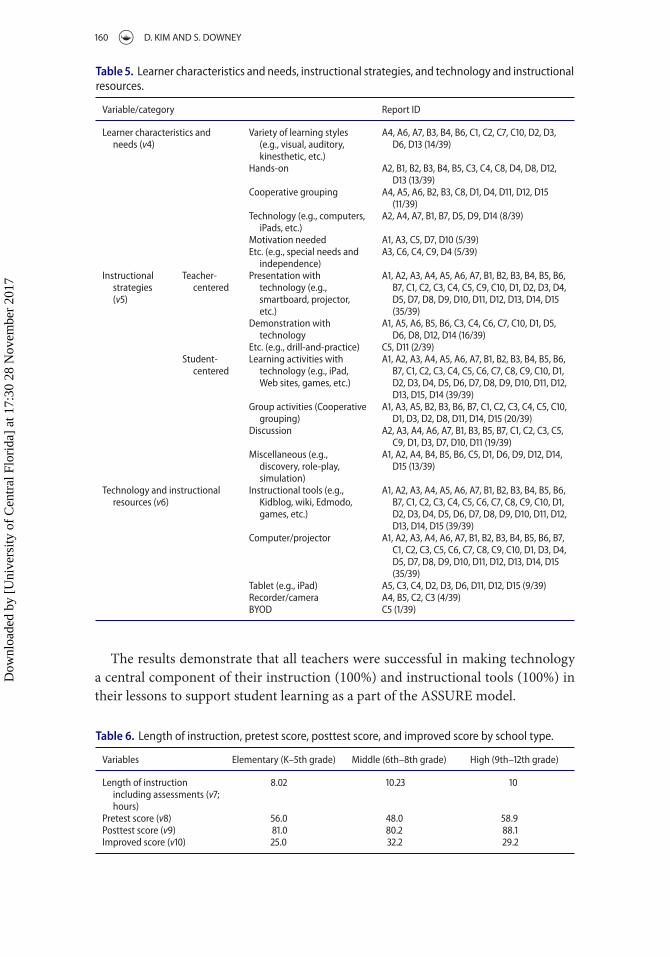
One of the key stages of the ASSURE model focuses on the selection of strate-gies, technologies, media, and materials for use in instruction. These elements wereexamined along three factors: learner characteristics and needs (v4), instructionalstrategies (v5), and technology and instructional resources (v6). The informationin the table for each variable was organized into major categories that emergedwhen analyzing content of the cases during the coding process. For instance, the
Table . School settings and subjects addressed in IDP cases.
Instructional settingsElementary (K–thgrades)
Middle (th–thgrades) High (th–th grades)
School type (v) A, A, A, A, B,C, C, C, C, C,C, D, D, D,D, D, D(/)
A, A, A, B, B, B,B, C, C, C, D,D, D, D, D(/)
B, B, C, D, D, D,D (/)
Number of learners (v) Subject of IDP(v)
Language arts (e.g.,reading fluency,persuasive writing)
A, B, C, C, C,C, C, D, D,D, D, D(/)
A, A, B, B, C, D(/)
B, C, D, D, D(/)
Social studies (e.g., votingand citizenship)
A, A, D (/) B, D (/)
Science (e.g., electricityand magnetism)
A (/) B, C, D (/)
Special education (e.g.,functional groceryword identification)
C (/) C (/)
Research/library media(e.g., how to useprimary and secondarysources in research)
D, D (/)
Math (e.g., working withexponents)
A (/)
Character (e.g., characterin real life)
B (/)
Business tech (e.g., mailmerge in Word)
D (/)
Dow
nloa
ded
by [
Uni
vers
ity o
f C
entr
al F
lori
da]
at 1
7:30
28
Nov
embe
r 20
17

COMPUTERS IN THE SCHOOLS 159
information on learner characteristics and needs (v4) was organized by six majorcategories that emerged from the teachers’ responses onwhat they described as theirstudents’ perceptual preferences and strengths for learning: variety of learning styles;hands-on, cooperative grouping; technology; motivation needed; and so forth (e.g.,special needs and independence). The following excerpts exemplify the commentsmade by participants when analyzing the characteristics of learners in their individ-ual case studies.
With respect to learning styles, the students enjoy participating in collaborative activities(A5, Cooperative grouping).
The majority of the students appear to experience more success when information is pre-sented using technology and media (B1, Technology [e.g., computers, iPads, etc.]).
They are beginning to work well independently of direct teacher supervision, but still needredirection and motivation (A3, Motivation needed).
Themajority of the class have amoderate intellectual disability (C4, Etc. [e.g., special needsand independence]).
Once the teachers analyzed their students’ learner characteristics and needs (v4),the teachers engaged in the critical step of selecting the appropriate instructionalstrategies (v5), technologies, and instructional resources (v6) to achieve the learn-ing objectives. In terms of defining their instructional strategies (v5), the followingstrategy statements from participants’ case studies demonstrate the unique and var-ied approaches used.
The teacher will use the interactive whiteboard to teach students how to apply exponentrules to various numerical and algebraic expressions. Presentation was selected as theinstructional strategy because this material is new for all students in the class (A5, Pre-sentation with technology).
Student-centered activities will include students working collaboratively to constructa front page news article or a mini–documentary (B7, Group activities/Cooperativegrouping).
This will be followed by a discussion (student-centered) ensuring that students have fullygrasped the basic knowledge provided by the text on the topic of Great Depression, theCrash of the Stock Market, New Deal (D1, Discussion).
In terms of technology and instructional resources (v6), therewere few categories,as noted in Table 5, but within those categories the actual resources used variedwidely.
Students enjoy using the mini whiteboards, working on IXL , and using the iPads. Thewhiteboards and IXL provide students with instant feedback, which they like. The iPadsadd a level of technical sophistication and “cool” factor to their work, which promotes stu-dent engagement (A5, Instructional tools).
Throughout the course of this unit, various forms of technology will be utilized, such asPowerPoint (PPT), YouTube videos, Senteo response systems, digital cameras, Web-basedresources, and publishing software (B7, Instructional tools).
Dow
nloa
ded
by [
Uni
vers
ity o
f C
entr
al F
lori
da]
at 1
7:30
28
Nov
embe
r 20
17
160 D. KIM AND S. DOWNEY
Table . Learner characteristics and needs, instructional strategies, and technology and instructionalresources.
Variable/category Report ID
Learner characteristics andneeds (v)
Variety of learning styles(e.g., visual, auditory,kinesthetic, etc.)
A, A, A, B, B, B, C, C, C, C, D, D,D, D (/)
Hands-on A, B, B, B, B, B, C, C, C, D, D, D,D (/)
Cooperative grouping A, A, A, B, B, C, D, D, D, D, D(/)
Technology (e.g., computers,iPads, etc.)
A, A, A, B, B, D, D, D (/)
Motivation needed A, A, C, D, D (/)Etc. (e.g., special needs and
independence)A, C, C, C, D (/)
Instructionalstrategies(v)
Teacher-centered
Presentation withtechnology (e.g.,smartboard, projector,etc.)
A, A, A, A, A, A, A, B, B, B, B, B, B,B, C, C, C, C, C, C, C, D, D, D, D,D, D, D, D, D, D, D, D, D, D(/)
Demonstration withtechnology
A, A, A, B, B, C, C, C, C, C, D, D,D, D, D, D (/)
Etc. (e.g., drill-and-practice) C, D (/)Student-
centeredLearning activities with
technology (e.g., iPad,Web sites, games, etc.)
A, A, A, A, A, A, A, B, B, B, B, B, B,B, C, C, C, C, C, C, C, C, C, C, D,D, D, D, D, D, D, D, D, D, D, D,D, D, D (/)
Group activities (Cooperativegrouping)
A, A, A, B, B, B, B, C, C, C, C, C, C,D, D, D, D, D, D, D (/)
Discussion A, A, A, A, A, B, B, B, B, C, C, C, C,C, D, D, D, D, D (/)
Miscellaneous (e.g.,discovery, role-play,simulation)
A, A, A, B, B, B, C, D, D, D, D, D,D (/)
Technology and instructionalresources (v)
Instructional tools (e.g.,Kidblog, wiki, Edmodo,games, etc.)
A, A, A, A, A, A, A, B, B, B, B, B, B,B, C, C, C, C, C, C, C, C, C, C, D,D, D, D, D, D, D, D, D, D, D, D,D, D, D (/)
Computer/projector A, A, A, A, A, A, B, B, B, B, B, B, B,C, C, C, C, C, C, C, C, C, D, D, D,D, D, D, D, D, D, D, D, D, D(/)
Tablet (e.g., iPad) A, C, C, D, D, D, D, D, D (/)Recorder/camera A, B, C, C (/)BYOD C (/)
The results demonstrate that all teachers were successful in making technologya central component of their instruction (100%) and instructional tools (100%) intheir lessons to support student learning as a part of the ASSURE model.
Table . Length of instruction, pretest score, posttest score, and improved score by school type.
Variables Elementary (K–th grade) Middle (th–th grade) High (th–th grade)
Length of instructionincluding assessments (v;hours)
. .
Pretest score (v) . . .Posttest score (v) . . .Improved score (v) . . .
Dow
nloa
ded
by [
Uni
vers
ity o
f C
entr
al F
lori
da]
at 1
7:30
28
Nov
embe
r 20
17
COMPUTERS IN THE SCHOOLS 161
It was particularly interesting to note the frequent use of technology-supportedactive learning strategies employed in each of the cases. Although ASSURE wasnot conceived with the primary intent of serving as an active learning model, itreadily lends itself to facilitating active learning strategies. As noted in Table 5,the majority of cases employed technology-supported learning activities that werestudent-centered (e.g., student-driven inquiry, discovery and information gather-ing, simulations, etc.). In addition to student-centered learning, more than halfof the cases (20/39) utilized some form of collaborative learning. In terms of theactivities themselves, Web-based resources, games, and activities were used. Afew cases employed tablets; and in unique cases involving elementary school stu-dents, the students were allowed to “bring your own device” (BYOD) to help themlearn.
Noting that only two cases used technologies for drill-and-practice and othernon-active learning strategies, it is clear that participants used the ASSURE modelto seek out and employ technologies that engaged their learners in an active, hands-on, collaborative manner. This approach could be a paramount reason why somanycases posted strong learning gains for their students.
Question 2:What impact on student learning resulted from the ASSURE-basedinstructional lessons?
As part of the Evaluate and Revise phase of the ASSURE model, participantsmeasured student learning gains through the use of pre/posttest measures. Thesemeasures, in turn, were reported as part of the participants’ IDP case report.Table 6 provides a summary of students’ instructional time and the learninggains that resulted from the instruction. Case-by-case details are provided in theAppendix.
Paired, two-tailed, t tests were calculated using the pretest and posttest meansfrom each of the 39 cases. When looking across all of the cases, the average pretestvalue was 53.45 (SD= 20.24) and the average posttest value was 82.14 (SD= 17.04),resulting in a significant increase in student learning (t(38) = −10.299, p < .001;Cohen’s d = 1.54). This is not surprising when one examines the student learninggains at the individual case level. At the individual case level, only one of the 39 casesproduced learning gains that were not statistically significant (see the Appendix forcase level details). Case C6 did observe an increase in student learning but not at sig-nificant levels. It further should be noted that C6 is an outlier in that there were onlytwo students in the special education classroom using the ASSURE-based instruc-tional content.
Given the manner in which K–12 students consistently achieved statistically sig-nificant learning gains regardless of grade levels or subject matter, it is difficult todiscount the pedagogical potential of the ASSURE model. By employing ASSUREin their instructional design practices, 38 out of 39 participants (97.4%) producedinstructionalmodules resulting in large learning gains for their 1,102K–12 students.
Dow
nloa
ded
by [
Uni
vers
ity o
f C
entr
al F
lori
da]
at 1
7:30
28
Nov
embe
r 20
17
162 D. KIM AND S. DOWNEY
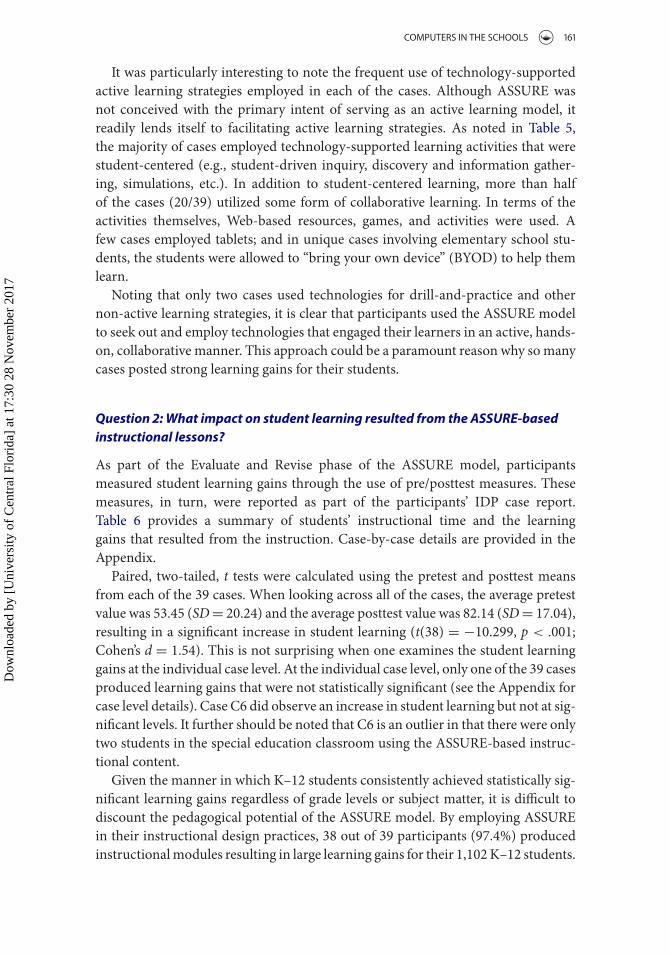
Table . Summary of IDP reports by variables , , and .
Variable/category Report ID
Were the instructionalstrategies effective?(v)
Positive A, A, A, A, A, A, A, B, B, B, B, B, B, B, C,C, C, C, C, C, C, C, C, C, D, D, D, D,D, D, D, D, D, D, D, D, D (/)
Required minor change D (/)Required major change D (/)
Did the technology andmedia assist studentsin meeting the learningobjectives? (v)
Positive A, A, A, A, A, A, A, B, B, B, B, B, B, B, C,C, C, C, C, C, C, C, C, C, D, D, D, D,D, D, D, D, D, D, D, D (/)
Required minor change D, D (/)Required major change D (/)
Were they effective inarousing studentinterest? (v)
Positive A, A, A, A, A, A, A, B, B, B, B, B, B, B, C,C, C, C, C, C, C, C, C, C, D, D, D, D,D, D, D, D, D, D, D, D, D (/)
Required minor change D (/)Required major change D (/)
Question 3:What are the teachers’ perceptions of implementing the instructionand of student learningwith technology?
The final step of the project focused on the teachers’ reflections on assessing theinstructional strategies, technology, and instructional resources used to supportstudent learning. The reflection questions were prepared based on recom-mendations by Smaldino et al. (2015, p. 56): Were the instructional strate-gies effective? (v11), Could they be improved? (v12), Did the technology andmedia assist students in meeting the learning objectives? (v13), and Were theyeffective in arousing student interest? (v14). The findings of the reflectionsregarding those categorical variables were analyzed and the results presentedin Table 7.
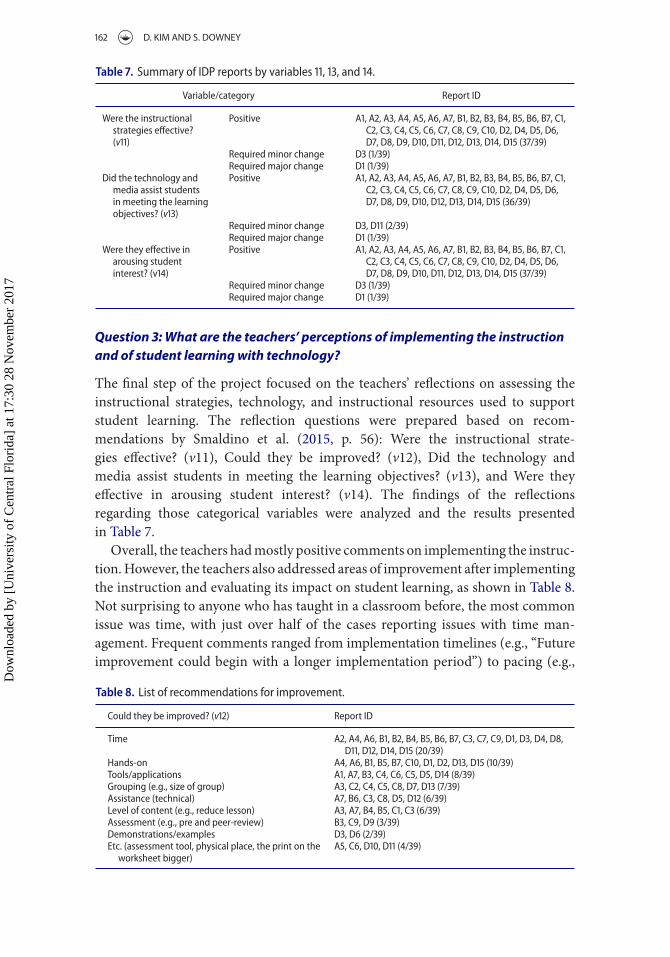
Overall, the teachers hadmostly positive comments on implementing the instruc-tion.However, the teachers also addressed areas of improvement after implementingthe instruction and evaluating its impact on student learning, as shown in Table 8.Not surprising to anyone who has taught in a classroom before, the most commonissue was time, with just over half of the cases reporting issues with time man-agement. Frequent comments ranged from implementation timelines (e.g., “Futureimprovement could begin with a longer implementation period”) to pacing (e.g.,
Table . List of recommendations for improvement.
Could they be improved? (v) Report ID
Time A, A, A, B, B, B, B, B, B, C, C, C, D, D, D, D,D, D, D, D (/)
Hands-on A, A, B, B, B, C, D, D, D, D (/)Tools/applications A, A, B, C, C, C, D, D (/)Grouping (e.g., size of group) A, C, C, C, C, D, D (/)Assistance (technical) A, B, C, C, D, D (/)Level of content (e.g., reduce lesson) A, A, B, B, C, C (/)Assessment (e.g., pre and peer-review) B, C, D (/)Demonstrations/examples D, D (/)Etc. (assessment tool, physical place, the print on theworksheet bigger)
A, C, D, D (/)
Dow
nloa
ded
by [
Uni
vers
ity o
f C
entr
al F
lori
da]
at 1
7:30
28
Nov
embe
r 20
17

COMPUTERS IN THE SCHOOLS 163
“strategies used could likely be improved somewhat by switching back and forthmore quickly between teacher- and student-centered strategies to make the lessonfeelmore quickly paced” to balancing time spent on one activity versus another (e.g.,“I believe the students would have been better off if they hadmore practice scanningcodes before this assignment”).
Similarly, the teachers had mostly positive comments about the implementationof the instruction and students learning with technology. About 95% of the teachersresponded that their instructional strategies were effective (v11) and that technologyand instructional resources assist their students in meeting learning goals (v13) andassist in arousing student interest (v14). Positive statements about the effectivenessof instructional strategies (v11) included
This increase in assessment results indicates the instruction was effective in teaching stu-dents how to accurately use exponent rules to solve mathematical problems (A5, Positive).
After implementing the project in Mrs. Johnson’s third-grade class, we found the IDP tobe very effective. The results were very encouraging. Students had an average of 34% gainsbetween the pretest and posttest (B5, Positive).
Equally positive observations were found in participants’ case studies in the areaof technology and learning objectives (v13).
In talking with the students, the practice on IXL was the most beneficial in helping stu-dents learn the content. The students liked receiving instant feedback and raising their“SmartScore” within the program (A5, Positive).
Yes, the use of the Bitsboard App assisted students in learning the functional vocabularyand words. Students were very focused while using the Bitsboard App and stayed on taskwhile participating in the various activities it provided with the functional vocabulary (C4,Positive).
Similarly, participants observed positive effects on students’ engagement andinterest in learning during their projects.
Students were engaged and excited when they used the technology. Students loved doingthe research on the laptops and desktop computers and printing out the images to add tothe storyboard. Students also loved using the Flips to record their stories (B5, Positive).
They especially enjoyed working in groups of two to play the activities and see who couldobtain the most matches in a memory game with the functional vocabulary (C4, Positive).
Althoughmany teachers had a positive outlook and positive teaching experienceswith the lessons, it did not mean that the instruction based on the ASSURE modelwas effective for all students (see Table 9).
Overall, teachers were very happy with the ASSURE-facilitated projects theydeveloped as well as with the results posted by the students. However, as severalteachers wrote, “There is always room for improvement.” The changes that wererecommended were minor in nature and ones that are typical of instructional unitsbeing implemented for the first time (e.g., better time management). In those caseswhere major changes were identified, the changes related to students’ preparedness
Dow
nloa
ded
by [
Uni
vers
ity o
f C
entr
al F
lori
da]
at 1
7:30
28
Nov
embe
r 20
17

164 D. KIM AND S. DOWNEY
Table . Participants’ comments on recommended minor or major changes.
VariableRequired minor change (from thereport D)
Required major change (from thereport D)
Were the instructional strategieseffective? (v)
“Several students admitted that theydo not like to write regardless of themedium or the topic, and thosewere the same students who did notshow progress.”
“The instructional strategies utilizedwithin this project had to bemodified a great deal frommyoriginal plan to what the studentswere able to do. As well, thestrategies, technology, and mediawere more of a burden on thelearning process rather than helpfuland effective.”
Did the technology and mediaassist students in meeting thelearning objectives? (v)
“Many students learned quickly to addimages to their blog posts, realizingthe added aesthetic touch that theyprovide. Others never embracedthis.”
“The media and technology alsocaused distractions with thestudents staying focused on theirwork. The students didn’t dodetailed research due to their tryingto rush through the projects.”
Were they effective in arousingstudent interest? (v)
“When this unit was first introduced,many students were excited to getstarted and continued to blogenthusiastically, growing in theirwriting gradually. Even thosestudents who were least interestedin reading and discussing booksshowed some interest.”
“Surprisingly, the students were notaroused by the project at all. …Again, I feel that the students wereinitially intimidated andoverwhelmed by the project. This isbecause the students have not beenchallenged to this capacity beforeand allowed to ‘think outside thebox.”’
(e.g., having the skills to use the technology or being able to stay focused and notdistracted by the technology being used).
Discussion
Depending on the instructional resources available for use, there are a variety of gen-eral instructional design frameworks (e.g., Dick, Carey, & Carey, 2009; Gagne et al.,2005; Smith & Ragan, 2005), as well as technology-specific models (e.g., Berking,Haag, Archibald, & Birthwhistle, 2012; Downey, 2011; Ifenthaler & Eseryel, 2013).Heinich et al.’s (1999) ASSURE model is a generic model that has stood the test oftime.However, for all of its long-term stamina, there is comparatively little empiricalevidence examining its effect on student learning gains.
Based upon the findings from this study, it appears that the ASSURE model def-initely has a positive influence on learners who receive instruction developed usingthis framework. As the data in Tables 4 and 5 illustrate, the six stages of the ASSUREmodel support, and potentially encourage, the creation of student-centered, activelearning lessons. Admittedly, the ASSURE model does not preclude the creationof lessons that are wholly teacher-centered or lessons that rely on passive learn-ing strategies. There were cases of this nature; however, these cases were very fewin number and each of them still used some level of student-centered instructionand/or active learning. As a whole, the strategies used in the 39 cases were active,engaging, and highly effective.
Dow
nloa
ded
by [
Uni
vers
ity o
f C
entr
al F
lori
da]
at 1
7:30
28
Nov
embe
r 20
17
COMPUTERS IN THE SCHOOLS 165
With regard to their effect on student learning, the ASSURE-facilitated lessonsproved to be highly effective. Thirty-eight (38) out of the 39 cases reported statisti-cally significant learning gains. Given that these gains spanned over 1,100 studentsacross a broad spectrum of disciplines in elementary, middle, and high school set-tings, the consistent reporting of such large learning gains is remarkable in andof itself. The one common element across all of these cases was the use of theASSURE model to guide, plan, and develop lessons systematically and symmetri-cally to effectively integrate the use of appropriate instructional strategies, technol-ogy, and media for learning. In doing so, it appears that the teachers successfullydeveloped instructional strategies (v5) with technology and instructional resources(v6) in their lessons to support learner differences and special needs (v4) as a partof the ASSURE model.
With an eye toward sustaining the learning gains, the data, and comments inTables 7, 8, and 9 reflect the important step of evaluation and revision (v12). In nearlyevery case, the teachers’ perceptions of the lesson and its effectiveness were positive.Granted, revisions typically are necessary but those revisions were relatively minorin nature for the majority of the cases.
In conclusion, from a practitioner standpoint, it is acknowledged that theASSURE model is a practical, easy-to-implement approach for integrating technol-ogy into classroom instruction. Beyond its ability to facilitate the development ofnew lessons, it remains to be seen if, and to what degree, it may affect student learn-ing gains. Consequently, it was with much surprise that such large learning gainswere so consistently reported across nearly every case analyzed in the study. Admit-tedly, it is unlikely that such large and sweeping gains will occur in all future stud-ies. That being said, such positive and overwhelming results encourage the needfor additional studies examining the potential influences of the ASSURE model todetermine more precisely to what degree and in what areas the ASSURE model hasthe greatest impact on instruction and learning.
References
Asplund, S. E. (2006). A study of two technology-enriched inclusion classrooms that promote learn-ing for students with learning disabilities (Doctoral dissertation). Retrieved from ProQuestDissertations & Theses Global database. (Order No. 3272140)
Berking, P., Haag, J., Archibald, T., & Birthwhistle, M. (2012). Mobile learning: Not justanother delivery method. In Proceedings of the 2012 Interservice/Industry Training, Simula-tion, and Education Conference. Arlington, VA: National Training and Simulation Associa-tion. Retrieved from http://www.adlnet.org/wp-content/uploads/2012/12/12079.pdf
Dick, W., Carey, L., & Carey, J. O. (2009). The systematic design of instruction (7th ed.). UpperSaddle River, NJ: Pearson.
Downey, S. (2011). i-MMOLE: Instructional framework for creating virtual world lessons.TechTrends, 55(6), 33–41.
Gagne, R. M., Wager, W. W., Golas, K. C., & Keller, J. M. (2005). Principles of instructional design(5th ed.). Belmont, CA: Wadsworth.
Dow
nloa
ded
by [
Uni
vers
ity o
f C
entr
al F
lori
da]
at 1
7:30
28
Nov
embe
r 20
17
166 D. KIM AND S. DOWNEY
Heinich, R., Molenda, M., Russell, J. D., & Smaldino, S. (1999). Instructional media and technolo-gies for learning (6th ed.). Englewood Cliffs, NJ: Merrill/Prentice Hall.
Ifenthaler, D., & Eseryel, D. (2013). Facilitating complex learning by mobile aug-mented reality learning environments. In R. Huang, J. M. Spector, & Kinshuk (Eds.),Reshaping learning (pp. 415–438). Berlin, Germany: Springer-Verlag. Retrieved fromhttp://deniz.eseryel.com/uploads/9/0/7/5/9075695/2013_ifenthalereseryel_cl-marle.pdf
Junqi, W., Yumei, L., & Zhibin, L. (2010, March). Study of instructional design in ubiquitouslearning. In Z. Hu & Z. Ye (Eds.), Education technology and computer science (ETCS), 2010second international workshop (Vol. 3, pp. 518–523). Wuhan, Hubei, China.
Kim, D., Rueckert, D., Kim, D.-J., & Seo, D. (2013). Students’ perceptions and experiences ofmobile learning. Language Learning & Technology, 17(3), 52–73.
Kodali, S. (1998). Instructional strategies used to design and deliver courses online (Doctoral dis-sertation). Retrieved from ProQuest Dissertations & Theses Global database. (Order No.9830943)
Laurillard, D., Charlton, P., Craft, B., Dimakopoulos, D., Ljubojevic, D., Magoulas, G., …Whittlestone, K. (2013). A constructionist learning environment for teachers to model learn-ing designs. Journal of Computer Assisted Learning, 29, 15–30.
Lee, Y., & Lee, J. (2014). Enhancing pre-service teachers’ self-efficacy beliefs for technol-ogy integration through lesson planning practice. Computers & Education, 73, 121–128.doi:10.1016/j.compedu.2014.01.001
Miles, M., Huberman, A. M., & Saldaña, J. (2014). Qualitative data analysis (3rd ed.). ThousandOaks, CA: Sage.
Patton, M. Q. (2002). Qualitative research & evaluation methods (3rd ed.). Thousand Oaks, CA:Sage.
Russell, J. D., & Butcher, C. (1999). Using portfolios in educational technology courses. Journalof Technology and Teacher Education, 7(4), 279–289.
Russell, J. D., Sorge, D., & Brickner, D. (1994). Improving technology implementation in grades5–12 with the ASSURE model. Technological Horizons in Education, 21(9), 66–70.
Shelly, G. B., Gunter, G. A., & Gunter, R. E. (2012). Teachers discovering computers: Integratingtechnology in a connected world (7th ed.). Boston, MA: Cengage Learning.
Smaldino, S. E., Lowther, D. L., Russell, J. D., & Mims, C. (2015). Instructional technology andmedia for learning (10th ed.). Upper Saddle River, NJ: Prentice Hall.
Smith, P. L., & Ragan, T. J. (2005). Instructional design (3rd ed.). Hoboken, NY: Wiley.Soto, V. (2013). Which instructional design models are educators using to design virtual world
instruction. Journal of Online Learning and Teaching, 9(3), 364–375.Sun, X. (2001).An investigation of instructional designmodels forWeb-based instruction (Doctoral
dissertation). Retrieved from ProQuest Dissertations & Theses Global database. (Order No.3004521)
Trochim, W., & Donnelly, J. (2006). The research methods knowledge base (3rd ed.). Mason, OH:Cengage Learning.
Dow
nloa
ded
by [
Uni
vers
ity o
f C
entr
al F
lori
da]
at 1
7:30
28
Nov
embe
r 20
17

COMPUTERS IN THE SCHOOLS 167
App
endix
Summaryof
IDPRe
ports
Case
Pages
Title
ofIDP
Scho
olStud
ent
Num
berofstudentsCo
hen’sd
Leng
thPre
Post
Difference
pt
A
Lang
uage
arts
Elem
entary
Firstg
rade
.
.
.
.
.
.
.
B
Lang
uage
arts
Elem
entary
Third
grade
.
.
.
.
.
.
.
C
Lang
uage
arts
Elem
entary
Fourth
grade
.
.
.
.
.
.
C
Lang
uage
arts
Elem
entary
K
.
.
.
.
.
.
.
C
Lang
uage
arts
Elem
entary
Second
grade
.
.
.
.
.
.
C
Lang
uage
arts
Elem
entary
Firstg
rade
.
.
.
.
.
.
.
C
Lang
uage
arts
Elem
entary
Firstg
rade
.
.
.
.
.
D
Lang
uage
arts
Elem
entary
Firstg
rade/Eng
lishforSpeakerso
fOtherLang
uages(ESOL)
.
.
.
.
.
D
Lang
uage
arts
Elem
entary
Fifthgrade
.
.
.
.
.
.
.
D
Lang
uage
arts
Elem
entary
Third
grade
.
.
.
.
.
D
Lang
uage
arts
Elem
entary
Fifthgrade
.
.
.
.
.
.
D
Lang
uage
arts
Elem
entary
Fourth
grade/gifted
.
.
.
A
Socialstud
ies
Elem
entary
Third
grade
.
.
.
.
.
.
A
Socialstud
ies
Elem
entary
Fourth
grade/risk
.
.
.
.
.
.
.
Case
Pages
Title
ofIDP
Scho
olStud
ent
No.ofstud
ents
Cohen’sd
Leng
thPre
Post
Diff.
pt
D
Socialstud
ies
Elem
entary
Third
grade
.
.
.
.
.
.
A
Science
Elem
entary
Third
grade
.
.
.
.
.
.
C
Specialed
Elem
entary
Fourth
andthird
grade/AttentionDeficitH
yperactivity
Disorder(AD
HD)
.
.
.
A
Lang
uage
Arts
Middle
Eigh
thgrade
.
.
.
.
.
.
(Continuedon
nextpage)
Dow
nloa
ded
by [
Uni
vers
ity o
f C
entr
al F
lori
da]
at 1
7:30
28
Nov
embe
r 20
17
168 D. KIM AND S. DOWNEY
App
endix
Summaryof
IDPRe
ports(Con
tinued)
Case
Pages
Title
ofIDP
Scho
olStud
ent
No.ofstud
ents
Cohen’sd
Leng
thPre
Post
Diff.
pt
A
Lang
uage
arts
Middle
Eigh
thgrade
.
.
.
.
.
.
B
Lang
uage
arts
Middle
Seventhgrade
.
.
.
.
.
.
B
Lang
uage
arts
Middle
Eigh
thgrade
.
.
.
.
.
.
C
Lang
uage
arts
Middle
Seventhgrade
.
.
.
.
.
D
Lang
uage
arts
Middle
Sixthgrade
.
.
.
.
.
.
B
Socialstud
ies
Middle
Seventhgrade
.
.
.
.
.
.
D
Socialstud
ies
Middle
Fifthgrade
.
.
.
.
.
.
B
Science
Middle
Eigh
thgrade/EnglishLang
uage
Learning
(ELL)
.
.
.
.
.
.
C
Science
Middle
Sixthgrade
.
.
.
.
.
.
.
D
Science
Middle
Fifthgrade
.
.
.
.
.
.
A
Math
Middle
Eigh
thgrade
.
.
.
.
.
.
Case
Pages
Title
ofIDP
Scho
olStud
ent
No.stud
ents
Cohen’sd
Leng
thPre
Post
Diff.
pt
C
Specialed
Middle
Seventh–
eigh
thgrade/intellectually
disabled
.
.
.
.
.
.
D
Library
Middle
Sixthgrade
.
.
.
.
.
.
D
Library
Middle
Seventh–
eigh
thgrade
.
.
.
.
.
.
C
Lang
uage
arts
High
Ninth
grade
.
.
.
.
.
.
.
B
Lang
uage
arts
High
th
grade
.
.
.
.
.
.
.
D
Lang
uage
arts
High
th
grade
.
.
.
.
.
.
D
Lang
uage
arts
High
th
grade
.
.
.
.
.
.
D
Lang
uage
arts
High
Ninth
grade/EnglishandLang
uage
Arts(ELA)
.
.
.
.
.
.
B
Characteredu
catio
nHigh
th—
th
grade
.
.
.
.
.
.
D
Techno
logy
High
th–thgrade
.
.
.
.
.
.
Dow
nloa
ded
by [
Uni
vers
ity o
f C
entr
al F
lori
da]
at 1
7:30
28
Nov
embe
r 20
17