Examining Student Anxiety and Service Perception in Today's ...
16
Volume 30, number 1 Page 1 Do They Think We’re the Frenemy?: Examining Student Anxiety and Service Perception in Today’s Academic Libraries Doris J. Van Kampen-Breit Rachel Cooke Introduction The Internet and portable technologies such as smartphones and tablets have dramatically affected the way most patrons interact with library personnel and resources. Digital natives roam library websites, yet do not appear to be fluent in the language of search interfaces, 1 nor are they necessarily competent with more advanced searching options. 2 Foot traffic has increased at some institutions, especially those with redesigned or new student- oriented spaces, while other institutions report a slight decline in the number of in-person visits. 3 The shift from an information-centric collection to a more nuanced user-centric resource has possibly increased library use in the short term by millennials, but it may not have addressed the underlying information literacy needs of those same users. “While it has become popular in recent years to emphasize the library as place, an academic library is better viewed as a complex sociotechnical system that serves multiple stakeholders.” 4 The library building may at times be less frequented, yet library websites are flooded with virtual visitors; there were 722 million virtual visits to library websites in 2010, yet only 36 percent of millennials surveyed in 2012 indicated they had used a library website in the past year. 5,6 There is a troubling undercurrent affecting perhaps the very heart and survival of the physical library today. Decreasing in-person reference transactions, in-person visits, and print circulation statistics are symptomatic of the times in which people live and work. These trends, coupled with the sophistication of the information search and retrieval process, have produced at least some frustration and anxiety in college students today. Library service models have responded by offering what are believed to be convenient services: reference by chat, email, or phone, and self-directed learning modules. Not surprisingly, in- person reference requests have shown a decline in many libraries, and although most libraries still offer in-person reference desk assistance and classroom instruction sessions, it is uncertain if this model will be sustained as the movement toward digitizing collections, and online classes become more popular. How well do current service models assist students who may be struggling with some of the frustrations of library research? To investigate this, two faculty librarians, one from Saint Leo University and one from Florida Gulf Coast University, surveyed 211 undergraduates in 2013 using the Undergraduate Multidimensional Library Anxiety Scale (UMLAS) to determine how they felt about the Information Search Process (ISP), their research skills, and their attitude toward the staff and library facilities. The authors wanted to know how undergraduates felt about themselves within the context of their academic lives and the library. To explore this, it is critical
-
Upload
khangminh22 -
Category
Documents
-
view
0 -
download
0
Transcript of Examining Student Anxiety and Service Perception in Today's ...

V o l u m e 3 0 , n u m b e r 1
Page 1
Do They Think We’re the Frenemy?: Examining Student Anxiety and Service Perception in Today’s Academic Libraries
Doris J. Van Kampen-Breit Rachel Cooke
Introduction
The Internet and portable technologies such as smartphones and tablets have
dramatically affected the way most patrons interact with library personnel and resources. Digital
natives roam library websites, yet do not appear to be fluent in the language of search
interfaces,1 nor are they necessarily competent with more advanced searching options.2 Foot
traffic has increased at some institutions, especially those with redesigned or new student-
oriented spaces, while other institutions report a slight decline in the number of in-person visits.3
The shift from an information-centric collection to a more nuanced user-centric resource has
possibly increased library use in the short term by millennials, but it may not have addressed the
underlying information literacy needs of those same users. “While it has become popular in
recent years to emphasize the library as place, an academic library is better viewed as a
complex sociotechnical system that serves multiple stakeholders.”4 The library building may at
times be less frequented, yet library websites are flooded with virtual visitors; there were 722
million virtual visits to library websites in 2010, yet only 36 percent of millennials surveyed in
2012 indicated they had used a library website in the past year.5,6 There is a troubling
undercurrent affecting perhaps the very heart and survival of the physical library today.
Decreasing in-person reference transactions, in-person visits, and print circulation statistics are
symptomatic of the times in which people live and work.
These trends, coupled with the sophistication of the information search and retrieval
process, have produced at least some frustration and anxiety in college students today. Library service models have responded by offering what are believed to be convenient services: reference by chat, email, or phone, and self-directed learning modules. Not surprisingly, in-person reference requests have shown a decline in many libraries, and although most libraries still offer in-person reference desk assistance and classroom instruction sessions, it is uncertain if this model will be sustained as the movement toward digitizing collections, and online classes become more popular.
How well do current service models assist students who may be struggling with some of the frustrations of library research? To investigate this, two faculty librarians, one from Saint Leo University and one from Florida Gulf Coast University, surveyed 211 undergraduates in 2013 using the Undergraduate Multidimensional Library Anxiety Scale (UMLAS) to determine how they felt about the Information Search Process (ISP), their research skills, and their attitude toward the staff and library facilities. The authors wanted to know how undergraduates felt about themselves within the context of their academic lives and the library. To explore this, it is critical

V o l u m e 3 0 , n u m b e r 1
Page 2
to understand student attitudes about the library and their perception of their information search skills. In other words, did the average user or non-user of an academic library value the social capital and community building potential provided by the academic library? Additionally, did they value the services and resources housed in the library building, long considered to be “an open learning environment and a safe, non-discriminatory, free and accessible place?”7 The research questions included: Did the staff seem to be friendly and helpful, or unapproachable and best avoided by remaining online? Did the students feel comfortable asking for help? Did the user indicate they were comfortable in an online academic website, and did they perceive their online research skills were adequate? Did the students believe they could locate things they needed? Literature Review: Students and the Digital Revolution
To place this study in context of today’s students and the challenges they face, the following literature review indicates that the digitization of information may actually have negatively impacted the way that students find, read, and interpret information; additionally, some studies related to student anxiety indicate the need for a re-examination of the library service model with the ultimate goal being that of transformation to better meet the needs of students.
Demographics, full-text dependency, and a perception by librarians and teaching faculty that there is a user preference for online and electronic resources over print resources have significantly decreased library spending on print resources. The shift from print to digital library materials has been going on for more than a decade; in 2011, almost two-thirds of academic libraries were reported as “continuing to accelerate their shift from print to electronic resources”8 More recently, online-only libraries are beginning to appear. Libraries are early adopters, and will evolve with the perceived changing needs of users and with the technology trends. Forecasting change is difficult; however, money once spent cannot be unspent, and budgets and resource allocations are often static or declining.
Google’s search interface may have supplanted the library’s resources in many people’s Internet bookmarks and affections, but it is a shallow relationship for many users. Libraries have responded to this trend by offering one-box searching, and increased access to full-text, focusing more of their budgets on e-books and other e-resources. Libraries have also included federated searching of resources and enhancements like auto correct spelling and suggestions based on searching history. However, these next generation Integrated Library Systems (ILS) cannot at this time compete with the algorithms of Google and may oftentimes be defeated by the inability of the user to select appropriate search strategies and more sophisticated vocabulary based on their field of study. Search results may also overwhelm the user with the quantity of information retrieved. A librarian can act as a mediator and assist with search strategies and targeted vocabulary, but this cannot occur if the user does not initiate contact. Much of the research on information literacy indicates a need for more and better instruction, as “college students are clearly floundering in information overload, and helping them develop research fluency remains one of the most important roles for academic librarians.”9
These trends are likely to accelerate as more and younger students in the K-12 arena are introduced to e-textbooks and other e-resources. The push for providing online and electronic access by the publishing industry is based partly on potential cost saving and a perceived demand by the consumer; time spent online has increased each year since 1996.10 Despite the rush to online and electronic access to academic resources, reading

V o l u m e 3 0 , n u m b e r 1
Page 3
comprehension scores are almost flat for students aged seventeen since 1971, and only 19 percent of students age seventeen reported reading everyday compared to 31 percent in 1984. This may indicate some potential pitfalls ahead; students can access resources electronically but may actually need more assistance navigating to the resources, using the correct key terms to locate resources needed, and analyzing the materials provided because there may be no faculty member to provide reading guidance or to act as an information mediator.11
Another significant statistic library directors and librarians should be aware of involves the reading of newspapers; most are probably aware that print readership has declined significantly since 1996, when almost 60 percent of Americans age eighteen and above reported reading a daily newspaper, compared to 38 percent in 2012. Print readership has been shattered by the Internet; the collapse of newspaper readership and the traditional print business model have put many newspapers out of business.12 In 2012, 46 percent of Americans age eighteen and above reported obtaining news online, and 30 percent of Facebook users who indicated they visited that site for more than an hour a day obtain news on Facebook, while 8 percent of survey respondents reported they obtain news from Twitter.13
The Internet has disrupted more than just the time-tested business model of newspapers. It has also changed the Information Search Process (ISP) and the user experience within the library, as well as in the larger academic community. It has changed the way librarians interact with their patrons and perhaps has even changed user attitudes toward libraries. Certainly, library professionals strive to learn more about the patrons they serve. They know what types of items patrons check out; they know how many searches patrons complete using our online resources. They know the busiest times for the library online and in-person, based on foot traffic and Internet traffic data. But, do they know whether patrons feel academically competent to locate articles, books, and e-books needed to complete an assignment or project?
Academic libraries are usually examined by the number of volumes in their collections, the number of resources they can provide to their students online, and the facilities in which they are housed. Some libraries also evaluate their facilities and programs on other data as well, such as LibQUAL+. A short discussion on the difference between LibQUAL+ data and the Undergraduate Library Multidimensional Anxiety Scale (UMLAS) as a tool in our current study is worth a brief mention here. LibQUAL+ data can be useful in identifying how well library services, collections, and facilities meet patron expectations. For example, if patron expectations for a certain service are low and the satisfaction rate is particularly high, a library may be able to stay at “status quo” or even scale back that particular service because it is not perceived as important to patrons. On the other hand, patrons may have high expectations for a particular service and report low satisfaction rates. In this case, libraries can focus improvement efforts toward that particular problem area. For example, the 2012 LibQUAL+ data at Florida Gulf Coast University from 1,460 patrons indicated the FCCU Library was exceeding expectations for providing individual attention to graduate students and faculty, but did not meet expectations for quiet study space for undergraduates and printed materials for faculty. Additionally, the graduate students felt that three additional areas were not meeting expectations: “making information easily accessible for independent use; print and/or electronic collections; and the library as a getaway for study, learning, or research.”14 Other than these concerns, patrons at Florida Gulf Coast University indicated they were generally satisfied with the nineteen core services examined in the survey. LibQUAL+ data is extremely useful, and for Florida Gulf Coast University, a crucial component of the library’s assessment and planning.15

V o l u m e 3 0 , n u m b e r 1
Page 4
The UMLAS gives researchers a deeper and broader view of the student research experience and attitude toward resources, services, staff, and facilities. It can factor in student year, gender, distance from campus, experience, technology ownership, anxiety concerning the research process, and student skill set. As seen in from the results, student perception of services differed depending on these different factors. This article does not discuss all research results, but instead focuses on certain factors of the research study. A Brief Review of Library Anxiety The ease of access to library resources has significantly increased the convenience of information searching, but has not reduced the need to ask for assistance. Access to full-text resources and online services has increased, but not the need for an information literate user. “Most students have little training or understanding of how to conduct an effective search, and they may choose to use certain articles based on their ability to access the information rather than on other criteria.”16 The quantity of information available may also lead to information overload, causing “hesitation, confusion, and uncertainty in the early stages of information seeking.”17 Feelings of being “lost” in the library and unwillingness to ask for assistance from staff appear to be a common thread among library users;18,19 this may actually compound the problem, driving the most anxious of students to avoid the library altogether, thereby fostering a preference for online search engines. While a student may recognize their need for information in order to write a research paper or complete a presentation on a certain topic, he or she may not be able to articulate this need, or generate targeted terminology, causing him or her to feel anxious and uncertain. According to Onwuegbuzie & Jiao, an estimated 95 percent of college students have engaged in frequent academic procrastination due to library anxiety;20 additionally, “Procrastinators who perceive a task as difficult and requiring effort to achieve a successful outcome are more likely to avoid or to postpone beginning a task.”21 Even after decades of research and discussion concerning library anxiety and other factors that affect academic success, there continues to be a need to research and address strategies to support and assist students with the information search process. Methodology
This study was conducted at Saint Leo University (SLU) and Florida Gulf Coast University (FGCU) during the 2012-2013 academic year. The researchers surveyed a total of 211 undergraduates in the fall of 2012 and the spring of 2013 using the Undergraduate Multi-dimensional Library Anxiety Scale (UMLAS), developed and validated by Van Kampen in 2005. The scale was based on earlier research completed by Van Kampen22 and Bostick.23 The 2005 undergraduate version was updated and piloted in early 2012, and included new demographic questions that were added to address changes in technology ownership. There were also additional demographic questions added for the purposes of this study to reflect changes in technology. The survey measured seven components of students’ confidence and comfort levels: perceived barriers with staff; affective barriers; comfort with the library; knowledge of the library; barriers to using technology; the library building/environment; and library personnel. The questions were posed via an online Checkbox questionnaire, and results were exported to an SPSS file. Descriptive statistics were calculated using SPSS frequency analysis. Because of the amount of data contained in the UMLAS, the initial concentration for the analysis was on two of the seven factors, rather than all seven. This article focuses on perceived comfort with library personnel and comfort with technology.

V o l u m e 3 0 , n u m b e r 1
Page 5
There were 211 students surveyed from both institutions; 78 were from Saint Leo University, 131 were from Florida Gulf Coast University, and 2 students did not identify with either institution. The sampling was non-randomized, convenience sampling of students in courses to which the researchers had access. Most of the students surveyed at Saint Leo University were taking introductory computer classes. All of the Florida Gulf Coast University students were taking various humanities or history courses. As seen in Table 1, more than half of the students from both universities identified themselves as “First Time in College,” and all undergraduate class years (freshman through senior year) were represented in the sample. It must be noted that there was a high level (45 percent) of ethnic diversity among the Saint Leo University students due to a higher than average number of foreign exchange students enrolled that year, and there were more students residing full-time on-campus at Saint Leo University than at Florida Gulf Coast University, which accurately reflects the types of students served by each institution. Additionally, there were more first and second-year students in the Saint Leo University sample than in the Florida Gulf Coast University sample, which can be accounted for by the types of classes surveyed in the respective samples. No night classes or online classes were surveyed. All of the respondents completed the informed consent and survey during an on-campus class meeting for which the instructor of record was also present.
Table 1. Student Sample Characteristics
Characteristic Saint Leo University Florida Gulf Coast University
Diversity (non-Caucasian students)
45%* 28%
First time in college 53% 68%
First and second-year students
70% 56%
On-campus students 62% 35%
Off-campus (within 30 min) 14% 44%
Off-campus (over 30 min) 22% 21%
*Most students surveyed at Saint Leo University were taking COM140, a required class to
graduate; for 2012-2013, Saint Leo University had a larger than average number of foreign
exchange students, which may have skewed this number. Two students did not answer this
question.
Limitations
The study was limited to two institutions located in Florida, and to students in on-campus classes at each institution, which may not be representative of all institutions. Sampling was non-randomized, using convenience sampling, based on requests for library instruction by teaching faculty. Based on this research and other research results using the UMLAS, the

V o l u m e 3 0 , n u m b e r 1
Page 6
researchers believe the results are likely to be generalizable to the larger student populations at these and other institutions. Demographics indicate good representation for all undergraduate levels and other factors. Convenience sampling may influence results, as it would not capture data from faculty who do not utilize library instruction services, and whose students may have already been exposed to other library instruction sessions, which might also influence respondents’ levels of confidence with library resources.
There are missing responses to some questions, which resulted in the removal of several cases in this study. A few students did not answer a particular question in the survey, and responses were not forced. Two students did not affiliate with either institution, resulting in their responses being removed from location-specific data sets (i.e. Saint Leo University or Florida Gulf Coast University). The impact was not significant, with four missing responses out of 211 of students surveyed, which was reflected in the results as a variation in the number of responses. Results
The data displayed in the following tables often represents the number of students who selected that particular response to the question not the total number of students surveyed. For ease of interpretation, missing cases were only noted when relevant, particularly in the more complex tables in which subsets of data were analyzed. Among the findings to be discussed below, some of the discoveries included: more than 30 percent of the students surveyed indicated they were not finding the items they needed in the library; and about 40 percent felt the library staff were too busy to help them. In addition, men reported significantly higher satisfaction (about 10 percent higher in nearly every category).
It seems pertinent to begin with the reason students visit the library in the first place. Table 2 shows most students indicated they come to the library to study (51-62 percent) or work on an assignment (45-65 percent). While this is not surprising, it was somewhat disappointing that only 5 percent of students surveyed indicated they were visiting to the library specifically to get help. Students who may actually ask for assistance after they come to the library may be higher than what was reported. As an analogy, it is rare to go to a hardware store for the sole purpose of obtaining assistance, and yet customers may seek assistance once there. An interesting follow-up may be to ask students who request assistance at the circulation or reference desk whether they came to the library for that specific purpose and then compare responses with the survey.
Table 2. Reason for Library Visits This question allowed for multiple responses.
Reason for visit Saint Leo University Florida Gulf Coast University
Get help 5% 5%
Socialize 5% 5%
Study 51% 62%
Work on Assignment 65% 45%
Do students indicate a preference for using the library in-person or online? Florida Gulf
Coast University and Saint Leo University’s growing collections of online journals and e-books,

V o l u m e 3 0 , n u m b e r 1
Page 7
along with other trends in libraries across the United States might suggest that there would be a reduction in foot traffic, as students may prefer to use the library online. However, as indicated in the results in Table 3, there continues to be a slim majority (58-59 percent) of students who say they still prefer (agreed or strongly agreed) to use the library in-person. The two survey prompts were listed as different items in the survey. It is interesting to note that some students indicated both an online and in-person preference, perhaps suggesting that they enjoyed the flexibility of both. Additionally, the opportunity for socializing when coming to the library in-person to study with others could be inferred in the results found in Table 2 and Table 3. This result may or may not be more noticeable if a longitudinal study were undertaken to track and compare use of the library in-person by freshmen, sophomores, juniors, and seniors over time. A connection can possibly be made between student retention and use of the library in-person. There is some research in the professional literature indicating undergraduate students who use the library have a higher grade point average (GPA) and better retention rates than non-users.24 Results such as these highlight the value-added benefits of early library instruction and outreach to students.
Table 3. In-person Versus Online Use of the Library Percentage indicates the number of students who agreed or strongly agreed.
Question Saint Leo University Florida Gulf Coast University
Rather use the library online
32% 36%
Rather use the library in-person
58% 59%
*Two students did not answer the question about school affiliation and are not counted in this table, but their answers may appear in other tables.
The next set of data reviewed took into consideration how students felt about library employees. Considering the fact that many students would rather use the library in-person, how friendly did they perceive library personnel to be, and were they willing to ask for help? The majority of students indicated that they felt library employees were friendly and they were willing to ask for help, but overall, the numbers appear lower than what a strong service model should indicate (Table 4).
For many libraries, the circulation desk is the front line resource for student interactions, and there could be some patron dissatisfaction with employees due to overdue fines and replacement fees. But the perceived friendliness of the circulation staff was still higher than the helpfulness rating of the reference staff. The highest rating (74 – 81 percent) went to the more generic label of “library staff,” which would include all library employees, rather than specific departments.
V o l u m e 3 0 , n u m b e r 1
Page 8
Table 4. Student Perception of Service Percentage indicates the number of students who agreed or strongly agreed.
Question Saint Leo University Florida Gulf Coast University
Circulation staff friendly 68% 79%
Library staff helpful 74% 81%
Willing to call for help 59% 58%
Reference staff helpful 67% 73%
Staff are not too busy to help
59% 56%
Willing to ask for ILL help 63% 65%
Not willing to ask for help 16% 15%
There were two issues of concern within these results: 1) Perception that staff were too
busy to help; 2) Students’ reluctance to call for help or utilize interlibrary loan (ILL) assistance. About 40 percent of students at both institutions were not willing to use these services. One explanation for the interlibrary loan reluctance might be students continuing to prefer immediate gratification. However, further research as to their reasons behind not being willing to request assistance would be required to determine the root issue. Previous studies have indicated students feel less confident requesting assistance due to their own perceived weak research skills and to previous interactions with library employees who were described as rude or impatient.25 This certainly may have resulted in students’ reluctance to utilize services that required interacting with library employees.
Online preference and distance from campus were also examined (Table 5). Students’ responses in Table 5 indicated online preference mattered. Students who preferred online interaction (agreed or strongly agreed with preferring to use the library online) also had lower satisfaction with all aspects of customer service. Not surprisingly, students who reported not preferring to use the library online reported higher satisfaction rates with library services and were more willing to ask for help from library employees. Commuter students, who rated services a bit higher that on-campus students, indicated a stronger willingness to call and ask for assistance, while on-campus students appeared to be more willing to ask for assistance in person.

V o l u m e 3 0 , n u m b e r 1
Page 9
Table 5. Perceptions of the Staff by Online Preference and Distance from Campus Percentage indicates the number of students who agreed or strongly agreed.
Question Online not
preferred
(n=69)
Online
preferred
(n=73)
Resident
Student
(n=95)
Commuter
Student
(n=113)
Circulation staff friendly 81%
(56 of 69)
66%
(48 of 73)
74%
(70 of 95)
76%
(86 of 113)
Library staff helpful 86%
(59 of 69)
71%
(52 of 73)
75%
(71 of 95)
81%
(90 of 111*)
Willing to call for help 63%
(42 of 67*)
53%
(38 of 72*)
55%
(52 of 94*)
62%
(68 of 110*)
Reference staff helpful 77%
(53 of 69)
70%
(51 of 73)
68%
(65 of 95)
73%
(82 of 112*)
Staff not too busy to
help
62%
(43 of 69)
55%
(40 of 73)
58%
(55 of 95)
58%
(65 of 112*)
Willing to ask staff for
ILL help
67%
(46 of 69)
57%
(41 of 72*)
62%
(59 of 95)
66%
(73 of 110*)
Not willing to ask staff
for help
12%
(8 of 69)
18%
(13 of 72*)
13%
(12 of 94*)
17%
(19 of 110*)
*These questions were skipped by some students within the preference or distance
sub-group.
Yet another factor examined was whether there was a preference for using the library in-
person, and if that preference changed the responses of students concerning library employees. The researchers examined the answers from a subgroup of students who answered that they preferred to use the library in-person and reviewed how they perceived library staff. The results in Table 6 further support findings outlined in Table 5. Students who indicated a preference for using the library in-person also reported the highest satisfaction rates with library employees and were more willing to use phone and ILL services. Both the “in-person not preferred” and the “no preference” group reported lower satisfaction rates. These findings appear to indicate a need for stronger outreach to students who have a reluctance to use the library in-person.
V o l u m e 3 0 , n u m b e r 1
Page 10
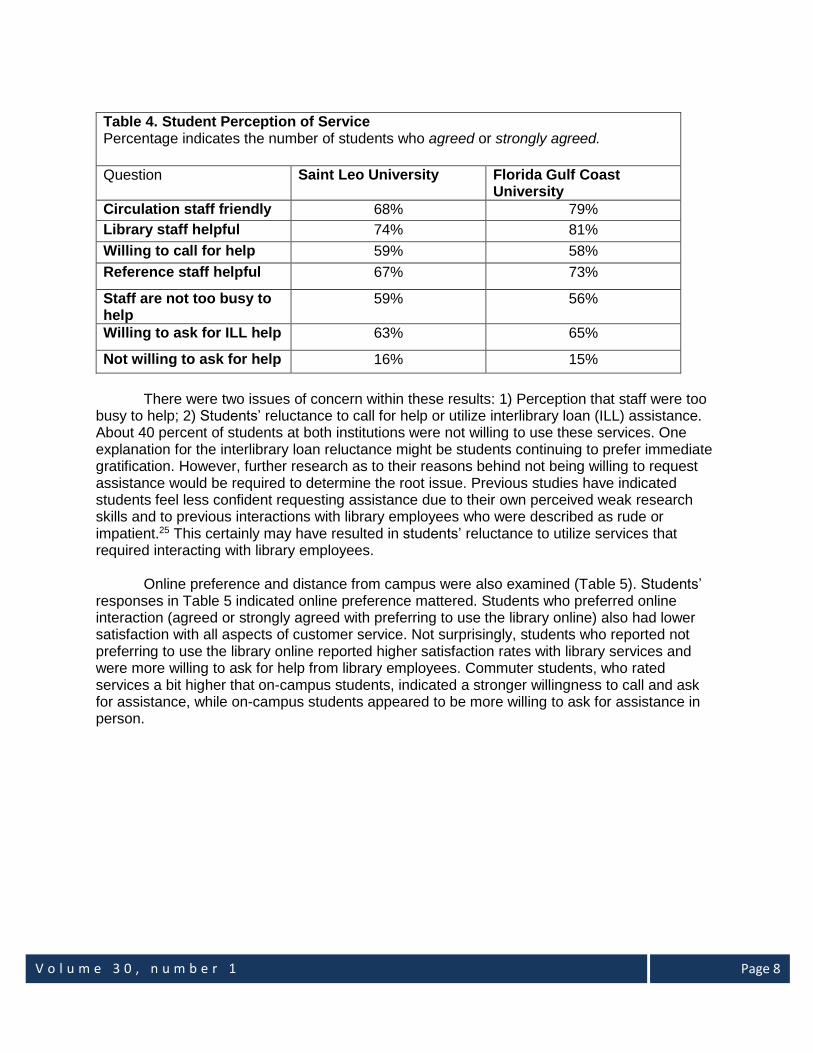
Table 6. Perceptions of Staff by In-Person Preference Percentage indicates the number of students who agreed or strongly agreed.
Question In-person Not Preferred (n=32)
In-person Preferred (n=53)
No preference (n=54)
Circulation staff are friendly
59% (19 of 32)
80% (98 of 122)
72% (39 of 54)
Library staff are helpful
72% (23 of 32)
85% (103 of 121*)
66% (35 of 53*)
Willing to call for help
47% (14 of 30*)
71% (85 of 120*)
43% (23 of 54)
Ref staff are helpful
63% (20 of 32)
80% (97 of 122)
56% (30 of 54)
Staff are not too busy to help
41% (13 of 32)
70% (86 of 122)
37% (20 of 54)
Willing to ask staff for ILL help
45% (14 of 31*)
75% (92 of 122)
55% (29 of 53*)
*These questions were skipped by some students.
Although it was not completely unexpected to have a small divergence of opinion
between male and female respondents concerning service perception, it was sufficiently
different to raise concern. Men perceived circulation and library staff to be friendlier and more
helpful than women (Table 7). They were also slightly more willing to ask for help. This evidence
is certainly interesting and correlates with Van Kampen’s (2003) earlier study of doctoral
students. Van Kampen determined that “twenty-one percent of the male respondents stated
they used the library one or more times per week, compared with fourteen percent of women
respondents. Furthermore, 62.3% of male respondents indicated that they were frequent users
(at least once every 2-3 weeks or more), compared with only 41.3% of women respondents.” 26
Additionally, male respondents also had a more positive response concerning the importance of
the library possibly caused by their more frequent use of the facilities.27 These findings are also
supported in table 6, where the students who preferred using the library in person had higher
satisfaction levels.

V o l u m e 3 0 , n u m b e r 1
Page 11
Table 7. Perceptions of the Staff – Gender Percentage indicates the number of students who agreed or strongly agreed.
Question Women Men
Circulation staff are friendly
71% 81%
Library staff are helpful 74% 84%
Willing to call for help 57% 61%
Ref staff are helpful 68% 74%
The staff are never too busy to stop and help me.
56% 60%
I am willing to get help from staff to get materials from another library.
63% 68%
Not willing to ask staff for help
17% 13%
Of all the data reviewed, the fact that more than 40 percent of the students at each
institution viewed library staff as “too busy to help” (see Table 4) and more than 40 percent were also not willing to call for help (Table 4) is troubling. Based on the data, it is clear that students continue to need support and assistance. One can infer from the responses that 30 percent of students surveyed were leaving the library without the resources they need (Table 8). The data also indicated some students continue to struggle with locating materials, as almost 20 percent indicated they found the process of locating materials difficult. Furthermore, many students surveyed reported they did not know how to locate full-text articles or e-books online (Table 8). In today’s information-rich environment, comfort with e-journals and e-books is absolutely critical to be successful in college and beyond.
Table 8. Student Skills
Percentage indicates the number of students who agreed or strongly agreed.
Question Saint Leo Florida Gulf Coast
University
I can usually find things I need
in the library
63%
69%
It is not easy to locate materials I need in the library
17% 19%
I know how to locate full-text articles online from the library
71% 62%

V o l u m e 3 0 , n u m b e r 1
Page 12
Conclusion and Recommendations
Research concerning student attitudes toward the library and the research process consistently demonstrates a need to address the two-fold issue of library and research anxiety. The majority of students surveyed appeared to be satisfied with the level of service received. Some students reported not being able to find the items they needed and perhaps leaving disappointed with the library’s resources. Students continue to need assistance but are reticent in asking for help; most students indicated that they visit the library for scholastic pursuits but very few responded that they were visiting the library specifically to get help from a librarian.
Certainly, there are opportunities for improvement. A satisfaction rating of 56-81 percent on various service points, as noted previously, is concerning. Both institutions scored similarly, suggesting the problem is systemic. Service support metrics continue to be important in the library discipline with most reports emphasizing the positive;28 however, the stereotype of the librarian as unapproachable has not changed and the continued rumblings of dissatisfaction with library service have been sustained in the popular media29,30 while users continue to struggle to locate items.31,32,33 In addition, a second follow-up study is indicated to confirm statistical significance concerning differences in satisfaction rates about library services between male and female respondents.
It is evident from this study that students need our help but do not always ask for it. In the authors’ opinion, the solution is not necessarily (or only) to develop more and better websites, help videos, and support services, although, those would help to some degree. Students can become more confident and capable when confronted with an information need if they are coached and mentored by a friendly librarian. The solution is to foster stronger relationships with library users, including teaching faculty.
We, as information professionals, may need to explore our own attitudes toward our jobs, our own environment, and our individual attitudes toward service, as well as the students’ attitudes. Looking beyond the library, one can reach out to colleagues who teach credit-earning courses to encourage library use and partnerships. To form relationships with students who have negative perceptions of the library, it might be possible to make librarian-student interaction part of the classroom expectation. In a recent study at Utah State University, students attended four librarian-led research instruction sessions, followed by a mandatory reference desk consultation. A follow-up survey of the students revealed that 87 percent would visit the desk again. Initially, 13 percent of the students reported some anxiety approaching the desk for help, but 80 percent of these students “credited librarian’s professional knowledge with making them feel more comfortable.”34
Certainly there is intrinsic value in high-quality instruction and better and stronger search algorithms, but perhaps there is also a need to more closely examine the way instruction and research services are delivered and communicated to our patrons. Although it was not covered in this study, one suspects some of the anxiety students have concerning interaction with library staff may stem from prior negative experiences.35,36 This is an area in need of further
I know how to locate e-books online from the library
63% 56%

V o l u m e 3 0 , n u m b e r 1
Page 13
investigation. Informal interactions and observations with students have suggested that students are very sensitive to interpersonal exchanges and it is possible that even one negative past experience could dissuade them from future interaction.
Lacking research on the impact of negative prior experience, one can still glean some valuable insight on a related topic that has been hotly debated in library literature: approachability. Librarians have been grappling with the subject of approachability since 1876.37 Recent studies by Bonnet and McAlexander (2012) found that students are highly sensitive to context, and they tend to find females and people of their own age more approachable.38 Not surprisingly, they found smiling to be the single most powerful behavior to increase approachability. Wearing a name tag and wearing the color blue also increased approachability. Looking down at a computer screen or book negatively impacted approachability, with the book having a stronger negative effect.39
The behaviors of smiling and eye contact are certainly nothing new, but beyond this, there are other opportunities to enhance customer relations. As all library professionals share the goal of student success, behaviors that could encourage students to ask for assistance include: acknowledging students as they walk by the reference desk; asking students in the stacks if they need help locating an item; asking students who are checking out items if they found everything they needed, and encouraging the user during the search process. One can also strive to remember that every time a student is treated as a less than competent researcher because the library professional tells him/her, “you should already know that,” the interaction creates distance between the librarian and the user. Innovation of the service model occurs through increased awareness of the library environment, which includes the patrons in the stacks, at the reference desk, in the computer lab, and throughout the building. For many students, the library is an unfamiliar neighborhood and they don’t necessarily have a good, user-friendly map. Students do not use the library resources or the building every day. Many of them do not use the resources more than a few times per year, even online. The library neighborhood may need that “local touch” and librarians can become that friendly neighbor who stops to say hi to the casual visitor and offer assistance with the map. The authors are excited to form those relationships, break down some barriers, and make a better map. A first step would be to know the patrons better, and let them get to know the authors.
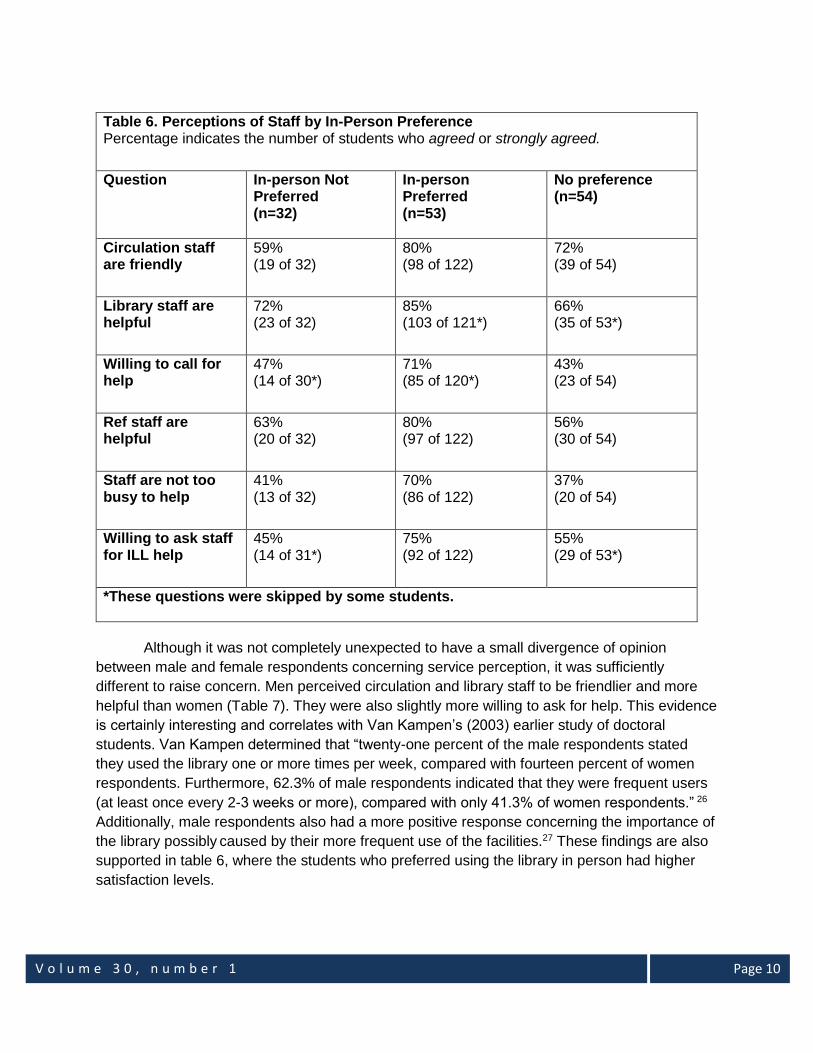
Based on the results, the authors have generated some recommendations that might improve students’ perceptions of librarian friendliness and willingness to serve them, and their ability to find electronic resources such as e-books and e-journals.
Table 9. Recommendations for improvement
Concern(s) Actions
Library staff are “too busy to help”
Remove clutter and barriers around the reference desk
Training on interpersonal skills of all public services desks
Promote relationship building
Improve desk signage
Smile and greet patrons as they enter
Work with teaching faculty to require students to document at least one reference interaction
V o l u m e 3 0 , n u m b e r 1
Page 14
It is not believed by the authors of this study that in-person reference support or classroom instruction should be eliminated; instead, the data indicates it may be time for a re-examination and discussion of the reference model. One should explore opportunities to engage and support students face-to-face and online in a manner they find to be helpful, convenient, and non-threatening. It is time to open a dialogue on how to make every interaction with students a personal and positive one, whether it be in the library, the classroom, or the student union.
Published: November 2015
Notes 1 Cory Lown, Tito Sierra, and Josh Boyer, "How Users Search the Library from a Single Search Box," College and Research Libraries 74, no. 3 (2013): 227-41. 2 Kathleen Bauer and Alice Peterson-Hart, “Does Faceted Display in a Library Catalog Increase Use of Subject Headings?" Library Hi Tech 30, no. 2 (2012): 347-358. 3 Lisa Peet, "Pew Report Finds Millennials Are Readers, Library Users," Library Journal.com, last modified September 16, 2014, http://lj.libraryjournal.com/2014/09/youth-services/pew-report-finds-millennials-are-readers-library-users. 4 Andrew Dillon, "Accelerating Learning and Discovery: Refining the Role of Academic Librarians," Council on Library and Information Resources, Accessed October 3, 2014, http://www.clir.org/pubs/reports/pub142/dillon.html. 5 Peet.
Aggressively market classroom information literacy sessions
Not willing to call for help
Market phone service prominently on website
Follow-up phone calls to email requests
Train personnel to be aware of their interpersonal interactions
Locating full-text articles Locating e-books
User studies of library website
Improve/market LibGuides
Focus on instruction and outreach to first-year students
Pilot roaming reference
Not being able to locate items Leaving library without the item came for
Be friendly and approachable.
Train employees to approach patrons to offer assistance
Train circulation staff to ask if the patron found everything and to offer to locate item immediately
Provide a runner at circulation for locating items
Doris J. Van Kampen-Breit ([email protected]) is the Faculty Development
Librarian at Saint Leo University. Rachel Cooke ([email protected]) is Education and Arts
Librarian at Florida Gulf Coast University.
V o l u m e 3 0 , n u m b e r 1
Page 15
6 “The State of America’s Libraries: A Report from the American Library Association,” American Library Association (2011): 5, Accessed September 1, 2014. ww.ala.org/news/sites/ala.org.news/files/content/mediapresscenter/americaslibraries/state_of_americas_libraries_report_2011.pdf. 7 Debra Rosenfeldt, “Libraries Building Communities Paper,” County Public Libraries Association of NSW Conference (2004): 6, quoted in Megan J. Oakleaf, “The Value of Academic Libraries: A Comprehensive Research Review and Report,” Association of College and Research Libraries, American Library Association (2010): 82. 8 “Press Release on The state of America’s Libraries: A Report from the American Library Association: Economic Challenges: The New Normal,” American Library Association (2011), Accessed September 1, 2014, http://www.ala.org/news/mediapresscenter/americaslibraries/academic. 9 “The State of America’s Libraries: A Report from the American Library Association.” 10 "The Web at 25 in the U.S." Pew Research Center (2014), Accessed July 06, 2014. http://pewrsr.ch/1mIfhDy. 11“Trends in Academic Progress: Reading 1971-2012, Mathematics 1973-2012,” Nation’s Report Card, National Center for Educational Statistics, Institutes of Educational Sciences, (2013, NCES 2013-456):1-3, Accessed October 01, 2014, http://nces.ed.gov/nationsreportcard/subject/publications/main2012/pdf/2013456.pdf. 12 “Section 1: Watching, Reading, and Listening to the News,” Pew Research Center (2010) Accessed October 01, 2014, http://www.people-press.org/2010/09/12/section-1-watching-reading-and-listening-to-the-news/. 13 “The Facebook News Experience,” Pew Research Center (2013) Accessed October 1, 2014, http://www.journalism.org/2013/10/24/the-facebook-news-experience-infographic/. 14 Florida Gulf Coast University Library LibQUAL+ 2012 Survey Report. Accessed August 1, 2014. http://lgdata.s3-website-us-east-1.amazonaws.com/docs/209/684751/LibQUAL_Report_2012_revised.pdf , 2. 15 Sharon L. Bostick, "The Development and Validation of the Library Anxiety Scale," Research in Reference Effectiveness, 16 (1993). 16 Doris J. Van Kampen, Library Anxiety, the Information Search Process, and Doctoral Students Use of the Library. PhD diss., University of Central Florida, 2003. 17 Carol Collier Kuhlthau, "Accommodating the User's Information Search Process: Challenges for Information Retrieval System Designers." Bulletin of the American Society for Information Science and Technology 25, no. 3 (1999): 12-16. doi:10.1002/bult.115. 18 Constance Mellon, “Library Anxiety: A Grounded Theory and Its Development.” College and Research Libraries (1986): 160-165. 19 Bostick, 16. 20 Qun G. Jiao, Denise A. DaRos-Voseles, Kathleen M. T. Collins, and Anthony J. Onwuegbuzie, “Academic procrastination and the performance of graduate-level cooperative groups in research methods courses.” Journal of the Scholarship of Teaching and Learning, 11, no 1 (2011): 119-138. 21 M. Engin Denız, Zeliha Traş,and Didem Aydogan, “An Investigation of Academic Procrastination, Locus of Control, and Emotional Intelligence,” Educational Sciences: Theory & Practice, 9 (2009) :623-631, quoted in. Jiao, et al., 119-138. 22 Van Kampen. 23 Bostick, 16. 24 Soria, Krista M., Jan Fransen, and Shane Nackerud. "Library Use and Undergraduate Student Outcomes: New Evidence for Students’ Retention and Academic Success," Portal: Libraries and the Academy 13, no. 2 (2013): 147-164,

V o l u m e 3 0 , n u m b e r 1
Page 16
http://ezproxy.fgcu.edu/login?url=http://search.proquest.com/docview/1398194115?accountid=10919. 25 Van Kampen. 26 Ibid. 27 Ibid. 28 Michael C Alewine, 2012. "Listen to What They Have to Say! Assessing Distance Learners’ Satisfaction with Library Services Using a Transactional Survey." Journal of Library & Information Services in Distance Learning 6, no. 3/4: 136-146. 29 Merlin Flower, “Ever Met the Stern Librarian?” The Express Tribune with the International New York Times (September 2, 2011), Accessed October 1, 2014 http://tribune.com.pk/story/242714/ever-met-the-stern-librarian/ 30 Ramirose Ilene Attebury Library, "Perceptions of a Profession: Librarians and Stereotypes in Online Videos." Library Philosophy & Practice (2010) 1-22. 31 Michelle Dalton, "The Form of Search Tool Chosen by Undergraduate Students Influences Research Practices and the Type and Quality of Information Selected." Evidence Based Library & Information Practice 9, no. 2 (April 2014): 19-21. 32 Hahn, Jim, and Lizz Zitron. 2011. "How First-Year Students Navigate the Stacks: Implications for Improving Wayfinding." Reference & User Services Quarterly 51, no. 1: 28-35. 33 Alison J. Head, “Learning the Ropes: How Freshmen Conduct Course Research Once They Enter College,” Project Information Literacy Report (2013) Accessed October 1, 2014 http://projectinfolit.org/images/pdfs/pil_2013_freshmenstudy_fullreport.pdf. 34 Pamela N. Martin and Lezlie Park, “Reference Desk Consultation Assignment: An Exploratory Study of Students’ Perceptions of Reference Service,” Reference & User Services Quarterly 49, no. 4 (2010): 338. 35 Van Kampen. 36William C. Robinson, “Complaint Handling in the Library,” Occasional Papers University of Illinois Graduate School of Library and Information Science no. 166 (1984): 3-4, accessed October 1, 2014, https://www.ideals.illinois.edu/bitstream/handle/2142/3927/gslisoccasionalpv00000i00166.pdf?sequence=1. 37 Amy L. Guy, “Approachability,” Info Access Encyclopedia (2006): 1, accessed October 1, 2014. http://ucla245.pbworks.com/w/page/8751342/Approachability. 38 Jennifer L. Bonnet and Benjamin L. Mc Alexander, “Structural Diversity in Academic Libraries: A Study of Librarian Approachability,” The Journal of Academic Librarianship 38, no. 5 (2012): 283. 39 Jennifer L. Bonnet and Benjamin L. McAlexander, “How Do You Like Me Now?: An Image-rating Study of Librarian Approachability,” Association of College and Research Libraries 2013 Conference Contributed Papers (2013): 262-269, Accessed October 1, 2014, http://www.ala.org/acrl/sites/ala.org.acrl/files/content/conferences/confsandpreconfs/2013/papers/BonnetMcAlexander_HowDoYouLike.pdf.