Examining a dynamic leadership approach that influences job ...
237
Walden University Walden University ScholarWorks ScholarWorks Walden Dissertations and Doctoral Studies Walden Dissertations and Doctoral Studies Collection 2020 Examining a dynamic leadership approach that influences job Examining a dynamic leadership approach that influences job satisfaction in dynamic and stable environments satisfaction in dynamic and stable environments Francois Kammoe Walden University Follow this and additional works at: https://scholarworks.waldenu.edu/dissertations Part of the Educational Administration and Supervision Commons, and the Labor Economics Commons This Dissertation is brought to you for free and open access by the Walden Dissertations and Doctoral Studies Collection at ScholarWorks. It has been accepted for inclusion in Walden Dissertations and Doctoral Studies by an authorized administrator of ScholarWorks. For more information, please contact [email protected].
-
Upload
khangminh22 -
Category
Documents
-
view
3 -
download
0
Transcript of Examining a dynamic leadership approach that influences job ...
Walden University Walden University
ScholarWorks ScholarWorks
Walden Dissertations and Doctoral Studies Walden Dissertations and Doctoral Studies Collection
2020
Examining a dynamic leadership approach that influences job Examining a dynamic leadership approach that influences job
satisfaction in dynamic and stable environments satisfaction in dynamic and stable environments
Francois Kammoe Walden University
Follow this and additional works at: https://scholarworks.waldenu.edu/dissertations
Part of the Educational Administration and Supervision Commons, and the Labor Economics
Commons
This Dissertation is brought to you for free and open access by the Walden Dissertations and Doctoral Studies Collection at ScholarWorks. It has been accepted for inclusion in Walden Dissertations and Doctoral Studies by an authorized administrator of ScholarWorks. For more information, please contact [email protected].
Walden University
College of Management and Technology
This is to certify that the doctoral dissertation by
Francois Kammoe
has been found to be complete and satisfactory in all respects,
and that any and all revisions required by
the review committee have been made.
Review Committee
Dr. David Cavazos, Committee Chairperson, Management Faculty
Dr. Richard Dool, Committee Member, Management Faculty
Dr. Danielle Wright-Babb, University Reviewer, Management Faculty
Chief Academic Officer and Provost
Sue Subocz, Ph.D.
Walden University
2020

Abstract
Examining a Dynamic Leadership Approach that Influences Job Satisfaction in Dynamic-
Stable Environments
by
Francois Kammoe
MPhil, Walden University, USA, 2019
MSc, University of Yaoundé, Cameroon, 2005
BSc, University of Yaoundé, Cameroon, 2002
Dissertation Submitted in Partial Fulfillment
of the Requirements for the Degree of
Doctor of Philosophy
Management
Walden University
August 2020
Abstract
Effectively managing the turnover of qualified staff has become a major challenge for managers.
In this dynamic business era, companies in various industries experience an annual staff turnover
rate of at least 10%. Scholars have linked employee turnover to job dissatisfaction and inadequate
leadership styles. A quantitative non-experimental correlation study was conducted to examine
the relationship between servant, transactional, and transformational leadership styles and
employee job satisfaction as well as the moderating and mediating mechanisms in which this
relationship occurs. The theoretical framework for this study included Harber and McMaster’s
dynamic leadership approach, the adaptable emphasis leadership model by Staats, and the
comparative model on transformational and servant leadership by Smith, Montagno, and
Kuzmenko. Data were collected using a survey of 712 adult employees working in different
organizations around the world. Pearson correlation analysis, hierarchical multiple regression,
and mediation testing were used to analyze data. Findings indicated that there was a correlation
between transformational/servant leadership and job satisfaction, but that there was no correlation
between transactional leadership and job satisfaction. Results indicated that the relationship
between servant/transformational leadership and job satisfaction was stronger in stable
environments than in turbulent environments, and that follower maturity mediates the relationship
between transformational/servant leadership and job satisfaction regardless of the follower
maturity level. Findings supported the development of a new dynamic leadership approach in
which leadership style can be tailored to follower maturity and the dynamism level of the
organizational environment. Results might serve as a source of policy guidance for organizational
leaders to provide an appropriate leadership response to employee job satisfaction according to
the maturity level of the people they lead and the frequency of organizational pressures they face.
Examining a Dynamic Leadership Approach that Influences Job Satisfaction in Dynamic-
Stable Environments
by
Francois Kammoe
MPhil, Walden University, USA, 2019
MSc, University of Yaoundé, Cameroon, 2005
BSc, University of Yaoundé, Cameroon, 2002
Dissertation Submitted in Partial Fulfillment
of the Requirements for the Degree of
Doctor of Philosophy
Management
Walden University
August 2020
Dedication
This dissertation is dedicated to GOD who works in me to produce the will and
the doing in order to fulfill his good purpose. It is also dedicated to my children, Sarah
Fomo Kammoe, Savio Lucas Ndjatchi Kammoe, and Marc Alexandre Kamdem Kammoe
which I have always wanted to stimulate their intellectuals so that they can positively
impact society through their future work in alignment with the will of GOD. Lastly, this
study is dedicated to my parents and siblings for their love and support.
Acknowledgments
I would like to thank all my instructors at Walden University, in particular Dr.
Cavazos Eduardo David, my dissertation chair, Dr. Dool Rick Richard, my second
committee member, and Dr. Wright-Babb Danielle L. for their active contribution which
allowed me to successfully complete this study.
i
Table of Contents
List of Tables ..................................................................................................................... vi
List of Figures .................................................................................................................... ix
Chapter 1: Introduction to the Study ....................................................................................1
Background of the Study ...............................................................................................2
Problem Statement .........................................................................................................4
Purpose of the Study ......................................................................................................6
Research Questions and Hypotheses .............................................................................7
Theoretical Foundation ..................................................................................................9
Nature of the Study ......................................................................................................10
Definitions....................................................................................................................11
Assumptions .................................................................................................................12
Scope and Delimitations ..............................................................................................13
Limitations ...................................................................................................................14
Significance of the Study .............................................................................................15
Significance to Theory .......................................................................................... 15
Significance to Practice......................................................................................... 16
Significance to Social Change .............................................................................. 16
Summary and Transition ..............................................................................................16
Chapter 2: Literature Review .............................................................................................18
Literature Search Strategy............................................................................................19
Theoretical Foundation ................................................................................................22
ii
Smith et al.’s Comparative Model on Transformational and Servant
Leadership ................................................................................................. 23
Adaptable Emphasis Leadership Model ............................................................... 27
Harber and McMaster’s Dynamic Leadership Approach ..................................... 28
Literature Review Related to Key Variables ...............................................................29
Leadership styles ................................................................................................... 30
Job satisfaction ...................................................................................................... 45
Relationship between leadership styles and employee job satisfaction ................ 48
Relationship between transformational leadership, servant leadership, and
environmental dynamism .......................................................................... 52
Relationship between servant leadership, transactional leadership,
transformational leadership, and follower maturity .................................. 53
Summary and Conclusions ..........................................................................................56
Chapter 3: Research Method ..............................................................................................58
Research Design and Rationale ...................................................................................58
Variables ............................................................................................................... 58
Research Approach ............................................................................................... 59
Research Design.................................................................................................... 61
Methodology ................................................................................................................62
Population ............................................................................................................. 63
Sampling and Sampling Procedures ..................................................................... 64
Procedures for Recruitment, Participation, and Data Collections ........................ 73
iii
Instrumentation and Operationalization of Constructs ......................................... 76
Data Analysis Plan .......................................................................................................84
Statistical tests ....................................................................................................... 87
Statistical assumptions underlying the study ........................................................ 89
Missing data .......................................................................................................... 89
Treats to Validity .........................................................................................................90
External Validity ................................................................................................... 91
Internal Validity .................................................................................................... 91
Ethical Procedures ................................................................................................ 92
Summary ......................................................................................................................93
Chapter 4: Results ..............................................................................................................95
Data Collection ............................................................................................................97
Survey Administration .................................................................................................99
Study Results .............................................................................................................100
Descriptive Statistics ........................................................................................... 101
Assumptions for Statistical Analyses.................................................................. 109
Test Results for Hypothesis 1 ............................................................................. 121
Test Results for Hypothesis 2 ............................................................................. 124
Test Results for Hypothesis 3 ............................................................................. 132
Additional Findings ............................................................................................ 143
Summary ....................................................................................................................145
Chapter 5: Discussion, Conclusions, and Recommendations ..........................................147
iv
Interpretation of Findings ..........................................................................................148
Effects of Transformational, Servant, and Transactional Leadership on Job
Satisfaction .............................................................................................. 148
Moderating Effect of the Dynamism of the Organizational Environment ......... 150
Mediating Effect of Follower Maturity............................................................... 152
Dynamic Leadership Approach .......................................................................... 153
Limitations of the Study.............................................................................................154
Recommendations ......................................................................................................157
Recommendations Based on Findings ................................................................ 157
Theoretical Recommendations............................................................................ 159
Methodological Recommendations .................................................................... 160
Implications................................................................................................................164
Implications Relating to Existing Studies ........................................................... 164
Implications for Empirical Theory...................................................................... 165
Methodological Implications .............................................................................. 166
Implications for Practice ..................................................................................... 166
Positive Social Change Implications .................................................................. 169
Conclusions ................................................................................................................170
References ........................................................................................................................173
Appendix A: Survey Questions .......................................................................................197
Appendix B: Permission to use MLQ 5X Short ..............................................................216
Appendix C: Permission to use JSS .................................................................................217
v
Appendix D: Permission to use Environmental dynamism scale ....................................218
Appendix E: Permission to use SLS ................................................................................219
Appendix F: Recruitment invitation for my referral friends through LinkedIn and
Facebook (WhatsApp) .........................................................................................220
Appendix G: Recruitment post invitation for survey participants contacted by my
referral friends on their Social media channels such as Facebook
(WhatsApp) or LinkedIn ......................................................................................221
vi
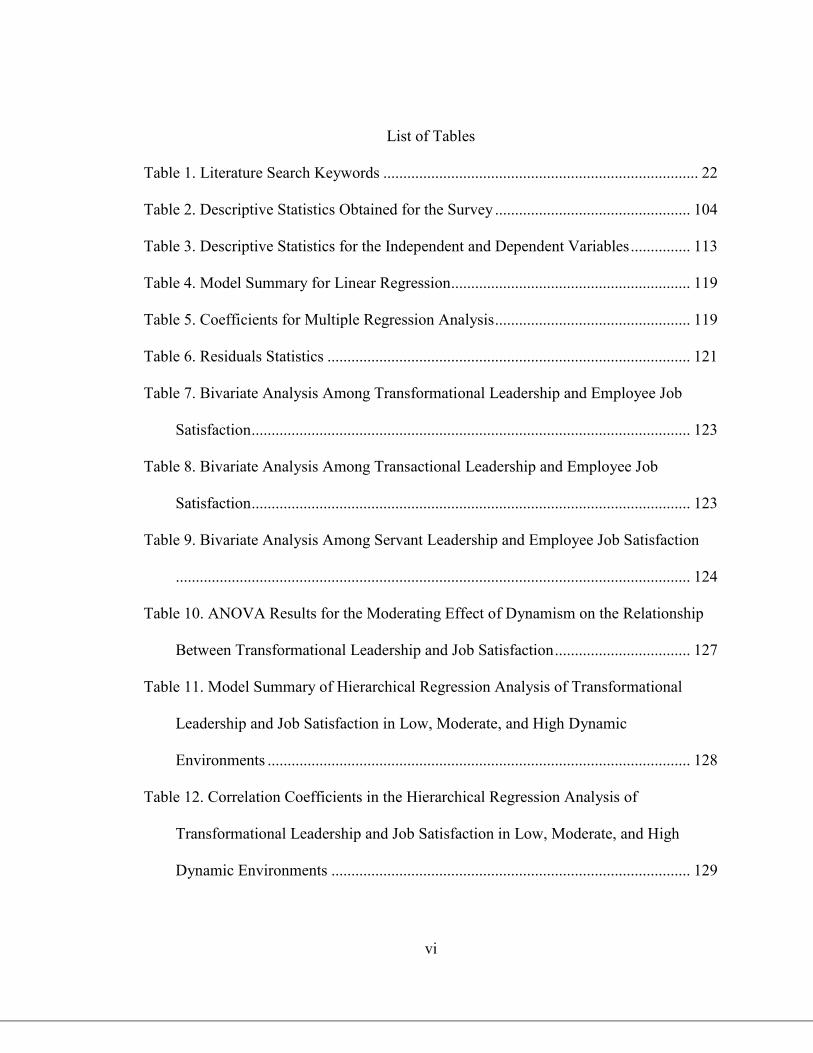
List of Tables
Table 1. Literature Search Keywords ............................................................................... 22
Table 2. Descriptive Statistics Obtained for the Survey ................................................. 104
Table 3. Descriptive Statistics for the Independent and Dependent Variables ............... 113
Table 4. Model Summary for Linear Regression............................................................ 119
Table 5. Coefficients for Multiple Regression Analysis ................................................. 119
Table 6. Residuals Statistics ........................................................................................... 121
Table 7. Bivariate Analysis Among Transformational Leadership and Employee Job
Satisfaction .............................................................................................................. 123
Table 8. Bivariate Analysis Among Transactional Leadership and Employee Job
Satisfaction .............................................................................................................. 123
Table 9. Bivariate Analysis Among Servant Leadership and Employee Job Satisfaction
................................................................................................................................. 124
Table 10. ANOVA Results for the Moderating Effect of Dynamism on the Relationship
Between Transformational Leadership and Job Satisfaction .................................. 127
Table 11. Model Summary of Hierarchical Regression Analysis of Transformational
Leadership and Job Satisfaction in Low, Moderate, and High Dynamic
Environments .......................................................................................................... 128
Table 12. Correlation Coefficients in the Hierarchical Regression Analysis of
Transformational Leadership and Job Satisfaction in Low, Moderate, and High
Dynamic Environments .......................................................................................... 129
vii
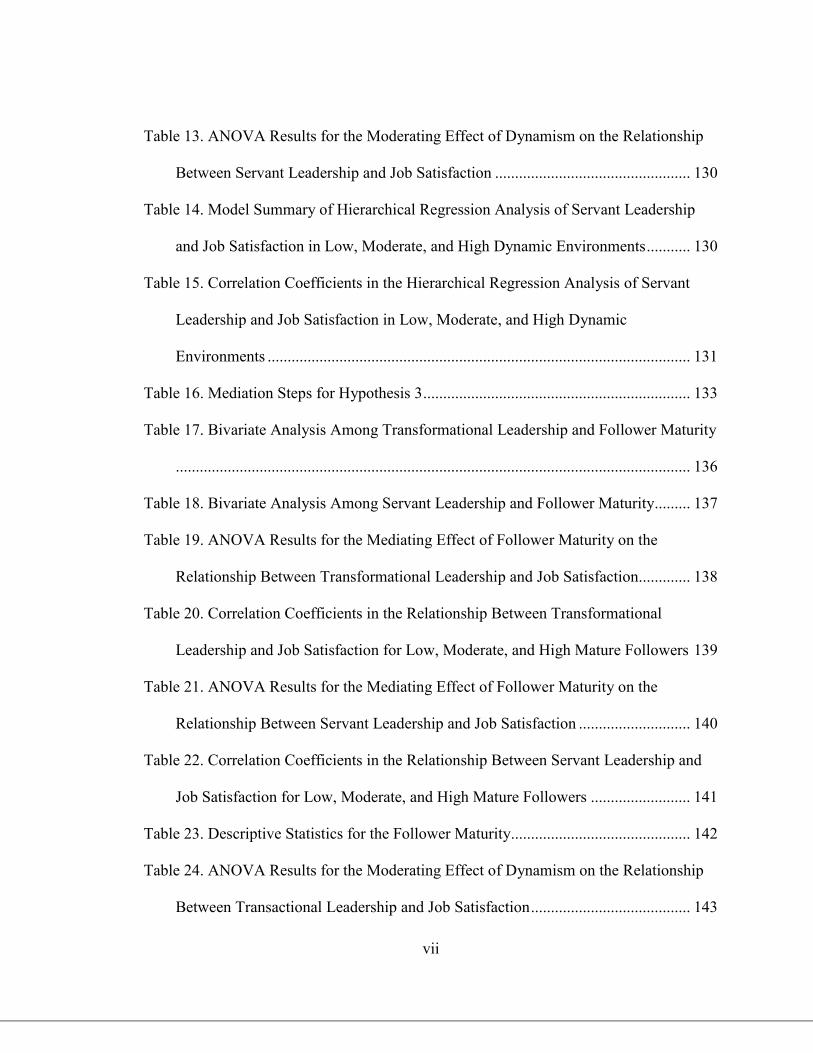
Table 13. ANOVA Results for the Moderating Effect of Dynamism on the Relationship
Between Servant Leadership and Job Satisfaction ................................................. 130
Table 14. Model Summary of Hierarchical Regression Analysis of Servant Leadership
and Job Satisfaction in Low, Moderate, and High Dynamic Environments ........... 130
Table 15. Correlation Coefficients in the Hierarchical Regression Analysis of Servant
Leadership and Job Satisfaction in Low, Moderate, and High Dynamic
Environments .......................................................................................................... 131
Table 16. Mediation Steps for Hypothesis 3 ................................................................... 133
Table 17. Bivariate Analysis Among Transformational Leadership and Follower Maturity
................................................................................................................................. 136
Table 18. Bivariate Analysis Among Servant Leadership and Follower Maturity......... 137
Table 19. ANOVA Results for the Mediating Effect of Follower Maturity on the
Relationship Between Transformational Leadership and Job Satisfaction ............. 138
Table 20. Correlation Coefficients in the Relationship Between Transformational
Leadership and Job Satisfaction for Low, Moderate, and High Mature Followers 139
Table 21. ANOVA Results for the Mediating Effect of Follower Maturity on the
Relationship Between Servant Leadership and Job Satisfaction ............................ 140
Table 22. Correlation Coefficients in the Relationship Between Servant Leadership and
Job Satisfaction for Low, Moderate, and High Mature Followers ......................... 141
Table 23. Descriptive Statistics for the Follower Maturity ............................................. 142
Table 24. ANOVA Results for the Moderating Effect of Dynamism on the Relationship
Between Transactional Leadership and Job Satisfaction ........................................ 143
viii
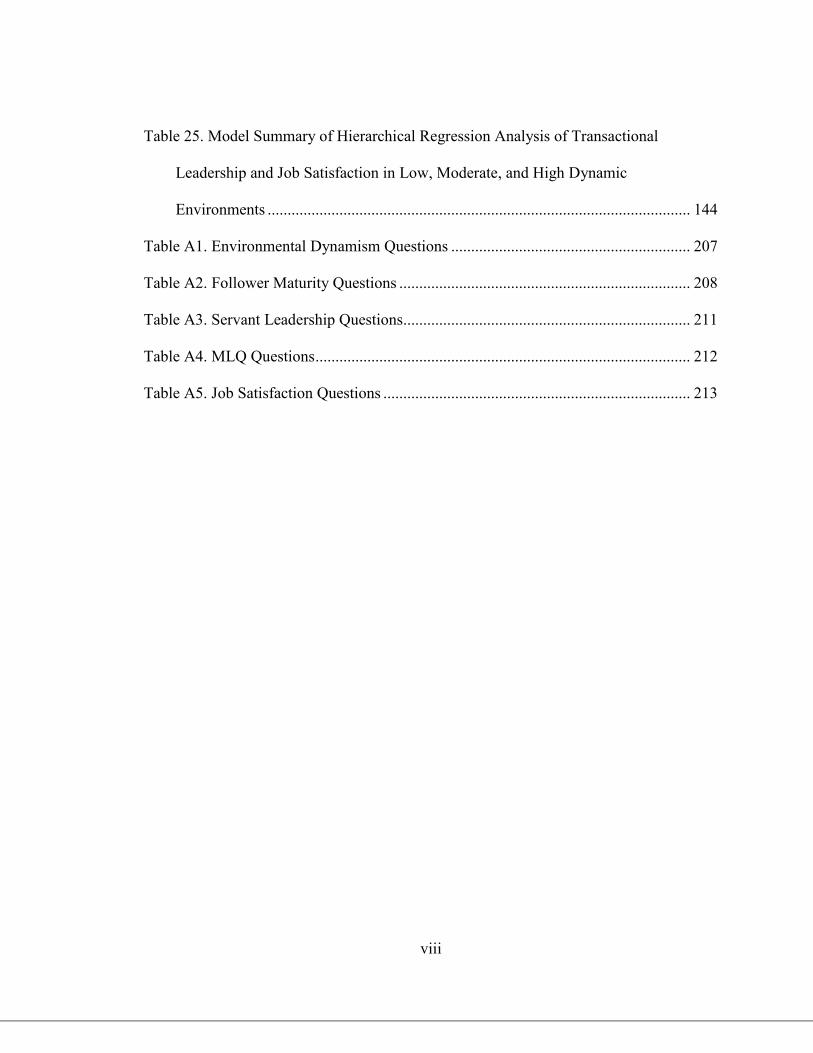
Table 25. Model Summary of Hierarchical Regression Analysis of Transactional
Leadership and Job Satisfaction in Low, Moderate, and High Dynamic
Environments .......................................................................................................... 144
Table A1. Environmental Dynamism Questions ............................................................ 207
Table A2. Follower Maturity Questions ......................................................................... 208
Table A3. Servant Leadership Questions........................................................................ 211
Table A4. MLQ Questions .............................................................................................. 212
Table A5. Job Satisfaction Questions ............................................................................. 213
ix
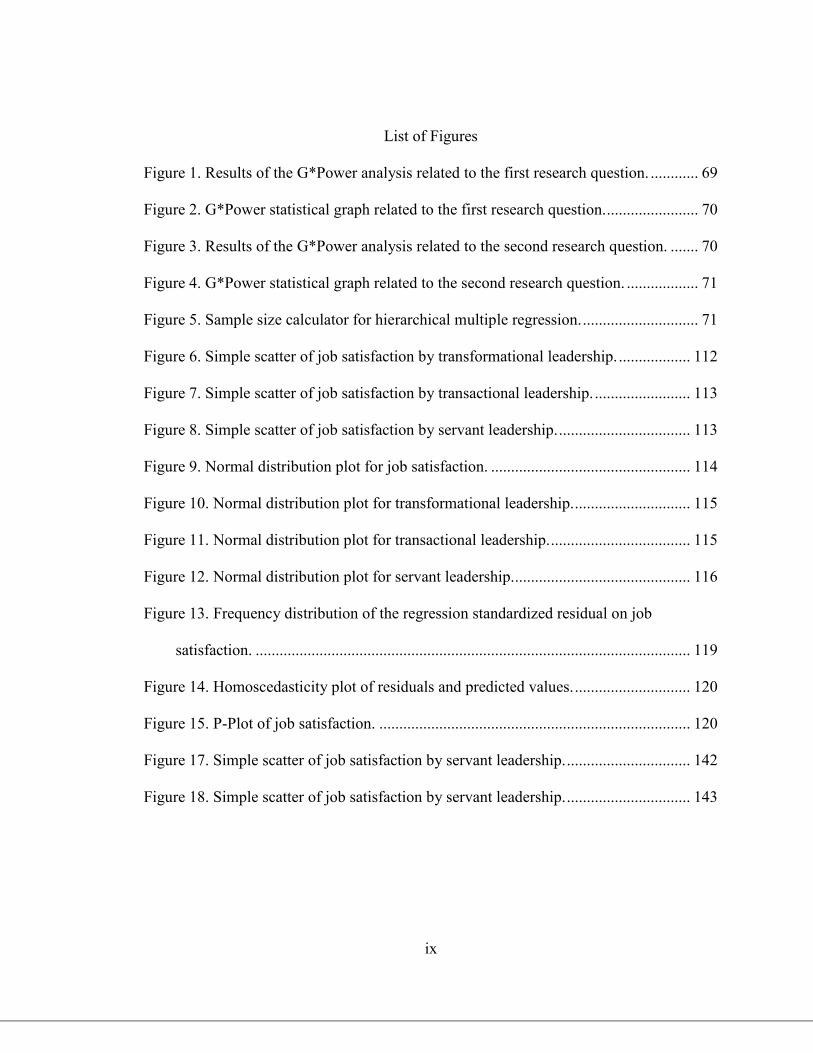
List of Figures
Figure 1. Results of the G*Power analysis related to the first research question. ............ 69
Figure 2. G*Power statistical graph related to the first research question. ....................... 70
Figure 3. Results of the G*Power analysis related to the second research question. ....... 70
Figure 4. G*Power statistical graph related to the second research question. .................. 71
Figure 5. Sample size calculator for hierarchical multiple regression. ............................. 71
Figure 6. Simple scatter of job satisfaction by transformational leadership. .................. 112
Figure 7. Simple scatter of job satisfaction by transactional leadership. ........................ 113
Figure 8. Simple scatter of job satisfaction by servant leadership. ................................. 113
Figure 9. Normal distribution plot for job satisfaction. .................................................. 114
Figure 10. Normal distribution plot for transformational leadership. ............................. 115
Figure 11. Normal distribution plot for transactional leadership. ................................... 115
Figure 12. Normal distribution plot for servant leadership. ............................................ 116
Figure 13. Frequency distribution of the regression standardized residual on job
satisfaction. ............................................................................................................. 119
Figure 14. Homoscedasticity plot of residuals and predicted values. ............................. 120
Figure 15. P-Plot of job satisfaction. .............................................................................. 120
Figure 17. Simple scatter of job satisfaction by servant leadership. ............................... 142
Figure 18. Simple scatter of job satisfaction by servant leadership. ............................... 143
1
Chapter 1: Introduction to the Study
Organizational leaders struggle to retain their staff and maintain their companies
competitive in this digital age, resulting in high staff turnover rates since 2012 (European
Federation of Management Consultancies Associations, 2018). Managers strive to find
solutions to reduce the high rate of staff turnover and employee job dissatisfaction
(Sukriket, 2018). Managers attempt to adopt appropriate leadership styles among
existing leadership styles to improve employee job satisfaction (Babalola, 2016). This
suggests the need to develop a better understanding of the relationship between
leadership styles and employee satisfaction. In order to do so, one must identify the
moderating and mediating factors that influence this relationship. Previous research has
shown that the level of dynamism of the organizational environment is a moderating
variable that can help determine the conditions (e.g., a stable or dynamic organizational
environment) in which servant leadership style is more or less effective than
transformational leadership style (Smith, Montagno, & Kuzmenko, 2004). Recent
research shows that follower maturity is a mediating variable in the relationship between
leadership styles and employee job satisfaction (Harber & McMaster, 2018). Previous
research has also shown how important it is for organizational leaders to strategically
adapt to their organizational environment to survive and evolve in this digital age and
adopt the perspective of person-environment fit (e.g., employee maturity-environment fit)
to enhance the effects of leadership on follower outcomes (e.g., job satisfaction; Tepper
et al., 2018). A gap in the research literature exists in determining the relationship
between leadership styles and employee job satisfaction by diagnosing both the

2
dynamism of the organizational environment and the maturity of employees (Tepper et
al., 2018). The focus of the study is on any organization in which there are dyadic
relationships between managers and employees.
A quantitative non-experimental study was conducted to examine to what extent,
if any, (a) follower maturity mediates the relationship between leadership styles and
employee job satisfaction, and (b) the dynamism of the organizational environment
moderates the relationship between leadership styles and employee job satisfaction within
organizations around the world. According to contingency theory and the paradigm of
person-environment fit, leaders need to configure organizations to fit into their external
environment in order to provide adequate resources in amounts that fit employee needs,
especially as a lack of ‘fit’ can have a negative impact on follower outcomes, thus
resulting in employee dissatisfaction (Tepper et al., 2018). The positive social change
implications include the revision of leadership curriculum within organizations to
prescribe the leadership styles appropriate to the levels of environmental dynamism and
employee maturity. In this chapter, I present the background, problem, purpose, research
questions, theoretical foundation, definitions, assumptions, limitations, delimitations,
nature, and overall significance of the study.
Background of the Study
Anderson and Sun (2017) showed the chaos characterized by the large number of
overlapping leadership styles found in the leadership literature, which confuses
leadership scholars in identifying the most effective leadership styles to optimize
organizational and follower outcomes. Because of this chaos, Anderson and Sun
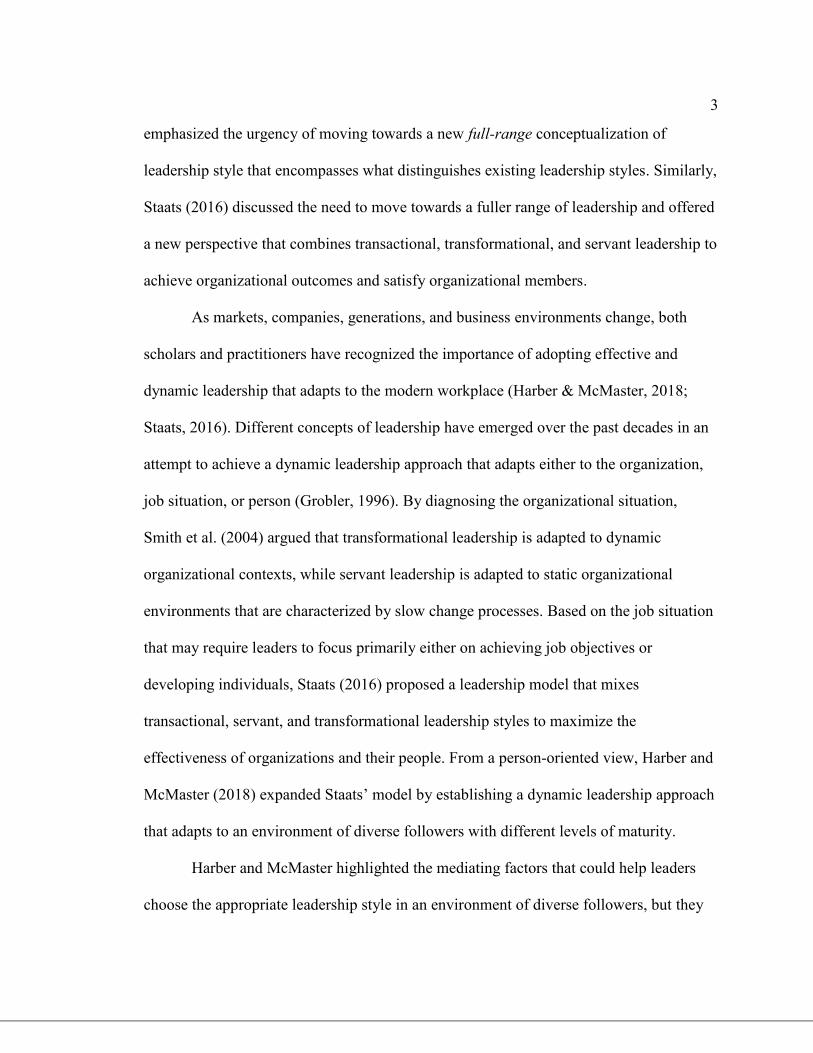
3
emphasized the urgency of moving towards a new full-range conceptualization of
leadership style that encompasses what distinguishes existing leadership styles. Similarly,
Staats (2016) discussed the need to move towards a fuller range of leadership and offered
a new perspective that combines transactional, transformational, and servant leadership to
achieve organizational outcomes and satisfy organizational members.
As markets, companies, generations, and business environments change, both
scholars and practitioners have recognized the importance of adopting effective and
dynamic leadership that adapts to the modern workplace (Harber & McMaster, 2018;
Staats, 2016). Different concepts of leadership have emerged over the past decades in an
attempt to achieve a dynamic leadership approach that adapts either to the organization,
job situation, or person (Grobler, 1996). By diagnosing the organizational situation,
Smith et al. (2004) argued that transformational leadership is adapted to dynamic
organizational contexts, while servant leadership is adapted to static organizational
environments that are characterized by slow change processes. Based on the job situation
that may require leaders to focus primarily either on achieving job objectives or
developing individuals, Staats (2016) proposed a leadership model that mixes
transactional, servant, and transformational leadership styles to maximize the
effectiveness of organizations and their people. From a person-oriented view, Harber and
McMaster (2018) expanded Staats’ model by establishing a dynamic leadership approach
that adapts to an environment of diverse followers with different levels of maturity.
Harber and McMaster highlighted the mediating factors that could help leaders
choose the appropriate leadership style in an environment of diverse followers, but they
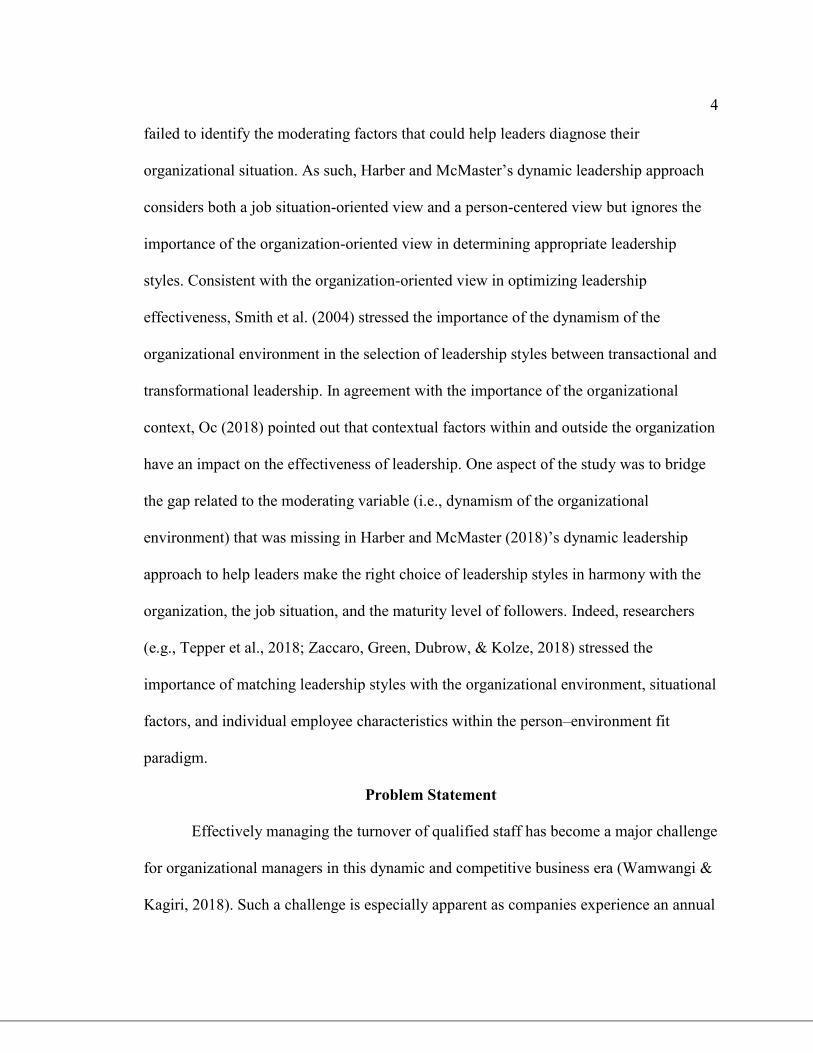
4
failed to identify the moderating factors that could help leaders diagnose their
organizational situation. As such, Harber and McMaster’s dynamic leadership approach
considers both a job situation-oriented view and a person-centered view but ignores the
importance of the organization-oriented view in determining appropriate leadership
styles. Consistent with the organization-oriented view in optimizing leadership
effectiveness, Smith et al. (2004) stressed the importance of the dynamism of the
organizational environment in the selection of leadership styles between transactional and
transformational leadership. In agreement with the importance of the organizational
context, Oc (2018) pointed out that contextual factors within and outside the organization
have an impact on the effectiveness of leadership. One aspect of the study was to bridge
the gap related to the moderating variable (i.e., dynamism of the organizational
environment) that was missing in Harber and McMaster (2018)’s dynamic leadership
approach to help leaders make the right choice of leadership styles in harmony with the
organization, the job situation, and the maturity level of followers. Indeed, researchers
(e.g., Tepper et al., 2018; Zaccaro, Green, Dubrow, & Kolze, 2018) stressed the
importance of matching leadership styles with the organizational environment, situational
factors, and individual employee characteristics within the person–environment fit
paradigm.
Problem Statement
Effectively managing the turnover of qualified staff has become a major challenge
for organizational managers in this dynamic and competitive business era (Wamwangi &
Kagiri, 2018). Such a challenge is especially apparent as companies experience an annual
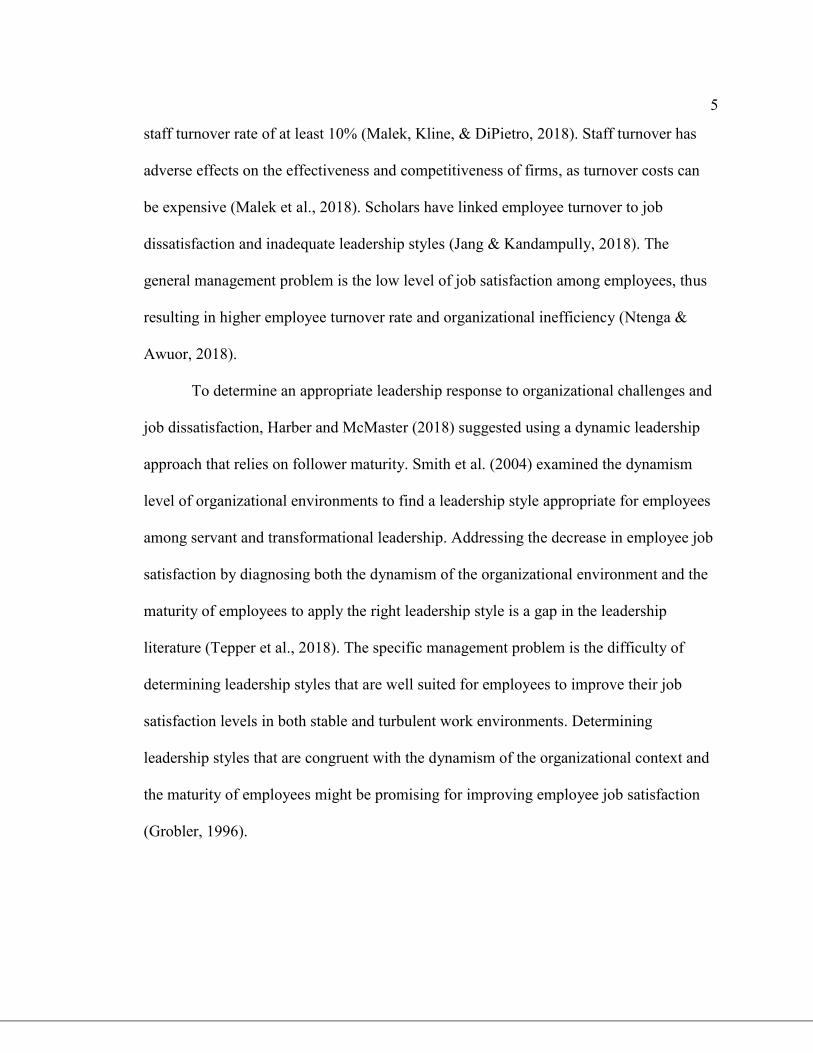
5
staff turnover rate of at least 10% (Malek, Kline, & DiPietro, 2018). Staff turnover has
adverse effects on the effectiveness and competitiveness of firms, as turnover costs can
be expensive (Malek et al., 2018). Scholars have linked employee turnover to job
dissatisfaction and inadequate leadership styles (Jang & Kandampully, 2018). The
general management problem is the low level of job satisfaction among employees, thus
resulting in higher employee turnover rate and organizational inefficiency (Ntenga &
Awuor, 2018).
To determine an appropriate leadership response to organizational challenges and
job dissatisfaction, Harber and McMaster (2018) suggested using a dynamic leadership
approach that relies on follower maturity. Smith et al. (2004) examined the dynamism
level of organizational environments to find a leadership style appropriate for employees
among servant and transformational leadership. Addressing the decrease in employee job
satisfaction by diagnosing both the dynamism of the organizational environment and the
maturity of employees to apply the right leadership style is a gap in the leadership
literature (Tepper et al., 2018). The specific management problem is the difficulty of
determining leadership styles that are well suited for employees to improve their job
satisfaction levels in both stable and turbulent work environments. Determining
leadership styles that are congruent with the dynamism of the organizational context and
the maturity of employees might be promising for improving employee job satisfaction
(Grobler, 1996).
6
Purpose of the Study
The purpose of this quantitative non-experimental correlation research study was
to examine the relationship between servant, transactional, and transformational
leadership styles and employee job satisfaction within organizations. A specific aim of
the study was to examine to what extent, if any, (a) follower maturity mediates the
relationship between leadership styles and employee job satisfaction, and (b) the
dynamism of the organizational environment moderates the relationship between
leadership styles and employee job satisfaction. The independent variables of the study
were transformational, transactional, and servant leadership styles. Servant leadership
was measured using the short version of the Servant Leadership Survey (SLS), and
transformational and transactional leadership styles were measured using the Multifactor
Leadership Questionnaire (MLQ-5X Short). The dependent variable is employee job
satisfaction, which was quantitatively measured using the Job Satisfaction Survey (JSS).
The moderating variable is the dynamism of the organizational environment that may
moderate the strength of the relationship between leadership styles and employee job
satisfaction. The mediating variable is follower maturity to mediate the relationship
between leadership styles and employee job satisfaction. The moderating and mediating
variables, namely the dynamism of the organizational environment and the maturity of
followers, were statistically controlled in the study and were measured respectively using
the measurement scale adapted by Akgun, Keskin, and Byrne (2008) and Employee
Readiness Scale (ERS).
7
Research Questions and Hypotheses
Three primary research questions were formulated to examine the relationship
between leadership styles and employee job satisfaction:
RQ1: To what extent, if any, is there a correlation between transformational,
transactional, and servant leadership styles and employee job satisfaction?
H011: There is no correlation between transformational leadership style and
employee job satisfaction among leaders and their followers.
Ha11: There is a correlation between transformational leadership style and
employee job satisfaction among leaders and their followers.
H012: There is no correlation between transactional leadership style and employee
job satisfaction among leaders and their followers.
Ha12: There is a correlation between transactional leadership style and employee
job satisfaction among leaders and their followers.
H013: There is no correlation between servant leadership style and employee job
satisfaction among leaders and their followers.
Ha13: There is a correlation between servant leadership style and employee job
satisfaction among leaders and their followers.
RQ2: To what extent, if any, does environmental dynamism moderate the
relationship between servant and transformational leadership styles and employee job
satisfaction?
RQ2.1: To what extent, if any, does transformational leadership influence
employee job satisfaction in dynamic environments?
8
RQ2.2: To what extent, if any, does servant leadership influence employee job
satisfaction in stable environments?
H021: Environmental dynamism does not moderate the relationship between
transformational leadership and employee job satisfaction.
Ha21: The relationship between transformational leadership and employee job
satisfaction will be stronger in turbulent environments than in stable
environments.
H022: Environmental dynamism does not moderate the relationship between
servant leadership and employee job satisfaction.
Ha22: The relationship between servant leadership and employee job satisfaction
will be stronger in stable environments than in turbulent environments.
RQ3: To what extent, if any, does follower maturity mediate the relationship
between transformational, servant, and transactional leadership styles and employee job
satisfaction?
H031: Follower maturity does not mediate the relationship between
transformational leadership and employee job satisfaction.
Ha31: The relationship between transformational leadership and employee job
satisfaction will be effective when follower maturity is moderate.
H032: Follower maturity does not mediate the relationship between servant
leadership and employee job satisfaction.
Ha32: The relationship between servant leadership and employee job satisfaction
will be associated with highly mature followers.
9
H033: Follower maturity does not mediate the relationship between transactional
leadership and employee job satisfaction.
Ha33: The relationship between transactional leadership and employee job
satisfaction will be appropriate when follower maturity is low.
Theoretical Foundation
Three theories served as the foundation for the study: Staats’ (2016) adaptable
emphasis leadership model, Harber and McMaster’s (2018) dynamic leadership
approach, and Smith et al.’s (2004) framework. According to Staats, leaders can use
transactional, transformational, and servant leadership styles to maximize follower and
organizational outcomes. Staats’ (2016) adaptable emphasis leadership model was used in
the study to examine the relationship between servant, transactional, and transformational
leadership styles and employee job satisfaction. According to Harber and McMaster
(2018), leaders could choose between servant, transformational, and transaction
leadership styles depending on the professional maturity of the follower. Harber and
McMaster’s approach was used to establish follower maturity as a mediating variable in
the relationship between leadership styles and employee job satisfaction. Smith et al.
(2004) diagnosed the dynamism of the organizational environment and proposed a
leadership model in which transformational leadership is more effective in a highly
dynamic environment and servant leadership is more effective in a static or weakly
dynamic environment. Smith et al.’s (2004) framework was used to specify the
10
environmental conditions in which one leadership style among servant or
transformational leadership is stronger than the other, perhaps suggesting that the level of
environmental dynamism is a moderating variable in the relationship between leadership
styles and employee job satisfaction.
Nature of the Study
For the quantitative study, a non-experimental correlational design was used to
examine the relationship between leadership styles and employee job satisfaction within
organizations. This quantitative analysis could help examine to what extent, if any, (a)
follower maturity mediates the relationship between leadership styles and employee job
satisfaction, and (b) the dynamism of the organizational environment moderates the
relationship between leadership styles and employee job satisfaction. Researchers use
quantitative methods when they want to make deductive reasoning and gather numerical
data (Burkholder, Cox, & Crawford, 2016). A quantitative research approach was
selected because the goal of the study was to numerically quantify the extent to which
leadership styles are related to employee job satisfaction within organizations.
A quantitative, non-experimental, correlational design was appropriate for the
study because the purpose of the study was to determine if there is a correlation between
leadership styles and employee job satisfaction when these variables are not manipulated
(Burkholder et al., 2016). A non-experimental correlational design was more appropriate
for the study because the goal of the study was to examine the extent to which servant,
transactional, and transformational leadership styles could be correlated with employee
job satisfaction. Other quantitative research designs, such as experimental and quasi-
11
experimental designs, are appropriate when the researcher is seeking cause and effect
relationships among the study variables (Burkholder et al., 2016), which was not the
objective of this study. Quasi-experimental and experimental designs were not the most
appropriate research designs for this study.
Data were collected through questionnaires sent to employees and leaders working in
different organizations. The sources of information for the study included the following
instruments:
The Multifactor Leadership Questionnaire, MLQ-5X, which measures
transactional and transformational leadership styles (Bass & Avolio, 1995).
The Servant Leadership Survey, which measures servant leadership style (Van
Dierendonck et al., 2017).
The Job Satisfaction Survey that measures the job satisfaction level of employees
(Spector, 1997).
The Employee Readiness Scale developed by Fernandez and Vecchio (1997),
which helps measure follower maturity in terms of employee competence and
commitment.
The measurement scale adapted by Akgun et al. (2008) that measures the
dynamism level of the organizational environment.
Definitions
The key terms used in this study are defined as follows:
Job satisfaction: Although there are different constructs of job satisfaction such as
work satisfaction, quality of work life, and well-being at work, job satisfaction in this
12
study represents the overall satisfaction score for multiple work factors, as measured on
the Job Satisfaction Survey (Van Saane, Sluiter, Verbeek, & Frings‐Dresen, 2003).
Leadership style: A pattern of behaviors, characteristics, attitudes, assumptions,
skills, and traits that leaders use when interacting with their subordinates (Ye, Feng, Ma,
& Huang, 2018). The leadership styles examined in this study include transformational
leadership, transactional leadership, and servant leadership.
Transformational leadership: A leadership style in which the leader transforms
employees to perform beyond expectations (Ribeiro, Yucel, & Gomes, 2018). This
leadership style is defined by a work-based exchange relationship in which the social
partnership between leaders and their followers is motivated by the attractiveness of the
task for the collaborator (Cardona, 2000).
Transactional leadership: A leadership style defined by an economically‐based
exchange relationship that seeks to maintain stability rather than promoting change
within an organization (Zhu & Wang, 2019).
Servant leadership: A leadership style in which leaders develop their followers in
multiple dimensions (e.g., relational, ethical, emotional, spiritual) to meet their individual
needs and the needs of the broader organizational stakeholders and the wider community
(Eva, Robin, Sendjaya, Van Dierendonck, & Liden, 2019).
Assumptions
Four assumptions underpinned the study. The first assumption was that the
willingness of participants to voluntarily participate in the study may not generate any
bias. The second assumption was that participants in the study may objectively complete
13
the survey as accurately as possible. Because the sample of participants were drawn from
a diverse group of leaders and employees, the third assumption was that (a) the leaders of
the selected organization practice the transactional, transformational, and servant
leadership styles and (b) employees would exhibit different levels of maturity. The fourth
assumption was that the leaders and employees of the organizations under study may be
exposed to highly and weakly dynamic organizational task environments to be able to
measure the variable environmental dynamism.
Scope and Delimitations
The study, based on a quantitative non-experimental correlational design, focused
on the relationship between servant, transactional, and transformational leadership styles
and employee satisfaction within organizations. The study aimed to determine to what
extent (a) follower maturity mediates the relationship between leadership styles and
employee job satisfaction, and (b) the dynamism of the organizational environment
moderates the relationship between leadership styles and employee job satisfaction within
organizations. A delimitation of the study involved reducing its scope of application to
the adult employees reporting hierarchically to an organizational leader. More
specifically, this study focused on the perceptions of followers only in examining a
dynamic leadership approach that may influence employee job satisfaction in dynamic
and stable environments. Using only the follower questionnaire helped reduce the risk of
participant bias in which organizational leaders can self-rate their leadership styles. As
such, followers could rate their leader’s leadership styles as accurately as possible and
without any bias or fear.

14
The boundaries of the study were confined to the formation of a new leadership
approach centered on both the maturity of the followers and the dynamism of the
organizational environment as the mediating and moderating factors of leadership style
selection. Another delimitation of the study entails its confinement to the environmental
dynamism dimension included in the overall organizational uncertainty concept,
especially as other variables of the organizational task environment such as
environmental munificence and environmental complexity were not considered.
Although the data collected came from different organizations located in different
countries and continents, the findings of the study did not have the potential to be
generalized to all organizations around the world, particularly because of the convenience
and snowball sampling strategies used in the study.
Limitations
Four limitations emerge from the study. First, given that the study participants
reported their own perceptions of certain variables, a potential limitation exists regarding
common method bias due to the collection of survey data from the same source. Second,
there is a limitation related to the inference of causality between the variables under
study, especially as the dynamism of the organizational environment can both influence
and be influenced by managers’ leadership styles. Third, some Western leadership styles
such as servant, transactional, and transformational leadership may not be as acceptable
or necessary in the organizations located in Francophone countries due to the paucity of
leadership publications in French-speaking countries, thus limiting the validity of the
study in these regions specifically. This scarcity is explained by the fact that the two large
15
research projects on leadership in Africa, namely the Global Leadership and
Organizational Behavior Effectiveness (GLOBE) and the Leadership Effectiveness in
Africa and the Diaspora (LEAD), have mainly considered the English-speaking African
countries in their sample (Lituchy, Galperin, & Punnett, 2017). Finally, the use of
convenience and snowball sampling strategies provides a poor generalizability of the
study, which may yield biased estimates of the target population and its socio-
demographic subpopulations.
Significance of the Study
In this section, the significance of the study is addressed in terms of how the study
may advance management theory, advance management practice, and affect positive
social change.
Significance to Theory
Researchers might use the results of the proposed research to better understand
how servant, transactional, and transformational leadership styles impact job satisfaction
in both static and dynamic organizational environments. The research project was an
extension of previous studies on the conceptualization of a dynamic leadership approach,
which is needed to help leaders choose a leadership style that is tailored to the needs of
their organization. The project is one of the first studies providing empirical evidence to
support a dynamic leadership approach in which both the maturity of followers and the
dynamism of the environment help leaders select a leadership style.
16
Significance to Practice
For organizations that participated in this study, the results of the research might
serve as a source of policy guidance by providing managers with insight into the
environmental and follower conditions that impact employee job satisfaction. This
knowledge could guide them in their decision to choose the appropriate leadership style
among transactional, transformational, and servant leadership. The results of the study
may yield practical leadership implications for managers in understanding which
leadership style is adequate for improving employee job satisfaction when the
organizational context shifts from a stable environment to a dynamic one.
Significance to Social Change
The findings of the study could inspire human resource academics within
organizations to revise their leadership curriculum and prescribe the leadership styles
appropriate to the levels of environmental dynamism and maturity of employees. By
determining the leadership styles that are appropriate for employees, organizational
leaders could increase employee job satisfaction, thus effecting positive social change for
the employees of the organizations which participated in this study. Those results could
also be extended to employees of other companies operating in the same countries by
considering the cultural similarities.
Summary and Transition
To present the overall picture of the study, Chapter 1 began with the introduction,
background, problem statement, and the purpose of the study. These sections were used
to inform the reader about the history of the problem and the specific problem requiring a
17
quantitative non-experimental correlation research study to examine the relationship
between servant, transactional, and transformational leadership styles and employee job
satisfaction. The research questions, the theoretical foundation, and the nature of the
study established the focus and boundaries of the study, which helped to highlight that a
non-experimental correlational design was the most suitable research design for this
study. The correlational design may eventually help establish a relationship between
servant, transactional, and transformational leadership styles and employee job
satisfaction using the maturity of followers and the dynamism of the organizational
environment. The definitions, assumptions, scope, and limitations of the study have
helped to refine both the focus and boundaries of the study.
Chapter 1 sets the tone for the literature review presented in the next chapter by
providing the background, focus, and boundaries of the study. The literature review
builds on the information in Chapter 1 to provide additional and detailed information on
the existing literature relevant to the research topic to address the identified problem and
purpose of the study. Chapter 2 also defines the search strategy in the literature review,
the theoretical foundation used to guide the literature review, and the literature review
itself.
18
Chapter 2: Literature Review
Due to the high rate of staff turnover in the dynamic business world of the digital
age, managers strive to identify leadership styles that can improve employee job
satisfaction and reduce the rate of turnover (Sukriket, 2018). The specific problem of this
study lies in the difficulty of determining the best leadership styles to improve job
satisfaction in both stable and turbulent work environments. Addressing this problem
suggests understanding the relationship between leadership styles and employee job
satisfaction and identifying the moderating and mediating factors that may influence this
relationship. Unfortunately, almost no empirical study presents both the moderating role
of the dynamism of the organizational environment and the mediating role of employee
maturity in the relationship between leadership styles and employee job satisfaction
(Tepper et al., 2018).
In this chapter, I identify the search strategy used in the literature review, the
theoretical foundation incorporating seminal theorists, and a concise review of the
literature regarding the main concepts used in this study (servant, transactional,
transformational leadership, and employee job satisfaction). After the search strategy
section, I describe the theoretical framework and the concepts of servant leadership,
transformational leadership, transactional leadership, and employee job satisfaction.
Next, I review past findings on the relationship between each of these three leadership
styles and employee job satisfaction. Then, I examine how the dynamism level of the
organizational environment moderates the relationship between two of these leadership
styles (servant and transformational leadership) and employee job satisfaction. After that,
19
I examine the mediating role of follower maturity in the relationship between the three
leadership styles and employee job satisfaction. At the end of this chapter, I summarize
and conclude on its key takeaways.
Literature Search Strategy
I used various multidisciplinary databases and types of resources. The principal
resources used for this literature review were peer-reviewed journals and foundational
textbooks. For locating these resources, I searched 14 databases and library search
engines including ABI/Inform, Business Source Complete, EBSCO Host, ERIC, Emerald
Management, Expanded Academic, Google Scholar, Informit, Sage Premier, Science
Direct, SocINDEX with Full Text, ProQuest, PsycARTICLES, and Psych Info. By
searching these search engines and databases, I found a multitude of studies that have a
focus on servant, transactional, and transformational leadership.
Due to the abundance of articles found, I conducted a literature review using both
quantitative and qualitative literature review approaches, as recommended by Randolph
(2009). As such, I first focused my review on articles presenting systematic reviews and
meta-analyses and/or meta-syntheses to easily synthesize literature pertinent to servant,
transactional, and transformational leadership, and then identify patterns and
consistencies across studies. Indeed, Hinde and Spackman (2015) found that conducting a
systematic review of existing literature is a vital starting point for identifying all relevant
articles in the literature of any reliable study. Moreover, meta-analyses provide a
“quantitative” method for research synthesis in which the results of articles related to the
topic of interest are commonly reported in tables, which helps researchers summarize the
20
results of studies on the same topic (Kaufmann, 2018). With this strategy in mind, I was
able to get an overview of what has been done before and what is already known about
servant, transactional, and transformational leadership through existing empirical
research. In this regard, I used the keywords of transformational leadership and servant
leadership and combined them with the specific keywords of systematic review, meta-
analysis, and meta-synthesis, as follows: (a) "transformational leadership" "servant
leadership" "systematic review," (b) "transformational leadership" "servant leadership"
"meta-analysis," and (c) "transformational leadership" "servant leadership" "meta-
synthesis." Based on the results obtained, I easily excluded the majority of articles based
on duplicates and the fact that their titles and abstracts describe neither servant leadership
nor transformational leadership. Next, I continued this first review with the most recent
articles to have an exhaustive list of up-to-date information on servant leadership and
transformational leadership and to identify the titles of relevant studies that compare
servant leadership to transformational leadership.
After having structured and synthesized the list of key articles relevant to this
initial quantitative research review, I focused my second review on “qualitative” literature
reviews by locating and reviewing key studies comparing transactional, transformational,
and servant leadership. To this end, I combined several search terms using Boolean
operators, as follows: (a) transformational leadership versus servant leadership, (b)
"servant leadership" AND "transactional leadership" AND "transformational leadership"
AND comparison, and (c) servant AND transactional AND transformational AND
leadership AND "job satisfaction" OR "employee satisfaction" AND "sub-Saharan
21
francophone Africa" OR Ghana OR Cameroon OR "ivory coast" Gabon OR Guinea OR
Equatorial Guinea. Finally, I used the following key search terms to retrieve additional
articles that present the mediating/moderating mechanisms in the relationships between
leadership styles and follower outcomes and that show staff turnover statistics: (a)
follower maturity OR environmental dynamism AND servant AND transformational AND
leadership, and (b) employee turnover increase per year OR staff turnover statistics.
After performing all the above search terms, I set up keywords in Google Scholar to
receive alerts on the most recent articles related to the main theories used in this study:
“dynamic leadership approach” and “adaptable emphasis leadership model.” As a result
of the application of these keywords in Google Scholar, I did not found any empirical
evidence in organizations.
The inclusion criteria for literature to be included in the review were as follows:
(a) articles written in English and linked to servant, transactional, transformational
leadership, and employee job satisfaction; and (b) conceptual or empirical studies. From
the initial cumulative sample of 67,929 articles, my database investigations resulted in
approximately 150 journal articles after using these inclusion criteria to focus on articles
relevant to the topic of interest and after applying filters to prevent redundancy. Then, I
examined the reference list section of all extracted articles to identify other relevant
documents that were not included in my initial database search, resulting in 50 other
articles. Then, I repeated the above investigative steps until no new relevant article was
found. Of the 200 articles, I cited 150 articles, 90% of which were published between
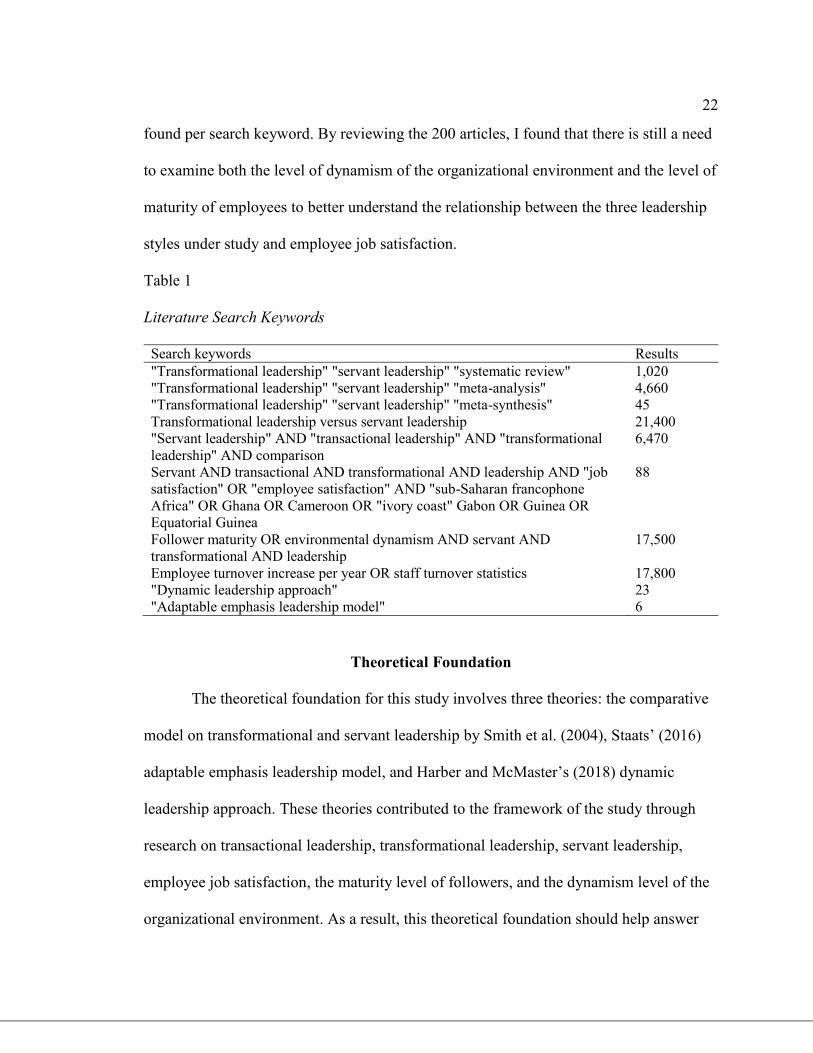
2013 and 2019 (see Table 1). Table 1 highlights the total quantity of research articles
22
found per search keyword. By reviewing the 200 articles, I found that there is still a need
to examine both the level of dynamism of the organizational environment and the level of
maturity of employees to better understand the relationship between the three leadership
styles under study and employee job satisfaction.
Table 1
Literature Search Keywords
Search keywords Results
"Transformational leadership" "servant leadership" "systematic review" 1,020
"Transformational leadership" "servant leadership" "meta-analysis" 4,660
"Transformational leadership" "servant leadership" "meta-synthesis" 45
Transformational leadership versus servant leadership 21,400
"Servant leadership" AND "transactional leadership" AND "transformational
leadership" AND comparison
6,470
Servant AND transactional AND transformational AND leadership AND "job
satisfaction" OR "employee satisfaction" AND "sub-Saharan francophone
Africa" OR Ghana OR Cameroon OR "ivory coast" Gabon OR Guinea OR
Equatorial Guinea
88
Follower maturity OR environmental dynamism AND servant AND
transformational AND leadership
17,500
Employee turnover increase per year OR staff turnover statistics 17,800
"Dynamic leadership approach" 23
"Adaptable emphasis leadership model" 6
Theoretical Foundation
The theoretical foundation for this study involves three theories: the comparative
model on transformational and servant leadership by Smith et al. (2004), Staats’ (2016)
adaptable emphasis leadership model, and Harber and McMaster’s (2018) dynamic
leadership approach. These theories contributed to the framework of the study through
research on transactional leadership, transformational leadership, servant leadership,
employee job satisfaction, the maturity level of followers, and the dynamism level of the
organizational environment. As a result, this theoretical foundation should help answer
23
the three research questions in the study by testing (a) the relationship between the three
leadership styles (transformational, transactional, and servant leadership) and employee
job satisfaction and (b) the moderating and mediating factors proposed in this
relationship.
Smith et al.’s Comparative Model on Transformational and Servant Leadership
Driven by the need to understand what good or effective leadership is and
whether this effectiveness depends on the environmental context, specifically among the
most popular leadership styles (transformational and servant), Smith et al. (2004)
conducted content and contextual comparison studies between these two styles. From a
contextual standpoint, Smith et al. concluded that the application of transformational
leadership would lead to greater success in a dynamic organizational environment while
the adoption of servant leadership may be more effective in environments characterized
by low dynamism and slow change processes. More specifically, Smith et al. asserted that
servant leadership may be effective in not-for-profit, voluntary, religious, and community
organizations, which often operate in a more static environment and attract employees
seeking personal growth, support, and healing. In connection with this study, Smith et
al.’s model provides a contextual comparison between transformational leadership and
servant leadership to determine the situation in which one leadership style is preferable to
the other, depending on the dynamism of the organizational context.
Several authors have found convergent conclusions with the contextual assertions
of the Smith et al.’s model, particularly from theoretical and empirical perspectives.
Consistent with the ideas of Smith et al.’s contextual comparative model, Gregory Stone,
24
Russell, and Patterson (2004) argued that the difference between transformational
leadership and servant leadership styles in practice may also depend on the organizational
context. From an empirical standpoint, Humphreys (2005) conducted a historical
investigation of the military retreats of two leaders (Xenophon and Chief Joseph)
exhibiting transformational and servant leadership in ancient times to compare the
effectiveness of transformational leadership against servant leadership during similar
turbulent times. As a result, Humphreys found that transformational leadership was more
effective than servant leadership in highly dynamic organizational environments.
In contrast to Humphreys’ (2005) findings, Van Dierendonck, Stam, Boersma, De
Windt, and Alkema (2014) found inconsistent results that did not support the premises of
Smith et al.’s contextual model. Indeed, Van Dierendonck et al. conducted two
experimental studies to examine the role of environmental uncertainty as a moderator of
the effects of servant and transformational leadership on follower outcomes (e.g.,
follower need satisfaction). In their first study, Van Dierendonck et al. used a snowball
sample of 184 people (employees of various organizations with their family members and
friends) using a 2x2 factorial design (leadership: servant versus transformational
leadership; business environment: stable versus unstable). As a result of their first study,
Van Dierendonck et al. found no moderating effect of environmental uncertainty in the
relationship between transformational/servant leadership and follower outcomes (e.g.,
follower need satisfaction). Reflecting on the absence of an effect of environmental
uncertainty, Van Dierendonck et al. attributed the reason for this discrepancy in results to
25
the nature of the sample, which was a snowball sample of relatively diverse persons. To
fill this gap in the nature of the sample and to assess the effects of transformational
leadership and servant leadership independently, these authors replicated their findings in
a second study by using a more homogeneous sample (participants of a single
organization) of 200 hospital employees (mainly nurses and doctors). In their second
study, Van Dierendonck et al. conducted a 4x2 experimental design (leadership: servant
leadership versus transformational leadership versus transactional leadership versus
laissez-faire leadership; business environment: stable versus unstable). As a result of this
second study, Van Dierendonck et al. found partial consistency in the results with Smith
et al.’s contextual comparative model. Van Dierendonck et al. found that the effect of
servant leadership on the satisfaction of employees’ psychological needs was more
pronounced in stable times than in uncertain times and that there was no apparent
difference in the effect of transformational leadership on follower outcomes in stable or
dynamic times.
A potential theoretical explanation for this inconclusive result could be attributed
to the fact that Van Dierendonck et al. (2014) considered the overall variable
organizational uncertainty in their study instead of using only its sub-dimension
environmental dynamism to which Smith et al.’s (2004) contextual model refers to.
Indeed, environmental uncertainty consists of three different dimensions: environmental
dynamism, environmental munificence, and environmental complexity (Dess & Beard,
1984), thus suggesting that environmental dynamism is not identical to environmental
26
uncertainty. This limitation shows the need to pursue further research using an optimal
and valid measurement scale of environmental dynamism to confirm whether
transformational and servant leadership may be more or less applicable depending on the
dynamism of the organizational context (Van Dierendonck et al., 2014).
Holtzhausen and de Klerk (2018) also found inconsistent results that contradicts
Smith et al.’s (2004) assertion that servant leadership is not suited for high change
environments. Indeed, Holtzhausen and de Klerk (2018) examined the role and influence
of the Scrum master’s servant leadership on the software development team’s
effectiveness. These authors classified the software development environment as a high
change environment. Holtzhausen and de Klerk (2018) conducted an online questionnaire
that was fully completed by 71 Scrum team members (excluding Scrum masters) and 22
Scrum masters employed in 17 organizations based in the Western Cape in South Africa.
As a result, Holtzhausen and de Klerk (2018) found that Scrum masters extensively used
servant leadership style. What was probably not considered by Holtzhausen and de Klerk
(2018) was the use of a valid and reliable instrument that measures all the components of
the dynamism of the software development environment. Indeed, the authors just
assumed that the study participants were operating in a high change environment without
trying to accurately measure the dynamism level of this environment. This gap shows the
need to conduct the study using an optimal and valid measurement scale of
environmental dynamism to confirm whether the software development environment is
truly dynamic and adapted to the use of servant leadership style.
27
To verify the reliability in the present times of Humphreys’ (2005) results that
stem from ancient times and to crosscheck the consistency of Smith et al.’s (2004)
contextual comparative model with a valid scale, I conduct this study to find empirical
evidence of Smith et al.’s model. To this end, the contextual dimension of Smith et al.’s
comparative model was used to test the moderating role of dynamic organizational
context in the relationship between leadership styles (transformational and servant
leadership) and follower outcomes.
Adaptable Emphasis Leadership Model
Building on the fact that markets, firms, and business environments evolve faster
than ever before, Macik-Frey, Quick, and Cooper (2009) argued that leadership can play
a more important role in maximizing results for organizations and their followers. To
achieve both organizational and follower outcomes, Gregory Stone et al. (2004) argued
that transformational leaders focus on achieving organizational objectives and servant
leaders emphasize on serving followers. Despite this difference in emphasis between
organizational goals and people’s well-being in these two leadership models, Staats’
(2016) core idea was to leverage on the respective strengths of each model and mitigate
the weaknesses of each model. By doing so and using transactional leadership as a
foundation to support servant and transformational leadership, Staats theoretically built a
more complete range of leadership that he named the “adaptable emphasis leadership
28
model.” In this adaptable emphasis leadership model, Staats argued that leaders can use
all the advantages of transactional, transformational, and servant leadership styles to
maximize both follower and organizational outcomes. As such, leaders who apply the
adaptable emphasis leadership model can recognize the short- and long-term impacts of
their behaviors on the organization and their followers and can also determine when to
focus more on the objectives of the organization, their employees, or exchanges with
followers (Staats, 2016). To the best of my knowledge, this adaptable emphasis
leadership model is still purely theoretical and its effectiveness has not yet been
empirically tested within organizations. By applying Staats’ model in the organization of
study, I foresaw that transactional, transformational, and servant leadership styles may
help predict employee satisfaction at work because employee job satisfaction is an
example of follower attitudinal outcome (Eva et al., 2019).
Harber and McMaster’s Dynamic Leadership Approach
Harber and McMaster’s (2018) theoretical model is a dynamic leadership
approach for a diverse environment that incorporates Staats’ (2016) adaptable emphasis
leadership model as well as Hersey and Blanchard’s (1982) situational leadership style,
while drawing on servant, transactional, and transformational leadership styles. Harber
and McMaster have developed this recent leadership approach which seems to have not
yet been applied and used in prior research. Their leadership approach contains the
following three main propositions: (a) a leader can incorporate the attributes of a servant

29
leader while applying transactional or transformational leadership, depending on the
maturity of the followers; (b) transactional servant leadership consists of applying
rewards and punishments in order to further develop followers while still attaining
organizational objectives; and (c) transformational servant leadership provides an
authentic style of leadership that aims to grow followers through collaboration and the
achievement of organizational goals. I adopt Harber and McMaster’s (2018) leadership
approach in this study because these authors argued that follower maturity drives the
choice of leadership styles among transactional, transformational, or servant leadership.
Applying this leadership approach to this study, I expected that follower maturity may
mediate the relationship between (a) transactional leadership and employee job
satisfaction, (b) transformational leadership and employee job satisfaction, and (c)
servant leadership and employee job satisfaction.
Literature Review Related to Key Variables
In this literature review, I analyze the current literature on the key variables of this
study, namely, servant leadership, transformational leadership, and transactional
leadership. As such, I begin this literature review with a brief description of what
leadership style is. Then, I provide a brief explanation of the relevance for this study of
the choice of servant, transformational, and transactional leadership styles in relation to
other popular styles of leadership. Through this literature review analysis, I compare and
contrast studies from the scholarly literature on servant leadership, transformational
leadership, transactional leadership, and employee job satisfaction. After analyzing each
topic, I examine the linkages between leadership styles and employee job satisfaction in a
30
summary of how each topic fits into the theoretical framework. Next, I examine the
moderating effect of environmental dynamism in selecting a leadership style among
transformational leadership and servant leadership. After that, I analyze the mediating
role of follower maturity in the relationship between servant leadership, transactional
leadership, transformational leadership, and employee job satisfaction. Finally, I
conclude with an introduction to Chapter 3.
Leadership styles
Leadership style has many definitions in the literature and it refers broadly to the
style with which an individual leads other persons. Wakabi (2016) postulated that
leadership style refers to a kind of relationship whereby someone utilizes his methods and
ways to get many people to work together for a common task. Other scholars (e.g.,
Göksoy, 2017; İnce, 2018; Ye, Feng, Ma, & Huang, 2018) viewed leadership style as a
pattern of behaviors, characteristics, managerial attitudes, assumptions, skills, personality
traits that leaders use when interacting with their subordinates. Iqbal, Anwar, and Haider
(2015) argued that leadership style is the result of personality traits, experience, attitudes,
choices, and philosophy of the leaders when governing and supervising others. Given that
leaders can choose the leadership style they wish to adopt to influence, guide, and inspire
employees to achieve their organization’s goals, the leadership literature is endowed with
a multitude of leadership styles.
Given the multitude of leadership styles in the scholarly literature, I approached
my literature analysis by first justifying the choice of servant, transactional, and
31
transformational leadership as the basic leadership styles for the study. Next, I examined
studies related to servant leadership. Then, I examined studies related to transformational
leadership and concluded with studies on transactional leadership.
Among the most popular contemporary leadership styles in the leadership
literature, servant leadership and transformational leadership were more relevant for the
study than ethical and authentic leadership to predict employee job satisfaction. On the
one hand, the relevance of using transformational leadership and servant leadership styles
for the study was explained by the fact that servant leadership is conceptually different
from transformational leadership (Chiniara & Bentein, 2016). Specifically,
transformational leaders are more focused on achieving organizational results, while
servant leaders are primarily focused on the multidimensional development of employees
before considering the achievement of organizational goals and the goals of the leaders
themselves (Sendjaya, 2015). On the other hand, the empirical redundancy and similarity
of ethical leadership and authentic leadership to transformational leadership are the
determinant factors that have led me to the exclusion of ethical leadership and authentic
leadership in this study. Indeed, authentic and ethical leadership styles display significant
construct redundancy, as evidenced by their strong correlation and low amounts of
incremental variance with transformational leadership (Hoch, Bommer, Dulebohn, &
Wu, 2018). Similarly, Banks, McCauley, Gardner, and Guler (2016) found that there was
a strong correlation between authentic leadership and transformational leadership and
there was no significant incremental validity of authentic leadership over
transformational leadership, thus indicating a redundancy of constructs between these
32
two leadership styles. Moreover, given that authentic leadership has a relative lower
weight than transformational leadership in influencing follower job satisfaction (Banks et
al., 2016), transformational leadership seems more relevant to this study than authentic
leadership to help maximize employee job satisfaction, which is the dependent variable in
this study.
Servant leadership. Robert Greenleaf (1977) coined the concept of servant
leadership in 1970 to combat the leadership crisis of poor quality relationships and
unethical flaws he saw in modern society after consulting for companies, foundations,
professional societies, churches, and universities in the US, Europe, and developing
nations. To provide a potential solution to the leadership crisis he witnessed within
organizations, Greenleaf founded the concept of servant leadership on the premise that
leaders who retain the ability to motivate followers are those who give priority to the
development of their employees and who focus less on the satisfaction of their personal
desires. Specifically, servant leaders focus on developing employees to their fullest
potential in areas of task effectiveness, community stewardship, self-motivation, and
future leadership capabilities (Greenleaf, 1977). To help employees reach their full
potential, Greenleaf underscored the importance of a leader’s motivation, to serve or to
lead, as an identifying factor of servant leadership, especially since he did not provide
any definition of servant leadership (Smith et al., 2004).
Many authors have attempted to define the servant leadership construct. Graham
(1991) conceptualized servant leadership as a leadership approach that emphasizes both
personal integrity and the development of strong long-term relationships between leaders
33
and employees. In addition to building relationships with an organization’s employees,
Graham argued that the scope of servant leadership extends outside the organization,
particularly because servant leaders serve multiple stakeholders, including their
communities and society as a whole. Likewise, Laub (1999) defined servant leadership as
an understanding and practice of leadership that puts the good of followers above the
personal interest of the leader for the common good of every individual, the whole
organization, and the stakeholders of the organization. By examining the diversity of
stakeholders served by servant leaders, Sendjaya (2015) defined an order of priority
among the types of stakeholders by arguing that the priorities of servant leaders are:
followers first, second organizations, leaders last. Hoch et al. (2018) echoed Laub’s
sentiment by defining servant leadership as a leadership approach that emphasizes
wisdom, emotional healing, and altruistic values through which servant leaders put the
interests of others ahead of their own for the greater good of the society.
To better highlight the interests of others, scholars (e.g., Chughtai, 2018; Ye, Lyu,
& He, 2019) showed that servant leadership is a leadership approach in which the
leadership behaviors of servant leaders are characterized by actions that strongly respect
the self-esteem and self-worth of followers while increasing their desire to become
servant leaders. To exhibit the self-esteem of followers, Barbuto and Wheeler (2006)
described servant leadership as comprising (a) an altruistic appeal, which is the
motivation of leaders to put the needs and interests of others ahead of their own; and (b)
an organizational stewardship, which directs others towards the benefit and service of the
34
community. With regard to organizational stewardship, servant leaders see themselves as
stewards of organizations (Chan, 2016), who seek to develop the organizational resources
(financial, human, etc.) that have been entrusted to them. With regard to the altruistic
aspect of servant leadership, Barbuto Jr(Jay) and Gottfredson (2016) asserted that servant
leaders transcend their personal interests and aspire to meet the physical, ethical, and
emotional needs of others. To respond to the needs of followers, Van Dierendonck and
Patterson (2015) argued that servant leaders act by understanding the abilities, needs,
desires, goals, and potential of their followers through one-on-one communications with
each follower. After providing definitions and conceptualizations of servant leadership, I
now review and synthesize research related to servant leadership.
Given the different facets and orientations mentioned above in the definitions of
servant leadership, Eva et al. (2019) provided a new and comprehensive definition of
servant leadership that includes three features that capture the essence of servant
leadership, namely the motive, mode, and mindset of servant leadership. As such, Eva et
al. viewed servant leadership as a leadership approach oriented towards individuals other
than the leader (i.e., motive), manifested through the recognition of the individual needs
of followers (i.e., mode), and evidenced by a deep concern towards the well-being of the
broader organizational stakeholders and the wider community (i.e., mindset). By
recognizing that each individual follower is unique and has different needs, desires,
interests, goals, strengths, and limitations, servant leaders develop their followers in
multiple dimensions (e.g., relational, ethical, emotional, spiritual) to meet their needs
(Eva et al., 2019). Given the holistic and developmental nature of servant leadership in
35
meeting the needs of followers, the adoption of servant leadership was appropriate for the
study to predict employee job satisfaction and then respond to the first research question.
Three streams of research have categorized research on servant leadership (Eva et
al., 2019). First, a conceptual stream in which scholars focused on the conceptual
development of servant leadership has emerged based on the early works of Greenleaf
(1977), as pointed out by Eva et al. (2019). Second, a measurement stream came into
play in which researchers (e.g., Laub, 1999; Van Dierendonck et al., 2017) developed
measures of servant leadership and tested the relationships between servant leadership
and organizational outcomes through cross-sectional research (Eva et al., 2019). Third,
the current stream of model development has emerged in which scholars have used more
complex research designs to go beyond simple relationships between servant leadership
and organizational outcomes in order to understand the antecedents, mediating
mechanisms, and boundary conditions of servant leadership (Eva et al., 2019).
Unfortunately, an empirical stream in which researchers explore servant leadership
within organizations and confirm the consistency and reliability of the results obtained is
almost absent from the research streams above (Parris & Peachey, 2013).
To fill this gap in the consistency of the empirical evidence of servant leadership
and to contribute to the maturity of the current model development phase, I provide a
model for testing the theory of servant leadership in a given organizational context to
help advance research on servant leadership. Indeed, examining the role of follower
maturity as a mediating variable in the relationship between servant leadership and
employee job satisfaction would help scholars and practitioners better understand the
36
mediating mechanisms of servant leadership. Moreover, using the concept of servant
leadership in this study could help examine the boundary conditions (highly or weakly
dynamic organizational environments) in which servant leadership is highly effective in
maximizing employee job satisfaction, thus helping to answer the second research
question of the study.
Transformational leadership. In his descriptive research on political leaders,
Burns (1978) examined the characteristics and behaviors of political leaders to
distinguish between leaders and mere power-wielders and between leadership and
management. Burns argued that the difference between leadership and management lies
in the characteristics and behaviors of people. For this reason, Burns (1978) established
the concepts of transforming leadership and transactional leadership, in which the
behavior of followers is based on the reward for compliance (i.e., transaction) or the
motivation to meet higher order needs (i.e., transformation). According to Burns,
transforming leadership is a process in which leaders elevate their followers from lower
to higher levels of motivation and morality in order to serve common interests and
achieve the necessary organizational and cultural changes in the best interest of the
organization (Iverson, McKenzie, & Halman, 2019).
Although Burns (1978) coined the concept of transforming leadership, Bass
(1985) expanded Burn’s political concept of transforming leadership and subsequently
operationalized it as transformational leadership to apply it to organizational contexts. In
contrast to Burns’ ideas, Bass argued that leaders can simultaneously exhibit both
transformational and transactional leadership behaviors. In addition to Burns’ initial
37
conceptualization, Bass (1985) explained how transformational leadership could be
measured as well as how it could impact the motivation and performance of followers. As
such, Bass explained that the extent to which a leader is transformational is measured in
terms of his/her influence on his/her followers, which is manifested by the fact that
followers have trust, admiration, loyalty, and respect for their leader and are willing to
work harder than originally expected.
Bass (1985) defined the process of transformational leadership as a leadership
process in which leaders demonstrate their ability to transform and inspire followers to
achieve performance beyond the usual limits. According to Bass (1985), transformational
leaders transform the personal interests and goals of their followers into collective
interests and goals. In this collective perspective, transformational leaders transform and
motivate their followers to exceed expectations by offering followers something greater
than just working for self-gain, through a commitment to the four following dimensions
of leader behavior: idealized influence, inspirational motivation, intellectual stimulation,
and individualized consideration (Bass, 1985). As such, transformational leadership can
be summarized as a multidimensional leadership style in which leaders encourage
followers to exceed expectations and focus on collective values and needs in achieving
the bigger picture rather than the individual values and needs of followers (Burawat,
2019).
The four dimensions of transformational leadership include:
Inspirational Motivation
38
Inspirational motivation is manifested in leaders who (a) articulate
reasonable visions that inspire their followers in envisioning attractive future
states, (b) challenge followers with high standards in enhancing performance, (c)
communicate optimism about future goals, and (d) provide meaning to followers’
works and arouse team spirit (Banks, Gooty, Ross, Williams, & Harrington,
2018). In practice, leaders express important goals in simple terms and use
symbols and imagery in their communication to focus group members’ efforts to
achieve organizational goals (Samson & Ilesanmi, 2019). For example, a CEO
may emphasize the prosocial impact and strategic importance of the job by
explaining that the new role of the manager may help the organization and other
employees to ensure the company’s future growth and long-term sustainability
(Hamdani, 2018).
Individualized Consideration
Leaders displaying this behavior pay close attention to the needs and
concerns of each individual follower, act as mentors or coaches to their followers,
and try to understand their followers’ cultural perceptions and shared values, and
how they affect their performance and productivity (Aga, Noorderhaven, &
Vallejo, 2016). This understanding/diagnosis of followers’ individual differences
helps the transformational leader integrate employee mental and emotional
39
participation into the organization’s day-to-day operations and decision-making
processes to optimize the potential and development of each follower (Hamdani,
2018). An example of this type of leadership is a manager who spends time
treating each employee in a caring and unique way. For some employees, the
leader may give strong affiliation or restructure the work to address the
employee’s concerns; for others, the leader may give specific directives with a
high degree of structure (Northouse, 2018).
Intellectual Stimulation
Leaders who demonstrate intellectual stimulation behavior encourage
innovation and creativity in their followers by (a) challenging assumptions to
abandon unnecessary processes and practices, (b) reframing problems, (c)
proposing new ways of seeing old situations, and (d) highlighting the big picture
(Adanri & Singh, 2016). In practice, an intellectually stimulating leader avoids
publicly criticizing the mistakes of followers and promotes intelligence,
rationality, logical thinking, careful problem solving, and risk-taking for long-
term organizational success (Northouse, 2018). For intellectually stimulating
leaders, learning is a value and unforeseen situations are viewed as learning
opportunities (Feniser & Sadeh, 2017). Examples of this type of behavior include
(a) a CEO who consults with senior managers to develop new and effective
practices to achieve broader organizational objectives and (b) a manager who
40
promotes workers’ individual efforts to develop unique ways of solving problems
that have caused production slowdowns (Northouse, 2018).
Idealized influence
Idealized influence is manifested in leaders who (a) behave as role models
for their followers by demonstrating high standards of ethical and moral conduct
and avoiding the use of power for personal gain, (b) instill pride in and among the
group, and (c) gain respect and trust (Northouse, 2018). Examples of this type of
behavior include setting an example of courage and dedication, and making self-
sacrifices for the benefit of the group or organization. Idealized influence can be
considered as a culmination of the other three dimensions of transformational
leadership, combined with the fact that it denotes a strong emotional connection
of followers with their leader (Allen et al., 2016). Leaders who exert idealized
influence over followers develop much personal power and influence with their
followers and are often described as charismatic leaders. As such, idealized
influence refers to as an ethical charisma in which followers identify with and
emulate their leaders (Change, Linge, & Sikalieh, 2019). This charismatic
dimension of transformational leadership is divided into behavioral and attributed
idealized influence (Banks et al., 2018). The attributional component of idealized
influence refers to the socialized charisma of leaders or the attributions of leaders
made by followers based on perceptions they have of their leaders as being
trustful and powerful, and as people focusing on higher order ideals and ethics
(Banks et al., 2018). The behavioral component of idealized influence refers to
41
the observations made by followers on the behavior of their leader on his/her
charismatic actions centered on values, beliefs, and a sense of mission
(Northouse, 2018).
Transformational leaders use the above four behaviors to create an organizational
culture in which the vision, mission, and values of the organization are constantly
evaluated, and adaptation to organizational/cultural change is encouraged (Mutali, 2017).
With an emphasis on organizational change, Smith et al. (2004) recommended that
leaders should adopt a transformational leadership style at the early/birth/initial growth
and late/decline stages of an organization’s life cycle, when adaptation or revolutionary
change is particularly necessary. As many industries in Africa are characterized by rapid
change, fierce competition (Pillay, Flotman, & Mitonga-Monga, 2019), organizational
leaders have displayed the four transformational leadership behaviors in some African
countries (Waziri, Ali, & Aliagha, 2015). The study was conducted to investigate the
relationship between transformational leadership and employee job satisfaction to cope
with the intense external pressure within organizations, which depends on adaptation to
market trends and industry innovations.
Transactional leadership. Unlike transformational leadership, transactional
leadership is a leadership practice in which leaders motivate their followers through the
exchange of resources to fulfill low-order follower needs (Günzel-Jensen, Hansen,
Jakobsen, & Wulff, 2017). As its name suggests, the concept of transactional leadership
suggests that there is a transaction between leaders and followers related to an economic
or social exchange for praise, resources, rewards, or for the avoidance of disciplinary
42
action by the leader in return for contracted services rendered by followers (Bass, 1985).
As such, transactional leadership is psychologically contractual in nature through
transactional or task-based interactions (Nazarian, Atkinson, Foroudi, & Dennis, 2019).
Transactional leadership is based on a leader’s bureaucratic or positional authority over
followers in which transaction-oriented leaders rely on the use of rewards for satisfactory
performances and punishments for dissatisfactory performances (Chow, Salleh, & Ismail,
2017). Transactional leadership reflects a mechanistic image of organizational behavior
that emphasizes productivity, goals achievement, risk reduction, and maintaining the
status quo through clearly defined rules and goals (Harber & McMaster, 2018). In
practice, the transactional leader clarifies performance expectations, goals, and a pathway
that links the achievement of goals to rewards; and he/she monitors the performance of
followers and takes corrective actions when necessary (Samson & Ilesanmi, 2019).
As transactional leadership motivates followers to achieve in-role task
performance extrinsically through reward exchanges and clarifications of work and work
goals, transactional leadership is less likely to affect followers’ extra-role behaviors and
motivate followers beyond the initial goals set for them (Dartey-Baah & Addo, 2019). By
maintaining the status quo on the goals set out in the contractual agreement between
leaders and followers, transactional leaders fail to significantly develop followers or help
foster organizational/cultural change (Saleh, Nusari, Ameen, & Alrajawy, 2018). With
the focus on leader-follower interactions in their contractual agreement, transactional
leaders are less likely to consider external organizational factors such as potential
situational or environmental issues/changes in an organization (Khan, 2017). This
43
emphasis on transactional goals set out in the contractual agreement between leaders and
their subordinates is also observed in various African organizations (Gitoho, Kamau, &
Muchara, 2016) and even within African consultancy firms (Pillay et al., 2019) that adopt
transactional leadership styles. Gitoho et al. found that transactional leaders within the
South African consulting industry adopted a reward and sanction system in specific
situations when there are urgent matters to be solved or fires that needed to be killed or
dealt with.
As transactional leadership is based on a system of reward and punishment,
transactional leadership can be described in terms of the use of contingent rewards and
management by exception, either as a positive contingent reward or an active or passive
form of management-by-exception, as described below (Bass 1985).
i. Contingent Reward
Contingent reward involves an interaction between the leader and the
follower in which the leader uses rewards, incentives, promises, and praise to
motivate followers to gain their compliance in achieving performance levels
contracted by both parties (Arenas, 2019). As such, transactional leaders lead
employees by fulfilling their own interests that come in different forms of rewards
such as benefits, monetary returns, appraisals, and many other tangible ways
(Khan, 2017). Contingent reward is an exchange process between leaders and
followers in which leaders provide followers a reward for achieving a set target
(e.g., adhering to policy and regulations) and maintaining the status quo (Khan,
2017).
44
ii. Passive Management by Exception
A leader using the passive form of management-by-exception passively
waits for deviances, mistakes, and errors to occur, and then takes corrective
actions (Northouse, 2018). To influence followers’ behavior, the leader intervenes
only after standards have not been met or problems have arisen, and then uses
correction or sanctions in response to unacceptable performance or deviation from
accepted standards (Dajani & Mohamad, 2017). An example of passive
management-by-exception is illustrated in the case where a leader gives an
employee a poor performance appraisal without ever talking with the employee
about his or her past work performance.
iii. Active Management by Exception
A leader using the active form of management-by-exception closely
monitors the work of followers for mistakes or rule violations, and then takes
corrective action (Fischer, 2016). To influence the behavior of followers, the
leader actively monitors task execution for any problems that might arise and uses
corrective methods to maintain current performance levels or accepted standards
(Northouse, 2018). Such leadership is effective in certain situations, such as when
safety is paramount in importance.
Transactional leadership behavior is used to one degree or another by most
leaders. Bass (1985) saw the transactional and transformational leadership dimensions as
complementary rather than contrary to one another. Bass ranked the different leadership
styles in the following way:
45
1. Transformational leaders.
2. Leaders using Contingent Rewards.
3. Leaders using Active Management by Exception.
4. Leaders using Passive Management by Exception.
5. Laissez-faire Leaders or leaders showing an absence of leadership.
Job satisfaction
Job satisfaction concept and definitions.
Although job satisfaction has been conceptualized and defined in a variety of
ways, job satisfaction is a multifaceted construct that includes job satisfaction, work
satisfaction, quality of work life, and well-being at work (Van Saane et al., 2003). Some
scholars (e.g., Judge, Weiss, Kammeyer-Mueller, & Hulin, 2017; Kianto, Vanhala, &
Heilmann, 2018) defined job satisfaction as an employee’s attitude towards work while
others (e.g., Locke, 1969) defined it as an employee’s emotional response to work, which
is based on comparing actual results to desired results. Bowling, Wagner, and Beehr
(2018) argued that job satisfaction can be conceptualized either through (a) the global
satisfaction approach as a worker’s overall attitude toward his/her job or (b) the facet
satisfaction approach as a worker’s attitude towards specific aspects of his/her job.
Rahmat, Ramly, Mallongi, and Kalla (2019) considered many characteristics of the job
and the work environment to define employee job satisfaction as an attitude that people
have about their jobs and the various aspects of their work. Robbins, Coulter, and
DeCenzo (2017) argued that there are three different components that make up an
attitude: the cognitive component (e.g., beliefs, opinions, and knowledge), the affective

46
component (i.e., emotions or feelings), and the behavioral component (e.g., an intent to
behave in a certain way). In Africa, job satisfaction is mainly seen as a positive emotional
state resulting from the assessment of one’s job characteristics or experiences, or as the
degree to which an employee enjoys or feels satisfied with their job (Vigan & Giauque,
2018).
Job satisfaction theories
As job satisfaction is a multifaceted construct that requires the interaction of a
range of behavioral, emotional, and cognitive factors, a number of theoretical approaches
have been developed to explain job satisfaction: content theories and process theories
(Dilig-Ruiz et al., 2018). By reviewing the content theories, Dilig-Ruiz et al. argued that
leaders strive to identify and prioritize the needs, motives, and goals of individuals to
ensure their job satisfaction. Content theories include:
i. Herzberg’s (1968) two-factory theory in which satisfaction is influenced by
motivation/intrinsic factors (e.g., meaningful work, growth prospects,
responsibility, and recognition of achievement) and hygiene/extrinsic factors
(e.g., pay and job security).
ii. Maslow’s (1954) hierarchy of needs in which people are motivated by
fulfilling their needs in a hierarchical order ranging from lower order needs to
higher order needs.
iii. McGregor’s (1960) theory of motivation ‘s theory of motivation in which a
theory X management style requires close and firm supervision of employees
47
and a theory Y management style consists of the willingness of people to
work, achieve their goals, and take responsibility.
In process theories, leaders focus on how motivation, needs, and objectives are
fulfilled (Locke, 1969).
Job satisfaction factors
Given the abundance of job satisfaction theories, there are also numerous factors
that can be considered when determining how satisfied an employee is with his or her
job (Sukriket, 2018). For example, Spector (1997) argued that job satisfaction factors
include many facets of satisfaction such as appreciation, co-workers, fringe benefits,
communication, nature of the work, job conditions, recognition, security,
organization’s policies and procedures, pay, personal growth, promotion, and
supervisory. Similarly, Mosadegh and Yarmohammadian (2006) pointed out that the
factors influencing employee job satisfaction include: degree of professionalism,
wages, fringe benefits, job security, achievement, recognition, communication,
working conditions, job importance, co-workers, organizational climate, interpersonal
relationships, working for a reputable organization, autonomy, supervisory support,
positive affectivity, genetic factors, workplace flexibility, and teamwork. Dilig-Ruiz
et al. (2018) and Muterera, Hemsworth, Baregheh, and Garcia-Rivera (2018)
summarized the determinants of employee job satisfaction into three categories:
individual factors (e.g., age, number of years of experience, educational level), job
factors (e.g., autonomy, job stress, task variety), and organizational factors (e.g.,
team cohesion, organizational structure and climate, workplace training, salary,
48
organization size, and leadership practices). In terms of job satisfaction factors at the
organizational level, Janicijevic, Kovacevic, and Petrovic (2015) identified six factors
that affect job satisfaction such as relationships between colleagues, management
skills, the job itself, rewarding results and creating conditions for achieving them,
working conditions and safety at work, and significant support from the company.
Relationship between leadership styles and employee job satisfaction
Various studies have been conducted to examine the influence of leadership styles
on employee job satisfaction, but the findings are mixed. For example, some research
results indicate a positive relationship between leadership styles (e.g., transactional,
transformational, and servant leadership) and employee job satisfaction, as reported by
Alonderiene and Majauskaite (2016), Barnett (2018), Girma (2016), and Rahmat et al.
(2019). The results of these studies differ from those of the studies by Moslehpour,
Altantsetseg, Mou, and Wong (2019) who found that leadership style has no direct
impact on employee job satisfaction. Conducting the study within a sample of employees
from different companies helped verify previous claims about the relationship between
leadership styles and employee job satisfaction.
Relationship between servant leadership and employee job satisfaction
Given that servant leadership is predominantly a people-centered leadership style
in which servant leaders develop and satisfy their followers’ needs, servant leadership is
positively associated with employee job satisfaction (Eva et al., 2019). Findings of
previous research show the positive effect of servant leadership on job satisfaction, either
directly or through mediating/moderating factors. The positive relationship between
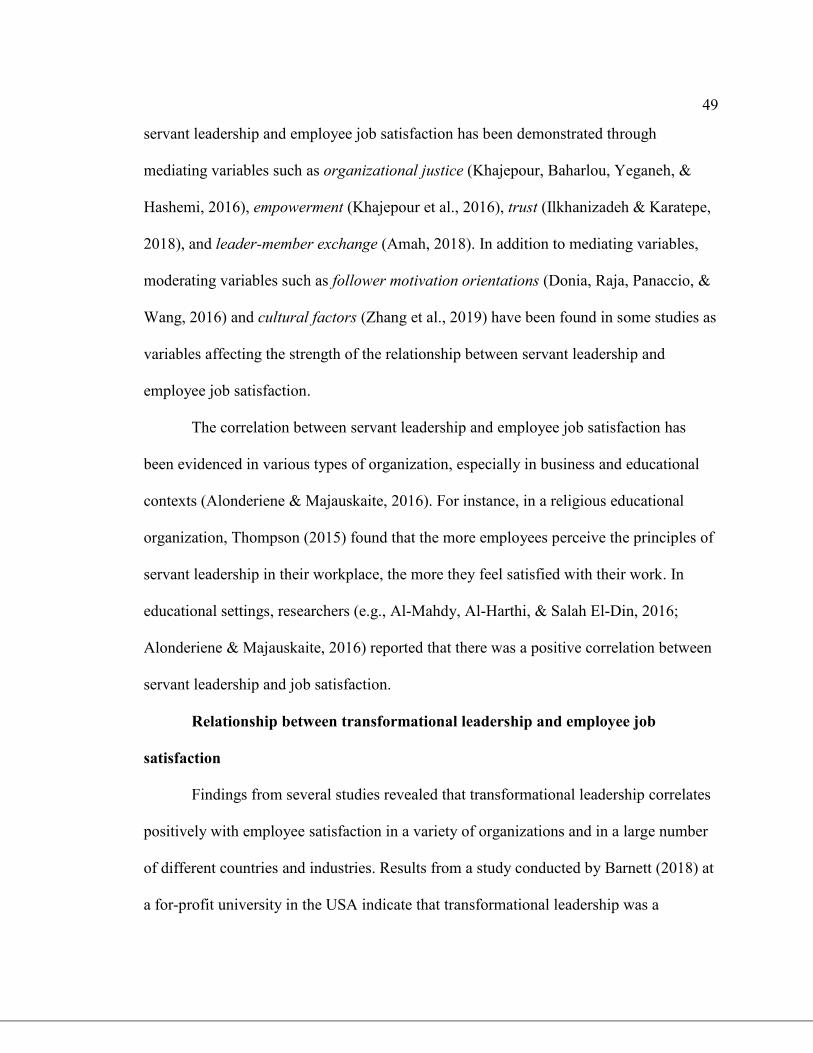
49
servant leadership and employee job satisfaction has been demonstrated through
mediating variables such as organizational justice (Khajepour, Baharlou, Yeganeh, &
Hashemi, 2016), empowerment (Khajepour et al., 2016), trust (Ilkhanizadeh & Karatepe,
2018), and leader-member exchange (Amah, 2018). In addition to mediating variables,
moderating variables such as follower motivation orientations (Donia, Raja, Panaccio, &
Wang, 2016) and cultural factors (Zhang et al., 2019) have been found in some studies as
variables affecting the strength of the relationship between servant leadership and
employee job satisfaction.
The correlation between servant leadership and employee job satisfaction has
been evidenced in various types of organization, especially in business and educational
contexts (Alonderiene & Majauskaite, 2016). For instance, in a religious educational
organization, Thompson (2015) found that the more employees perceive the principles of
servant leadership in their workplace, the more they feel satisfied with their work. In
educational settings, researchers (e.g., Al-Mahdy, Al-Harthi, & Salah El-Din, 2016;
Alonderiene & Majauskaite, 2016) reported that there was a positive correlation between
servant leadership and job satisfaction.
Relationship between transformational leadership and employee job
satisfaction
Findings from several studies revealed that transformational leadership correlates
positively with employee satisfaction in a variety of organizations and in a large number
of different countries and industries. Results from a study conducted by Barnett (2018) at
a for-profit university in the USA indicate that transformational leadership was a
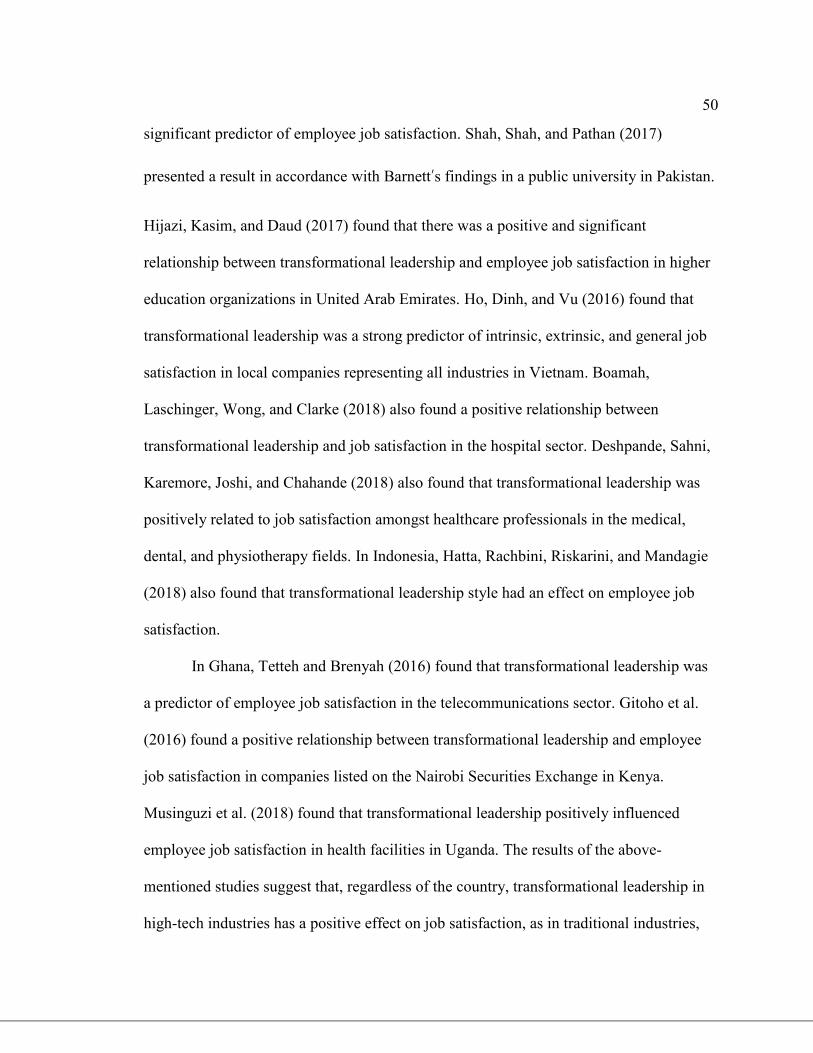
50
significant predictor of employee job satisfaction. Shah, Shah, and Pathan (2017)
presented a result in accordance with Barnett’s findings in a public university in Pakistan.
Hijazi, Kasim, and Daud (2017) found that there was a positive and significant
relationship between transformational leadership and employee job satisfaction in higher
education organizations in United Arab Emirates. Ho, Dinh, and Vu (2016) found that
transformational leadership was a strong predictor of intrinsic, extrinsic, and general job
satisfaction in local companies representing all industries in Vietnam. Boamah,
Laschinger, Wong, and Clarke (2018) also found a positive relationship between
transformational leadership and job satisfaction in the hospital sector. Deshpande, Sahni,
Karemore, Joshi, and Chahande (2018) also found that transformational leadership was
positively related to job satisfaction amongst healthcare professionals in the medical,
dental, and physiotherapy fields. In Indonesia, Hatta, Rachbini, Riskarini, and Mandagie
(2018) also found that transformational leadership style had an effect on employee job
satisfaction.
In Ghana, Tetteh and Brenyah (2016) found that transformational leadership was
a predictor of employee job satisfaction in the telecommunications sector. Gitoho et al.
(2016) found a positive relationship between transformational leadership and employee
job satisfaction in companies listed on the Nairobi Securities Exchange in Kenya.
Musinguzi et al. (2018) found that transformational leadership positively influenced
employee job satisfaction in health facilities in Uganda. The results of the above-
mentioned studies suggest that, regardless of the country, transformational leadership in
high-tech industries has a positive effect on job satisfaction, as in traditional industries,
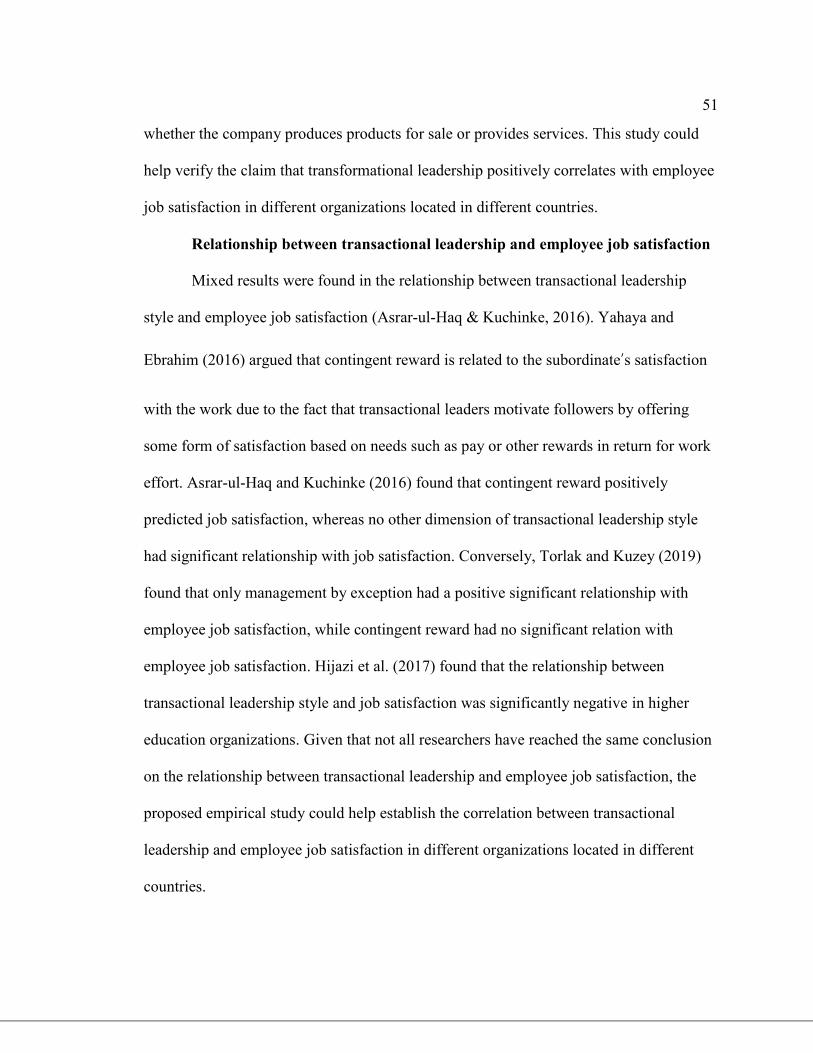
51
whether the company produces products for sale or provides services. This study could
help verify the claim that transformational leadership positively correlates with employee
job satisfaction in different organizations located in different countries.
Relationship between transactional leadership and employee job satisfaction
Mixed results were found in the relationship between transactional leadership
style and employee job satisfaction (Asrar-ul-Haq & Kuchinke, 2016). Yahaya and
Ebrahim (2016) argued that contingent reward is related to the subordinate’s satisfaction
with the work due to the fact that transactional leaders motivate followers by offering
some form of satisfaction based on needs such as pay or other rewards in return for work
effort. Asrar-ul-Haq and Kuchinke (2016) found that contingent reward positively
predicted job satisfaction, whereas no other dimension of transactional leadership style
had significant relationship with job satisfaction. Conversely, Torlak and Kuzey (2019)
found that only management by exception had a positive significant relationship with
employee job satisfaction, while contingent reward had no significant relation with
employee job satisfaction. Hijazi et al. (2017) found that the relationship between
transactional leadership style and job satisfaction was significantly negative in higher
education organizations. Given that not all researchers have reached the same conclusion
on the relationship between transactional leadership and employee job satisfaction, the
proposed empirical study could help establish the correlation between transactional
leadership and employee job satisfaction in different organizations located in different
countries.
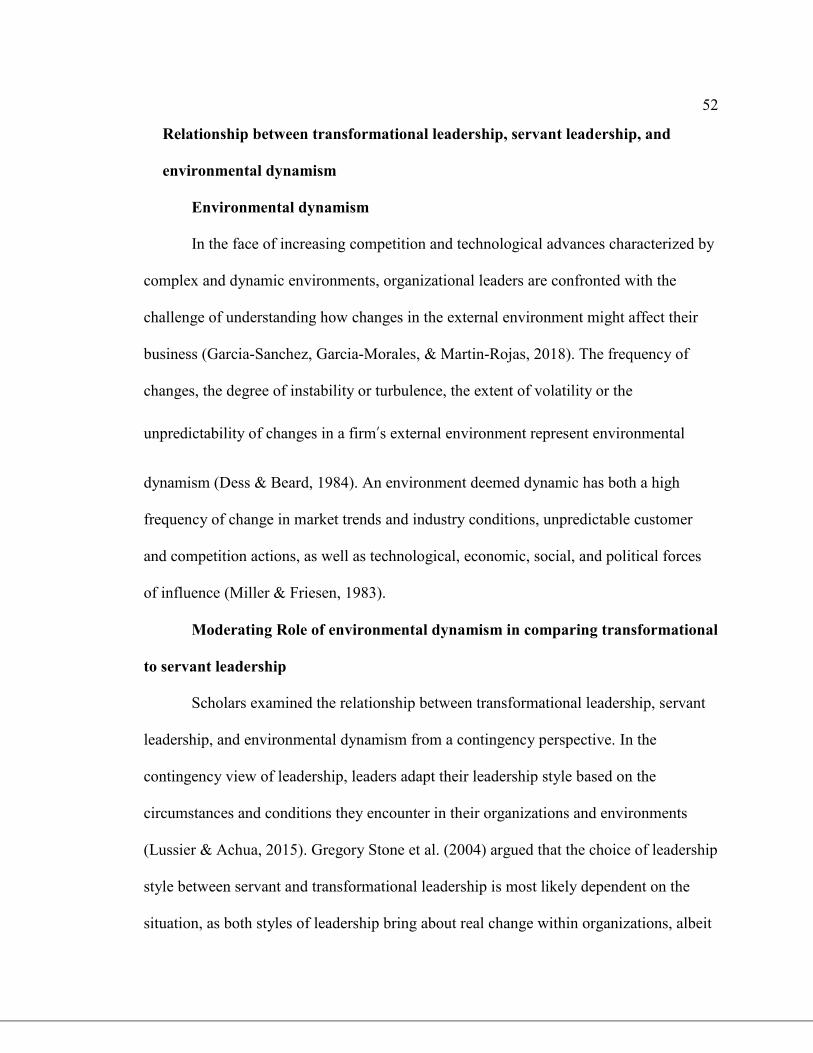
52
Relationship between transformational leadership, servant leadership, and
environmental dynamism
Environmental dynamism
In the face of increasing competition and technological advances characterized by
complex and dynamic environments, organizational leaders are confronted with the
challenge of understanding how changes in the external environment might affect their
business (Garcia-Sanchez, Garcia-Morales, & Martin-Rojas, 2018). The frequency of
changes, the degree of instability or turbulence, the extent of volatility or the
unpredictability of changes in a firm’s external environment represent environmental
dynamism (Dess & Beard, 1984). An environment deemed dynamic has both a high
frequency of change in market trends and industry conditions, unpredictable customer
and competition actions, as well as technological, economic, social, and political forces
of influence (Miller & Friesen, 1983).
Moderating Role of environmental dynamism in comparing transformational
to servant leadership
Scholars examined the relationship between transformational leadership, servant
leadership, and environmental dynamism from a contingency perspective. In the
contingency view of leadership, leaders adapt their leadership style based on the
circumstances and conditions they encounter in their organizations and environments
(Lussier & Achua, 2015). Gregory Stone et al. (2004) argued that the choice of leadership
style between servant and transformational leadership is most likely dependent on the
situation, as both styles of leadership bring about real change within organizations, albeit
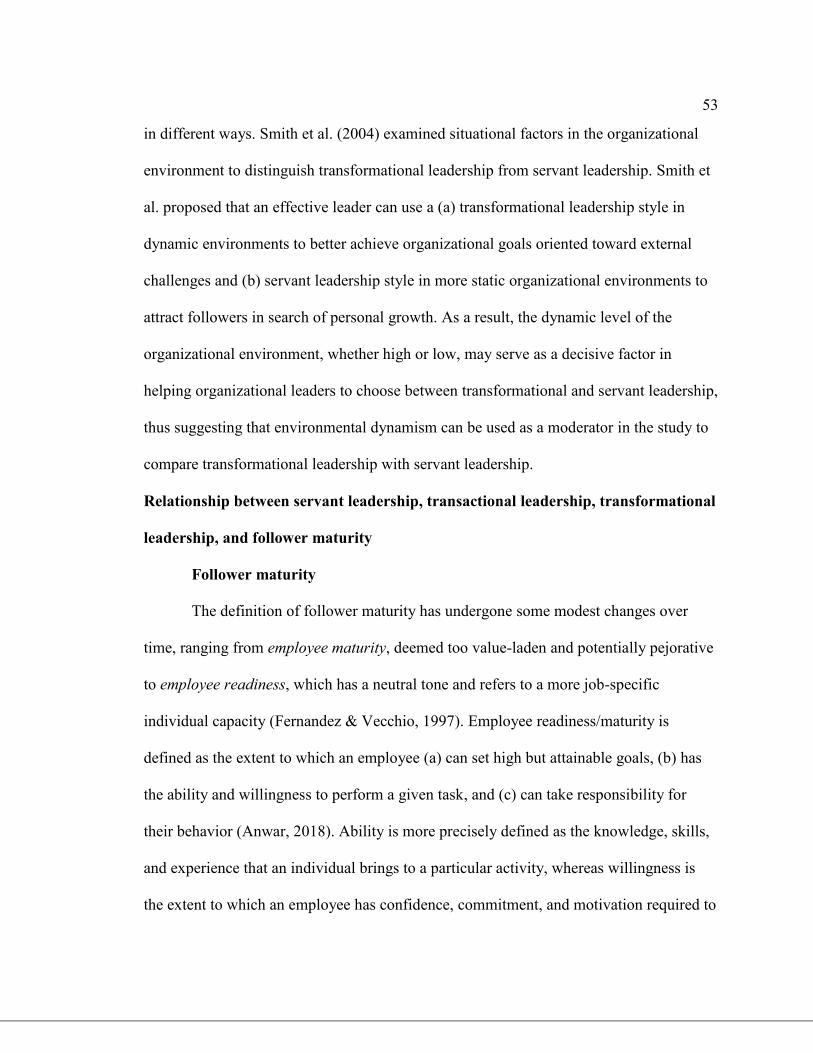
53
in different ways. Smith et al. (2004) examined situational factors in the organizational
environment to distinguish transformational leadership from servant leadership. Smith et
al. proposed that an effective leader can use a (a) transformational leadership style in
dynamic environments to better achieve organizational goals oriented toward external
challenges and (b) servant leadership style in more static organizational environments to
attract followers in search of personal growth. As a result, the dynamic level of the
organizational environment, whether high or low, may serve as a decisive factor in
helping organizational leaders to choose between transformational and servant leadership,
thus suggesting that environmental dynamism can be used as a moderator in the study to
compare transformational leadership with servant leadership.
Relationship between servant leadership, transactional leadership, transformational
leadership, and follower maturity
Follower maturity
The definition of follower maturity has undergone some modest changes over
time, ranging from employee maturity, deemed too value-laden and potentially pejorative
to employee readiness, which has a neutral tone and refers to a more job-specific
individual capacity (Fernandez & Vecchio, 1997). Employee readiness/maturity is
defined as the extent to which an employee (a) can set high but attainable goals, (b) has
the ability and willingness to perform a given task, and (c) can take responsibility for
their behavior (Anwar, 2018). Ability is more precisely defined as the knowledge, skills,
and experience that an individual brings to a particular activity, whereas willingness is
the extent to which an employee has confidence, commitment, and motivation required to
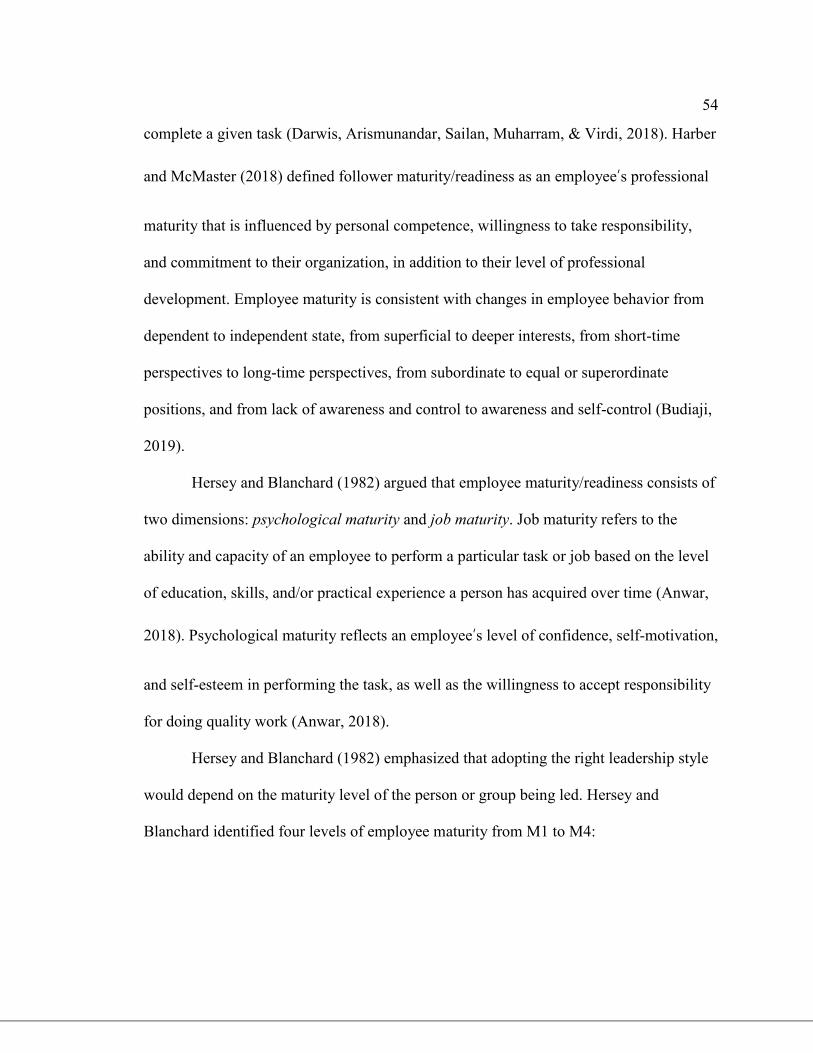
54
complete a given task (Darwis, Arismunandar, Sailan, Muharram, & Virdi, 2018). Harber
and McMaster (2018) defined follower maturity/readiness as an employee’s professional
maturity that is influenced by personal competence, willingness to take responsibility,
and commitment to their organization, in addition to their level of professional
development. Employee maturity is consistent with changes in employee behavior from
dependent to independent state, from superficial to deeper interests, from short-time
perspectives to long-time perspectives, from subordinate to equal or superordinate
positions, and from lack of awareness and control to awareness and self-control (Budiaji,
2019).
Hersey and Blanchard (1982) argued that employee maturity/readiness consists of
two dimensions: psychological maturity and job maturity. Job maturity refers to the
ability and capacity of an employee to perform a particular task or job based on the level
of education, skills, and/or practical experience a person has acquired over time (Anwar,
2018). Psychological maturity reflects an employee’s level of confidence, self-motivation,
and self-esteem in performing the task, as well as the willingness to accept responsibility
for doing quality work (Anwar, 2018).
Hersey and Blanchard (1982) emphasized that adopting the right leadership style
would depend on the maturity level of the person or group being led. Hersey and
Blanchard identified four levels of employee maturity from M1 to M4:
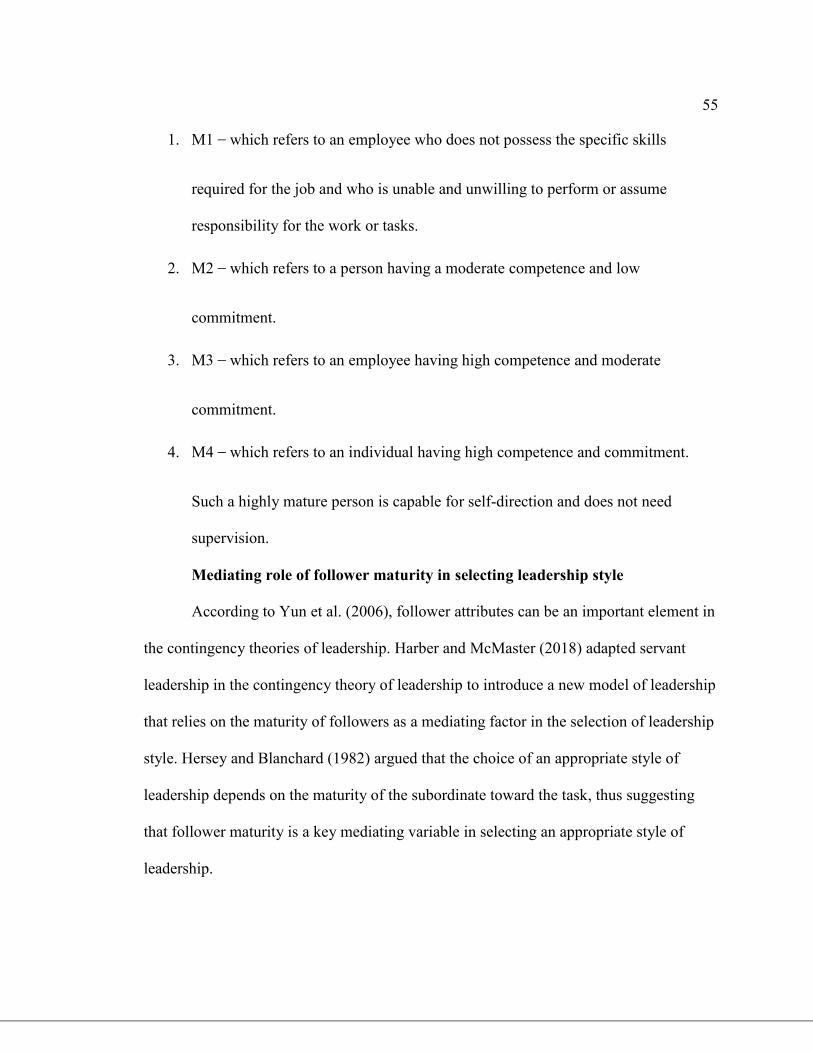
55
1. M1 – which refers to an employee who does not possess the specific skills
required for the job and who is unable and unwilling to perform or assume
responsibility for the work or tasks.
2. M2 – which refers to a person having a moderate competence and low
commitment.
3. M3 – which refers to an employee having high competence and moderate
commitment.
4. M4 – which refers to an individual having high competence and commitment.
Such a highly mature person is capable for self-direction and does not need
supervision.
Mediating role of follower maturity in selecting leadership style
According to Yun et al. (2006), follower attributes can be an important element in
the contingency theories of leadership. Harber and McMaster (2018) adapted servant
leadership in the contingency theory of leadership to introduce a new model of leadership
that relies on the maturity of followers as a mediating factor in the selection of leadership
style. Hersey and Blanchard (1982) argued that the choice of an appropriate style of
leadership depends on the maturity of the subordinate toward the task, thus suggesting
that follower maturity is a key mediating variable in selecting an appropriate style of
leadership.
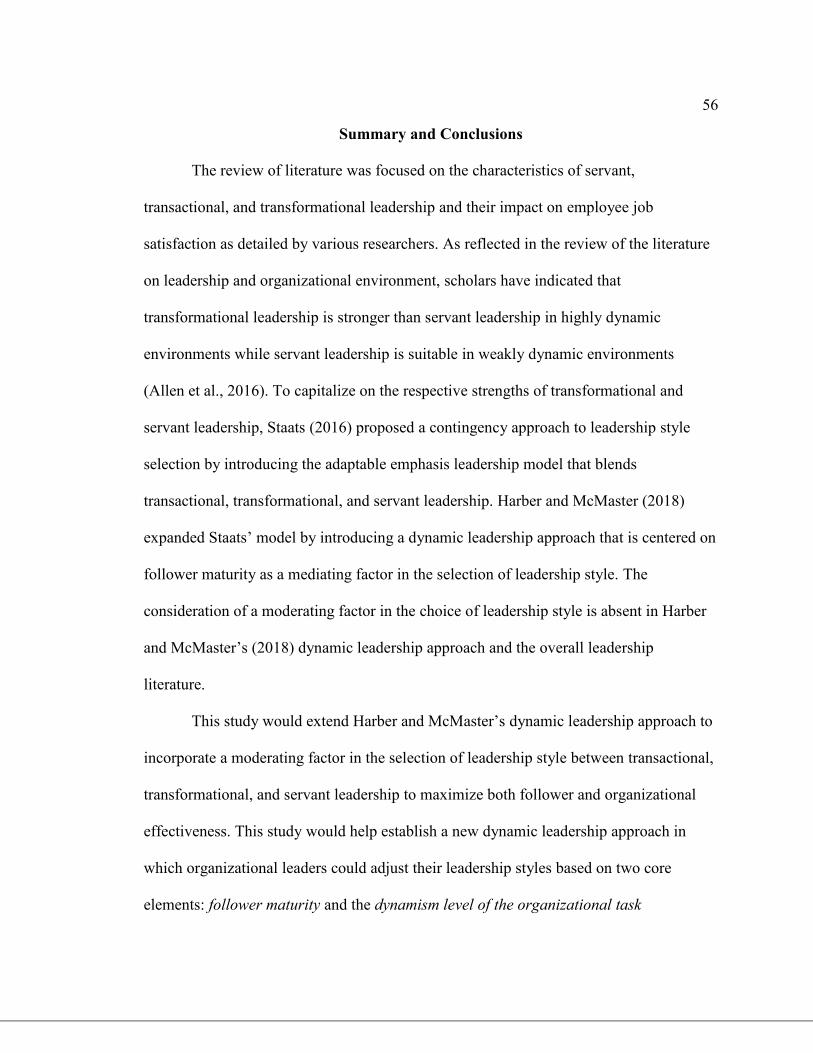
56
Summary and Conclusions
The review of literature was focused on the characteristics of servant,
transactional, and transformational leadership and their impact on employee job
satisfaction as detailed by various researchers. As reflected in the review of the literature
on leadership and organizational environment, scholars have indicated that
transformational leadership is stronger than servant leadership in highly dynamic
environments while servant leadership is suitable in weakly dynamic environments
(Allen et al., 2016). To capitalize on the respective strengths of transformational and
servant leadership, Staats (2016) proposed a contingency approach to leadership style
selection by introducing the adaptable emphasis leadership model that blends
transactional, transformational, and servant leadership. Harber and McMaster (2018)
expanded Staats’ model by introducing a dynamic leadership approach that is centered on
follower maturity as a mediating factor in the selection of leadership style. The
consideration of a moderating factor in the choice of leadership style is absent in Harber
and McMaster’s (2018) dynamic leadership approach and the overall leadership
literature.
This study would extend Harber and McMaster’s dynamic leadership approach to
incorporate a moderating factor in the selection of leadership style between transactional,
transformational, and servant leadership to maximize both follower and organizational
effectiveness. This study would help establish a new dynamic leadership approach in
which organizational leaders could adjust their leadership styles based on two core
elements: follower maturity and the dynamism level of the organizational task

57
environment. The first half of the proposed dynamic leadership approach is related to a
leader that adapts to its audience/followers in terms of follower maturity. The second half
of the proposed dynamic leadership approach consists of leaders who adapt to the
organizational situation or the dynamism of the organizational environment. Examining
both the maturity of followers and the dynamism of the organizational environment in a
new dynamic leadership approach suggests using a more scientifically rigorous approach
and developing a methodology to fill the gap in the literature, which is addressed in
Chapter 3.
58
Chapter 3: Research Method
The purpose of this quantitative non-experimental correlation research study was
to examine the relationship between servant, transactional, and transformational
leadership styles and employee job satisfaction within organizations. A specific purpose
of the study was to examine to what extent, if any, (a) follower maturity mediates the
relationship between leadership styles and employee job satisfaction, and (b) the
dynamism of the organizational environment moderates the relationship between
leadership styles and employee job satisfaction within organizations. In this chapter, I
provide details on how the research purpose was achieved by discussing the research
methodology and providing a detailed explanation of the research design of the study and
the rationale behind my selection of the research design. Specifically, this chapter
encompasses the research design and rationale, the study population, the sample and
sampling procedures, the data collection approach and strategy, instrumentation and
operationalization of constructs, data analysis plan, potential threats to validity, and
ethical procedures. In the concluding section of Chapter 3, I provide a summary and
introduction to Chapter 4.
Research Design and Rationale
Variables
The independent variables for the study were transformational, transactional, and
servant leadership styles. The dependent variable for the study was employee job
satisfaction, as measured by the JSS instrument to assess the job satisfaction level of
employees (Spector, 1997). The moderating variable that may help moderate the strength
59
of the relationship between leadership styles and employee job satisfaction in the second
research question was the dynamism of the organizational environment, as measured by
Akgun et al.’s (2008) scale. The mediating variable that may help mediate the
relationship between leadership styles and employee job satisfaction in the third research
question was follower maturity, as measured by the employee readiness scale (Fernandez
& Vecchio, 1997).
Research Approach
The quantitative research approach was selected for the study based on the
following rationales: (a) the research questions and hypotheses suggest that a relationship
exists between the variables leadership styles and employee job satisfaction, (b) the study
purpose requires a deductive approach to test existing theories and not developing new
ones, and (c) the goal of the study was to numerically quantify the extent to which
leadership styles are related to employee job satisfaction (Burkholder et al., 2016). As the
specific problem of the study was the difficulty of determining the leadership styles that
adequately suit employees to improve their level of job satisfaction in both stable and
turbulent work environments, this problem statement suggested adopting a quantitative
research approach. The need to improve employee job satisfaction suggested measuring
the satisfaction level of employees and checking whether it was improving. This in turn
suggested quantifying employee attitudes toward their satisfaction at work, that is,
quantifying the problem by generating numerical data or data that can be transformed
into usable statistics. This quantification of the problem informed the need to use
quantitative research approach, as pointed out by Burkholder et al. (2016).
60
The qualitative research approach was not chosen for the study on the basis of the
following arguments: (a) the research questions did not begin with how and what, (b) the
study purpose did not require the exploration of a phenomenon in which there is a lack of
theory, and (c) words in the research questions were not more indicative of the meanings
that people ascribe to societal or human problems (Ravitch & Carl, 2016). The research
study was not exploratory in nature, as it was not intended to build a leadership
framework that provides in-depth analysis and understanding of how individuals
construct their worldview of job satisfaction and what styles of leadership may be needed
by employees. The goal of the study was to examine a potential relationship between
leadership styles and employee job satisfaction, as opposed to exploring the meanings
that people ascribe to the reportedly low levels of job satisfaction in their organization.
As the purpose of the study and problem statement did not align with the qualitative
research approach, I eliminated the qualitative research approach as a possible research
approach for the study.
I considered applying a mixed methods approach as an alternative research
approach, but this approach was not fully qualified to truly answer the research questions
of the study. As the words used in the research questions did not indicate the need to both
explore the meaning that people attribute to the phenomenon under study and understand
the relationship between the variables of the study, the mixed methods approach was not
adequate for the study (Barnes, 2019). Because the mixed-methods approach
encompasses both qualitative and quantitative approaches, it is a time-consuming method
that requires more resource constraints (e.g., cost, research skills) than the qualitative or
61
quantitative method (Barnes, 2019). The elimination of qualitative and mixed methods
approaches implied that the type of study best suited to answer the research questions of
the study was quantitative.
Research Design
A non-experimental correlational design was utilized for the quantitative study to
examine the relationship between leadership styles and employee job satisfaction. Such a
non-experimental design choice was appropriate for the study because its purpose was to
determine if there is a relationship between leadership styles and employee job
satisfaction without controlling and/or manipulating the variables and conditions of the
study (Burkholder et al., 2016). The fact that the specific problem underlines the
difficulty of determining the leadership styles that adequately suit employees suggests
that this situation currently exists, thus suggesting using a research design that helps to
obtain facts or to make judgments about existing situations and not to look for cause and
effect relationships. Other quantitative research designs, such as true experimental and
quasi-experimental designs, are appropriate when the researcher is seeking cause and
effect relationships among the study variables (Burkholder et al., 2016), which was not
the objective of the study. Rather than true experimental and quasi-experimental research
designs, a non-experimental research design was considered the most appropriate design
choice for the study because the manipulation of explanatory variables under treatment
conditions was not necessary to answer the research questions (Barnes, 2019). As the
purpose of the study was not to establish a cause and effect relationship, but to examine
62
whether there was a relationship between leadership styles and employee job satisfaction,
a non-experimental design was appropriate to answer the research questions.
Among the non-experimental research designs, which are typically descriptive
and, at best, correlational, a correlational design was more appropriate for the study
because the goal of the study was to examine the extent to which servant, transactional,
and transformational leadership styles could be correlated with employee job satisfaction
(Barnes, 2019). A descriptive research design is particularly useful when researchers seek
to describe the sample population to develop a deeper understanding (Heppner,
Wampold, Owen, Thompson, & Wang, 2015). A descriptive research design was not the
best option for this non-experimental research study because the purpose of the study was
to define the relationship between independent and dependent variables rather than
limiting the study to a description of the sample population. Determining the presence of
a relationship between variables was most appropriate via a correlational design, which
also has the advantages of not having time or resource constraints. Such advantages for
the study included: (a) easy access to participants to sample the population at a low cost,
(b) greater anonymity and reduction of bias errors, and (c) a low risk of ethical breach
(Barnes, 2019).
Methodology
This section includes the logic used to select participants; the instruments utilized
to collect data; the procedures for recruitment, participation, and data collection; and the
plan for analyzing the data.
63
Population
A study population can be defined in two ways: theoretical and accessible
(Trochim, Donnelly, and Arora, 2016). The theoretical population is the population of
interest for which the researcher wishes to generalize the results of the study while the
accessible population is the subset of the larger population or the final sample that the
researcher can access to actually measure the study variables (Trochim et al.). For this
study, the theoretical population includes the global workforce. Due to the difficulty of
developing a reasonable sampling plan for the entire target population, the accessible
population was made up of a population of U.S. employees and other adult employees
worldwide accessible through social media groups, Qualtrics panel audience, and the
Walden participant pool. Employees working in different industries were grouped into
the following five categories: non-management staff, middle management (supervisor,
team leader, manager...), senior management, top management (directors, general
managers), and chief/top executives (CEO, vice-president, senior partners, president,
etc.). The total estimated population for the employed adult U.S. workforce is over
152,388,000 (Bureau of Labor Statistics, 2017). The overall population for this study was
difficult to predict because of the difficulty of reliably consolidating the adult workforce
worldwide. More specifically, the proliferation of connections in social networks makes
it difficult to estimate the population of adult employees recruited via social media
channels.
The Walden participant pool is made up of volunteer university faculty and
students who wish to participate in various research opportunities. The reason for adding
64
the participation pool was to stimulate additional responses. The population from my
social media (Facebook, WhatsApp, and LinkedIn) accounts included personal friends,
academic colleagues, immediate and extended family members, acquaintances, and
coworkers (contacted privately and outside their company). Due to a potential risk of low
participation rate from the Walden pool and social media channels, I considered using
qualified volunteers from the Qualtrics panel audience (e.g., employed U.S. workforce).
Sampling and Sampling Procedures
Sample frame. Adequately drawing the sample frame from an entire population
ensures an equal chance of being selected for each member of the study population.
Trochim et al. (2016) recommended that obtaining an adequate sample frame requires an
assessment of the sample to verify its completeness, its effectiveness, and the likelihood
that each individual sample is adequately represented in the selected population. For this
study, the list of adult employees located in the United States and other countries
constitutes the sample frame, that is, the practical population from which the sample was
determined.
Sampling strategy. Given that participants in the Qualtrics panel and the Walden
pool were conveniently accessible and available to participate in the study and that the
participants accessed via social networks were difficult to find in a specific place, I used
convenience and snowball sampling to contact adult employees working in different
organizations around the world. This sampling design was chosen for four main reasons.
First, the sample population composing the sampling frame was impossible to define in
the world population and was selected in a non-systematic process that did not guarantee

65
equal chances for each participant in the target population, thus suggesting the adoption
of non-probability sampling methods for this study (Trochim et al., 2016). The
participants selected from the Walden pool, the Qualtrics panel, and my referrals were
gathered in a process that did not give all adult employees of the world an equal
opportunity to be selected in their respective countries and industries. Second,
participants recruited from the Walden pool and the Qualtrics panel were conveniently
available to participate in the study because of their accessibility and proximity
previously defined and organized with Walden University and Qualtrics XM respectively,
which then facilitated an efficient recruitment of participants in less time to make the use
of convenience sampling appropriate (Trochim et al., 2016). Third, given that I had a
previously established relationship with some of my contacts on social media (Facebook,
WhatsApp, and LinkedIn) who were eligible to participate in this study and volunteered
to recruit more eligible participants, the use of snowball sampling was an appropriate
sampling choice for this study. As such, some personal friends, academic colleagues,
family members, and professional colleagues (contacted via social media privately and
outside their company) were accessible participants who could recruit additional eligible
participants from their social networks to increase the study participation rate like a
rolling snowball. To reduce the bias of the study participants in the snowball sampling
strategy, I planned to inform my referral friends not to transmit the survey to participants
to whom they have any influence (e.g., their subordinates or relatives), and I refrained
from asking or knowing the identity of the participants contacted by my referral friends.
Fourth, given that there was no reliable way of knowing the total size of the adult
66
employee population in the world, snowball sampling was also an appropriate sampling
strategy to locate adult employees around the world with less money and time.
Convenience and snowball sampling methods formed the most appropriate sampling
design for this study because of the nature of the design, the parameters of the study, and
the accessibility of the population via the audience of the Qualtrics panel, the Walden
pool, and my referrals’ social networks.
Among the non-probability sampling methods, the judgmental sampling or
purposive sampling strategy was not selected as the main sampling strategy for this study
because there was no judgment criterion to believe that some adult employees were more
fit for the research compared to other individuals for representing the population
(Trochim et al., 2016). Trochim et al. argued that the researcher should have a specific
purpose in mind to deliberately choose participants by seeking one or more specific types
of people or groups, which was inadequate for the purpose of this study which sought to
examine the leadership styles that help influence employee job satisfaction without
mentioning specific demographic characteristics of the population (like gender, location,
organization). Although snowball sampling could be considered as a sub-category of
purposive sampling methods, convenience and snowball sampling strategies were
particularly suitable for this study due to the difficulty of reaching inaccessible or hard-
to-find adult populations around the world (Trochim et al., 2016). Such a challenge of
inaccessibility to adult populations worldwide had become manageable with the help of
my referral contacts (via social media) and research participation platforms (Walden pool
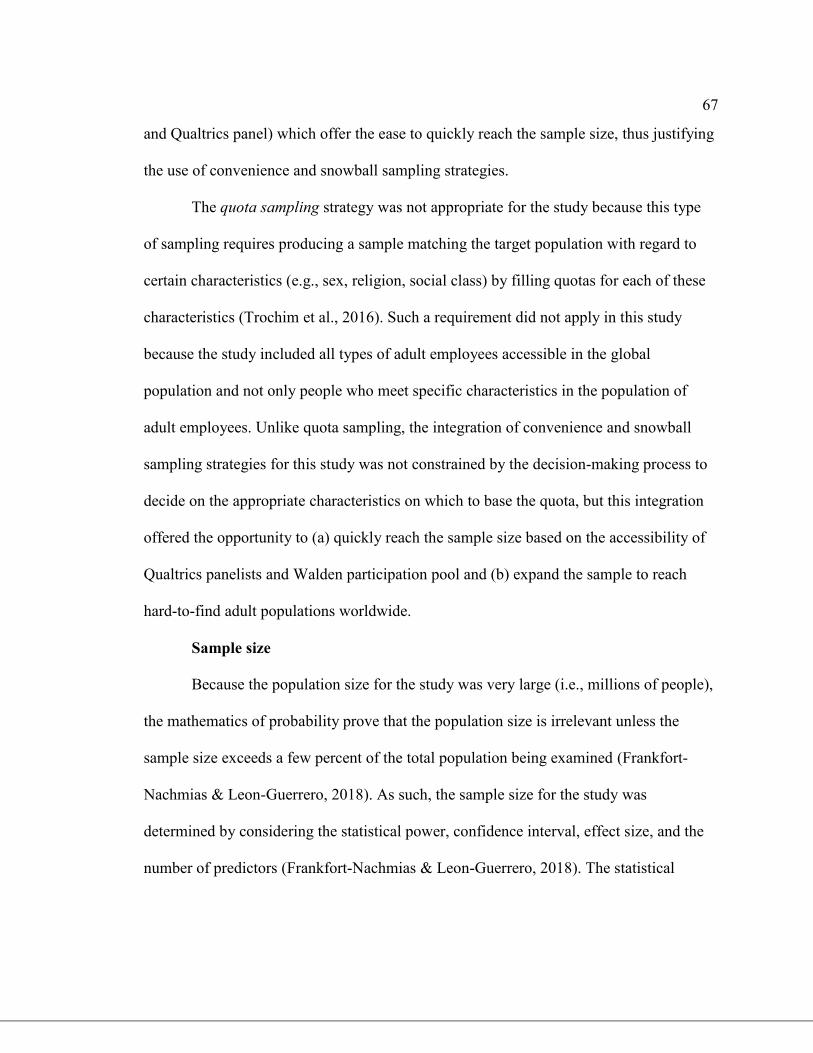
67
and Qualtrics panel) which offer the ease to quickly reach the sample size, thus justifying
the use of convenience and snowball sampling strategies.
The quota sampling strategy was not appropriate for the study because this type
of sampling requires producing a sample matching the target population with regard to
certain characteristics (e.g., sex, religion, social class) by filling quotas for each of these
characteristics (Trochim et al., 2016). Such a requirement did not apply in this study
because the study included all types of adult employees accessible in the global
population and not only people who meet specific characteristics in the population of
adult employees. Unlike quota sampling, the integration of convenience and snowball
sampling strategies for this study was not constrained by the decision-making process to
decide on the appropriate characteristics on which to base the quota, but this integration
offered the opportunity to (a) quickly reach the sample size based on the accessibility of
Qualtrics panelists and Walden participation pool and (b) expand the sample to reach
hard-to-find adult populations worldwide.
Sample size
Because the population size for the study was very large (i.e., millions of people),
the mathematics of probability prove that the population size is irrelevant unless the
sample size exceeds a few percent of the total population being examined (Frankfort-
Nachmias & Leon-Guerrero, 2018). As such, the sample size for the study was
determined by considering the statistical power, confidence interval, effect size, and the
number of predictors (Frankfort-Nachmias & Leon-Guerrero, 2018). The statistical
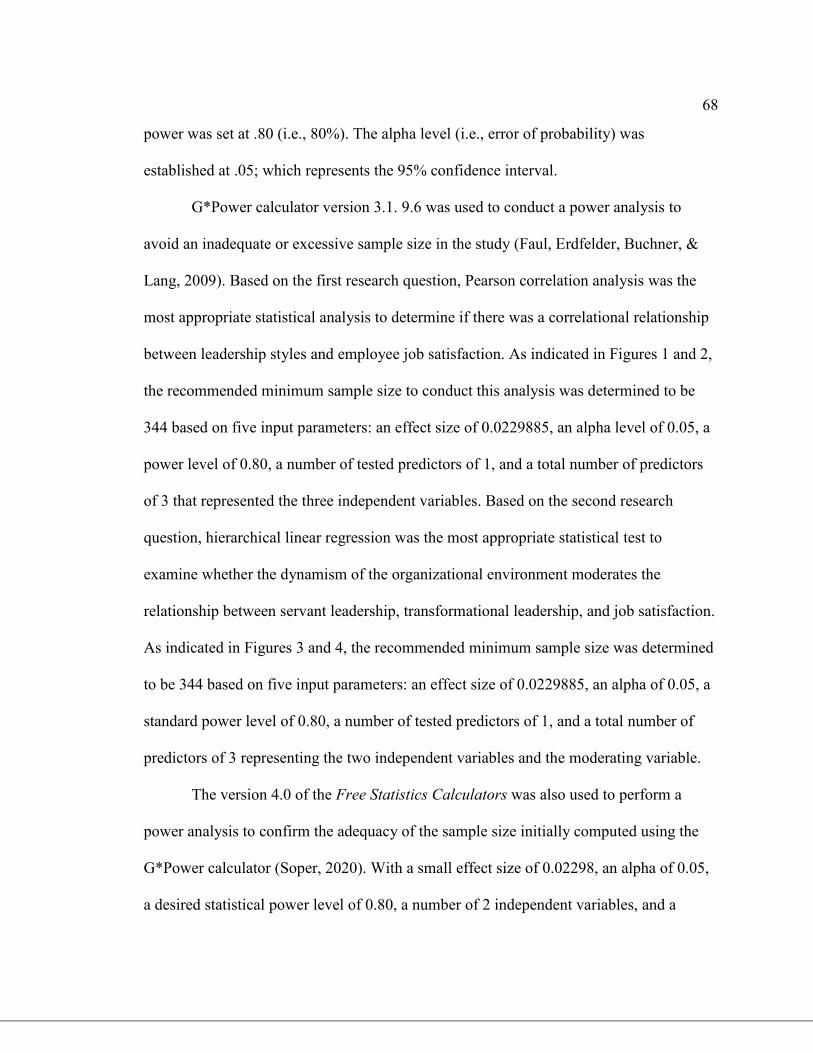
68
power was set at .80 (i.e., 80%). The alpha level (i.e., error of probability) was
established at .05; which represents the 95% confidence interval.
G*Power calculator version 3.1. 9.6 was used to conduct a power analysis to
avoid an inadequate or excessive sample size in the study (Faul, Erdfelder, Buchner, &
Lang, 2009). Based on the first research question, Pearson correlation analysis was the
most appropriate statistical analysis to determine if there was a correlational relationship
between leadership styles and employee job satisfaction. As indicated in Figures 1 and 2,
the recommended minimum sample size to conduct this analysis was determined to be
344 based on five input parameters: an effect size of 0.0229885, an alpha level of 0.05, a
power level of 0.80, a number of tested predictors of 1, and a total number of predictors
of 3 that represented the three independent variables. Based on the second research
question, hierarchical linear regression was the most appropriate statistical test to
examine whether the dynamism of the organizational environment moderates the
relationship between servant leadership, transformational leadership, and job satisfaction.
As indicated in Figures 3 and 4, the recommended minimum sample size was determined
to be 344 based on five input parameters: an effect size of 0.0229885, an alpha of 0.05, a
standard power level of 0.80, a number of tested predictors of 1, and a total number of
predictors of 3 representing the two independent variables and the moderating variable.
The version 4.0 of the Free Statistics Calculators was also used to perform a
power analysis to confirm the adequacy of the sample size initially computed using the
G*Power calculator (Soper, 2020). With a small effect size of 0.02298, an alpha of 0.05,
a desired statistical power level of 0.80, a number of 2 independent variables, and a
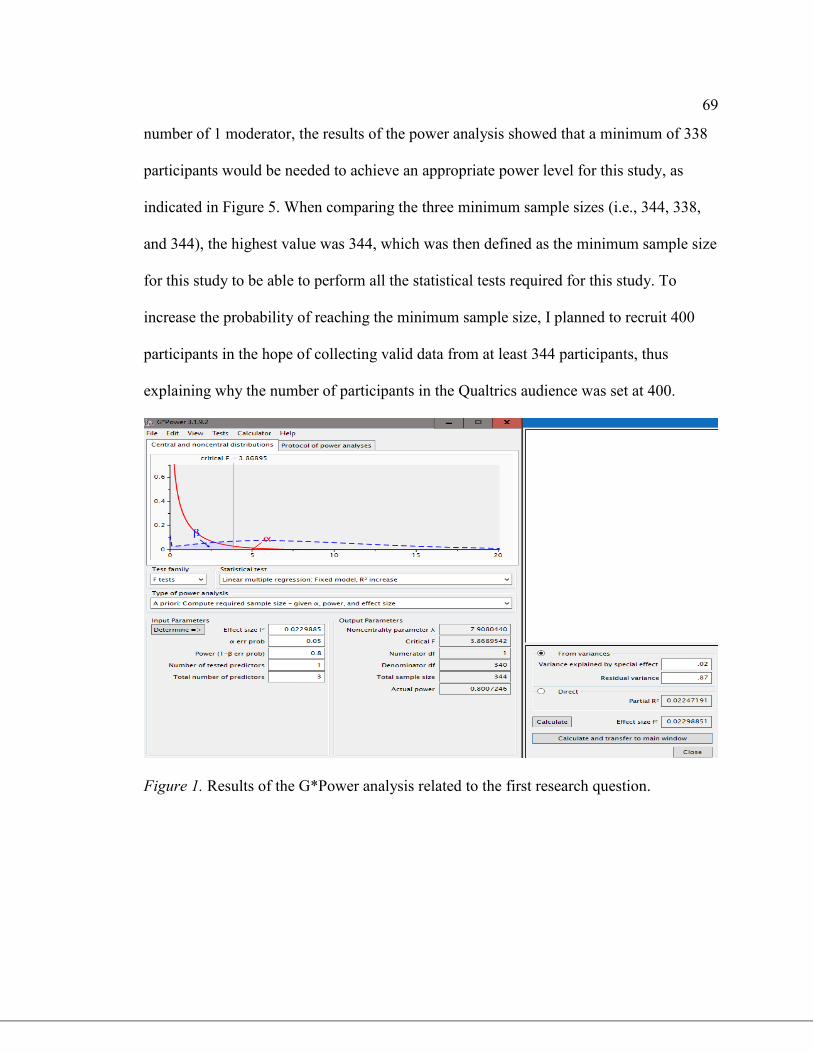
69
number of 1 moderator, the results of the power analysis showed that a minimum of 338
participants would be needed to achieve an appropriate power level for this study, as
indicated in Figure 5. When comparing the three minimum sample sizes (i.e., 344, 338,
and 344), the highest value was 344, which was then defined as the minimum sample size
for this study to be able to perform all the statistical tests required for this study. To
increase the probability of reaching the minimum sample size, I planned to recruit 400
participants in the hope of collecting valid data from at least 344 participants, thus
explaining why the number of participants in the Qualtrics audience was set at 400.
Figure 1. Results of the G*Power analysis related to the first research question.
70
Figure 2. G*Power statistical graph related to the first research question.
Figure 3. Results of the G*Power analysis related to the second research question.
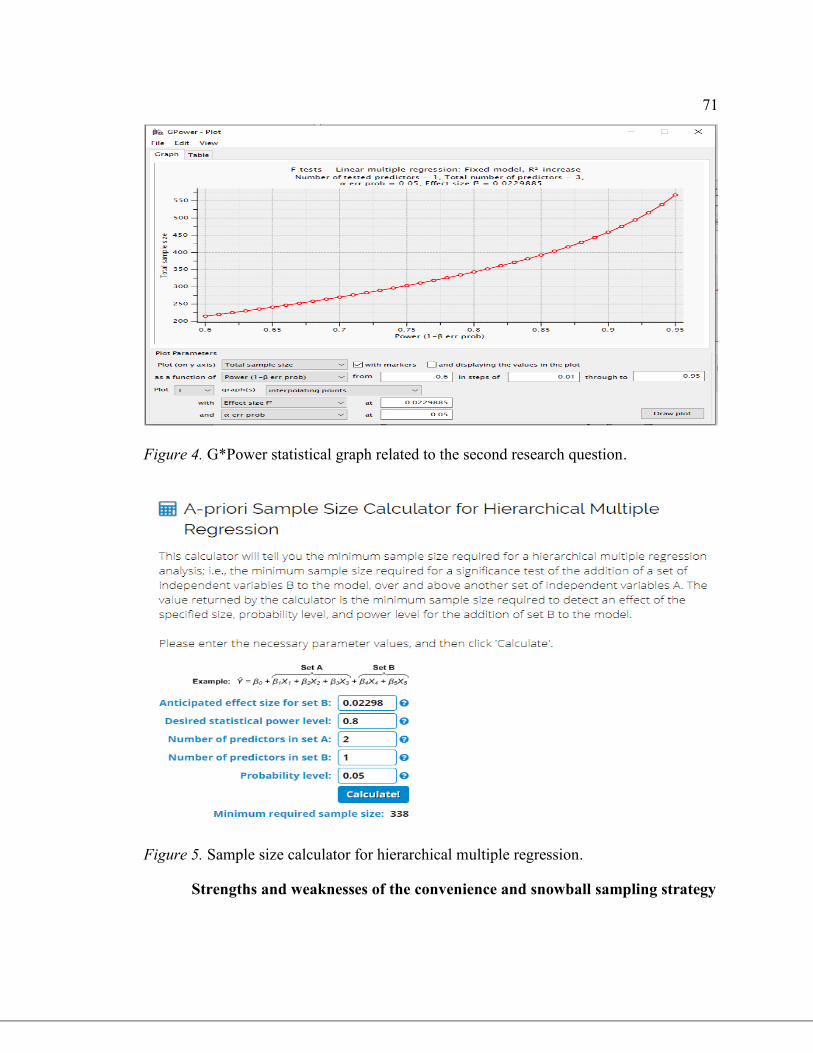
71
Figure 4. G*Power statistical graph related to the second research question.
Figure 5. Sample size calculator for hierarchical multiple regression.
Strengths and weaknesses of the convenience and snowball sampling strategy
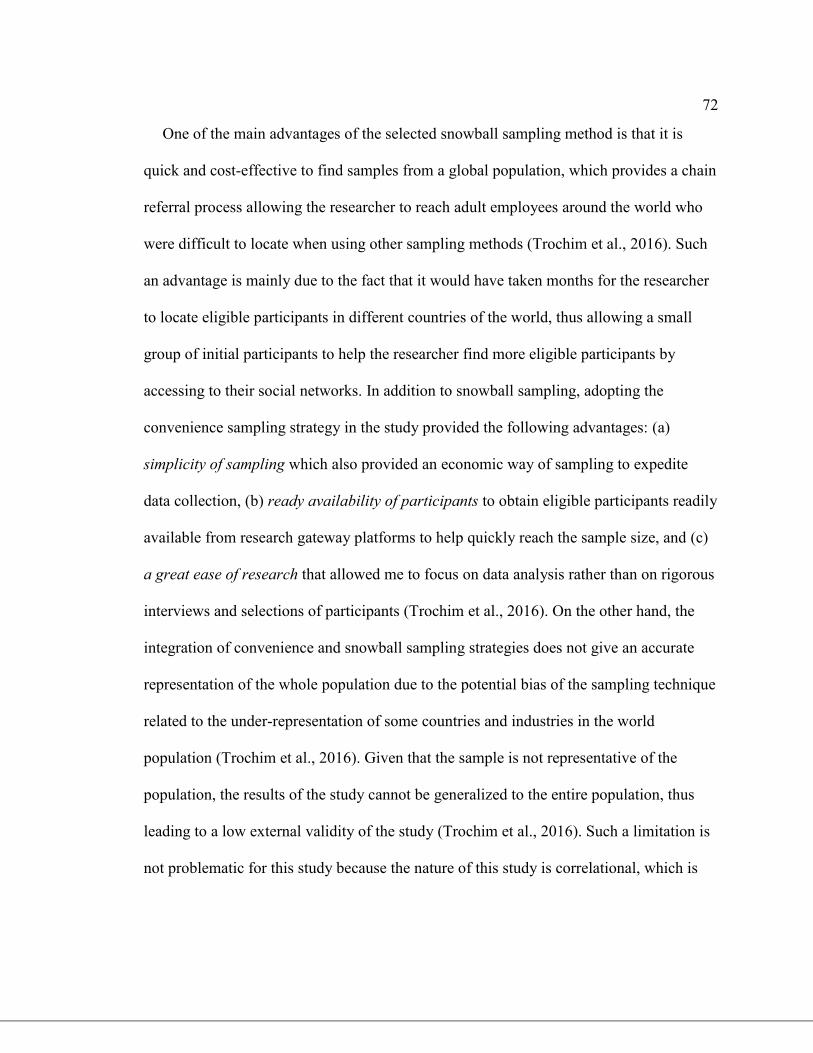
72
One of the main advantages of the selected snowball sampling method is that it is
quick and cost-effective to find samples from a global population, which provides a chain
referral process allowing the researcher to reach adult employees around the world who
were difficult to locate when using other sampling methods (Trochim et al., 2016). Such
an advantage is mainly due to the fact that it would have taken months for the researcher
to locate eligible participants in different countries of the world, thus allowing a small
group of initial participants to help the researcher find more eligible participants by
accessing to their social networks. In addition to snowball sampling, adopting the
convenience sampling strategy in the study provided the following advantages: (a)
simplicity of sampling which also provided an economic way of sampling to expedite
data collection, (b) ready availability of participants to obtain eligible participants readily
available from research gateway platforms to help quickly reach the sample size, and (c)
a great ease of research that allowed me to focus on data analysis rather than on rigorous
interviews and selections of participants (Trochim et al., 2016). On the other hand, the
integration of convenience and snowball sampling strategies does not give an accurate
representation of the whole population due to the potential bias of the sampling technique
related to the under-representation of some countries and industries in the world
population (Trochim et al., 2016). Given that the sample is not representative of the
population, the results of the study cannot be generalized to the entire population, thus
leading to a low external validity of the study (Trochim et al., 2016). Such a limitation is
not problematic for this study because the nature of this study is correlational, which is
73
not a study of the proportions of the target audience but an examination of the correlation
between variables.
Procedures for Recruitment, Participation, and Data Collections
Recruitment procedure
The study participants were recruited using two recruitment methods: an
outsourcing commercial method via Qualtrics panel system and do-it-yourself (DIY)
methods via social networks (LinkedIn and WhatsApp) and Walden participation pool.
Recruiting participants required the study population to be notified of the availability of a
survey. The notification of participants contacted through Walden participation pool was
managed by Walden participation pool administrators after posting the survey details on
Walden University research pool website. The notification of participants contacted
through Qualtrics panel system was managed by Qualtrics panel administrators. The
recruitment of survey respondents via LinkedIn and WhatsApp involved an invitation
message sent by the researcher.
The invitation message was posted on social media (see Appendix A) to volunteer
participants aged 18 and over. In the invitation message, I encouraged participants to
share the survey link with other individuals on social media (LinkedIn and WhatsApp).
Referral friends extended the invitation to other people who might be interested in
becoming participants in this study. For participants contacted via social media and
Walden participation pool, a SurveyMonkey link was made available while a Qualtrics
survey link was used by participants contacted via Qualtrics panel system.
74
The Qualtrics panel system consists of respondents who have signed up to take
online surveys in exchange for incentives such as rewards, cash, and gift cards.
Recruitment and compensation were managed by the firm Qualtrics XM, so I had no direct
control over how much respondents were paid or who was targeted, apart from defining
the target audience and specifying certain characteristics (e.g., employment status). Based
on the target characteristics defined for the required sample (i.e. full-time employment
status), Qualtrics XM applied a sampling methodology that combines quota sampling to
reach target groups and random sampling within those groups. Knowing that the
minimum sample size required for this study was 344, I opted to define 400 respondents
with full-time employment status as the target audience to guarantee reaching the sample
size of participants distributed around the world.
Demographic information
The following demographic information were collected from the study
participants: industry sector, age range, gender, educational attainment, hierarchical
position, total years of experience, years of management experience in the current
organization, years of management experience in all the organizations worked regardless
of the industry, tenure in the current organization, number of years in the current
hierarchical position in the current organization, years of experience under the current
manager in the current organization, and country name. This demographic information
was collected to determine whether the findings of the study are consistent with those of
the literature regarding the relationship between transformational, servant, and
transactional leadership styles, and employee job satisfaction. Based on the demographic
75
information provided by the study participants, the study results could be used to provide
more insights into the study.
Data collection
The data collection tools that were used to distribute survey links to the study
participants were the online survey tools SurveyMonkey® and Qualtrics XM. The
SurveyMonkey link was used by respondents contacted via Walden participation pool
and social media while the Qualtrics survey link was used by respondents contacted via
Qualtrics panel system to complete the study questionnaire. The study questionnaire
initially designed in SurveyMonkey® was replicated in Qualtrics system to harmonize
the survey questions and unify the data collected. The study questionnaire started with an
eligibility criteria page that included screening questions to either qualify or disqualify
respondents from taking the survey, depending on how they answer. The use of screening
questions contributed to (a) reach the desired people and confirm the target audience, (b)
eliminate respondents’ biases, and (c) improve the respondent’s experience. After the
eligibility criteria page, the consent page was made available to employees aged 18 and
over. After the consent page, demographic questions and questions related to the
instruments of the study followed for eligible participants who agreed to participate in the
study. At the end of the questionnaire, participants were allowed to provide their personal
contact information if they wish to receive a copy of the summary of the results of the
study.
In the consent page, participants were first asked to read, understand, and accept
the provisions set out in the informed consent form before deciding whether or not to
76
voluntarily participate in the study. The informed consent form contained information
such as my name and contact information, the purpose of the study, and information
relating to the confidential and anonymous nature of the study. In addition to this basic
information, the informed consent form contained information on the rights of
participants to withdraw from the study at any time during the data collection process, as
well as the opportunity to ask questions or express their concerns. By clicking on the
YES button, participants consented that they had read and understood the consent
information and that they were willing to answer the survey questions.
Instrumentation and Operationalization of Constructs
For this study on the dynamic leadership approach that might influence employee
job satisfaction in dynamic and stable environments, web-based questionnaires relating to
the dependent and independent variables were designed and administered to respondents.
A set of 20 questions was developed for this study to collect empirical data on the
dependent and independent variables. The independent and dependent variables were
measured at the ordinal and measurement interval levels using a Likert scale. A Likert-
type scale provides the means of measuring the degree of agreement with a statement by
survey participants (Kuhlmann, Dantlgraber, & Reips, 2017). Such a type of scale was
used to determine the extent to which follower maturity could mediate the relationship
between leadership styles and employee job satisfaction, and the dynamism of the
organizational environment could moderate the relationship between leadership styles
and employee job satisfaction within organizations.
Relation of Survey Questions to the Research Questions
77
The survey questions were grouped into six main sets to examine the extent to
which the independent variables are related to the dependent variable, and the moderator
and mediator variables strengthen and mediate this relationship. Apart from the first set
of questions which aimed to (a) ensure the eligibility of participants, (b) obtain their
informed consent, and (c) buttress the results of the study with demographic information,
the remaining five sets of questions aimed at eliciting answers to RQ1, RQ2, and RQ3.
The first set of questions included demographic information characterizing each
participant. Individual survey responses did not contain any participant identification
(i.e., names, postal addresses, telephone numbers, social security number, date of birth),
unless the participant provided their email address to request a copy of the summary
report. The third and fourth sets of questions focused on the independent variables, while
the sixth set of questions focused on the dependent variable. The initial combination of
these three sets of questions addressed RQ1. The addition of the fifth set of questions to
this initial combination helped address RQ2, while the integration of the second set of
questions into the initial combination addressed RQ3.
Within the second set of survey questions, the ten questions were aimed at
determining the extent to which employees perceive their own level of maturity in
achieving work objectives. Within the third set of survey questions, the eighteen
questions were aimed at determining the extent to which employees view their respective
managers as servant leaders. The fourth set of survey questions, the thirty-two questions
were aimed at determining the extent to which employees perceive their managers as
transformational leaders. Within the fifth set of survey questions, the nine questions were
78
aimed at soliciting the extent to which employees perceive the level of dynamism of their
organizational environment is more or less frequent. Within the sixth set of survey
questions, the thirty-six questions were aimed at determining the extent to which
employees are satisfied with their jobs. Sample survey questions are provided in the
Appendix.
Instrumentation
The instruments chosen to measure the variables in the study include:
The Multifactor Leadership Questionnaire (MLQ-5X Short) that measures
transactional and transformational leadership styles (Bass & Avolio, 1995).
The Servant Leadership Survey (SLS) short version, which measures servant
leadership style (Van Dierendonck et al., 2017).
The Job Satisfaction Survey (JSS) that measures the job satisfaction level of
employees (Spector, 1997).
The Employee Readiness Scale (ERS) developed by Fernandez and Vecchio
(1997), which helps measure follower maturity in terms of employee competence
and commitment.
Akgun et al.’s (2008) scale that measures the dynamism of the organizational task
environment.
Multifactor leadership questionnaire. To measure the variables of
transformational and transactional leadership, the rater form of the MLQ 5X-
Short instrument developed by Bass and Avolio (1995) was used in the study. The
rater form was completed by followers to record their perceptions of their leaders’
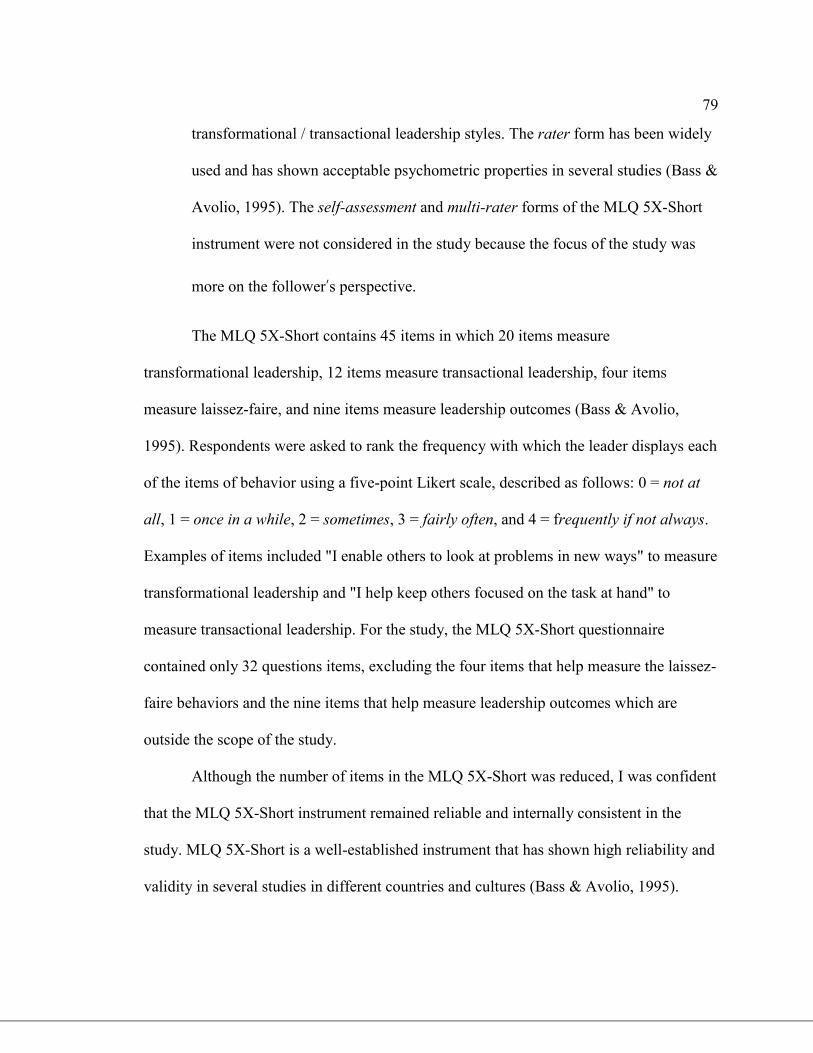
79
transformational / transactional leadership styles. The rater form has been widely
used and has shown acceptable psychometric properties in several studies (Bass &
Avolio, 1995). The self-assessment and multi-rater forms of the MLQ 5X-Short
instrument were not considered in the study because the focus of the study was
more on the follower’s perspective.
The MLQ 5X-Short contains 45 items in which 20 items measure
transformational leadership, 12 items measure transactional leadership, four items
measure laissez-faire, and nine items measure leadership outcomes (Bass & Avolio,
1995). Respondents were asked to rank the frequency with which the leader displays each
of the items of behavior using a five-point Likert scale, described as follows: 0 = not at
all, 1 = once in a while, 2 = sometimes, 3 = fairly often, and 4 = frequently if not always.
Examples of items included "I enable others to look at problems in new ways" to measure
transformational leadership and "I help keep others focused on the task at hand" to
measure transactional leadership. For the study, the MLQ 5X-Short questionnaire
contained only 32 questions items, excluding the four items that help measure the laissez-
faire behaviors and the nine items that help measure leadership outcomes which are
outside the scope of the study.
Although the number of items in the MLQ 5X-Short was reduced, I was confident
that the MLQ 5X-Short instrument remained reliable and internally consistent in the
study. MLQ 5X-Short is a well-established instrument that has shown high reliability and
validity in several studies in different countries and cultures (Bass & Avolio, 1995).
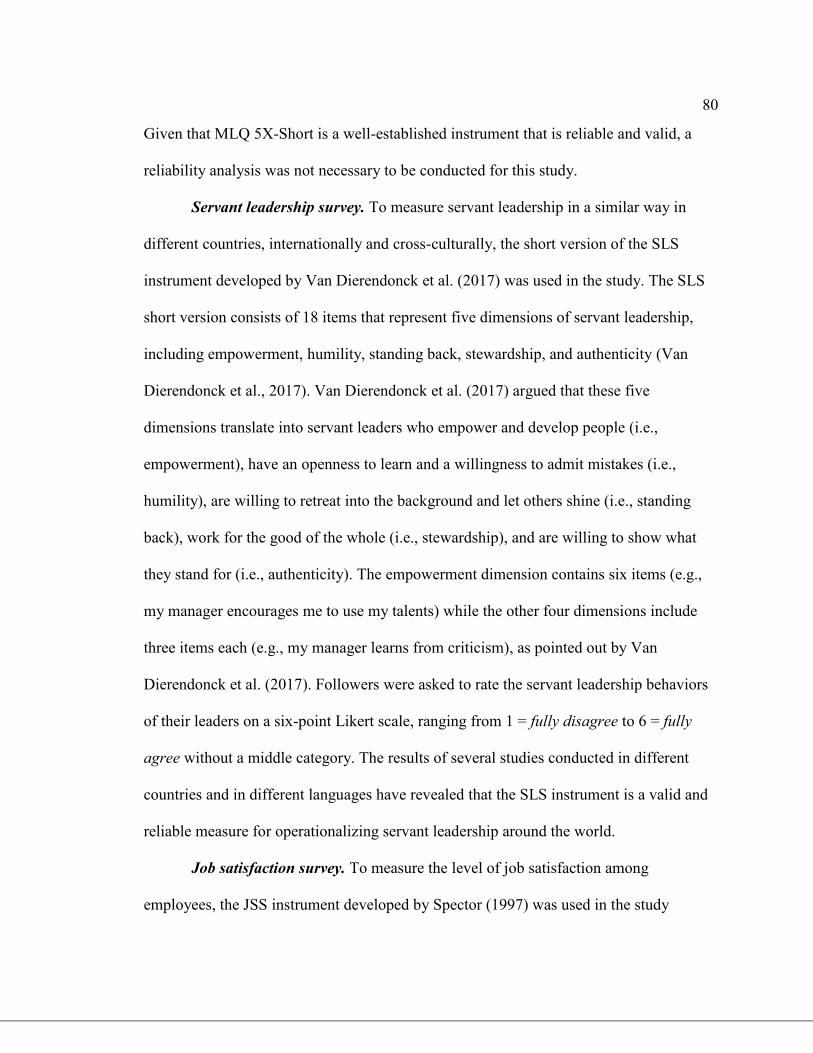
80
Given that MLQ 5X-Short is a well-established instrument that is reliable and valid, a
reliability analysis was not necessary to be conducted for this study.
Servant leadership survey. To measure servant leadership in a similar way in
different countries, internationally and cross-culturally, the short version of the SLS
instrument developed by Van Dierendonck et al. (2017) was used in the study. The SLS
short version consists of 18 items that represent five dimensions of servant leadership,
including empowerment, humility, standing back, stewardship, and authenticity (Van
Dierendonck et al., 2017). Van Dierendonck et al. (2017) argued that these five
dimensions translate into servant leaders who empower and develop people (i.e.,
empowerment), have an openness to learn and a willingness to admit mistakes (i.e.,
humility), are willing to retreat into the background and let others shine (i.e., standing
back), work for the good of the whole (i.e., stewardship), and are willing to show what
they stand for (i.e., authenticity). The empowerment dimension contains six items (e.g.,
my manager encourages me to use my talents) while the other four dimensions include
three items each (e.g., my manager learns from criticism), as pointed out by Van
Dierendonck et al. (2017). Followers were asked to rate the servant leadership behaviors
of their leaders on a six-point Likert scale, ranging from 1 = fully disagree to 6 = fully
agree without a middle category. The results of several studies conducted in different
countries and in different languages have revealed that the SLS instrument is a valid and
reliable measure for operationalizing servant leadership around the world.
Job satisfaction survey. To measure the level of job satisfaction among
employees, the JSS instrument developed by Spector (1997) was used in the study
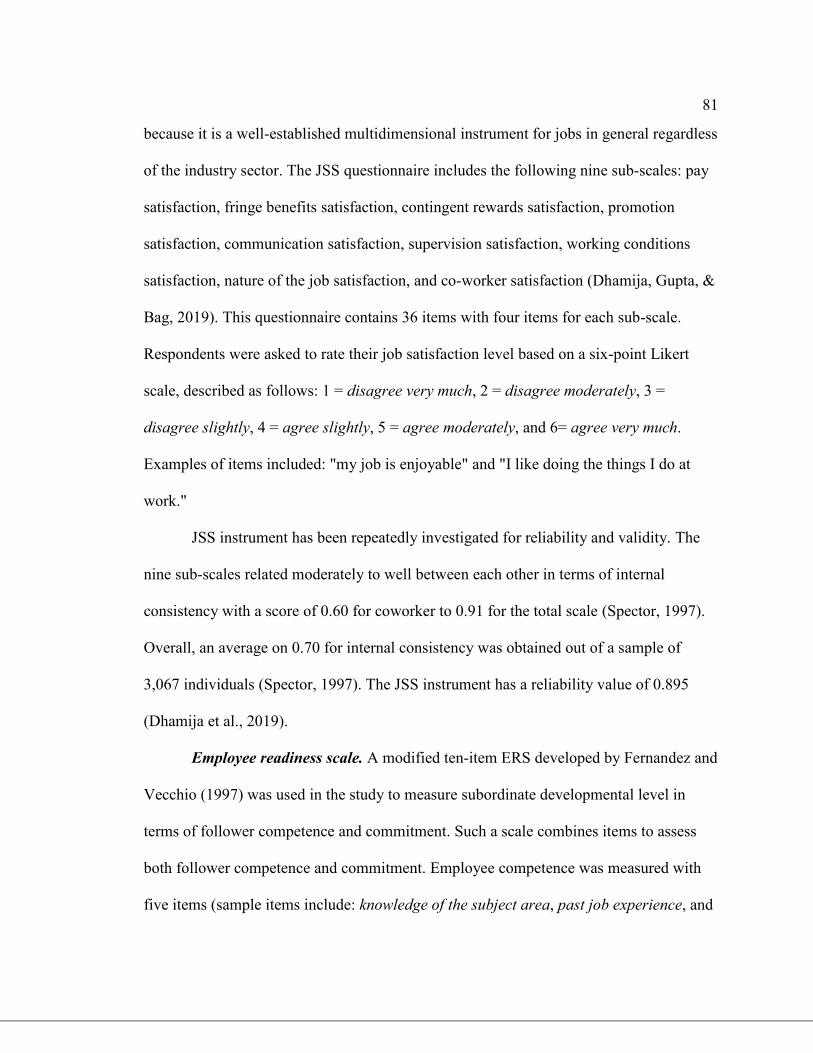
81
because it is a well-established multidimensional instrument for jobs in general regardless
of the industry sector. The JSS questionnaire includes the following nine sub-scales: pay
satisfaction, fringe benefits satisfaction, contingent rewards satisfaction, promotion
satisfaction, communication satisfaction, supervision satisfaction, working conditions
satisfaction, nature of the job satisfaction, and co-worker satisfaction (Dhamija, Gupta, &
Bag, 2019). This questionnaire contains 36 items with four items for each sub-scale.
Respondents were asked to rate their job satisfaction level based on a six-point Likert
scale, described as follows: 1 = disagree very much, 2 = disagree moderately, 3 =
disagree slightly, 4 = agree slightly, 5 = agree moderately, and 6= agree very much.
Examples of items included: "my job is enjoyable" and "I like doing the things I do at
work."
JSS instrument has been repeatedly investigated for reliability and validity. The
nine sub-scales related moderately to well between each other in terms of internal
consistency with a score of 0.60 for coworker to 0.91 for the total scale (Spector, 1997).
Overall, an average on 0.70 for internal consistency was obtained out of a sample of
3,067 individuals (Spector, 1997). The JSS instrument has a reliability value of 0.895
(Dhamija et al., 2019).
Employee readiness scale. A modified ten-item ERS developed by Fernandez and
Vecchio (1997) was used in the study to measure subordinate developmental level in
terms of follower competence and commitment. Such a scale combines items to assess
both follower competence and commitment. Employee competence was measured with
five items (sample items include: knowledge of the subject area, past job experience, and
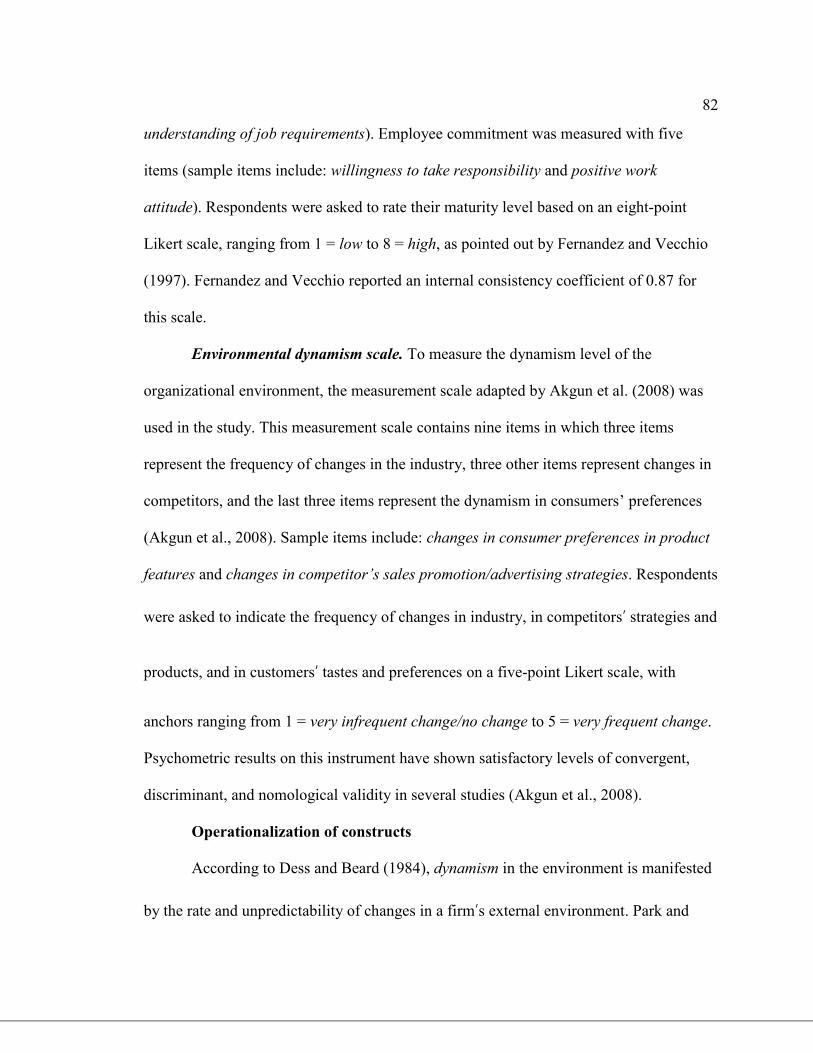
82
understanding of job requirements). Employee commitment was measured with five
items (sample items include: willingness to take responsibility and positive work
attitude). Respondents were asked to rate their maturity level based on an eight-point
Likert scale, ranging from 1 = low to 8 = high, as pointed out by Fernandez and Vecchio
(1997). Fernandez and Vecchio reported an internal consistency coefficient of 0.87 for
this scale.
Environmental dynamism scale. To measure the dynamism level of the
organizational environment, the measurement scale adapted by Akgun et al. (2008) was
used in the study. This measurement scale contains nine items in which three items
represent the frequency of changes in the industry, three other items represent changes in
competitors, and the last three items represent the dynamism in consumers’ preferences
(Akgun et al., 2008). Sample items include: changes in consumer preferences in product
features and changes in competitor’s sales promotion/advertising strategies. Respondents
were asked to indicate the frequency of changes in industry, in competitors’ strategies and
products, and in customers’ tastes and preferences on a five-point Likert scale, with
anchors ranging from 1 = very infrequent change/no change to 5 = very frequent change.
Psychometric results on this instrument have shown satisfactory levels of convergent,
discriminant, and nomological validity in several studies (Akgun et al., 2008).
Operationalization of constructs
According to Dess and Beard (1984), dynamism in the environment is manifested
by the rate and unpredictability of changes in a firm’s external environment. Park and
83
Ryu (2015) conceptualized environmental dynamism into two sub-constructs, namely
competitor dynamism and customer dynamism. More specifically, Akgun et al. (2008)
pointed out that environmental dynamism includes three sub-dimensions including:
dynamism in industry, competition, and consumers. For this study, environmental
dynamism was operationalized as the unpredictability and rate at which the preferences
and tastes of the firm’s consumers, the strategies and products developed by the firm’s
competitors, and the industry settings change over time.
Transformational leadership is defined as a leadership style in which the leader
transforms employees to perform beyond expectations (Bass, 1985). Transactional
leadership is defined as an exchange relationship based on economic considerations or a
leadership style based on transactions between a leader and his/her followers (Sheshi &
Kërçini, 2017). Transformational and transactional leadership styles were measured by
the MLQ-5X short (Bass & Avolio, 1995). The MLQ-5X questionnaire helps measure
leadership style as being transformational, transactional, or passive-avoidant, but only 32
items of this questionnaire were considered in the study to measure only transformational
and transactional leadership styles.
Servant leadership is defined as a leadership style in which leaders develop their
followers in multiple dimensions (e.g., relational, ethical, emotional, spiritual) to meet
their individual needs and the needs of the broader organizational stakeholders and the
wider community (Eva et al., 2019). Servant leadership was measured by the short
version of the SLS instrument developed by Van Dierendonck et al. (2017). The short
version of the SLS questionnaire includes 18 questions.
84
Job satisfaction is operationalized as the total job satisfaction score for multiple
work factors such as salaries, fringe benefits, recognition, promotion, communication,
supervision, working conditions, nature of the job, and co-workers (Van Saane et al.,
2003). Job satisfaction was measured by the JSS instrument (Spector, 1997). Each
respondent assessed his/her level of job satisfaction.
Follower maturity is defined as employee readiness or subordinate developmental
level (Fernandez & Vecchio, 1997). Follower maturity is operationalized as the
combination of subordinate commitment and competence. Employee readiness was
measured by the ERS instrument to assess both follower competence and commitment.
The results on the maturity level of followers would help facilitate the selection of
leadership styles in the proposed dynamic leadership approach (Thompson & Glaso,
2018).
Data Analysis Plan
The research questions and hypotheses that were used to guide the data analysis in
the study were as follows:
RQ1: To what extent, if any, is there a correlation between transformational,
transactional, and servant leadership styles and employee job satisfaction?
H011: There is no correlation between transformational leadership style and
employee job satisfaction among leaders and their followers.
Ha11: There is a correlation between transformational leadership style and
employee job satisfaction among leaders and their followers.
85
H012: There is no correlation between transactional leadership style and employee
job satisfaction among leaders and their followers.
Ha12: There is a correlation between transactional leadership style and employee
job satisfaction among leaders and their followers.
H013: There is no correlation between servant leadership style and employee job
satisfaction among leaders and their followers.
Ha13: There is a correlation between servant leadership style and employee job
satisfaction among leaders and their followers.
RQ2: To what extent, if any, does environmental dynamism moderate the
relationship between servant and transformational leadership styles and employee job
satisfaction?
RQ2.1: To what extent, if any, does transformational leadership influence
employee job satisfaction in dynamic environments?
RQ2.2: To what extent, if any, does servant leadership influence employee job
satisfaction in stable environments?
H021: Environmental dynamism does not moderate the relationship between
transformational leadership and employee job satisfaction.
Ha21: The relationship between transformational leadership and employee job
satisfaction will be stronger in turbulent environments than in stable
environments.
H022: Environmental dynamism does not moderate the relationship between
servant leadership and employee job satisfaction.
86
Ha22: The relationship between servant leadership and employee job satisfaction
will be stronger in stable environments than in turbulent environments.
RQ3: To what extent, if any, does follower maturity mediate the relationship
between transformational, servant, and transactional leadership styles and employee job
satisfaction?
H031: Follower maturity does not mediate the relationship between
transformational leadership and employee job satisfaction.
Ha31: The relationship between transformational leadership and employee job
satisfaction will be effective when follower maturity is moderate.
H032: Follower maturity does not mediate the relationship between servant
leadership and employee job satisfaction.
Ha32: The relationship between servant leadership and employee job satisfaction
will be associated with highly mature followers.
H033: Follower maturity does not mediate the relationship between transactional
leadership and employee job satisfaction.
Ha33: The relationship between transactional leadership and employee job
satisfaction will be appropriate when follower maturity is low.
The rejection or acceptance of a null hypothesis was based on some level of
significance (alpha level) as a criterion. For testing any hypothesis in the study, an alpha
level of 0.05 was used as the level of significance to identify the presence of statistical
significance. As such, 5% (0.05) alpha level of significance was considered as a standard
for rejection of null hypothesis (Brase & Brase, 2016). This value represents the 95%
87
confidence interval which has a 95% likelihood of containing the true but unknown
parameter (Trafimow, 2018).
Statistical tests
The data to be collected in the study were analyzed using the version 25 of IBM’s
Statistical Package for the Social Sciences (SPSS) analytical tool. Both descriptive and
inferential statistical procedures were used to analyze the data received from the sample.
Descriptive statistics such as frequencies, percentages mean, and standard deviations
were used to profile the sample in several parts and as a whole and to compare one set of
scores to another. Inferential statistics such as Pearson correlation analysis, hierarchical
multiple regression, and the four-step method of mediation testing were used to analyze
quantitative data that help answer research questions.
A Pearson correlation analysis was used to analyze the correlation between
servant, transformational, and transactional leadership styles and employee job
satisfaction. Given that each leadership style and employee job satisfaction were
continuous variables, Pearson’s bivariate correlation analysis was the most appropriate
statistical tool for analyzing linear relationships between pairs of continuous variables
(Frankfort-Nachmias & Leon-Guerrero, 2018). Applying the Pearson correlation analysis
to the study analysis should help me verify whether each of the three independent
variables has a correlational effect on the dependent variable. Such a verification should
help answer the first research question.
Hierarchical multiple regression was used in the study to examine whether the
dynamism of the organizational environment moderates the relationship between servant
88
leadership, transformational leadership, and employee job satisfaction. Hierarchical
multiple regression helps explain the relationship between a dependent variable and two
or more independent variables in a series of steps that differ from each other by the
introduction of the moderation/interaction term (Field, 2018). Given that the dynamism
of the organizational environment has three main hierarchical levels, low/stable,
moderate, or high/turbulent; performing a hierarchical regression analysis through SPSS
consisted of performing a simple linear regression analysis by hierarchical level. Doing
such a hierarchical regression analysis was equivalent to performing a simple linear
regression between transformational/servant leadership and employee job satisfaction
based on the different hierarchical levels (i.e., low, moderate, high) of the moderating
variable environmental dynamism.
The four-step method of mediation testing initially designed by Baron and Kenny
(1986) was used in the study to test if the effect of transformational, servant, and
transactional leadership styles on employee job satisfaction is partly or entirely
transmitted by follower maturity. Mediation testing was the most appropriate choice of
statistical test to answer the third research question because it helps determine the
presence of mediating effects in the relationship between transformational, servant, and
transactional leadership styles and employee job satisfaction. Previous studies showed
that level of maturity of employees helps determine the appropriate leadership style to
achieve certain organizational goals (Perna, 2016). Given that there is an influence
between leadership style and follower maturity (Ebere & Fragouli, 2015) and between
follower maturity and employee job satisfaction (Matthews, Daigle, & Houston, 2018),
89
follower maturity can be considered as a possible explanation of the relationship between
leadership style and employee job satisfaction. As such, mediation analysis was the most
appropriate statistical test to answer the third research question.
Prior to conducting the simultaneous and hierarchical multiple linear regression
analyses, the data collected from the surveys were screened for violations of assumptions
and checked for consistency (Leech, Barrett, & Morgan, 2015). These data were also
verified for inconsistent responses as well as missing data. These checks allowed me to
determine whether the data collected meet the statistical assumptions underlying the
simultaneous and hierarchical multiple linear regression analyses.
Statistical assumptions underlying the study
Two statistical assumptions underlying the correlation analysis and the multiple
linear regression analyses were considered appropriate for this study to answer RQ1,
RQ2, and RQ3. Regarding RQ1, four assumptions required to conduct a Pearson
correlation analysis were considered to verify whether the independent and dependent
variables of the study were correlated (Jeong & Jung, 2016). Regarding RQ2 and RQ3,
eight assumptions were considered to verify the eligibility requirements for conducting a
multiple regression analysis, which then also apply for hierarchical linear regression and
mediation testing (Ross & Willson, 2017; Yu, Jiang, & Land, 2015).
Missing data
An examination of missing data was carried out during the data analysis process
to avoid threatening the external validity of the study (Little & Rubin, 2019). Missing
data may appear in the data collection process due to errors in data entry such as
90
insufficient information provided to participants to answer a question, accidental jump of
questions by participants, incomprehensible questions, and discomfort among participants
to respond appropriately to specific questions (Raghunathan, 2015). Missing data may
appear in this study if participants feel uncomfortable expressing their perception of their
own maturity level, which may then cause a reduction in the overall sample size.
Treats to Validity
Validity in quantitative research designs consists of determining whether what
was intended to be measured in a study has been measured or whether the research results
accurately describe or reflect the phenomenon being studied (Burkholder et al., 2016). As
such, validity in a research study relates to both the research design and the measures
used to measure the variables in the study. Ombok and Aila (2015) argued that the
validity of a research design involves assessing how well it fits the type of study that a
researcher intends to conduct. Due to the relevance of the quantitative non-experimental
correlational design chosen as the data collection technique for the study, the validity of
this design to examine the extent to which servant, transactional, and transformational
leadership styles are correlated with employee satisfaction was achieved.
Validity relating to measurement entails determining whether (a) the right
variables are being measured, (b) the appropriate level of measurement is being used to
measure these variables, and (c) the measurement instrument tool is being used for the
purposes for which it was designed (Burkholder et al., 2016). Given that all variables in
the study were continuous with an interval level of measurement and all chosen
instruments were well-established and valid in the literature, the validity related to the
91
measurement of independent, dependent, moderator, and mediator variables was
achieved. Other types of validity include external validity and internal validity.
External Validity
A potential threat to external validity could be found in similar types of leadership
questionnaires that participants may have completed or previous informal discussions that
employees may have participated about the quality/type of their leader’s leadership style
and the effect that it may have on their overall level of job satisfaction. Another threat to
external validity is related to the sample and the design of the study. The sample was
composed of employees from different countries in the world. Not all the countries in the
world were considered in this study. As a result, the findings of the study may not be
generalized to the overall population of employees in the world. The use of a snowball
sampling strategy was an attempt to control this sampling limitation. Another threat
concerned the potential low response rate of the participants contacted through
SurveyMonkey as the survey remained open for only a few months, with the
understanding that if the sample is not reached, the survey may be closed without the
possibility of generalization. This threat was mitigated by the use of Qualtrics panel
audience that helped increase the overall response rate of the study.
Internal Validity
Several threats to internal validity may occur in the study. Given that employees
self-reported their maturity levels, they may identify themselves as highly mature
differently from their actual behaviors. Given this risk of self-overestimation, this study
could be confronted with an insufficient number of low-mature followers to validate the
92
hypothesis Ha33 concerning this category of followers. An introduction to the study and
an explanation of all questionnaires was provided to participants to minimize this threat.
Ethical Procedures
To protect the rights of human subjects, the proposal for the study was reviewed
and approved according to the protocol and strict guidelines set out by the Institutional
Review Board (IRB) of Walden University (Approval number: 02-11-20-0628704).
Informed consent was obtained from participants prior to their participation in the study.
The informed consent contained the researcher’s name, the mode of selection of
participants, the purpose of the research, the benefits of participating in the research
study, the level and type of participation required by the participant, and the risks to the
participant. The informed consent also contained a guarantee of confidentiality for the
participant that any information will only be seen by the researcher and his dissertation
committee members, the information that the participant may withdraw from the study at
any time as well as the name and contact information of the person a participant can call
if he/she has a question.
Participants did not receive financial compensation for participation in the study.
To help with reciprocity, the conclusion page of the survey in SurveyMonkey® and
Qualtrics XM allowed respondents to provide contact information (i.e., email) if they
would like to receive a copy of the summary results of the study. The contact information
was ignored from SurveyMonkey® and Qualtrics XM data before analyzing the summary
data.
93
To protect the confidentiality of participants, the summary data and the data
analysis files were stored in password-protected files on a password-protected computer
to ensure data confidentiality and privacy. Once the data were analyzed, a summary
report was generated and will be sent to the individuals who wished to receive the
summary report. The contact information of participants who wished to receive the
summary report will be deleted once the summary report will be published.
Summary
In Chapter 3, a detailed outline was provided including the research approach and
design, the data analysis plan, potential threats to validity, and the study’s methodology
that includes the recruitment of participants and the sampling and data collection
strategies. A quantitative non-experimental correlational research design was found to be
appropriate for the study to examine the extent to which servant, transactional, and
transformational leadership styles could be correlated with employee job satisfaction. A
combination of convenience sampling and snowball sampling techniques was found to be
adequate in the study to select participants from multiple countries in the world. A
sample size of 344 was needed to achieve generalizability. Informed consent, ethical
procedures, and IRB approval for the study were achieved prior to the collection of any
data. Data were collected using SurveyMonkey® and Qualtrics XM tools containing
demographic data, MLQ 5X-Short, the SLS survey, the JSS survey, a modified ten-item
ERS survey, and the Akgun et al.’s (2008) survey. The data received from the sample
were analyzed using descriptive statistics and inferential statistics such as the Pearson
correlation analysis, hierarchical multiple regression, and mediation testing for
94
addressing the research questions of the study. Following the data collection process
described in Chapter 3, the results of the study are described in Chapter 4.

95
Chapter 4: Results
The purpose of this quantitative, non-experimental, correlational study was to
examine the relationship between servant, transactional, and transformational leadership
styles and employee job satisfaction within organizations. A specific aim of the study was
to examine to what extent, if any, (a) follower maturity mediates the relationship between
leadership styles and employee job satisfaction, and (b) the dynamism of the
organizational environment moderates the relationship between leadership styles and
employee job satisfaction within organizations. The research questions and hypotheses
that were used to guide the data analysis in the study were as follows:
RQ1: To what extent, if any, is there a correlation between transformational,
transactional, and servant leadership styles and employee job satisfaction?
H011: There is no correlation between transformational leadership style and
employee job satisfaction among leaders and their followers.
Ha11: There is a correlation between transformational leadership style and
employee job satisfaction among leaders and their followers.
H012: There is no correlation between transactional leadership style and employee
job satisfaction among leaders and their followers.
Ha12: There is a correlation between transactional leadership style and employee
job satisfaction among leaders and their followers.
H013: There is no correlation between servant leadership style and employee job
satisfaction among leaders and their followers.
96
Ha13: There is a correlation between servant leadership style and employee job
satisfaction among leaders and their followers.
RQ2: To what extent, if any, does environmental dynamism moderate the
relationship between servant and transformational leadership styles and employee job
satisfaction?
RQ2.1: To what extent, if any, does transformational leadership influence
employee job satisfaction in dynamic environments?
RQ2.2: To what extent, if any, does servant leadership influence employee job
satisfaction in stable environments?
H021: Environmental dynamism does not moderate the relationship between
transformational leadership and employee job satisfaction.
Ha21: The relationship between transformational leadership and employee job
satisfaction will be stronger in turbulent environments than in stable
environments.
H022: Environmental dynamism does not moderate the relationship between
servant leadership and employee job satisfaction.
Ha22: The relationship between servant leadership and employee job satisfaction
will be stronger in stable environments than in turbulent environments.
RQ3: To what extent, if any, does follower maturity mediate the relationship
between transformational, servant, and transactional leadership styles and employee job
satisfaction?
97
H031: Follower maturity does not mediate the relationship between
transformational leadership and employee job satisfaction.
Ha31: The relationship between transformational leadership and employee job
satisfaction will be effective when follower maturity is moderate.
H032: Follower maturity does not mediate the relationship between servant
leadership and employee job satisfaction.
Ha32: The relationship between servant leadership and employee job satisfaction
will be associated with highly mature followers.
H033: Follower maturity does not mediate the relationship between transactional
leadership and employee job satisfaction.
Ha33: The relationship between transactional leadership and employee job
satisfaction will be appropriate when follower maturity is low.
Chapter 4 includes the data collection strategy in more detail, the data analysis process,
and the results pertaining to the data collected for this quantitative cross-sectional study.
Chapter 4 begins with the review of the data collection procedure used for this study. Next,
I outline the descriptive statistics, which help describe the characteristics of the study
participants, and then present the results of the data analysis addressing the three research
questions. I conclude Chapter 4 with a summary and an introduction to Chapter 5.
Data Collection
Data collected directly from research participants provided the primary data in the
survey questionnaire of this study. A cross-sectional survey was developed to collect
empirical data on the independent and dependent variables. Data collection for this study
98
took place over an 8-week period in two rounds of surveys distributed through
SurveyMonkey and Qualtrics. On April 20, 2020, the study was approved by Walden
IRB, then the survey designed from SurveyMonkey was distributed to my referring
friends via social media. On April 22, 2020, this survey was made visible to members of
the Walden participant pool. A total of 461 participants responded to the survey invitation
that I and my referring friends posted on social networks (WhatsApp and LinkedIn) and
that I also posted on the Walden participation pool website. Of these 461 participants,
302 participants completed all survey questions after the first round of surveys distributed
through SurveyMonkey.
One month after the distribution of the first round of surveys, the number of
completed responses was only 184, thus making the sample size considerably smaller
than the minimum of 344 completed responses required for this study. Given that the first
round of surveys failed to generate a sufficient audience with the participants contacted
via the social networks and the Walden participation pool, I launched a second round of
surveys via the Qualtrics panel system to obtain the required sample size of 344
participants for this study. A total of 410 participants from the Qualtrics panel audience
had fully answered all of the survey questions as of May 29, 2020, thus bringing the total
of respondents to 871 and the total of completed responses to 712 when combining all
responses from Qualtrics and SurveyMonkey tools. Regarding the statistical power
analysis, I needed 344 participants, and the final number of completed responses (N=712)
far exceeded the minimum sample size. The overall completion rate for this study was
81.74%. Such a response rate of 81.74% is considered acceptable and would not affect

99
the validity of the results of a study (Frankfort-Nachmias & Nachmias, 2008). One
hundred and fifty-night responses (18.26%) were incomplete or failed to meet the
inclusion criteria for the study and were then dropped from the study.
There were no major deviations from the data collection plan, except that the
sample size far exceeded the minimum sample size required for this study. The minimum
sample size required for this study was 344, while the sample size ultimately obtained for
this study was 712. Such a deviation is a strength for this study because larger samples
increase the statistical power and decrease the estimation error to produce a large effect
(Warner, 2013). Based on this larger sample, the results more accurately represent the
characteristics of the populations from which the data originate.
Survey Administration
I collected psychometric data from participants spread across the world with the
help of my referral friends and the survey coordinators from Qualtrics panel system and
Walden participant pool system. On April 20, 2020, I distributed the survey link to my
referral contacts, who then forwarded it to larger groups of participants. Data collection
for this study took place over a 11-week period in two rounds: a first round of surveys
administered through SurveyMonkey and a second round of surveys administered
through Qualtrics. Overall, data collection for this study started on April 20, 2020 and
ended on July 4, 2020. As of July 4, 2020, the total number of participants who fully
responded was 712.
At the end of the data collection, I logged into my password protected computer
and onto the password protected websites of SurveyMonkey® and Qualtrics XM to view
100
and export data. The response data was exported to a password-protected SPSS file on a
password protected computer. Data from the SPSS file were used in SPSS to perform the
data analysis for the study. To develop an understanding of the demographics of all
variables, I performed descriptive statistics using SPSS. Means, variances, and standard
deviations were computed for all of the study variables to indicate the characteristics of
each variable.
Study Results
SPSS was used to obtain descriptive statistics that could be used to buttress the
study results. The overall results showed that there is a correlation between servant
leadership and employee job satisfaction, and a correlation between transformational
leadership and employee job satisfaction, but no correlation between transactional
leadership and employee job satisfaction. Moreover, these results showed that the
relationship between (a) transformational leadership and employee job satisfaction is a
moderate positive relationship that is statistically significant and (b) servant leadership
and employee job satisfaction is a moderate positive relationship that is statistically
significant. Furthermore, the results indicated that the dynamism of the organizational
environment moderates the relationship between leadership styles and employee job
satisfaction and that follower maturity mediates this relationship. More specifically, the
results indicated that the relationship between servant leadership and employee job
satisfaction is stronger in stable environments than in turbulent environments. The results
showed that transformational leadership does not influence employee job satisfaction in
highly dynamic environments more than in weakly dynamic environments. The results
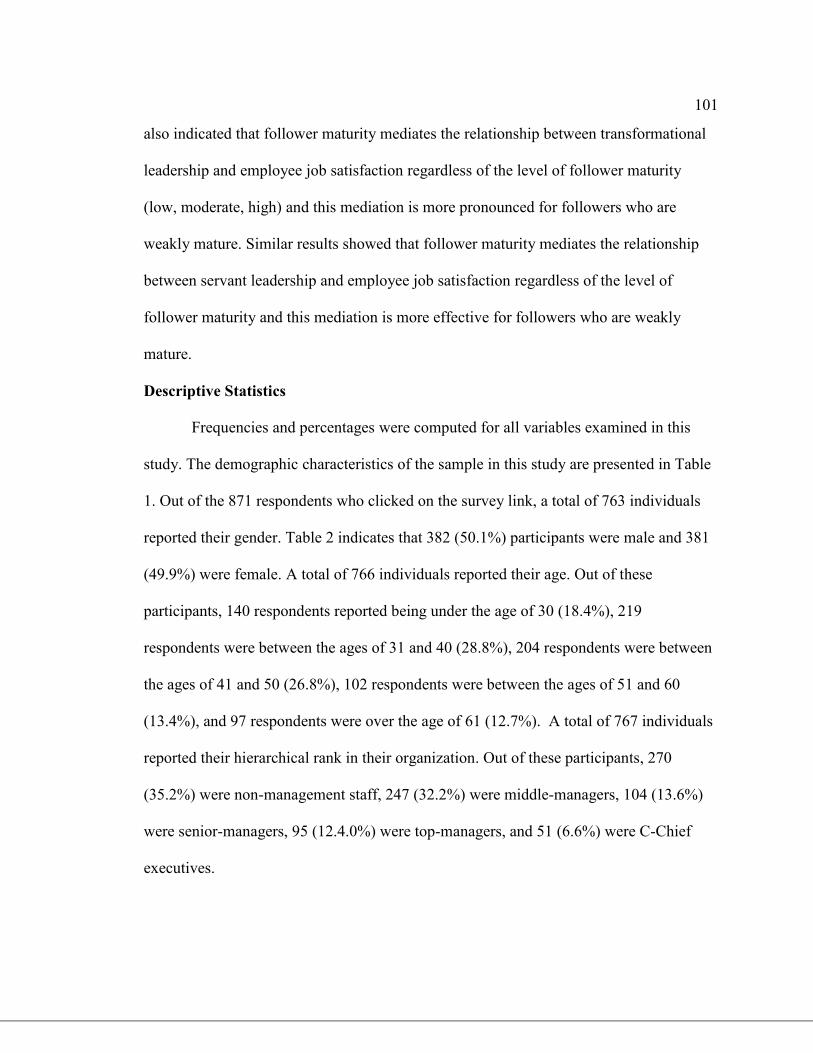
101
also indicated that follower maturity mediates the relationship between transformational
leadership and employee job satisfaction regardless of the level of follower maturity
(low, moderate, high) and this mediation is more pronounced for followers who are
weakly mature. Similar results showed that follower maturity mediates the relationship
between servant leadership and employee job satisfaction regardless of the level of
follower maturity and this mediation is more effective for followers who are weakly
mature.
Descriptive Statistics
Frequencies and percentages were computed for all variables examined in this
study. The demographic characteristics of the sample in this study are presented in Table
1. Out of the 871 respondents who clicked on the survey link, a total of 763 individuals
reported their gender. Table 2 indicates that 382 (50.1%) participants were male and 381
(49.9%) were female. A total of 766 individuals reported their age. Out of these
participants, 140 respondents reported being under the age of 30 (18.4%), 219
respondents were between the ages of 31 and 40 (28.8%), 204 respondents were between
the ages of 41 and 50 (26.8%), 102 respondents were between the ages of 51 and 60
(13.4%), and 97 respondents were over the age of 61 (12.7%). A total of 767 individuals
reported their hierarchical rank in their organization. Out of these participants, 270
(35.2%) were non-management staff, 247 (32.2%) were middle-managers, 104 (13.6%)
were senior-managers, 95 (12.4.0%) were top-managers, and 51 (6.6%) were C-Chief
executives.
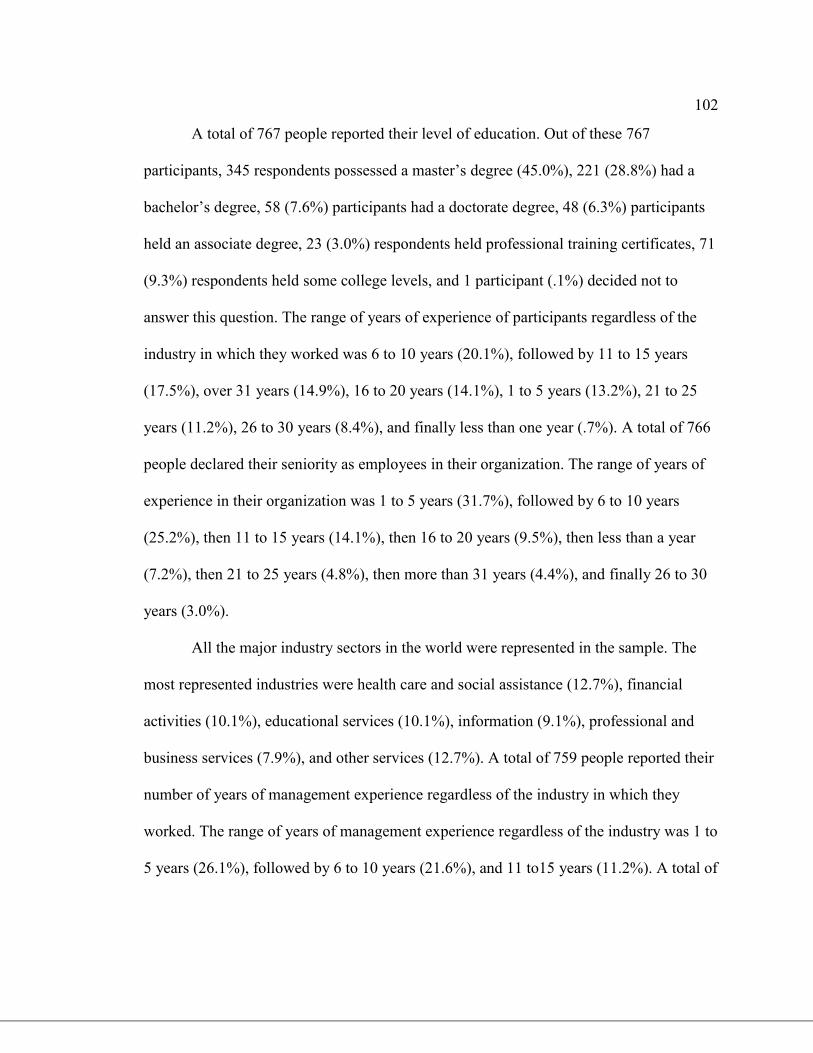
102
A total of 767 people reported their level of education. Out of these 767
participants, 345 respondents possessed a master’s degree (45.0%), 221 (28.8%) had a
bachelor’s degree, 58 (7.6%) participants had a doctorate degree, 48 (6.3%) participants
held an associate degree, 23 (3.0%) respondents held professional training certificates, 71
(9.3%) respondents held some college levels, and 1 participant (.1%) decided not to
answer this question. The range of years of experience of participants regardless of the
industry in which they worked was 6 to 10 years (20.1%), followed by 11 to 15 years
(17.5%), over 31 years (14.9%), 16 to 20 years (14.1%), 1 to 5 years (13.2%), 21 to 25
years (11.2%), 26 to 30 years (8.4%), and finally less than one year (.7%). A total of 766
people declared their seniority as employees in their organization. The range of years of
experience in their organization was 1 to 5 years (31.7%), followed by 6 to 10 years
(25.2%), then 11 to 15 years (14.1%), then 16 to 20 years (9.5%), then less than a year
(7.2%), then 21 to 25 years (4.8%), then more than 31 years (4.4%), and finally 26 to 30
years (3.0%).
All the major industry sectors in the world were represented in the sample. The
most represented industries were health care and social assistance (12.7%), financial
activities (10.1%), educational services (10.1%), information (9.1%), professional and
business services (7.9%), and other services (12.7%). A total of 759 people reported their
number of years of management experience regardless of the industry in which they
worked. The range of years of management experience regardless of the industry was 1 to
5 years (26.1%), followed by 6 to 10 years (21.6%), and 11 to15 years (11.2%). A total of
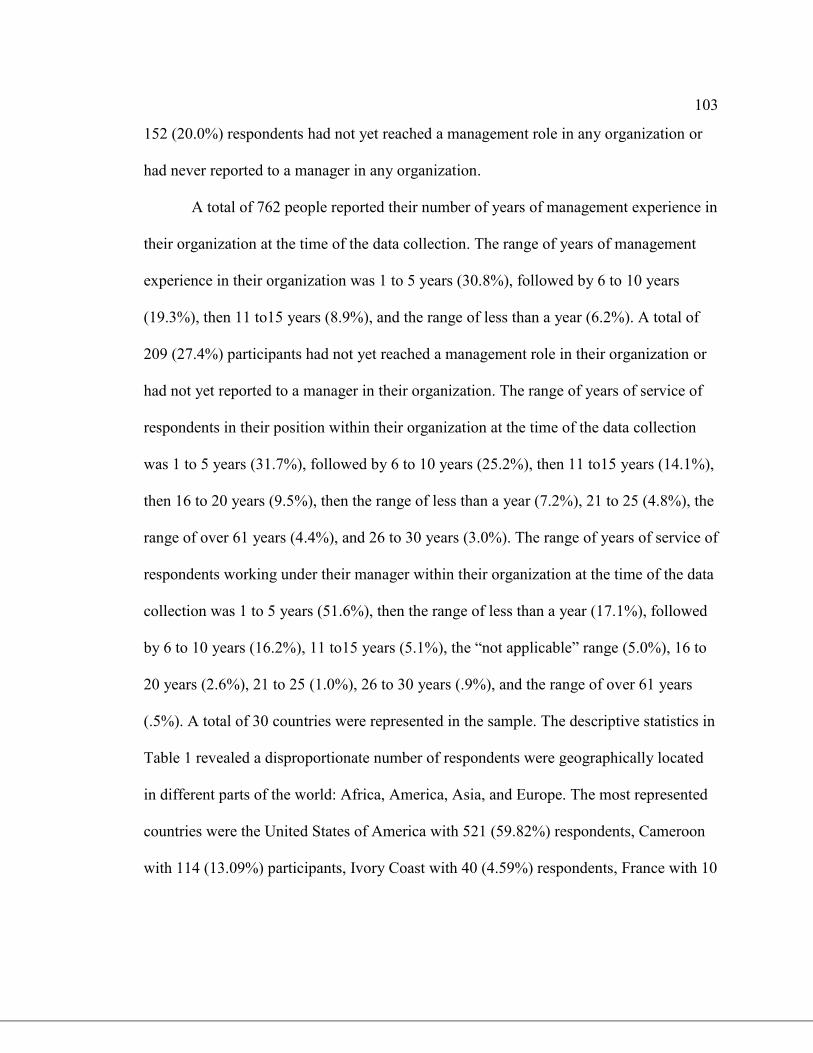
103
152 (20.0%) respondents had not yet reached a management role in any organization or
had never reported to a manager in any organization.
A total of 762 people reported their number of years of management experience in
their organization at the time of the data collection. The range of years of management
experience in their organization was 1 to 5 years (30.8%), followed by 6 to 10 years
(19.3%), then 11 to15 years (8.9%), and the range of less than a year (6.2%). A total of
209 (27.4%) participants had not yet reached a management role in their organization or
had not yet reported to a manager in their organization. The range of years of service of
respondents in their position within their organization at the time of the data collection
was 1 to 5 years (31.7%), followed by 6 to 10 years (25.2%), then 11 to15 years (14.1%),
then 16 to 20 years (9.5%), then the range of less than a year (7.2%), 21 to 25 (4.8%), the
range of over 61 years (4.4%), and 26 to 30 years (3.0%). The range of years of service of
respondents working under their manager within their organization at the time of the data
collection was 1 to 5 years (51.6%), then the range of less than a year (17.1%), followed
by 6 to 10 years (16.2%), 11 to15 years (5.1%), the “not applicable” range (5.0%), 16 to
20 years (2.6%), 21 to 25 (1.0%), 26 to 30 years (.9%), and the range of over 61 years
(.5%). A total of 30 countries were represented in the sample. The descriptive statistics in
Table 1 revealed a disproportionate number of respondents were geographically located
in different parts of the world: Africa, America, Asia, and Europe. The most represented
countries were the United States of America with 521 (59.82%) respondents, Cameroon
with 114 (13.09%) participants, Ivory Coast with 40 (4.59%) respondents, France with 10
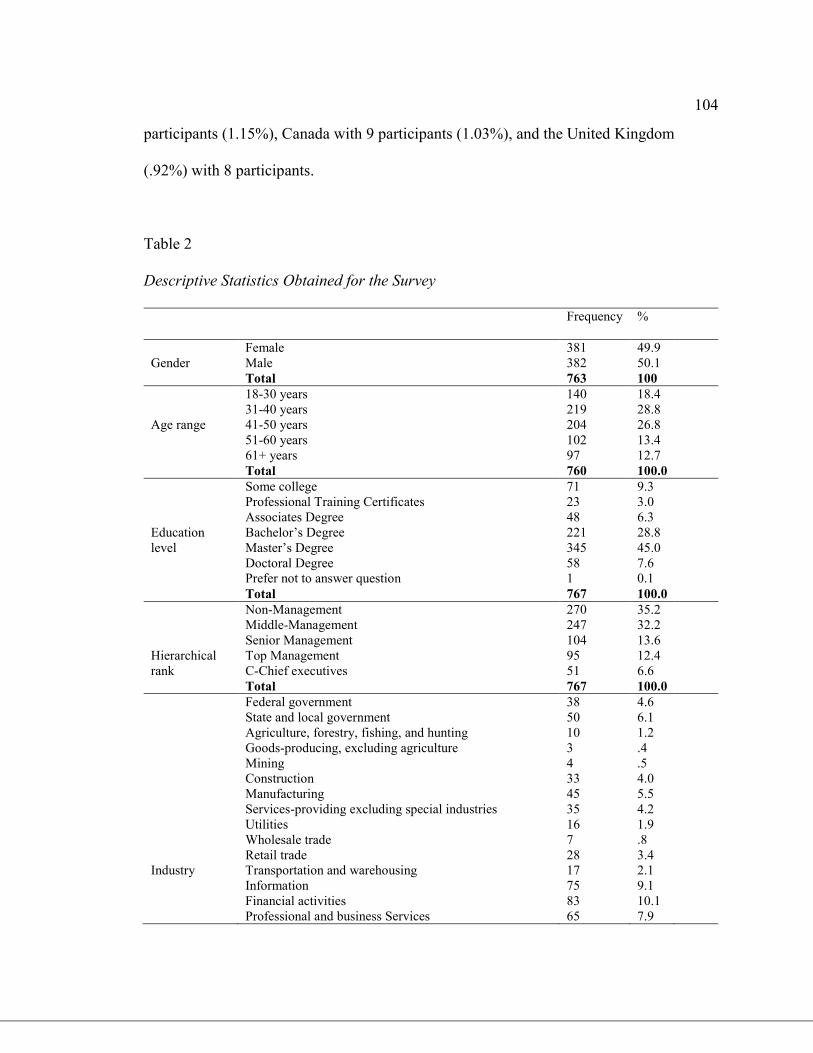
104
participants (1.15%), Canada with 9 participants (1.03%), and the United Kingdom
(.92%) with 8 participants.
Table 2
Descriptive Statistics Obtained for the Survey
Frequency %
Female 381 49.9
Gender Male 382 50.1
Total 763 100
Age range
18-30 years
31-40 years
41-50 years
51-60 years
61+ years
Total
140
219
204
102
97
760
18.4
28.8
26.8
13.4
12.7
100.0
Education
level
Some college
Professional Training Certificates
Associates Degree
Bachelor’s Degree
Master’s Degree
Doctoral Degree
Prefer not to answer question
Total
71
23
48
221
345
58
1
767
9.3
3.0
6.3
28.8
45.0
7.6
0.1
100.0
Hierarchical
rank
Non-Management
Middle-Management
Senior Management
Top Management
C-Chief executives
Total
270
247
104
95
51
767
35.2
32.2
13.6
12.4
6.6
100.0
Industry
Federal government
State and local government
Agriculture, forestry, fishing, and hunting
Goods-producing, excluding agriculture
Mining
Construction
Manufacturing
Services-providing excluding special industries
Utilities
Wholesale trade
Retail trade
Transportation and warehousing
Information
Financial activities
Professional and business Services
38
50
10
3
4
33
45
35
16
7
28
17
75
83
65
4.6
6.1
1.2
.4
.5
4.0
5.5
4.2
1.9
.8
3.4
2.1
9.1
10.1
7.9
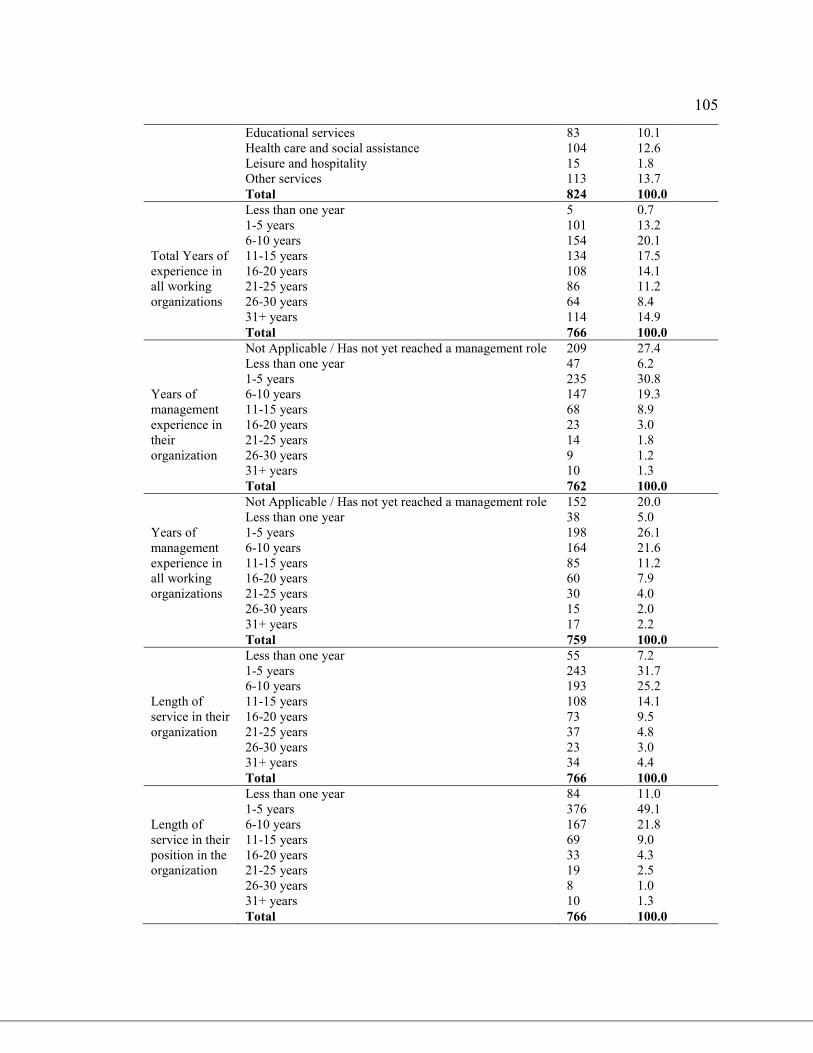
105
Educational services
Health care and social assistance
Leisure and hospitality
Other services
Total
83
104
15
113
824
10.1
12.6
1.8
13.7
100.0
Total Years of
experience in
all working
organizations
Less than one year
1-5 years
6-10 years
11-15 years
16-20 years
21-25 years
26-30 years
31+ years
Total
5
101
154
134
108
86
64
114
766
0.7
13.2
20.1
17.5
14.1
11.2
8.4
14.9
100.0
Years of
management
experience in
their
organization
Not Applicable / Has not yet reached a management role
Less than one year
1-5 years
6-10 years
11-15 years
16-20 years
21-25 years
26-30 years
31+ years
Total
209
47
235
147
68
23
14
9
10
762
27.4
6.2
30.8
19.3
8.9
3.0
1.8
1.2
1.3
100.0
Years of
management
experience in
all working
organizations
Not Applicable / Has not yet reached a management role
Less than one year
1-5 years
6-10 years
11-15 years
16-20 years
21-25 years
26-30 years
31+ years
Total
152
38
198
164
85
60
30
15
17
759
20.0
5.0
26.1
21.6
11.2
7.9
4.0
2.0
2.2
100.0
Length of
service in their
organization
Less than one year
1-5 years
6-10 years
11-15 years
16-20 years
21-25 years
26-30 years
31+ years
Total
55
243
193
108
73
37
23
34
766
7.2
31.7
25.2
14.1
9.5
4.8
3.0
4.4
100.0
Length of
service in their
position in the
organization
Less than one year
1-5 years
6-10 years
11-15 years
16-20 years
21-25 years
26-30 years
31+ years
Total
84
376
167
69
33
19
8
10
766
11.0
49.1
21.8
9.0
4.3
2.5
1.0
1.3
100.0
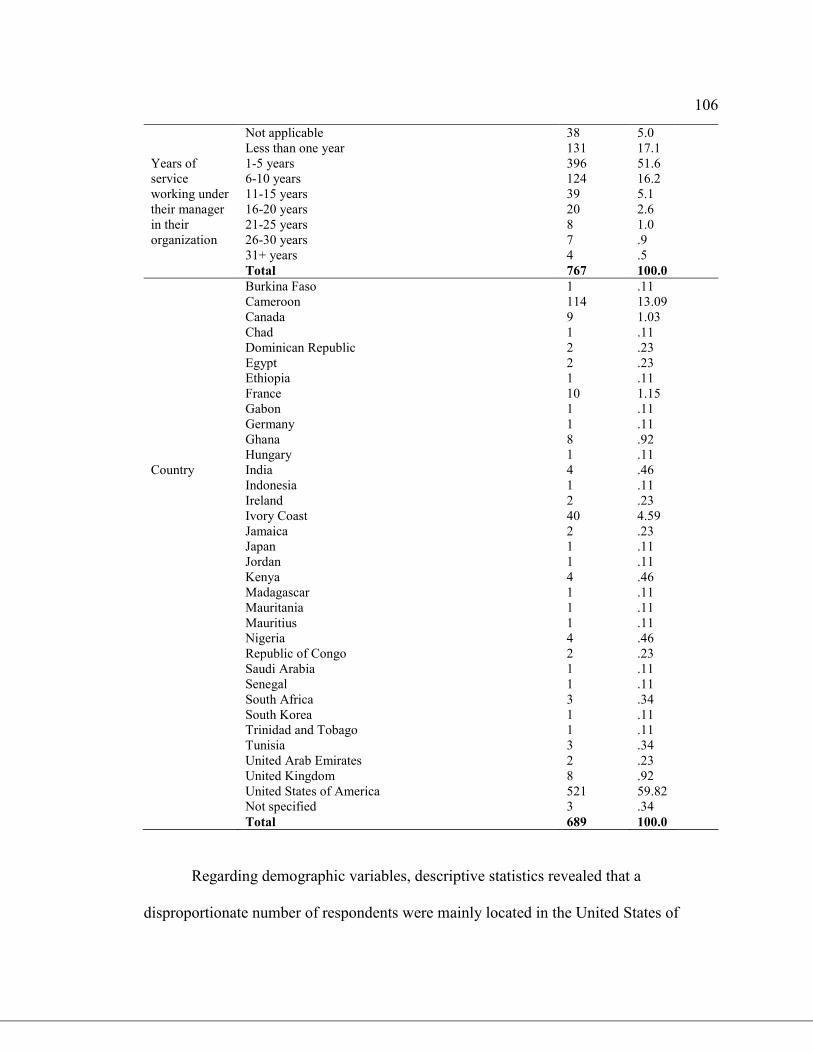
106
Years of
service
working under
their manager
in their
organization
Not applicable
Less than one year
1-5 years
6-10 years
11-15 years
16-20 years
21-25 years
26-30 years
31+ years
Total
38
131
396
124
39
20
8
7
4
767
5.0
17.1
51.6
16.2
5.1
2.6
1.0
.9
.5
100.0
Country
Burkina Faso
Cameroon
Canada
Chad
Dominican Republic
Egypt
Ethiopia
France
Gabon
Germany
Ghana
Hungary
India
Indonesia
Ireland
Ivory Coast
Jamaica
Japan
Jordan
Kenya
Madagascar
Mauritania
Mauritius
Nigeria
Republic of Congo
Saudi Arabia
Senegal
South Africa
South Korea
Trinidad and Tobago
Tunisia
United Arab Emirates
United Kingdom
United States of America
Not specified
Total
1
114
9
1
2
2
1
10
1
1
8
1
4
1
2
40
2
1
1
4
1
1
1
4
2
1
1
3
1
1
3
2
8
521
3
689
.11
13.09
1.03
.11
.23
.23
.11
1.15
.11
.11
.92
.11
.46
.11
.23
4.59
.23
.11
.11
.46
.11
.11
.11
.46
.23
.11
.11
.34
.11
.11
.34
.23
.92
59.82
.34
100.0
Regarding demographic variables, descriptive statistics revealed that a
disproportionate number of respondents were mainly located in the United States of
107
America, Cameroon, Ivory Coast, France, Canada, and the United Kingdom. Moreover,
descriptive statistics showed that the majority of the respondents were found in the age
categories of 31- 40 and 41-50, so the respondents were mature enough to provide
information related to the study. Given that the highest level of education for the majority
of respondents was the master’s degree, participants were at an acceptable level of
educational qualification requirements to provide information related to the study. Given
that the majority of respondents had between 6 and 10 years of work experience or
higher, respondents had adequate experience to provide information about their leader’s
leadership style, the dynamism level of their organizational environment, and their own
maturity level.
Regarding the independent and dependent variables, Table 3 shows the
descriptive statistics associated with transformational leadership, transactional leadership,
servant leadership, and employee job satisfaction. As shown in Table 3, transformational
leadership scores ranged from 0 to 4, with a mean score of 2.5852 and a standard
deviation of .90220. Such a mean score implies that transformational leadership exercised
by the respondents’ leaders was less than the ideal frequency (i.e., 3 or greater) of
transformational leadership according to the research validated benchmark (Bass &
Avolio, 1995). This result shows that the respondents’ leaders were not applying
transformational leadership behavior as equal as the suggested ideal level for the most
effective transformational leadership score.
Regarding transactional leadership, Bass and Avolio (1995) suggested that the
mean score should be between 2.0 - 3.0 (sometimes and fairly often) for contingent
108
rewards and between 1.0 - 2.0 (once in a while and sometimes) for management by
exception-active. Table 3 shows that the mean level of transactional leadership was
2.1536 with a standard deviation of .69839. This result indicates that respondents more
often perceived their managers as transactional leaders than transformational leaders.
Table 3 indicates that the standard deviation of transactional leadership style (i.e., .69839)
was less than the standard deviation of transformational leadership style (i.e., .90220).
This result shows that the responses of participants were less dispersed for transactional
leadership than for transformational leadership.
Servant leadership scores ranged from 1 to 6 with a mean score of 4.4873 and a
standard deviation of 1.07268. Given that this mean score is closer to 5 (i.e.., agree) than
4 (somewhat agree), respondents more generally agreed that their managers were
practicing servant leadership behaviors. Given that the mean score for servant leadership
was higher than that for transactional leadership, which was also higher than that for
transformational leadership, this result implies that comparatively the leadership style
most frequently used by the respondent’s leaders was servant leadership, followed by
transactional leadership, then transformational leadership. As a result, servant leadership
style was relatively the dominant leadership style in the organizations of the study
participants.
Regarding the job satisfaction levels of employees, job satisfaction scores ranged
from 47 to 212 with a mean score of 143.2792 and a standard deviation of 28.12787.
Given that this mean score was between 108 and 144, the majority of participants showed
that they were ambivalent most of the time regarding their job satisfaction levels. There
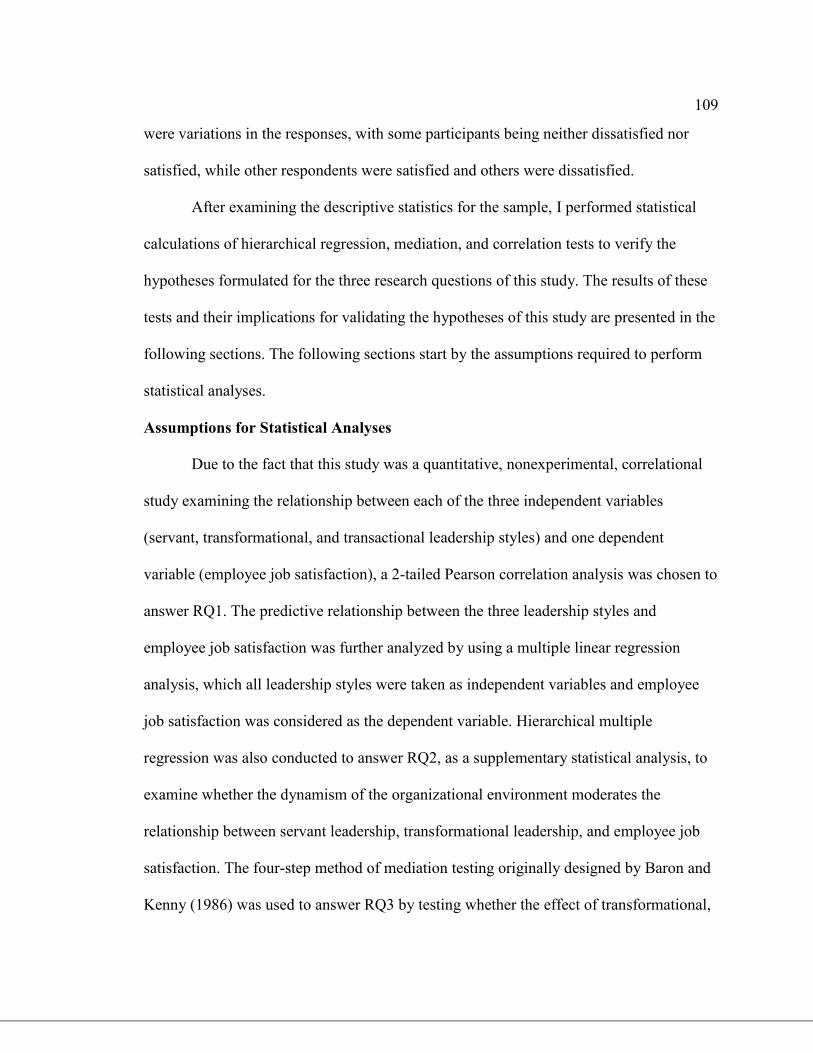
109
were variations in the responses, with some participants being neither dissatisfied nor
satisfied, while other respondents were satisfied and others were dissatisfied.
After examining the descriptive statistics for the sample, I performed statistical
calculations of hierarchical regression, mediation, and correlation tests to verify the
hypotheses formulated for the three research questions of this study. The results of these
tests and their implications for validating the hypotheses of this study are presented in the
following sections. The following sections start by the assumptions required to perform
statistical analyses.
Assumptions for Statistical Analyses
Due to the fact that this study was a quantitative, nonexperimental, correlational
study examining the relationship between each of the three independent variables
(servant, transformational, and transactional leadership styles) and one dependent
variable (employee job satisfaction), a 2-tailed Pearson correlation analysis was chosen to
answer RQ1. The predictive relationship between the three leadership styles and
employee job satisfaction was further analyzed by using a multiple linear regression
analysis, which all leadership styles were taken as independent variables and employee
job satisfaction was considered as the dependent variable. Hierarchical multiple
regression was also conducted to answer RQ2, as a supplementary statistical analysis, to
examine whether the dynamism of the organizational environment moderates the
relationship between servant leadership, transformational leadership, and employee job
satisfaction. The four-step method of mediation testing originally designed by Baron and
Kenny (1986) was used to answer RQ3 by testing whether the effect of transformational,
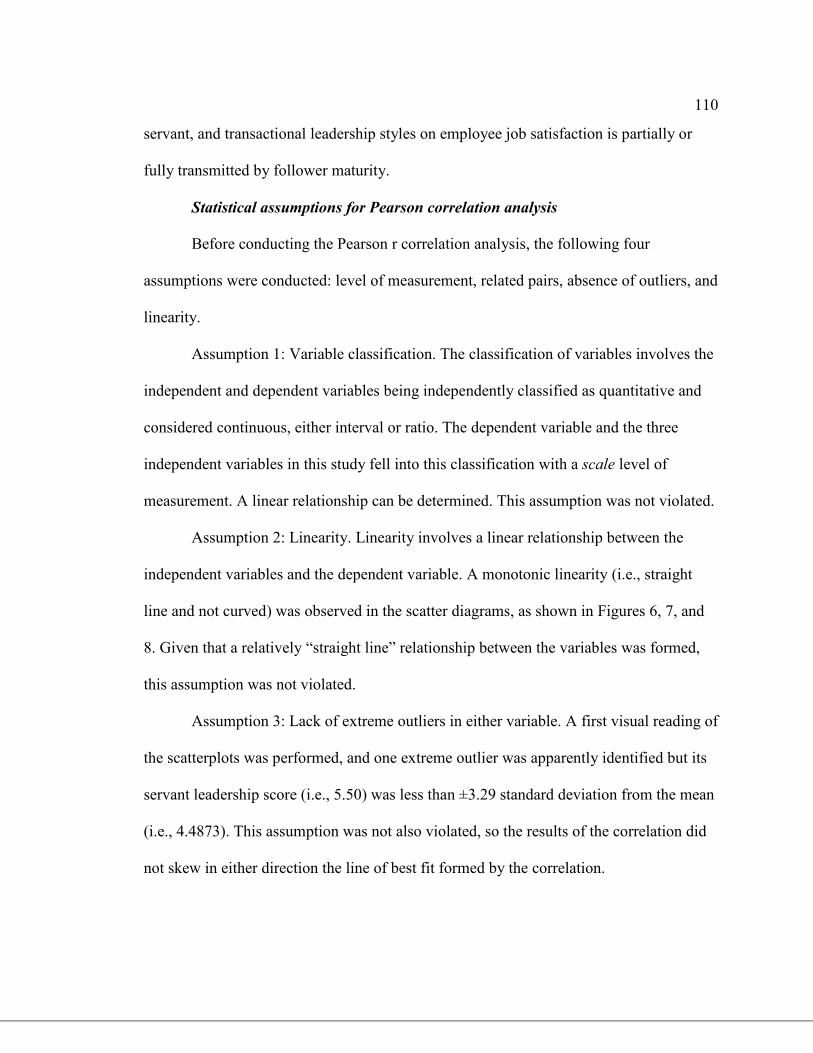
110
servant, and transactional leadership styles on employee job satisfaction is partially or
fully transmitted by follower maturity.
Statistical assumptions for Pearson correlation analysis
Before conducting the Pearson r correlation analysis, the following four
assumptions were conducted: level of measurement, related pairs, absence of outliers, and
linearity.
Assumption 1: Variable classification. The classification of variables involves the
independent and dependent variables being independently classified as quantitative and
considered continuous, either interval or ratio. The dependent variable and the three
independent variables in this study fell into this classification with a scale level of
measurement. A linear relationship can be determined. This assumption was not violated.
Assumption 2: Linearity. Linearity involves a linear relationship between the
independent variables and the dependent variable. A monotonic linearity (i.e., straight
line and not curved) was observed in the scatter diagrams, as shown in Figures 6, 7, and
8. Given that a relatively “straight line” relationship between the variables was formed,
this assumption was not violated.
Assumption 3: Lack of extreme outliers in either variable. A first visual reading of
the scatterplots was performed, and one extreme outlier was apparently identified but its
servant leadership score (i.e., 5.50) was less than ±3.29 standard deviation from the mean
(i.e., 4.4873). This assumption was not also violated, so the results of the correlation did
not skew in either direction the line of best fit formed by the correlation.
111
Assumption 4: Normality. The presence of normal distribution was tested by
applying skewness and kurtosis tests as well as histograms. As shown in Table 3, the
results of the skewness and kurtosis tests for the three independent variables and the
dependent variable were in the range of -1 and +1, indicating that the assumption of
normality was met. Regarding the kurtosis, job satisfaction has a negative kurtosis,
meaning that the distribution is slightly flatter than normal or platykurtik. Table 3 shows
the opposite for transformational, transactional, and servant leadership in which the
kurtosis value is positive. The histogram plots enabled the data to be inspected to
determine whether normal distribution was evident. An analysis of the histograms
depicted in Figures 9–12 indicated that the assumption of normality had not been violated
for any of the three independent variables and the dependent variable.
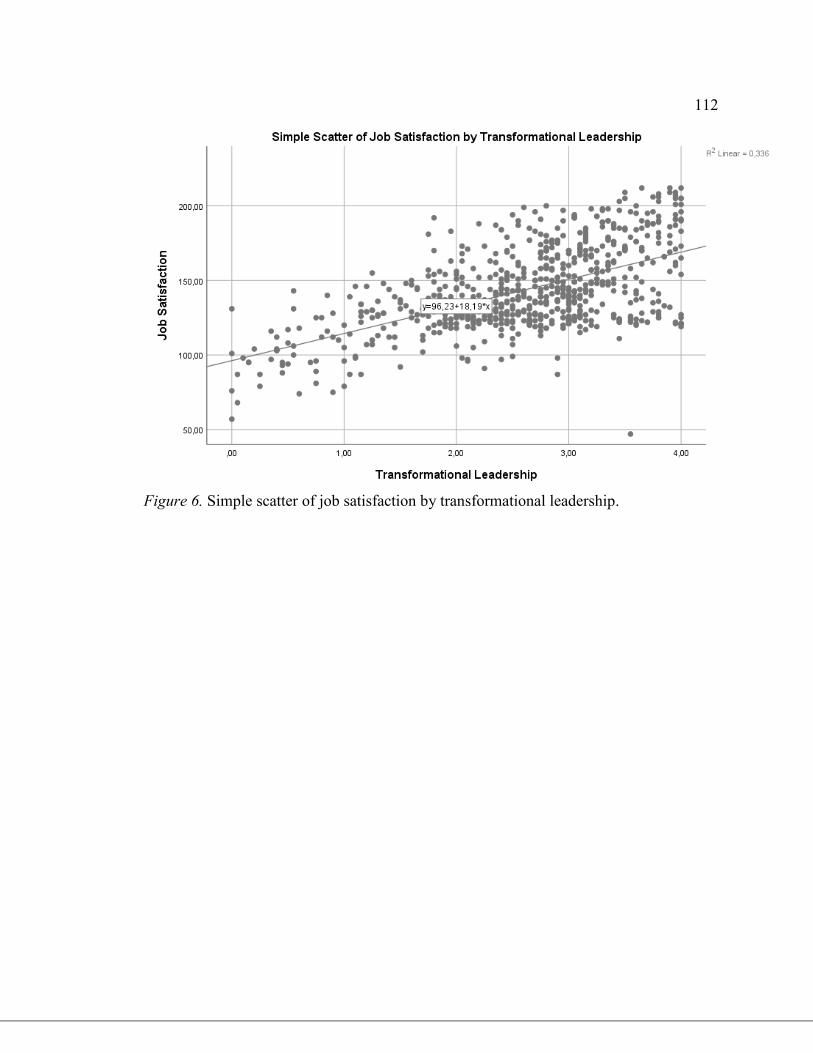
112
Figure 6. Simple scatter of job satisfaction by transformational leadership.
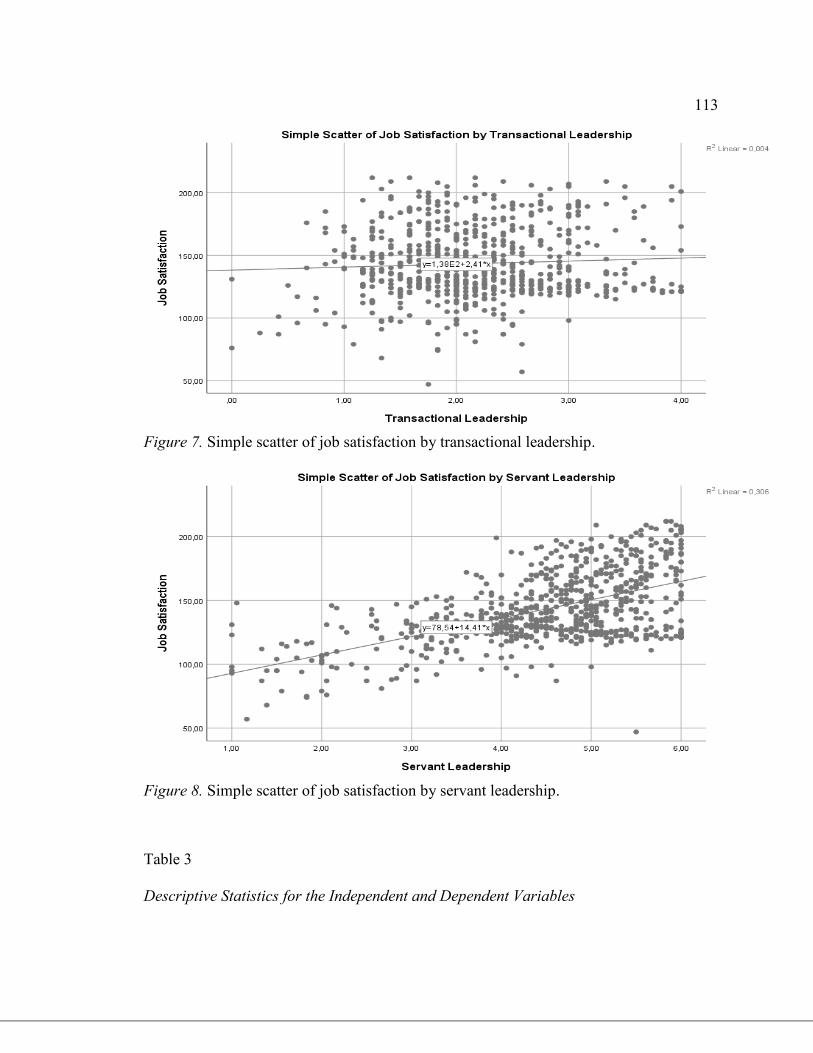
113
Figure 7. Simple scatter of job satisfaction by transactional leadership.
Figure 8. Simple scatter of job satisfaction by servant leadership.
Table 3
Descriptive Statistics for the Independent and Dependent Variables
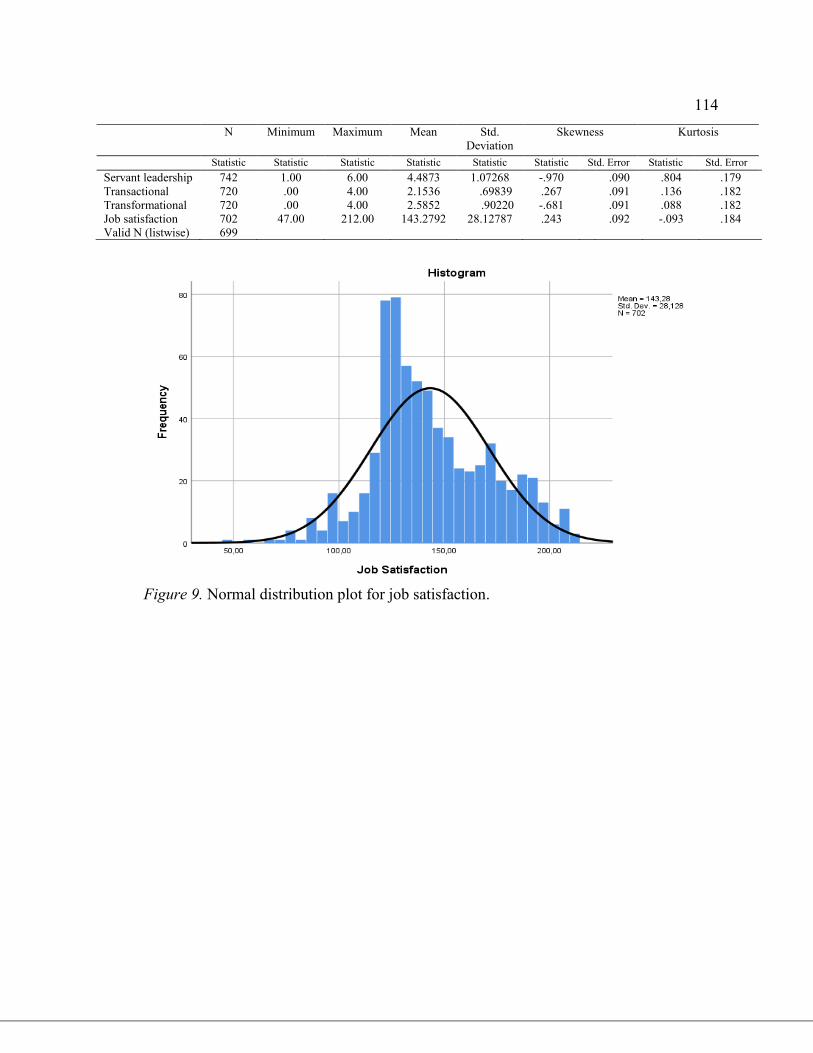
114
N
Minimum Maximum Mean Std.
Deviation
Skewness Kurtosis
Statistic Statistic Statistic Statistic Statistic Statistic Std. Error Statistic Std. Error
Servant leadership 742 1.00 6.00 4.4873 1.07268 -.970 .090 .804 .179
Transactional 720 .00 4.00 2.1536 .69839 .267 .091 .136 .182
Transformational 720 .00 4.00 2.5852 .90220 -.681 .091 .088 .182
Job satisfaction
Valid N (listwise)
702
699
47.00 212.00 143.2792 28.12787 .243 .092 -.093 .184
Figure 9. Normal distribution plot for job satisfaction.
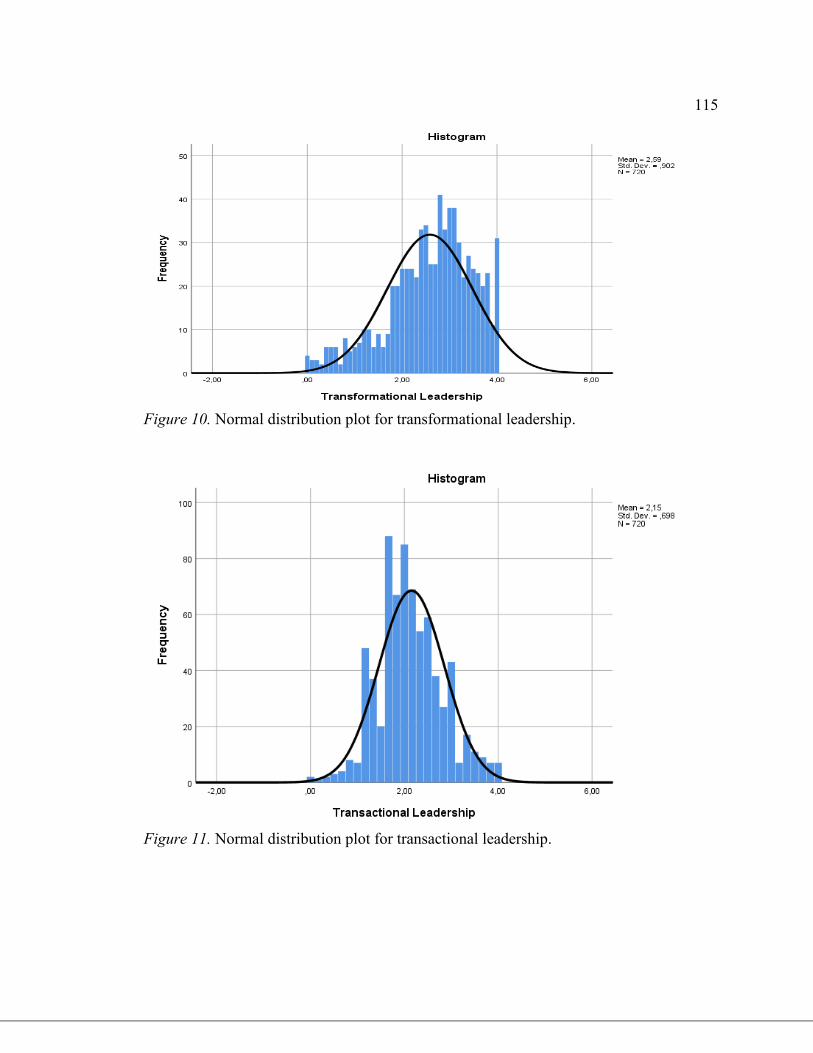
115
Figure 10. Normal distribution plot for transformational leadership.
Figure 11. Normal distribution plot for transactional leadership.
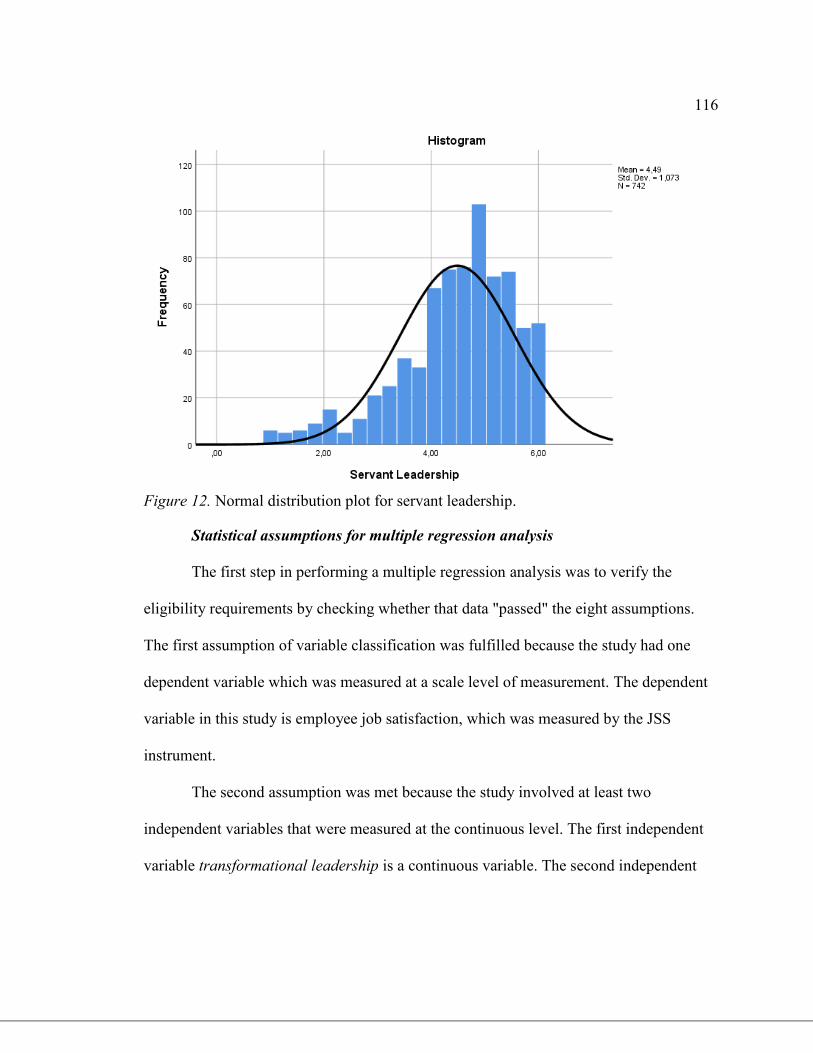
116
Figure 12. Normal distribution plot for servant leadership.
Statistical assumptions for multiple regression analysis
The first step in performing a multiple regression analysis was to verify the
eligibility requirements by checking whether that data "passed" the eight assumptions.
The first assumption of variable classification was fulfilled because the study had one
dependent variable which was measured at a scale level of measurement. The dependent
variable in this study is employee job satisfaction, which was measured by the JSS
instrument.
The second assumption was met because the study involved at least two
independent variables that were measured at the continuous level. The first independent
variable transformational leadership is a continuous variable. The second independent
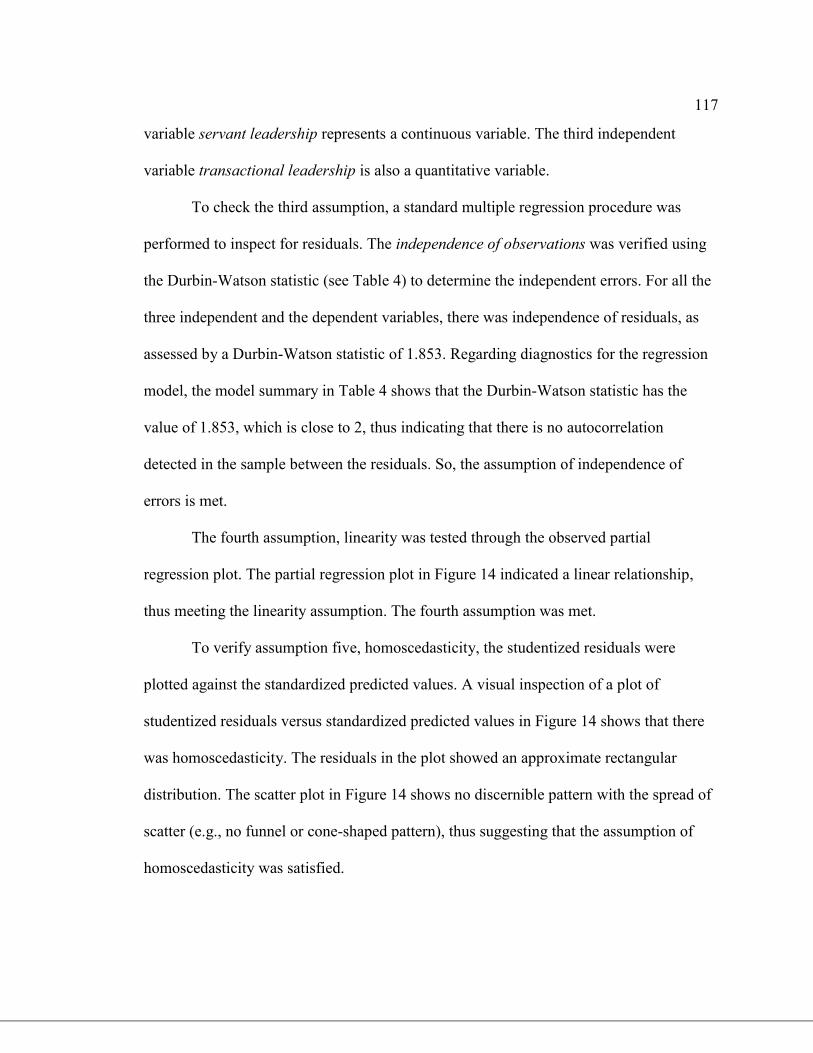
117
variable servant leadership represents a continuous variable. The third independent
variable transactional leadership is also a quantitative variable.
To check the third assumption, a standard multiple regression procedure was
performed to inspect for residuals. The independence of observations was verified using
the Durbin-Watson statistic (see Table 4) to determine the independent errors. For all the
three independent and the dependent variables, there was independence of residuals, as
assessed by a Durbin-Watson statistic of 1.853. Regarding diagnostics for the regression
model, the model summary in Table 4 shows that the Durbin-Watson statistic has the
value of 1.853, which is close to 2, thus indicating that there is no autocorrelation
detected in the sample between the residuals. So, the assumption of independence of
errors is met.
The fourth assumption, linearity was tested through the observed partial
regression plot. The partial regression plot in Figure 14 indicated a linear relationship,
thus meeting the linearity assumption. The fourth assumption was met.
To verify assumption five, homoscedasticity, the studentized residuals were
plotted against the standardized predicted values. A visual inspection of a plot of
studentized residuals versus standardized predicted values in Figure 14 shows that there
was homoscedasticity. The residuals in the plot showed an approximate rectangular
distribution. The scatter plot in Figure 14 shows no discernible pattern with the spread of
scatter (e.g., no funnel or cone-shaped pattern), thus suggesting that the assumption of
homoscedasticity was satisfied.
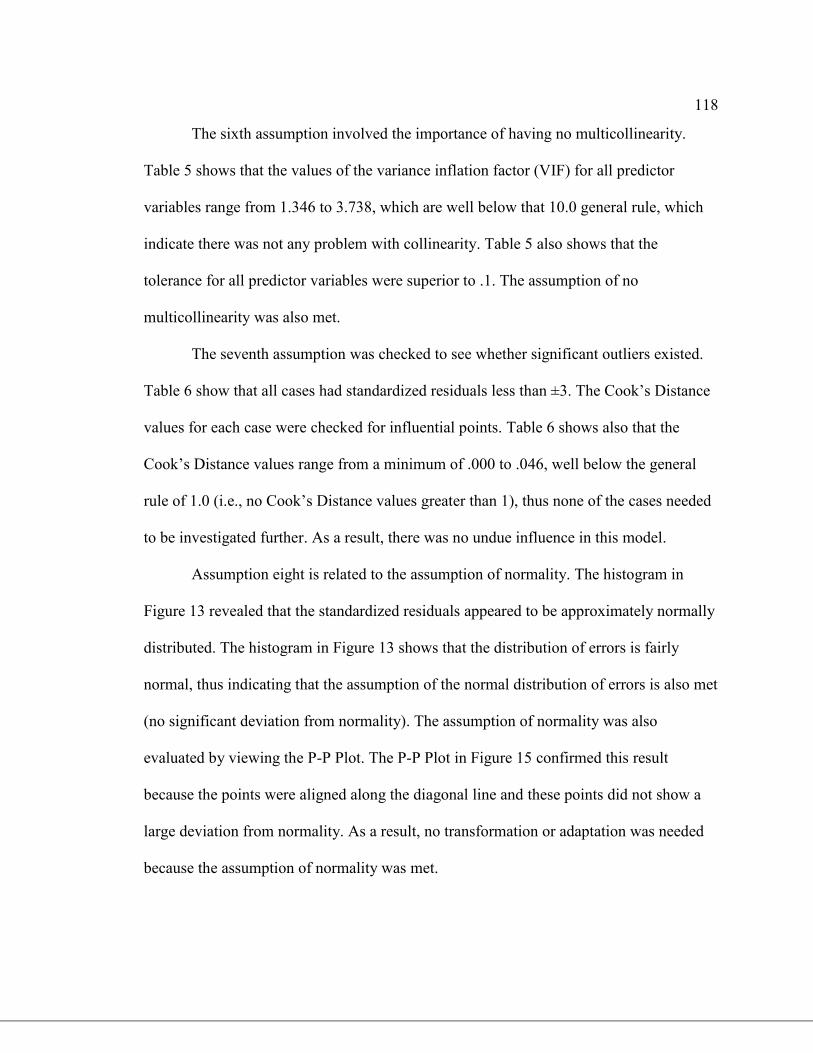
118
The sixth assumption involved the importance of having no multicollinearity.
Table 5 shows that the values of the variance inflation factor (VIF) for all predictor
variables range from 1.346 to 3.738, which are well below that 10.0 general rule, which
indicate there was not any problem with collinearity. Table 5 also shows that the
tolerance for all predictor variables were superior to .1. The assumption of no
multicollinearity was also met.
The seventh assumption was checked to see whether significant outliers existed.
Table 6 show that all cases had standardized residuals less than ±3. The Cook’s Distance
values for each case were checked for influential points. Table 6 shows also that the
Cook’s Distance values range from a minimum of .000 to .046, well below the general
rule of 1.0 (i.e., no Cook’s Distance values greater than 1), thus none of the cases needed
to be investigated further. As a result, there was no undue influence in this model.
Assumption eight is related to the assumption of normality. The histogram in
Figure 13 revealed that the standardized residuals appeared to be approximately normally
distributed. The histogram in Figure 13 shows that the distribution of errors is fairly
normal, thus indicating that the assumption of the normal distribution of errors is also met
(no significant deviation from normality). The assumption of normality was also
evaluated by viewing the P-P Plot. The P-P Plot in Figure 15 confirmed this result
because the points were aligned along the diagonal line and these points did not show a
large deviation from normality. As a result, no transformation or adaptation was needed
because the assumption of normality was met.
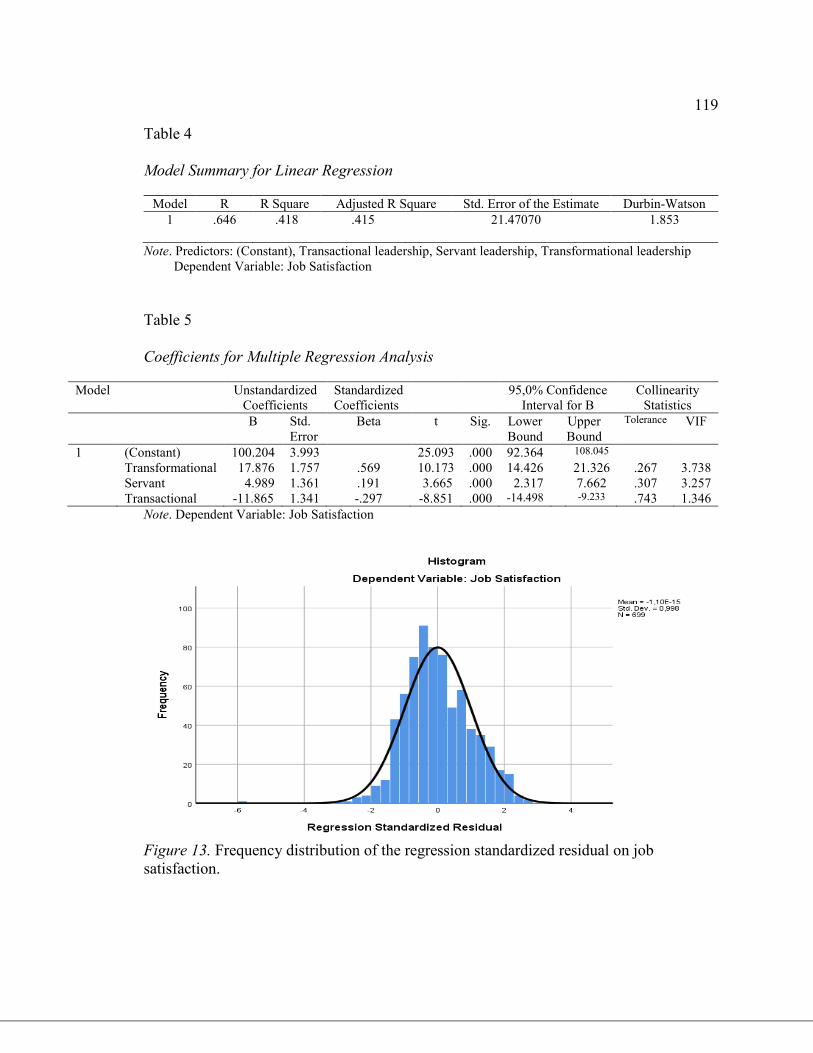
119
Table 4
Model Summary for Linear Regression
Model R R Square Adjusted R Square Std. Error of the Estimate Durbin-Watson
1
.646 .418 .415 21.47070 1.853
Note. Predictors: (Constant), Transactional leadership, Servant leadership, Transformational leadership
Dependent Variable: Job Satisfaction
Table 5
Coefficients for Multiple Regression Analysis
Model
Unstandardized
Coefficients
Standardized
Coefficients
95,0% Confidence
Interval for B
Collinearity
Statistics
B Std.
Error
Beta t Sig. Lower
Bound
Upper
Bound
Tolerance VIF
1 (Constant) 100.204 3.993 25.093 .000 92.364 108.045
Transformational 17.876 1.757 .569 10.173 .000 14.426 21.326 .267 3.738
Servant 4.989 1.361 .191 3.665 .000 2.317 7.662 .307 3.257
Transactional -11.865 1.341 -.297 -8.851 .000 -14.498 -9.233 .743 1.346
Note. Dependent Variable: Job Satisfaction
Figure 13. Frequency distribution of the regression standardized residual on job
satisfaction.
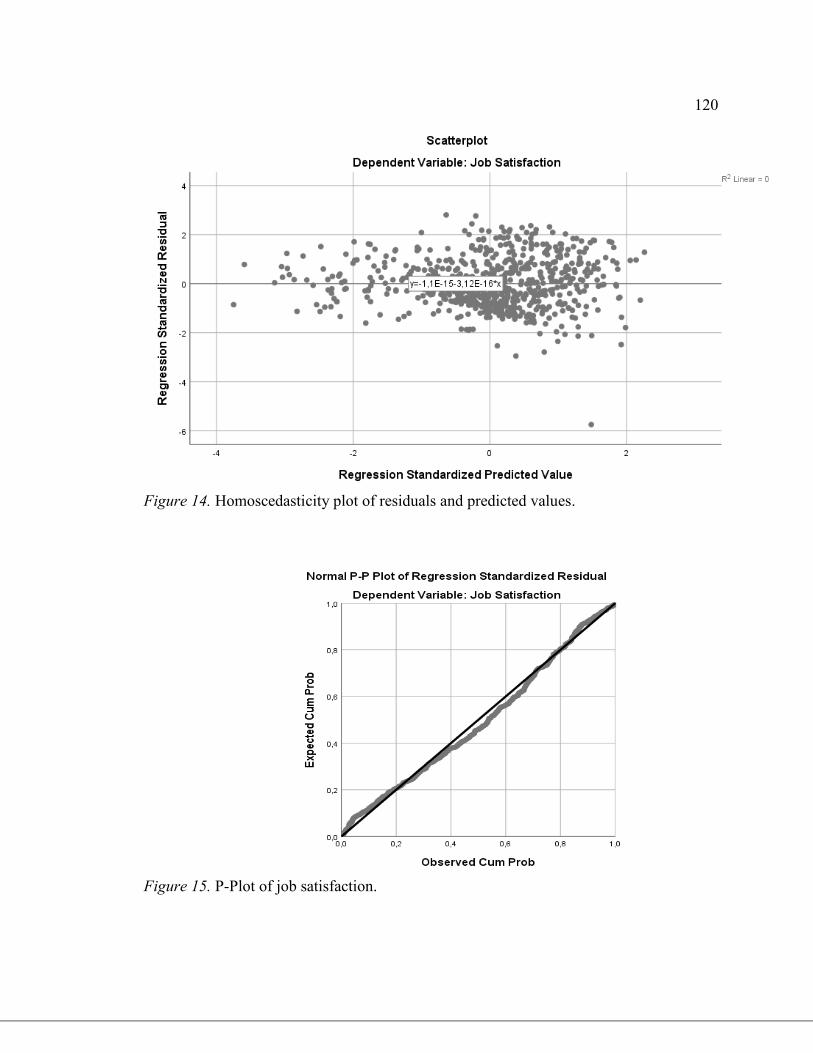
120
Figure 14. Homoscedasticity plot of residuals and predicted values.
Figure 15. P-Plot of job satisfaction.
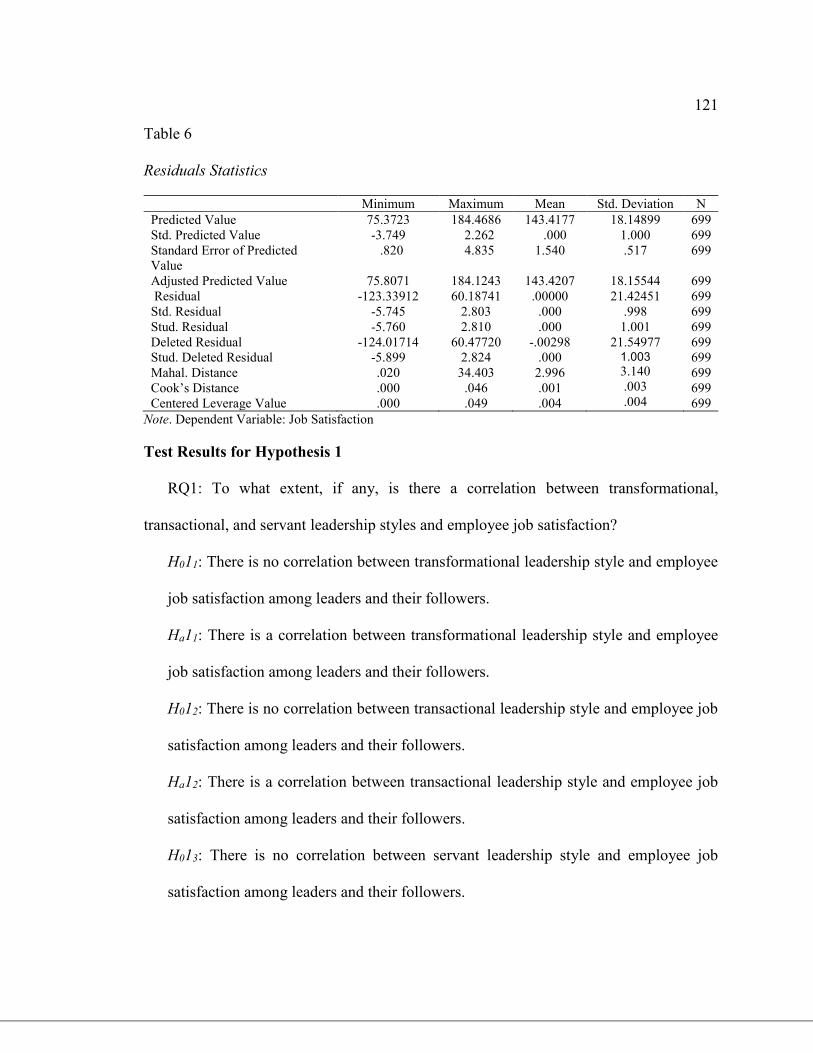
121
Table 6
Residuals Statistics
Minimum Maximum Mean Std. Deviation N
Predicted Value 75.3723 184.4686 143.4177 18.14899 699
Std. Predicted Value -3.749 2.262 .000 1.000 699
Standard Error of Predicted
Value
.820 4.835 1.540 .517 699
Adjusted Predicted Value
Residual
Std. Residual
Stud. Residual
Deleted Residual
Stud. Deleted Residual
Mahal. Distance
Cook’s Distance
Centered Leverage Value
75.8071
-123.33912
-5.745
-5.760
-124.01714
-5.899
.020
.000
.000
184.1243
60.18741
2.803
2.810
60.47720
2.824
34.403
.046
.049
143.4207
.00000
.000
.000
-.00298
.000
2.996
.001
.004
18.15544
21.42451
.998
1.001
21.54977 1.003
3.140
.003
.004
699
699
699
699
699
699
699
699
699
Note. Dependent Variable: Job Satisfaction
Test Results for Hypothesis 1
RQ1: To what extent, if any, is there a correlation between transformational,
transactional, and servant leadership styles and employee job satisfaction?
H011: There is no correlation between transformational leadership style and employee
job satisfaction among leaders and their followers.
Ha11: There is a correlation between transformational leadership style and employee
job satisfaction among leaders and their followers.
H012: There is no correlation between transactional leadership style and employee job
satisfaction among leaders and their followers.
Ha12: There is a correlation between transactional leadership style and employee job
satisfaction among leaders and their followers.
H013: There is no correlation between servant leadership style and employee job
satisfaction among leaders and their followers.
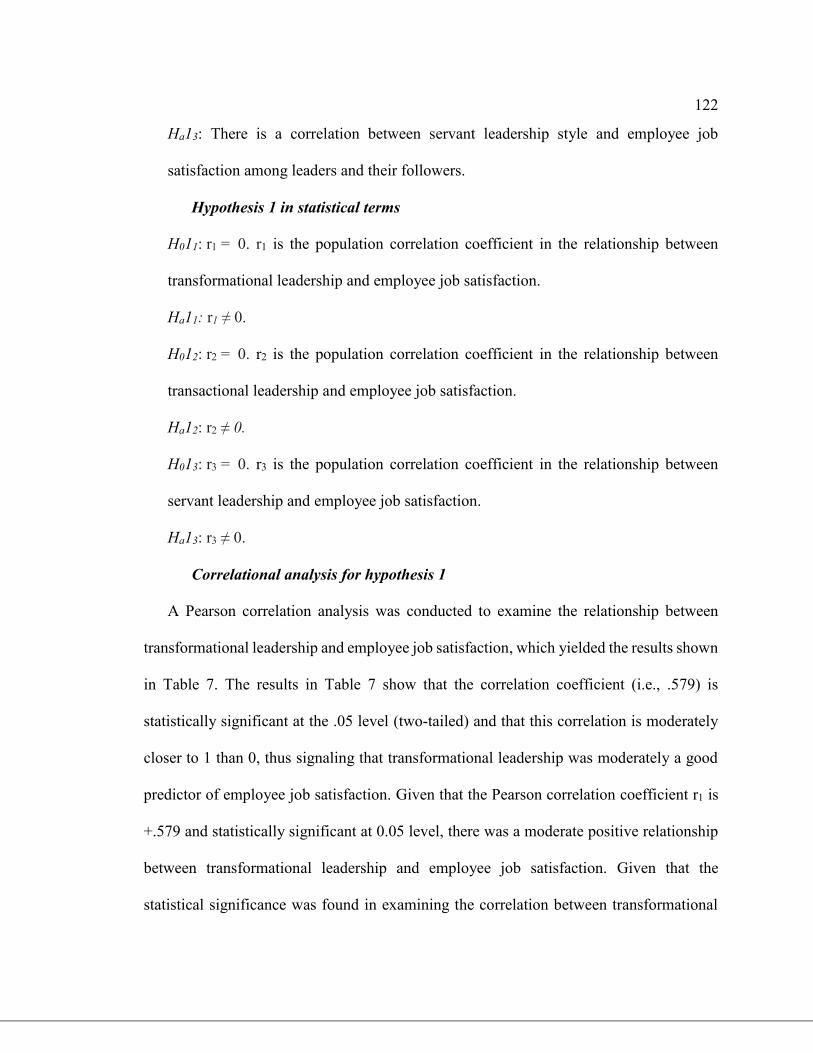
122
Ha13: There is a correlation between servant leadership style and employee job
satisfaction among leaders and their followers.
Hypothesis 1 in statistical terms
H011: r1 = 0. r1 is the population correlation coefficient in the relationship between
transformational leadership and employee job satisfaction.
Ha11: r1 ≠ 0.
H012: r2 = 0. r2 is the population correlation coefficient in the relationship between
transactional leadership and employee job satisfaction.
Ha12: r2 ≠ 0.
H013: r3 = 0. r3 is the population correlation coefficient in the relationship between
servant leadership and employee job satisfaction.
Ha13: r3 ≠ 0.
Correlational analysis for hypothesis 1
A Pearson correlation analysis was conducted to examine the relationship between
transformational leadership and employee job satisfaction, which yielded the results shown
in Table 7. The results in Table 7 show that the correlation coefficient (i.e., .579) is
statistically significant at the .05 level (two-tailed) and that this correlation is moderately
closer to 1 than 0, thus signaling that transformational leadership was moderately a good
predictor of employee job satisfaction. Given that the Pearson correlation coefficient r1 is
+.579 and statistically significant at 0.05 level, there was a moderate positive relationship
between transformational leadership and employee job satisfaction. Given that the
statistical significance was found in examining the correlation between transformational
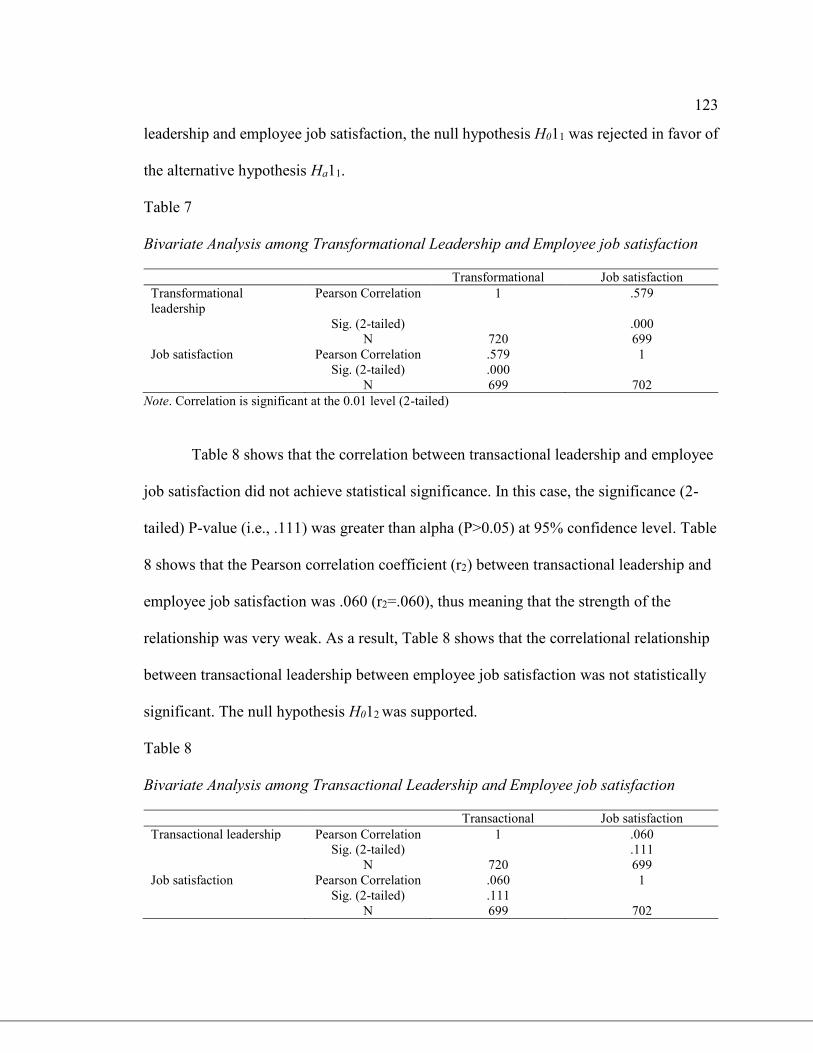
123
leadership and employee job satisfaction, the null hypothesis H011 was rejected in favor of
the alternative hypothesis Ha11.
Table 7
Bivariate Analysis among Transformational Leadership and Employee job satisfaction
Transformational Job satisfaction
Transformational
leadership
Pearson Correlation 1 .579
Sig. (2-tailed) .000
N 720 699
Job satisfaction
Pearson Correlation
Sig. (2-tailed)
N
.579
.000
699
1
702
Note. Correlation is significant at the 0.01 level (2-tailed)
Table 8 shows that the correlation between transactional leadership and employee
job satisfaction did not achieve statistical significance. In this case, the significance (2-
tailed) P-value (i.e., .111) was greater than alpha (P>0.05) at 95% confidence level. Table
8 shows that the Pearson correlation coefficient (r2) between transactional leadership and
employee job satisfaction was .060 (r2=.060), thus meaning that the strength of the
relationship was very weak. As a result, Table 8 shows that the correlational relationship
between transactional leadership between employee job satisfaction was not statistically
significant. The null hypothesis H012 was supported.
Table 8
Bivariate Analysis among Transactional Leadership and Employee job satisfaction
Transactional Job satisfaction
Transactional leadership Pearson Correlation 1 .060
Sig. (2-tailed) .111
N 720 699
Job satisfaction
Pearson Correlation
Sig. (2-tailed)
N
.060
.111
699
1
702
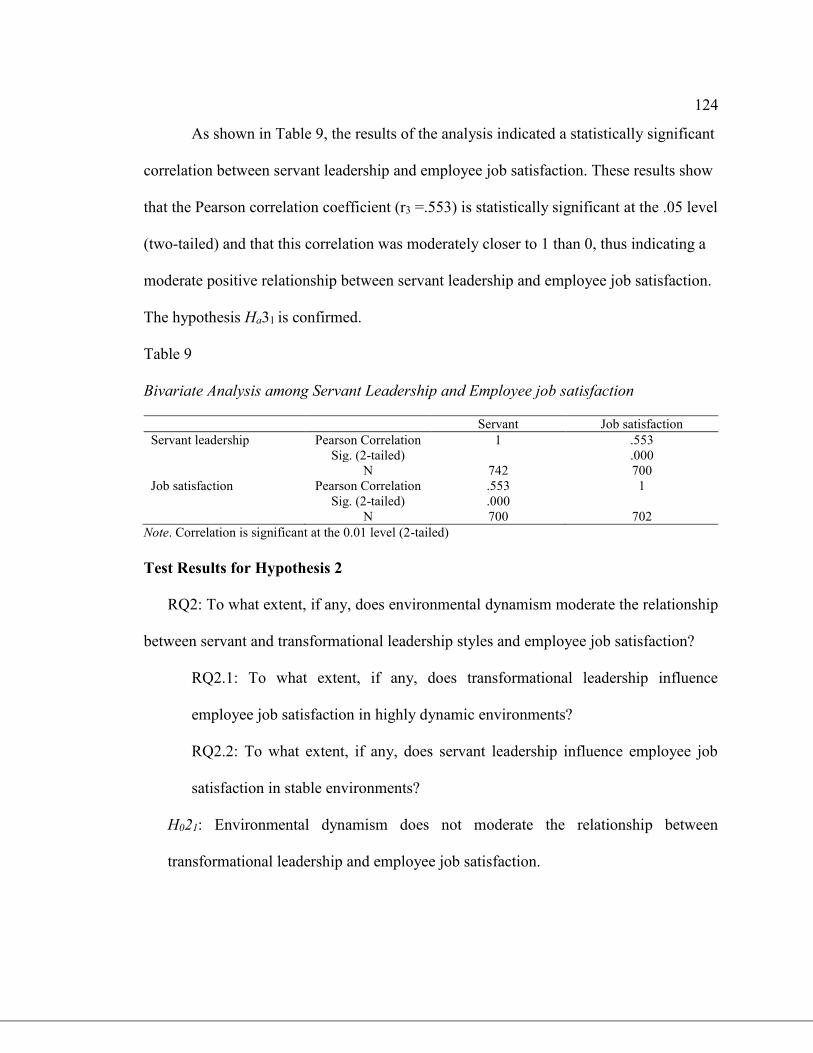
124
As shown in Table 9, the results of the analysis indicated a statistically significant
correlation between servant leadership and employee job satisfaction. These results show
that the Pearson correlation coefficient (r3 =.553) is statistically significant at the .05 level
(two-tailed) and that this correlation was moderately closer to 1 than 0, thus indicating a
moderate positive relationship between servant leadership and employee job satisfaction.
The hypothesis Ha31 is confirmed.
Table 9
Bivariate Analysis among Servant Leadership and Employee job satisfaction
Servant Job satisfaction
Servant leadership Pearson Correlation 1 .553
Sig. (2-tailed) .000
N 742 700
Job satisfaction
Pearson Correlation
Sig. (2-tailed)
N
.553
.000
700
1
702
Note. Correlation is significant at the 0.01 level (2-tailed)
Test Results for Hypothesis 2
RQ2: To what extent, if any, does environmental dynamism moderate the relationship
between servant and transformational leadership styles and employee job satisfaction?
RQ2.1: To what extent, if any, does transformational leadership influence
employee job satisfaction in highly dynamic environments?
RQ2.2: To what extent, if any, does servant leadership influence employee job
satisfaction in stable environments?
H021: Environmental dynamism does not moderate the relationship between
transformational leadership and employee job satisfaction.
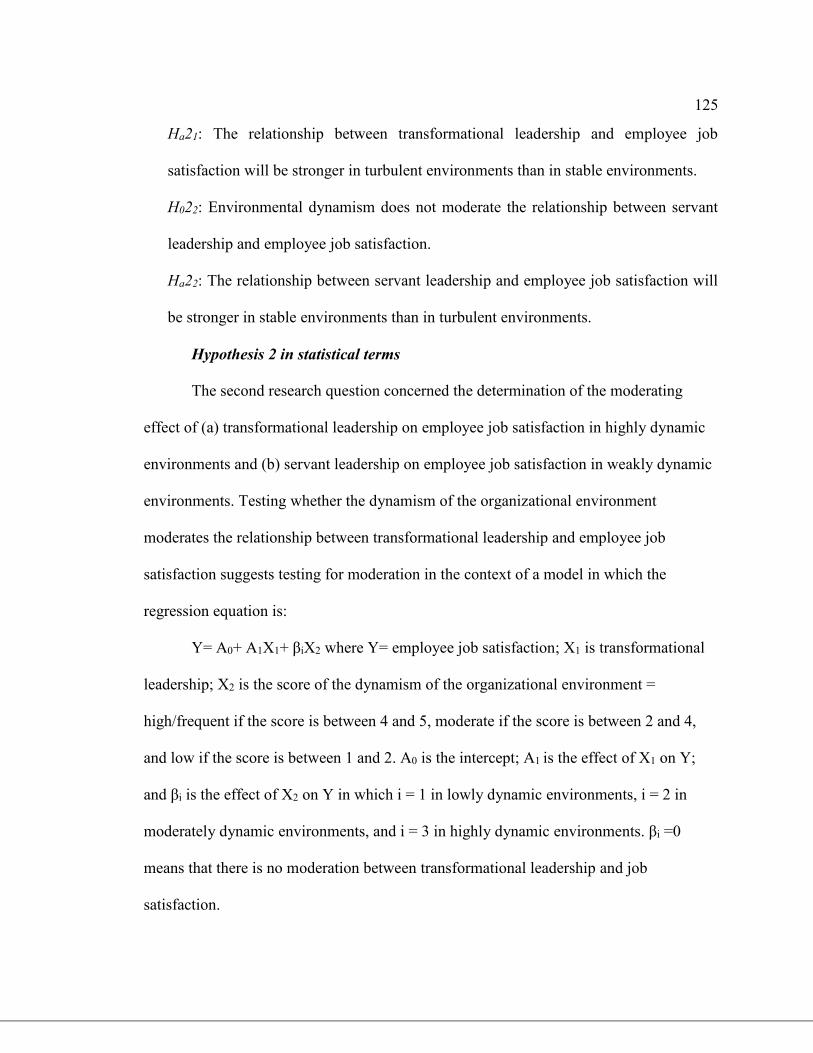
125
Ha21: The relationship between transformational leadership and employee job
satisfaction will be stronger in turbulent environments than in stable environments.
H022: Environmental dynamism does not moderate the relationship between servant
leadership and employee job satisfaction.
Ha22: The relationship between servant leadership and employee job satisfaction will
be stronger in stable environments than in turbulent environments.
Hypothesis 2 in statistical terms
The second research question concerned the determination of the moderating
effect of (a) transformational leadership on employee job satisfaction in highly dynamic
environments and (b) servant leadership on employee job satisfaction in weakly dynamic
environments. Testing whether the dynamism of the organizational environment
moderates the relationship between transformational leadership and employee job
satisfaction suggests testing for moderation in the context of a model in which the
regression equation is:
Y= A0+ A1X1+ βiX2 where Y= employee job satisfaction; X1 is transformational
leadership; X2 is the score of the dynamism of the organizational environment =
high/frequent if the score is between 4 and 5, moderate if the score is between 2 and 4,
and low if the score is between 1 and 2. A0 is the intercept; A1 is the effect of X1 on Y;
and βi is the effect of X2 on Y in which i = 1 in lowly dynamic environments, i = 2 in
moderately dynamic environments, and i = 3 in highly dynamic environments. βi =0
means that there is no moderation between transformational leadership and job
satisfaction.
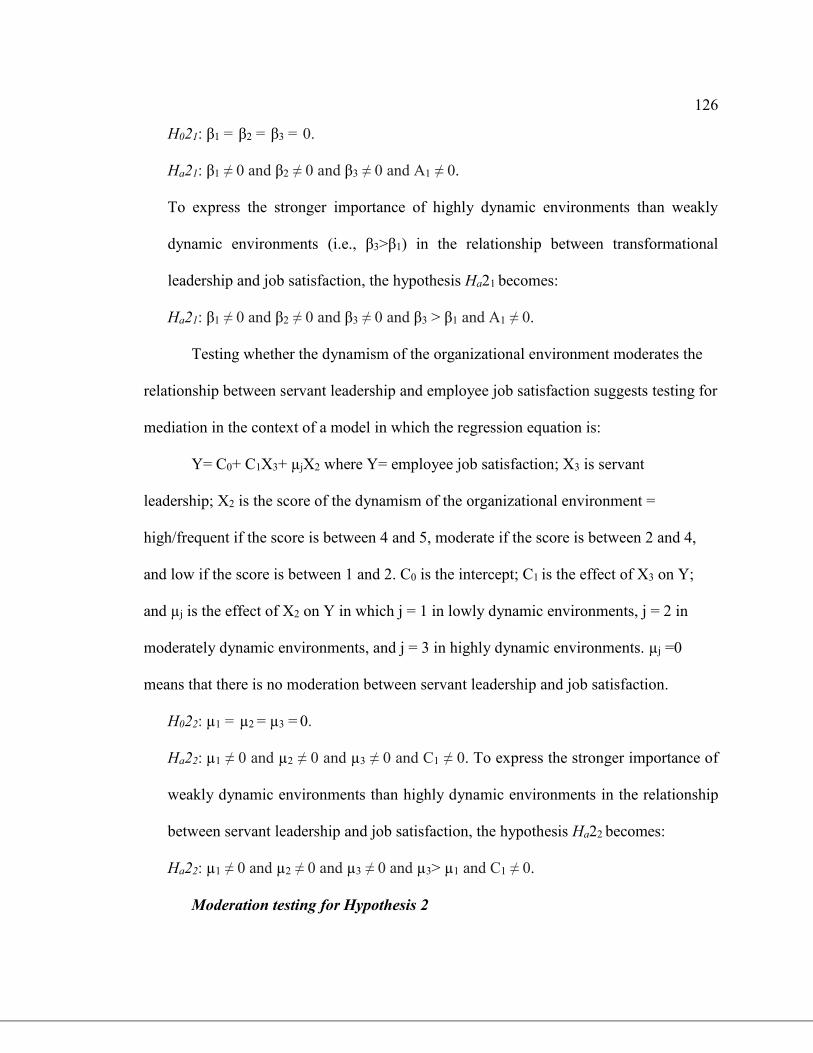
126
H021: β1 = β2 = β3 = 0.
Ha21: β1 ≠ 0 and β2 ≠ 0 and β3 ≠ 0 and A1 ≠ 0.
To express the stronger importance of highly dynamic environments than weakly
dynamic environments (i.e., β3>β1) in the relationship between transformational
leadership and job satisfaction, the hypothesis Ha21 becomes:
Ha21: β1 ≠ 0 and β2 ≠ 0 and β3 ≠ 0 and β3 > β1 and A1 ≠ 0.
Testing whether the dynamism of the organizational environment moderates the
relationship between servant leadership and employee job satisfaction suggests testing for
mediation in the context of a model in which the regression equation is:
Y= C0+ C1X3+ µjX2 where Y= employee job satisfaction; X3 is servant
leadership; X2 is the score of the dynamism of the organizational environment =
high/frequent if the score is between 4 and 5, moderate if the score is between 2 and 4,
and low if the score is between 1 and 2. C0 is the intercept; C1 is the effect of X3 on Y;
and µj is the effect of X2 on Y in which j = 1 in lowly dynamic environments, j = 2 in
moderately dynamic environments, and j = 3 in highly dynamic environments. µj =0
means that there is no moderation between servant leadership and job satisfaction.
H022: µ1 = µ2 = µ3 = 0.
Ha22: µ1 ≠ 0 and µ2 ≠ 0 and µ3 ≠ 0 and C1 ≠ 0. To express the stronger importance of
weakly dynamic environments than highly dynamic environments in the relationship
between servant leadership and job satisfaction, the hypothesis Ha22 becomes:
Ha22: µ1 ≠ 0 and µ2 ≠ 0 and µ3 ≠ 0 and µ3> µ1 and C1 ≠ 0.
Moderation testing for Hypothesis 2
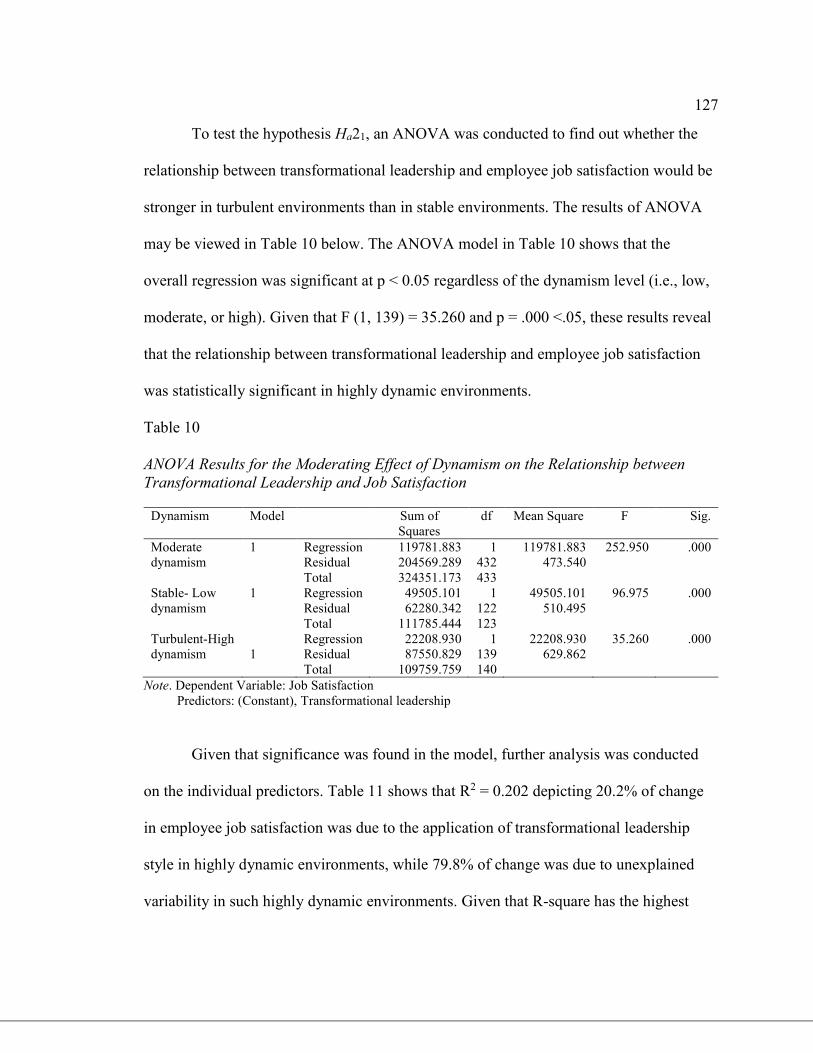
127
To test the hypothesis Ha21, an ANOVA was conducted to find out whether the
relationship between transformational leadership and employee job satisfaction would be
stronger in turbulent environments than in stable environments. The results of ANOVA
may be viewed in Table 10 below. The ANOVA model in Table 10 shows that the
overall regression was significant at p < 0.05 regardless of the dynamism level (i.e., low,
moderate, or high). Given that F (1, 139) = 35.260 and p = .000 <.05, these results reveal
that the relationship between transformational leadership and employee job satisfaction
was statistically significant in highly dynamic environments.
Table 10
ANOVA Results for the Moderating Effect of Dynamism on the Relationship between
Transformational Leadership and Job Satisfaction
Dynamism Model Sum of
Squares
df Mean Square F Sig.
Moderate
dynamism
1 Regression
Residual
119781.883
204569.289
1
432
119781.883
473.540
252.950 .000
Total 324351.173 433
Stable- Low
dynamism
Turbulent-High
dynamism
1
1
Regression
Residual
Total
Regression
Residual
Total
49505.101
62280.342
111785.444
22208.930
87550.829
109759.759
1
122
123
1
139
140
49505.101
510.495
22208.930
629.862
96.975
35.260
.000
.000
Note. Dependent Variable: Job Satisfaction
Predictors: (Constant), Transformational leadership
Given that significance was found in the model, further analysis was conducted
on the individual predictors. Table 11 shows that R2 = 0.202 depicting 20.2% of change
in employee job satisfaction was due to the application of transformational leadership
style in highly dynamic environments, while 79.8% of change was due to unexplained
variability in such highly dynamic environments. Given that R-square has the highest
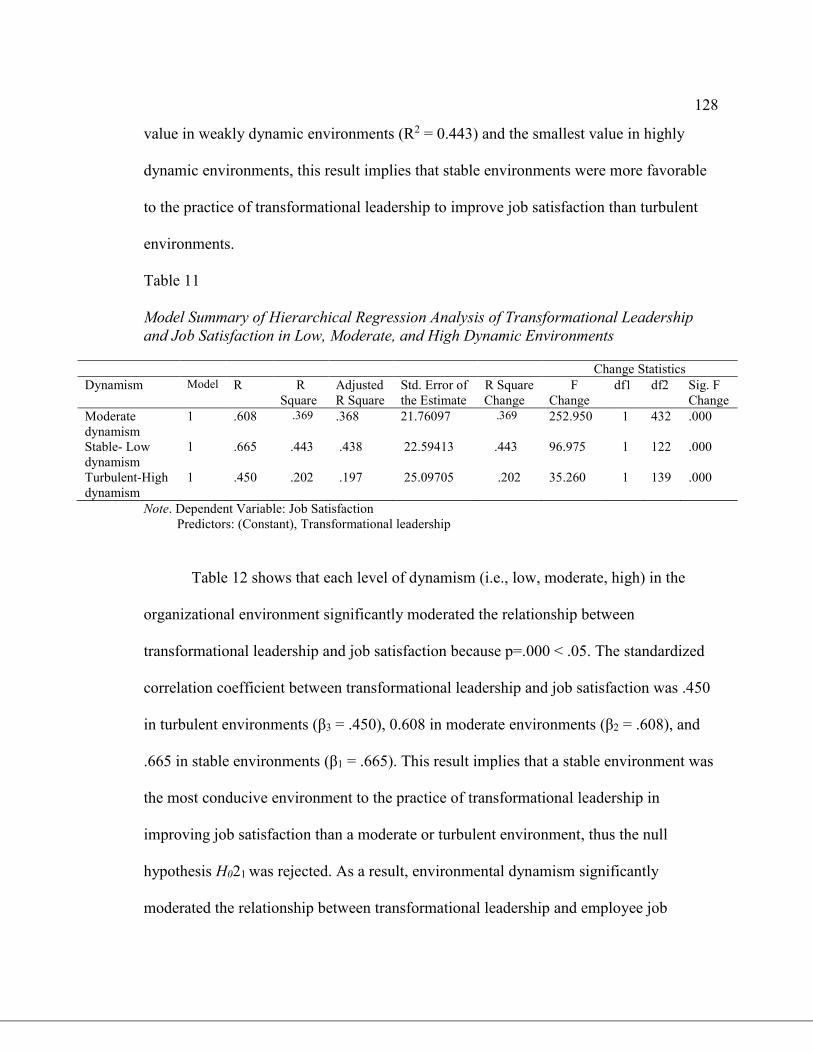
128
value in weakly dynamic environments (R2 = 0.443) and the smallest value in highly
dynamic environments, this result implies that stable environments were more favorable
to the practice of transformational leadership to improve job satisfaction than turbulent
environments.
Table 11
Model Summary of Hierarchical Regression Analysis of Transformational Leadership
and Job Satisfaction in Low, Moderate, and High Dynamic Environments
Change Statistics
Dynamism Model R R
Square
Adjusted
R Square
Std. Error of
the Estimate
R Square
Change
F
Change
df1 df2 Sig. F
Change
Moderate
dynamism
1 .608 .369
.368
21.76097 .369
252.950 1 432 .000
Stable- Low
dynamism
Turbulent-High
dynamism
1
1
.665
.450
.443
.202
.438
.197
22.59413
25.09705
.443
.202
96.975
35.260
1
1
122
139
.000
.000
Note. Dependent Variable: Job Satisfaction
Predictors: (Constant), Transformational leadership
Table 12 shows that each level of dynamism (i.e., low, moderate, high) in the
organizational environment significantly moderated the relationship between
transformational leadership and job satisfaction because p=.000 < .05. The standardized
correlation coefficient between transformational leadership and job satisfaction was .450
in turbulent environments (β3 = .450), 0.608 in moderate environments (β2 = .608), and
.665 in stable environments (β1 = .665). This result implies that a stable environment was
the most conducive environment to the practice of transformational leadership in
improving job satisfaction than a moderate or turbulent environment, thus the null
hypothesis H021 was rejected. As a result, environmental dynamism significantly
moderated the relationship between transformational leadership and employee job
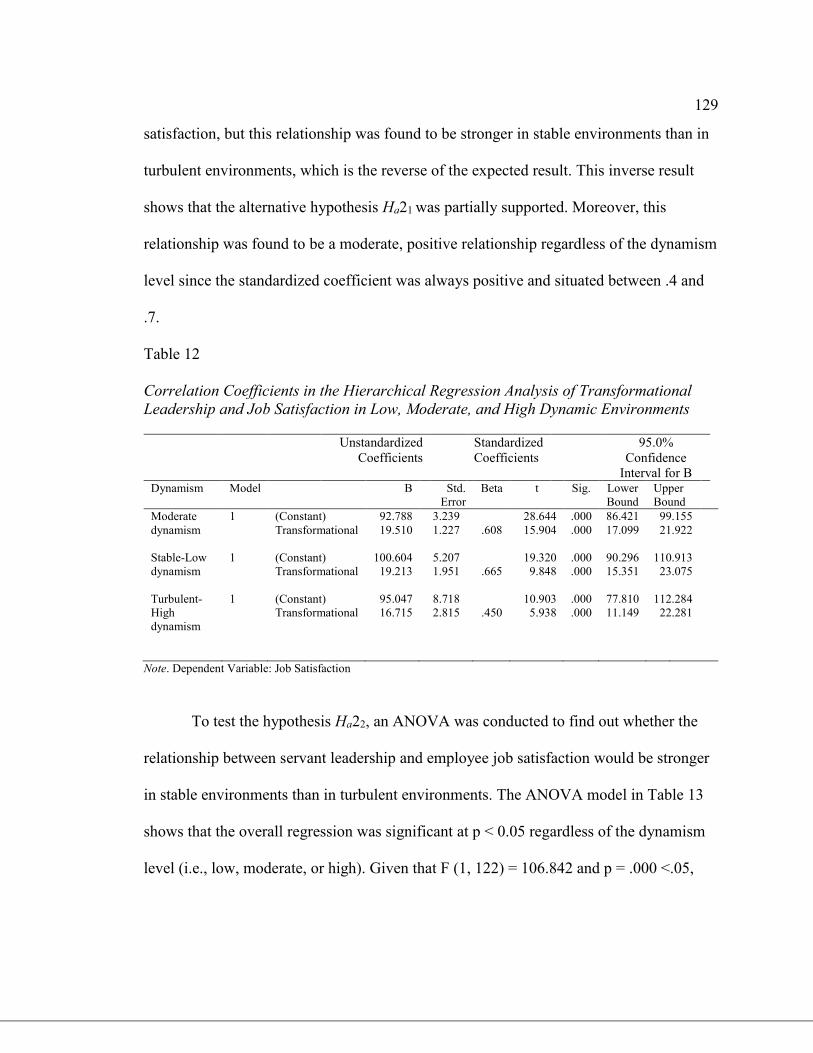
129
satisfaction, but this relationship was found to be stronger in stable environments than in
turbulent environments, which is the reverse of the expected result. This inverse result
shows that the alternative hypothesis Ha21 was partially supported. Moreover, this
relationship was found to be a moderate, positive relationship regardless of the dynamism
level since the standardized coefficient was always positive and situated between .4 and
.7.
Table 12
Correlation Coefficients in the Hierarchical Regression Analysis of Transformational
Leadership and Job Satisfaction in Low, Moderate, and High Dynamic Environments
Unstandardized
Coefficients
Standardized
Coefficients
95.0%
Confidence
Interval for B Dynamism
Model B Std.
Error
Beta t Sig. Lower
Bound
Upper
Bound
Moderate
dynamism
Stable-Low
dynamism
1
1
(Constant)
Transformational
(Constant)
Transformational
92.788
19.510
100.604
19.213
3.239
1.227
5.207
1.951
.608
.665
28.644
15.904
19.320
9.848
.000
.000
.000
.000
86.421
17.099
90.296
15.351
99.155
21.922
110.913
23.075
Turbulent-
High
dynamism
1 (Constant)
Transformational
95.047
16.715
8.718
2.815
.450
10.903
5.938
.000
.000
77.810
11.149
112.284
22.281
Note. Dependent Variable: Job Satisfaction
To test the hypothesis Ha22, an ANOVA was conducted to find out whether the
relationship between servant leadership and employee job satisfaction would be stronger
in stable environments than in turbulent environments. The ANOVA model in Table 13
shows that the overall regression was significant at p < 0.05 regardless of the dynamism
level (i.e., low, moderate, or high). Given that F (1, 122) = 106.842 and p = .000 <.05,

130
these results reveal that the relationship between servant leadership and employee job
satisfaction was statistically significant in stable environments.
Table 13
ANOVA Results for the Moderating Effect of Dynamism on the Relationship between
Servant Leadership and Job Satisfaction
Dynamism Model Sum of
Squares
df Mean Square F Sig.
Moderate
dynamism
1 Regression
Residual
114335.644
210088.553
1
433
114335.644
485.193
235.650 .000
Total 324424.198 434
Stable- Low
dynamism
Turbulent-High
dynamism
1
1
Regression
Residual
Total
Regression
Residual
Total
52190.619
59594.824
111785.444
12362.103
97397.656
109759.759
1
122
123
1
139
140
52190.619
488.482
12362.103
700.703
106.842
17.642
.000
.000
Note. Dependent Variable: Job Satisfaction
Predictors: (Constant), Servant leadership
Given that significance was found in the model for any level of dynamism of the
organizational environment, further analysis was conducted on the individual predictors.
The analysis of the data resulted in R-square of .463 (see Table 14) in stable
environments. The R-square of .467 implies that 46.7% of the variation in job satisfaction
was due to the application of servant leadership style in stable environments, while
53.3% of change was due to unexplained variability in such stable environments. Given
that R-square has the highest value in weakly dynamic environments (R2 = .467) and the
smallest value in highly dynamic environments (i.e., .113), this result implies that stable
environments were more conducive to the practice of servant leadership to improve job
satisfaction than turbulent environments.
Table 14
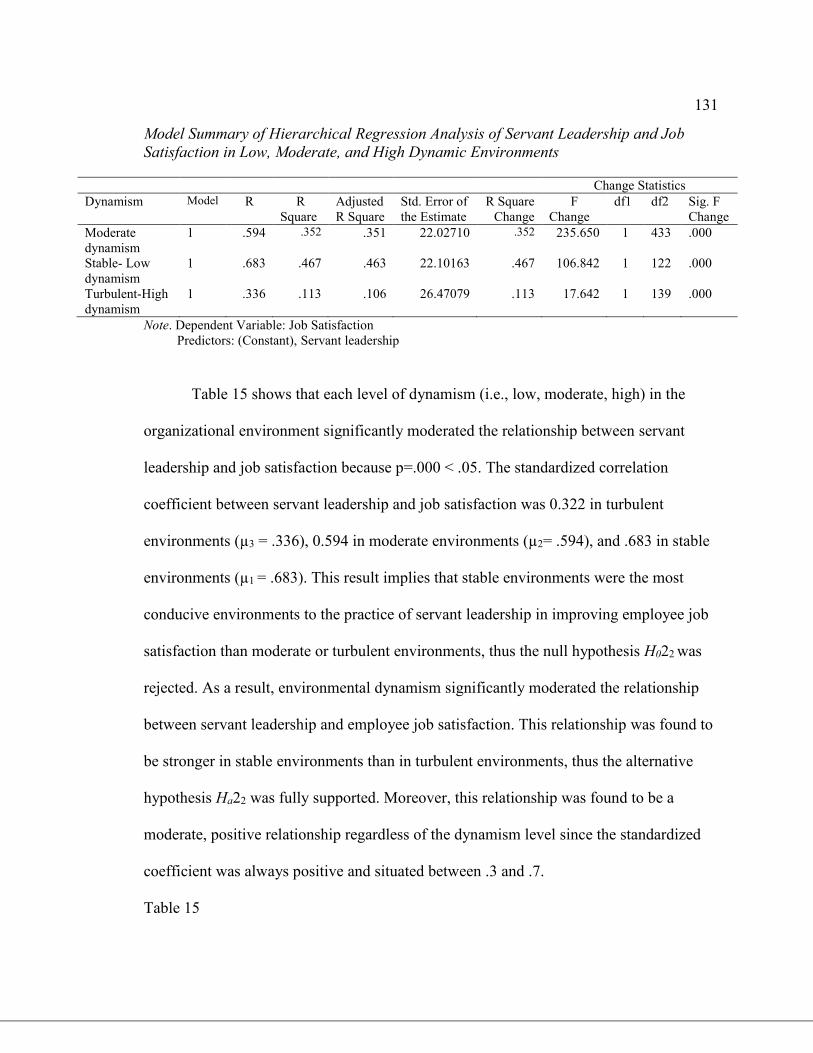
131
Model Summary of Hierarchical Regression Analysis of Servant Leadership and Job
Satisfaction in Low, Moderate, and High Dynamic Environments
Change Statistics
Dynamism Model R R
Square
Adjusted
R Square
Std. Error of
the Estimate
R Square
Change
F
Change
df1 df2 Sig. F
Change
Moderate
dynamism
1 .594 .352
.351
22.02710 .352
235.650 1 433 .000
Stable- Low
dynamism
Turbulent-High
dynamism
1
1
.683
.336
.467
.113
.463
.106
22.10163
26.47079
.467
.113
106.842
17.642
1
1
122
139
.000
.000
Note. Dependent Variable: Job Satisfaction
Predictors: (Constant), Servant leadership
Table 15 shows that each level of dynamism (i.e., low, moderate, high) in the
organizational environment significantly moderated the relationship between servant
leadership and job satisfaction because p=.000 < .05. The standardized correlation
coefficient between servant leadership and job satisfaction was 0.322 in turbulent
environments (µ3 = .336), 0.594 in moderate environments (µ2= .594), and .683 in stable
environments (µ1 = .683). This result implies that stable environments were the most
conducive environments to the practice of servant leadership in improving employee job
satisfaction than moderate or turbulent environments, thus the null hypothesis H022 was
rejected. As a result, environmental dynamism significantly moderated the relationship
between servant leadership and employee job satisfaction. This relationship was found to
be stronger in stable environments than in turbulent environments, thus the alternative
hypothesis Ha22 was fully supported. Moreover, this relationship was found to be a
moderate, positive relationship regardless of the dynamism level since the standardized
coefficient was always positive and situated between .3 and .7.
Table 15
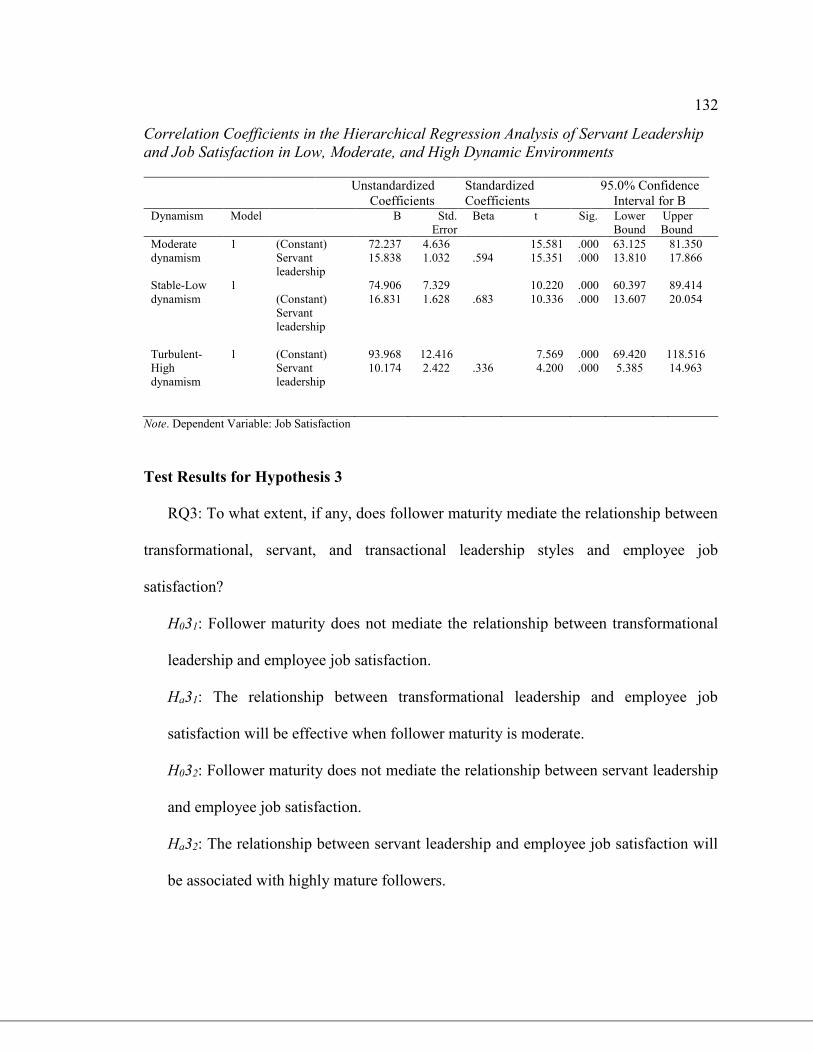
132
Correlation Coefficients in the Hierarchical Regression Analysis of Servant Leadership
and Job Satisfaction in Low, Moderate, and High Dynamic Environments
Unstandardized
Coefficients
Standardized
Coefficients
95.0% Confidence
Interval for B Dynamism
Model B Std.
Error
Beta t Sig. Lower
Bound
Upper
Bound
Moderate
dynamism
Stable-Low
dynamism
1
1
(Constant)
Servant
leadership
(Constant)
Servant
leadership
72.237
15.838
74.906
16.831
4.636
1.032
7.329
1.628
.594
.683
15.581
15.351
10.220
10.336
.000
.000
.000
.000
63.125
13.810
60.397
13.607
81.350
17.866
89.414
20.054
Turbulent-
High
dynamism
1 (Constant)
Servant
leadership
93.968
10.174
12.416
2.422
.336
7.569
4.200
.000
.000
69.420
5.385
118.516
14.963
Note. Dependent Variable: Job Satisfaction
Test Results for Hypothesis 3
RQ3: To what extent, if any, does follower maturity mediate the relationship between
transformational, servant, and transactional leadership styles and employee job
satisfaction?
H031: Follower maturity does not mediate the relationship between transformational
leadership and employee job satisfaction.
Ha31: The relationship between transformational leadership and employee job
satisfaction will be effective when follower maturity is moderate.
H032: Follower maturity does not mediate the relationship between servant leadership
and employee job satisfaction.
Ha32: The relationship between servant leadership and employee job satisfaction will
be associated with highly mature followers.
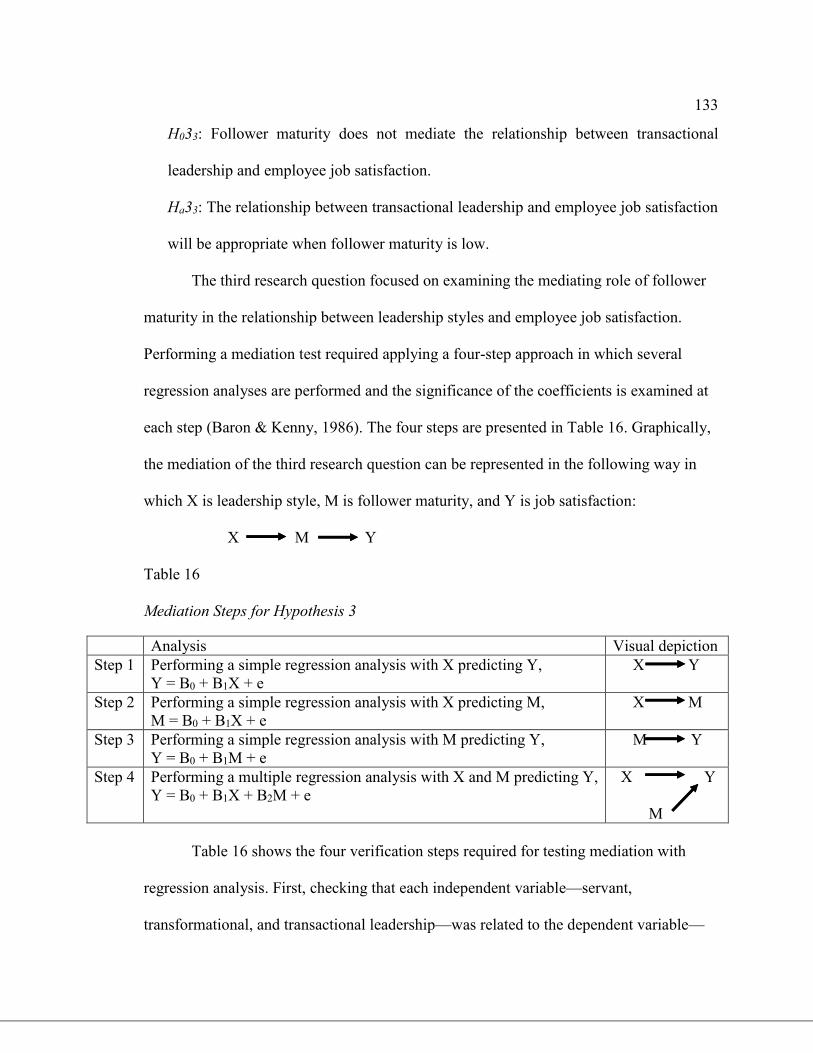
133
H033: Follower maturity does not mediate the relationship between transactional
leadership and employee job satisfaction.
Ha33: The relationship between transactional leadership and employee job satisfaction
will be appropriate when follower maturity is low.
The third research question focused on examining the mediating role of follower
maturity in the relationship between leadership styles and employee job satisfaction.
Performing a mediation test required applying a four-step approach in which several
regression analyses are performed and the significance of the coefficients is examined at
each step (Baron & Kenny, 1986). The four steps are presented in Table 16. Graphically,
the mediation of the third research question can be represented in the following way in
which X is leadership style, M is follower maturity, and Y is job satisfaction:
X M Y
Table 16
Mediation Steps for Hypothesis 3
Analysis Visual depiction
Step 1 Performing a simple regression analysis with X predicting Y,
Y = B0 + B1X + e
X Y
Step 2 Performing a simple regression analysis with X predicting M,
M = B0 + B1X + e
X M
Step 3 Performing a simple regression analysis with M predicting Y,
Y = B0 + B1M + e
M Y
Step 4 Performing a multiple regression analysis with X and M predicting Y,
Y = B0 + B1X + B2M + e
X Y
M
Table 16 shows the four verification steps required for testing mediation with
regression analysis. First, checking that each independent variable—servant,
transformational, and transactional leadership—was related to the dependent variable—
134
employee job satisfaction. Secondly, checking that each independent variable was related
to the mediator variable, follower maturity. Thirdly, verifying that the mediator variable,
follower maturity, was significantly related to the dependent variable job satisfaction.
Finally, when the mediator variable was controlled for, checking that the relationship
(i.e., the correlation coefficient) between each independent variable and the dependent
variable is either no longer significant (full mediation) or substantially reduced (partial
mediation).
Hypothesis 3 in statistical terms
Testing whether the variable Maturity (i.e., follower maturity) explains the
relationship between the variable Leadership (i.e., leadership style) and the variable
JobSatisfaction (i.e., employee job satisfaction) suggests fitting a sequence of three linear
regression models (Baron & Kenny, 1986). If alternative hypothesis is supported, then
Leadership should be substituted by (a) transformational leadership when Maturity is
moderate, (b) transactional leadership when Maturity is low, and (c) servant leadership
when Maturity is high. The three linear regression models for mediation analysis can be
expressed as below:
Model 1: JobSatisfaction = A01 + B1*Leadership + ε01
Model 2: Maturity = A02 + B2*Leadership + ε02
Model 3: JobSatisfaction = A03 + B31*Leadership + B32*Maturity + ε03
Model 1 consisted of testing whether the leadership predictor variable—servant,
transformational, or transactional leadership—was correlated to the dependent variable—
job satisfaction. Model 2 is the zero-order correlation between each independent variable
135
and the mediator variable. Model 3 consisted of a multiple regression analysis in which
each independent variable and the mediator variable predict the dependent variable.
When Leadership is transformational and Maturity is moderate, the statistical
hypothesis is expressed as below:
H031: B1 = 0 or B2 = 0 or B32 = 0.
Ha31: B1 ≠ 0 and B2 ≠ 0 and B32 ≠ 0.
Regarding servant leadership, the statistical hypothesis is expressed as below:
H032: B1 = 0 or B2 = 0 or B32 = 0.
Ha32: B1 ≠ 0 and B2 ≠ 0 and B32 ≠ 0 when Leadership is servant leadership and
Maturity is high.
Regarding transactional leadership, the statistical hypothesis becomes:
H033: B1 = 0 or B2 = 0 or B32 = 0.
Ha33: B1 ≠ 0 and B2 ≠ 0 and B32 ≠ 0 when Leadership is transactional leadership and
Maturity is low.
If B31 ≠ 0 in model 3, then the results would indicate that variable Maturity
partially mediates the relationship between Leadership and JobSatisfaction (Warner,
2013). If B1 ≠ 0 and B2 ≠ 0 and B32 ≠ 0 and B31 = 0, then the results would indicate that
variable Maturity completely mediates the relationship between Leadership and
JobSatisfaction.
Mediation testing for Hypothesis 3
The model 1 was already examined in the hypothesis 1 in which the hypotheses Ha11
and Ha13 were supported by showing that there was a statistically significant correlation
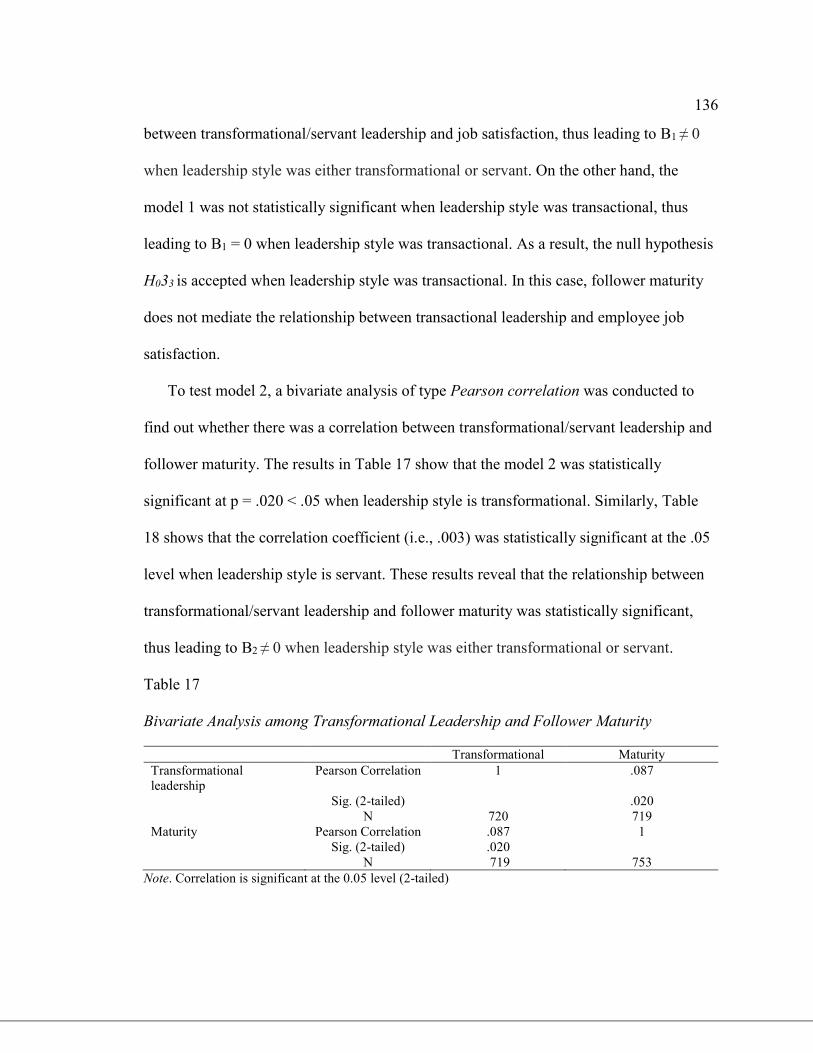
136
between transformational/servant leadership and job satisfaction, thus leading to B1 ≠ 0
when leadership style was either transformational or servant. On the other hand, the
model 1 was not statistically significant when leadership style was transactional, thus
leading to B1 = 0 when leadership style was transactional. As a result, the null hypothesis
H033 is accepted when leadership style was transactional. In this case, follower maturity
does not mediate the relationship between transactional leadership and employee job
satisfaction.
To test model 2, a bivariate analysis of type Pearson correlation was conducted to
find out whether there was a correlation between transformational/servant leadership and
follower maturity. The results in Table 17 show that the model 2 was statistically
significant at p = .020 < .05 when leadership style is transformational. Similarly, Table
18 shows that the correlation coefficient (i.e., .003) was statistically significant at the .05
level when leadership style is servant. These results reveal that the relationship between
transformational/servant leadership and follower maturity was statistically significant,
thus leading to B2 ≠ 0 when leadership style was either transformational or servant.
Table 17
Bivariate Analysis among Transformational Leadership and Follower Maturity
Transformational Maturity
Transformational
leadership
Pearson Correlation 1 .087
Sig. (2-tailed) .020
N 720 719
Maturity
Pearson Correlation
Sig. (2-tailed)
N
.087
.020
719
1
753
Note. Correlation is significant at the 0.05 level (2-tailed)
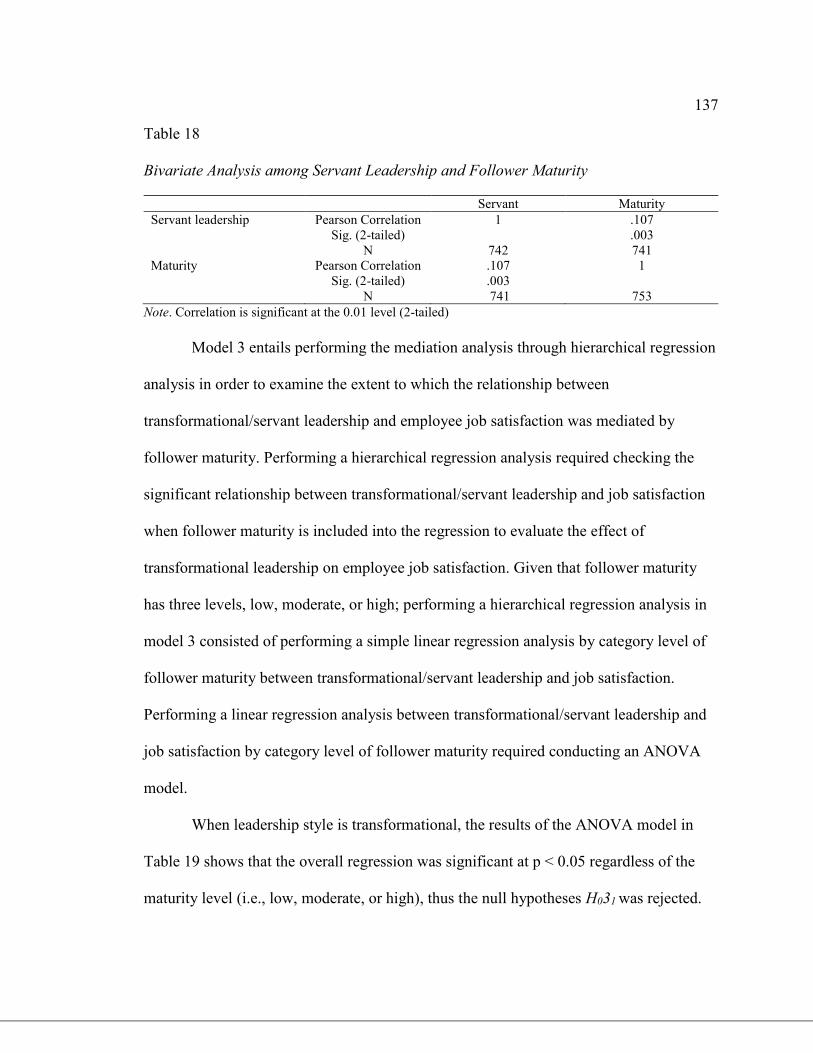
137
Table 18
Bivariate Analysis among Servant Leadership and Follower Maturity
Servant Maturity
Servant leadership Pearson Correlation 1 .107
Sig. (2-tailed) .003
N 742 741
Maturity
Pearson Correlation
Sig. (2-tailed)
N
.107
.003
741
1
753
Note. Correlation is significant at the 0.01 level (2-tailed)
Model 3 entails performing the mediation analysis through hierarchical regression
analysis in order to examine the extent to which the relationship between
transformational/servant leadership and employee job satisfaction was mediated by
follower maturity. Performing a hierarchical regression analysis required checking the
significant relationship between transformational/servant leadership and job satisfaction
when follower maturity is included into the regression to evaluate the effect of
transformational leadership on employee job satisfaction. Given that follower maturity
has three levels, low, moderate, or high; performing a hierarchical regression analysis in
model 3 consisted of performing a simple linear regression analysis by category level of
follower maturity between transformational/servant leadership and job satisfaction.
Performing a linear regression analysis between transformational/servant leadership and
job satisfaction by category level of follower maturity required conducting an ANOVA
model.
When leadership style is transformational, the results of the ANOVA model in
Table 19 shows that the overall regression was significant at p < 0.05 regardless of the
maturity level (i.e., low, moderate, or high), thus the null hypotheses H031 was rejected.
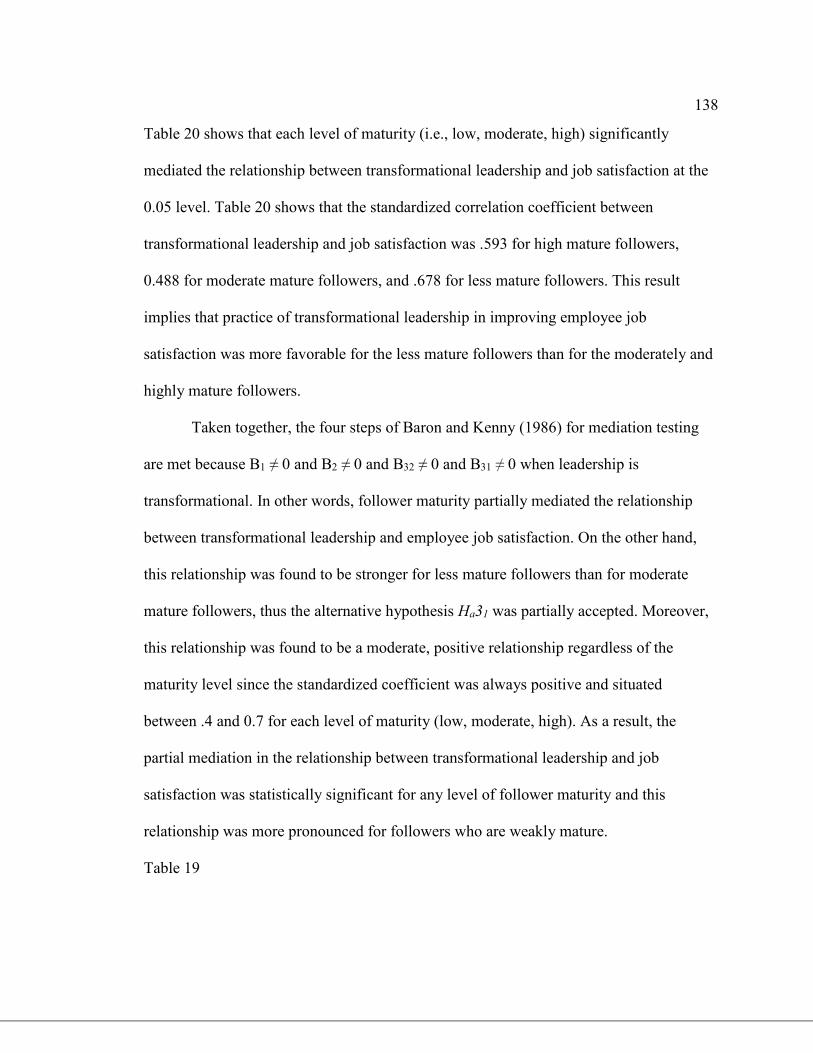
138
Table 20 shows that each level of maturity (i.e., low, moderate, high) significantly
mediated the relationship between transformational leadership and job satisfaction at the
0.05 level. Table 20 shows that the standardized correlation coefficient between
transformational leadership and job satisfaction was .593 for high mature followers,
0.488 for moderate mature followers, and .678 for less mature followers. This result
implies that practice of transformational leadership in improving employee job
satisfaction was more favorable for the less mature followers than for the moderately and
highly mature followers.
Taken together, the four steps of Baron and Kenny (1986) for mediation testing
are met because B1 ≠ 0 and B2 ≠ 0 and B32 ≠ 0 and B31 ≠ 0 when leadership is
transformational. In other words, follower maturity partially mediated the relationship
between transformational leadership and employee job satisfaction. On the other hand,
this relationship was found to be stronger for less mature followers than for moderate
mature followers, thus the alternative hypothesis Ha31 was partially accepted. Moreover,
this relationship was found to be a moderate, positive relationship regardless of the
maturity level since the standardized coefficient was always positive and situated
between .4 and 0.7 for each level of maturity (low, moderate, high). As a result, the
partial mediation in the relationship between transformational leadership and job
satisfaction was statistically significant for any level of follower maturity and this
relationship was more pronounced for followers who are weakly mature.
Table 19
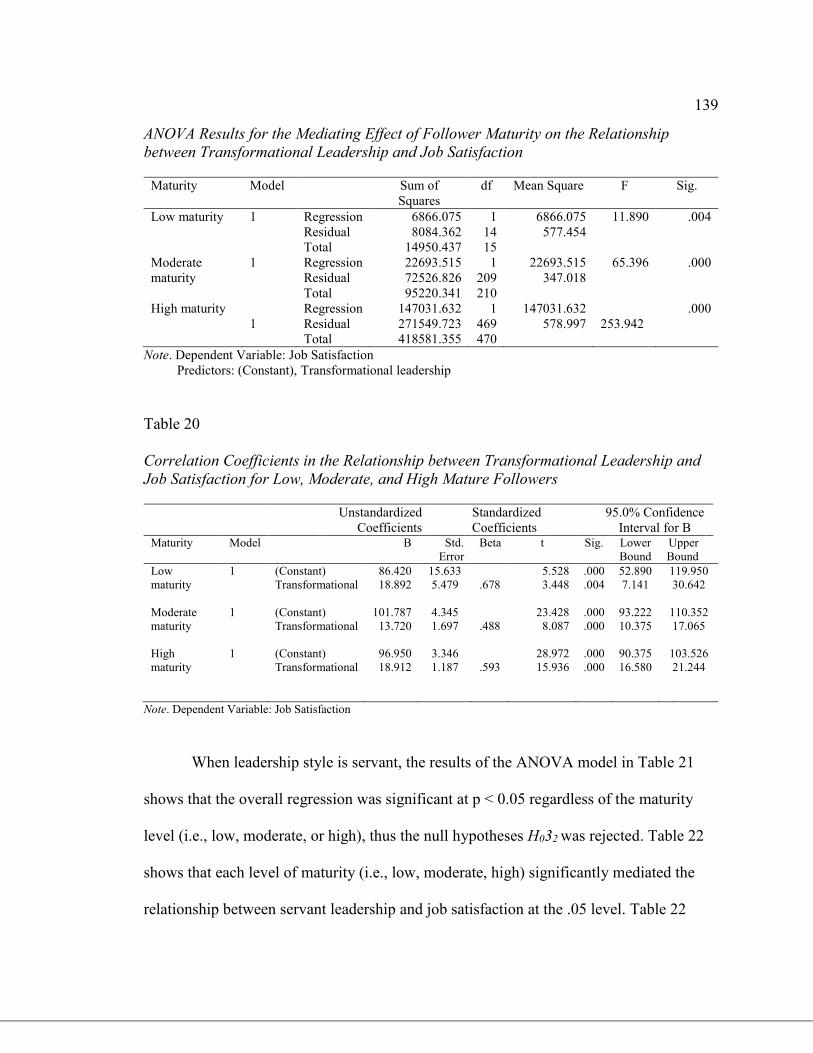
139
ANOVA Results for the Mediating Effect of Follower Maturity on the Relationship
between Transformational Leadership and Job Satisfaction
Maturity Model Sum of
Squares
df Mean Square F Sig.
Low maturity 1 Regression
Residual
6866.075
8084.362
1
14
6866.075
577.454
11.890 .004
Total 14950.437 15
Moderate
maturity
High maturity
1
1
Regression
Residual
Total
Regression
Residual
Total
22693.515
72526.826
95220.341
147031.632
271549.723
418581.355
1
209
210
1
469
470
22693.515
347.018
147031.632
578.997
65.396
253.942
.000
.000
Note. Dependent Variable: Job Satisfaction
Predictors: (Constant), Transformational leadership
Table 20
Correlation Coefficients in the Relationship between Transformational Leadership and
Job Satisfaction for Low, Moderate, and High Mature Followers
Unstandardized
Coefficients
Standardized
Coefficients
95.0% Confidence
Interval for B Maturity
Model B Std.
Error
Beta t Sig. Lower
Bound
Upper
Bound
Low
maturity
Moderate
maturity
1
1
(Constant)
Transformational
(Constant)
Transformational
86.420
18.892
101.787
13.720
15.633
5.479
4.345
1.697
.678
.488
5.528
3.448
23.428
8.087
.000
.004
.000
.000
52.890
7.141
93.222
10.375
119.950
30.642
110.352
17.065
High
maturity
1 (Constant)
Transformational
96.950
18.912
3.346
1.187
.593
28.972
15.936
.000
.000
90.375
16.580
103.526
21.244
Note. Dependent Variable: Job Satisfaction
When leadership style is servant, the results of the ANOVA model in Table 21
shows that the overall regression was significant at p < 0.05 regardless of the maturity
level (i.e., low, moderate, or high), thus the null hypotheses H032 was rejected. Table 22
shows that each level of maturity (i.e., low, moderate, high) significantly mediated the
relationship between servant leadership and job satisfaction at the .05 level. Table 22
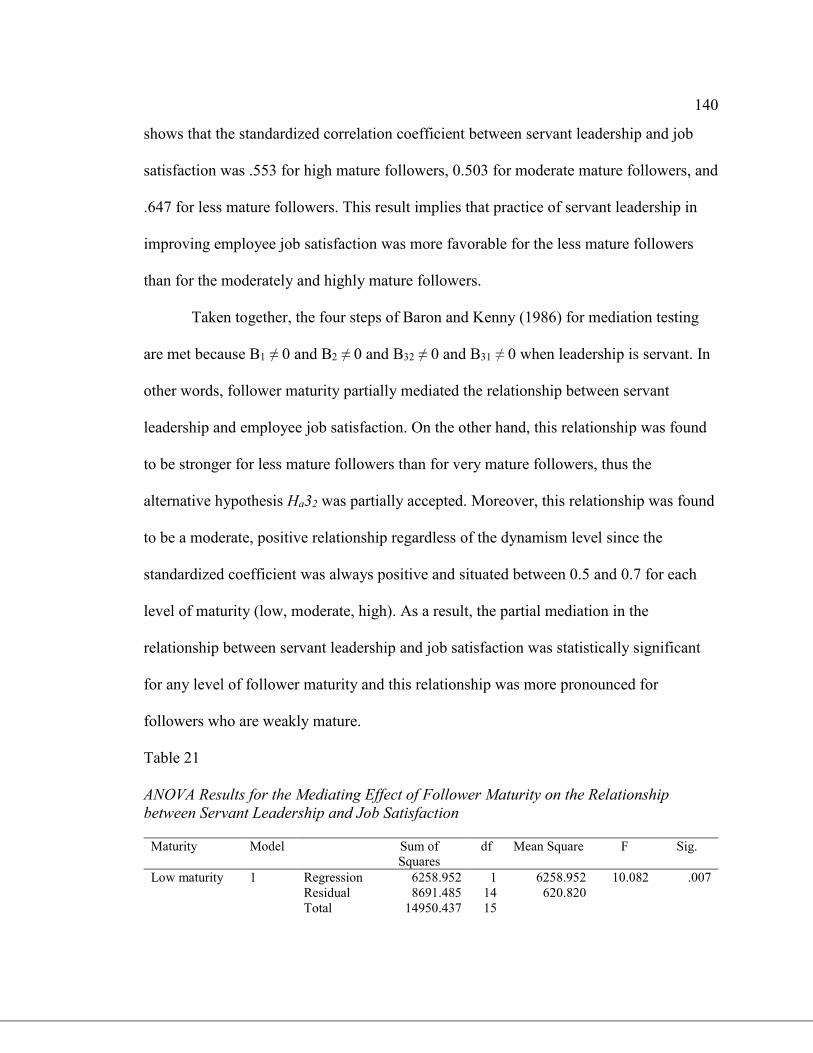
140
shows that the standardized correlation coefficient between servant leadership and job
satisfaction was .553 for high mature followers, 0.503 for moderate mature followers, and
.647 for less mature followers. This result implies that practice of servant leadership in
improving employee job satisfaction was more favorable for the less mature followers
than for the moderately and highly mature followers.
Taken together, the four steps of Baron and Kenny (1986) for mediation testing
are met because B1 ≠ 0 and B2 ≠ 0 and B32 ≠ 0 and B31 ≠ 0 when leadership is servant. In
other words, follower maturity partially mediated the relationship between servant
leadership and employee job satisfaction. On the other hand, this relationship was found
to be stronger for less mature followers than for very mature followers, thus the
alternative hypothesis Ha32 was partially accepted. Moreover, this relationship was found
to be a moderate, positive relationship regardless of the dynamism level since the
standardized coefficient was always positive and situated between 0.5 and 0.7 for each
level of maturity (low, moderate, high). As a result, the partial mediation in the
relationship between servant leadership and job satisfaction was statistically significant
for any level of follower maturity and this relationship was more pronounced for
followers who are weakly mature.
Table 21
ANOVA Results for the Mediating Effect of Follower Maturity on the Relationship
between Servant Leadership and Job Satisfaction
Maturity Model Sum of
Squares
df Mean Square F Sig.
Low maturity 1 Regression
Residual
6258.952
8691.485
1
14
6258.952
620.820
10.082 .007
Total 14950.437 15
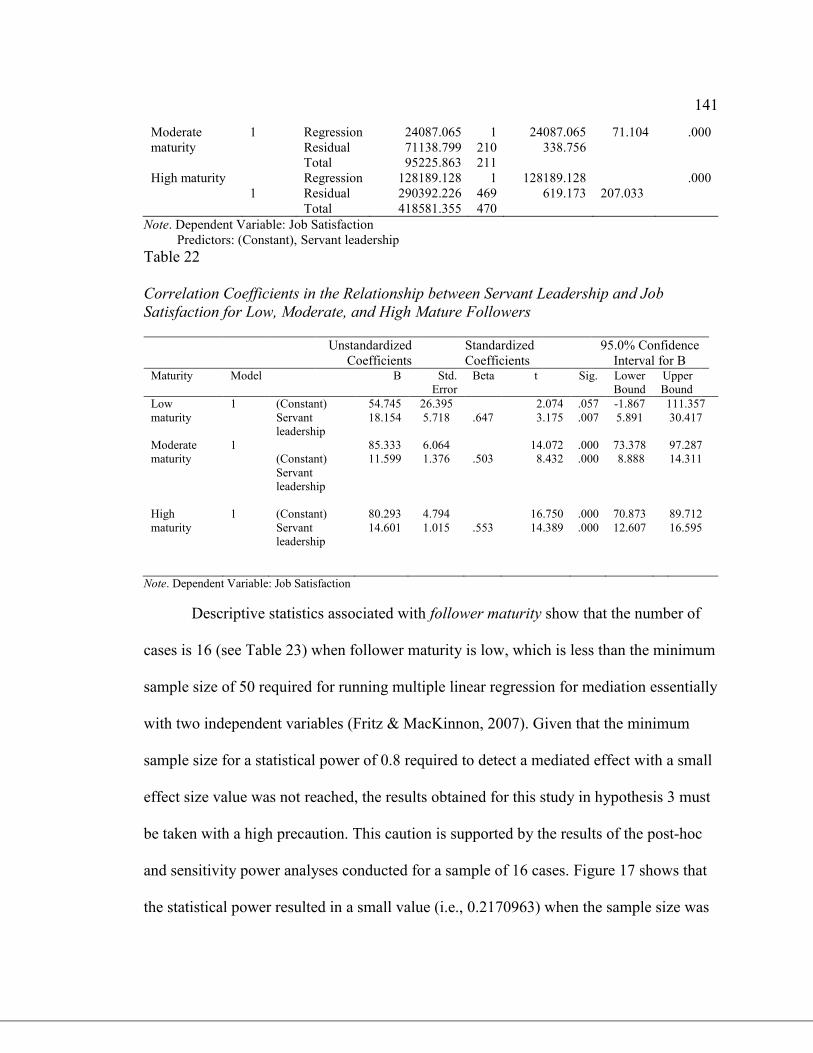
141
Moderate
maturity
High maturity
1
1
Regression
Residual
Total
Regression
Residual
Total
24087.065
71138.799
95225.863
128189.128
290392.226
418581.355
1
210
211
1
469
470
24087.065
338.756
128189.128
619.173
71.104
207.033
.000
.000
Note. Dependent Variable: Job Satisfaction
Predictors: (Constant), Servant leadership
Table 22
Correlation Coefficients in the Relationship between Servant Leadership and Job
Satisfaction for Low, Moderate, and High Mature Followers
Unstandardized
Coefficients
Standardized
Coefficients
95.0% Confidence
Interval for B Maturity
Model B Std.
Error
Beta t Sig. Lower
Bound
Upper
Bound
Low
maturity
Moderate
maturity
1
1
(Constant)
Servant
leadership
(Constant)
Servant
leadership
54.745
18.154
85.333
11.599
26.395
5.718
6.064
1.376
.647
.503
2.074
3.175
14.072
8.432
.057
.007
.000
.000
-1.867
5.891
73.378
8.888
111.357
30.417
97.287
14.311
High
maturity
1 (Constant)
Servant
leadership
80.293
14.601
4.794
1.015
.553
16.750
14.389
.000
.000
70.873
12.607
89.712
16.595
Note. Dependent Variable: Job Satisfaction
Descriptive statistics associated with follower maturity show that the number of
cases is 16 (see Table 23) when follower maturity is low, which is less than the minimum
sample size of 50 required for running multiple linear regression for mediation essentially
with two independent variables (Fritz & MacKinnon, 2007). Given that the minimum
sample size for a statistical power of 0.8 required to detect a mediated effect with a small
effect size value was not reached, the results obtained for this study in hypothesis 3 must
be taken with a high precaution. This caution is supported by the results of the post-hoc
and sensitivity power analyses conducted for a sample of 16 cases. Figure 17 shows that
the statistical power resulted in a small value (i.e., 0.2170963) when the sample size was
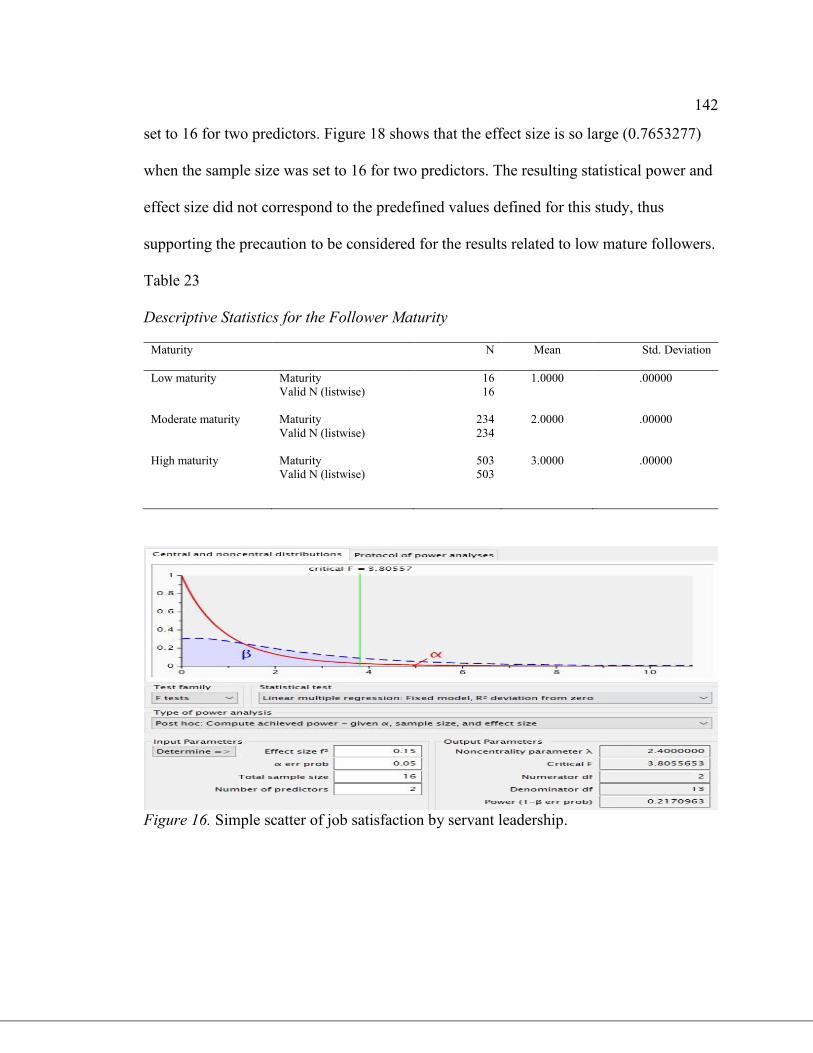
142
set to 16 for two predictors. Figure 18 shows that the effect size is so large (0.7653277)
when the sample size was set to 16 for two predictors. The resulting statistical power and
effect size did not correspond to the predefined values defined for this study, thus
supporting the precaution to be considered for the results related to low mature followers.
Table 23
Descriptive Statistics for the Follower Maturity
Maturity
N Mean Std. Deviation
Low maturity
Moderate maturity
Maturity
Valid N (listwise)
Maturity
Valid N (listwise)
16
16
234
234
1.0000
2.0000
.00000
.00000
High maturity Maturity
Valid N (listwise)
503
503
3.0000 .00000
Figure 16. Simple scatter of job satisfaction by servant leadership.
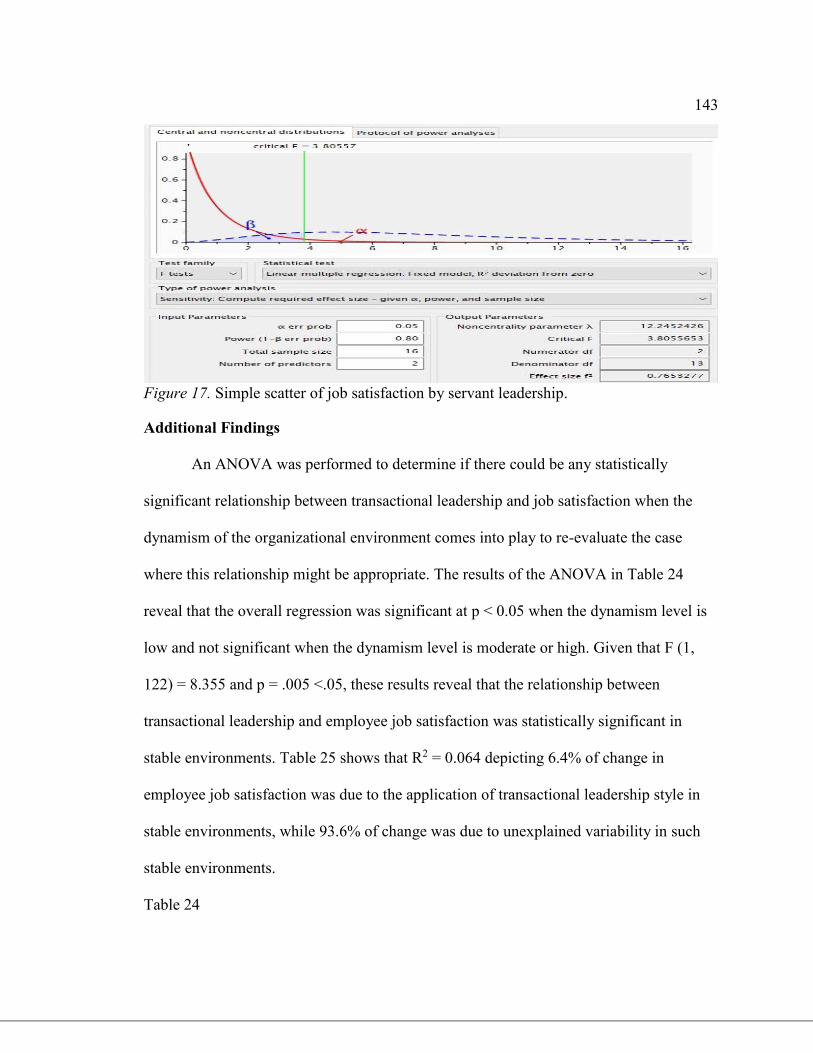
143
Figure 17. Simple scatter of job satisfaction by servant leadership.
Additional Findings
An ANOVA was performed to determine if there could be any statistically
significant relationship between transactional leadership and job satisfaction when the
dynamism of the organizational environment comes into play to re-evaluate the case
where this relationship might be appropriate. The results of the ANOVA in Table 24
reveal that the overall regression was significant at p < 0.05 when the dynamism level is
low and not significant when the dynamism level is moderate or high. Given that F (1,
122) = 8.355 and p = .005 <.05, these results reveal that the relationship between
transactional leadership and employee job satisfaction was statistically significant in
stable environments. Table 25 shows that R2 = 0.064 depicting 6.4% of change in
employee job satisfaction was due to the application of transactional leadership style in
stable environments, while 93.6% of change was due to unexplained variability in such
stable environments.
Table 24
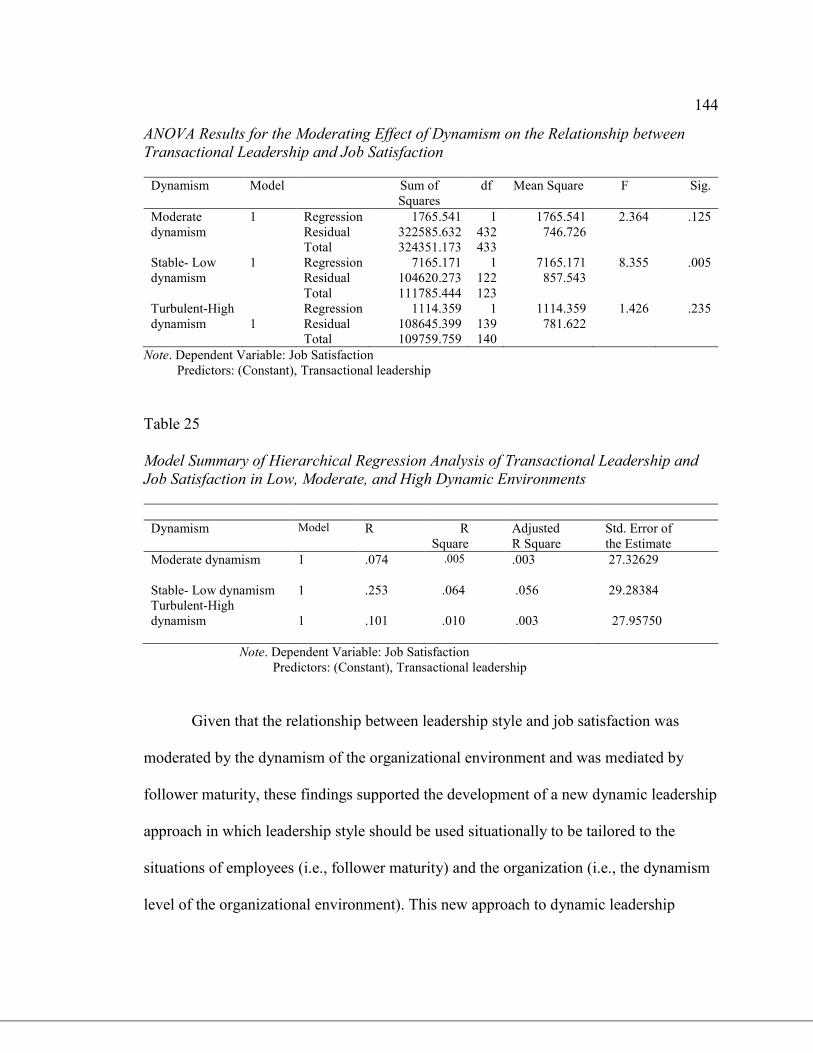
144
ANOVA Results for the Moderating Effect of Dynamism on the Relationship between
Transactional Leadership and Job Satisfaction
Dynamism Model Sum of
Squares
df Mean Square F Sig.
Moderate
dynamism
1 Regression
Residual
1765.541
322585.632
1
432
1765.541
746.726
2.364 .125
Total 324351.173 433
Stable- Low
dynamism
Turbulent-High
dynamism
1
1
Regression
Residual
Total
Regression
Residual
Total
7165.171
104620.273
111785.444
1114.359
108645.399
109759.759
1
122
123
1
139
140
7165.171
857.543
1114.359
781.622
8.355
1.426
.005
.235
Note. Dependent Variable: Job Satisfaction
Predictors: (Constant), Transactional leadership
Table 25
Model Summary of Hierarchical Regression Analysis of Transactional Leadership and
Job Satisfaction in Low, Moderate, and High Dynamic Environments
Dynamism Model R R
Square
Adjusted
R Square
Std. Error of
the Estimate
Moderate dynamism 1 .074 .005
.003
27.32629
Stable- Low dynamism
Turbulent-High
dynamism
1
1
.253
.101
.064
.010
.056
.003
29.28384
27.95750
Note. Dependent Variable: Job Satisfaction
Predictors: (Constant), Transactional leadership
Given that the relationship between leadership style and job satisfaction was
moderated by the dynamism of the organizational environment and was mediated by
follower maturity, these findings supported the development of a new dynamic leadership
approach in which leadership style should be used situationally to be tailored to the
situations of employees (i.e., follower maturity) and the organization (i.e., the dynamism
level of the organizational environment). This new approach to dynamic leadership
145
emphasized the importance of matching leadership styles with the dynamism level of the
organizational environment and individual characteristics of employees (e.g., the level of
maturity of followers) to influence employee job satisfaction. These findings were
consistent with the person–environment fit paradigm required to influence leadership
outcomes, as prescribed by several researchers (e.g., Tepper et al., 2018; Zaccaro et al.,
2018).
Summary
In this chapter, I described the data collection, analysis of data, and results of the
study. Before conducting the statistical tests required to answer the three research
questions, I tested the underlying statistical assumptions. ANOVA tests were performed
to examine the research questions. Based on their results, the null hypotheses for RQ2
and RQ3 were rejected. Concerning RQ1, the null hypothesis was rejected for the cases
of transformational and servant leadership, but not rejected for transactional leadership.
The overall results revealed statistical significance in the relationship between
transformational/servant leadership and employee job satisfaction. Moreover, the results
showed that the dynamism level of the organizational environment moderated the
relationship between transformational/servant leadership and employee job satisfaction.
Furthermore, the results indicated that follower maturity mediated the relationship
between transformational/servant leadership and employee job satisfaction. Given that
the number of cases for low-mature followers was below the minimum sample size
required for mediation testing, a great precaution must be taken with the result related to
the fact that the mediation role of follower maturity in the relationship between
146
transformational/servant leadership and employee job satisfaction was more pronounced
for less mature followers. Chapter 5 presents an interpretation of the findings and
limitations of the study, the study’s implications for positive social change, as well as
recommendations and potential opportunities for further research.

147
Chapter 5: Discussion, Conclusions, and Recommendations
The purpose of this quantitative, non-experimental, correlational study was to
examine the relationship between servant, transactional, and transformational leadership
styles and employee job satisfaction within organizations. A specific aim of the study was
to examine to what extent, if any, (a) follower maturity mediates the relationship between
leadership styles and employee job satisfaction, and (b) the dynamism of the
organizational environment moderates the relationship between leadership styles and
employee job satisfaction within organizations. Concerning the correlation between the
three leadership styles under study and employee job satisfaction, two leadership styles
(transformational and servant) and employee job satisfaction had a statistically
significant, moderate, and positive relationship. The study findings failed to reveal a
statistically significant relationship between transactional leadership and employee job
satisfaction. In addition, the findings revealed that the dynamism level of the
organizational environment moderated the relationship between transformational/ servant
leadership and employee job satisfaction, and that follower maturity mediated the
relationship between transformational/servant leadership and employee job satisfaction.
Furthermore, the study findings confirmed the relevance of the proposed dynamic
approach to leadership, whereby different contexts (i.e., dynamism levels) of the
organizational environment require employing different leadership styles (i.e., servant
and transformational leadership), which themselves require different situations (i.e.,
maturity levels) of the contingency variable follower maturity to link to employee job
satisfaction. Due to the lack of evidence of a correlational relationship between
148
transactional leadership and employee job satisfaction, this dynamic leadership approach
is not relevant to transactional leadership style. This chapter presents an interpretation of
the study results, a discussion of the limitations of the study, some recommendations for
future research, and potential implications for promoting positive social change.
Interpretation of Findings
Three research questions were addressed in this study. Regarding the first
research question, the results confirmed that there was a statistically significant
correlational relationship between transformational/servant leadership and employee job
satisfaction. The results showed no evidence of a correlational relationship between
transactional leadership and employee job satisfaction. As for the second research
question, the results showed that the level of dynamism of the organizational
environment helps moderate the relationship between transformational / servant
leadership and employee job satisfaction. Regarding the third research question, the
results showed follower maturity partially mediates the relationship between
transformational/servant leadership and employee job satisfaction.
Effects of Transformational, Servant, and Transactional Leadership on Job
Satisfaction
The first research question aimed at determining whether there is a correlation
between transformational/transactional/servant leadership and employee job satisfaction.
Results for the first research question indicated that there is a statistically significant
correlational relationship between servant leadership and employee job satisfaction.
Presented findings are consistent with the empirical research (Alonderiene &
149
Majauskaite, 2016; Eva et al., 2019). Given that servant leadership emphasizes the need
of followers, servant leadership naturally improves employee job satisfaction.
The findings of this study also confirm that a transformational leadership style of
managers contributes to increasing employee job satisfaction. This finding is consistent
with the empirical research (Barnett, 2018; Hijazi, 2017; Shah & al., 2017). When
managers use charisma, inspirational motivation, intellectual stimulation, and
individualized consideration, they help elicit positive reactions from employees and
promote the higher-level needs and satisfaction of employees (Awamleh, Evans, &
Mahate, 2005). The attention that managers give to employees is likely to be reflected in
their overall positive attitude towards work and working conditions, which in turn is
likely to foster employee job satisfaction (Awamleh et al., 2005).
Regarding transactional leadership, the results for the first research question
indicated that there was no statistically significant correlational relationship between
transactional leadership and employee job satisfaction. Such a finding is consistent with
the mixed results found in empirical research in which transactional leadership may not
have a significant correlational relationship with employee job satisfaction (Awamleh et
al., 2005). A significant relationship between transactional leadership and job satisfaction
may or may not exist depending on the dimensions of transactional leadership (Asrar-ul-
Haq & Kuchinke, 2016). One potential reason why transactional leadership may not have
a significant impact on job satisfaction is that dimensions of transactional leadership such
as management-by-exception and contingent rewards place too much emphasis on a
counterparty approach, which in turn may significantly offset their effect on employee
150
job satisfaction. More specifically, the positive side of transactional leadership that
includes contingent rewards could be offset by the reactive management-by-exception
approach, which taken together do not significantly influence employee job satisfaction.
Moreover, employees appear to respond more positively to a work system in which
managers define their tasks and clearly state their job objectives and performance
expectations, thus establishing rewards-goals relationships and performance–reward links
(Awamleh et al., 2005). Furthermore, Awamleh et al. argued that transactional leadership
may be redundant or irrelevant in the organizations in which the majority of tasks are
routinized, structured, and highly standardized. As a result, employees seek flexibility in
the task execution process which is more balanced and complemented by a
transformational style than a transactional style. This explains why transformational
leadership promotes job satisfaction as opposed to transactional leadership (Awamleh et
al., 2005).
Moderating Effect of the Dynamism of the Organizational Environment
The second research question aimed at examining the extent to which the
dynamism of the organizational environment moderates the relationship between
transformational/servant leadership and employee job satisfaction. Results for the second
research question showed that environmental dynamism significantly moderates the
relationship between servant leadership and employee job satisfaction, and this
relationship is stronger in stable environments than in turbulent environments, thus fully
supporting Ha22. These results support the conceptual findings of Smith et al. (2004), the
historical results of Humphreys (2005), and the empirical findings of Van Dierendonck et
151
al. (2014) that the effect of servant leadership on employee job satisfaction is more
pronounced in stable environments than in highly dynamic environments.
Regarding the moderating effect of the dynamism of the organizational
environment in the relationship between transformational leadership and employee job
satisfaction, the results received mixed support. Results showed that environmental
dynamism significantly moderates the relationship between transformational leadership
and employee job satisfaction, but this moderating effect is not more effective in highly
dynamic environments than in static environments, which is the inverse result of the
alternative hypothesis Ha21. This inverse result is consistent with the findings of the
experimental studies by Van Dierendonck et al. (2014) which report that transformational
leadership is not more effective in uncertain environments than in stable environments.
A potential reason why the hypothesis Ha22 is fully supported and the hypothesis
Ha21 is partially supported is that servant leadership emphasizes individual needs (e.g.,
employee job satisfaction) whereas transformational leadership focuses on the needs of
the organization (Van Dierendonck et al., 2014). Moreover, given that the dependent
variable in the second research question is employee job satisfaction, which is an
individual-level outcome rather than an organizational-level outcome, servant leadership
is likely to be more effective than transformational leadership in improving job
satisfaction even in highly dynamic environments. Furthermore, another reason why the
Ha21 hypothesis is partially supported may be that the variable “stage of the
organizational cycle” was not considered to examine whether the organizations of the
study respondents were at their stage of maturity. Smith et al. (2004) argued that
152
transformational leadership should be most effective in the initial stage of birth and
growth and in the declining stage of an organization’s cycle, while servant leadership is
most effective when an organization enters its stage of maturity. Given that employee
concerns and personal growth are the priority in the maturity stage, servant leadership is
more appropriate than transformational leadership during this stage (Smith et al., 2004).
This may explain why transformational leadership was found less effective on turbulent
environments. Given that the result of Ha21 is partially inconsistent with the reasoning by
Smith et al. (2004) but fully consistent with the empirical studies by Van Dierendonck et
al. (2014), these divergent results open a new path for future theorizing and research.
Mediating Effect of Follower Maturity
The third research question aimed at examining the extent to which follower
maturity mediates the relationship between transformational/servant/transactional
leadership and employee job satisfaction. Results for this research question showed that
follower maturity significantly mediates the relationship between transformational
/servant leadership and employee job satisfaction, and this relationship is stronger for
low-mature followers than for followers of moderate or high maturity, thus partially
supporting the hypotheses Ha31 and Ha32. These results fully support the main principles
of the theoretical model of Harber and McMaster (2018) that the maturity of followers
serves as an intermediary variable for the selection of servant or transformational
leadership style. On the other hand, these results do not support Harber and McMaster’s
theoretical model that servant leadership is the preferred leadership style when follower
maturity is high and that transformational leadership is more adequate than servant
153
leadership when follower maturity is moderate. This result suggests that Harber and
McMaster’s theoretical model could be slightly revised to reconsider the maturity level
that should apply to transformational leadership versus servant leadership. According to
Harber and McMaster’s model, the high level of maturity refers to persons with high
competence and medium commitment (M3) as well as persons with high competence and
high commitment (M4) while it may be possible that only M4 is valid and reliable for
high-mature people.
Given that the results of this study showed that transactional leadership is not
correlated with job satisfaction, these results imply that transactional leadership may not
be preferable to transformational and servant leadership when follower maturity is low,
especially for individual outcomes such as employee job satisfaction. Such a finding
suggests that the choice among servant/transformational/transactional leadership may
depend on the type of expected leadership outcomes. This potential explanation suggests
that Harber and McMaster’s (2018) theoretical model may consider the types of
leadership outcomes in which their model may be fully valid: organizational-level
outcome or individual-level outcome.
Dynamic Leadership Approach
Given that the maturity level of followers and the dynamism level of the
organizational environment are respectively valid mediators and moderators in the
relationship between transformational/servant leadership and employee job satisfaction,
the proposed dynamic approach to leadership is valid in these reviewed cases. The
findings of this study extend leadership knowledge in relation to a new dynamic approach

154
to leadership in which environmental dynamism serves as a moderator and follower
maturity serves as a mediator for applying the correct leadership style in order to better
serve employees and their organizations. The results of this study provide empirical
evidence to further support the proposed dynamic approach to leadership, which can be
considered valuable when it comes to using the identified moderating and mediating
factors in the relationship between transformational/servant leadership and employee job
satisfaction.
Limitations of the Study
This study had several limitations. The aforementioned interpretations of the
study results are limited by the sampling procedures used in this study –convenience and
snowball sampling strategies– which imply that the data may not be representative of the
world population. On the other hand, the fact that the sample was somewhat distributed in
terms of industries, countries, and hierarchical ranks of respondents and that the sample
size was larger than the minimum required for this study, has strengthened confidence in
the potential representativeness of populations and the validation of findings. Moreover,
the majority of the data comes from the Qualtrics source and that Qualtrics XM applied a
sampling methodology that combines quota sampling to reach target groups and random
sampling to reach participants within these groups. This sampling procedure reduced the
impact of selection bias and the risk of representativeness. Furthermore, because this
study used a convenience sample that was homogeneous with respect to the
sociodemographic factors of interest (i.e., any employee working in an organization, any
industry type, any country), the study results yield estimates with clearer, albeit narrower,
155
generalizability, thus providing more accurate accounts of population effects (Jager,
Putnick, & Bornstein, 2017). Although the homogeneous convenience sample in this
study was not equipped to directly examine sociodemographic differences regarding the
type of employment (full-time, part-time, other; formal employment, informal
employment), the generalizability of homogeneous convenience samples is clearer and
closer to the level of generalizability of probability samples. Jager et al. (2017) argued
that the more homogeneous the samples are (i.e., the more sociodemographic factors that
are homogeneous), the closer they get to the level of generalizability of probability
samples.
The data used were self-reported by employees in relation to the assessment of
their own maturity level, which showed a concern regarding the data collection method
leading to a common method variance. Employees tended to view themselves as more
mature than their managers could assessed them, which likely inflated the percentage of
moderate and high maturity observed in the data. As such, follower maturity should be
assessed by the leaders of employees instead of employees themselves to avoid any bias.
This bias may explain why there are only 16 respondents who rated themselves with a
low maturity level. Moreover, given that all variables in the study were assessed from an
individual’s perspective without considering other sources of assessment (e.g., leaders,
peers), the relationships between the study variables could have been inflated because
they were all taken from a single source – the individual employee.
Another important limitation of the study was that the number of observations for
the low mature employees was too small (i.e., 16), which may not yield valid results and
156
may explain the partial support of the hypotheses Ha31 and Ha32. More specifically, only
16 respondents declared themselves as having a low maturity level, which may have
influenced the results of this study concerning the hypotheses Ha31 and Ha32. Knowing
that an appropriate sample size can produce an accuracy of results, the results obtained
from the small sample size of low-mature employees are questionable. More specifically,
the results showing that the mediation between servant / transformational leadership is
more effective for followers who are weakly mature may not be valid. On the other hand,
this limitation is amplified in this study by the fact that many researchers established a
rule-of-thumb that there should be at least 50 observations per variable in regression
analysis, which is not the case for this study because the number of low mature
employees was 16 in total (Frankfort-Nachmias & Nachmias, 2008; Kyriazos, 2018).
Another potential limitation was related to the drawback of correlational research,
especially as correlational studies can only detect measures of association and cannot
help determine the direction of causality between the variables under study. Although the
theoretical framework underlying the conceptualizations of the leadership process
indicates that a leader’s leadership style is a predictor of employee job satisfaction, it is
also plausible that employee job satisfaction predicts leadership style. Furthermore, the
dynamism of the organizational environment can both influence and be influenced by
managers’ leadership styles. Although the cross-sectional nature of the study did not
allow inferring causal relationships and generating more detailed and insightful results,
this correlational design was important for this study to make predictions between the
independent and the dependent variables.
157
An additional potential limitation concerns the fact that the study focused
primarily on the bivariate relationships between leadership styles and employee job
satisfaction with a single moderator and a single mediator. A more accurate account of
the relative importance of leadership styles would be provided if other factors, such as
demographic characteristics (e.g., age-range, hierarchical rank) and follower
characteristics were also considered. For instance, Kelley (1992) found that follower
characteristics (e.g., independent critical thinking, active management in the task) could
be an important moderator of the effects of leadership styles on the attitudes and
behaviors of followers (e.g., employee job satisfaction).
Recommendations
Recommendations Based on Findings
The primary recommendation that can be generated from the findings of this
study is to continue research in this area. The findings of this study established that there
is a relationship between servant/transformational leadership and employee job
satisfaction; however, the direction of this association cannot be accurately predicted and
the causality of the relationship cannot be proven without further research, which should
replicate this study and revalidate the results with other samples. Given that this study
was not intended to find causal relationships, future research could focus on analyzing
how exactly the variables under study may affect the proposed dynamic leadership
approach. Future research based on the results of this study can greatly inform the
development of the proposed dynamic leadership approach.
158
Based on the partial support of the Ha31 and Ha32 hypotheses and the rejection of
the Ha21 alternative hypothesis in this study, steps should be taken to confirm and better
understand these results. As such, another recommendation concerns the need for further
studies to validate the rejection of the Ha21 hypothesis and the partial support of Ha31 and
Ha32 hypotheses. Given the rejection of the Ha21 hypothesis, further research is required
to (a) confirm that transactional leadership is not correlated with employee job
satisfaction or (b) identify the factors that explain this rejection. Regarding the partial
support of Ha31 and Ha32 hypotheses, future research is required with at least 50 cases for
low-mature followers to confirm or refute the results related to the fact that the mediating
role of follower maturity in the relationship between transformational/servant leadership
and employee job satisfaction is higher among low-mature followers than among
medium-mature and high-mature followers.
Given that the findings showed the relevance of the proposed dynamic leadership
approach in relation to its effect on employee job satisfaction, future research should
study other impacts of the proposed dynamic leadership approach to better quantify its
value to leadership education and practice. Testing other employee outcomes (e.g.,
intention to leave, employee work motivation) and organizational outcomes (e.g., work
performance) can all be salient research objectives. More specifically, in addition to
employee job satisfaction, further studies need to examine other organizational outcomes
and employee outcomes to confirm the relevance of the proposed dynamic leadership
approach.
159
Theoretical Recommendations
Further refinement of the proposed dynamic leadership approach is
recommended, implying to move from a dynamic leadership approach to empirical
theory-testing to conceptual theory building. This evolution should facilitate the
transition from a dynamic leadership approach to a dynamic leadership theory. Additional
empirical evidence would help further the building of the theory, especially when a new
theory is still in the process of being developed and expanded on through continuous
research. Given that the proposed dynamic leadership approach was successfully verified
with respondents working in various industries and countries around the world, future
research is needed to test whether the proposed dynamic leadership approach may evolve
into a new leadership theory in which levels of employee maturity and organizational
turbulence would help select the best leadership style among transformational and servant
leadership.
Future studies are needed to measure at the organizational-level the proposed
dynamic leadership approach in order to compare with the results of other studies in
which the proposed dynamic leadership approach should be measured at both group/team
and individual levels, as well as the organizational level. Future research should consider
the types of desired leadership outcomes either at the individual level for follower growth
and development, or at the organizational level for organizational success in order to
examine the conditions under which the theoretical models of Smith et al. (2004) and
Harber and McMaster (2018) can be fully supported. Researchers should examine the
proposed dynamic leadership approach to determine if it also improves other levels of
160
employee relationships such as (a) top management and their followers, and (b) these
followers and their direct reports to determine if correlations exist between the two
groups. Given that interpersonal/dyadic relationships (e.g., leader–follower/supervisor–
subordinate, employee–customer, and employee–coworker) transcend a single level of
conceptualization and analysis, future research within the realm of multilevel research
should be conducted.
Another important area to study involves expanding the understanding of the
underlying dynamic process related to the proposed dynamic leadership approach to
further investigate the processes by which this new leadership approach develops. As
such, future research needs to move toward a more precise articulation of the conditions
and contexts under which the proposed dynamic leadership approach would be expected
to affect employee job satisfaction and other individual and organizational outcomes.
Future areas of research include examining correlates –antecedents and/or outcomes– and
demographic variables as well as additional mediating and moderating variables. Some
potential factors at work may moderate or mediate the relationship between servant /
transformational leadership and employee job satisfaction such as follower characteristics
(e.g., independent critical thinking). Kelley (1992) found that follower characteristics can
be an important moderator of the effects of leadership styles on the attitudes of followers
(e.g., employee job satisfaction).
Methodological Recommendations
Due to the self-report bias in assessing follower maturity, future research should
improve the generalizability of the results of this study by using more unbiased data such
161
as using ratings by others or observing employees in real working conditions. Another
area that deserves attention includes studies that measure servant and transformational
leadership from the perspective of peers, leaders themselves, and the boss of each leader.
Evaluating the maturity of followers from the point of view of their leader also deserves
special scholarly attention to make comparisons between the scores of followers and the
scores of leaders. Moreover, the observation of employees in real working conditions can
strengthen the validity of the study results, which may reflect the respondents’ real
experience more than the self-perception of their own level of maturity and the leadership
style of their leader. Future research on subordinate ratings and other people’s ratings can
help identify differences in agreement between subordinates and their leaders, thus
shedding more light on the understanding of the effects of servant/transformational
leadership on employee job satisfaction. Future research should replicate this study to
extend the self-other ratings literature in the specific cases of servant leadership,
transformational leadership, the dynamism of the organizational environment, and
follower maturity.
Given the cross-sectional nature of this study, future studies should employ a
carefully designed longitudinal methodology to capture the dynamic process of the
proposed leadership approach and its impact on employee job satisfaction. Conducting
longitudinal studies should help explore how transformational and servant leadership
operate over time and influence employee job satisfaction over time. For example,
researchers could examine data over long periods of time to ensure that the proposed
dynamic leadership approach remains valid and reliable over time.
162
In addition to the need for more quantitative studies (e.g., quasi-experimental and
experimental studies) to generalize the results, qualitative and mixed-method studies
should also be pursued to supplement the in-depth insights necessary to confirm the
validity of the proposed dynamic leadership approach. Regarding the application of
qualitative methods, methodologies such as narrative stories, case study, or
phenomenology can be employed to increase the level of knowledge of the what and why
of the proposed dynamic leadership concept. A qualitative research approach is
recommended for future studies that seek to understand in-depth perceptions of
leadership styles and job satisfaction. Ultimately, grounded theory studies could allow the
work to move more quickly from conceptual and theoretical to quantitative studies.
Regarding the sampling population, given that the sample did not cover all
countries in the world population, further research is needed to extend the study to
unexplored countries. This extension should help researchers gain an overall
understanding of the proposed dynamic leadership approach and confirm whether it is
valid and reliable in all countries and different types of organizations (e.g., not-for-profit
or for-profit) and cultures. The perceptions of respondents from unexplored countries
should allow researchers to compare results across countries for a better generalization of
the results and to cross validate the findings of this study with the findings of other
studies. Comparative studies from different cultures would be helpful for both the theory
development and the practice of the proposed dynamic leadership approach.
Regarding the sampling technique, given that I used non-probability sampling
techniques (i.e., convenience and snowball sampling techniques) and that Qualtrics XM
163
used quota and random sampling techniques, the overall sample was not entirely random,
which results in some form of selection bias. Given that such a bias may affect the
strength of one or more relationships tested by the statistical regression analyses
performed in this study, future research based solely on probability sampling methods is
recommended to provide a greater ability to generalize the results. Probability sampling
techniques should allow a better representation of the world population.
Regarding the measurement method, behaviorally-based leadership measures such
as MLS and SLS do not use an established timeframe to ensure that respondents’ ratings
of their leader’s leadership style reflect upon their cumulative experience with their
leader (Hoption, 2016). Hoption argued that leadership behaviors are most memorable
when exhibited during organizational milestones (e.g., announcing a merger, a massive
layoff) or employee milestones (e.g., hiring interview, performance appraisal) to leave
lasting impressions on employees. Further research is needed to add time-frames to both
MLQ and SLS behaviorally-based leadership questionnaires (e.g., over the past two
weeks) to help respondents select the relevant observations on which to base their
assessments. Another avenue of research to pursue consists of asking respondents to
clarify how they arrived at their ratings of leadership styles (e.g., in what context did the
leader show the behavior, when did you last see the leader show this behavior, etc.).
Future leadership studies should shift from measuring the frequency of leadership
behaviors (i.e., how often) to measuring when leadership behaviors were exhibited
(Hoption, 2016). Such studies should help progress the episodic leadership research that
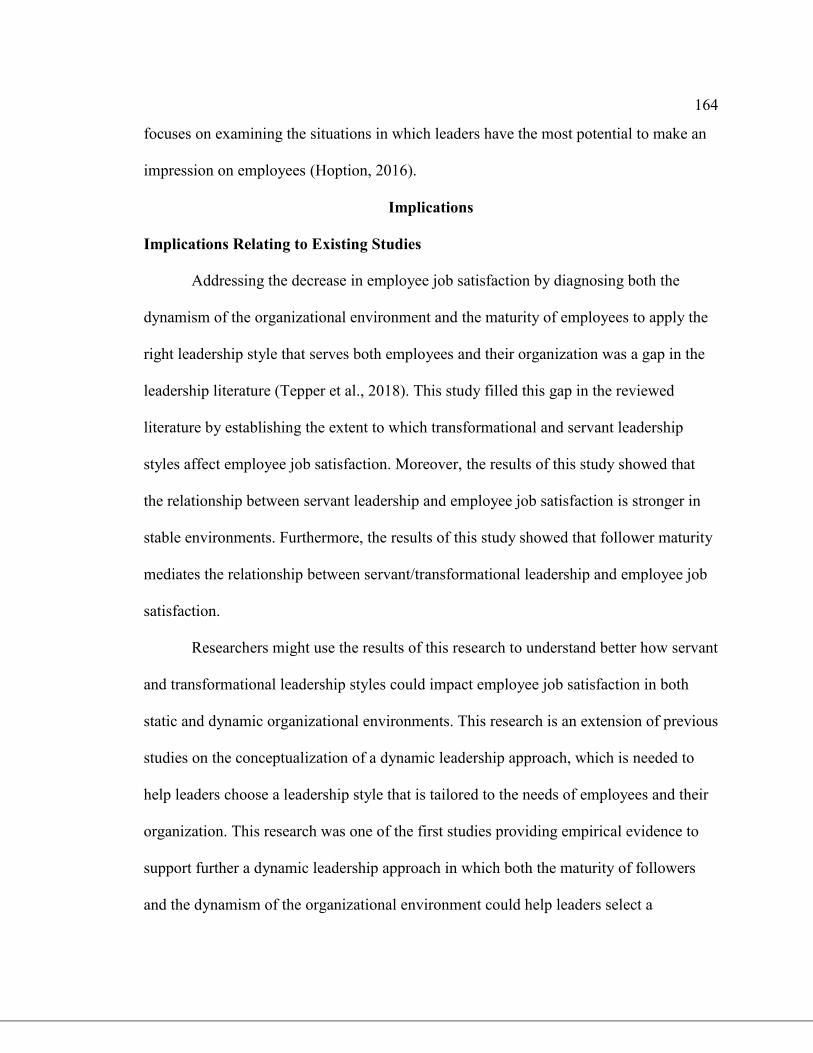
164
focuses on examining the situations in which leaders have the most potential to make an
impression on employees (Hoption, 2016).
Implications
Implications Relating to Existing Studies
Addressing the decrease in employee job satisfaction by diagnosing both the
dynamism of the organizational environment and the maturity of employees to apply the
right leadership style that serves both employees and their organization was a gap in the
leadership literature (Tepper et al., 2018). This study filled this gap in the reviewed
literature by establishing the extent to which transformational and servant leadership
styles affect employee job satisfaction. Moreover, the results of this study showed that
the relationship between servant leadership and employee job satisfaction is stronger in
stable environments. Furthermore, the results of this study showed that follower maturity
mediates the relationship between servant/transformational leadership and employee job
satisfaction.
Researchers might use the results of this research to understand better how servant
and transformational leadership styles could impact employee job satisfaction in both
static and dynamic organizational environments. This research is an extension of previous
studies on the conceptualization of a dynamic leadership approach, which is needed to
help leaders choose a leadership style that is tailored to the needs of employees and their
organization. This research was one of the first studies providing empirical evidence to
support further a dynamic leadership approach in which both the maturity of followers
and the dynamism of the organizational environment could help leaders select a
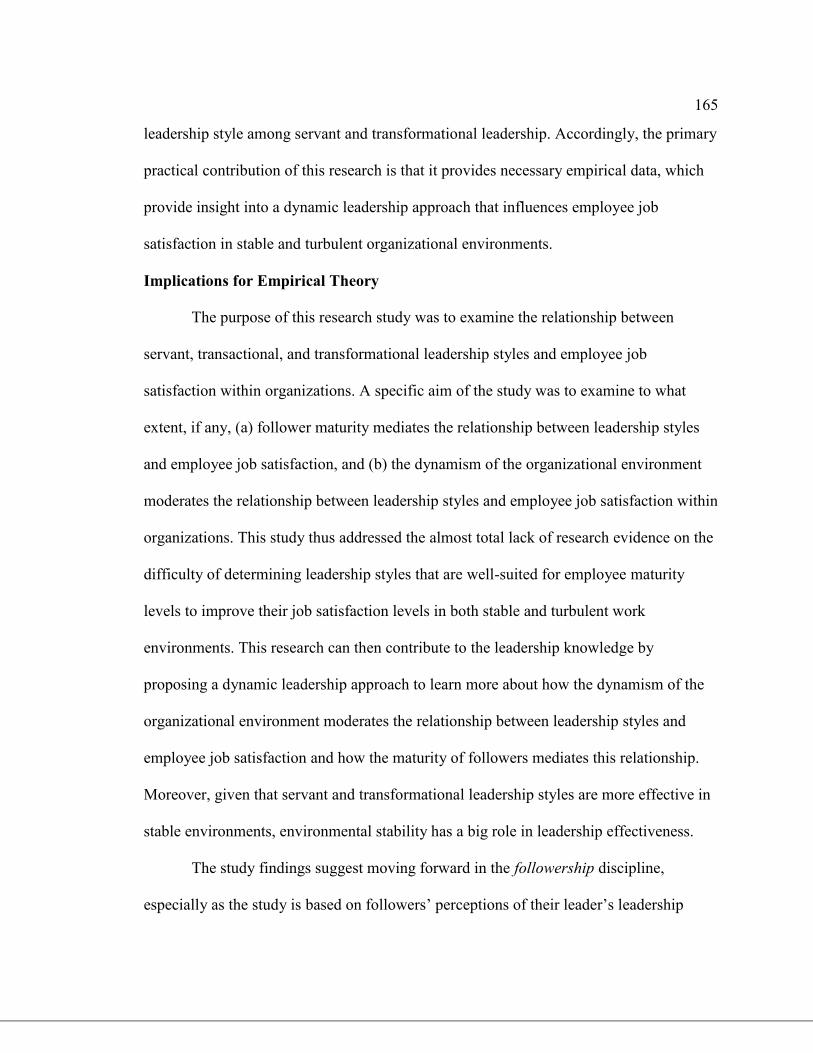
165
leadership style among servant and transformational leadership. Accordingly, the primary
practical contribution of this research is that it provides necessary empirical data, which
provide insight into a dynamic leadership approach that influences employee job
satisfaction in stable and turbulent organizational environments.
Implications for Empirical Theory
The purpose of this research study was to examine the relationship between
servant, transactional, and transformational leadership styles and employee job
satisfaction within organizations. A specific aim of the study was to examine to what
extent, if any, (a) follower maturity mediates the relationship between leadership styles
and employee job satisfaction, and (b) the dynamism of the organizational environment
moderates the relationship between leadership styles and employee job satisfaction within
organizations. This study thus addressed the almost total lack of research evidence on the
difficulty of determining leadership styles that are well-suited for employee maturity
levels to improve their job satisfaction levels in both stable and turbulent work
environments. This research can then contribute to the leadership knowledge by
proposing a dynamic leadership approach to learn more about how the dynamism of the
organizational environment moderates the relationship between leadership styles and
employee job satisfaction and how the maturity of followers mediates this relationship.
Moreover, given that servant and transformational leadership styles are more effective in
stable environments, environmental stability has a big role in leadership effectiveness.
The study findings suggest moving forward in the followership discipline,
especially as the study is based on followers’ perceptions of their leader’s leadership
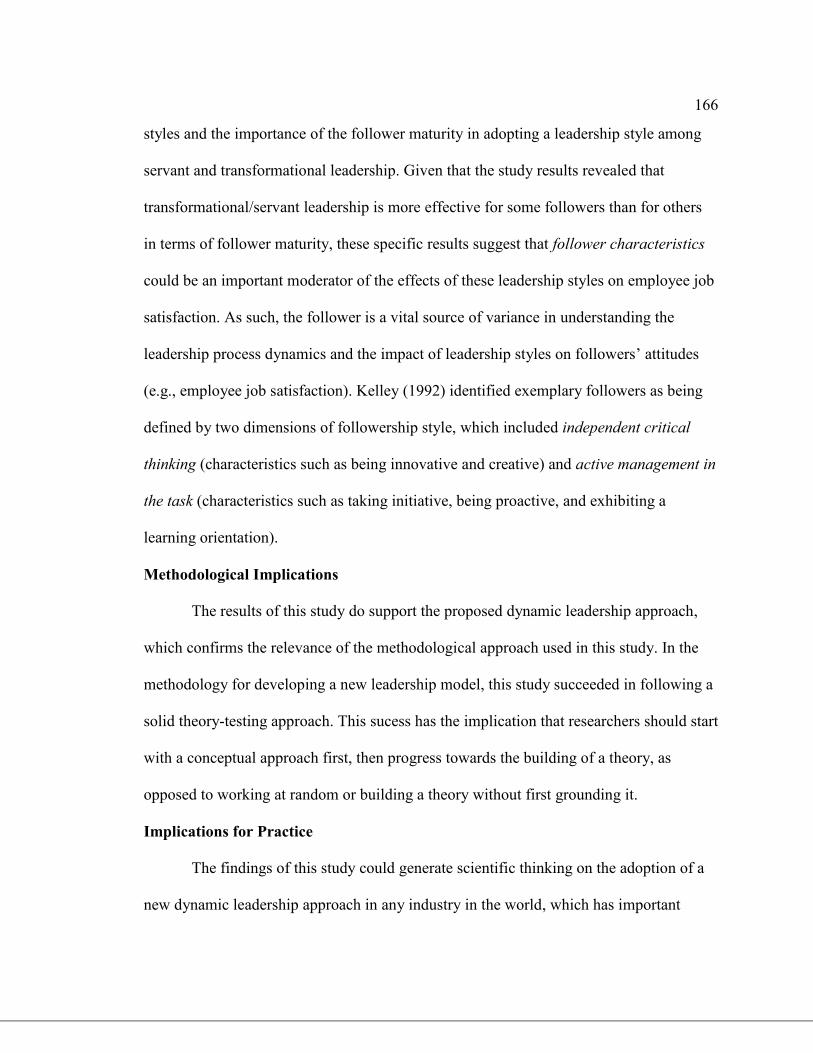
166
styles and the importance of the follower maturity in adopting a leadership style among
servant and transformational leadership. Given that the study results revealed that
transformational/servant leadership is more effective for some followers than for others
in terms of follower maturity, these specific results suggest that follower characteristics
could be an important moderator of the effects of these leadership styles on employee job
satisfaction. As such, the follower is a vital source of variance in understanding the
leadership process dynamics and the impact of leadership styles on followers’ attitudes
(e.g., employee job satisfaction). Kelley (1992) identified exemplary followers as being
defined by two dimensions of followership style, which included independent critical
thinking (characteristics such as being innovative and creative) and active management in
the task (characteristics such as taking initiative, being proactive, and exhibiting a
learning orientation).
Methodological Implications
The results of this study do support the proposed dynamic leadership approach,
which confirms the relevance of the methodological approach used in this study. In the
methodology for developing a new leadership model, this study succeeded in following a
solid theory-testing approach. This sucess has the implication that researchers should start
with a conceptual approach first, then progress towards the building of a theory, as
opposed to working at random or building a theory without first grounding it.
Implications for Practice
The findings of this study could generate scientific thinking on the adoption of a
new dynamic leadership approach in any industry in the world, which has important
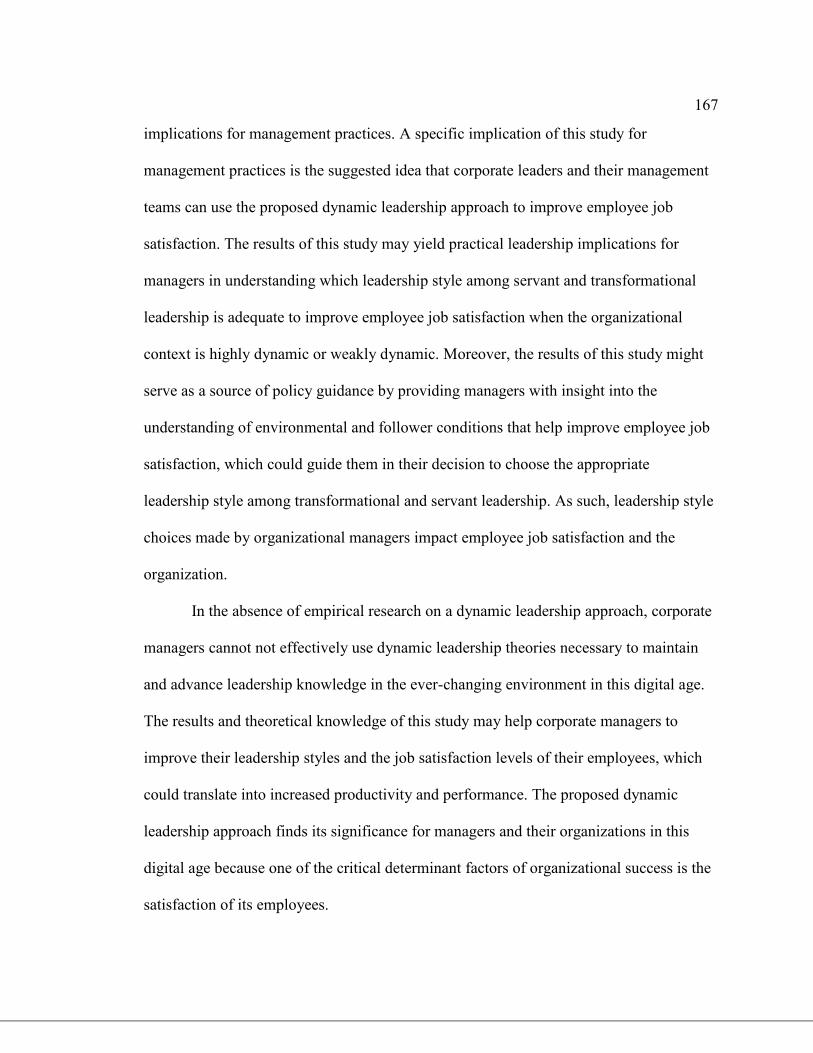
167
implications for management practices. A specific implication of this study for
management practices is the suggested idea that corporate leaders and their management
teams can use the proposed dynamic leadership approach to improve employee job
satisfaction. The results of this study may yield practical leadership implications for
managers in understanding which leadership style among servant and transformational
leadership is adequate to improve employee job satisfaction when the organizational
context is highly dynamic or weakly dynamic. Moreover, the results of this study might
serve as a source of policy guidance by providing managers with insight into the
understanding of environmental and follower conditions that help improve employee job
satisfaction, which could guide them in their decision to choose the appropriate
leadership style among transformational and servant leadership. As such, leadership style
choices made by organizational managers impact employee job satisfaction and the
organization.
In the absence of empirical research on a dynamic leadership approach, corporate
managers cannot not effectively use dynamic leadership theories necessary to maintain
and advance leadership knowledge in the ever-changing environment in this digital age.
The results and theoretical knowledge of this study may help corporate managers to
improve their leadership styles and the job satisfaction levels of their employees, which
could translate into increased productivity and performance. The proposed dynamic
leadership approach finds its significance for managers and their organizations in this
digital age because one of the critical determinant factors of organizational success is the
satisfaction of its employees.
168
The results of this study could be considered for incorporation in leadership
training curriculums. If leadership trainers can successfully develop future leaders to
increase their use of servant and transformational leadership qualities, then improvements
in employee job satisfaction can be expected. When training leadership styles within
organizations, it will be helpful for trainees to specify the organizational context in which
a leadership style is adequate when planning lessons and designing leadership
curriculums. Instructors may also apply the results of this study to account for employee
maturity in adopting a leadership style among servant leadership and transformational
leadership. Given that the leadership style manifested by organizational managers reflects
their knowledge, skills, and abilities, fostering the development of a dynamic leadership
approach that applies to different leadership styles and that is based on follower maturity
and the organizational context might enhance staff job satisfaction.
The results of this study provide a strong indication that transactional leadership is
not significantly correlated with employee job satisfaction. Given that there is a
statistically significant correlation between transformational/servant leadership and
employee job satisfaction, organizational leaders should focus on transformational and
servant leadership styles rather than transactional leadership when it comes to improving
employee job satisfaction. The results of this study imply that transactional leadership has
no direct impact on employee job satisfaction, which indicates that transactional
leadership may have less value than expected in promoting employee job satisfaction.
Such a finding can bring practical values to organizations.
169
Positive Social Change Implications
The potential impact on social change from this study proves to be positive. The
results of this study indicated a moderate, positive correlation between transformational /
servant leadership and employee job satisfaction. These findings point to strategies that
might support the efforts of organizational managers to improve employee job
satisfaction and then decrease staff turnover rates within organizations. As a result, such a
decrease in staff turnover rates within organizations can greatly help organizations in
gaining a competitive advantage at the employee level.
The implications of social change within organizations involve considering the
organizational context in which the organization evolves and the situation of the
employee (i.e., the maturity of the employee) to navigate between servant and
transformational leadership styles to improve employee job satisfaction. According to the
proposed dynamic leadership approach, the choice of leadership styles is dynamical and
situational, so organizational leaders must be flexible and adopt the appropriate
leadership style depending on the situation and context. Moreover, the proposed dynamic
leadership approach showed that the leadership style required for an individual varies
from one situation to another depending on the employee’s situation - employee maturity-
and the organizational context- the dynamism level of the organizational environment.
The findings of the study could inspire human resource academics within
organizations to revise their leadership curriculum to prescribe the leadership styles
appropriate to the levels of environmental dynamism and maturity of employees. By
determining the leadership styles that are appropriate for employees, organizational
170
leaders could apply the results of this study to their organization as a way to increase
employee job satisfaction, thus effecting positive social change for the employees within
organizations. Those results could also be extended to employees of other companies
operating in the same countries by considering the similarity of cultures. This study
should not only stimulate other researchers intellectually to conduct additional studies,
but it also has the potential to affect positive social change by encouraging decision-
makers in companies and organizations around the world to develop staff leadership
skills.
Conclusions
The purpose of this quantitative non-experimental correlation research study was
to examine the relationship between servant, transactional, and transformational
leadership styles and employee job satisfaction within organizations. A specific aim of
the study was to examine to what extent, if any, (a) follower maturity mediates the
relationship between leadership styles and employee job satisfaction, and (b) the
dynamism of the organizational environment moderates the relationship between
leadership styles and employee job satisfaction within organizations. To conduct this
study, I developed a theoretical framework based on Smith et al.’s (2004) comparative
model and Harber and McMaster’s (2018) theoretical model. Next, I collected survey data
from respondents working in different organizations in different countries around the
world. My analysis of the quantitative data collected was intended to answer three
research questions that guided the study. The results of the bivariate analysis confirmed
171
that there was a statistically significant correlational relationship between
transformational/servant leadership and employee job satisfaction. The results of the
moderation testing further suggested that the dynamism level of the organizational
environment moderates the relationship between transformational/servant leadership and
employee job satisfaction, and this relationship is stronger in stable environments than in
turbulent environments. The results of the mediation testing revealed that follower
maturity partially mediates the relationship between transformational/servant leadership
and employee job satisfaction, and this relationship is stronger for low-mature followers
than for followers of moderate or high maturity. Recommendations emerging from the
study include the need for further quantitative and qualitative studies to confirm the
validity of the proposed dynamic leadership approach and to capture the dynamic process
from which this approach influences individual-level outcomes and organizational-level
outcomes. Other recommendations include the need to evolve the proposed dynamic
leadership approach towards a dynamic leadership theory.
The results generated in this study should serve as a baseline study that provides a
conceptual and empirical basis for future research on a dynamic leadership approach that
applies servant and transformational leadership styles to improve employee job
satisfaction through situational and contingency variables. This study is particularly
useful for human resources and leadership development professionals who can better
adjust leadership styles in their organization as new information emerges, or, under
certain circumstances, to achieve expected organizational outcomes (e.g., employee job
satisfaction). From a practical point of view, organizational leaders should adjust their
172
leadership style according to the maturity level of the people they lead, the context in
which they lead, and the frequency of external pressures they face. This study promotes a
dynamic leadership approach that leaders can employ when the situation requires them to
use a different leadership style by examining the maturity level of their employees and
the dynamism level of the organizational environment for signals on when it is
appropriate to adopt transformational leadership over servant leadership.
173
References
Adanri, A. A., & Singh, R. K. (2016). Transformational leadership: Towards effective
governance in Nigeria. International Journal of Academic Research in Business
and Social Sciences, 6(11), 670–680. doi:10.6007/ijarbss/v6-i11/2450.
Aga, D. A., Noorderhaven, N., & Vallejo, B. (2016). Transformational leadership and
project success: The mediating role of team-building. International Journal of
Project Management, 34(5), 806–818. doi:10.1016/j.ijproman.2016.02.012.
Akgun, A. E., Keskin, H., & Byrne, J. (2008). The moderating role of environmental
dynamism between firm emotional capability and performance. Journal of
Organizational Change Management, 21(2), 230–252.
doi:10.1108/09534810810856453.
Allen, G. P., Moore, W. M., Moser, L. R., Neill, K. K., Sambamoorthi, U., & Bell, H. S.
(2016). The role of servant leadership and transformational leadership in
academic pharmacy. American Journal of Pharmaceutical Education, 80(7), 113.
Retrieved from https://www.ajpe.org.
Al-Mahdy, Y. F., Al-Harthi, A. S., & Salah El-Din, N. S. (2016). Perceptions of school
principals’ servant leadership and their teachers’ job satisfaction in Oman.
Leadership and Policy in Schools, 15(4), 543–566.
doi:10.1080/15700763.2015.1047032.
Alonderiene, R., & Majauskaite, M. (2016). Leadership style and job satisfaction in
higher education institutions. International Journal of Educational Management,
30(1), 140–164. doi:10.1108/ijem-08-2014-0106.
174
Amah, O. E. (2018). Determining the antecedents and outcomes of servant leadership.
Journal of General Management, 43(3), 126–138.
doi:10.1177/0306307017749634.
Anderson, M. H., & Sun, P. Y. (2017). Reviewing leadership styles: Overlaps and the
need for a new ‘full‐range’ theory. International Journal of Management Reviews,
19(1), 76-96. doi:10.1111/ijmr.12082.
Anwar, M. T. (2018). Model of leadership style to achieve success of high private
education information system. International Review of Management and
Marketing, 8(6), 24. Retrieved from https://www.econjournals.com.
Arenas, F. J. (2019). A casebook of transformational and transactional leadership. New
York, NY: Routledge. doi:10.4324/9781315178707.
Asrar-ul-Haq, M., & Kuchinke, K. P. (2016). Impact of leadership styles on employees’
attitude towards their leader and performance: Empirical evidence from Pakistani
banks. Future Business Journal, 2(1), 54–64. doi:10.1016/j.fbj.2016.05.002.
Awamleh, R., Evans, J., & Mahate, A. (2005). A test of transformational and
transactional leadership styles on employees’ satisfaction and performance in the
UAE banking sector. Journal of Comparative International Management, 8(1), 3–
19. Retrieved from https://journals.lib.unb.ca/index.php.
Babalola, S. S. (2016). The effect of leadership style, job satisfaction and employee-
supervisor relationship on job performance and organizational commitment.
Journal of Applied Business Research (JABR), 32(3), 935–946.
doi:10.19030/jabr.v32i3.9667.
175
Banks, G. C., Gooty, J., Ross, R. L., Williams, C. E., & Harrington, N. T. (2018).
Construct redundancy in leader behaviors: A review and agenda for the future.
The Leadership Quarterly, 29(1), 236–251. doi:10.1016/j.leaqua.2017.12.005.
Banks, G. C., McCauley, K. D., Gardner, W. L., & Guler, C. E. (2016). A meta-analytic
review of authentic and transformational leadership: A test for redundancy. The
Leadership Quarterly, 27(4), 634–652. doi:10.1016/j.leaqua.2016.02.006.
Barbuto, J. E., & Wheeler, D. W. (2006). Scale development and construct clarification
of servant leadership. Group & Organization Management, 31(3), 300–326.
doi:10.1177/1059601106287091.
Barbuto Jr(Jay), J. E., & Gottfredson, R. K. (2016). Human capital, the millennial’s reign,
and the need for servant leadership. Journal of Leadership Studies, 10(2), 59–63.
doi:10.1002/jls.21474.
Barnes, B. R. (2019). Transformative mixed methods research in South Africa:
Contributions to social justice. Research Methods in the Social Sciences, 303–
316. doi:10.18772/22019032750.24.
Barnett, D. E. (2018). Online adjunct faculty: A quantitative examination of the
predictive relationship between leadership and job satisfaction. International
Journal of Research in Education and Science, 4(1), 226–236.
doi:10.21890/ijres.383159.
Bass, B. M. (1985). Leadership and performance beyond expectations. New York: Free
Press.
176
Bass, B. M., & Avolio, B. J. (1995). The multifactor leadership questionnaire. Palo Alto,
CA: Mind Garden.
Boamah, S. A., Laschinger, H. K. S., Wong, C., & Clarke, S. (2018). Effect of
transformational leadership on job satisfaction and patient safety outcomes.
Nursing Outlook, 66(2), 180–189. doi:10.1016/j.outlook.2017.10.004.
Bowling, N. A., Wagner, S. H., & Beehr, T. A. (2018). The facet satisfaction scale: An
effective affective measure of job satisfaction facets. Journal of Business and
Psychology, 33(3), 383–403. doi:10.1007/s10869-017-9499-4.
Brase, C. H., & Brase, C. P. (2016). Understandable statistics: Concepts and methods
(12th ed.). Boston, MA: Cengage Learning.
Budiaji, W. (2019). Teachers versus extension agents from education perspective.
Proceeding of International Seminar on Education, 161–165.
doi:10.31227/osf.io/yvbmn.
Burawat, P. (2019). The relationships among transformational leadership, sustainable
leadership, lean manufacturing and sustainability performance in Thai SMEs
manufacturing industry. International Journal of Quality & Reliability
Management, 36(6), 1014–1036. doi:10.1108/ijqrm-09-2017-0178.
Bureau of Labor Statistics (BLS). (2017). Labor force statistics from the current
population survey: Employed persons by detailed occupation and age. Retrieved
January 22, 2020, from https://www.bls.gov/cps/cpsaat11b.htm.
Burkholder, G. J., Cox, K. A., & Crawford, L. M. (2016). The scholar-practitioner’s
guide to research design. Baltimore, MD: Laureate Publishing.
177
Burns, J. M. (1978). Leadership. New York: Harper & Row.
Cardona, P. (2000). Transcendental leadership. Leadership & Organization Development
Journal, 21(4), 201–207. doi:10.1108/01437730010335445.
Chan, K. W. C. (2016). Servant leadership cultivates grit and growth mindset in learners.
Servant Leadership: Theory & Practice, 3(2), 2. Retrieved from
http://www.sltpjournal.org.
Change, D., Linge, T. K., & Sikalieh, D. (2019). Influence of idealized influence on
employee engagement in parastatals in the energy sector in Kenya. International
Journal of Research in Business and Social Science, 8(5), 123–135.
doi:10.20525/ijrbs.v8i5.476.
Chiniara, M., & Bentein, K. (2016). Linking servant leadership to individual
performance: Differentiating the mediating role of autonomy, competence and
relatedness need satisfaction. The Leadership Quarterly, 27(1), 124–141.
doi:10.1016/j.leaqua.2015.08.004.
Chow, T. W., Salleh, L. M., & Ismail, I. A. (2017). Lessons from the major leadership
theories in comparison to the competency theory for leadership practice. Journal
of Business and Social Review in Emerging Economies, 3(2), 147–156.
doi:10.26710/jbsee.v3i2.86.
Chughtai, A. A. (2018). Examining the effects of servant leadership on life satisfaction.
Applied Research in Quality of Life, 13(4), 873–889. doi:10.1007/s11482-017-
9564-1.
178
Dajani, M. A. Z., & Mohamad, M. S. (2017). Leadership styles, organisational culture
and learning organisational capability in education industry: Evidence from
Egypt. International Journal of Business and Social Research, 6(11), 42–57.
doi:10.18533/ijbsr.v6i11.1022.
Dartey-Baah, K., & Addo, S. A. (2019). Psychological identification with job: A
leadership-ocb mediator. International Journal of Organizational Analysis, 27(3),
548–565. doi:10.1108/ijoa-10-2017-1262.
Darwis, M., Arismunandar, M., Sailan, M., Muharram, M., & Virdi, M. (2018).
Effectiveness of situational leadership director of Fajar TV Makassar, Indonesia.
Advances in Social Science, Education and Humanities Research, 226, 1171–
1174. Retrieved from https://www.atlantis-press.com.
Deshpande, S., Sahni, S., Karemore, T., Joshi, J., & Chahande, J. (2018). Evaluation of
relationship between leadership style and job satisfaction amongst healthcare
professionals. MedEdPublish, 7(1). doi:10.15694/mep.2018.0000024.1.
Dess, G. G., & Beard, D. W. (1984). Dimensions of organizational task environments.
Administrative Science Quarterly, 29(1), 52–73. doi:10.2307/2393080.
Dhamija, P., Gupta, S., & Bag, S. (2019). Measuring of job satisfaction: The use of
quality of work life factors. Benchmarking: An International Journal, 26(3), 871–
892. doi:0.1108/bij-06-2018-0155.
Dilig-Ruiz, A., MacDonald, I., Varin, M. D., Vandyk, A., Graham, I. D., & Squires, J. E.
(2018). Job satisfaction among critical care nurses: A systematic review.
179
International Journal of Nursing Studies, 88,123–134.
doi:10.1016/j.ijnurstu.2018.08.014.
Donia, M. B., Raja, U., Panaccio, A., & Wang, Z. (2016). Servant leadership and
employee outcomes: The moderating role of subordinates’ motives. European
Journal of Work and Organizational Psychology, 25(5), 722–734.
doi:10.1080/1359432x.2016.1149471.
European Federation of Management Consultancies Associations. (2018). Survey of the
European management consultancy market 2017-2018. Retrieved from
http://www.feaco.org/site-page/feaco-annual-survey-european-mc-market.
Eva, N., Robin, M., Sendjaya, S., Van Dierendonck, D., & Liden, R. C. (2019). Servant
leadership: A systematic review and call for future research. The Leadership
Quarterly, 30(1), 111–132. doi:10.1016/j.leaqua.2018.07.004.
Faul, F., Erdfelder, E., Buchner, A., & Lang, A.-G. (2009). Statistical power analyses
using G*Power 3.1: Tests for correlation and regression analyses. Behavior
Research Methods, 41(4), 1149–1160. doi:10.3758/brm.41.4.1149.
Feniser, C. & Sadeh, A. (2017). Dimensions of transformational leadership as revealed
from managerial planning prospects in higher education. New Trends and Issues
Proceedings on Humanities and Social Sciences, 4(1), 123–131.
doi:10.18844/prosoc.v4i1.2243.
Fernandez, C. F., & Vecchio, R. P. (1997). Situational leadership theory revisited: A test
of an across-jobs perspective. The Leadership Quarterly, 8(1), 67–84.
doi:10.1016/s1048-9843(97)90031-x.
180
Field, A. P. (2018). Discovering statistics using IBM SPSS statistics (5th ed.). Thousand
Oaks, CA: Sage Publications.
Fischer, S. A. (2016). Transformational leadership in nursing: A concept analysis.
Journal of Advanced Nursing, 72(11), 2644–2653. doi:10.1111/jan.13049.
Frankfort-Nachmias, C., & Leon-Guerrero, A. (2018). Social statistics for a diverse
society (8th ed.). Thousand Oaks, CA: Sage Publications.
Frankfort-Nachmias, C. and Nachmias, D. (2008). Research methods in the social
sciences (7th ed.). New York, NY: Worth Publishers.
Fritz, M. S., & MacKinnon, D. P. (2007). Required sample size to detect the mediated
effect. Psychological Science, 18(3), 233–239. doi:10.1111/j.1467-
9280.2007.01882.x.
García-Sánchez, E., García-Morales, V. J., & Martín-Rojas, R. (2018). Analysis of the
influence of the environment, stakeholder integration capability, absorptive
capacity, and technological skills on organizational performance through
corporate entrepreneurship. International Entrepreneurship and Management
Journal, 14(2), 345–377. doi:10.1007/s11365-017-0436-9.
George, D., & Mallery, P. (2003). SPSS for Windows step by step: A simple guide and
reference. Boston, MA: Allyn & Bacon.
Girma, S. (2016). The relationship between leadership style, job satisfaction and culture
of the organization. International Journal of Applied Research, 2(4), 35–45.
Retrieved from http://intjar.com.
181
Gitoho, S. W., Kamau, J. N., & Muchara, M. (2016). Influence of transformational
leadership style on employee job satisfaction: Case study of firms listed at the
Nairobi securities exchange. International Journal of Novel Research in
Marketing Management and Economics, 3(2),177–190. Retrieved from
www.noveltyjournals.com.
Göksoy, S. (2017). The relationship between principals’ cultural intelligence levels and
their cultural leadership behaviors. Educational Research and Reviews, 12(20),
988–995. doi:10.5897/err2016.2982.
Graham, J. W. (1991). Servant-leadership in organizations: Inspirational and moral. The
Leadership Quarterly, 2(2), 105–119. doi:10.1016/1048-9843(91)90025-w.
Greenleaf, R. K. (1977). Servant leadership: A journey into the nature of legitimate
power and greatness. New York: Paulist Press.
Gregory Stone, A., Russell, R. F., & Patterson, K. (2004). Transformational versus
servant leadership: A difference in leader focus. Leadership & Organization
Development Journal, 25(4), 349–361. doi:10.1108/01437730410538671.
Grobler, P. A. (1996). In search of excellence: leadership challenges facing companies in
the new South Africa. SAM Advanced Management Journal, 61(2), 22. Retrieved
from https://samnational.org.
Günzel-Jensen, F., Hansen, J. R., Jakobsen, M. L. F., & Wulff, J. (2017). A two-pronged
approach? Combined leadership styles and Innovative behavior. International
Journal of Public Administration, 41(12), 957–970.
doi:10.1080/01900692.2017.1303711.
182
Hamdani, M. R. (2018). Learning how to be a transformational leader through a skill-
building, role-play exercise. The International Journal of Management Education,
16(1), 26–36. doi:10.1016/j.ijme.2017.11.003.
Harber, G. G., & McMaster, C. C. (2018). Adapting servant leadership to follower
maturity: A dynamic leadership approach for a diverse environment. Servant
Leadership: Theory & Practice, 5(1), 5. Retrieved from
http://www.sltpjournal.org.
Hatta, I. H., Rachbini, W., Riskarini, D., & Mandagie, Y. R. O. (2018). Organizational
citizenship behavior analysis, transformational leadership style, work ethic, work
satisfaction, and good governance. Jurnal Manajemen, 22(3), 395–408.
doi:10.24912/jm.v22i3.429.
Heppner, P. P., Wampold, B. E., Owen, J., Thompson, M. N., & Wang, K. T. (2015).
Research design in counseling (4th ed.). Boston, MA: Cengage Learning.
Hersey, P., & Blanchard, K. (1982). Management of organizational behavior: Utilizing
human resources (4th ed.). Englewood Cliffs, NJ: Prentice Hall.
Herzberg, F. (1968). One more time: How do you motivate employees. Harvard Business
Review, 53-62.
Hijazi, S., Kasim, A. L., & Daud, Y. (2017). Leadership styles and their relationship with
the private university employees’ job satisfaction in United Arab Emirates.
Journal of Public Administration and Governance, 6(4), 110–124.
doi:10.5296/jpag.v6i4.10347.
183
Hinde, S., & Spackman, E. (2015). Bidirectional citation searching to completion: An
exploration of literature searching methods. PharmacoEconomics, 33(1), 5–11.
doi:10.1007/s40273-014-0205-3.
Ho, V., Dinh, T., & Vu, M. (2016). Transformational and transactional leadership styles
and employees’ job satisfaction in Vietnamese local companies. International
Review of Management and Business Research, 5(3), 938–950. Retrieved from
http://www.irmbrjournal.com.
Hoch, J. E., Bommer, W. H., Dulebohn, J. H., & Wu, D. (2018). Do ethical, authentic,
and servant leadership explain variance above and beyond transformational
leadership? A meta-analysis. Journal of Management, 44(2), 501–529.
doi:10.1177/0149206316665461.
Holtzhausen, N., & de Klerk, J. J. (2018). Servant leadership and the Scrum team’s
effectiveness. Leadership & Organization Development Journal, 39(7), 873–882.
doi:10.1108/lodj-05-2018-0193.
Hoption, C. (2016). It does not add up: Comparing episodic and general leadership
ratings. Leadership, 12(4), 491–503. doi:10.1177/1742715015575583.
Humphreys, J. H. (2005). Contextual implications for transformational and servant
leadership: A historical investigation. Management Decision, 43(10), 1410–1431.
doi:10.1108/00251740510634949.
Ilkhanizadeh, S., & Karatepe, O. M. (2018). Does trust in organization mediate the
influence of servant leadership on satisfaction outcomes among flight attendants?
184
International Journal of Contemporary Hospitality Management, 30(12), 3555–
3573. doi:10.1108/ijchm-09-2017-0586.
İnce, F. (2018). The effect of democratic leadership on organizational cynicism: A study
on public employees. Journal of Business Research Turk, 10(2), 245–253.
doi:10.20491/isarder.2018.428.
Iqbal, N., Anwar, S., & Haider, N. (2015). Effect of leadership style on employee
performance. Arabian Journal of Business and Management Review, 5(5), 1–6.
Retrieved from https://s3.amazonaws.com.
Iverson, S. V., McKenzie, B. L., & Halman, M. (2019). What Can Feminism Offer
Student Leadership Education? Journal of Leadership Education, 18(1), 183–199.
doi:10.12806/v18/i1/t1.
Jager, J., Putnick, D. L., & Bornstein, M. H. (2017). More than just convenient: The
scientific merits of homogeneous convenience samples. Monographs of the
Society for Research in Child Development, 82(2), 13–30.
doi:10.1111/mono.12296.
Jang, J., & Kandampully, J. (2018). Reducing employee turnover intention through
servant leadership in the restaurant context: A mediation study of affective
organizational commitment. International Journal of Hospitality & Tourism
Administration, 19(2), 125–141. doi:10.1080/15256480.2017.1305310.
Janicijevic, N., Kovacevic, P., & Petrovic, I. (2015). Identifying organizational factors of
job satisfaction: The case of one Serbian company. Economic Annals, 60(205),
73-104. doi:10.2298/eka1505073j.
185
Jeong, Y., & Jung, M. J. (2016). Application and interpretation of hierarchical multiple
regression. Orthopaedic Nursing, 35(5), 338–341.
doi:10.1097/nor.0000000000000279.
Judge, T. A., Weiss, H. M., Kammeyer-Mueller, J. D., & Hulin, C. L. (2017). Job
attitudes, job satisfaction, and job affect: A century of continuity and of change.
Journal of Applied Psychology, 102(3), 356. doi:10.1037/apl0000181.
Kaufmann, E. (2018). Data aggregation: A proposed psychometric IPD meta-analysis.
Open Journal of Statistics, 8(01), 38–48. doi:10.4236/ojs.2018.81004.
Keith, T. Z. (2015). Multiple regression and beyond: An introduction to multiple
regression and structural equation modeling (2nd ed.). New York, NY:
Routledge.
Khajepour, N., Baharlou, M., Yeganeh, M. M., & Hashemi, S. E. (2016). The mediating
role of psychological empowerment and organizational justice in the relationship
of servant leadership with job satisfaction, organizational citizenship behavior and
organizational commitment. International Journal of Behavioral Sciences, 10(2),
99–105. Retrieved from http://www.behavsci.ir.
Khalil, U., Iqbal, J., & Khan, A. (2016). Exploring leadership styles of school
administrators in Pakistan. FWU Journal of Social Sciences, 10(1), 39–47.
Retrieved from http://journal.sbbwu.edu.pk.
Khan, N. (2017). Adaptive or transactional leadership in current higher education: A brief
comparison. The International Review of Research in Open and Distributed
Learning, 18(3). doi:10.19173/irrodl.v18i3.3294.
186
Kianto, A., Vanhala, M., & Heilmann, P. (2018). The impact of knowledge management
on job satisfaction. Journal of Knowledge Management, 20(4), 621–636.
doi:10.1108/jkm-10-2015-0398.
Kocman, A., & Weber, G. (2018). Job satisfaction, quality of work life and work
motivation in employees with intellectual disability: A systematic review. Journal
of Applied Research in Intellectual Disabilities, 31(1), 1–22.
doi:10.1111/jar.12319.
Kuhlmann, T., Dantlgraber, M., & Reips, U. D. (2017). Investigating measurement
equivalence of visual analogue scales and Likert-type scales in internet-based
personality questionnaires. Behavior Research Methods, 49(6), 2173–2181.
doi:10.3758/s13428-017-0868-8.
Kyriazos, T. A. (2018). Applied psychometrics: Sample size and sample power
considerations in factor analysis (EFA, CFA) and SEM in general. Psychology,
9(08), 2207–2230. doi:10.4236/psych.2018.98126.
Laub, J. A. (1999). Assessing the servant organization: Development of the servant
organizational leadership assessment (SOLA) instrument (Unpublished doctoral
dissertation). Florida Atlantic University.
Leech, N. L., Barrett, K. C., & Morgan, G. A. (2015). IBM SPSS for intermediate
statistics: Use and interpretation (5th ed.). New York, NY: Routledge.
Lemoine, G. J., Hartnell, C. A., & Leroy, H. (2019). Taking stock of moral approaches to
leadership: An integrative review of ethical, authentic, and servant leadership.
Academy of Management Annals, 13(1), 148–187. doi:10.5465/annals.2016.0121.
187
Little, R. J., & Rubin, D. B. (2019). Statistical analysis with missing data (3rd ed.). New
York, NY: John Wiley & Sons, Inc.
Lituchy, T. R., Galperin, B. L., & Punnett, B. J. (2017). LEAD: Leadership effectiveness
in Africa and the African diaspora. New York: Palgrave Macmillan.
Locke, E. A. (1969). What is job satisfaction? Organizational Behavior and Human
Performance, 4(4), 309–336. doi:10.1016/0030-5073(69)90013-0.
Lussier, R. N., & Achua, C. F. (2015). Leadership: Theory, application, & skill
development (6th ed.). Boston, MA: Cengage Learning.
Malek, K., Kline, S. F., & DiPietro, R. (2018). The impact of manager training on
employee turnover intentions. Journal of Hospitality and Tourism Insights, 1(3),
203–219. doi:10.1108/jhti-02-2018-0010.
Maslow, A. H. (1954). Motivation and Personality. New York: Harper & Row.
McGregor, D.M. (1960). The human side of enterprise. New York: McGraw-Hill.
Miller, D., & Friesen, P. H. (1983). Strategy‐making and environment: The third link.
Strategic Management Journal, 4(3), 221–235. doi:10.1002/smj.4250040304.
Mohammad Mosadegh Rad, A., & Hossein Yarmohammadian, M. (2006). A study of
relationship between managers’ leadership style and employees’ job satisfaction.
Leadership in Health Services, 19(2), 11–28. doi:10.1108/13660750610665008.
Moslehpour, M., Altantsetseg, P., Mou, W., & Wong, W. K. (2019). Organizational
climate and work style: The missing links for sustainability of leadership and
satisfied employees. Sustainability, 11(1), 125. doi:10.3390/su11010125.
188
Musinguzi, C., Namale, L., Rutebemberwa, E., Dahal, A., Nahirya-Ntege, P., &
Kekitiinwa, A. (2018). The relationship between leadership style and health
worker motivation, job satisfaction and teamwork in Uganda. Journal of
Healthcare Leadership, 10, 21–32. doi:10.2147/jhl.s147885.
Mutali, E. (2017). Strategic leadership and change management at Equity bank.
International Academic Journal of Human Resource and Business
Administration, 2(4), 49–67. Retrieved from http://www.iajournals.org.
Muterera, J., Hemsworth, D., Baregheh, A., & Garcia-Rivera, B. R. (2018). The leader–
follower dyad: The link between leader and follower perceptions of
transformational leadership and its impact on job satisfaction and organizational
performance. International Public Management Journal, 21(1), 131–162.
doi:10.1080/10967494.2015.1106993.
Nazarian, A., Atkinson, P., Foroudi, P., & Dennis, K. (2019). Finding the right
management approach in independent hotels. International Journal of
Contemporary Hospitality Management, 31(7), 2862–2883. doi:10.1108/ijchm-
08-2018-0700.
Northouse, P. G. (2018). Leadership: Theory and practice (8th ed.). California: Sage
Publications, Inc.
Ntenga, E. K., & Awuor, E. (2018). Leadership style and employee turnover intentions in
organizations in Kenya: A case of xyz company. Journal of Human Resource &
Leadership, 2(3), 87–109. Retrieved from https://stratfordjournals.org.
189
Oc, B. (2018). Contextual leadership: A systematic review of how contextual factors
shape leadership and its outcomes. The Leadership Quarterly, 29(1), 218–235.
doi:10.1016/j.leaqua.2017.12.004.
Ombok, B., & Aila, F. (2015). Validating measures in business research: Practical
implications. International Journal of Science and Engineering, 1(9), 11–19.
Retrieved from https://ejournal.undip.ac.id.
Park, T., & Ryu, D. (2015). Drivers of technology commercialization and performance in
SMEs: The moderating effect of environmental dynamism. Management
Decision, 53(2), 338–353. doi:10.1108/md-03-2014-0143.
Parris, D. L., & Peachey, J. W. (2013). A systematic literature review of servant
leadership theory in organizational contexts. Journal of Business Ethics, 113(3),
377-393. doi:10.1007/s10551-012-1322-6.
Pillay, R., Flotman, A. P., & Mitonga-Monga, J. (2019). Emotional labour among women
leaders within the South African consulting industry: A hermeneutic
phenomenological inquiry. Southern African Business Review, 23, 1–23.
doi:10.25159/1998-8125/4280.
Raghunathan, T. (2015). Missing data analysis in practice. New York, NY: Taylor &
Francis Group.
Rahmat, R., Ramly, M., Mallongi, S., & Kalla, R. (2019). The leadership style effect on
the job satisfaction and the performance. Asia Pacific Journal of Management
and Education, 2(1), 1–13. doi:10.3253/apjme.V2i1.376.
190
Randolph, J. J. (2009). A guide to writing the dissertation literature review. Practical
Assessment, Research and Evaluation, 14(13), 1–13. Retrieved from
http://pareonline.net.
Ravitch, S. M., & Carl, N. M. (2016). Qualitative research: Bridging the conceptual,
theoretical, and methodological. Thousand Oaks, CA: Sage Publications.
Ribeiro, N., Yücel, İ., & Gomes, D. (2018). How transformational leadership predicts
employees’ affective commitment and performance. International Journal of
Productivity and Performance Management, 67(9), 1901–1917.
doi:10.1108/ijppm-09-2017-0229.
Robbins, S.P., Coulter, M., & DeCenzo, D.A. (2017). Fundamentals of management
(10th ed.). Boston, MA: Pearson.
Ross, A., & Willson, V. L. (2017). Hierarchical multiple regression analysis using at least
two sets of variables (in two blocks). In Basic and Advanced Statistical Tests (pp.
59–74). Rotterdam: SensePublishers.
Rubin, D. B. (1987). Multiple imputations for nonresponse in surveys. New York, NY:
John Wiley & Sons, Inc.
Saleh, R. M. M., Nusari, M., Ameen, A., & Alrajawy, I. (2018). Leadership in the
organization: A conceptual review. International Journal of Management and
Human Science, 2(4), 52–59. Retrieved from http://www.ijmhs.org.
Samson, A. T., & Ilesanmi, O. A. (2019). The relationship between transactional
leadership, transformational leadership and performance of SMEs in Nigeria.
191
Noble International Journal of Business and Management Research, 3(4), 73–85.
Retrieved from https://www.napublisher.org.
Sendjaya, S. (2015). Personal and organizational excellence through servant leadership:
Learning to serve, serving to lead, leading to transform. Switzerland: Springer.
Shah, S. S., Shah, A. A., & Pathan, S. K. (2017). The relationship of perceived leadership
styles of department heads to job satisfaction and job performance of faculty
members. Journal of Business Strategies, 11(2), 35–56. Retrieved from
http://www.jsbs.org.
Sheshi, A., & Kërçini, D. (2017). The role of transactional, transformational and
participative leadership in performance of SME’s in Albania. Albanian Journal of
Agricultural Sciences, 285–292. Retrieved from http://www.revista.ubt.edu.al.
Smith, B. N., Montagno, R. V., & Kuzmenko, T. N. (2004). Transformational and servant
leadership: Content and contextual comparisons. Journal of Leadership &
Organizational Studies, 10(4), 80–91. doi:10.1177/107179190401000406.
Soper, D. (2020). A-priori sample size calculator for hierarchical multiple regression.
Retrieved March 8, 2020, from https://www.danielsoper.com.
Sousa, M., & Van Dierendonck, D. (2017). Servant leadership and the effect of the
interaction between humility, action, and hierarchical power on follower
engagement. Journal of Business Ethics, 141(1), 13–25. doi:10.1007/s10551-015-
2725-y.
Spector, P. E. (1997). Job satisfaction: Application, assessment, causes, and
consequences. Thousand Oaks, CA: Sage Publications.
192
Staats, C. (2016). The adaptable emphasis leadership model: A more full range of
leadership. Servant Leadership: Theory & Practice, 2(2), 2. Retrieved from
http://www.sltpjournal.org.
Sukriket, P. (2018). The relationship between job satisfaction and turnover intention of
Thai software programmers in Bangkok, Thailand. AU Journal of Management,
12(2), 42–52. Retrieved from https://aujm.au.edu.
Sverke, M., Hellgren, J., & Näswall, K. (2002). No security: A meta-analysis and review
of job insecurity and its consequences. Journal of Occupational Health
Psychology, 7(3), 242–264. doi:10.1037/1076-8998.7.3.242.
Tepper, B. J., Dimotakis, N., Lambert, L. S., Koopman, J., Matta, F. K., Man Park, H., &
Goo, W. (2018). Examining follower responses to transformational leadership
from a dynamic, person–environment fit perspective. Academy of Management
Journal, 61(4), 1343–1368. doi:10.5465/amj.2014.0163.
Tetteh, E. N., & Brenyah, R. S. (2016). Organizational leadership styles and their impact
on employee’s job satisfaction: Evidence from the mobile telecommunications
sector of Ghana. Global Journal of Human Resource Management, 4(4), 12–24.
Retrieved from https://www.eajournals.org.
Thompson, G., & Glasø, L. (2015). Situational leadership theory: A test from three
perspectives. Leadership & Organization Development Journal, 36(5), 527–544.
doi:10.1108/lodj-10-2013-0130.
193
Thompson, G., & Glasø, L. (2018). Situational leadership theory: A test from a leader-
follower congruence approach. Leadership & Organization Development Journal,
39(5), 574–591. doi:10.1108/lodj-01-2018-0050.
Thompson, R. S. (2015). The perception of servant leadership characteristics and job
satisfaction in a church-related college. Retrieved from https://futana.ga.
Torlak, N. G., & Kuzey, C. (2019). Leadership, job satisfaction and performance links in
private education institutes of Pakistan. International Journal of Productivity and
Performance Management, 68(2), 276–295. doi:10.1108/ijppm-05-2018-0182.
Trafimow, D. (2018). Confidence intervals, precision and confounding. New Ideas in
Psychology, 50, 48–53. doi:10.1016/j.newideapsych.2018.04.005.
Trochim, W., Donnelly, J. P., & Arora, K. (2016). Research methods: The essential
knowledge base (2nd ed.). Boston, MA: Cengage Learning.
Van Dierendonck, D., & Patterson, K. (2015). Compassionate love as a cornerstone of
servant leadership: An integration of previous theorizing and research. Journal of
Business Ethics, 128(1), 119–131. doi:10.1007/s10551-014-2085-z.
Van Dierendonck, D., Sousa, M., Gunnarsdóttir, S., Bobbio, A., Hakanen, J., Pircher
Verdorfer, A., Cihan Duyan, E., & Rodriguez-Carvajal, R. (2017). The cross-
cultural invariance of the servant leadership survey: A comparative study across
eight countries. Administrative Sciences, 7(2), 8. doi:10.3390/admsci7020008.
Van Dierendonck, D., Stam, D., Boersma, P., De Windt, N., & Alkema, J. (2014). Same
difference? Exploring the differential mechanisms linking servant leadership and
194
transformational leadership to follower outcomes. The Leadership Quarterly,
25(3), 544–562. doi:10.1016/j.leaqua.2013.11.014.
Van Saane, N., Sluiter, J. K., Verbeek, J. H. A. M., & Frings‐Dresen, M. H. W. (2003).
Reliability and validity of instruments measuring job satisfaction—a systematic
review. Occupational Medicine, 53(3), 191–200. doi:10.1093/occmed/kqg038.
Vigan, F. A., & Giauque, D. (2018). Job satisfaction in African public administrations: A
systematic review. International Review of Administrative Sciences, 84(3), 596–
610. doi:10.1177/0020852316651693.
Wagner, W. E. (2016). Using IBM® SPSS® statistics for research methods and social
science statistics (6th ed.). Thousand Oaks, CA: Sage Publications.
Wakabi, B. M. (2016). Leadership style and staff retention in organisations. International
Journal of Science and Research, 5(1), 412–416. doi:10.21275/v5i1.nov152642.
Wamwangi, F. M., & Kagiri, A. (2018). Role of talent management programmes on
employee performance in professional consultancy services firms in Kenya.
European Journal of Business and Strategic Management, 3(3), 56–73. Retrieved
from https://www.iprjb.org.
Waziri, A. Y., Ali, K. N., & Aliagha, G. U. (2015). The influence of transformational
leadership style on ICT adoption in the Nigerian construction industry. Asian
Social Science, 11(18), 123. doi:10.5539/ass.v11n18p123.
Yahaya, R., & Ebrahim, F. (2016). Leadership styles and organizational commitment:
Literature review. Journal of Management Development, 35(2), 190–216.
doi:10.1108/jmd-01-2015-0004.
195
Ye, X., Feng, J., Ma, L., & Huang, X. (2018). Impact of team leadership habitual
domains on ambidextrous innovation. Social Behavior and Personality, 46(12),
1955-1966. doi:10.2224/sbp.7323.
Ye, Y., Lyu, Y., & He, Y. (2019). Servant leadership and proactive customer service
performance. International Journal of Contemporary Hospitality Management,
31(3), 1330–1347. doi:10.1108/ijchm-03-2018-0180.
Yu, H., Jiang, S., & Land, K. C. (2015). Multicollinearity in hierarchical linear models.
Social Science Research, 53, 118–136. doi:10.1016/j.ssresearch.2015.04.008.
Yun, S., Cox, J., & Sims Jr, H. P. (2006). The forgotten follower: A contingency model
of leadership and follower self-leadership. Journal of Managerial Psychology,
21(4), 374–388. doi:10.1108/02683940610663141.
Zaccaro, S. J., Green, J. P., Dubrow, S., & Kolze, M. (2018). Leader individual
differences, situational parameters, and leadership outcomes: A comprehensive
review and integration. The Leadership Quarterly, 29(1), 2–43.
doi:10.1016/j.leaqua.2017.10.003.
Zhang, Y., Zheng, Y., Zhang, L., Xu, S., Liu, X., & Chen, W. (2019). A meta-analytic
review of the consequences of servant leadership: The moderating roles of
cultural factors. Asia Pacific Journal of Management, 1–30. doi:10.1007/s10490-
018-9639-z.
Zhu, Q., & Wang, P. (2019). The Influence of leadership style on employees’ innovative
behavior—The adjustment of bicultural self. Proceedings of the Twelfth
196
International Conference on Management Science and Engineering
Management,1109–1121. doi:10.1007/978-3-319-93351-1_87.
197
Appendix A: Survey Questions
Section 1: Eligibility Criteria Page for Survey Participants
Do you work in an organization?
o Yes
o No
Section 2: Informed Consent Page for Survey Participants
You are invited to participate in a study examining a dynamic leadership approach
that may help improve employee job satisfaction in both stable and turbulent
organizational environments. The researcher is inviting anyone who works in an
organization to participate in the study. This form is part of a process called “informed
consent” to allow you to understand this study before deciding whether to take part.
This study is being conducted by a researcher named Francois Kammoe, who is a
doctoral candidate in Management specializing in leadership and organizational change at
Walden University in the United States. This questionnaire is purely for academic
purpose and you are assured that your responses will be treated with utmost
confidentiality and anonymity. Also, you are kindly request to respond to each item as
frankly as you can. The results of this study, of course, will not identify either individuals
or your organization, and your responses will remain confidential and anonymous.
Background Information:
The purpose of this study is to examine the relationship between servant,
transactional, and transformational leadership styles and employee job satisfaction. A
specific aim of this study is to examine to what extent, if any, (a) employee maturity
198
mediates the relationship between leadership styles and employee job satisfaction, and (b)
the dynamism of the organizational environment influences the strength (low, moderate,
strong) or direction of the relationship (positive or negative relationship) between
leadership styles and employee job satisfaction within organizations.
Procedures:
If you agree to be in this study, you will be asked to:
• Complete a survey that consist of a total of 20 questions. This survey
should take approximately 20 minutes to complete. All responses will be anonymous.
• Answer questions about your perceptions on your leader’s leadership
styles, your job satisfaction level, the dynamism level of your organizational task
environment, and your own maturity level by considering your professional experience
and the leadership support provided by your manager.
The survey is asking you for your opinion. Please note that:
• Read each statement carefully.
• While alternative answers are given, please select the answer that best
describes your opinion.
• Multiple responses are not possible.
Voluntary Nature of the Study:
This study is voluntary. You are free to accept or turn down the invitation. The
identity of the participant and the name of the organization are not required for this study.
No one in your organization will treat you differently if you decide not to be in the study.
If you decide to join the study now, you can still change your mind later. You may stop at
199
any time. Given the confidential and anonymous nature of the study, this study cannot
affect your employment or relations with your organization.
Risks and Benefits of Being in the Study:
Being in this type of study involves some risk of the minor discomforts that can
be encountered in daily life, such as fatigue or stress. If you feel tired for a moment, you
are encouraged to take a short break before continuing to answer the survey. Being in this
study would not pose risk to your safety or wellbeing.
The study has an indirect benefit to you as a participant as it may help improve
the leadership practice in understanding which leadership style among servant and
transformational leadership is adequate for improving the job satisfaction levels of
employees within organizations when the organizational context shifts from a stable
environment to a dynamic environment. Moreover, the results of the proposed research
might serve as a source of policy guidance by providing organizational managers with
insight into the understanding of environmental and follower conditions that may help
improve employee job satisfaction, which could guide them in their decision to choose
the appropriate leadership style among transactional, transformational, and servant
leadership.
Payment:
There is no payment for your participation in this study. To provide reciprocity
for your participation, you may submit your contact information (e.g., private email) on
the last slide of the survey and receive an executive summary of the study findings. But,
if you skip questions or do not complete the full survey, your results may not be included
200
in the survey analysis. You must complete the entire survey for your responses to be
included.
Privacy:
Reports coming out of this study will not share the identities of organizations and
individual participants. The identity of the participants and the name of their
organizations are not required for this study. Any information you provide during this
study will be kept anonymous. Data will be kept secure in separate password encrypted
files on a password protected computer. Data will be kept for a period of at least 5 years,
as required by the university, after which it will be destroyed.
Contacts and Questions:
You may ask any questions you have now. Or if you have questions later, you
may contact the researcher via email [email protected] or (+225) 87 15 63
10 or (+237) 6 77 55 12 63. If you want to talk privately about your rights as a
participant, you can call the Research Participant Advocate at +1-612-312-1210 or email
[email protected]. Walden University’s approval number for this study is 02-11-20-
0628704 and it expires on February 10th, 2021. Please print or save this consent form for
your records.
Obtaining Your Consent:
If you feel you understand the study well enough to contribute, please indicate
your consent by clicking on the “Yes” button below. Indeed, this form is part of a process
called “informed consent” to allow you to understand this study before deciding whether
to participate or not.
201
Do you agree to participate in this study? By clicking Yes, you consent that you
have read and understood the above information and that you are willing to answer the
questions in this survey.
o Yes
o No
Section 3: Demographic Questions
1. Which of the following best describes the industry sector of the organization in which
you work in?
o Federal government
o State and local government
o Agriculture, forestry, fishing, and hunting
o Goods-producing, excluding agriculture
o Mining
o Construction
o Manufacturing
o Services-providing excluding special industries
o Utilities
o Wholesale trade
o Retail trade
o Transportation and warehousing
o Information
o Financial activities
202
o Professional and business Services
o Educational services
o Health care and social assistance
o Leisure and hospitality
o Other services
2. What is your age range?
o 18-30 years
o 31-40 years
o 41-50 years
o 51-60 years
o 61+ years
o Prefer not to answer question
3. What is your gender?
o Male
o Female
o Prefer not to answer question
4. What is the highest level of education you have completed?
o Some college
o Professional Training Certificates
o Associates Degree
o Bachelor’s Degree
o Master’s Degree
203
o Doctoral Degree
o Prefer not to answer question
5. What is your hierarchical rank/position in your current organization?
o Non-Management
o Middle-Management (Supervisor, Team Leader, Manager…)
o Senior Management
o Top Management/Directors/General Management
o C-Chief executives
6. Considering all the companies for which you have worked since the start of your first
job until today regardless of the industry sector (finance, federal government, etc.),
what is your total number of years of work experience in both non-management and
management roles?
o Less than one year
o 1-5 years
o 6-10 years
o 11-15 years
o 16-20 years
o 21-25 years
o 26-30 years
o 31+ years
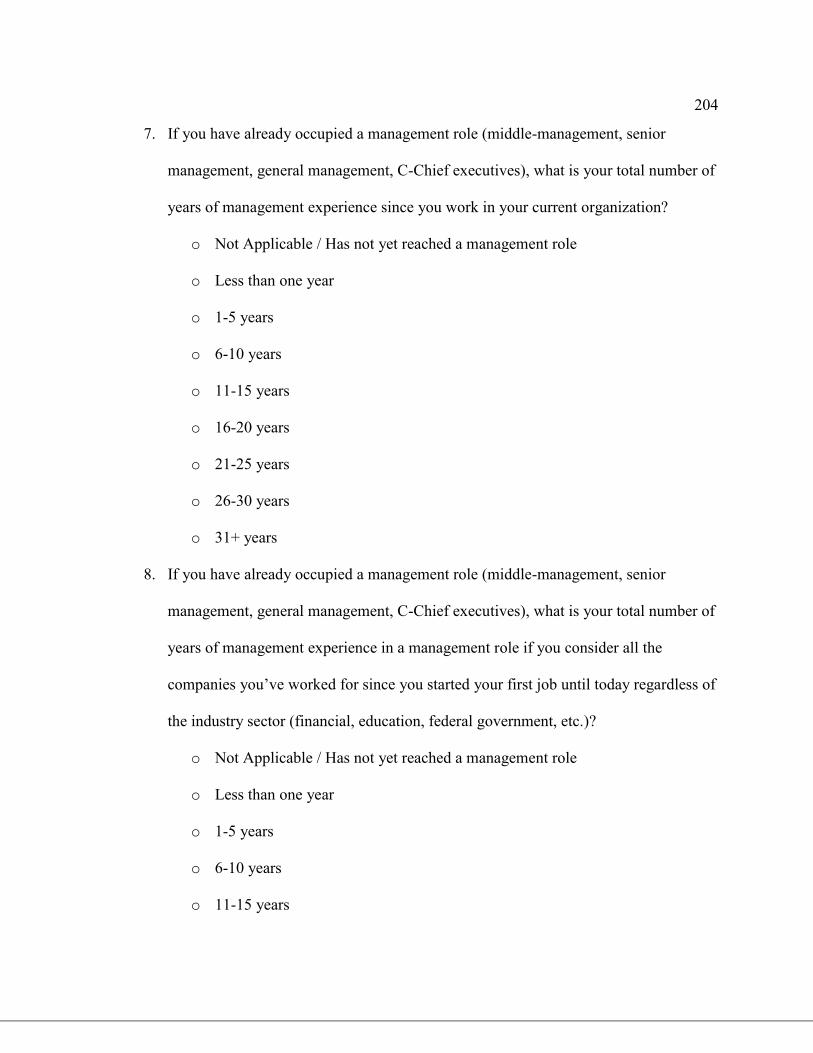
204
7. If you have already occupied a management role (middle-management, senior
management, general management, C-Chief executives), what is your total number of
years of management experience since you work in your current organization?
o Not Applicable / Has not yet reached a management role
o Less than one year
o 1-5 years
o 6-10 years
o 11-15 years
o 16-20 years
o 21-25 years
o 26-30 years
o 31+ years
8. If you have already occupied a management role (middle-management, senior
management, general management, C-Chief executives), what is your total number of
years of management experience in a management role if you consider all the
companies you’ve worked for since you started your first job until today regardless of
the industry sector (financial, education, federal government, etc.)?
o Not Applicable / Has not yet reached a management role
o Less than one year
o 1-5 years
o 6-10 years
o 11-15 years
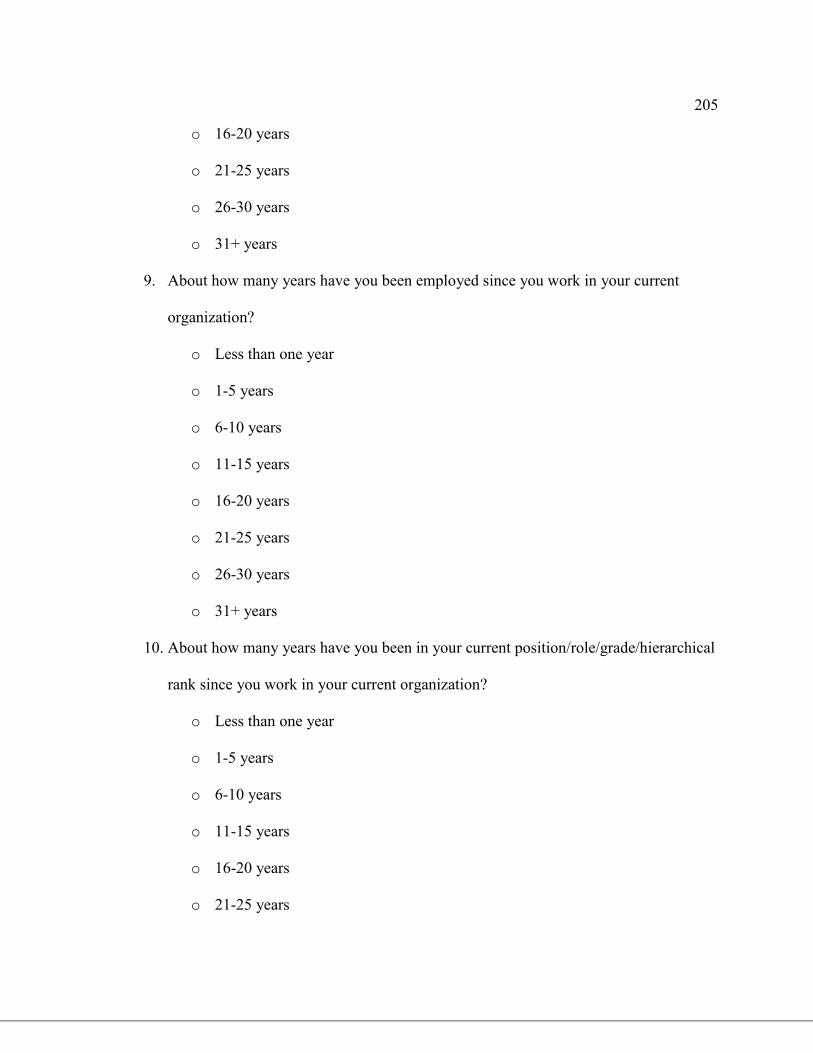
205
o 16-20 years
o 21-25 years
o 26-30 years
o 31+ years
9. About how many years have you been employed since you work in your current
organization?
o Less than one year
o 1-5 years
o 6-10 years
o 11-15 years
o 16-20 years
o 21-25 years
o 26-30 years
o 31+ years
10. About how many years have you been in your current position/role/grade/hierarchical
rank since you work in your current organization?
o Less than one year
o 1-5 years
o 6-10 years
o 11-15 years
o 16-20 years
o 21-25 years

206
o 26-30 years
o 31+ years
11. About how many years have you worked hierarchically under your current
supervisor/manager since you work in your current organization?
o Not applicable / There is no leader above me hierarchically with whom I have
worked
o Less than one year
o 1-5 years
o 6-10 years
o 11-15 years
o 16-20 years
o 21-25 years
o 26-30 years
o 31+ years
12. What is the name of the country in which you work in (United States, Ivory Coast,
etc.)?
Section 4: Environmental Dynamism
13. Answer questions as the statement pertains to your perspective of the dynamism of
your organizational environment. Please evaluate each statement, identifying the
extent to which you perceive the frequency of changes in industry, in competitors’
strategies and products, and in customers’ tastes and preferences (1 = very infrequent
/no change; 2 = weakly infrequent; 3 = somewhat frequent; 4 = frequent; 5 = very
frequent).
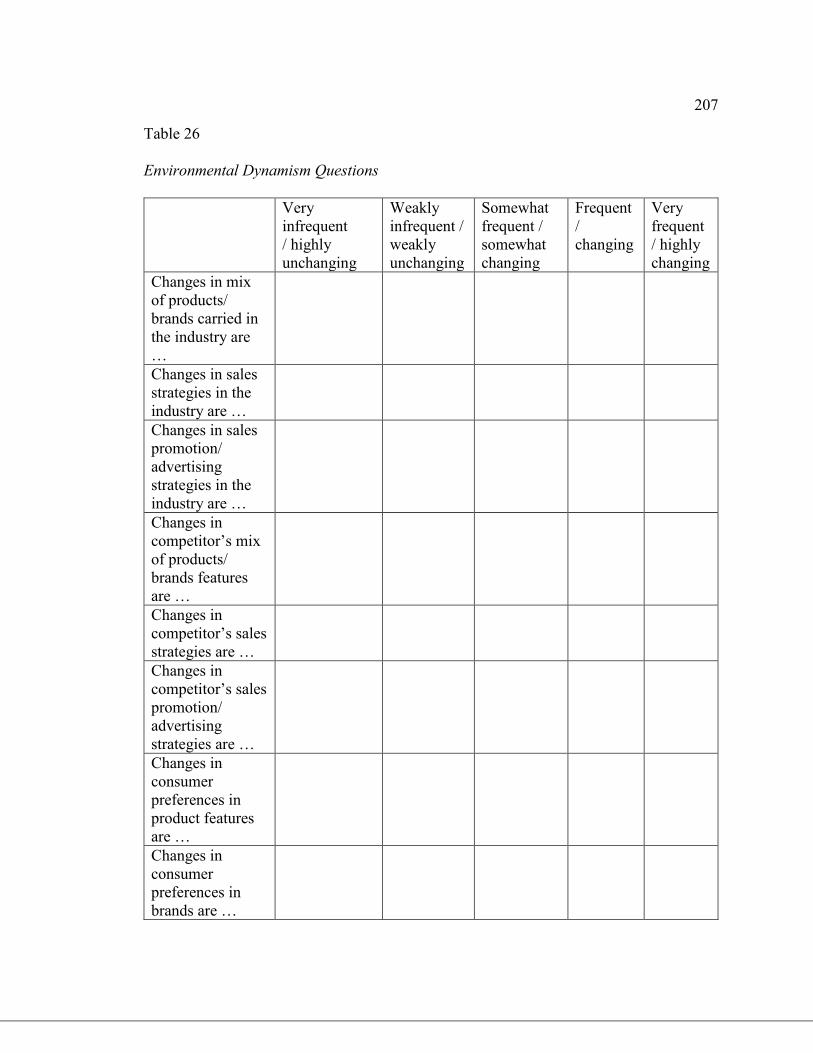
207
Table 26
Environmental Dynamism Questions
Very
infrequent
/ highly
unchanging
Weakly
infrequent /
weakly
unchanging
Somewhat
frequent /
somewhat
changing
Frequent
/
changing
Very
frequent
/ highly
changing
Changes in mix
of products/
brands carried in
the industry are
…
Changes in sales
strategies in the
industry are …
Changes in sales
promotion/
advertising
strategies in the
industry are …
Changes in
competitor’s mix
of products/
brands features
are …
Changes in
competitor’s sales
strategies are …
Changes in
competitor’s sales
promotion/
advertising
strategies are …
Changes in
consumer
preferences in
product features
are …
Changes in
consumer
preferences in
brands are …
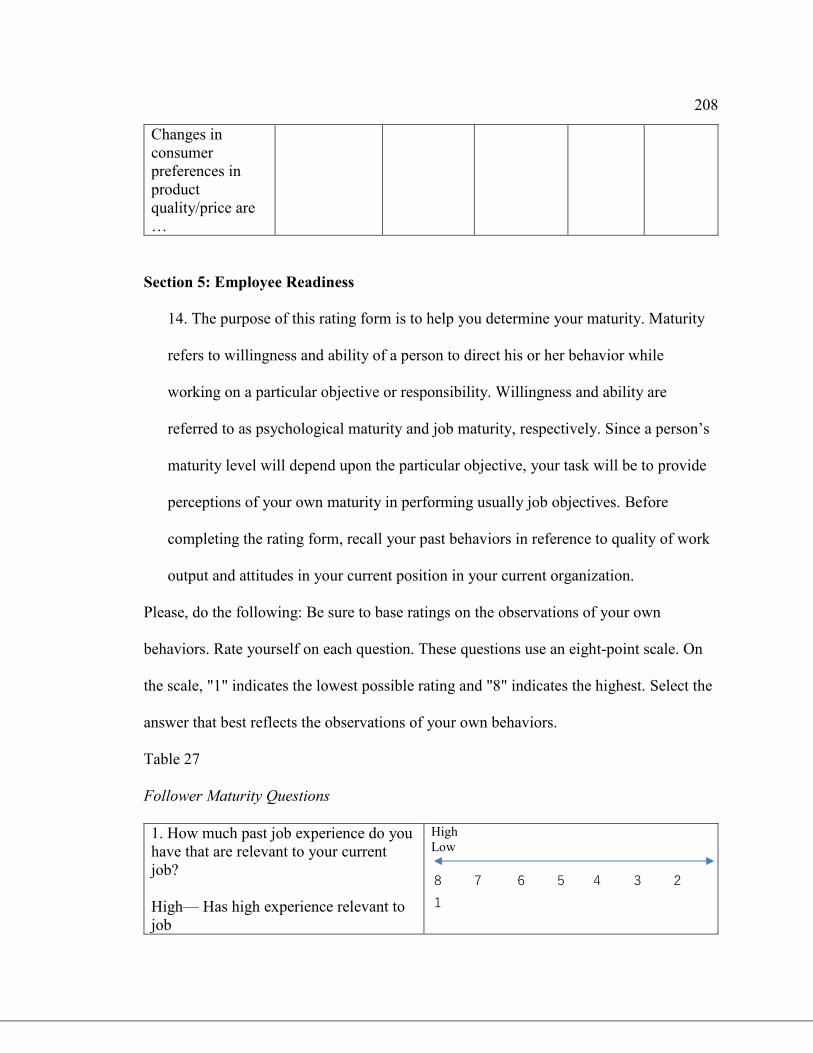
208
Changes in
consumer
preferences in
product
quality/price are
…
Section 5: Employee Readiness
14. The purpose of this rating form is to help you determine your maturity. Maturity
refers to willingness and ability of a person to direct his or her behavior while
working on a particular objective or responsibility. Willingness and ability are
referred to as psychological maturity and job maturity, respectively. Since a person’s
maturity level will depend upon the particular objective, your task will be to provide
perceptions of your own maturity in performing usually job objectives. Before
completing the rating form, recall your past behaviors in reference to quality of work
output and attitudes in your current position in your current organization.
Please, do the following: Be sure to base ratings on the observations of your own
behaviors. Rate yourself on each question. These questions use an eight-point scale. On
the scale, "1" indicates the lowest possible rating and "8" indicates the highest. Select the
answer that best reflects the observations of your own behaviors.
Table 27
Follower Maturity Questions
1. How much past job experience do you
have that are relevant to your current
job?
High— Has high experience relevant to
job
High
Low
8 7 6 5 4 3 2
1
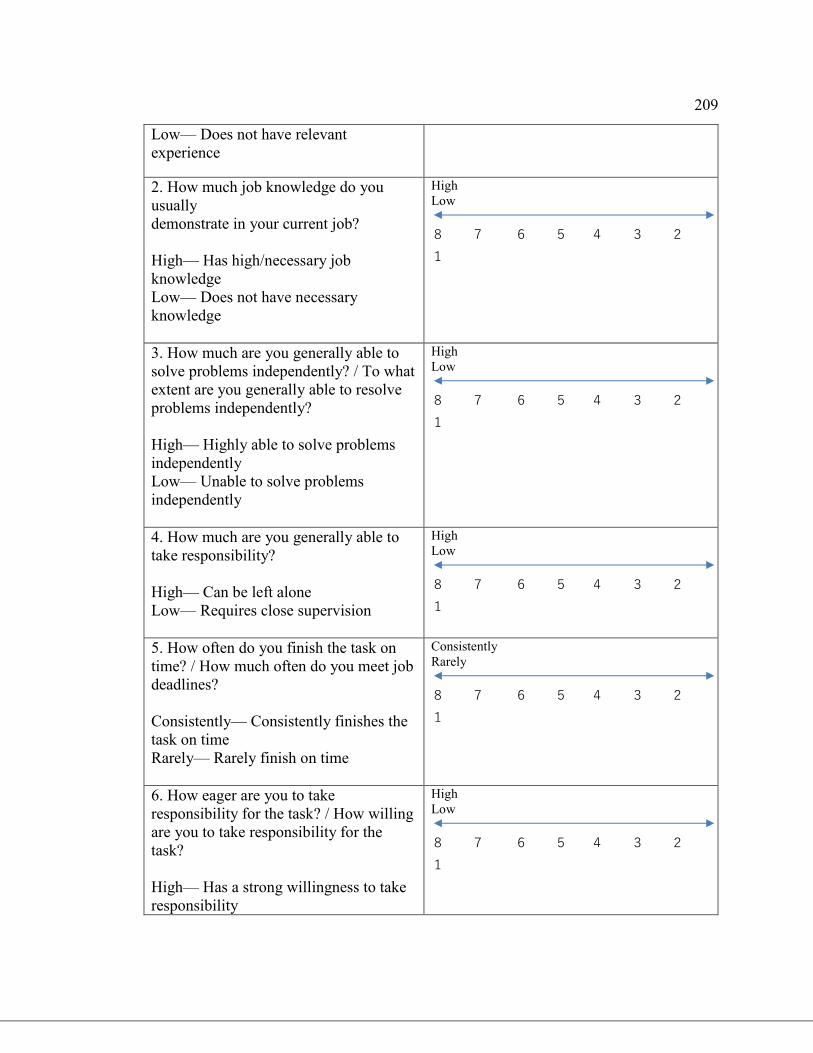
209
Low— Does not have relevant
experience
2. How much job knowledge do you
usually
demonstrate in your current job?
High— Has high/necessary job
knowledge
Low— Does not have necessary
knowledge
High
Low
8 7 6 5 4 3 2
1
3. How much are you generally able to
solve problems independently? / To what
extent are you generally able to resolve
problems independently?
High— Highly able to solve problems
independently
Low— Unable to solve problems
independently
High
Low
8 7 6 5 4 3 2
1
4. How much are you generally able to
take responsibility?
High— Can be left alone
Low— Requires close supervision
High
Low
8 7 6 5 4 3 2
1
5. How often do you finish the task on
time? / How much often do you meet job
deadlines?
Consistently— Consistently finishes the
task on time
Rarely— Rarely finish on time
Consistently
Rarely
8 7 6 5 4 3 2
1
6. How eager are you to take
responsibility for the task? / How willing
are you to take responsibility for the
task?
High— Has a strong willingness to take
responsibility
High
Low
8 7 6 5 4 3 2
1
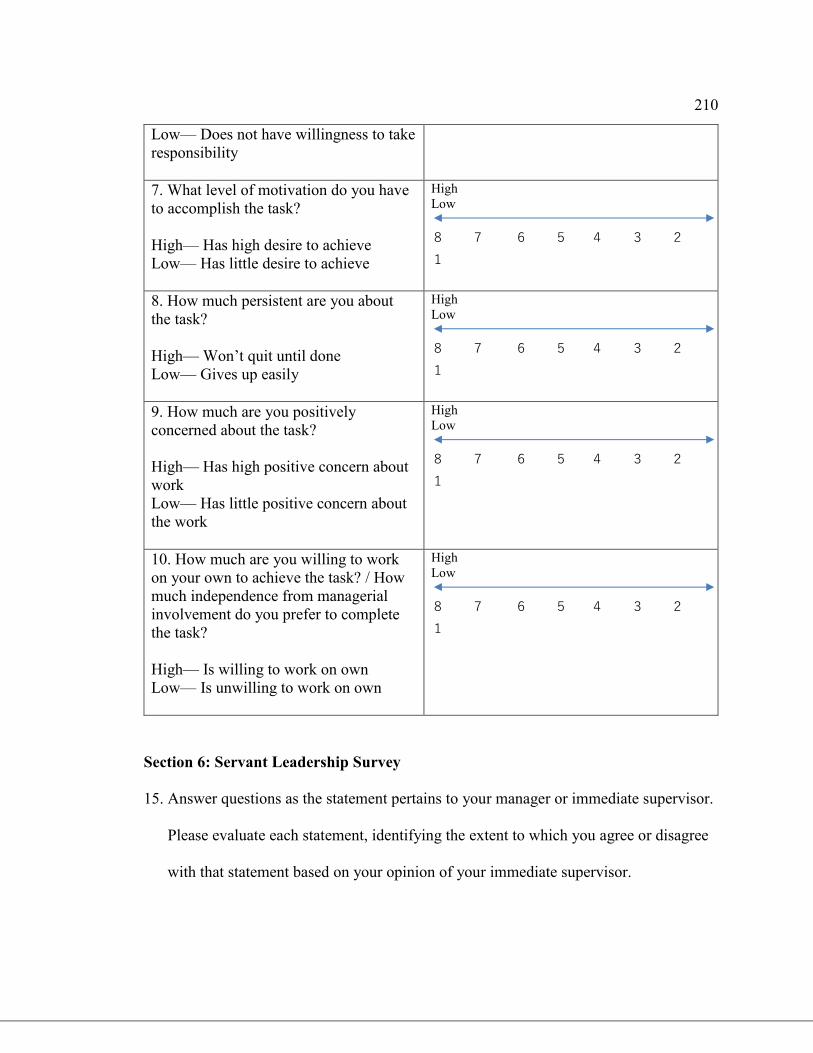
210
Low— Does not have willingness to take
responsibility
7. What level of motivation do you have
to accomplish the task?
High— Has high desire to achieve
Low— Has little desire to achieve
High
Low
8 7 6 5 4 3 2
1
8. How much persistent are you about
the task?
High— Won’t quit until done
Low— Gives up easily
High
Low
8 7 6 5 4 3 2
1
9. How much are you positively
concerned about the task?
High— Has high positive concern about
work
Low— Has little positive concern about
the work
High
Low
8 7 6 5 4 3 2
1
10. How much are you willing to work
on your own to achieve the task? / How
much independence from managerial
involvement do you prefer to complete
the task?
High— Is willing to work on own
Low— Is unwilling to work on own
High
Low
8 7 6 5 4 3 2
1
Section 6: Servant Leadership Survey
15. Answer questions as the statement pertains to your manager or immediate supervisor.
Please evaluate each statement, identifying the extent to which you agree or disagree
with that statement based on your opinion of your immediate supervisor.
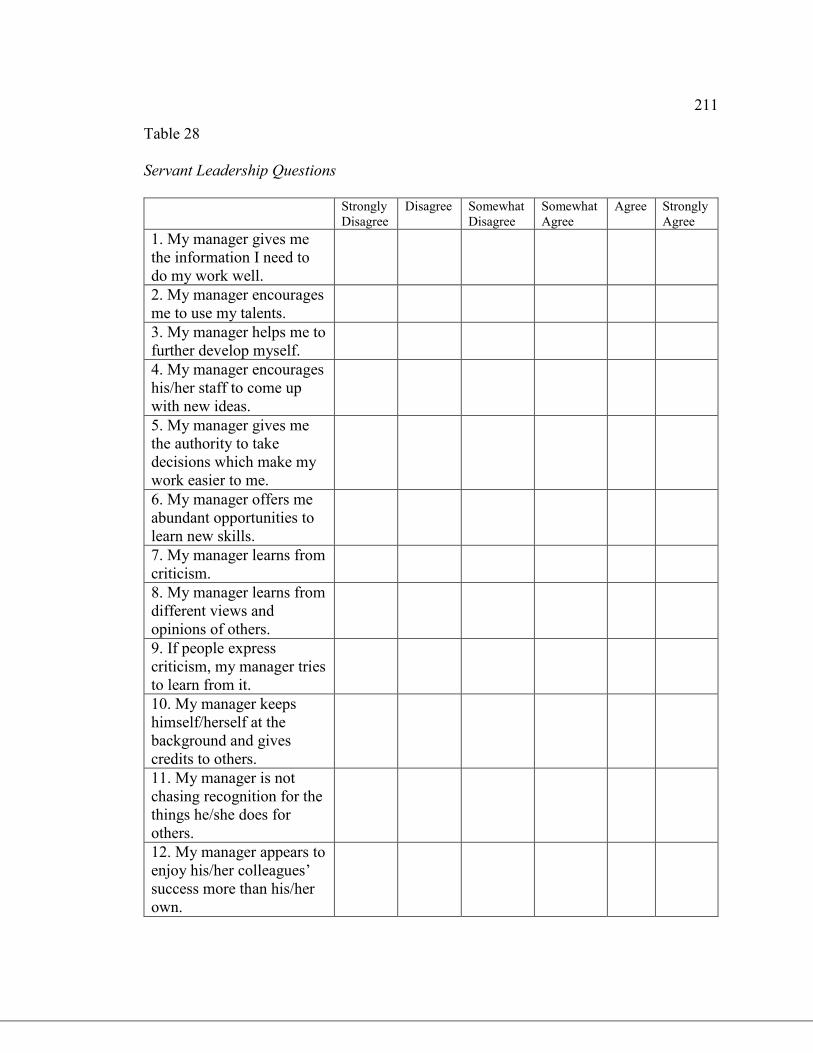
211
Table 28
Servant Leadership Questions
Strongly
Disagree Disagree Somewhat
Disagree Somewhat
Agree Agree Strongly
Agree
1. My manager gives me
the information I need to
do my work well.
2. My manager encourages
me to use my talents.
3. My manager helps me to
further develop myself.
4. My manager encourages
his/her staff to come up
with new ideas.
5. My manager gives me
the authority to take
decisions which make my
work easier to me.
6. My manager offers me
abundant opportunities to
learn new skills.
7. My manager learns from
criticism.
8. My manager learns from
different views and
opinions of others.
9. If people express
criticism, my manager tries
to learn from it.
10. My manager keeps
himself/herself at the
background and gives
credits to others.
11. My manager is not
chasing recognition for the
things he/she does for
others.
12. My manager appears to
enjoy his/her colleagues’
success more than his/her
own.
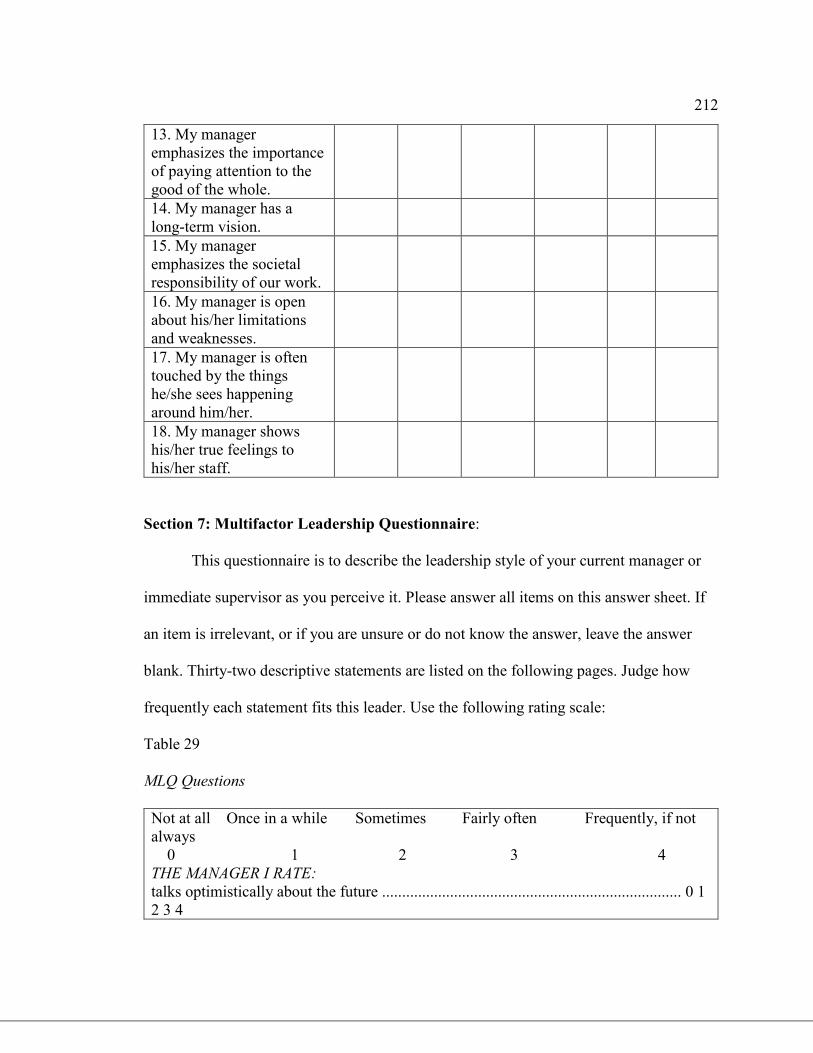
212
13. My manager
emphasizes the importance
of paying attention to the
good of the whole.
14. My manager has a
long-term vision.
15. My manager
emphasizes the societal
responsibility of our work.
16. My manager is open
about his/her limitations
and weaknesses.
17. My manager is often
touched by the things
he/she sees happening
around him/her.
18. My manager shows
his/her true feelings to
his/her staff.
Section 7: Multifactor Leadership Questionnaire:
This questionnaire is to describe the leadership style of your current manager or
immediate supervisor as you perceive it. Please answer all items on this answer sheet. If
an item is irrelevant, or if you are unsure or do not know the answer, leave the answer
blank. Thirty-two descriptive statements are listed on the following pages. Judge how
frequently each statement fits this leader. Use the following rating scale:
Table 29
MLQ Questions
Not at all Once in a while Sometimes Fairly often Frequently, if not
always
0 1 2 3 4
THE MANAGER I RATE:
talks optimistically about the future ........................................................................... 0 1
2 3 4
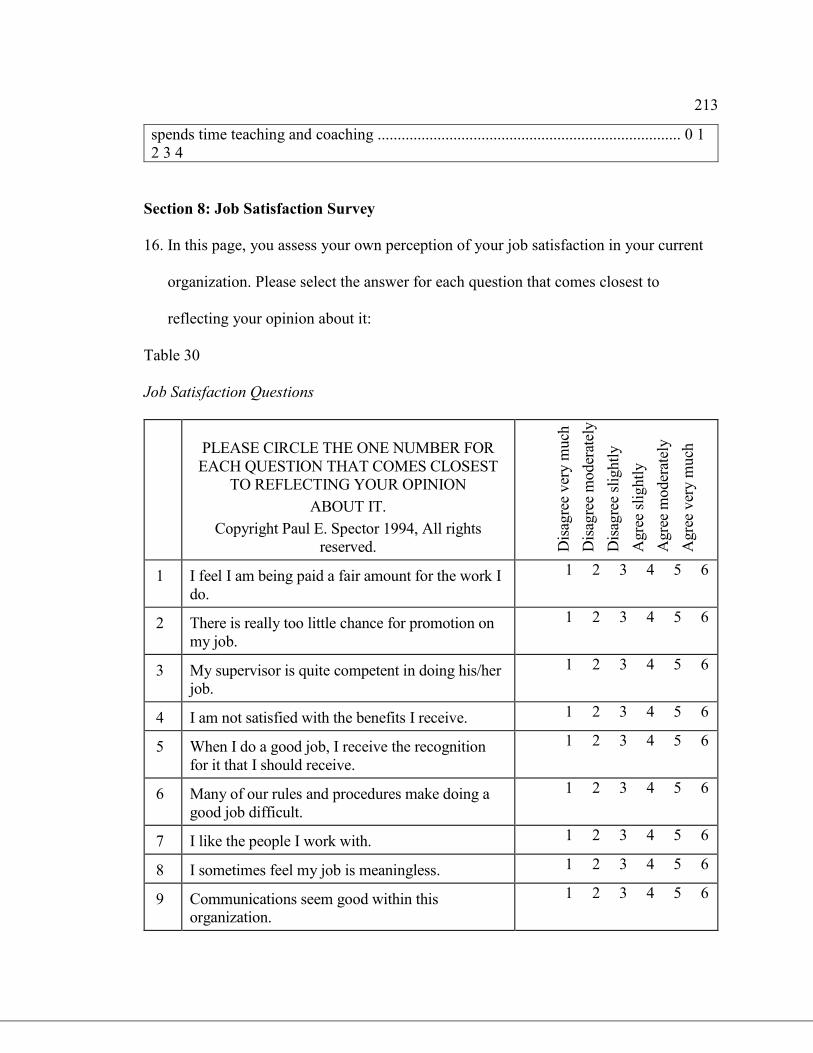
213
spends time teaching and coaching ............................................................................ 0 1
2 3 4
Section 8: Job Satisfaction Survey
16. In this page, you assess your own perception of your job satisfaction in your current
organization. Please select the answer for each question that comes closest to
reflecting your opinion about it:
Table 30
Job Satisfaction Questions
PLEASE CIRCLE THE ONE NUMBER FOR
EACH QUESTION THAT COMES CLOSEST
TO REFLECTING YOUR OPINION
ABOUT IT.
Copyright Paul E. Spector 1994, All rights
reserved.
Dis
agre
e ver
y m
uch
Dis
agre
e m
oder
atel
y
Dis
agre
e sl
ightl
y
Agre
e sl
ightl
y
Agre
e m
oder
atel
y
Agre
e ver
y m
uch
1 I feel I am being paid a fair amount for the work I
do.
1 2 3 4 5 6
2 There is really too little chance for promotion on
my job.
1 2 3 4 5 6
3 My supervisor is quite competent in doing his/her
job.
1 2 3 4 5 6
4 I am not satisfied with the benefits I receive. 1 2 3 4 5 6
5 When I do a good job, I receive the recognition
for it that I should receive.
1 2 3 4 5 6
6 Many of our rules and procedures make doing a
good job difficult.
1 2 3 4 5 6
7 I like the people I work with. 1 2 3 4 5 6
8 I sometimes feel my job is meaningless. 1 2 3 4 5 6
9 Communications seem good within this
organization.
1 2 3 4 5 6
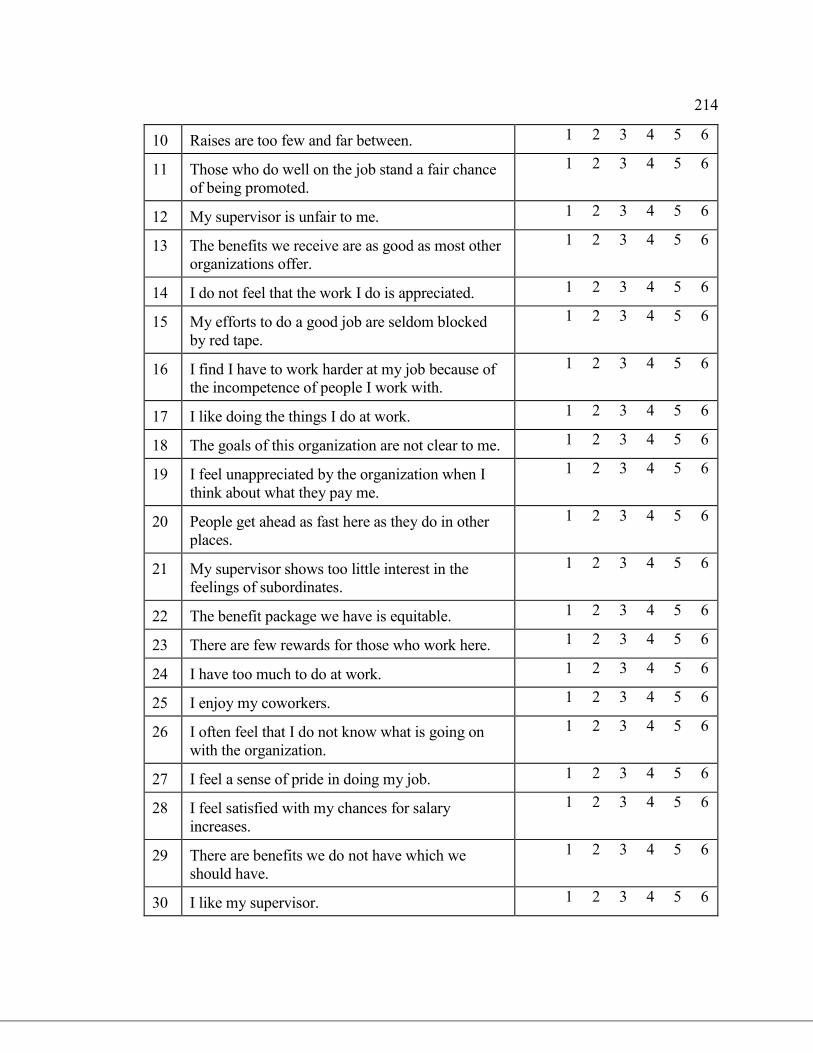
214
10 Raises are too few and far between. 1 2 3 4 5 6
11 Those who do well on the job stand a fair chance
of being promoted.
1 2 3 4 5 6
12 My supervisor is unfair to me. 1 2 3 4 5 6
13 The benefits we receive are as good as most other
organizations offer.
1 2 3 4 5 6
14 I do not feel that the work I do is appreciated. 1 2 3 4 5 6
15 My efforts to do a good job are seldom blocked
by red tape.
1 2 3 4 5 6
16 I find I have to work harder at my job because of
the incompetence of people I work with.
1 2 3 4 5 6
17 I like doing the things I do at work. 1 2 3 4 5 6
18 The goals of this organization are not clear to me. 1 2 3 4 5 6
19 I feel unappreciated by the organization when I
think about what they pay me.
1 2 3 4 5 6
20 People get ahead as fast here as they do in other
places.
1 2 3 4 5 6
21 My supervisor shows too little interest in the
feelings of subordinates.
1 2 3 4 5 6
22 The benefit package we have is equitable. 1 2 3 4 5 6
23 There are few rewards for those who work here. 1 2 3 4 5 6
24 I have too much to do at work. 1 2 3 4 5 6
25 I enjoy my coworkers. 1 2 3 4 5 6
26 I often feel that I do not know what is going on
with the organization.
1 2 3 4 5 6
27 I feel a sense of pride in doing my job. 1 2 3 4 5 6
28 I feel satisfied with my chances for salary
increases.
1 2 3 4 5 6
29 There are benefits we do not have which we
should have.
1 2 3 4 5 6
30 I like my supervisor. 1 2 3 4 5 6

215
31 I have too much paperwork. 1 2 3 4 5 6
32 I don’t feel my efforts are rewarded the way they
should be.
1 2 3 4 5 6
33 I am satisfied with my chances for promotion. 1 2 3 4 5 6
34 There is too much bickering and fighting at work. 1 2 3 4 5 6
35 My job is enjoyable. 1 2 3 4 5 6
36 Work assignments are not fully explained. 1 2 3 4 5 6
216
Appendix B: Permission to use MLQ 5X Short
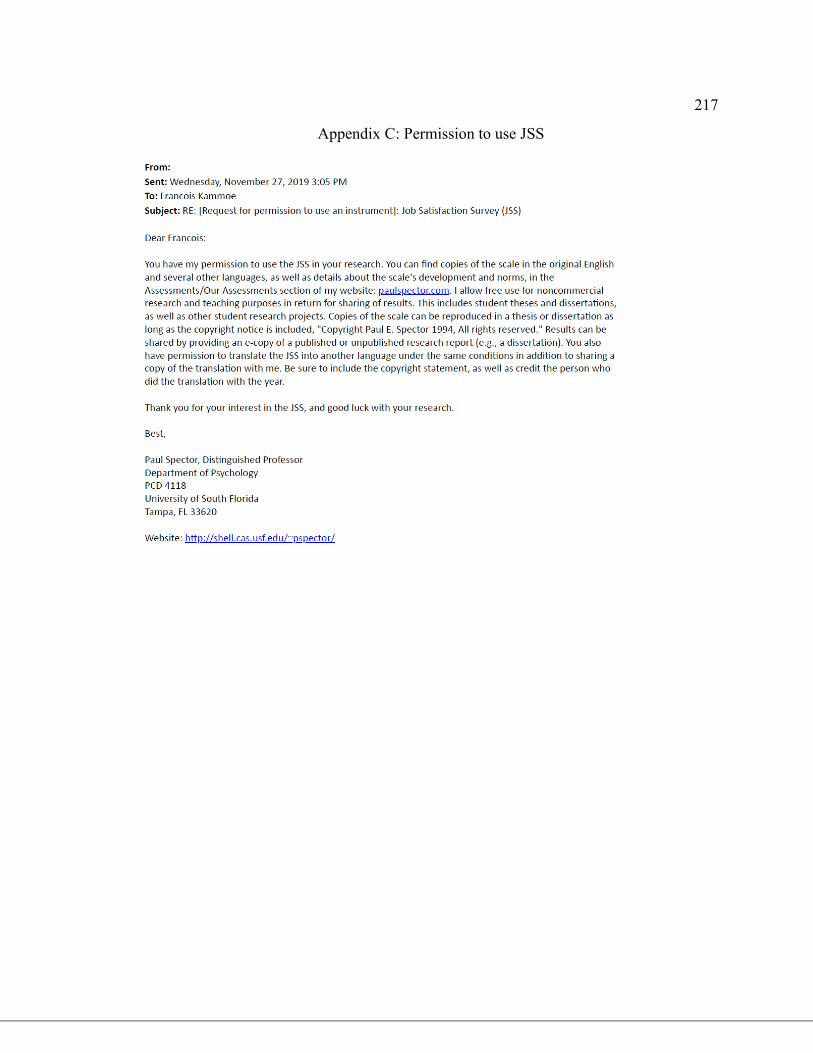
217
Appendix C: Permission to use JSS
218
Appendix D: Permission to use Environmental dynamism scale
219
Appendix E: Permission to use SLS
220
Appendix F: Recruitment invitation for my referral friends through LinkedIn and
Facebook (WhatsApp)
221
Appendix G: Recruitment post invitation for survey participants contacted by my referral
friends on their Social media channels such as Facebook (WhatsApp) or LinkedIn