Ex-Post Evaluation of The URBAN Community Initiative 2001 ...
139
EN Evaluation report June 2010 Ex-Post Evaluation of Cohesion Policy programmes 2000-06: The URBAN Community Initiative
-
Upload
khangminh22 -
Category
Documents
-
view
2 -
download
0
Transcript of Ex-Post Evaluation of The URBAN Community Initiative 2001 ...

EN
Evaluation report June 2010
Ex-Post Evaluation of Cohesion Policy programmes 2000-06:
The URBAN Community Initiative

Ex-Post Evaluation of The URBAN Community Initiative 2001-2006
Final Report prepared for the European Commission

Contents
Executive Summary................................................................................. i
1.0 Introduction............................................................................................. 9 1.1 The evaluation ............................................................................................................9 1.2 Aims of the evaluation ...............................................................................................9 1.3 Methodology and approach.....................................................................................11 1.4 Structure of the Final Report...................................................................................20
2.0 Background and Characteristics of URBAN II ................................... 21 2.1 Introduction ..............................................................................................................21 2.2 Summary of Key Points ...........................................................................................21 2.3 Origins of the URBAN II Community Initiative .......................................................22 2.4 Overview of URBAN II ..............................................................................................22 2.5 Selection of URBAN II areas....................................................................................25 2.6 Main challenges facing URBAN II areas.................................................................29 2.6.1 Physical challenges....................................................................................................29 2.6.2 Economic challenges .................................................................................................30 2.6.3 Social challenges .......................................................................................................31 2.7 Strategies deployed by URBAN II programmes.....................................................32 2.7.1 Types of strategy by patterns of fund allocation .........................................................32 2.7.2 Working across themes..............................................................................................34 2.7.3 Alignment with Objective 1 and 2 programmes ..........................................................35 2.7.4 Strategic approaches at project level .........................................................................35 2.7.5 Reasons behind different strategies ...........................................................................36 2.7.6 Continuity of strategic approaches .............................................................................37 2.8 Conclusions – URBAN II programme characteristics and strategies..................38
3.0 Review of Outputs, Results and Impacts of URBAN II ...................... 40 3.1 Introduction ..............................................................................................................40 3.2 Summary of key findings.........................................................................................40 3.3 Changes within the programme areas ...................................................................41 3.4 Drivers of change .....................................................................................................51 3.5 Programme logic: challenges and strategies ........................................................52 3.5.1 Did programmes follow a logical process? .................................................................53 3.5.2 Did the strategies match the challenges?...................................................................59 3.6 Use of programme indicators..................................................................................60 3.6.1 The collection of indicators .........................................................................................60

3.6.2 Comparisons between actual and target values.........................................................62 3.6.3 Factors affecting the relationship between actual and target values ..........................65 3.7 Outputs, results and impacts ..................................................................................66 3.7.1 Physical theme...........................................................................................................66 3.7.2 Economic theme.........................................................................................................72 3.7.3 Social theme...............................................................................................................77 3.8 Wider benefits of URBAN II .....................................................................................82 3.9 Factors underlying programme success or failure ...............................................86 3.10 Conclusions – the outputs, results and impacts of URBAN II..............................91
4.0 Delivery Structures of URBAN II ......................................................... 93 4.1 Introduction ..............................................................................................................93 4.2 Summary of key points............................................................................................93 4.3 Management arrangements.....................................................................................94 4.4 Linkages between URBAN II and wider policy and practice.................................96 4.5 Administrative costs ................................................................................................98 4.6 Delivery of projects funded by URBAN II ...............................................................98 4.7 Local partnerships in URBAN II ..............................................................................99 4.7.1 The strength of partnership working ...........................................................................99 4.7.2 Approaches to URBAN II partnerships .....................................................................100 4.7.3 Involvement of private and voluntary sector partners ...............................................102 4.8 Capacity building of partners................................................................................103 4.9 Analysis by typology .............................................................................................104 4.10 Involvement of local communities........................................................................105 4.11 Sustainability of URBAN II programme legacies .................................................106 4.11.1 Sustainability of programme activities ......................................................................106 4.11.2 Sustainability of impacts...........................................................................................106 4.11.3 Success factors and barriers ....................................................................................107 4.12 Conclusions – the delivery of URBAN II...............................................................108
5.0 The Evaluation of URBACT I.............................................................. 111 5.1 Introduction ............................................................................................................111 5.2 Summary of key points..........................................................................................111 5.3 Background and objectives of URBACT ..............................................................112 5.4 What outputs has URBACT achieved?.................................................................113 5.5 Who participated in URBACT?..............................................................................115 5.6 What results and impacts did URBACT 1 generate? ..........................................116 5.6.1 Identifying and recording practice.............................................................................117 5.6.2 Results: exchanging and ‘capitalising’......................................................................118 5.6.3 Impacts: absorbing and applying lessons learned....................................................119 5.7 URBACT and other networks ................................................................................121

5.8 Conclusions and lessons learnt ...........................................................................121
6.0 Conclusions and Lessons ................................................................. 124 6.1 Introduction ............................................................................................................124 6.2 Conclusions............................................................................................................124 6.2.1 Did URBAN II areas improve?..................................................................................124 6.2.2 Were improvements to urban areas driven by URBAN II programmes? ..................125 6.2.3 What difference did URBAN II make? ......................................................................126 6.2.4 Critical success factors.............................................................................................128 6.2.5 The sustainability of URBAN II .................................................................................129 6.2.6 The assessment of URBACT I .................................................................................130 6.3 The policy and delivery lessons from URBAN II..................................................130 6.3.1 Programme development and delivery requires strong and inclusive
partnerships..............................................................................................................131 6.3.2 The area based local approach ................................................................................131 6.3.3 Method is as important as funding............................................................................131 6.3.4 Programmes need guidance ....................................................................................131
List of figures Figure 1.1 Methodology and approach......................................................................11 Figure 1.2 Map of the 15 case study locations ..........................................................19 Figure 3.1 Average number of indicators per programme (by Member State) ..........62 List of tables Table 1.1 Evaluation questions for the review of 70 URBAN II programmes ............10 Table 1.2 Evaluation questions for the 15 URBAN II case studies ............................10 Table 1.3 URBACT I evaluation questions ................................................................11 Table 1.4 Comparisons between total population and case study selection .............13 Table 1.5 The case studies .......................................................................................14 Table 2.1 Overview of URBAN II programmes by Member State..............................24 Table 2.2 General characteristics of URBAN II areas ...............................................25 Table 2.3 Reasons for choosing URBAN II areas .....................................................27 Table 2.4 Selection process used by Member States ...............................................28 Table 2.5 National unemployment rates....................................................................30 Table 2.6 Thematic emphasis of URBAN II allocation at country level (% of ERDF allocated to each theme) .................................................................................33 Table 2.7 Key characteristics of projects funded through URBAN II under the three main themes......................................................................................................36 Table 3.1 Changes and drivers in URBAN II programme areas ................................42

Table 3.2 Unemployment for URBAN II programme areas compared to host cities ...........................................................................................................................48 Table 3.3 Programme logic across case study areas................................................53 Table 3.4 Reporting indicator data (from the 2006 Annual Implementation Reports for the 70 URBAN II programmes)................................................................60 Table 3.5 Average achievement ratio: outputs, results and impacts (% actual values per programme against targets, minimum, maximum and average values)........................................................................................................................62 Table 3.6 Outputs, results and impacts in the physical theme...................................68 Table 3.7 Outputs, results and impacts in the economic theme ................................74 Table 3.8 Outputs, impact and results for the social theme.......................................79 Table 3.9 Critical Success Factors ............................................................................87 Table 4.1 Delivery of URBAN II projects by organisational type................................98 Table 4.2 Composition of URBAN II programme partnerships ................................100 Table 4.3 Typology analysis for partnership inclusiveness......................................104 Table 5.1 URBACT I outputs ...................................................................................114 Table 6.1 Summary Headlines – Key URBAN II Outputs ........................................127

i
Executive Summary
1. The Evaluation
The report forms part of the ex-post evaluation of Cohesion Policy Programmes 2000-2006 and covers the URBAN II Community Initiative (2001-2006) and URBACT I Programme (2003-2006). The evaluation methodology was as follows:
• A desk review of all 70 URBAN II programmes combined with discussions with programme managers.
• A review of key statistics and trends over the programme period.
• A counterfactual analysis based on comparisons of changes in unemployment over the programme period and between the programme areas and the cities, within which the areas were situated. A lack of data meant that the counterfactual failed to produce results that met the tests of statistical validity, but the work of the evaluation demonstrated its value as a tool for measuring impact, if embedded at the start of the programme period.
• Detailed case studies on the ground for fifteen URBAN II programmes and ten 'good practice' projects. The case studies were rigorously selected to be representative of all the programmes. More than 120 stakeholders (including local and regional authorities, community organisations and businesses, and academics) were interviewed as part of the process.
• A review of URBACT I documentation and interviews with key stakeholders.
• Inputs to the evaluation team from three leading experts: Professor Michael Parkinson; Professor Jan Lambooy and Professor Alberto Martini, who provided a critical filter at the three key reporting stages of the evaluation - the inception, interim and final reports.
2. The URBAN Community Initiative
URBAN II (2001-2006) followed previous urban interventions, the Urban Pilot Projects (1989-99) and URBAN I (1994-1999) supported through the European Regional Development Fund (ERDF), one of the EU Structural Funds. Some €754 million of EU funding was committed to 70 programmes across fourteen Member States, covering a combined population of 2.2 million, which with match funding rose to €1.6 billion. 45 programmes augmented Objective 1 or 2 funding in their cities but some programmes were selected by their Member States to spread resources to urban areas not eligible, and not in receipt of support from the Structural Funds. URBACT I (2003-2006) had a separate budget under the URBAN Community Initiative (€18.03 million EU funding, €28.2 million including match funding).
The aim of URBAN II was to develop innovative and integrated approaches to regenerating neighbourhoods in crisis and promoting sustainable urban development. The relatively low levels of spend (an average of €10.7m per programme) and the fixed term period for programmes meant that in most cases URBAN II could not - and was not intended to - eradicate the deep rooted problems prevalent in parts of many European cities. However, the expectation was that URBAN II would contribute to positive improvements and would develop a legacy of longer term change, whereby public and private agencies, together with local communities would work together to create sustainable neighbourhoods in their cities. There was a strong emphasis on fostering local ownership of the challenges and policy

ii
solutions, with encouragement for partnership working to develop and deliver effective programmes. This 'bottom up' approach resulted in a wide diversity of programmes and projects, although programmes generally fell into two broad categories, the first focused on physical regeneration (land and building, transport and the environment) with smaller economic and social measures fitting within this framework, the second more balanced across economic, social and physical themes. This distinction should not be over emphasised however, since the case studies showed that most programmes did indeed have an integrated approach to the economic, social and physical challenges facing their area – only the relative spending figures changed.
URBAN II supported some genuinely innovative and high quality projects. Not all projects worked and some were delayed, but from the case study work we conclude that the majority of projects achieved what they set out to do.
The main aim of URBACT I was to identify good practice and promote an exchange of experience derived from urban projects, including those funded under URBAN II. However, it was not approved until 2002 and did not become operational until 2003 and was therefore not embedded as part of the strategies and processes adopted by URBAN II programmes. It supported thematic networks that proved to be more popular than anticipated (20 were supported, against an anticipated 10-12) and involved 248 cities and more than 4,000 individuals. URBACT I also supported the development of information tools, studies, training, working groups and the deployment of experts to promote an exchange of experience. A second round of URBACT activities (URBACT II) is ongoing but was not part of this evaluation.
3. The Impact of the URBAN II Community Initiative
Overall, URBAN II made a positive contribution to tackling the challenges of neighbourhoods in crisis. In particular.
There are a set of measurable outputs that can be aggregated across the 70 programmes
Despite the diversity of programmes and programme outputs it was possible to aggregate the frequently mentioned output categories from the monitoring reports submitted by the programmes. The headlines are set out in Figure 1 and show the volume of outputs in respect of the re-use of spaces and buildings, transport infrastructure, training projects and community facilities, green space and environmental projects, business support projects, health and care interventions. There is less programme data on results, and even less on impacts. For example, there were relatively few surveys to measure increased usage or appreciation of facilities supported by the programmes, although where surveys were undertaken positive changes were normally observed.
There is qualitative evidence of impacts within the programme areas
The case studies highlighted impacts that are not readily measurable (or in some cases not measured) resulting from URBAN II. There was evidence of:

iii
• Perceptions of an improved local image in some programme areas, normally via visible physical regeneration projects. This has been a key to attracting new residents and businesses, and new investment.
• More activity in commercial quarters of programmes areas with more visitors, more cafés and other facilities creating a more vibrant environment, which could lead to increased trade and business confidence, and the sustainability of these areas.
• Improvements to the social cohesiveness of some neighbourhoods with projects targeted to support migrants and minority groups. Often these projects have strengthened local representative organisations.
• An improved quality of life in urban areas including reduced pollution and congestion, as well as perceptions of safer neighbourhoods.
Figure 1 - Key URBAN II Outputs
Under the physical theme the key outputs were:
372 restoration projects
2.3 Million m2 of converted public space plus a further 557,115 m2 of space developed for social, sports, education and health uses
3.2 Million m2 of new green space
80 Kilometres of cycle and footpaths plus 11,614 m2 of renovated surfaces for cyclists and pedestrians
10,712 m2 of new water collectors designed to reduce energy consumption
194 environmental equipment projects to recover liquid and toxic waste
Under the social theme the key outputs were:
982 training projects with 64,801 training places for individuals
246 security projects tackling crime and fear of crime
593 community capacity building initiatives
16 employment centres and 22 health and community centres
162 drug advice interventions
949 cultural events projects
443 childcare places
Under the economic theme the key outputs were:
5,984 business support and advisory interventions
43,004 training places for businesses
23 commercial centres and stores renewed

iv
7 innovation projects and 20 business incubator units
43,942 m2 of new commercial floorspace
7 ICT projects and services
Source: ECOTEC Analysis of URBAN II programme data
The socio-economic conditions in most programme areas have stabilised or improved
The socio-economic conditions of most URBAN II programme areas stabilised and in some cases improved during the programme period. There is evidence of positive change or stable conditions in 13 of the 15 case programme areas. In terms of quantification, unemployment is the key measure as other statistical evidence is patchy. For those areas where data were available and unemployment rates were more than 2% higher than the city average (20 programmes), there was a reduction in this gap in 10 cases (with a high of a 7.6% decrease – a narrowing of the gap between the city and programme area unemployment rates), an increase in 9 cases (with a high of a 4.7% increase – a widening of the gap) and no change in one case. Overall, the evidence showed that unemployment rates in the programme areas had stabilised between 2000 and 2006 in common with the EU average for that period, but arguably a greater achievement in the neighbourhoods that constituted the URBAN II programme areas where unemployment was often high and jobs (or access to nearby employment) difficult to secure. In addition most stakeholders perceived the areas as being in a stable or improved condition, whilst visual evidence of change (e.g. the re-use of redundant land and buildings) was evident from the case study visits.
URBAN II contributed to positive change within programme areas
URBAN II contributed to change but was one of a number of policy 'drivers' and often not the most important driver. Regional and national economic factors shaped the labour market and the health of the business community whilst the plans and programmes, including mainstream programmes, delivered at the city and regional level, were key to bringing about more fundamental change in respect of health, educational and skills attainment, crime levels and environmental conditions. This can in part be attributed to the small scale of URBAN II programmes. In addition, some issues are most appropriately tackled at the neighbourhood level, but others are more effectively delivered at a larger spatial area such as the city or the region. This is particularly true for economic policies (changing the business base) or the provision of major infrastructure that impact significantly on economic performance. The dovetailing of local actions in the programme areas with wider city and regional plans, resulting in an integrated approach to urban development was realised in some cases, enhancing the effectiveness and impact of URBAN II resources.
There is evidence of sustainability of many elements of the URBAN II programmes
URBAN II was deliberately time limited and many of the formal structures that were set up to manage programmes have now gone. Several projects have finished, having achieved their goals, but others (about 60%) have continued in some form, where they needed to, under new funding and delivery

v
regimes. In some cases local communities have successfully taken on projects that originated out of URBAN II, reflecting a commitment by local organisations to the ongoing regeneration of their areas.
The URBAN II 'method' has provided an important legacy for tackling the challenges of neighbourhoods in crisis
A significant impact of URBAN II has been the stimulation of new partnerships and ways of working within the programme areas. There is evidence from the case studies of new integrated, multi-agency approaches, with a strong level of involvement from community organisations and the private sector. In the best examples URBAN II has embedded new approaches that have a lasting legacy after the EU funding ceased, giving neighbourhoods in crisis the tools – and the confidence – to tackle and reverse urban decline in the longer term. URBAN II has also had a legacy in respect of individual and institutional knowledge, some of which has been put to effect in other neighbourhoods or in mainstream programmes.
4. Critical Success Factors
Whilst the challenges experienced in the programmes areas, and the strategies and projects that were employed, varied between the programmes, there were some common critical success factors that have helped to enhance the impact of URBAN II, and which provide generic lessons for future urban policies. Some of the lessons pose particular challenges for policy development in the new Member States, where programme integration, local 'bottom up approaches' and inclusive partnership working are generally not common place.
The importance of local ownership and inclusive partnerships
The key success factor in URBAN II projects was local involvement and ownership. This applied whatever the nature of the project and whether it was drawn from the field of physical, social or economic regeneration. Projects were most successful when they responded to local perceptions of need and had the active support of a broad range of local partners, not just the local authority, but also the private and voluntary sector, and local residents.
The partnership approach to the delivery of programmes was one of the defining characteristics of URBAN II. Some partnerships existed before 2001, some were a direct response to the availability of EU funding and some have continued - in some form - carrying on the work of the programmes after URBAN II.
Local authorities were usually the 'glue' holding these partnerships together. They took the lead in 80% of URBAN II programmes, providing staffing, processes, information and intelligence and project ideas. Successful programmes also relied on broadly based local partnerships with representatives from the public, private and voluntary sectors, often informal as the formal representation of the private and voluntary sectors in partnership working was not strong in many programmes.
In particular partnerships worked best when:
• All partners were in a position to play an effective role in decision making. Capacity building, especially for the voluntary sector and community organisations is important, but also for other

vi
organisations. This often included the need for specific training and experience in aspects of programme management (e.g. knowledge of legal and financial structures).
• Focused on local issues that partners felt they could influence, through collective working. Often these issues provided a common platform that would bring together interests from all sectors (e.g. in one example, the problems created by traffic congestion in an historic city centre, mobilised partners from the public, private and voluntary sectors).
• The management and delivery of projects was spread across a range of partners, providing experience and direct involvement in the delivery programme as an effective way of engaging local partners. This was often a good way of involving community organisations, although some required support from the public agencies. It also helped to boost the programme management and delivery capacity, which was often weak at the start of the programme period.
Supporting partnerships
URBAN II partnerships sometimes struggled to gain support from their cities and regions, and to engage key stakeholders and decision makers at that level. This was largely because of the small scale and local focus of the programmes, and as such they were 'off the radar' of city and regional policy makers. However, many local partnerships could have gained from more active support from their cities and regional agencies in respect of:
• Helping to embed the programmes into a wider spatial policy framework, generally necessary for effecting change in respect of key economic and social indicators (such as reducing unemployment or changing the business base).
• Providing skills and learning experiences for programme managers and their teams, many of whom had limited experience of managing urban programmes.
• Providing support in the development and delivery of effective monitoring and evaluation systems which track progress against key indicators – a key management and accountability requirement. This was lacking in many programme areas but experience varied significantly.
• Providing support on strategy development and longer term planning. Most programmes were poor in respect of developing exit strategies, although regeneration has continued in most programme areas.
Integration and synergies
In many cases the impact of URBAN II resources has been increased, within the programme areas, through the integration of the strategies and resources with other urban development programmes. We found high levels of programme integration in the great majority of programmes. Integration improved the impact of URBAN II in different ways and worked at different levels, namely:
• The integration of the strategy and programmes (such as the joint development of URBAN II and mainstream Structural Funds programmes in some cities, the flexibility of URBAN complementing and adding value to main programmes). The integration of programmes can help to lever in additional funding, including mainstream programmes, but also has the potential to link local neighbourhood
vii
specific actions with city and regional policies. This can improve the overall impact (e.g. in URBAN II there were examples of local employment initiatives targeting hard to reach and disadvantaged groups such as migrant workers, linked into policies that were more effective at a larger spatial level to increase the number of employment opportunities).
• Synergies between URBAN II funded projects (for example, the reuse of buildings to serve community needs which were then physically linked to those communities through improved transport infrastructure). This works best when the links are intentional - rather than accidental - and built into the design of the programme and specific projects.
• The integration of delivery teams (management teams drawn from different local authority departments and local organisations). There are potential benefits in terms of efficiency savings and also the opportunity to raise the profile of the programmes with a wider group of stakeholders. However, integrating delivery teams is also likely to bring together a wider range of participants and interests that stretch beyond the programme area and it is important though to ensure that the local ownership - that was a significant contributor to the success of URBAN II - is not lost or diminished within a management structure that is not just focused on the programme area, and has additional priorities.
Sharing experience
The timing of URBACT I meant that it was less supportive of URBAN II programmes than originally envisaged. The experiences of URBACT I though illustrate the value of sharing ideas and approaches between cities, ideally also between Member States (some URBAN II programmes participate in alternative national networks, missing the benefits of international networks). Effective networking requires a significant time and resources commitment from partners and the main lessons for the future are:
• As much as possible of the sharing of experience should be done through active participation in networks, ideally face-to-face, working with colleagues from other cities, but experiencing similar challenges. The exchange of experiences through written materials and the internet was less effective in URBACT I. This assumes that networking events have clear objectives and are managed effectively, which was not always the experience in URBACT I.
• Ensuring that those participating in networking activity can do so effectively by having the necessary language and technical skills (including a practical knowledge of urban regeneration and development) and that processes are in place to ensure that benefits received by the participants are effectively disseminated to colleagues and partner organisations. Again, this was not always the case in URBACT I.
5. Overall conclusions and recommendations
The URBAN II initiative has finished but its legacy continues and can be found in the 70 programme areas where there is evidence of change seen through the projects funded by URBAN II, with results and

viii
impacts, some captured in the monitoring and evaluation data, some not easily measured and some just not measured. The legacy has left a visual impact (e.g. buildings restored and vacant spaces converted into new community or economic uses), but is also manifest in the ongoing regeneration that continues in many of the programme areas. Here URBAN II stimulated processes of urban regeneration, often community led, that picked up and continued the work of URBAN II once EU funding had ceased. URBACT I has also ceased but has been continued through URBACT II working in the absence of URBAN, but addressing a demand for an international mechanism, whereby experiences can be shared and lessons learnt in the field of urban development and regeneration can be transferred. The experiences of URBAN II provide valuable lessons for future urban programmes. Most importantly any new programmes should:
• Be ambitious but also realistic in respect of what can be achieved with set budgets and time periods. URBAN II showed that programmes focused on neighbourhoods can make an impact through interventions tailored to address specific local challenges, especially those that are most suited to policies that impact directly on local communities (e.g. improving educational attainment and reducing crime). URBAN II also showed that physical transformation could be achieved with new and improved buildings and spaces that have contributed to a more positive image for the area and an increase in confidence, often a trigger for private investment.
• Build strong local partnerships involving a range of partners, all able to contribute and bring value to the collective development and management of programmes. URBAN II showed that this is central to the success of regeneration at a city level. Local 'bottom up' partnerships have a legitimacy and a strong local knowledge base that can help lead to locally owned and effective solutions to urban challenges. At a European level this approach has often been missing in urban development since the closing of URBAN II.
• Utilise the active support of city and regional partners, which has helped programme managers to define what is realistic in terms of generating impacts and how local interventions can dovetail with city and regional policies for greater effect. Cities and regions can also lend their experience in strategy development and effective monitoring and evaluation systems, areas where some URBAN II programmes were weak, making sure that programmes are aware of their limitations (resources, time, spatial coverage), plan accordingly and realistically, and have the means to know what they trying to achieve and how they will measure progress and success.
• Integrate programme specific resources with the resources, plans and programmes of city and regional authorities, as well as mainstream providers of key services (including the police, education and health) to increase impact. This form of integration can flow from the support provided by city and regional partners and can be used to create strong working relationships with those partners.

9
1.0 Introduction
1.1 The evaluation
This final report presents the findings of the ex-post evaluation of the second round of the URBAN Community Initiative (URBAN II), one of four Community Initiatives funded through the Structural Funds in the 2000-2006 period. URBAN II received €7001 million from the European Regional Development Fund (ERDF).
The report also presents the findings of an evaluation of the URBACT I (urban networks) programme created in 2002 as part of URBAN II.
ECOTEC Research and Consulting has prepared the final report for the Evaluation Unit of the Directorate General for Regional Policy (DG Regio). It builds on the findings of the interim report2 , incorporating evidence gathered throughout the evaluation. The interim report includes a more detailed assessment of URBACT and the results of the counterfactual exercise (one of the evidence strands), which is distilled here in the section on outputs, results and impacts (Section 3).
1.2 Aims of the evaluation
The key objectives3 were to:
• analyse “the impacts of URBAN II4 on economic and social cohesion. This includes an assessment of the efficiency, effectiveness, community added value and management of the programmes”.
• identify “lessons for current and future programmes, including the new Member States”.
The evaluation focused on the impact of URBAN II and whether it achieved its aims and objectives. It also highlights elements of URBAN II that have worked well and also those that have not.
The evaluation was guided by questions laid down in the call for tender. These are set out below. Table 1.1 highlights the evaluation questions for the desk review of secondary information on all 70 URBAN II programmes, and Table 1.2 the questions for the case study element. Table 1.3 covers the terms of reference questions for the URBACT evaluation.
1 At 1999 prices. This has translated to €754m of total ERDF programme spend. 2 Ex-Post Evaluation of the Cohesion Policy Programmes 2000-2006: The URBAN II Community Initiative – Interim Report (Nov 2009) 3 ToR number 2008.CE.16.0.AT.015 (http://ec.europa.eu/regional_policy/sources/docgener/evaluation/rado2_en.htm). 4 Including the URBACT programme

10
Table 1.1 Evaluation questions for the review of 70 URBAN II programmes Key evaluation questions
What were the methods by which URBAN II areas were chosen in each country? How relevant was this method and choice? What were the main challenges facing URBAN II areas at the start of the programmes and what have been the key features of the strategies deployed under URBAN II? How did the programmes’ perceptions of the challenges and the strategies deployed fit within literature on urban regeneration and urban neighbourhoods in crisis? What have been the results and impacts of URBAN II programmes and how do changes compare to the initial baseline? How do changes compare to general trends in similar non-URBAN areas across the EU?Have some elements of URBAN II been more successful than others? (e.g. social rather than physical regeneration actions). Should the balance between investments have been different? What can be said about the degree of local partnership working? To what extent have municipalities and other actors been involved in the design and implementation of the programmes? How has this influenced the design and implementation of the programmes? For the above questions, are there systematic variations by Member States or by Structural Funds Objective? To what extent does URBAN II add value to national and sub-national public policy for urban regeneration? Has URBAN II impacted public policies in this field? Source: Terms of Reference
Table 1.2 Evaluation questions for the 15 URBAN II case studies Key evaluation questions Has there been a gap between theory (as set out in the programming documents) and practice? Has the programme been experienced ‘on the ground’ as a solution to the most pressing problems of the area? What is the link between the URBAN II area and the broader economy, as well as the economic policies of the city? Where an URBAN II area is covered by Objective 1 or 2, what is the link between URBAN II and the strategy pursued in the mainstream? What are examples of successful projects? Why have projects and programmes been successful or unsuccessful in terms of outputs, results and impacts? What are the factors determining success or failure of the different types of URBAN II intervention? How successful has the integrated approach been? To what extent has there been a genuine synergy between measures? What are the factors underlying success in this area? How well have the programmes been managed in terms such as project selection, project support, monitoring, evaluation, communication/publicity, comparison, etc? What have been the main factors underlying the success (or otherwise) of programme and project management? Have administrative costs been reasonable and proportional? Where municipalities have been in the driving seat, how have they fared? How successful have the programmes been in building the capacity of local partners? And in building links between partners? What factors underlie success or failure? To what extent have programmes benefited from the various networks, especially URBACT? What has driven the degree to which they benefit? To what extent are the impacts of URBAN II likely to prove sustainable beyond the end of the period? What are the main factors driving this? Source: Terms of Reference

11
Table 1.3 URBACT I evaluation questions Key evaluation questions
What outputs have been generated? Did networks tend to focus on practicalities or new areas? To what extent have the outputs generated concrete results and impacts ‘on the ground’? What could be done to optimise this final impact? Who has participated and why? To what extent have new Member States been involved? What concretely could be done to optimise participation? The answers to the previous questions should be used to give an overall judgement as to how effective the networks have been, as well as recommendations for good practice Source: Terms of Reference
1.3 Methodology and approach
This sub-section summarises the approach adopted for the evaluation process (Figure 1.1). A detailed methodology is described in the inception report (published separately5).
Figure 1.1 Methodology and approach
Task 1: Review of 70 URBAN II programmes
Document collection and review
Document review of all 70 URBAN II programmes. This desk-based exercise collected secondary information about inputs and outputs and (to a lesser extent) the results and impacts of programmes. It focused on programme complements, annual implementation reports (AIRs), mid-term evaluations (and their updates) and final evaluation reports (where available) for each of the URBAN programmes.
Interviews with stakeholders
Telephone interviews with managing body representatives for URBAN II programmes (61 interviews: 50 programme managers and 11 officials with management responsibility for elements of the programme, e.g. financial managers), and with representatives of national and/or regional managing authorities (18).
Collection of statistics
• unemployment data for URBAN II areas (2000): available for 68 programmes
• unemployment data for URBAN II areas (2006): available for 46 programmes
• unemployment data (2000 and 2006) at city level: available for 70 programmes
• long-term unemployment data (2000 and 2006) for URBAN II areas: available for 29 programmes
• population data for URBAN II areas (2000): available for 70 programmes
• population data for URBAN II areas (2006): available for 32 programmes
5 Ex-Post Evaluation of Cohesion Policy Programmes 2000-2006: The URBAN II Community Initiative – Inception Report (Nov 2008) (http://ec.europa.eu/regional_policy/sources/docgener/evaluation/rado2_en.htm)

12
• city population (2000 and 2006): available for 70 programmes
• population density and size of URBAN II areas: available for 70 programmes.
Counterfactual
The evaluation also explored the impact of URBAN II by attempting to construct the counterfactual. The counterfactual analysis sought to compare outcomes among a group of areas receiving URBAN II funds (the treatment group) with those observed in a group of non-participating areas (the comparison group). The analysis was based on unemployment data, and the results are briefly outlined in Section 3, although the data available did not allow us to generate findings that were statistically significant.
Task 2: Evaluation of URBACT I
Document review
Review of key documents: the latest implementation report (2006), website information (including the URBACT and national-level urban network websites) and written outputs from eight URBACT projects.
Interviews with stakeholders
• representatives of URBACT’s Secretariat/Managing Authority (4 interviews) and Programme Monitoring Committee (3 interviews)
• project lead partners (8)
• project partners (8)
• thematic or secretariat experts involved in project implementation (8)
• representatives of the European Commission (2)
• representatives of other urban development networks, including national URBAN II networks (Germany-Austria, France) and EU networks (EUROCITIES, ERAN-Quartiers en Crise and EUKN.
• representatives of the EU and national urban networks and associations (4).
Task 3: Evaluation of 15 in-depth case studies of URBAN II programmes
The evaluation included 15 programme-level and 10 mini case studies of projects (selected from the 15 programmes) from URBAN II. The case studies (see Table 1.5) allowed deeper exploration of the findings from the first two tasks and gave more detailed understanding of the answers to the evaluation questions.
Case studies were chosen from across Member States using a sampling framework and applying cluster analysis techniques to ensure that they were representative of the total population of the 70 URBAN II programmes. In total, 121 stakeholders were interviewed for the case studies.
Face-to-face and telephone interviews were normally undertaken with the following stakeholders during

13
each case study visit:
• the manager of the URBAN II programme
• other key staff involved in the programme’s management (e.g. monitoring officer, theme leader)
• members of the Monitoring Committee
• local stakeholders working for organisations focused on the target neighbourhood (e.g. local community worker, local police officer, local health worker)
• the managers of two projects funded through the URBAN II programme
• academics and/or relevant stakeholders involved in the wider city or region’s regeneration/neighbourhood renewal agenda (e.g. city regeneration manager, city neighbourhood renewal manager).
In total 121 stakeholders were interviewed as part of the case studies.
The case studies generated a particularly strong strand of the evidence base for the evaluation. By interviewing a wide range of stakeholders within each area, the evaluation gathered a significant amount of information, both qualitative and quantitative, to help answer the terms of reference questions. As the case studies provided a rich and deep understanding of programmes, in terms of performance and – importantly – impact, we have used this evidence base to inform much of the final report.
The programme review undertaken at the start of the evaluation provided a firm base for the study to build on. However, as highlighted in Section 3, the data and information by themselves were often limited in both completeness and usefulness when it came to understanding the impact of the URBAN II intervention. The counterfactual analysis was also helpful, but data limitations meant that statistically valid results could not be derived.
The case studies were representative of the total population of programmes on a range of measures, including geography, size, spend patterns, strength of partnership and unemployment levels of target areas, and thus formed a solid basis for drawing wider conclusions. This is demonstrated in Table 1.4
Table 1.4 Comparisons between total population and case study selection
Cluster (typology) Ideal6 Actual Difference
Physical regeneration group 43% 47% -4%
Relatively balanced group 34% 30% 4%
Social regeneration group 9% 7% 2%
6 Figures do not add up to 100 because the sixth cluster (the ‘outlier’ Bremerhaven) has been omitted.

14
Economic regeneration group 3% 7% -4%
Transport regeneration group 10% 7% 3%
Partnership Ideal Actual Difference
Very inclusive partnership 47% 47% 0%
Relatively inclusive partnership 36% 40% -4%
Not inclusive partnership 17% 13% 4%
City size Ideal Actual Difference
Big 36% 33% 3%
Medium 38% 53% -15%
Small 26% 13% 13%
Unemployment
Ideal Actual Difference
Low 23% 13% 10%
Intermediate 43% 40% 3%
High 34% 47% -13%
Objective 1/Objective 2/other Ideal Actual Difference
Within Objective 1 area 38% 33% 5%
Within Objective 2 area 27% 27% 0%
Outside Objective1 or 2 area 35% 40% -5% Source: ECOTEC analysis of data drawn from programme Annual Implementation Reports and ECOTEC's assessment of the strength of partnerships
Table 1.5 briefly describes each of the 15 case studies; their location is shown in Figure 1.2.
Table 1.5 The case studies Programme Summary
Arhus Arhus, the second largest city in Denmark, had a total programme budget of €12 million (including €5.3 million from the ERDF), which was focused on three neighbourhoods identified as the most deprived areas in Denmark. The target area is dominated by 1960s high-rise housing estates built to accommodate immigrant workers. It is characterised by high worklessness, low educational attainment and high crime.
A large share (42%) of the funding was allocated to leisure and cultural activities to address low participation in leisure activities and the community’s wider socio-economic needs.
The local authority managed the programme but, particularly towards the end, there was a

15
Programme Summary
conscious effort to involve residents and community groups in developing and managing specific projects.
Bristol Bristol is a large city in the south-west of England. Despite the successful development of financial, business, hi-tech and aerospace sectors in the city, it has persistent multiple deprivation in certain areas. The Bristol programme had a total budget of €22.4 million (including €10.6 million from the ERDF), which was targeted at five wards ranked within the 12% most deprived wards in England.
The programme placed young people aged 10-30 at the centre of the decision-making process, and supported projects with a strong focus on developing opportunities and provision for youth.
Carrara The Municipality of Carrara is located in Italy’s Tuscany region and has an economy focused on quarrying, transforming and distributing marble. The Municipality suffered from traffic congestion in its historic centre, and higher than average levels of unemployment.
Of a total budget of €27.2 million (including €8.7 million from the ERDF), approximately 35% of the programme’s budget was allocated to constructing an urban bypass, although some of these funds ended up being used to clean up after the 2003 floods. The rest of the budget was used to promote enterprise, tourism and culture (aiming to re-launch Carrara as the ‘city of marble’) and fight social exclusion.
In addition to institutional stakeholders, numerous trade associations and non-governmental organisations (NGOs) were involved in the URBAN II partnership.
Crotone The target area for this programme comprised 84% of the population of Crotone, a city on Italy’s east coast suffering from above-average unemployment and crime. The total budget for the programme in Crotone was €25 million, of which ERDF contributed €15.1 of funding.
A high proportion (80%) of funds was allocated to projects to improve the attractiveness of the territory through physical regeneration and cultural and social activities. This included renovating civic buildings and establishing the Pythagoras Theme Park and Museum.
The Municipality Administration successfully partnered with the Trade Association to deliver the ‘Pythagoras Showcase’ competition for local traders, although other partnership arrangements were less successful because of competing interests.
Dortmund The German city of Dortmund had a total funding allocation of €28.6 million (including €10 million from the ERDF), which was targeted on Nordstadt, an area in the northern part of the city. This area was badly affected by de-industrialisation and was characterised by high unemployment, poverty, low qualification levels, an unbalanced economy, low external image and high population turnover.
Most of the resources were directed at entrepreneurship and employment measures (42%) and physical and environmental projects (33%).
The programme has been the driving force behind the creation of new forms of networking and joint working, and the consultation group formed for the programme still exists.
Gijón Gijón is an industrial port city in northern Spain, and the largest city in the region of Asturias. Its traditional industries of shipbuilding, coal and metal production declined in the

16
Programme Summary
1980s and 1990s, leading to high unemployment and population losses.
The programme had a total budget of €14 million (including €10.5 million from the ERDF) and was focused on four neighbourhoods in the western part of Gijón. Over half of the budget was allocated to physical and environmental regeneration projects to build infrastructure and regenerate public spaces.
The city council managed the programme in partnership with over 40 local associations and other organisations which played a very active role in designing and implementing individual projects and the continuation of project activities after the programme ended.
Graz The district of Graz West, in the Austrian city of Graz, received a total budget of €20.6 million (including €4.2 from the ERDF) for the URBAN II programme. The decline of the area’s heavy industry and brewing sectors resulted in a high concentration of socially disadvantaged groups in the district, with unemployment three points higher than the city average.
The programme focused on the relocation of the technical college and the establishment of a business start-up centre. It sought to develop the area’s strengths, such as automotive, human technology, environmental and creative industries.
The building directorate of the city council managed the programme, which was influenced by a steering group comprising council departments, local and regional stakeholders and organisations implementing projects.
Halifax Halifax, in northern England, had a total budget of €36 million (including €12.6 million from the ERDF) for URBAN II, and was focussed on five neighbourhoods. Manufacturing accounts for 30% of the town’s employment (nearly twice the UK average), but unemployment was rising and educational attainment and skills levels were poor. URBAN II was one of only two regeneration initiatives targeted on Halifax in the last 20 years.
The programme focused on economic regeneration and, in particular, enterprise development. The programme’s vision centred on helping local businesses to grow and assisting local people to become more employable.
The programme was coordinated by Action Halifax, a company set up to deliver regeneration projects in the town. It was directed by a Monitoring Committee consisting of 26 people from across the public, private, community and voluntary sectors.
Le Havre The city of Le Havre is France’s largest container port, but has experienced economic challenges. Its port and industrial activities are increasingly capital intensive and the population is relatively low skilled, leading to higher than average unemployment rates. The city is also unattractive to tourists, investors and potential residents.
The URBAN II funds were targeted on the city’s southern districts. The total budget for the programme was €30.3 million (including €10.7 million from the ERDF). Physical regeneration accounted for 70% of the programme budget, including the development of an urban park and improving facades in one of the main streets.
The programme was managed by the city and backed by a large number of political and social stakeholders.
Le Mantois The programme was targeted at the two communities of Mantes-la-Jolie and Mantes-la-Ville, about 50km west of Paris. Following a period of population growth, the neighbourhoods underwent a sharp fall in prosperity during the economic downturn of the 1970s, and unemployment exceeded 20%. Moreover, Le Mantois experienced large-scale

17
Programme Summary
rioting in 1991, leading to a number of deaths.
Le Mantois had a budget of €37.9 million (including €12.9 million from the ERDF), allowing the programme to implement 70 projects. The largest were the Green Belt initiative (physical regeneration of the Seine river embankment) and physical improvement of the Red Cross Nursing School.
A local agency for urban planning managed the programme in close collaboration with the municipalities of Mantes-la-Jolie and Mantes-la-Ville.
Leipzig Leipzig is the largest city in the German region of Saxony. Since the reunification of Germany, the city suffered a major contraction of its manufacturing base resulting in a loss of 30,000 jobs since 1989 and a legacy of large areas of derelict land.
The programme, which had a total budget of €19.8 million (including €14.9 million from the ERDF), sought to arrest the decline of these areas through an integrated programme of activity focused on environmental and infrastructure improvements, local economic and employment development, and social integration and renewal.
The community was heavily involved in designing the programme and its associated projects, and it was perceived to be a bottom-up approach. There was also joint working by different organisations for the greater good of the target neighbourhood.
Perama The programme targeted €13.4 million on the port city of Perama (including €9.6 million from the ERDF), on the outskirts of Athens. With its historic reliance on the port and shipbuilding for jobs, Perama had suffered a decline in its employment base, heightened by its inability to attract new employment opportunities in other sectors.
The programme focused on physical and environmental regeneration, mainly because the decline in Perama’s port has left huge swathes of vacant land which were seriously polluted.
The programme was managed by the Municipality of Perama, which was not experienced in managing large-scale European-funded schemes such as this one. The partnership beyond this organisation was widespread, although organisations were mainly consulted on the direction of the programme rather than being key decision-makers.
Porto-Gondomar
Gondomar is one of the most deprived areas within the metropolitan area of Porto in Portugal and suffers from high unemployment, illiteracy, poor ethnic integration, isolated elderly people, drug problems and inadequate roads.
The programme’s total budget was €14.2 million (including €10 million from the ERDF); of which €9 million was allocated to a range of physical regeneration projects.
Despite partnership working not being widespread practice in Portugal, the programme used a partnership model consisting of local, regional and national institutions, as well as local associations and civil society associations.
Rotterdam The URBAN II target area was three neighbourhoods within the Borough of Rotterdam Noord in the Netherlands. The programme had a total budget of €23.7 million (including €8.9 million from the ERDF). The area was characterised by high migration flows, leading to deteriorating neighbourhood relations, and high unemployment, although incomes for those with jobs were relatively high.
The programme built on an existing strategy and focused on addressing crime, family breakdown, physical degradation of the neighbourhood, and community cohesion. A

18
Programme Summary
broad range of partners were involved. The programme management established strong links with educational institutes, social organisations, housing corporations and entrepreneurs.
Sambreville Sambreville, in Belgium, is a highly industrialised city that has suffered over the last 20 years through the restructuring of its industrial base, leading to significant job losses in its key employment sectors. The city had high unemployment, low skills and physical degradation. The largest part of the URBAN II budget (45.3%) was allocated to the physical and environmental regeneration of the area, mainly focused on creating a ‘new’ centre of Sambreville at Auvelais. About a quarter of the budget (26.9%) was allocated to entrepreneurship and employment projects. The programme established 21 projects in total and had a budget of €16.2 million (including €7.1 million from the ERDF). Partnership arrangements were relatively strong and a cohesive group of partners (from the public and private sector) was brought together to specifically oversee the programmes development and implementation.
Source: ECOTEC

19
Figure 1.2 Map of the 15 case study locations

20
1.4 Structure of the Final Report
The remainder of this report is structured as follows:
Section 2: Background and Characteristics of URBAN II – includes an explanation of its origins, an overview of the URBAN II programmes by Member State, the rationale for URBAN II, and a description of the issues faced in URBAN II target areas and key features of the strategies deployed.
Section 3: Review of Outputs, Results and Impacts of URBAN II – draws on programme data and the case study research, and also provides a short analysis of the findings of the counterfactual element of the evaluation approach.
Section 4: Delivery Structures of URBAN II – looks at the management and operational arrangements associated with delivering URBAN II, including its sustainability.
Section 5: The Evaluation of URBACT I – presents the main findings, focusing on the rationale, impact, participation in and management of URBACT programmes.
Section 6: Conclusions and Lessons from the URBAN II programmes – presents the overall analysis of the evaluation evidence.
The case studies and mini- case study reports can be found on the DG Regio website (http://ec.europa.eu/regional_policy/sources/docgener/evaluation/evaluation_en.htm).

21
2.0 Background and Characteristics of URBAN II
2.1 Introduction
This section outlines the background to the URBAN II Community Initiative and explains the selection process used, the main challenges found in target areas and the strategies deployed by programmes to tackle urban decline. The origins and objectives of URBAN II are explained, along with the rationale behind the initiative and the programmes.
2.2 Summary of Key Points
• URBAN II supported 70 programmes in 14 Member States. The European Union (EU) contributed €754 million between 2000 and 2006, rising to €1.6 billion with match funding. The EU contribution ranged from €3.5 to €19.4 million. The programme areas combined covered a population of 2.2 million.
• URBAN II followed the Urban Pilot Projects (1989-99) and URBAN I (1994-99) and shared with both initiatives a focus on innovative and integrated approaches to regenerating neighbourhoods in crisis, and promoting sustainable urban development. In common with the previous initiatives, URBAN II focused resources on defined neighbourhoods.
• The selection of cities and specific programme areas was delegated to the Member States. Different approaches were used, with differing objectives and rigour. In some countries the most deprived cities and neighbourhoods (e.g. as measured in terms of unemployment or industrial decline) were selected, but elsewhere decisions were made to spread resources, especially to cities that had not been in receipt of urban regeneration and development funding streams.
• Whilst high levels of unemployment were a common characteristic for most URBAN II areas, there were also a mix of physical, economic and social challenges, some common to several areas (such as physical dereliction, the immigration of new minority ethnic communities, and the decline of traditional industries), some more specific to individual programme areas (including histories of sectarian violence and heavy traffic in historic city centres).
• There was a broad split, based on resource allocation, between programmes (30) that were centred on the physical regeneration theme and other programmes (40) that had a balance between social, economic and physical regeneration. The case studies highlighted integrated programmes (in 13 of the 15 case studies) bringing together, through projects and partnership structures, physical, economic and social challenges and interventions to tackle those challenges (e.g. reusing redundant spaces and buildings for enterprise centres or new community facilities).
• There was a very close alignment to Objective 1 and 2 programmes in 4 of the 15 case studies with 'joined up' approaches to avoid duplication of activity. In a further two case study programmes
22
URBAN II operated entirely separately from the mainstream Structural Funds.
• In the majority of cases (approximately three-quarters), programme strategies strongly mapped onto the characteristics and challenges of the programme areas. There were exceptions where strategies did not align closely to the main challenges although in the case of major structural problems (such as unemployment).
• Nearly all of case studies (14 out of 15) showed that programme strategies were followed throughout the programme period. However, programmes were also able to adapt to specific local events and changes including natural disasters and policy changes at the city level.
2.3 Origins of the URBAN II Community Initiative
The origins of URBAN II were in 59 Urban Pilot Projects which received €164 million from the ERDF between 1989 and 1999. The 33 Urban Pilot Projects launched in 1989 and the 26 additional pilots that followed represented the first time that the ERDF had explicitly supported innovative, holistic urban regeneration activities across Europe. Although some Member States had their own area-based urban initiatives, many did not have national policies specifically aimed at holistic regeneration of towns and cities.
Following the pilot stages, the first round of the URBAN programme was launched in 19947 and ran until 1999. URBAN I supported 118 European cities in 15 Member States, with a Community contribution of €950 million. The experiences from the Urban Pilot Projects and URBAN I fuelled debate about future urban policy across the EU and the need for further ERDF investments in holistic and innovative urban programmes. The outcome was the communication ‘Sustainable Urban Development in the European Union: A Framework for Action’,8 which explained the Commission’s intended approach to tackling urban decline and called for a second round of the URBAN Community Initiative - URBAN II.
2.4 Overview of URBAN II
URBAN II supported 70 programmes across 14 countries and received €754 million from the ERDF. With matched funding, URBAN II injected €1.6 billion into neighbourhoods in crisis with a combined population of nearly 2.2 million and an average programme population of 31,200 people.9
URBAN II’s mission was the ‘economic and social regeneration of cities and urban neighbourhoods in crisis with a view to promoting sustainable urban development’.10 As with URBAN I, the emphasis was on
7 Decision 94/C 180/02 Notice to Member States ‘Laying down guidelines for operational programmes which Member States are invited to establish in the framework of a Community Initiative concerning urban areas’. 8 Com (1998) 605 final. 9 Communication from the Commission to the Council, the European Parliament, the Economic and Social Committee and the Committee of the Regions – An Initial Assessment of the URBAN Initiative (2002). 10 Article 3(1) of EC regulation 1783/1999.

23
an integrated approach to solving the problems of urban areas, taking into consideration physical, social and economic regeneration issues.
The main objectives of URBAN II were to:
• formulate and implement innovative strategies for sustainable economic and social regeneration of small and medium-sized towns and cities or of distressed urban neighbourhoods in larger cities
• enhance and exchange knowledge and experience in relation to sustainable urban regeneration and development in the areas concerned.
To fulfil these objectives the principles for the 70 programmes (and associated strategies) supported through URBAN II were to 11:
• have sufficient critical mass of population and associated support structures to facilitate the formulation and implementation of innovative urban development programmes.
• have strong local partnerships to define challenges, strategy and priorities, allocate resources and monitor and evaluate the strategy; partnerships needed to be wide and include economic and social partners, NGOs and residents’ groupings.
• adopt an integrated territorial approach with links to development strategies for the wider urban area or region.
• integrate the economic, social, environmental, security and transport aspects, including equality of access to education and training opportunities.
• promote equal opportunities between men and women.
• ensure complementarity with the main forms of assistance under the Structural Funds and other Community initiatives.
Each area supported through URBAN II funding had to demonstrate a need for economic or social regeneration and show that there was no duplication of regional or national funding. URBAN II aimed to finance innovative projects and activities with the long-term objective to transfer these innovations into mainstream practice at local or national level.
URBAN II’s guiding principles also differentiated it from mainstream ERDF support. It focused on stimulating innovative and partnership based ways to address urban problems, sought to provide an integrated response to all the challenges facing the area, and was generally flexible regarding what was funded and how funding was allocated.
Table 2.1 sets out the areas selected to receive URBAN II funding and the allocation for each Member State.
11 Communication from the Commission to the Council, the European Parliament, the Economic and Social Committee and the Committee of the Regions – An Initial Assessment of the URBAN Initiative (2002).

24
Table 2.1 Overview of URBAN II programmes by Member State
Country URBAN II area Number of programmes
URBAN II FUNDS committed (million €)
Austria Graz, Wien (Vienna) 2 8.5
Belgium Antwerpen (Antwerp), Bruxelles-Capitale (Brussels), Sambreville 3 21.5
Denmark Arhus 1 5.4
Finland Helsinki/Vantaa 1 5.4
France Bastia, Grenoble, Le Mantois, Bordeaux, Grigny/Viry, Strasbourg, Clichy-Montfermeil, Le Havre, Val-de-Seine
9 101.9
Germany Berlin, Gera, Luckenwalde, Bremerhaven, Kassel, Mannheim/Ludwigshafen, Dessau, Kiel, Neubrandenburg, Leipzig, Dortmund, Saarbrücken
12 149.7
Greece Iraklio, Komotini, Perama 3 24.7
Ireland Ballyfermot 1 4.9
Italy Carrara, Milano (Milan), Pescara, Caserta, Misterbianco, Taranto, Crotone, Mola di Bari, Torino (Turin), Genova (Genoa)
10 118.1
Netherlands Amsterdam, Heerlen, Rotterdam 3 30.6
Portugal Amadora, Lisboa (Lisbon), Porto Gondomar 3 19.2
Spain Caceres, Orense, S. Cristobal de la Laguna, Gijon, Pamplona, Teruel, Granada, S. Adria de Besos, S. Sebastian-Pasaia, Jaen
10 120.0
Sweden Göteborg 1 5.4
UK Belfast, Halifax, Hetton and Murton, Stockwell, Bristol, Normanton in Derby, Thames Gateway, Burnley, Peterborough, West Wrexham, Clyde Waterfront
11 139.0
TOTAL 70 754.3 Source: An Initial Assessment of the URBAN Initiative (2002)12.
The Commission allocated money in proportion to the level of urban unemployment and provided an indication of how many URBAN II programmes were likely to be funded within each Member State. The average allocation per programme was €10.7 million. The largest single allocation was to Thames Gateway in the UK (€19.4 million) and the smallest to Amadora in Portugal (€3.5 million).
12 Communication from the Commission to the Council, the European Parliament, the Economic and Social Committee and the Committee of the Regions – An Initial Assessment of the URBAN Initiative (2002)

25
Table 2.2 presents other key characteristics of areas receiving URBAN II funds.
Table 2.2 General characteristics of URBAN II areas
Characteristic Observations
Population size of URBAN II programme areas and recipient cities
The 70 URBAN II areas covered a total population of just under 2.2 million, with the largest target area containing 62,000 people (Amsterdam) and the smallest 10,000 (Amadora).13 In all, 18 URBAN II programmes were located in cities with a relatively small population (under 150,000), 27 in cities with a population of between 150,000 and 500,000, and 25 in cities of over 500,000 people.
Type of target area of URBAN II 31 out of 70 URBAN II programmes were located on the outskirts or periphery of the urban area, 27 in the city centre. The remainder (12) were split between 8 city-wide programmes and 4 with a mix of peripheral and central areas. Countries with the majority of their URBAN II areas in the city periphery were France, Greece and Italy, while those with programmes located in the urban centre were Germany, Spain and the Netherlands.
Overlap of URBAN II with Objective 1 and Objective 2 areas
45 URBAN II programmes were located in Objective 1 or 2 areas: 26 in Objective 1 areas and 19 in Objective 2 areas. 25% of URBAN II funds were spent outside Objective 1 and 2 areas. Compared to the first round of URBAN, URBAN II was less focused on Objective 1 and 2 areas; only 17% of funding from URBAN I was spent outside Objective 1 and 2 areas.
Levels of match funding Under half of all the URBAN programmes’ total spend was made up of URBAN II funds (48%). The two extremes in relation to levels of match funding were Greece (at 25% the smallest proportion of match) and Austria (at 76% the highest levels of match).
Source: ECOTEC analysis of URBAN II programmes
2.5 Selection of URBAN II areas
Given the strong interest in URBAN II from prospective cities in all 14 Member States meaning a selection process was used to decide which areas received URBAN II funds. This process varied between Member States.
The decentralised approach for selecting URBAN II areas stemmed from the Commission’s recognition that urban problems differ across Europe, requiring a more localised, country-level decision-making process. Qualitative and quantitative evidence was used to inform the selection process. Virtually all Member States used some form of statistical analysis when identifying areas most in need, though some had stronger and more complete datasets than others. Germany, the Netherlands and the UK all had
13 Communication from the Commission to the Council, the European Parliament, the Economic and Social Committee and the Committee of the Regions – An Initial Assessment of the URBAN Initiative (2002).

26
relatively sophisticated statistical information to draw on, although (in 2000) even these countries tended not to have datasets that provided statistical information at the neighbourhood level.
Partly because of the lack of data, qualitative evidence was also important when selecting programme areas. The case studies highlighted that political processes played a part in influencing decisions to select areas for URBAN II funding. In Rotterdam local figures lobbied for the city to have URBAN II funding, and local support and backing for the bid was strong and well organised. In Le Havre, political pressure was put onto national organisations to award URBAN II funds to the city’s southern district, an area not previously covered by other national, regional or European funds.
Other factors at play in the selection process included:
Geographical balance and spread – Member States often consciously decided to spread URBAN II programmes equally across the country wherever possible. For example, in Belgium an equitable split of resources across regions was a major consideration in selecting programme areas. In Germany, the selection process was based on one programme per region. The UK initially proposed one programme per region but later amended this approach which resulted in a change of one of the selected areas.
Target areas not previously in receipt of funding – URBAN II programmes were sometimes located in areas not in receipt of other funding streams (e.g. UK, Spain and the Netherlands). Teruel in Spain is an example of an area which had historically not benefited from regeneration funding. The government decided to prioritise URBAN II funding on Treuel as opposed to nearby cities (Huesca and Zaragoza) which had previously enjoyed a comparatively wide range of regeneration funding regimes. Heerlen in the Netherlands had also missed out on Objective 2 funding and was designated an URBAN II area partly as a consequence.
Capacity of key stakeholders – the capacity of the city and its stakeholders to deliver an effective urban regeneration programme was another consideration. For instance, in Germany an independent panel decided which areas would receive URBAN II funding, with the city’s capacity and previous experience being one of the deciding factors.
Alignment with national strategies/funding streams – some areas were chosen specifically to link with and match national funding streams. As URBAN II required match funding, programmes often targeted areas where other public and private finance was available. France focused on 80 cities already in receipt of regeneration funding, partly because they represented the most deprived parts of the country, but also because URBAN II funding could more easily find a source of match funding in these cities. In Rotterdam, the desire to build on existing policy initiatives promoting a neighbourhood-based approach to regeneration was a key factor in determining the target areas.
A balance between need and opportunity – some Member States chose to focus URBAN II resources on areas which were not necessarily the most deprived parts of the city. Overall, 11 (16%) URBAN II areas had unemployment rates lower than the city level, suggesting that some Member States directed resources at less deprived areas (the strongest evidence for this came from the UK, Germany, Spain and Italy). The reasons were twofold. Firstly, less deprived urban areas would have more chance of recovery, as their problems could more ‘easily’ be addressed through a programme such as URBAN II. Secondly, targeting URBAN II funding on, for instance, the city centre (which was often not the most deprived part of the urban area) could provide greater opportunity for the city as a whole, including its deprived
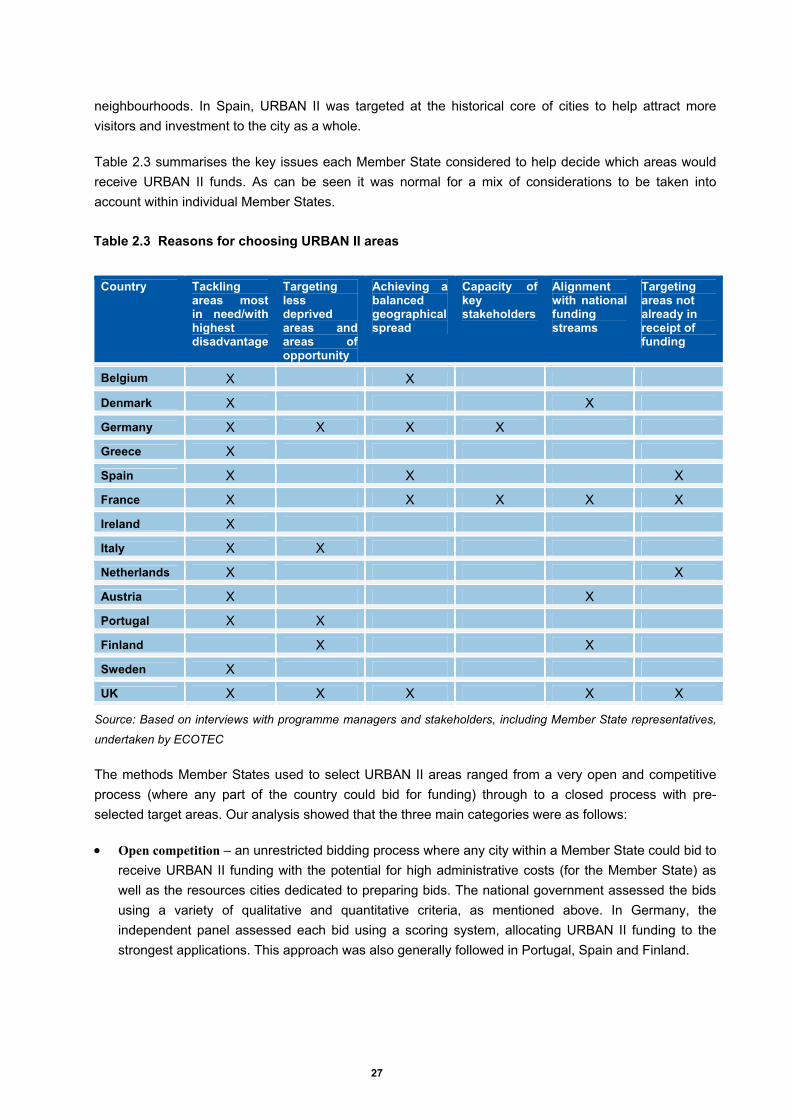
27
neighbourhoods. In Spain, URBAN II was targeted at the historical core of cities to help attract more visitors and investment to the city as a whole.
Table 2.3 summarises the key issues each Member State considered to help decide which areas would receive URBAN II funds. As can be seen it was normal for a mix of considerations to be taken into account within individual Member States.
Table 2.3 Reasons for choosing URBAN II areas
Country Tackling areas most in need/with highest disadvantage
Targeting less deprived areas and areas of opportunity
Achieving a balanced geographical spread
Capacity of key stakeholders
Alignment with national funding streams
Targeting areas not already in receipt of funding
Belgium X X
Denmark X X
Germany X X X X
Greece X
Spain X X X
France X X X X X
Ireland X
Italy X X
Netherlands X X
Austria X X
Portugal X X
Finland X X
Sweden X
UK X X X X X
Source: Based on interviews with programme managers and stakeholders, including Member State representatives,
undertaken by ECOTEC
The methods Member States used to select URBAN II areas ranged from a very open and competitive process (where any part of the country could bid for funding) through to a closed process with pre-selected target areas. Our analysis showed that the three main categories were as follows:
• Open competition – an unrestricted bidding process where any city within a Member State could bid to receive URBAN II funding with the potential for high administrative costs (for the Member State) as well as the resources cities dedicated to preparing bids. The national government assessed the bids using a variety of qualitative and quantitative criteria, as mentioned above. In Germany, the independent panel assessed each bid using a scoring system, allocating URBAN II funding to the strongest applications. This approach was also generally followed in Portugal, Spain and Finland.

28
• Restricted competition – while still using an element of competition, Member States restricted the cities eligible. In France, of the 80 eligible cities, 35 bid for URBAN II funds, 13 were shortlisted and 9 were chosen. Restricted competition was the method favoured in France, the UK, Italy, the Netherlands, Denmark, Belgium, Italy and Ireland.
• Closed call – some Member States invited specific cities to apply for URBAN II funding; these were pre-selected based on a quantitative assessment (i.e. the most deprived), or because very few cities met the minimum requirements for eligibility. This method tended to be used in small Member States, including Austria, Greece and Sweden.
Restricted competition was the most popular selection method as it was thought to stimulate innovative proposals while restricting the level of overall resources dedicated to making bids for URBAN II programmes, some of which would be unsuccessful. Thus a balanced approach encompassing both competition and restricted selection was preferred for the decision-making process.
Table 2.4 summarises each Member State’s selection process, drawing on the results of interviews during the review of all 70 programmes. From our analysis we cannot demonstrate that one process was more effective than another (in terms of the subsequent impact of the chosen programmes). However, the value of a rigorous approach, providing there is transparency, is that the basis for selection can be defended, an important consideration for Member States in their ongoing relationship with cities.
Table 2.4 Selection process used by Member States
Country Open competition Restricted competition
Closed call
Belgium X
Denmark X
Germany X
Greece X
Spain X
France X
Ireland X
Italy X
Netherlands X
Austria X
Portugal X
Finland X
Sweden X
UK X
Source: Based on interviews with programme managers and stakeholders, including Member State representatives,
undertaken by ECOTEC

29
2.6 Main challenges facing URBAN II areas
This sub-section explores the broad socio-economic trends prevailing in target neighbourhoods prior to facing the areas prior to URBAN II.
All URBAN II programme areas suffered significant economic, social and physical problems. Although there were different local contexts and challenges the programme areas still faced a range of common challenges. Before examining these common challenges in more detail, we highlight three case study examples that typify the problems URBAN II tried to address.
Case-study examples: typical problems
Dortmund, Germany
URBAN II targeted an isolated, post-industrial suburb in the northern part of Dortmund, where most residents lived in densely populated, poor quality accommodation. The area was badly affected by de-industrialisation and developed a role as a home to growing numbers of immigrant and socially disadvantaged groups. The main challenges included tackling high unemployment rates (26.5% in 2000 – three times the national rate), long-term unemployment (46.9% of the total), high rates of economic inactivity, poverty, risk of exclusion, low levels of qualifications, an unbalanced economy and poor external image. The area had also suffered high population turnover rates, with more ‘successful’ residents moving out to be replaced by more disadvantaged groups.
Le Havre, France
Le Havre had suffered from decline in traditional industries (mainly associated with the port and petro-chemical sectors) over the last three decades. Prior to URBAN II, new and emerging industries had failed to create sufficient employment opportunities for the existing population, so unemployment (particularly long-term unemployment) and benefit dependency were noticeably higher than in the surrounding regions (the unemployment rate stood at 21% in Le Havre compared with 13% in France in 1999). Low educational attainment levels and lack of an enterprise culture also hampered economic recovery in the target area. High crime and delinquency rates were other symptoms of the deprivation existing in Le Havre. The quality of the physical environment was poor – two particularly prevalent issues were high levels of land pollution and vacant and derelict buildings. Lack of public sector investment (prior to URBAN II) also meant that transport links were degraded, while local public service provision was insufficient to meet the population’s needs.
Perama, Greece
The Municipality of Perama was one of the most disadvantaged areas of the capital region, Attiki, with particular problems on the quality of the environment, urban fabric and residents’ socio-economic situation. Some of the most deprived neighbourhoods had a much degraded urban fabric. The local economy traditionally depended on ship-building, but this sector’s decline in the 1980s resulted in high levels of unemployment. Other challenges included low incomes, low levels of entrepreneurship, low participation of women in the labour force, a serious shortage of social care and health services, and overall low quality of life. Residents’ ability to improve their quality of life was also undermined by low educational attainment. Furthermore, the decline in heavy industry was not compensated by growth in the service sector and thus access to new employment opportunities had been scarce.
The following is a more general overview of the typical challenges URBAN II programmes tried to address.
2.6.1 Physical challenges
A number of characteristics defined the physical environment of the target areas for URBAN II, most often associated with the decline of heavy or more traditional industries leaving a legacy of derelict or underused land and buildings, some with severe contamination problems.

30
URBAN II target areas also generally suffered from poor quality and outdated infrastructure particularly that related to roads, rail and canals. 44% of the programmes were located in more peripheral urban areas which tended to be more isolated, whether physically (i.e. geographically remote from other areas) or with a poor transport infrastructure. This meant that local residents were often disadvantaged in their ability to access key services or potential employment opportunities outside their immediate neighbourhood.
Many programme areas had a lack of green and open space for local residents to undertake sporting or leisure pursuits, or more generally a lack of social and public space. This characteristic was also substantiated in a European Commission initial review of the URBAN II programme areas,14 where only 10.5% of the surface area of target areas could be accounted for by green space.
Poor conditions in the social housing sector were a common feature across URBAN II programme areas with a focus on the problems of very high housing densities and overcrowding in some neighbourhoods. In other areas, URBAN II programme areas had problems of low demand for housing, because of unfit or undesirable properties which people tended to move away from.
2.6.2 Economic challenges
Many programme areas were facing large-scale ‘structural difficulties’, due to the long-term decline of heavy or more traditional industries. This decline in what was often the main source of employment meant that unemployment levels were noticeably higher in URBAN II programme areas than in surrounding areas or compared to regional and national rates. The levels of unemployment and long-term unemployment were typically high across all programme areas, while economic activity and employment rates were normally low.
According to the European Commission’s assessment15 of the 70 programme areas, 17% of the working-age population were unemployed in 2000, compared to an EU average of around 8%. Furthermore, the average unemployment rate in target areas was higher than the whole-city average in all countries except Belgium and higher across all programmes by an average of 5.3% (see Table 2.5).
Table 2.5 National unemployment rates
Country
Average unemployment rate in programme area (2000)
Average unemployment rate in whole host city (2000)
Average difference in unemployment between programme area and whole city
Belgium16 15.0% 15.0% 0.0%
Denmark 12.2% 5.1% + 7.1%
14 Commission of the European Communities (2002) Communication from the Commission to the Council, the European Parliament, the Economic and Social Committee and the Committee of the Regions ‘The Programming of the Structural Funds 2002-2006: An Initial Assessment of the URBAN Initiative’. 15 Communication from the Commission to the Council, the European Parliament, the Economic and Social Committee and the Committee of the Regions – An Initial Assessment of the URBAN Initiative (2002). 16 Unemployment data for target area in Brussels was not available

31
Country
Average unemployment rate in programme area (2000)
Average unemployment rate in whole host city (2000)
Average difference in unemployment between programme area and whole city
Germany 19.1% 15.9% + 3.3%
Greece 17.0% 11.2% + 5.8%
Spain 19.2% 15.8% + 3.4%
France 20.4% 9.8% + 10.6%
Ireland17 11.7% - -
Italy 23.4% 17.4% + 7.0%
Netherlands 13.2% 9.2% + 4.0%
Austria 8.9% 7.0% + 1.9%
Portugal 25.0% 7.0% + 18.0%
Finland 12.7% 7.1% + 5.6%
Sweden 11.3% 6.8% + 4.5%
UK18 3.5% 2.9% + 0.6%
Overall - - + 5.3% Sources: Programme documents, national statistical offices, Eurostat, Urban Audit, and Assessment of the Urban Initiative
The evidence shows that unemployment levels among some demographic groups were especially high within the programme areas. In particular, women, younger people and residents from minority ethnic groups, together with asylum seekers and refugees, were over-represented among the unemployed population. In a number of cases the unemployment rate in the programme areas was much higher than the URBAN II average of 17%. For example, Mola di Bari, Caserta and Crotone in Italy, Perama in Greece, Granada and S. Adria de Besos in Spain and Bordeaux in France all had unemployment rates above 25% in 2000.
2.6.3 Social challenges
Social exclusion was a key factor affecting the lives and opportunities of several key demographic groups in most of the URBAN II programme areas. Women, younger and older people, residents from minority ethnic groups, and asylum seekers and refugees all experienced some form of social exclusion or disadvantage. Ethnic minorities accounted for 15% of the population of URBAN II areas – around four times higher than the European average and more than double the figure for cities covered by the Urban Audit (6%). Brussels, for example, had a particularly high immigrant population, comprising 59% of the target area’s total population.19
17 Unemployment rate for Dublin agglomeration was not available 18 Jobseekers Allowance (JSA) was used as a proxy for unemployment at both target area and city levels. Data for Scotland and Northern Ireland is not available 19 Communication from the Commission to the Council, the European Parliament, the Economic and Social Committee and the Committee of the Regions – An Initial Assessment of the URBAN Initiative (2002).

32
Changing socio-demographic patterns were also a common feature. The following trends were identified in many programme areas:
• out-migration of the indigenous population from the programme area.
• immigration of new minority ethnic population groups, asylum seekers and refugees, often to the most deprived parts of the target areas.
• polarised population, with levels of both younger and older residents above regional and national averages.
• educational attainment levels below regional and national averages, as well as high drop out rates from school.
• high unemployment levels, low economic activity levels, low skill and qualification levels and above national average levels of benefit dependency.
Although anecdotal, there was also evidence to suggest that these changing socio-demographic patterns, together with the physical, economic and social problems, created social cohesion problems. Combined with the general levels of poverty and deprivation in the programme areas, these social cohesion issues were manifested in incidences of crime, drug and alcohol misuse and other anti-social behaviour. A few programme managers cited extremist problems; for example, terrorism as a serious issue in Bastia, and sectarian violence in North Belfast being a longstanding problem.
The voluntary and community sector, which often provides key services to the local community, was weak in many of the programme areas and often unable to respond to local community needs. Many residents in the target areas were unable to access basic social services (such as health and wellbeing services), as well as more specific labour market or recreation and leisure-related services at local level.
2.7 Strategies deployed by URBAN II programmes
This sub-section highlights the types of approaches adopted by the various URBAN II programmes to tackle and overcome the problems inherent in their target areas. After assessing the strategies by examining their spend patterns, it looks at whether programmes adopted an integrated approach – a key original aim of URBAN II.
2.7.1 Types of strategy by patterns of fund allocation
A starting point for understanding the strategies deployed is to examine the allocation of funds in programmes to the different regeneration themes. Table 2.6 shows the broad balance of strategies used by URBAN II programmes, based on the percentage of funds allocated to each of the themes20.
20 Spend under information and communications technology (ICT) is included in the economic theme; transport and environmental spend is under the physical theme.

33
Table 2.6 Thematic emphasis of URBAN II allocation at country level (% of ERDF allocated to each theme)
Physical and environmental
regeneration and transport
infrastructure
Social Economic regeneration and
ICT
Technical assistance
Sweden 0% 60.7% 31.2% 8%
Denmark 4.8% 62.5% 27.3% 5.2%
Ireland 23.9% 54.3% 18.7% 3.1%
UK 24.6% 40.1% 27.4% 4.8%
Germany 33.4% 26.6% 27.7% 5.3%
Finland 39.9% 21.4% 29.7% 8.8%
Netherlands 41.4% 26.1% 26.4% 5.9%
Portugal 44.6% 40.9% 10.4% 3.8%
Austria 49% 27.9% 19.4% 3.5%
Greece 50.6% 28.9% 16.9% 7.1%
France 52% 23.5% 20.2% 4.1%
Belgium 52.1% 7.9% 34.3% 5.5%
Italy 67.2% 9.6% 14.8% 6.0%
Spain 68.4% 7.2% 19.7% 4.5%
Average 39% 31% 23% 5% Source: ECOTEC analysis of the Annual Implementation Reports NB: Figures do not equal 100 because of rounding.
Although Table 2.6 is helpful in understanding the broad strategic approaches that Member States adopted, it does not show the variations within countries. For example, one programme in Portugal focused on the economic theme, even though the country’s overall average shows that the physical and social themes predominated at national level.
A cluster analysis was a useful exercise to further understand programme strategies to tackle the challenges highlighted above. This analysis (also based on statistical assessment of programme expenditure data) shows a typology of strategic approaches based around two key clusters21. Each was defined by the balance of spend allocated across the five main regeneration themes of URBAN II.22
These groups are as follows:
• Cluster 1: Focus on economic and social regeneration (but also with some spend on physical regeneration) – programmes with generally high spend on social inclusion and
21 The analysis explored a range of cluster groupings, the Interim Report highlighted six smaller clusters. For the purposes of the Final Report we present the two main meta-clusters. 22 An econometric and hierarchical data clustering technique was used to decide which groups are most distant from each another.

34
entrepreneurship/employment, and relatively lower spend on ICT and physical and environmental regeneration; the cluster contained 40 programmes.
• Cluster 2: Physical regeneration (driven by physical or transport priorities) – programmes with high spend on physical environment, and a relatively low spend on social inclusion and entrepreneurship/employment; the cluster contained 30 programmes.
2.7.2 Working across themes
Programmes generally adopted an integrated approach to regeneration. 13 of the 15 case study programmes showed signs of a holistic approach to their strategies. Stakeholders interviewed generally saw an integrated approach as a key characteristic of their programmes. The case studies also provided evidence of how programmes supported projects that worked across the three themes, with projects in one theme often supporting projects in another theme (see examples below).
Case study examples: integration at programme level
Gijon, Spain
The integration of physical, economic and social activities was designed into the programme from inception. The ‘integrated development path’, as it was known, resulted in key city council departments working together to deliver holistic regeneration projects. For example, a capital project to build a new waste management and recycling point incorporated public space for community events and training sessions to raise awareness of environmental issues. In addition, the physical regeneration of three industrial parks included economic development measures to stimulate enterprise development and growth among resident small and medium-sized enterprises (SMEs).
Carrara, Italy
The integration across themes in Carrara increased the programme’s overall impact, and led to positive perceptions of the programme by local residents. The improvement of bridges, piazzas and streets in the historic centre drove the subsequent flourishing of economic and tourism activity. Marble (a key local natural resource) was used to regenerate the physical environment and promote cultural regeneration through the XII Biannual International Sculpture Exhibition.
Rotterdam, Netherlands
Key stakeholders worked collaboratively to tackle particular problems in three geographically well-defined neighbourhoods. For example, a capital-intensive project to refurbish retail outlets in the target area included parallel activities such as training shopkeepers on safety issues to help address public fears over crime and anti-social behaviour. Activities to improve public areas have also resulted in various social and economic outcomes, including youth facilities, a dedicated cycle path for learner-riders, and public art exhibitions designed to encourage tourism in the target area.
Further evidence from the case studies showed that:
• The integration agenda already existed in 8 of the 14 Member States involved in URBAN II - regeneration practitioners were already using an integrated approach prior to 2001. For example, in the Netherlands, the integration of economic, social and physical objectives was not considered a

35
new concept, as the National Large City Programme was already seen as a beacon of good practice in promoting holistic regeneration. In the UK, the Single Regeneration Budget (a national regeneration fund) also promoted regeneration in its widest sense.
• Where integration did not exist, there was usually a good reason – URBAN II programmes focusing heavily on a particular theme were often part of a wider programme (contributing a physical dimension to a larger, multifaceted, city-wide programme). For example, the URBAN II programme in Halifax in the UK mainly focused on economic development; this was intentional, as there was another regeneration fund supporting mostly physical and social regeneration projects.
2.7.3 Alignment with Objective 1 and 2 programmes
URBAN II programmes worked well in conjunction with Objective 1 and 2 programmes, where the cities concerned were eligible for support under the Structural Funds, as in the following examples from the case studies. However, in two case studies (Rotterdam and Le Havre), even though they targeted similar spatial areas there was no synergy between URBAN II and the mainstream Structural Funds programme, which were treated as entirely separate in terms of how they were run and their overall management processes. This was down to the programmes focusing on different strands of the regeneration agenda.
Case study examples: alignment with Objective 1 and 2
In Graz, Bristol, Leipzig and Carrara, the existence of an Objective 1 and 2 programmes proved to be highly positive. The two initiatives linked up to jointly fund activities and avoid duplication of activity.
In Bristol, the URBAN II management team was placed within the same council department that was managing Objective 2. This strategic decision helped to ensure ‘joined up’ programmes and led to shared experience and approaches across key management and finance team personnel, especially in areas such as monitoring technicalities. There was close liaison and coordination between URBAN II and the Bristol Objective 2 Action Plan, including cross-referring project proposals and ensuring that European Commission spend was not duplicated between the two programmes.
One project, Archimedia (which has won a number of national and regional awards), received investment from both Objective 2 and URBAN II, for different project elements. EU project management expertise was also shared between the two programmes.
Carrara operated a close strategic alignment between the two programmes. URBAN II was regarded as a tool for targeting local regeneration needs, and Objective 2 as a means of tackling economic conditions within the broader region. This approach was seen to work well with the two funding streams having a clear remit in terms of geography and target groups.
2.7.4 Strategic approaches at project level
Although URBAN II supported a wide variety of projects, they can be analysed under the three broad themes of the programmes (see Table 2.7).

36
Table 2.7 Key characteristics of projects funded through URBAN II under the three main themes Physical Economic Social
About a third of the projects aimed to improve public space, ranging from improving green space in deprived neighbourhoods through to major construction in city centres.
About a fifth of projects focused on supporting business growth. Most supported high-growth businesses, to help local economies to ‘reinvent’ themselves in new industrial sectors and move away from over-reliance on declining ones.
Most programmes contained projects to tackle unemployment and worklessness. As most target areas had very high unemployment levels, they tried to tackle this primary problem head-on through investing in projects for training, workforce development, education and skills enhancement.
About a quarter of projects aimed to bring redundant buildings back into use. Many were old industrial/commercial buildings left over from the industrial past of the programme areas. Buildings were refurbished for a variety of uses, from new commercial premises through to new arts and cultural venues.
Many projects retrained people employed in older (declining) industries, while others helped local people to access job opportunities in emerging new industries.
About a quarter of projects addressed health issues including projects aimed at reducing the number of smokers through to interventions encouraging healthier eating and tackling drug usage.
About a quarter of physical regeneration projects were related to infrastructure investments. These tended to be road-building schemes, but cycle path construction was also a popular project type.
About 10% of programmes had projects that dealt with underemployment as opposed to unemployment. These projects often targeted people who were in work but on low incomes.
Almost half of the programmes supported projects that addressed crime issues, with a relatively large number of drug-related projects and interventions with an emphasis on anti-social behaviour.
About 10% of projects related to site preparation. Projects such as land decontamination and site assembly helped to stimulate further investments and lay the foundation for private sector-led regeneration activity.
About a third of programmes had projects for capacity building and strengthening the voluntary and community sector. Projects supported these organisations to grow and develop and become more robust and sustainable, so that they could effectively deliver support for local communities.
ICT-related projects included ICT infrastructure in schools and community centres, and, particularly, improving ICT capabilities in small businesses.
Many projects targeted specific groups in deprived communities. Key groups included women, ethnic minorities and (to a lesser extent) young people. Projects therefore seemed to prioritise the hardest to reach in the target communities.
2.7.5 Reasons behind different strategies
Various factors influenced strategies and approaches that URBAN II programmes and projects used to address urban decline. The main drivers covered four areas:
• Neighbourhood need – the needs of neighbourhoods and their communities was fundamental to the type of response of URBAN II programmes. Programmes focused on the economic theme tended to have target areas suffering from economic decline, while programmes addressing physical renewal had target areas with high levels of physical degradation.

37
• The national regeneration agenda – where a national regeneration policy’s main emphasis was on physical regeneration, the URBAN II programme often mirrored this approach. In the UK, for instance, the emphasis among URBAN II programmes was on social inclusion issues, partly because of a strong emphasis at national government policy level (the National Strategy for Neighbourhood Renewal) to tackle neighbourhood deprivation through social (as opposed to physical) regeneration. In Spain, the national agenda was more biased towards physical change, which in turn influenced how URBAN II programmes addressed problems and allocated funding.
• The local regeneration agenda – Vienna concentrated its URBAN II funds on converting the Rinderhalle (cattle hall), because this was a flagship and catalytic project in the local regeneration strategy. In Spain, local regeneration plans in Granada focused on physically regenerating the city core to stimulate an increase in tourism and a knock-on effect for employment opportunities for deprived areas. Granada’s URBAN II programme mirrored this key objective, again influenced by an existing local regeneration plan.
• Gaps in funding – URBAN II funds were sometimes used to fill funding gaps in existing regeneration plans, or to add an extra dimension to target neighbourhoods’ regeneration plans which were not then being implemented because finance was not available.
Overall, the needs of the urban areas were the main driver shaping URBAN II programmes. However, our desk research suggests that the focus of about a quarter of URBAN II programmes did not directly align with the needs and problems of the programme area. Some areas with problems of high unemployment did not have projects that assisted people back into work. Similarly, programmes with target areas that had low levels of school attainment did not always have projects including educational activities. Most programme managers stated that the links between urban problems and solutions were often complex, and that a focus on physical interventions was also intended to address a wide range of social and economic issues (for instance, the construction of a community facility to provide neighbourhood childcare provision).
2.7.6 Continuity of strategic approaches
The evaluation also explored whether there were differences between what programmes intended to do and what happened in reality. This sub-section assesses whether programmes drifted away from their original plans, and explains the reasons behind any changes.
Programmes reported very few fundamental shifts from their original plans. Of the 15 case studies, 14 stayed true to the aims and objectives developed at the start of the programme. Most put this down to a good understanding of what was wrong with the target area at the beginning of the programme and therefore what issues they needed to focus on. Despite changes to socio-economic conditions over the lifetime of URBAN II, these initial and fundamental challenges remained constant throughout the delivery period, which in turn led to consistent and stable programme objectives.
Where changes occurred, this was more at project level. Sometimes, projects as originally developed did not come to fruition or were altered for various reasons. The following examples illustrate factors affecting project-level changes.

38
Case study examples: changes to strategic approaches at project level
• Changing socio-economic conditions – in Halifax, the original plans were to develop projects to tackle rising unemployment, but as economic conditions improved and worklessness became less of an issue these projects were scaled down and replaced with business support interventions.
• Natural disasters – large-scale floods in Carrara in 2003 led the programme to drop some longer term projects and turn its attention to more urgent rebuilding that was needed. Similarly, after the Italian earthquakes URBAN II funds were redirected to make people more aware of imminent earthquake danger.
• Political change – in Rotterdam, the 2002 murder of a key politician led to elections that brought in a new coalition which strongly promoted tackling crime and community safety. This led to an increase in the amount of resources the URBAN II programme funded in this area.
• Changes because of a review – two of the case studies changed the emphasis of projects because of a mid-term evaluation or internal review. Le Havre and Dortmund revisited their projects at this stage and found some to be underperforming. As a result, they either stopped or realigned them.
2.8 Conclusions – URBAN II programme characteristics and strategies
Evaluation findings from Section 2 based on the terms of reference questions are as follows:
What were the methods Member States used to choose their areas?. How relevant was this method and choice?
Three main methods, ranging from open competition to restricted and closed calls, with the first two being most common. Although areas were often selected because they were deprived (and therefore most in need) other considerations included targeting areas that had not received funding from other sources (almost as compensation) and a focus less deprived areas (with more opportunity for revival with smaller amounts of URBAN funds). There was no evidence to suggest that a particular selection method was any better than another when it came to the levels of outputs or impacts achieved.
What were the main challenges of URBAN II areas and what were the key features of the strategies deployed to tackle them?
All programmes were in areas suffering significant economic, social and physical problems. Although all had different local contexts, and within these a wide range of challenges, many programmes dealt with the symptoms of de-industrialisation (vacant land, high unemployment, poor business growth and the associated social problems).
Derived from their approaches and strategies to tackle this complex group of problems, the programmes could be grouped into two large clusters:
- a social and economic regeneration group consisting of 40 programmes (programmes with generally high spend on social inclusion and entrepreneurship/employment and lower spend on ICT and physical and environmental regeneration, although some did have significant budgets in this area)

39
- a physical regeneration group consisting of 30 programmes(programmes with high spend on physical environment and lower spend on social inclusion and entrepreneurship/employment).
Was there a gap between theory and practice? Was URBAN experienced as a solution to the most pressing problems 'on the ground'.
Any gaps were relatively minor. As they progressed through their delivery period, programmes tended to ‘tweak’ their activities rather than fundamentally alter them from their original plans. Despite socio-economic conditions changing over the lifetime of URBAN II, the initial major challenges identified at the beginning of the programmes life remained constant throughout the delivery period, which in turn led to consistent and stable programme objectives. However, examples highlighted in this section and others in the case studies show that programmes did respond to emerging issues and changes to their target areas and target populations when required. URBAN II also tended to respond to the most pressing problems in target areas and was used by cities to tackle large scale and fundamental local challenges that had tended to exist in programmes areas for some time.
How successful has the integrated approach promoted through URBAN II been?
The impacts of adopting an integrated approach on the level of outputs achieved was less obvious. There was no evidence to clearly show that a programme adopting an integrated approach achieved more outputs or hit more targets, compared to programmes that were less integrated. However, stakeholders felt that integration promoted a better use of resources (as partners often joined up funding to tackle one single problem) and less duplication which in turn helped generate better outcomes for the project in question. Programmes also recognised that the root causes of a problem such as poor health were related to physical (poor housing) and economic drivers (access to services and appropriate medication), rather than simply about health circumstances. This was a further benefit of the integrated approach which promoted links between the different themes. However, actually how much this improvement in the delivery of the programmes increased levels of, for example, jobs created or businesses supported was difficult to quantify. These issues are covered in more detail in Section 3 and 4 of this report.

40
3.0 Review of Outputs, Results and Impacts of URBAN II
3.1 Introduction
This section reviews the outputs, results and impacts of URBAN II based on data from the 2006 Annual Implementation Reports (AIRs) and information from the 15 case studies. It identifies how programme areas have changed and explores the extent to which URBAN II programmes were a driver. The outputs, results and impacts of URBAN II are presented under the three themes - physical, economic and social - and the factors that underpinned the achievements of URBAN II are highlighted.
The evidence informing this section is both qualitative and quantitative. The AIRs provided the quantitative information as they recorded the output, result and impact indicators from monitoring data collected by individual programmes23. The qualitative evidence comes from the case studies, which was a rich source of information on impacts that were not necessarily measured or picked up through any monitoring or evaluation process. Most of the main impacts and benefits identified by case study consultees were non-quantifiable, or not quantified, and not recorded in any of the AIR documentation we reviewed. Hence the case studies were a strong source for this section.
3.2 Summary of key findings
• We found evidence of positive change in 13 of the 15 case study programme areas over the period of URBAN II, and the majority of local stakeholders felt that programme areas had generally got better. Positive change was identified through improved performance in relation to economic, health, crime, education and other data. There was also evidence of, the improved physical appearance of neighbourhoods, and also improvements such as a new image and increased business confidence which are difficult to measure (or were not measured).
• URBAN II tended not to be the main driver of change, but was one of a number of reasons for areas generally improving. URBAN II supported successful projects that were well received and achieved high levels of outputs, but this did not necessarily lead to any obvious, or at least measured, improvements in deep-seated deprivation.
• The intensity of URBAN II, in terms of financial and geographical scope, set against the scale of the issues facing programme areas, was often the main reason why URBAN II was not seen as a principal driver of change.
• Despite this, most stakeholders viewed the programmes in a positive light and deemed URBAN II a success – partly because they never expected URBAN II to fundamentally reverse long-term decline, but also because the programmes supported a wide range of largely successful projects that helped to address economic, social and physical development.
23 The AIRs were the most up-to-date source of programme information at the time of our evaluation, but their timing means that
they will not have gathered evidence on all the programme results and impacts. This needs to be borne in mind when
considering the progress of URBAN II programmes.

41
• Stakeholders highlighted the URBAN II ‘method’ as the key impact and benefit, more than the funding itself. Although the funding supported strong projects, local stakeholders saw URBAN II 'methods' including the promotion of integration, its flexibility, its partnership building and its local agenda as the main impacts and also the main legacy. Stakeholders saw URBAN II funding as a key way to encourage urban development practitioners to embed these new types of working and as a tool that stimulated cities to approach their regeneration agendas in different ways. The URBAN II 'method' is also dealt with in Section 4 of this report which looks at implementation and delivery issues.
• The scale of outputs and impacts achieved shows that programmes supported a range of varied activities which had an impact on a whole host of issues connected with urban decline. Even though it is difficult to aggregate data (mainly because programmes could decide upon their own indicators for monitoring purposes) there are many quantified outputs for improved physical, social and economic circumstances. Some of the key headline figures relating to URBAN II outputs include 982 training projects with 64,801 training places, 3.2 million sq m of green space created, 372 restoration projects, 593 community capacity building projects and 5,984 business support interventions.
• Most programmes made an initial study of their challenges through detailed baseline assessments. These varied in coverage and some were updated to provide an ongoing information and knowledge base. In many cases there are good linkages between the challenges, the programme strategies and the projects, thus demonstrating a logical process. However, programme monitoring and evaluation systems designed to capture changes in the programme area and the impact of URBAN II were patchy, and very poor in some cases.
3.3 Changes within the programme areas
Table 3.1 shows that most programme areas experienced some positive socio-economic changes, with 13 out of 15 case study areas seeing a general improvement over the timeframe of URBAN II. Although some of this change manifested itself in statistics (e.g. educational attainment, health levels): it was also evidenced through the perspectives of stakeholders, many of whom perceived that their areas looked better, communities felt safer, traffic congestion had fallen, the area’s image had improved or businesses felt more confident. Many of these changes were not quantified and where changes could have been measured additional primary research would have been required (something that most programmes did not do).

42
Table 3.1 Changes and drivers in URBAN II programme areas
Case study area
How the programme area changed during URBAN II Was the URBAN II programme a driver of change?
Arhus There have been positive changes in respect of participation in leisure and cultural activities and in crime reduction. The employment rate remained unchanged, standing at 47% between 2000 and 2004. The share of residents with a post-compulsory school education or higher showed a small improvement (from 53% to 54%), while the percentage of young people involved in leisure and cultural activities also showed progress (up from 50% to 68%). The most positive change has been in reducing the incidence of crime relative to other similar areas (it fell from 65 to 52 per 10,000 population).
On the basis of the available evidence, URBAN II was generally not regarded as a key driver of change in terms of socio-economic conditions. However, the evidence suggests that the programme had a positive impact on reducing crime (18% of funding was devoted to this). Key stakeholders commented that crime levels fell at a faster rate relative to other similar areas. The programme was a key driver of change in improving perceptions of the area among local organisations, the local council and, crucially, residents. A resident survey revealed that the majority felt more positive things were happening in the area (66% of respondents); the area’s prospects were looking brighter (64%); and there were more opportunities than at the start of the programme (73%).
Bristol Two key areas showing notable change over the course of URBAN II were educational achievement and crime levels. The number of pupils in the programme area achieving five A*-C GCSE grades doubled between 2005 and 2007. In the neighbourhood of Hartcliffe and Withywood, the proportion rose from 20.8% to 45.1% and for the neighbourhood of Knowle West from 15.3% to 32.1% over the programme period. This change compared favourably with the results for Bristol, which over the same period saw an increase from 35.3% to 45.6%. The crime statistics suggest an improvement towards the end of the programme, with total crime falling by 16% in Hartcliffe and Withywood and 28% in Knowle West, compared with just 6% in the city overall.
The case study evidence indicates that URBAN II was a key driver of change for educational attainment and crime levels. A number of key stakeholders were convinced that URBAN II had contributed to conditions fostering better educational attainment by raising young people’s aspirations and encouraging them to achieve academically. The picture is more complicated for crime levels because of challenges in isolating and quantifying the contribution of URBAN II to reducing crime. However, stakeholders perceived that improvements in crime statistics can be linked to raised expectations and new facilities for young people, supported by URBAN II.
Carrara Stakeholders commented that the main change evident was the reversal in the process of decay, which has created the basis for the urban renaissance of the programme area. Improvements to the physical infrastructure, including an urban bypass, and the restoration of areas damaged by a flood (2003) were the most apparent changes. Updated statistics demonstrating how the programme area has changed was lacking, although figures provided by the Management Authority indicate that dust pollution
The existence of other urban regeneration strategies and funding regimes in Carrara meant that URBAN II’s role was important but not the main driver. URBAN II provided the funds to help reverse the process of decay and restore areas damaged by the flood, and to prepare for future urban renaissance. The physical revitalisation of the centre of Carrara supported by URBAN II was felt to have been particularly important in stimulating an increase

43
Case study area
How the programme area changed during URBAN II Was the URBAN II programme a driver of change?
fell by 32% and transit of heavy goods vehicles through the historic centre by 22%.
in commercial, productive and tourism activity.
Crotone Stakeholders felt that it was difficult to see any real changes over the period of the URBAN II programme. The limited statistics that are available show that the area has continued to be one of the worst in Italy (although the figures are at the city level). Stakeholders were hesitant to pinpoint any real areas of improvement.
URBAN II does not seem to have acted as a driver of change in socio-economic conditions. Stakeholders doubted that the programme brought about any real or meaningful changes in addressing the area’s problems, because of its limitations in scale and the fixed term nature of the programme.
Dortmund Although socio-economic indicators suggest that conditions have worsened from the original baseline situation, the management team pointed out that the Nordstadt is now a more attractive place to live and that local facilities have been improved. Depopulation was still a particular issue (the population of the Nordstadt fell by 2.6% between 2000 and 2008 compared with 0.8% in Dortmund as a whole), as was the creation of new employment opportunities (although new jobs were created in the programme area, they were more than offset by job losses over the course of the programme). Also, in both the Nordstadt and Dortmund, long-term unemployed people accounted for a larger proportion of all unemployed people in 2008 than in 2000.
URBAN II brought about changes that were unlikely to have occurred in the absence of EU funding support. Where change was evident (improved public spaces, buildings and services and facilities), URBAN II was regarded as a key driver; stakeholders commented that the majority of projects would not otherwise have taken place. URBAN II has also helped to develop economic structures and social support networks that are likely to assist future development and improve community cohesion.
Gijon Stakeholders regarded the main changes to be improvements in the programme area’s physical appearance and the recovery and growth of the economy. Key changes include the regeneration of industrial sites (which have been converted into residential areas) and the creation of new green areas and public spaces. Key changes from the baseline position included a reduction in the unemployment rate in the URBAN II area, down from 18% to 14% in 2006 (a 4.3% reduction compared with 3.1% across Gijon as a whole). Equally, the percentage of people applying for a licence to start a business also showed improvement (rising from 15% in 2001 to 25% in 2006), as did the percentage of local residents with tertiary or upper secondary educational attainment (up from 20.5% in 2002 to 33.1% in December 2004).
Key stakeholders perceived that the URBAN II programme was one of several drivers of change, but played an important role in improving urban public space in the western part of Gijón, which in turn has led to a substantial increase in residents’ standard of living. Stakeholders also commented on the rate of change in local socio-economic conditions as a key factor as to why they believed URBAN II had driven change – which was felt to be more significant in the URBAN II area compared to other parts of the city.
Graz Stakeholders perceived a major physical transformation in the URBAN II area (including a new transport hub, railway
There is little evidence to suggest that URBAN II acted as a key driver of change in socio-economic

44
Case study area
How the programme area changed during URBAN II Was the URBAN II programme a driver of change?
underpass, library and crèche). Quantitative data to substantiate changes as compared to baseline conditions was generally lacking. However, despite large scale physical improvements, there was some evidence of depopulation between 2000 and 2006 (compared to 8% growth in the city as a whole), explained by people not wanting to live in the neighbourhood and choosing to move out whenever possible. Unemployment rate grew by 0.8% between 2000 and 2008 (a slower rate than for the city as a whole).
conditions in Graz; other external issues have been important in stimulating change. Stakeholders perceived that without URBAN II, some redevelopment work would have taken place, but at a much slower rate and less strategic in focus. Consultees also agreed that the prospects for future development had been greatly enhanced as a direct result of URBAN II investments to improve the business infrastructure (for example, high profile businesses are starting to move into the area).
Halifax Socio-economic conditions in Halifax improved between 2000 and 2007. The unemployment rate in the URBAN II area fell from 6.5% in 2000 to 4.7% in 2007. This fall of 1.8% was higher than in surrounding Calderdale, which saw a drop of just 0.4% over the same period. The proportion of long-term unemployed people also fell sharply, from 21% in 2000 to 13% in 2007. In education, the percentage of pupils obtaining five or more GCSEs at grades A*-C increased from 28% in 2000 to 50% in 2007. The weakest area of performance over the course of the programme was in stimulating new enterprise development in the programme area.
It is difficult to isolate URBAN II’s role in driving change in Halifax, because of the Single Regeneration Budget (SRB) programme which ran over the same period. However, stakeholders stated that key indicators such as unemployment have improved at a faster rate within the programme area than in other comparable areas because of the existence of URBAN II. They therefore regarded it as a key factor (along with the SRB programme) in driving change as compared to baseline conditions.
Le Havre The most apparent changes related to physical regeneration of the programme area, particularly new public and private sector housing. The picture was mixed regarding changes in socio-economic conditions. While unemployment rates had reduced, youth and long-term unemployment remain a key problem (25% of the total of unemployed people were 25 or younger and 33% were long-term unemployed). However, more positive was the growth in the number of companies located in the URBAN II area, which rose by 21% over the period 2000-2008 compared with growth of 14% in Le Havre as a whole.
The evidence strongly supports the assertion that URBAN II has been a key driver of (positive) change, most prominently in catalysing physical regeneration of the programme area. Key stakeholders were keen to point out that URBAN II was a key driver in enabling the Managing Authority to lever in additional private sector investment (every euro invested through URBAN II was matched by more than €10 of private investment). This enabled the programme to have a much greater impact in the target area than initially envisaged. It was also highlighted that in the absence of URBAN II, a number of additional spin-off benefits (such as the relocation of three universities, a private hospital and the Chamber of Commerce) would not have taken place.
Le Mantois The main changes relate to improvements in physical appearance and infrastructure. The target areas have changed in their housing offer, with existing social housing being improved and new housing created. They also changed aesthetically, with
As URBAN II resources were integrated into a much broader pot of regeneration funding (ERDF represented only 10% of the total budget), it is difficult to say that the programme played an important role in

45
Case study area
How the programme area changed during URBAN II Was the URBAN II programme a driver of change?
stakeholders commenting on improvements to green and other public spaces as well as to public services. However, the programme area has fared poorly compared to the French average in terms of changes to baseline conditions. For example, the employment rate remained well below the French average of 63% in 2006, while the unemployment rate was again well above the French average of 12% in 2006.
driving change. Key stakeholders mostly commented on how URBAN II funding helped to change the image and physical appearance of the programme area. By driving these changes (particularly in the physical environment), URBAN II was regarded as a key element in creating the building blocks for future development, particularly in improving socio-economic conditions compared to baseline statistics.
Leipzig Neighbourhoods differed in terms of changes over the course of the programme. For example, Plagwitz performed very well and has developed a role as a fashionable neighbourhood for young artists, start-ups and students. The total number of businesses increased between 2000 and 2007, with a 54% rise in Plagwitz. However, Lindenau and Altlindenau performed less well and saw a decrease in employment levels over the course of the programme. Between 2000 and 2007, the unemployment rate in the programme area increased by 21%, with long-term unemployment up to almost 50% of the total (compared with the city average of 45%). Lindenau and Altlindenau saw the main increases in unemployment.
Whilst the severe socio-economic conditions in Leipzig’s programme areas restricted change, URBAN II has helped to start the process of recovery and improvement. As a result of the €19m spent through URBAN II, a further €127m from national government and private investors was released. In neighbourhoods where more change was evident (such as Plagwitz), URBAN II funded activities that built on existing activities within the local economy therefore reinforcing further development.
Perama Statistical information to show changes to baseline conditions over the course of the programme was not available. However, stakeholders commented that the programme area changed for the better in terms of physical regeneration. The main changes were improvements to public squares and the creation of the new maritime museum and open air theatre. This was thought to have stimulated a change in commercial activity in the areas surrounding the squares and increased tourism through the museum and theatre. The issue of social exclusion was also tackled (by providing new and additional social services), although there is no exclusion-related data to suggest how matters have actually changed.
On the evidence available, URBAN II cannot be considered a key driver of change in socio-economic conditions in Perama. URBAN II funds were used to create new and additional social services in the programme area in order to tackle social exclusion. But how far these new services have impacted on socio-economic conditions and therefore acted as a key driver of change is not clear. However, stakeholders regarded URBAN II as a catalyst of change in the physical appearance of the programme area.
Porto Gondomar
Statistical information to provide a clear picture of any socio-economic changes in the programme area is lacking. Stakeholders found it difficult to identify any key changes because the problems are so deep-seated, being linked to de-industrialisation (i.e. unemployment) and an unbalanced economic base. However, noticeable physical improvements have been made to public spaces and to the public services on offer to local residents (e.g.
URBAN II has not been a key driver of change in socio-economic conditions. Other national regeneration and development programmes existed during the life of URBAN II, which makes it harder to isolate the role of URBAN II. However, URBAN II helped to establish a programme of physical regeneration in the target area, as a result of which derelict neighbourhoods have better

46
Case study area
How the programme area changed during URBAN II Was the URBAN II programme a driver of change?
educational, cultural and sporting activities). access, new and improved street furniture and green spaces, improved facades and better equipped youth centres. Alongside the physical projects, the programme also improved access to services for those most at risk, such as elderly people, school children and drug addicts.
Rotterdam Quantitative evidence to show how the programme areas have changed is lacking. The most apparent changes relate to physical appearance, including improvements to public spaces, renovation of the railway station and other transport improvements. While a number of economic measures related to the support of local businesses performed well, evidence to indicate how socio-economic conditions have changed since the baseline analysis is again limited. The only other change relates to an improvement in public perceptions on crime and safety issues.
Although it is not possible to clearly identify the role played by the programme in improving socio-economic conditions in the programme area, it has driven change regarding some of the most pressing issues. The most obvious area where URBAN II encouraged change is in improving physical appearance and infrastructure. It has also clearly played a role in addressing crime and safety and social exclusion issues.
Sambreville Updated baseline analysis indicators do not suggest any significant improvement in socio-economic conditions. The strongest area of performance related to unemployment, with the unemployment rate in Sambreville decreasing by 2.9% between 2001 and 2008 and the percentage of people classified as long-term unemployed decreasing by around 10% between 2001 and 2008 (from 68.5% to 62%). However, other socio-economic indicators deteriorated over the course of the programme. For example, the number of active companies decreased by 13.8% between 2001 and 2007 (from 1,358 to 1,170). The percentage of crimes per 1,000 inhabitants increased by 21.8% between 1999 and 2003 (from 7.2 to 8.7) compared with a decrease of 11.4% in Belgium overall. The number of beneficiaries on welfare benefits as a percentage of the population increased from 10.8% to 12.8% over the same period.
URBAN II did not acted as a key driver of change in socio-economic conditions in Sambreville. For example, although URBAN II funded economic measures aimed at improving employability prospects and creating job opportunities for local residents, the unemployment rate fell at the same rate as that in Belgium overall.

47
That broader and external issues dominated the local effects of URBAN II is illustrated by comparing the unemployment rates of URBAN II programme areas with those of the wider city. Table 3.2 shows data for the 37 programmes where reliable unemployment figures for the programme area and host city are available from 2000-2006. Unemployment rates in programme areas were strongly influenced by trends in the parent cities, with the 37 cases showing that percentage change figures for programme area and host city were similar. This again points to macro-economic changes at city (or regional and national) level being greater influences on the economic position of URBAN II programme areas than the activities of the URBAN II programmes.

48
Table 3.2 Unemployment for URBAN II programme areas compared to host cities
City Unemployment rate of URBAN II area 2000
Unemployment rate of URBAN
II area 2006
Change in area
unemployment rate between
2000 and 2006
Unemployment of city in 2000
Unemployment of city in 2006
Change in unemployment between 2000
and 2006
Unemployment difference (URBAN II-City) (2000)
Unemployment difference (URBAN II-City) (2006)
Change in difference
(2000-2006)
S.Adria de Besos
26.9% 16.3% -10.6% 9.6% 6.7% 2.9% 17.3% 9.6% -7.6%
Dortmund 26.5% 31.6% 5.1% 14.1% 18.1% 4% 12.4% 14.5% 2.1%
Kassel 26.7% 24.5% -2.2% 16.2% 18.4% 2.2% 10.5% 6.1% -4.4%
Mannheim-Ludwigshafe
20.4% 23.9% 3.5% 10.3% 10.3% 0% 10.1% 13.6% 3.6%
Clichy-Montfermeil
19.1% 22.6% 3.5% 9.3% 8.1% -1.2% 9.8% 14.5% 4.7%
Ballyfermot 11.7% 9.7% -2 2.3% 3.7% 1.4% 9.4% 4.0% -5.4%
Arhus 12.2% 11.9% -0.3% 5.1% 6.1% 1% 7.1% 5.8% -1.3%
Dessau 27% 22.2% -4.8% 20.4% 17.2% 3.2% 6.6% 5.0% -1.6%
Jaen 25% 18.5% -6.5% 19% 13.1% 5.9% 6.0% 5.4% -0.6%
Amsterdam 15.1% 10.4% -4.7% 9.2% 8.7% 0.5% 5.9% 1.7% -4.2%
Grigny/Viry 14.1% 15% 0.9% 9.3% 8.1% -1.2% 4.8% 6.9% 2.1%
Göteborg 11.3% 11.4% 0.1% 6.8% 7.1% 0.3% 4.5% 4.3% -0.2%
Kiel 14.4% 18.7% 4.3% 10.8% 12.7% 1.9% 3.6% 6.0% 2.4%
Vienna 9.3% 6.9% -2.4% 5.8% 8.8 3% 3.5% -1.9% -5.4%
Pamplona 12% 7.7% -4.3% 8.6% 3.4% 5.2% 3.4% 4.0% 0.7%
Rotterdam 13.6% 16.3% 2.7% 10.4% 10.9% 0.5% 3.2% 5.4% 2.2%
Heerlen 11% 12% 1% 8% 9% 1% 3.0% 3.0% 0.0%
Graz 8.4% 9.2% 0.8% 5.5% 6.8% 1.3% 2.9% 2.4% -0.5%

49
City Unemployment rate of URBAN II area 2000
Unemployment rate of URBAN
II area 2006
Change in area
unemployment rate between
2000 and 2006
Unemployment of city in 2000
Unemployment of city in 2006
Change in unemployment between 2000
and 2006
Unemployment difference (URBAN II-City) (2000)
Unemployment difference (URBAN II-City) (2006)
Change in difference
(2000-2006)
Helsinki/ Vantaa
12.7% 12.2% -0.5% 10% 7.8% 2.2% 2.7% 4.4% 1.7%
Stockwell 5% 5.5% 0.5% 3.2% 3.3% 0.1% 1.8% 2.2% 0.4%
Peterborough 3.5% 2.9% -0.6% 2.3% 2.7% 0.4% 1.2% 0.2% -1.0%
Halifax 4.2% 4.5% 0.3% 3.2% 6.2% 3% 1.0% 1.7% 0.7%
Normanton in Derby
4.7% 5.5% 0.8% 3.7% 3.4% -0.3% 1.0% 2.1% 1.1%
Burnley 3.2% 2.8% -0.4% 2.3% 2.6% 0.3% 0.9% 0.2% -0.7%
Berlin 17.7% 18.1% 0.4% 17.6% 20.1% 2.5% 0.1% -2.0% -2.1%
Sambreville 20.1% 21.9% 1.8% 20.1% 21.8% 1.7% 0.0% 0.1% 0.1%
Antwerp 9.8% 12.6% 2.8% 9.8% 11.7% 1.9% 0.0% 0.9% 0.9%
Wrexham 2.2% 2.7% 0.5% 2.3% 2% 0.3% -0.1% 0.7% 0.8%
Hetton & Murton
3.6% 4.7% 1.1% 3.7% 2.9% 0.8% -0.1% 1.8% 1.9%
Bristol 2.4% 1.9% -0.5% 2.9% 2.4% -0.5% -0.2% -0.5% -0.3%
Thames Gateway
3.0% 2.6% -0.4% 3.2% 3.3% 0.1% -0.2% -0.7% -0.5%
Gera 17.5% 20.4% 2.9% 17.9% 18% 0.1% -0.4% 2.4% 2.8%
Neubranden 17.4% 22% 4.6% 17.9% 19.4% 1.5% -0.5% 2.6% 3.1%
Leipzig 16.2% 18.2% 2% 17.3% 20.8% 3.5% -1.1% -2.6% -1.5%
Saarbrücken 8.8% 8.1% -0.7% 10.1% 10.8% 0.7% -1.3% -2.7% -1.4%
Gijon 22.6% 14% -8.6% 24.6% 14.2% -10.4% -2.0% -0.2% 1.8%
Teruel 4% 5.9% 1.9% 7.6% 5% -2.6% -3.6% 0.9% 4.5% Source: ECOTEC analysis of data collected from the member states and the programme managers

50
Developing a counterfactual to assess the impacts of URBAN II
The terms of reference called for a counterfactual analysis. This can be a very powerful tool to measure impacts and is increasingly popular for instruments such as enterprise support and active labour market measures. The intention was to pilot this for URBAN II, to see whether the method could be applied to urban regeneration in the future.
The key feature of the method is the construction of a comparison or control group. Each URBAN II area would be paired with a relevant comparison area (for example, the parent city or a similar deprived neighbourhood elsewhere in the city). If the sample is large enough and the data is of good quality, comparing the performance of the two groups indicates the average impact of URBAN II.
The inception report set out the various approaches and data sets that could be used, concluding that in urban policy three indicators (unemployment, long-term unemployment and population) could – given data availability – be used as the basis of a counterfactual analysis. Further work for the interim report effectively ruled out long-term unemployment and population, mainly because of data issues. The analysis was therefore undertaken on unemployment change between 2000 and 2006, comparing URBAN II programme areas with the wider city within which they were located. Even this had data availability difficulties – most programmes had not collected unemployment rates both before and after the intervention, and data could only be collected or constructed for 37 of the 70 programmes.
Using a difference-in-difference technique, we undertook a range of analyses. However, none produced statistically significant results. This was partly because the impact on unemployment was relatively small, but also because of the small sample size and high variation in performance. The gap in unemployment levels between the more disadvantaged URBAN II areas and their cities narrowed, although this too was not statistically significant. With better data from more programme areas, this would be an interesting ‘finding’ to test further.
However, as noted above, URBAN II funding was relatively modest and many programmes did not target unemployment. In this context, programmes were unlikely to create dramatic changes in unemployment.
For future evaluations of this type, a key lesson is the importance of establishing the counterfactual analysis ex-ante rather than ex-post. Better ‘before’ and ‘after’ data, covering all the programmes and a broader range of indicators (not just unemployment), would give a much clearer picture of impact.

51
3.4 Drivers of change
A number of drivers caused programme areas to change, one of which was the URBAN II programme. Although stakeholders felt that URBAN II was a contributing factor, it was not generally seen as the principal driver of change – other, larger, external forces generally underpinned area improvements.
Physical regeneration – URBAN II helped to reverse urban decay, created transport hubs and new transport facilities, developed new community facilities (museums, libraries, and crèches) and improved public spaces. Most of these changes improved the attractiveness of the area.
Economic regeneration – projects boosted entrepreneurialism, supported business creation and growth and the (small-scale) development of industrial sites. Supporting people into employment was another key aspect of URBAN II measures.
Social regeneration – projects helped to reduce crime, improve educational performance, improve the skills of local people and support disadvantaged groups (especially young people) in various ways.
A key improvement factor was wider economic conditions. URBAN II was implemented at a time when most Member States and host cities were experiencing relatively high levels of economic growth. Stakeholders commented that wider economic prosperity within the host city had a beneficial impact on URBAN II programme areas, which experienced growth in new job opportunities, more business start-ups and higher standards of living as a consequence. For example, unemployment within the programme area in Sambreville dropped because of an improvement in the region’s economic situation, which led to unemployment falling in the whole area at the same rate as in the programme area.
The work and funding of wider regeneration programmes were also underlying factors, particularly where URBAN II targeted a relatively small part of a large host city which was being supported by various regeneration initiatives. The projects and activities of other programmes were often cited as being more important than URBAN II in changing areas because they had larger budgets and were longer term. Le Mantois is a good example; the host city received more sustained intervention from the government prior to and during URBAN II, which stakeholders felt was the important factor contributing to the area’s regeneration work.
The work of other non-URBAN II-funded organisations also supported the regeneration objectives of the target neighbourhoods within programme areas. The police and local authorities were particularly cited as key drivers of change, and their ongoing work on various economic, social and physical development activities were important factors of the wider improvement of programme areas. For instance, the city police force in Le Mantois, targeting more neighbourhood-based resources on the programme area, was seen as the main reason why crime had reduced in recent years.
Investments and improvements in other parts of the city were also important factors affecting target neighbourhoods. Physical and economic improvements to the centre of the host city were often seen to stimulate better job opportunities, better business prospects and more investment activity in nearby (URBAN II) neighbourhoods. For example, in Porto Gondomar, large-scale physical investment in the city

52
centre to improve the tourism offer was, according to stakeholders, a key factor that led to URBAN II target communities finding new jobs. The same can be said about Halifax, where large economic growth in the nearby and larger city of Leeds meant that more people in the target community were accessing new employment.
The drivers underlying change within target neighbourhoods were relatively complex, but can be seen as operating at a wider level than the localised agenda of URBAN II. Stakeholders identified many drivers (including most of the above) as being external to the target neighbourhood, with activity, funding and decisions at city and national levels (including macro-economic policy) all having a large bearing on target neighbourhoods. They felt that URBAN II was one of a host of factors that caused areas to improve.
Whilst URBAN II has been a factor in areas changing, it was usually not the main driver. The main reasons for this were as follows:
• Time-limited nature of URBAN II – stakeholders felt that programmes running for seven years were unlikely to make any real headway in solving long-term and deep-seated issues. No matter how successful the projects were, their time-limited nature (and some ran for a lot less than seven years) meant that they were only likely to make an initial and short-term impact on major urban decline issues. Delays in implementing some programmes (e.g. Crotone) exacerbated this problem and further reduced the amount of time they had to make a positive difference. Delays in recruiting key staff, deciding priorities and developing a strong partnership held up programmes too, although these were not particularly common problems across the case study areas.
• Lack of scale in investment – stakeholders saw the scale of URBAN II investment as unlikely to affect significant issues such as high unemployment or poor health. Even when a programme focused on a relatively small area, the level of investment which stakeholders felt would be required to ‘shift’ long-term problems was larger than the resources available through URBAN II.
• Targeted at one area of the city – stakeholders felt that some of the real causes of deprivation were found elsewhere in the host city and not in the target neighbourhoods. For example, the closure of a large employer in another part of the host city was often seen as the main cause of decline in target neighbourhoods; the root causes and symptoms of urban decline were not always to be found in the same part of the city.
Therefore, the intensity of URBAN II, in relation to the scale of its funding and its longevity, was an overarching issue affecting the extent to which programmes were able to influence change, particularly considering the wider and external drivers of change mentioned earlier. Notably, most stakeholders did not feel that poorly performing projects or badly run programmes – in the small amount of cases where this was perceived to be an issue - were the main reasons why URBAN II was not a key driver of change.
3.5 Programme logic: challenges and strategies
This sub-section assesses whether programmes were developed in a logical way.

53
3.5.1 Did programmes follow a logical process?
From our review of the programme documentation together with the stakeholder consultations in the case studies we made an assessment of the extent to which programmes were developed using a logic process, starting with the definition of problems and challenges through to objectives and targets, the programme strategies and the processes to assess change and the impacts of URBAN II.
The start of a logical process in developing strategies and programmes is a relevant, focused and accurate baseline analysis. Most programmes undertook wide-ranging baseline exercises, presenting statistics on socio-economic conditions within the programme area, often regardless of whether the programme was designed to impact on those conditions. Although this was to be expected early on (to understand the broad issues before focusing on a smaller range of problems), many programmes carried on collecting updated data on (for instance) health or crime, even though the programme focused on economic activity. This meant that changes in these issues would show little in terms of the direct successes of the programme.
Having assessed the key challenges the next step is the development of the programme strategy, based on an assessment of the challenges and what could be realistically achieved within the resources and timescales of URBAN II. We assessed the case study programmes (as shown in Table 3.3) to see how far strategies were informed by the baseline analysis. Roughly half demonstrated a strong logic chain between challenges and the programme strategy, although a logic chain could be rationalised in some of the remaining case studies. However, in a few cases, the link between defined challenges and the programme strategy was not clear.
Table 3.3 Programme logic across case study areas
Case study area Problems Strategy Match between challenges
and strategy
Arhus Key problems related to socio-economic issues, including high crime and unemployment levels, low educational attainment and low participation in leisure activities, as well as particular challenges related to integration of the growing share of minority ethnic groups, some of which lacked the necessary skills to enter the labour market.
The programme focused heavily on social and cultural regeneration. It included a number of measures to promote participation in culture and leisure activities, personal responsibility, community cohesion and self-organising, entrepreneurship, vocational training, IT skills and upgrading green recreational facilities.
Despite the high unemployment and low skill levels amongst the target population, only a relatively small proportion of resources (24%) was set aside for tackling these issues. In comparison, integration through leisure and cultural activities (47% of resources) and tackling drug/alcohol addiction (18%) received high levels of funding. However, rather than focusing explicitly on traditional economic and social interventions, the programme looked to stimulate social and economic integration by implementing a range of measures and placing

54
Case study area Problems Strategy Match between challenges
and strategy
residents at the heart of regeneration.
Bristol High levels of unemployment, benefit dependency and crime rates, as well as low economic activity and educational attainment levels, were key issues in the target areas. Young people were highlighted as a particular target group.
The programme elected to place young people aged between 10 and 30 at its heart, and set out to support projects with a strong focus on developing opportunities and provision for youth.
The programme logic appeared to be extremely strong, with a clear link between the baseline conditions in the target area and solutions developed to tackle those problems. A scoping study helped to shape the programme’s focus and identified key issues to tackle. Young people were heavily involved in developing the projects delivered through URBAN II. This helped the programme to maintain its focus on tackling youth issues and ultimately to address the key problems of low educational attainment and crime.
Carrara The main challenges were environmental problems in the historic city centre and related social unease, tension and depopulation. The unemployment rate in the target area at the start of the programme was also highlighted as a key issue.
The programme focused heavily on tackling the physical and environmental issues in and around the historic city centre and arresting the decline in population and productivity rates in the target area. Physical regeneration of the target area and improvements to the surrounding transport infrastructure accounted for the majority of programme resources (80%).
Despite some reprogramming (because of flooding in 2003), the programme logic largely remained intact, with its strong focus on tackling physical and environmental problems in the target area. The decision to use the physical revitalisation of the centre of Carrara as a means of stimulating an increase in commercial, productive and tourism activity was also sound, although only a small proportion of resources were devoted to the economic theme (9%). But devoting only 5% of resources to social inclusion does not seem logical, given

55
Case study area Problems Strategy Match between challenges
and strategy
its mention as a key issue in the baseline analysis.
Crotone The target area was experiencing many problems relating to employment (it had the lowest employment level for the whole of Italy prior to 2000), while the unemployment rate was also high. The level of crime (particularly car crime) was also regarded as a key problem.
The programme had a strong physical focus, with regeneration of the historical centre a key objective (80% of resources). The desire to make the historical centre more attractive was also key to achieving the other programme objectives of addressing the abandonment of the city centre by stimulating tourism activity. Improvements to the transport infrastructure and social services were also identified as objectives.
The programme did not appear to have a strong logic, with little link between problems and strategy. The main challenges highlighted related to labour market deficiencies (low employment and high unemployment); however, only 13% of funding targeted entrepreneurship and employment activities. The majority of funding was focused on physical rehabilitation and revitalising cultural and social activities.
Dortmund The main challenges were high unemployment (especially among young people and migrants), poverty and risk of exclusion, low educational attainment levels, an unbalanced economy, sub-standard living conditions and a poor external image. The target area was affected by high population turnover rates, with more successful residents moving out to be replaced by more disadvantaged groups.
Most resources were focused on entrepreneurship and employment (42%) and physical and environmental measures (33%), with 15% devoted to social inclusion. The main priorities were creating and preserving jobs; improving the urban fabric and housing; developing structures for residents in commerce, housing and culture; and promoting social cohesion.
The programme logic was strong, with close links between the problems highlighted in the baseline analysis and the strategy developed. A study of the strength and weaknesses of the programme area supplemented by intensive consultation with local partners and residents, and helped to ensure that the programme strongly reflected local needs and conditions.
Gijon The main problems were the poor environmental conditions, the lack of social services and urban infrastructure for citizens to access (e.g. green space), high unemployment levels, a lack of employment opportunities, and
The programme focused on the physical problems in the target area, including infrastructural weaknesses and lack of public space (61% of resources). However, this was not at the expense of economic and social measures, where improving residents’
The programme logic was strong. The solutions developed closely matched the problems initially highlighted in the area and amongst key target groups. The programme logic was also reflected in the programme’s quantifiable achievements, where a number of key targets were

56
Case study area Problems Strategy Match between challenges
and strategy
depopulation. employability, fighting social exclusion, boosting economic activities and facilitating the use of ICT and broadband access for citizens and SMEs were also objectives.
exceeded (for example, in relation to improving public spaces and narrowing the digital divide).
Graz Key problems in the target area included depopulation (although this had been stabilised by a growing minority ethnic population) and high levels of social disadvantage and unemployment. Other problems included a shortage of kindergarten places, high crime levels and a poor external image.
Nearly half (49%) of the URBAN II resources were allocated to the target area’s economic needs, with 40 projects under this measure. Two key projects were the relocation of the technical college and establishment of a business start-up centre.
There was a limited direct link between the problems highlighted and solutions developed. Project ideas largely came from the local authority departments based on pre-existing plans and strategic priorities for the area agreed previously (although this is not to say that the plans were not well considered or successfully implemented).
Halifax Key problems included relatively high levels of worklessness, poor educational attainment, low skills levels, high crime rates, poor health and poor quality housing.
The URBAN II programme had a strong focus on economic regeneration, with a particular interest in enterprise development and growth (about 70% of projects had links to the economic and enterprise agenda). This focus on economic regeneration was partly driven by the fact that another regeneration scheme (funded through the national SRB) also targeted virtually the same area as URBAN II.
Although many projects seemed to fit the programme logic and had a strong economic focus, others had a distinct social or physical theme, and no apparent association with the original logic of the programme. It can be argued that all projects would help to stimulate a more enterprising programme area, but a number of projects 'drifted away' from the strategic intent for a highly focused economic programme.
Le Havre The target area was not an attractive place for tourists, investors or residents. Key problems were access to and from the city and lack of green space. However, much of the quantitative baseline evidence was concerned with the poor socio-economic conditions and
Initially, the programme had a strong holistic feel with funding spread relatively evenly over the physical, social and economic measures. However, at the mid-term point the focus of the programme shifted to give greater emphasis (and resources) to
Considering the high levels of physical deprivation in the target area, the decision to change the programme’s focus is defensible. However, it could also be argued that the programme did not formulate an effective strategy for tackling the main problems and thus changed its focus to create

57
Case study area Problems Strategy Match between challenges
and strategy
the weak structure of the local economy. Prior to 2000, key problems included high unemployment and low employment rates, high levels of benefit dependency, poor access to job opportunities and low educational attainment levels.
physical actions, at the expense of the more socially focused interventions.
a more obvious and visible impact in the target area (by funding more physically focused interventions).
Le Mantois The target population was characterised by high levels of unemployment (including long term) and benefit dependency, low levels of educational attainment, poor access to labour market opportunities and high levels of crime. The target areas were also characterised by poor housing conditions and suffered from a poor external image.
The design of the programme aimed to improve the economic and social development of the area, reducing the social divide between rich and poor and upgrading the natural environment to improve and sustain its image and attractiveness. The biggest share of funding was allocated to the physical theme (63%), followed by the social (22%) and economic (11%) themes.
The programme logic is not strong when reviewing the key issues highlighted in the target area (mainly economic and social in nature) and the allocation of funding (mostly to physical measures). The programme was linked to a much larger national regeneration programme (Mantes en Yvelines II), so the target area’s social and economic needs may have been covered through other programmes.
Leipzig After the decline of the traditional industrial base, the programme area struggled to replace the large number of manufacturing and engineering jobs lost. The target population found it difficult to access new employment opportunities and was characterised by high levels of unemployment and benefit dependency. Significant urban problems included decaying living quarters and high vacancy rates, poor environmental conditions, a shortage of green and open spaces and derelict and brownfield sites.
The programme sought to arrest the decline of the target areas through an integrated programme of activity focused on environmental and infrastructure improvements, local economic and employment development, and social integration and renewal. The programme’s holistic nature was reflected in the funding allocation, which was evenly spread across the physical (35% of total budget), economic (33%) and social measures (26%).
The programme theory was logical, with a strong links between the problems identified and the strategy developed. Given that the target areas suffered from multiple forms of deprivation, it was appropriate that the programme tackled the main problems by developing many small but integrated projects with a holistic focus.

58
Case study area Problems Strategy Match between challenges
and strategy
Perama Many key problems related to the decline of traditional industries and lack of access to new employment opportunities. Other problems included low educational levels, low participation of women in the labour force, high unemployment rates (especially for women), pollution, a serious shortage of social care and health services, and an overall low quality of life.
The programme focused on physical and environmental regeneration, followed by interventions for social inclusion and a smaller intervention supporting entrepreneurship. In essence, the programme was designed to promote Perama’s long industrial and cultural tradition for the benefit of economic regeneration, to boost employment, upgrade the environment and improve the quality of life in the area.
Lack of quantitative information made it difficult to discern whether the balance of the programme accurately reflected the needs of the area. Qualitative evidence indicated a close match between the area’s needs and the strategy developed. The programme theory, which promoted a holistic approach to regenerating the target area, has generally been realised on the ground as planned in the inception stages.
Porto Gondomar
The urban environment was severely degraded prior to 2000, with many derelict buildings, a lack of green space and poor transport links. Residents in the target area suffered from multiple forms of deprivation and disadvantage, and had high levels of unemployment, low levels of educational attainment, with poor ethnic integration in some communities, isolated elderly people and high drug use and trafficking.
A holistic regeneration programme was developed with a strong focus on urban regeneration and tackling social exclusion. A significant proportion of resources (almost 60%) was devoted to regenerating the physical environment and improving services. Other key objectives included tackling drug/alcohol addiction and addressing the labour market disadvantages faced by the local population (particularly low skill and qualification levels).
The theory underpinning the programme was sound, with the strategy developed, closely matching the challenges identified. Although the programme had a strong physical focus, much of the activity funded under this theme also had a strong social dimension (through the creation of new educational, cultural and social facilities). The programme also targeted a number of key groups, including older residents and people with severe drug and alcohol problems.
Rotterdam The main problems related to the population structure (above-average levels of young people), difficulties in assimilating new migrants, high levels of unemployment and benefit dependency, low levels of educational attainment and high crime rates.
The programme was designed to tackle key problems related to crime, family breakdown (acknowledging that this was a source of multiple problems), and the physical environment, in particular the degradation of the target area, empty shops, lack of occupancy and lack of high quality areas in the neighbourhood. It also
The programme logic was strong overall, with many projects linked to the needs, particularly the activity focused on addressing community safety issues and interventions targeted at young people, but the reasoning behind allocating the highest proportion of funding to physical measures was not immediately apparent. This was in part because

59
Case study area Problems Strategy Match between challenges
and strategy
aimed to stimulate partnership working and community cohesion by encouraging community groups to work together. This holistic focus was generally reflected in the funding allocation, where physical (45%), economic (26%) and social measures (29%) all received sizeable amounts of investment.
complimentary regeneration initiatives operating with the programme area were also focus on economic and social measures and less on physical regeneration.
Sambreville Prior to 2000, Sambreville was characterised by high levels of unemployment and benefit dependency and a lack of professional qualifications among the working-age population (limiting access to employment opportunities in high growth sectors). The decline of old industry in the target area also led to physical degradation, making the city a relatively unattractive area.
The programme was holistic, with funding spread relatively evenly over the different themes and priorities. The largest share of the budget was allocated to physical and environmental regeneration of the area (45%), while 27% went on improving entrepreneurship and employment.
The programme strategy was in line with the identified challenges. Many of the problems were linked to the decline of the traditional industrial base, so it was appropriate that a number of the projects and activities funded were highly integrated (for example, developing training projects that addressed the skill needs of local employers but also targeted local unemployed residents).
3.5.2 Did the strategies match the challenges?
In summary most programmes assessed their baseline position and a link between the challenges identified could be detected, stronger in some programmes than others and where it was less strong there was normally a rationale (other regeneration programmes were already tackling these challenges, so URBAN II resources were directed elsewhere. The link largely continued into programme funding allocations and individual projects but in terms of the strengths of the links the case studies showed a wide range of experiences. Overall, the example of Bristol (see box below) provided the strongest links amongst our case studies. However, as can be seen in the next section, the next stage in the logic process – developing monitoring systems to capture the information to test the ongoing appropriateness of programme strategies and to help assess the impacts of URBAN II, was generally much weaker, and certainly in its implementation.
Case study example: matching challenges with strategies
Bristol’s programme was soundly developed on the basis of an identified core issue that closely informed the focus and content of the programme, which was implemented with an appropriate monitoring system. The URBAN II scoping study on the five deprived neighbourhoods identified as the

60
target area uncovered low educational attainment (fewer than 15% of youths obtaining a GCSE A*-C grade pass compared with 32% for Bristol as a whole) as a symptom of social exclusion among young people. This had adverse consequences for skills development and employability and contributed to high levels of crime. Outputs were recorded in relation to education initiatives – visits to schools addressing drug abuse, bullying and offending, and mentoring activities. Monitoring gathered programme results on changes in educational attainment levels (exhibiting a substantial upward shift across the neighbourhoods) and in local crime levels during the intervention timeframe.
3.6 Use of programme indicators 3.6.1 The collection of indicators
The next step was to compare the targets set by programmes with the actual values reported.24 A number of caveats should be noted before the findings are presented.
• Programmes focused most of their efforts on defining output indicators (2,067 – half of all the indicators collected) rather than results (1,357) and impacts (696 25). Output indicators are an essential tool in day-to-day management, but only a first step in evaluating the success of a programme.
• The recording of actual (achieved) and target values from the AIRs for outputs, results and impacts was incomplete. Table 3.4 shows that there were actual values for 65% of all indicators, and that comparisons with actual and target values could only be made in 56% of cases.
Table 3.4 Reporting indicator data (from the 2006 Annual Implementation Reports for the 70 URBAN II programmes)
Outputs Results Impacts All indicators
Number % (of total) outputs)
Number % (of total) results)
Number % (of total) impacts)
Number % (of total) indicators)
Actual value and target reported
1,342 65% 766 56% 210 30% 2,318 56%
Target but no actual value reported
337 16% 306 22% 255 37% 898 22%
Actual only with no target
164 8% 140 10% 75 11% 379 9%
No target or 224 11% 145 11% 156 22% 525 13%
24 We have defined 'achievement' as within 20% either side of an actual value equalling the target (therefore we have applied a
banding of 80 to 120%, below 80% equals underachievement and above 120% equals over achievement).
25 Defined as indicator headings as set out in annual reports and aggregated across the 70 programmes.

61
Outputs Results Impacts All indicators
Number % (of total) outputs)
Number % (of total) results)
Number % (of total) impacts)
Number % (of total) indicators)
actual value
Total indicators set26
2,067 100% 1,357 100% 696 100% 4,120 100%
Source: ECOTEC analysis of URBAN II programme data (base: 4,120 indicators)
• It was not always possible to aggregate or compare programme indicators. Programmes reflected local concerns and had significant levels of freedom; Member States and authorities had flexibility in how they developed and managed their programmes. This meant that the variety of actions funded was very broad, as were the means of recording information on outputs, results and impacts. Aggregation was therefore difficult except for the most commonly reported activities across a number of programmes.
• Comparing achievements to targets, the data show tremendous variations among programmes. Underachievement and overachievement were both significant and in some cases the variations between actual and target values exceeded a factor of ten.
• Target setting was another issue. Just because a target was met or overachieved, this does not necessarily mean that a programme was successful. Achievement rates of 1,000% above targets almost certainly say more about the original target than about programme performance.
• It should be emphasised that the information relating to outputs, results and impacts were drawn from Annual Implementation Reports. This means that the analysis is based on programme implementation up to the end of 2006 so it could underestimate the final performance figures.
Figure 3.1 presents the average number of monitoring indicators per programme, at Member State level. The figure combines output, result and impact indicators and the recording of actual and target values in each case. It shows a correlation between the completeness of the monitoring process with the number of indicators set by programmes. It suggests that where programmes have more indicators (programmes in Greece, France and Italy averaged more than 70 different indicators per programme) the levels of data collection were poor with several indicators having an actual value or a target value recorded, but not both, and a high level of no returns. Conversely, those programmes which had fewer indicators tended to have higher levels of data completeness. This is consistent with the literature on monitoring systems where good practice is generally to have fewer indicators (quality over quantity) and to be realistic as to what can be collected.
26This is the sum of the indicator headings, set by the programmes in the their Annual Implementation Report tables

62
Figure 3.1 Average number of indicators per programme (by Member State)
0 10 20 30 40 50 60 70 80 90 100 110
UK
Sweden
Spain
Portugal
Netherlands
Italy
Ireland
Greece
Germany
France
Finland
Denmark
Belgium
Austria
Fully collected (target + actual) Actual only Target only No data
Source: ECOTEC analysis based on 2,067 output, 1,357 result and 696 impact indicators (70 programmes)
3.6.2 Comparisons between actual and target values
Table 3.5 provides the level of achievement for the 70 URBAN II programmes against target values (where set).
Table 3.5 Average achievement ratio: outputs, results and impacts (% actual values per programme against targets, minimum, maximum and average values)
Programme Average Minimum Maximum Number of indicators
Clyde 41% 0% 1,420% 128
Perama 51% 0% 300% 34
Iraklio 53% 0% 250% 47

63
Programme Average Minimum Maximum Number of indicators
Peterborough 58% 0% 254% 39
Lisbon 59% 2% 133% 11
Komotini 62% 0% 625% 88
Antwerp 64% 0% 1,530% 19
Le Mantois 64% 40% 88% 2
Crotone 67% 0% 1,000% 86
Milan 68% 0% 4,400% 61
Grenoble 69% 7% 150% 5
Orense 70% 3% 300% 30
Clichy 74% 0% 300% 27
Le Mantois 76% 22% 100% 4
Misterbianco 81% 0% 3,056% 36
Teruel 84% 0% 200% 34
Turin 86% 30% 170% 30
La Laguna 87% 1% 500% 83
Neubrandenburg 89% 28% 145% 8
Carrara 92% 0% 167% 18
Jaén 94% 0% 10,010% 97
Gera 94% 0% 450% 29
Val de Seine 97% 0% 433% 121
Caserta 98% 33% 278% 23
Belfast 101% 0% 584% 63
Dessau 109% 0% 450% 28
Grigny-Viry 110% 6% 600% 36
San Sebastian 115% 14% 927% 26
Gijon 120% 7% 444% 43
Bastia 123% 2% 1,780% 38
Brussels 124% 0% 2,145% 22
Vienna 125% 0% 7,167% 14
Bordeaux 127% 33% 500% 9
Caceres 128% 1% 1,566% 50
Hetton and Murton 128% 0% 1,750% 58
Pamplona 129% 3% 820% 61
Halifax 135% 22% 1,520% 24
Granada 140% 3% 610% 24
Bremerhaven 142% 100% 238% 8

64
Programme Average Minimum Maximum Number of indicators
Mola di Bari 144% 144% 144% 1
West Wrexham 145% 5% 669% 14
Genoa 151% 0% 500% 35
Normanton in Derby 156% 0% 1,400% 26
Arhus 156% 0% 1,410% 28
Rotterdam 162% 0% 608% 27
Heerlen 174% 0% 870% 18
San Adria 179% 6% 15,860% 51
Sambreville 185% 0% 1,007% 56
Amsterdam 186% 0% 16,043% 35
Pescara 189% 0% 6,050% 24
Amadora 194% 0% 800% 35
Thames Gateway 198% 0% 1,060% 23
Kiel 201% 24% 556% 6
Kassel 210% 40% 7,020% 41
Saarbruecken 215% 0% 7,020% 41
Gothenburg 231% 0% 3,125% 22
Mannheim/Ludwigshafen 233% 0% 3,367% 30
Bristol 238% 16% 3,800% 39
Porto 241% 25% 1,000% 48
Berlin 243% 13% 1,244% 16
Burnley 245% 0% 2,510% 43
Helsinki/Vantaa 249% 7% 1,521% 23
Graz 251% 42% 1,761% 17
Stockwell 257% 5% 1,705% 15
Ballyfermot 261% 42% 2,342% 26
Leipzig 290% 90% 2,111% 22
Dortmund 320% 84% 930% 8
Grand total 143% 0% 16,043% 2,316
Base: 67 programmes; the data for Le Havre, Strasbourg and Taranto was inadequate to provide comparisons between targets and values. Source: ECOTEC analysis of URBAN II programme data

65
To highlight from the table:
• 15 programmes achieved their targets, i.e. fell within the 80-120% banding27. This suggests that those who designed the programme had good knowledge of what the programme was likely to achieve. However, achievement against specific targets varied considerably within this group. An extreme case was Jaén, where the average score for all indicators (outputs, results and impacts) was 94%, yet individual scores ranged from 0% to 10,010%. Similarly, in spite of an average score of 101%, the Belfast programme recorded individual scores ranging from zero to 584%.
• 38 programmes met or exceeded their targets (averaged 120% or more above targets). In Dortmund, at the highest end of this range, the average achievement score against all targets was 320%.
• 14 programmes did not meet their targets (fell below the 80% banding). Again, variance against specific targets within each programme was high.
3.6.3 Factors affecting the relationship between actual and target values
The poor link between target and actual values raises questions. Many local factors were at work, with common factors appearing to be:
• uncertainty and inexperience in target-setting
• a desire not to raise local stakeholders’ expectations too high
• actual performance being influenced by developments in the broader area.
The following examples illustrate these points.
Case study examples: overshooting and undershooting
Overshooting
In Dortmund, the programme achieved 93 business start-ups against a target of 10. Programme managers stated that they were “cautious” when setting targets, being careful not to promise too much. This caution was based on experiences from previous programmes, as well as recognition of how difficult it can be to help long-term unemployed people to start their own business. In the event, this objective and associated target proved much easier than anticipated.
In Halifax, 1,168 unemployed people accessing training against a target of 220 – a 531% overachievement – and a steeper 1,600% overachievement in jobs created, with 160 actual jobs against a target of 10. These targets were set at a time when the Halifax and UK economies were in a period of low growth. This meant that expectations on how many ‘new’ jobs the local economy would need and could create were relatively low. As the economy grew and new employment opportunities were created, the original target came to look very pessimistic.
27 We have defined achievement as within 20% either side of a target value (therefore we have applied a banding of 80% to 120%, below 80% equals underachievement and above 120% equals over achievement). Whilst achievements above 120% can be seen as positive it can also point to cautious target setting, especially for very high achievement values.
66
Undershooting
In Perama, problems of underachieving targets were relatively acute. Although some of this underachievement was because of poorly performing projects, much of it was explained by local stakeholders not having much experience of setting targets or setting up systems for similar area-based regeneration programmes. A lack of benchmark figures from other similar programmes and projects meant that stakeholders estimated targets based on personal opinion. They had less baseline data on the target area available to them than most programme managers, which made it hard for them to assess the scale of issues such as long-term unemployment or crime levels. It was therefore even more difficult to derive a figure for how many unemployed individuals the project had to work with.
The conclusion is that performance against output, result and impact targets told us more about the process of target setting than it did about real achievements. Nevertheless, programme managers did tend to feel that having targets was necessary and it was seen as a useful exercise in terms of giving a focus to their activities.
3.7 Outputs, results and impacts
This sub-section presents the impacts of programmes based on the qualitative and quantitative information from the AIRs and the case study research. It starts with an assessment of impact by theme, looking at the difference URBAN II has made in economic, social and physical terms. The text and tables used in this sub-section are selective and illustrative, based on all of the major outputs that could be aggregated and those results and impacts that could be linked back to outputs. Examples of the impacts drawn from the case study programmes are given in this sub-section.
3.7.1 Physical theme
Physical regeneration activities tended to include building restoration, the re-use of public space for commercial, community and social benefits, transport projects, green space provision and environmental and energy projects. Other smaller physical projects include graffiti removal and environmental awareness campaigns – all targeting improvements in the quality of the environment.
In aggregate, there are some key headline outputs including:
• 2.3 million m2 of public space converted across 56 programmes, plus a further 557,000 m2 of space dedicated to sports, social, health and education uses.
• 25 programmes invested in 3.2 million m2 of green space.
• 20 programmes built 80 km of cycle and footpaths.
• About half of all the public space improved is confined to just 3 of the 56 programmes reporting this as an output, namely Strasbourg, Vienna and Berlin.
The impacts of physical projects were measured in terms of jobs and businesses created and also measures of satisfaction and change in local conditions. In one example of public space conversion (Misterbianco), surveys have shown a 35% satisfaction level, which at face value is disappointing but could be a significant increase from previous levels (although there was no baseline survey; had there
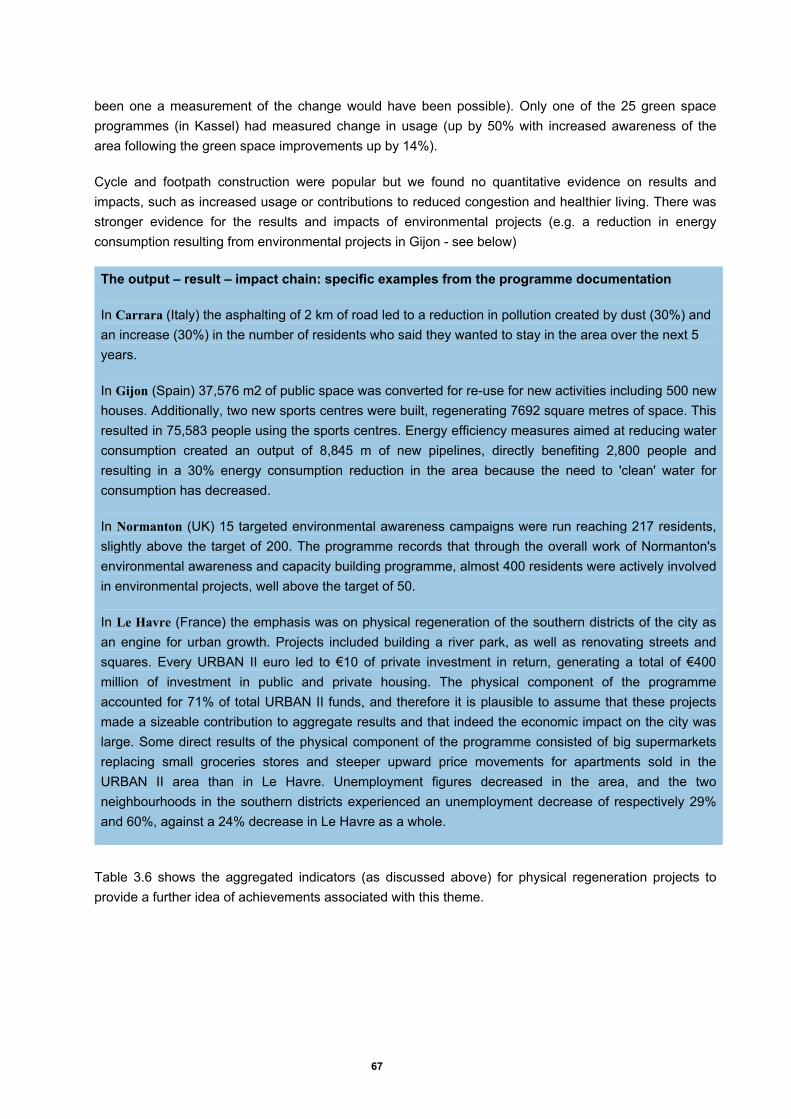
67
been one a measurement of the change would have been possible). Only one of the 25 green space programmes (in Kassel) had measured change in usage (up by 50% with increased awareness of the area following the green space improvements up by 14%).
Cycle and footpath construction were popular but we found no quantitative evidence on results and impacts, such as increased usage or contributions to reduced congestion and healthier living. There was stronger evidence for the results and impacts of environmental projects (e.g. a reduction in energy consumption resulting from environmental projects in Gijon - see below)
The output – result – impact chain: specific examples from the programme documentation
In Carrara (Italy) the asphalting of 2 km of road led to a reduction in pollution created by dust (30%) and an increase (30%) in the number of residents who said they wanted to stay in the area over the next 5 years.
In Gijon (Spain) 37,576 m2 of public space was converted for re-use for new activities including 500 new houses. Additionally, two new sports centres were built, regenerating 7692 square metres of space. This resulted in 75,583 people using the sports centres. Energy efficiency measures aimed at reducing water consumption created an output of 8,845 m of new pipelines, directly benefiting 2,800 people and resulting in a 30% energy consumption reduction in the area because the need to 'clean' water for consumption has decreased.
In Normanton (UK) 15 targeted environmental awareness campaigns were run reaching 217 residents, slightly above the target of 200. The programme records that through the overall work of Normanton's environmental awareness and capacity building programme, almost 400 residents were actively involved in environmental projects, well above the target of 50.
In Le Havre (France) the emphasis was on physical regeneration of the southern districts of the city as an engine for urban growth. Projects included building a river park, as well as renovating streets and squares. Every URBAN II euro led to €10 of private investment in return, generating a total of €400 million of investment in public and private housing. The physical component of the programme accounted for 71% of total URBAN II funds, and therefore it is plausible to assume that these projects made a sizeable contribution to aggregate results and that indeed the economic impact on the city was large. Some direct results of the physical component of the programme consisted of big supermarkets replacing small groceries stores and steeper upward price movements for apartments sold in the URBAN II area than in Le Havre. Unemployment figures decreased in the area, and the two neighbourhoods in the southern districts experienced an unemployment decrease of respectively 29% and 60%, against a 24% decrease in Le Havre as a whole.
Table 3.6 shows the aggregated indicators (as discussed above) for physical regeneration projects to provide a further idea of achievements associated with this theme.

68
Table 3.6 Outputs, results and impacts in the physical theme Outputs Number of
programmes Achieved Value
Results of Activity
Number of Programmes
Achieved Value
Impact Number of programmes
Achieved Value
Number of building restoration operations
6 372 Additional investment (€'000)
3 6,605 Employment created (temporary or permanent)
1 20
Number of beneficiaries
1 6,175 New gross jobs created (permanent or temporary)
14 1565
% increase in public spaces (average)
2 61% % of population satisfied 1 35%
Utilisation rate of new buildings
1 60%
Converted public space (m2)
56 2,313,748
Number of firms benefiting
4 1020
Number of firms established 5 254
Number of new companies
1 9
Users of new sport sites
3 80,774
Space for social, health, sports and education (m2)
12
557,115
Number of cultural events
1 12
Number of gross jobs created 5 316
Green space created (m2)
25 3,237,294 Increased awareness of the area 1 14%
Bicycle/footpath built (km)
20 80
Road and footpaths renovated for pedestrians/cyclists (m2)
6 11,614
Increased use of community parks (% of population)
1 50%
% of satisfied customers 1 62%
Length of new water pipelines (m)
3 10,712 Number of beneficiaries of new infrastructure
2 14800 % energy consumption reduced 1 30%
Volume of solid waste recovered (ton)
4 4,699 New environmental equipment projects
7 194
Volume of liquid waste
1 15,300
Number of beneficiaries 3 35,250

69
Outputs Number of programmes
Achieved Value
Results of Activity
Number of Programmes
Achieved Value
Impact Number of programmes
Achieved Value
recovered (litres) Volume of toxic waste recovered (ton)
1 105
Number of initiatives to improve the appearance of the environment
1 4 Reduction in number of people who have a problem with graffiti in the area
1 49% Satisfaction level with quality of the environment
Not known 11%
Number of buildings improved
2 2 Number of buildings
1 18,658 Reduction of CO2 emission (ton) 1 7.6
Note: The number of programmes columns refers to the number of programmes that reported a specific output, result or impact in their Annual Implementation Reports. As can be seen (and also in the tables covering the economic and social themes) the number of programmes recording results and impacts that can be linked back to outputs are generally fewer than the total number of programmes recording outputs. In the above table 3 programmes had output data concerning the installation of water pipes but only two recorded the results of that installation and only one had impact data Source: ECOTEC Analysis of Annual Implementation Reports

70
The case studies reveal that in addition to the quantified outputs that were achieved, other results and impacts on the physical investments were also realised, some measured and some not. Three main areas of achievement under the physical theme were most apparent, namely:
• transport and other infrastructure provision meeting the needs of the programme areas.
• the creation of new or improvement of existing green or other public spaces.
• building new or improving existing social, cultural, educational and business facilities.
Case study examples: Transport and infrastructure improvements
Stakeholders interviewed identified improvements made to the physical fabric of the programme area as particular impacts of URBAN II, with particular reference to transport improvements and more broadly to addressing the infrastructural needs of the area. Investment in the physical infrastructure of target areas seems to have resulted in a number of additional positive benefits, including for example, reduced levels of traffic and pollution and the stimulation of commercial activity in the target areas.
This was evident in Carrara, where improvements to the transport and physical infrastructure of the programme area have been a major area of success for the programme. The creation of a bypass not only contributed to improving the attractiveness of the area (in terms of reducing traffic and transport times) but has also had had a positive impact on commercial activity in the historic centre. Data supplied by the Managing Authority shows that dust pollution fell by 32% after the creation of the bypass, while transit of heavy goods vehicles through the historic centre fell by 22% (making it a more pleasant experience for local people and tourists to visit and enjoy).
In Le Mantois, the renewal of one of the main boulevards of Val Fourré and the improvement of access throughout the Domaine de la Vallée (Mantes-La-Ville) were regarded by stakeholders as significant achievements. Improved flow of traffic and making access to services (e.g. schools) much quicker and easier, also 'opened up' the programme area to outside residents, which has in turn stimulated greater interest and usage of retail facilities (an example of physical activity with a economic benefit).
Stakeholders in Perama pointed to a positive impact on the quality of life of local residents from pedestrianisation of the city centre and creation of a number of new parking spaces in convenient locations designated for use by residents with physical disabilities.
In Rotterdam investment in the physical infrastructure of the programme area was not only regarded as having a major impact but was also identified as key to tackling long held perceptions on safety. Prior to URBAN II, no one agency had responsibility for the area surrounding the railway station and thus the infrastructure and transport modes (e.g. bus, car, bus, bike) were severely degraded and regarded by local people as being unsafe. Through URBAN II, much needed physical investments were made to the area, which not only made access to and from the railway station much easier, but improved resident perceptions on public safety.
Case study examples: Green and public space improvements
Stakeholders saw improvements to green and public spaces as a key achievement. The Greenbelt project in Le Mantois, which was designed to connect the local public areas in neighbouring districts

71
through a range of improvements, including paths for pedestrians and cyclists, and the landscaping of key areas around the various lakes in the area. The improvements also acted as a catalyst to improving the image of the areas, stimulating a greater outside interest in the programme area (i.e. tourism interest) and generally improving local residents' quality of life through access to a range of services.
The physical regeneration of public squares in Perama was regarded by stakeholders as one of the main areas where an impact had been achieved by URBAN II. Anecdotal evidence suggests that the areas around the renovated squares have seen an increase in usage by local citizens, more children playing in the squares, special neighbourhood events, and small businesses such as restaurants also opening up around these squares.
In Leipzig, stakeholders commented that, while they had no quantitative data to substantiate their claims, they believed that the new green and public space were successful and had such a strong impact locally because residents had been engaged and consulted in all phases of project design and delivery and thus the end results met local expectations and needs. The impact again focused on how the green space had brought more people into these areas and a better 'buzz' in the neighbourhood.
Case study examples: New social, educational, cultural and business infrastructure
In 9 case studies stakeholders cited the creation of new social, educational, cultural and business infrastructure facilities as a contribution to the generation of programme impacts. These types of physical improvements helped pave the way for additional social and economic activities and services to be provided in the programme areas. One of the key success criteria is that they were strongly based on local needs and priorities, and were designed with sustainability in mind.
Many of the projects in Porto Gondomar aimed to improve the attractiveness of the neighbourhoods, renovate derelict sites and prepare them for social infrastructure (for example, cultural and educational functions, such as youth centres, elementary and primary schools). Stakeholders commented that the building of the new school provided much needed space for pre-school and primary-aged children to access educational, recreational and leisure activities (also funded through URBAN II before being mainstreamed by these schools themselves) that were not possible in the existing old prefabricated school rooms.
In Gijon, stakeholders commented that the strongest performing aspects of the programme were in physical regeneration linked to economic and social issues. For example, a sports centre was renovated and a new one created in direct response to local needs expressed by residents living in the programme area. The results of this investment saw more than 130,000 local people (as well as residents from the rest of the city) using the new facilities in 2008. Investments made under the physical theme have also been used as a means to stimulate economic development and growth. An example was the creation of a business centre with the capacity to host 16 new companies (of which 14 are taken) as well as a service centre designed to bring more dynamism to the local business community.
Stakeholders in Bristol regarded the creation of the Knowle West Media Centre as one of the impacts of the programme. A success factor was that the architects worked collaboratively with a panel of young people in designing a centre that met the needs and expectations of this key target group. One young

72
person who chaired the panel now occupies a flexible workspace within the centre and is pursuing a business venture in digital art and film making. The centre is a key driver in terms of helping Bristol as a whole to change its economic structure, in this instance towards the creative industries, and the project is part of a wider goal of helping the city to enhance its creative and media cluster.
In Perama, many new physical infrastructure projects were designed to help establish the area as a destination for cultural and educational tourism and to stimulate further private sector investment in the programme area. The programme funded the creation of an open-air theatre and a maritime museum. The area of Perama where these two projects were built was previously vacant and an environmental detractor for the city as a whole. According to consultees, URBAN II has put the west end of Perama 'on the map’ and brought 'life' back into a previously 'dead' part of the city. The presence of the theatre (and eventually the museum) has encouraged local residents and tourists to reintroduce themselves to the area and attend a variety of theatre shows and has therefore brought a new 'buzz' to the programme area.
The evidence provided through the good practice project case studies substantiates the claim that the physical measures have been an important factor in stimulating further impacts, particularly the provision of additional services and activities. The creation of the new Media Library in Le Havre is a clear example of a physical improvement project that integrated other measures, notably through the provision of training and other educational services related to ICT as well as childcare facilities. As a result of this integrated approach the library has been able to successfully support a number of key target groups in the southern districts of Le Havre including young people and the unemployed (in 2007, almost 40% of the members were under 18 years and 16% were unemployed). The library is now regarded as a symbol of how the programme area has changed and begun to shake off the negative image that people previously had of the southern districts. The restoration of the Civic Museum of Marble was also perceived by stakeholders to have had a similar catalytic affect in Carrara. The impact of these physical improvements was not just contained to the provision of additional educational services, they were also key to stimulating greater tourism interest by linking the restoration of the museum to a number of cultural events connected to the marble industry.
3.7.2 Economic theme
URBAN II funded advice to SMEs, with 17 programmes undertaking almost 6,000 interventions, supporting 2,249 companies (in 13 programmes) and claiming the creation of more than 1,000 gross jobs (in 10 programmes) together with other benefits such as companies relocating to the URBAN II area, and 131 business start-ups (in 3 programmes). In Graz, URBAN II funding resulted in a reported 30% increase in the number of businesses operating in the programme area, impacting on the area's employment headcount with 300 gross new jobs created. As well as advice, business support included business finance, especially in Germany and Italy, where a total of 1,100 companies were assisted.
URBAN II supported a large number of training places (43,000 participants in 25 programme areas). Much of the training involved the key steps needed for establishing or running a business. An example of specific training was that for the building sector, with improved quality of construction works as an expected result (in Bastia). In Sambreville, training courses at the industrial and commercial school of

73
Auvelais were co-financed with a total of 394 people receiving training across 49 courses, resulting in new employment for 60-70% of participants.
Seven programmes (through 19 projects) supported economic innovation where new growth sectors were promoted to replace declining traditional sectors such as manufacturing or shipbuilding. The number of participating SMEs was almost 3,000 in 5 programme areas with 44 start-ups claimed in one example (West Wrexham). 2 programmes (Sambreville and Thames Gateway) provided incubator centres with a 100% occupancy rate in the one programme. A further 2 programmes built just under 44,000 m2 of commercial floorspace, creating almost 600 jobs.
Seven programmes delivered ICT projects and services (some 130 individual projects). 3 programmes reported 127 SMEs implementing ICT upgrades and infrastructure, with 2 programmes reporting 123 jobs. The text below provides examples of the impact chain for the economic theme.
The output – result - impact chain: specific examples from the programme documentation
In Mannheim, Germany, 409 individuals were trained in 22 SMEs (in line with the target of 22). 60 new jobs were created against a target of 45. In another project, 149 SMEs received financial support, with 267 jobs created claimed (against a target of 205).
In Graz, Austria, URBAN II funding resulted in a 30% increase in the number of businesses operating in the programme area, impacting on the area's employment headcount through 300 new jobs.
In Halifax, United Kingdom, 1168 unemployed people accessed training and an additional 438 worked towards achieving a qualification. At the same time, a series of business support initiatives achieved outputs such as help for 928 SMEs. As a result, 634 new jobs were created, 971 people secured employment, contributing to an impact on the unemployment rate in the URBAN II area, which fell from 6.5% in 2000 to 4.7% in 2007.
In Sambreville, Belgium, URBAN II co-financed training courses at the industrial and commercial school of Auvelais. Consultations with local enterprises and public employment organisations had highlighted the specific recruitment needs of local companies and the extent of the inadequacy of qualified labour supply in the programme area, characterised by high unemployment (20%), lack of skills and qualifications and dependence on welfare benefits. Under URBAN II, 394 people from disadvantaged socio-economic backgrounds received training on 49 courses, resulting in a post-training 60-70% success rate in accessing employment. Some of the beneficiaries had been unemployed for years, or had no qualifications, others were socially isolated, or came from disadvantaged backgrounds.
Table 3.7 shows the aggregated figures for projects supported under the economic theme.

74
Table 3.7 Outputs, results and impacts in the economic theme
Core Outputs Number of
Programmes Achieved Value
Results Number of Programmes
Achieved Value
Impact Number of Programmes
Achieved Value
Jobs created or safeguarded 10 1016 Number of new companies / business start-ups
3 131
New businesses existing after extended period of time
4 198
Business advisory / support actions
17 5984 Number of companies assisted
13 2249
Companies relocating to URBAN area
1 64
Number of jobs created / maintained 14 2,276 Number of participants trained
25 43,004 Number of SMEs supported
21 7,354 Number of business start-ups 5 515
Number of commercial centres/stores renovated
2 23 Evolution of turnover
1 +10% Number of jobs created 2 115
Number of (innovation) projects supported
7 19 Number of firms involved
5 2,938 Number of start-ups 1 44
Service / support centres created
4 9 Nr of companies/self-employed benefiting
3 829 Number of companies set up 2 87
Incubator units created
2 20
Square metres of commercial real estate created
2 43,292
Occupancy rate of incubators
1 100% Employment created 2 595
ICT projects and services
7 130 Number of SMEs implementing new ICT appliances
3 127
Cultural events realized
1 6 Direct jobs created per event per year
Not known
41
Gross numbers of jobs created 2 123
Source: ECOTEC Analysis of Annual Implementation Reports

75
The case studies identified two main achievements under the economic theme:
• the provision of business support services to new and existing enterprises operating in the programme areas.
• the provision of training support to local residents to improve their skill levels and employment prospects.
Case study examples: The provision of business support services
The refurbishment of the Elsie Whiteley Incubation Centre was part of a vision to create a new image for Halifax, moving it away from traditional (declining) industrial sectors and a reliance on a small number of larger, at risk, employers (for example HSBC Bank). Through the employment of an incubation manager and youth enterprise manger the project was able to successfully target and support a number of local residents looking to start their own business, as well as recently established businesses needing subsidised workspace. The incubation centre was only one element of a 'cocktail' of business support measures designed to improve the economic performance of Halifax. Other examples of successful initiatives include the ‘Halifax Means Business’ project, which provided start-up grants to residents, specialist growth support to existing businesses, as well as offering a range of inducements to entice businesses to relocate to Halifax. The programme manager perceived that the project had helped to increase the entrepreneurial 'spirit' in the town although this was not measured. ,
In Arhus the establishment of the Nyvirk Enterprise Centre, which provided business support services targeted specifically at the ethnic minority population was regarded by stakeholders as one of the most positive impacts achieved under URBAN II. The enterprise centre was located next to a shopping centre where many entrepreneurs were active and where many residents would pass on a daily basis. Since 2003, the centre has provided guidance and advice to 150 residents in Arhus who have subsequently established a business, as well as providing support to a further 200 existing businesses.
In Leipzig stakeholders felt that the business support provided to SMEs had been successful with 245 local companies supported overall. It was perceived that the business support activity helped to stabilise business performance in Leipzig, as well as being important in helping to secure €7.4m of additional investment for the area and business community. The impact achieved was also evident in the updated baseline indicators, which showed that the total number of businesses increased from 320 to 650 between 2000 and 2007 (which in turn helped to revitalise demand for commercial properties in the programme area). Much of this business growth was concentrated in the Plagwitz neighbourhood which, with the help of URBAN II funding, has begun to shed its old image and develop a role as a fashionable neighbourhood for young artists, start-ups and students.
The additional business support services were one of the strongest performing aspects of the URBAN II programme in Sambreville. In total, 252 businesses were offered a holistic business support package, including organised trade visits and business-to-business conferences as well as a range of online support tools. The business support was deemed by case study consultees to be instrumental in a local industrial zone being filled to capacity, as well as helping to create new employment opportunities for local residents, especially vulnerable and unqualified people.
The development of the local economy was a focal point of the programme in Graz, and resulted in a raft

76
of measures aimed at exploiting the potential of the knowledge economy. A key project that fell under this area of activity was a business incubation centre that was created to provide advice, training, support services and funding to entrepreneurs looking to operate in the 'high tech' sector. Key stakeholders regarded this project as an example of good practice because it was based on local economic needs, and provided additional business start-up services that helped to stimulate a cluster of new businesses operating in the high tech sector. In addition, due to the success of the project, the business support services have now been absorbed into the mainstream and rolled out to the whole of Graz.
Case study examples: Training support to improve skill levels and employment opportunities
The case studies showed that many local residents were offered a range of training support options to help improve their skill levels and employment options. Many case study consultees commented on this economic measure when referring to the most significant areas of impact achieved under URBAN II.
In Sambreville, there was a high degree of synergy between economic measures. In addition to offering business support services, a number of local employers were also engaged through URBAN II to help devise a range of training support projects, including a welding training programme, that were targeted directly at the local labour force, many of whom were low skilled and had had prolonged periods of unemployment. The welding project was regarded by stakeholders as an example of good practice because it dealt with both demand and supply issues within the local economy and also resulted in a number of quantifiable impacts (for example, 80% of trainees subsequently moved into employment with a local company) as well as softer impacts such as improved confidence and employment prospects for beneficiaries who did not immediately find a job.
The additional start-up support services and training were also regarded as one of the strongest aspects of the programme in Dortmund. In order to create new, sustainable employment opportunities for a number of hard to reach groups (including alcohol and drug addicts and the long-term unemployed), a project was developed to stimulate enterprise development by converting a derelict local building into managed workspace and offering a range of start-up business support services and training opportunities. As well as looking to address worklessness issues by stimulating new enterprise development opportunities, the beneficiaries of the project were also encouraged to enter trades with skill shortages, thereby also addressing needs within the local economy. A large part of the success of the managed workspace project, which is now operating as a sustainable business requiring little intervention from the public sector, was perceived by stakeholders to be the fact that it was based on local needs.
Similarly in Perama, one of the strongest areas of perceived impact was the vocational training support that was offered to local residents, designed to help them exploit new employment opportunities in the local economy. Tailored training programmes that targeted specific groups (e.g. unemployed women, particularly those in danger of exclusion) as well as specific occupations (e.g. management and administration), particular sectors (e.g. cultural and recreational services) and specific trade skills (e.g. wooden ship-building crafts) were introduced to address the consequences of industrial decline in Perama (i.e. high levels of unemployment). Although there was no quantifiable evidence on how many trainees accessed employment, it was perceived that local people were more employable as they had

77
obtained the skills needed by the new sectors that had gradually been moving into Perama (especially IT and logistics).
In Gijon many of the more successful projects under the economic theme were focused on the provision of ICT training activities to local people and SMEs. From September 2003 until July 2008, training activities on ICT, electronic commerce and the use of internet attracted an average of 600 beneficiaries per year. Those training activities were tailored to meet the needs of the users, with specific modules for women, shop assistants and young people, for example. Stakeholders commented that the training not only helped to increase the number of households accessing the internet, but also helped to improve the employment options of residents and stimulated an increase in enterprise development.
3.7.3 Social theme
Training was the most popular activity under the social theme with 31 programmes reporting 982 training projects, which overall (for 28 programmes) accounted for the training of almost 65,000 individuals. Training can cover a wide variety of activity with different levels of depth, intensity and formality/informality28. Other impacts reported were reductions in illiteracy levels and new jobseekers entering the labour market. Only one programme (Normanton) recorded the most obvious result from the training - qualifications gained.
Security projects were common in disadvantaged areas, often blighted by high levels of crime and vandalism. 7 programmes delivered a total of 247 security projects that impacted on more than 71,000 people (in four programmes), and in one programme resulted in incidences of crime declining against a baseline statistic (Arhus). The impact of security projects should ideally be a reduction of crime or – sometimes more importantly – fear of crime. Due to the large number of indicators used for measuring crime across Member States, it is not possible to come to a definitive view about the impact of security-related measures, but it is clear that they have had some impact in the programme areas.
5 URBAN II programmes contributed to 593 capacity building interventions. In one case (Belfast) this resulted in increased business turnover for social economy projects and in a second case (Burnley) 134 people involved in community management. In Amadora, 85 different publications were issued on public and citizenship participation and 2,062 residents participated in community capacity building events. The literature on urban governance and community involvement often highlights the sustainability of capacity building projects once funding ceases.
The social projects collectively have reached large numbers of participants, whether it is attendance at employment, health and social centres, attendance at cultural events or participation in drug advice programmes (three programmes, all in Portugal). Participation can be relatively passive (e.g. attendance at events) but also targeted on individuals in need of specific support (e.g. the drug advice projects). Evidence and measurement of results is patchy: for example, in one programme (Arhus), it is claimed that 68% of young people are active in sport or culture as a result of cultural events, but no baseline comparison is offered to make a judgement on whether this represents an improvement. Employment impacts were put forward as impacts for health projects in two programmes, but improvements to the
28 Training under the social theme is largely focused on individuals seeking work whilst training under the economic theme mostly concerns businesses and their employees.

78
health of individuals and communities (not measured in these cases) would have been a more obvious indicator, directly relating to the problems identified at the baseline stage.
There is a theme of 'prevention rather than cure' for many social projects including the provision of advice on drugs, preventing crime through security measures and improving healthy living through participation in sports activities. In Peterborough, the programme sought to increase self confidence, motivation and self reliance among the residents of local communities through training and advice projects, and sought to reduce crime and the fear of crime through community safety initiatives. The programme recorded a 20% decrease in the proportion of young offenders as one of its impacts. The text below provides examples of the impact chain for the social theme.
The output – result – impact chain: specific examples from the programme documentation
In Arhus the Outsiders2Insiders project established by four former convicted criminals to prevent crime worked with 11 young people (exceeding the target of 5 people), with the aim of make them role models for the community's youth. A survey of residents showed that 66% believed positive change was happening in the area, with 64% believing that the area's prospects are looking brighter.
The projects claiming the most training places are in Val-de-Seine, France, with 87 projects delivering training to 35,030 participants (just above the target of 34,025). The creation of 12 jobs was claimed as an impact against a target of 11 (this could be associated with the provision of training but the monitoring of data is not clear).
The Thames Gateway programme delivered 172 community capacity building measures and assessed the benefits with a claim of 20% of the local population accessing financial advisory service and a 20% reduction in criminal damage reported, the causal link between output and impact being more difficult to prove in this case.
In Rotterdam initiatives aiming to improve the image of the programme area led to 81 projects in the field of preservation and dissemination of culture and 43 exchange projects. These, in turn, resulted in 12,550 individuals from vulnerable groups participating in coaching projects. The related impact is difficult to gauge with precision. A safety index was developed –and showed a positive trend - but several projects would have impacted on the index, thus making it difficult to disaggregate the relative weight that the above projects exerted.
Table 3.8 shows aggregated figures for activities belonging to the social theme.

79
Table 3.8 Outputs, impact and results for the social theme
Core Outputs
Number of Programmes
Achieved Value
Results Number of Programmes
Achieved Value
Impact Number of Programmes
Actual Value
Participants planning to study as result of
programme
1 280
Reduction in illiteracy levels relative to national average
1 3%
Increase in population accessing general training
1 20%
People securing recognised qualifications
1 49
Increase in use of services through new users
1 20%
New activities resulting 1 28
Number of training actions
31
982
Number of participants
28
64,801
Number of jobseekers entering labour market
3 481
Number of security actions
7 246 Number of persons
4 71,403 Incidences of crime per 10,000 population (baseline
65)
1
52
Proportion of population accessing
local community service for financial security
1 20% Number of community capacity building initiatives
5 593
New sales in assisted
social economy projects
during 3 year period (Euro
1 648
Reduction in criminal damage offences
1 20%

80
Core Outputs
Number of Programmes
Achieved Value
Results Number of Programmes
Achieved Value
Impact Number of Programmes
Actual Value
'000
Community facilities
benefiting from
enhanced security
1 33%
New people involved in
the management of community
groups
2 1,278
Financially assisted programmes still in place
after 18 months
1 5
Number of employment support/training centres created or restored
6 16 Number of users
6 17,554 Number of jobs 4 170
Number of users
4 14,258 Number of (indirect) employed
2 568
Increased community
participation (average)
2 24%
Number of community facilities improved
8 22
Amount (m2) of improved public space
1 2,619
Drug advice programme activities
3 162 Young people
assisted by information
and prevention
1 12,650
Number of community facilities improved
1
7
Number of cultural events and projects
11 949 Number of participants
7 91,646 Increase in number of residents participating to
activities
1 1287
Number of buildings
6 19 Number of ICT
5 35,817 Number of jobs created 1 3
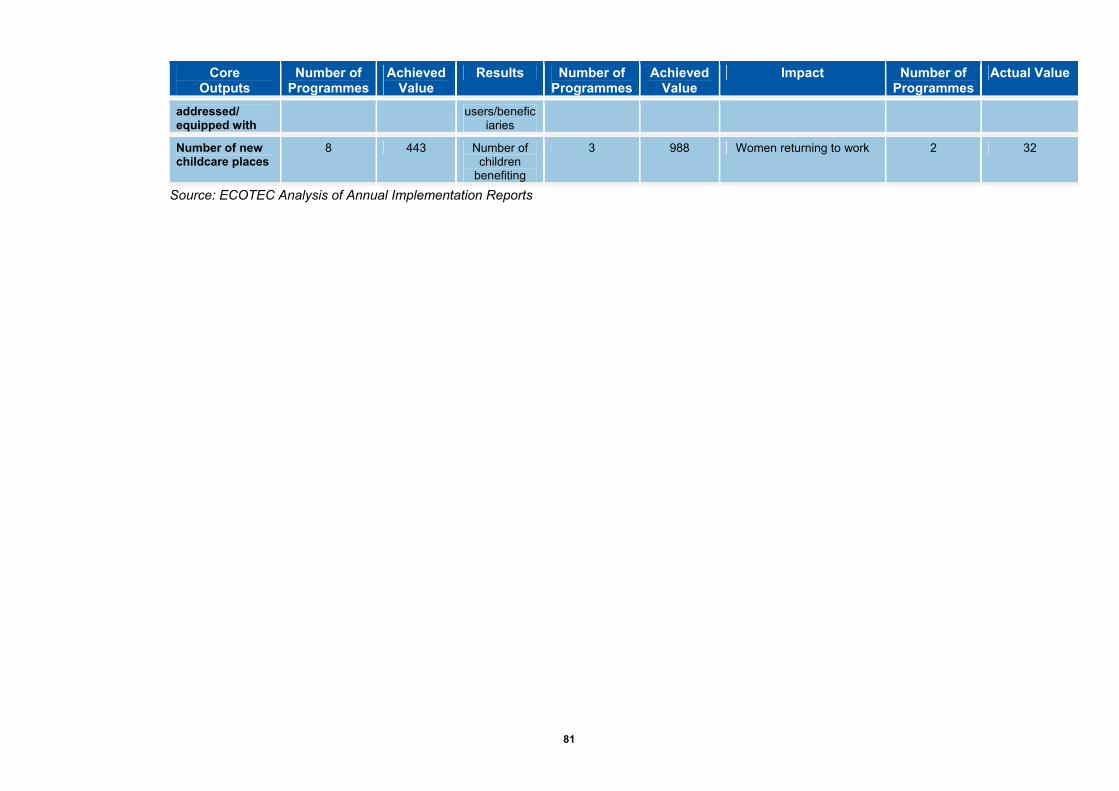
81
Core Outputs
Number of Programmes
Achieved Value
Results Number of Programmes
Achieved Value
Impact Number of Programmes
Actual Value
addressed/ equipped with
users/beneficiaries
Number of new childcare places
8 443 Number of children
benefiting
3 988 Women returning to work 2 32
Source: ECOTEC Analysis of Annual Implementation Reports

82
The case studies identified one main area of impact under the social theme, namely: the provision of additional or new social services to address issues of supply and accessibility at the local level.
Case study examples: improved social services
The provision of additional or new social services and resources was regarded by many stakeholders as a base for generating impact under the social theme. It was also apparent in case study reports that the investment made to improve the physical infrastructure and fabric of programme areas was contributed to the provision of better social services (for example, by building or renovating social centres offering information, advice, guidance and other support to residents).
Gijon is an example of a programme where investments to regenerate the physical fabric of the programme area played a key role in improving access to new social services. Stakeholders commented that the new social spaces created played a role in enabling delivery partners to host a range of training and other social activities targeted at local residents. URBAN Online, an ICT training project, was devised to narrow the digital divide between residents in the programme area compared to those living in more affluent surrounding areas (a need which was identified in a local research study). The project was successful in up-skilling local residents and also in promoting greater usage of the internet at home (broadband access increased from 11.5% of households in 2002 to 48.9% in 2008). This was seen to make local residents more employable as they were able to develop more better ICT skills in line with the new requirements of local employers.
In Le Havre, the creation of a new Multimedia Library contributed to the provision of a range of new social services for local residents to access (including ICT and language training as well as multimedia workshops and public reading sessions). One stakeholder commented that by providing high-level services that are not available in other libraries in the city, the library had become a focal point for the city of Le Havre.
In Perama, the municipality was aware that access to social services was an important issue in the target community and commissioned a mapping and needs analysis study to establish the extent of the problem. As a result of the study, the municipality created a 'one stop shop' offering information and public services to the citizens as well as encouraging residents to access employment services in order to move them closer to the labour market. They also used URBAN II funds to establish a mobile medical centre that was designed to reach out to citizens living in the more geographically isolated parts of the city. The project was regarded by stakeholders as an example of good practice because it provided an innovative solution to tackling a local need (i.e. access to health services) and helped to save lives (as the mobile centre allowed health professionals to go out into the community and diagnose serious health problems among patients who would not have visited the existing medical centre).
3.8 Wider benefits of URBAN II
The case studies also highlighted more general benefits to programme areas that cut across the themes but were either not systematically measured, or could not be quantified . These benefits were referred to by stakeholders when commenting on the main difference that URBAN II had made and were often

83
regarded by consultees as being as - if not more important - than the quantifiable outputs, results and impacts, particularly in terms of how URBAN II has left a lasting legacy in programme areas. Some of these benefits (e.g. improved image) have been introduced above as part of the thematic assessment of URBAN II.
The main wider benefits of URBAN II that were evident can be summarised as follows:
• it helped to change the image of programme areas, particularly through the realisation of physical regeneration projects including new public and cultural amenities and green space.
• it helped to raise the strategic profile and promoted greater understanding of the needs of programme areas and their target communities.
• it helped establish, build and strengthen the regeneration infrastructure in programme areas (e.g. helped to support the development of the local voluntary sector or established a new business forum).
• it had a positive impact on building the confidence and aspirations of local people.
Case study examples: Improved image
In 10 of the studies the URBAN II programmes were a catalyst to change the image of their areas. In particular, stakeholders referred to the physical regeneration projects. The improvement of infrastructural links, creation of new public space or cultural amenities, the regeneration of key buildings in neighbourhoods and the development of new and improved green space were all perceived as having improved the image of the programme area to investors, residents, tourists, businesses, shoppers and public funding bodies.
The mix of physical improvement projects in Graz (which included the conversion of the Helmut List Halle concert venue, alongside transport improvements to the local transport hub and new services such as the community library) was perceived as contributing to changing the image of the area, particularly in terms of encouraging young people to stay and enticing visitors (tourists) to the area. The creation of a new SME start-up centre and associated facilities for technological businesses were also regarded as being important factors in changing the image of Graz and encouraging new high profile companies and organisations to the area (such as Roche and the Eco World Styria network).
In Dortmund, as a consequence of URBAN II, the Nordstadt is regarded as a more attractive place to live, with improved local facilities and services. Communication work and events such as the ‘International Week’ were also identified as helping to increase the numbers of visitors and mitigate negative press about Dortmund. This was also the case in Arhus, where a resident survey highlighted that 'that more positive things are happening in the area' compared to before URBAN II (66% of respondents); the area's prospects are looking brighter (64% of respondents); and that there were more opportunities than before the start of the programme (73% of respondents).
Social and physical regeneration activities that stimulated an improved image were also considered the most visible successes of the Perama programme. Consultees commented that the area has certainly changed aesthetically, with many neighbourhoods being upgraded physically through the renovation of squares and the creation of pedestrian streets. The new open air theatre (and eventually a museum) had encouraged local residents and tourists to reintroduce themselves to the area and attend a variety of shows, which in turn gave the programme area a new, more vibrant feel and image. Word of mouth

84
and local press reports about the URBAN II projects helped to change the image of the programme area from one that was regarded as ‘dangerous’ to visit, to an area that is ‘welcoming’ and 'worth a visit'.
Case study examples: Raised profile
Stakeholders in Le Havre believe that the programme has been the driving force behind the rehabilitation of the area and that, prior to 2000, the southern districts were ‘forgotten’ and ‘neglected’ by most policy makers in the city. Strategic stakeholders now have a much better understanding of the needs and key priorities in the programme area, and crucially this has been backed up with additional funding to address those needs. URBAN II activities are continued via finance from a national regeneration programme dealing with regional competitiveness.
In Graz, stakeholders commented that one of the intangible impacts of the programme in Graz (West) has been its ability to put the programme area 'on the map' which has influenced the development of an integrated regeneration strategy for of Graz South (which in turn attracted around €3m of national and regional resources). This was also the case in Leipzig, where the success of a number of spatially targeted projects led to the release of a further €127m from national government and private investors. Stakeholders felt that this additional funding would not have happened without URBAN II raising the profile of the challenges in Graz West.
Case study consultees in Gijon also pointed out that the programme raised awareness of the area's needs among regional stakeholders. During the last few years the municipality of Gijon has received a number of awards recognising the work undertaken under URBAN II29, which assisted in raising the profile and awareness of the programme, the programme area and its key target communities.
Halifax stakeholders highlighted that regional partners (including funding organisations) were more aware of the town's need for regeneration funding. Even the attendance of regional stakeholders at the programmes partnership meetings meant that important decision makers came to the town more frequently than they had done previously.
Stakeholders in Sambreville commented that URBAN II has been a key factor in the creation of a new long-term successor strategy to guide regeneration activities in the city; a development that is unique within the Walloon Region. Previous regeneration programmes tended to be developed with regional priorities in mind, with little consideration for local needs and issues. URBAN II has therefore been influential in terms of promoting the local agenda, with Sambreville being regarded as a pioneer in the development of a new bottom-up approach to regeneration. Many stakeholders felt that further socio-economic improvements in the target area will follow on from the physical development that the programme has instigated. Another indirect impact of URBAN II was the accelerator effect on the pace of development in the programme area. The programme has sharpened the focus and mobilized involved parties to provide a basis for continuing regeneration after URBAN II.
29 The 2003 Award for the Best Public Initiative in Asturias (by the national economic magazine Actualidad Economica); the Award APIA 2003 for the full regeneration and renovation of the industrial parks of western Gijón; and the 2004 Award for the most attractive public building in Asturias for the Calzada Sports Centre.

85
Case study examples: Establishing and strengthening the regeneration infrastructure
The role of URBAN II in helping to establish new - as well as build and strengthen existing – regeneration delivery infrastructure and mechanisms is another example of one of the less easily measurable impacts that were reported in the case studies (9 out of 15 case studies made reference to this factor). In some instances, this impact was expressed in terms of equipping the programme management team with the skills and abilities to deliver other regeneration initiatives in the future. In other case study areas, the voluntary and community sector have built capacity to deliver a range of local services direct to the community.
In Le Mantois, the management team felt strongly that overseeing the delivery of URBAN II had exposed them to a new way of working that allowed them to develop new skills and abilities. The team highlighted new skills in relation to project development, appraisal and monitoring systems, community involvement and partnership working; skills which they believe have strengthened the infrastructure to support future regeneration priorities in Le Mantois. The team is now managing the ERDF Regional Competitiveness and Employment funds as well as all the other national and local initiatives targeting Le Mantois.
This was also the case in Porto Gondomar, where the structures that were established (e.g. community and business forums) and the staff that were appointed to oversee the delivery of the programme, are still actively involved in other regional and local regeneration programmes. In this sense, URBAN II has created a lasting legacy by developing a new infrastructure that has empowered local partners, and created new ways of working that successor regeneration projects and initiatives can build on and enhance. This was innovative in Porto Gondomar, where much policy making was centralised at the national level.
In Gijon, a total of 41 local community associations were involved in the management and implementation of the URBAN II projects. The voluntary and community sector partners included local neighbourhood associations, educational centres and foundations, youth associations, sports associations, associations for elderly people and local business associations. The participation of these organisations led stakeholders to believe that the voluntary and community sector could now be regarded as a 'trusted partner' and a 'key player' when it came to the delivery of future regeneration activity. Because of capacity building work, key stakeholders were much more confident that the overall regeneration infrastructure in the city (particularly concerning planning for and delivering regeneration initiatives) was geared towards tackling the real needs and issues in Gijon.
This was also the case in Halifax, where approximately half of the projects were run by voluntary or community organisations. The targeting of the third sector in Halifax was part of a two-pronged approach to strengthening the local regeneration infrastructure. Resources were directed at a Community Development Consortium, which provided four outreach workers to capacity build, fundraise and provide grants to various local resident organisations, as well as funding activities and services that were delivered directly by the voluntary and community sector.

86
Case study example: Building the confidence and aspirations of local residents
It is also apparent that URBAN II has built the confidence and raised the aspirations of residents living in many of the programme areas.
In Le Mantois, one consultee commented that there had been a "return of values to the area" among the local population, particularly in terms of respect for the surrounding environment. Local research suggested that, as the quality of life of people increased, their confidence rose and people were more optimistic about the future, when compared to the situation prior to URBAN II. Stakeholders also believed that resident attitudes had begun to change with respect to the value they placed on employment and the importance attached to gaining a good education.
In Sambreville the development of a training programme, which actively targeted local residents who were unemployed and low-skilled (in order to fill the skills gaps of local companies), was identified as being a key factor in changing the attitudes and aspirations of local people. Stakeholders commented that even when the training did not lead to a direct job opportunity, the programme had the indirect benefit of increasing the "motivation of the population”, especially the more vulnerable ones.
In Gijon, stakeholders commented that older people who had previously felt isolated were now interacting with the community on a much more regular basis and attending other activities as a direct result of being engaged in training events linked to improving employment support.
In Perama, stakeholders commented that local residents had responded positively to physical improvements to local public squares. This had manifested itself in greater resident involvement in local events and activities (e.g. visits to theatres and museums).More generally it was felt that local people were making better use of public spaces (evident through more children playing and people taking walks) as well as through increased usage of local social services.
In Bristol the involvement of young people in the management and delivery of the programme resulted in a number of spin off benefits, particularly in terms of raising their confidence, self esteem, aspirations and employment opportunities. In the words of the Project Manager, one of the key impacts of the programme was "the change that took place between the ears of those young people involved in the programme". 5 young people were able to gain employment in the outdoor activity sector. This reflects the role of URBAN II in helping young people turn their interests into career opportunities, through their experience in managing the programme or as project beneficiaries.
3.9 Factors underlying programme success or failure
As well as the external factors discussed above, important internal issues affected programmes’ overall level of success and failure. Table 3.8 shows these internal factors for the case study areas, with a particular focus on whether it was the URBAN II ‘method’ or funding that was the main success factor. It therefore explores whether methods promoted by URBAN II (integration, multidisciplinary approaches

87
etc) were a deciding factor in a programme being successful, or whether the main driver was simply the money that URBAN II injected into the programme area.
Table 3.9 shows that although both funding and method were important factors in programme performance, the methods and practices promoted through URBAN II were often clear reasons why programmes were deemed to be successful by stakeholders consulted as part in the evaluation.
Of course, if the funding supported projects which were poorly delivered, inappropriate to local conditions or underperformed on outputs, this would have a major effect on the programme’s level of success.
Table 3.9 Critical Success Factors Case study area Factors in success/failure
Arhus A key success factor, particularly in driving change in opinions and attitudes, was the URBAN II method of encouraging resident empowerment and involvement. A large proportion of residents surveyed considered that URBAN II had tried to involve them and that they now had more influence over the area’s future development. In addressing crime issues, the URBAN II method, particularly in promoting the integration of themes, was also a key success factor. For example, a key project to engage socially excluded people and prevent crime was set up by four previously convicted offenders in partnership with a housing association and a family centre.
Bristol Funding for projects which targeted specific issues would seem to be the key factor in addressing the socio-economic issues highlighted in the programme area (i.e. the money was more important than the method), particularly in terms of educational attainment. The critical mass of projects reflecting this theme and concentration of resources in this area were regarded as the main reasons why the context has improved in comparison to the baseline situation. However, key stakeholders’ comments suggest that the URBAN II principles, particularly resident and voluntary and community sector engagement and capacity building (in this case involving young people), were important factors in the success of the initiative and improving conditions.
Carrara The activity funded through URBAN II was determined to some extent by external factors (the 2003 flood) and pre-existing urban regeneration strategy. What URBAN II funded rather than the method or approach developed was key to the relative success of the programme. The integration of infrastructural measures with social, economic and cultural ones, improved residents’ positive perception of the programme. For example, creating the urban bypass contributed to improving the area’s ‘liveability’ (in reducing urban traffic and transport times) and has had repercussions on commercial activity in the city’s historic centre.
Crotone The programme was mainly designed around the priorities of the managing authority, and key stakeholders generally regarded it as having had little impact in the programme area or on the target population. Where the programme did make a positive impact in their target area the more successful projects were those which were less ambitious in nature, aimed to resolve simple problems, did not have a strong strategic focus, and had a built-in exit strategy or were designed to be short-term interventions.
Dortmund Although URBAN II was unable to catalyse a change in socio-economic conditions in the Nordstadt, the methods for developing and implementing

88
Case study area Factors in success/failure
URBAN II activity had a strong bearing on the programme’s success. Key factors include developing a strong evidence base on the programme area’s needs (prior to designing interventions) plus the active engagement of the population. In implementing projects, stakeholders commented that the Nordstadt benefited from the involvement of a range of local organisations, many of which developed model projects from innovative ideas and were treated as equal partners by the city council. The integration of themes was also cited as a key factor. For example, improvements to local parks and green spaces impacted on the environment and on the social dimension and quality of life for neighbourhood residents. This work also attracted visitors to the area, creating an economic impact and changing perceptions of the Nordstadt among people from the rest of Dortmund and further afield.
Gijon Stakeholders commented that the rate of change in local conditions was more apparent in the programme area than other comparable areas because of the intensity of the investments and resources devoted to physical regeneration of the urban public spaces, together with firm support to the local business community and the push towards general access to new ICT for residents and SMEs. Another instrumental factor in driving change was the ‘integrated development path’, which resulted in key city council departments working collaboratively to deliver a range of holistic regeneration projects. For example, a number of council departments worked together on a capital project to build a new waste management and recycling point. This was designed to incorporate public space to hold community events and training sessions on raising awareness of environmental issues.
Graz Where change was apparent (in relation to the physical environment), a ‘pre-URBAN II programme’ was a key factor in shaping the activity subsequently funded through URBAN II. The good relationships between agencies, departments and other local stakeholders were also cited as an important factor in stimulating change. However, it is not clear to what extent URBAN II influenced the development of these relationships. One area where the URBAN II method did influence change was in integrating physical measures with social and economic ones. For example, the creation of a new technical college was linked to improved transport infrastructure and public realm work, and the college also hosted a project for single parent families.
Halifax Targeting a tightly defined geographical area was as a key factor that contributed to the success of the URBAN II programme in Halifax. Engaging a range of local actors from the voluntary and community sector was also regarded as an important factor in achieving change. By working with local partners, the management team successfully targeted specific issues such as unemployment among those over 50 or developing an employment programme for people with disabilities. The integration of URBAN II resources with SRB and the focus on a single regeneration theme (economic measures), as well as URBAN II looking to build on existing projects and structures, was also regarded as a key reason why the programme drove change at the local level.
Le Havre A most revealing statement in the case study report was that: “much more attention and funding is devoted to the southern districts because of URBAN’s ability to make people more aware of the needs of the area and the funding from the programme that encouraged stakeholder organisations to get round the table. The funding drove change and was the impetus to bring key stakeholders together, and helped to lever in additional private

89
Case study area Factors in success/failure
sector investment. It also highlights that the method/approach facilitated change in the programme area too: the focus on a tightly defined geographical area was regarded as important. Integration in the management team (bringing together staff from different local authority departments) and in the projects (for example, the new Media Library offers a range of additional social and educational services) was also regarded as a key success factor.
Le Mantois The funding rather than the method or approach was the most important factor in the programme’s success. Although several successful projects were cited as driving a change in image, there is no evidence that URBAN II principles shaped this change or influenced the level of success. URBAN II being a time-limited programme was a key driving force that brought stakeholders together, rather than a desire to work together in a more integrated way. The key factors influencing the development of the programme were historic (most regeneration programmes in France focus on a single issue) and related to the managing authority, which was a public planning institution with a strong focus on physical development.
Leipzig A key success factor was the evidence base of local need which was developed by engaging and consulting with a range of local actors (e.g. businesses) and residents. This helped to ensure that funded activities were targeted and built on existing strengths (for example, by funding cultural and enterprise-related activities in the Plagwitz neighbourhood district). The programme comprised a large number of small but highly integrated projects, where achievements were quickly visible and built up awareness of and support for the URBAN II programme. However, some stakeholders considered the small size of the projects as a weakness, as it potentially ‘watered down’ the programme’s overall impact (and therefore its ability to drive change); the amount invested per project was seen as too small to make a real difference on a particular issue. The programme’s ability to drive change was also to some extent undermined by external economic factors, particularly job losses associated with the decline of a number of traditional industrial employers.
Perama It is not clear which factors were most influential in stimulating change (i.e. whether the funding and/or the method were most important). However, the creation of an evidence base on the needs and possible solutions for the programme area’s problems was highlighted as one of the main cross-cutting factors associated with the more successful projects. The design phase of the programme included consultation with a range of local actors, which influenced the design and ensured that a large number of small but integrated projects were developed (as well as larger physical ones) to address the needs of the programme area and population.
Porto Gondomar Although it was not possible to identify what role URBAN II has played in driving change in socio-economic conditions, its methods clearly influenced the programme design and delivery of projects. Prior to URBAN II, local stakeholders and other partners tended to work in isolation. By embracing the principles of URBAN II, new partnerships were developed and worked towards a common strategy; a number of integrated and targeted projects were created as a result. Community engagement, which previously tended not to occur, also became commonplace, which helped to ensure that projects responded to local needs.

90
Case study area Factors in success/failure
Rotterdam Where URBAN II drove change (for example, in addressing crime and safety issues), the integration of themes was clearly an important success factor. For example, the interventions for tackling crime and safety included training shopkeepers on safety issues, targeting families and children at risk of offending, and improvements to public spaces and infrastructure to address public perceptions of the fear of crime. However, the URBAN II programme must also be viewed in its broader strategic context. Rather than looking to duplicate or invent new ways of working, the programme built on and enhanced existing methods such as the ‘strategic neighbourhood approach’ to regeneration, which placed strong emphasis on targeting a tightly defined geographical area and integrating themes.
In relatively few instances, URBAN II supported projects that completely failed. In general, a wide range of urban development activities were supported; some were weak, but the majority were relatively strong in achieving outputs and having a positive effect on target groups. Where projects failed, it was generally down to very local issues specific to the project. For example, an enterprise support project underperformed because its premises were not built on time; a health project underperformed because it duplicated another similar project; and a crime project failed because it did not recruit a manager quickly enough.
The URBAN II 'method' was a much more important and overarching factor in determining whether a programme succeeded. Table 3.8 showed that stakeholders referred to critical success factors in terms of how the community was involved in decisions, how the programme encouraged multi-agency partnership working, how programmes focused on tightly defined areas, and how problems were approached in an integrated way. All of these elements came together, to varying degrees to characterise an approach or method by which many URBAN II programmes were developed and implemented. Many of the principles involved were relatively new to the local urban development agenda within host cities, and URBAN II stimulated new partnerships, new methods for engaging with local residents and new projects that combined an economic and physical focus in a way not seen before in many of the host cities. The above points are expanded upon in section 4 which deals with the delivery of URBAN II programmes.
The URBAN II method is dealt with in more detail in Section 4, which covers delivery structures. At this stage it is important to recognise that the URBAN II method was a clear ingredient in the success of programmes. Some of the more strategic stakeholders viewed the funding attached to URBAN II as a useful tool in encouraging urban development practitioners to consider implementing methods attached to URBAN II. The funding was helpful to ensure that stakeholders ‘got round the table’ and was often the initial stimulus that persuaded practitioners to consider, for instance, spending time developing a partnership or consulting with local people.

91
3.10 Conclusions – the outputs, results and impacts of URBAN II
The key evaluation findings from Section 3 based on the terms of reference questions can be summarised as follows.
What have been the results and impacts of URBAN II programmes and how do changes compare to the initial baseline? How do changes compare to general trends in similar non-URBAN areas across the EU?
Assessing the 'achievement' of programmes by looking at their performance against their target output, impact and result figures is not sufficient. It tells us more about target setting (and the programmes' inability to do this accurately) than it does about the 'performance' of programmes.
The scale of outputs and impacts achieved shows that programmes supported a range of varied activities which had an impact on a whole host of issues connected with urban decline. Even though it is difficult to aggregate data (because programmes often did different things or counted them in different ways) there are many quantified outputs for improved physical, social and economic circumstances.
The case studies show that, according to local stakeholders, many of the impacts of URBAN are intangible, or have not been measured. The key impacts were:
• to improve the image of the area.
• to raise its profile.
• to build up the regeneration infrastructure that supports successful urban development activity.
URBAN II stimulated new regeneration approaches and it influenced the way regeneration organisations approached urban decline issues. It promoted and encouraged better methods in terms of, for instance, integration, multi agency working and community consultation and therefore improved and challenged how some cities approached the urban development agenda. The URBAN 'method' was the most important result identified by stakeholders and was often the main success factor for programmes. This is a key evaluation finding as, although URBAN funding was important to initially 'get people round the table', the URBAN method was perceived to be the main legacy.
URBAN II tended not to be the main driver of change, but was one of a number of reasons for areas generally improving. URBAN II supported successful projects that were well received and achieved high levels of outputs, but this did not necessarily lead to any obvious improvements in deep-seated deprivation.
The reasons why URBAN II was not the main driver of change were mainly the time-limited nature of programmes, the lack of scale of the investment, and because programmes generally targeted one small part of a city. The intensity of URBAN II, in terms of financial and geographical scope, set against the scale of the issues facing programme areas, was often the main reason why URBAN II was not seen as a principal driver of change.

92
How have areas changed?
The case studies highlighted a real mix of changes to programme areas during the delivery period of the URBAN programme. Although some areas worsened, a general conclusion from statistical information, but also the views of local stakeholders, was that the conditions in the programme areas stabilised or improved between 2000 and 2006. Educational attainment, crime levels and health levels were improved in many programme areas. However, much of the evidence showed a slight turnaround in fortunes rather than a significant change. The main symptoms of deindustrialisation still remained in place and the issue of expectations concerning what URBAN II could have realistically achieved within its delivery period and with its available resources remains a consideration here.
13 of the 15 case study areas had evidence of a positive change over the period of URBAN II, and the majority of local stakeholders felt that programme areas had generally got better. Positive change was identified through better statistics, the improved physical appearance of neighbourhoods, and also non measured and intangible improvements such as image or the confidence of local communities. Stakeholders often used these more difficult-to-measure changes as a gauge of whether an area had got better or worse, rather than relying on statistical data.
How do changes compare to general trends in similar non- URBAN areas?
In terms of unemployment data, there was no real difference between the rate of change between supported and non supported areas (in the same cities) between 2000 and 2006. Although this could be seen as disappointing, it may be that the programme areas would have declined at a faster rate without URBAN II funding. There is evidence from the case studies that give examples of a narrowing of the gap between key indicators in the programme areas and their host cities.
Have some elements of URBAN II been more successful than others? (e.g. social rather than physical regeneration actions). Should the balance between investments have been different?
There was little evidence to provide a firm conclusion on whether a particular theme or project was generally more successful than others, although programmes that linked projects and themes with one another were seen by stakeholders as being the most successful. The physical projects did tend to be the more high profile projects highlighted by stakeholders but again most of these also cut across economic and social development, providing facilities to support communities and businesses (such as health and community centres, transport infrastructure and business space).
In terms of the physical theme, there was clear evidence of improved land and buildings, the provision of new green space, cycle and footpaths. There was survey evidence of increased usage of spaces and buildings, and increased appreciation of physical improvements in some programme areas. For the economic theme, URBAN II tended to support projects that helped SMEs, providing them with business support and training. Some programmes concentrated on ICT improvements. Generally, stakeholders saw employee training programmes to develop new skills (and to up-skill) as the most effective use of resources under this theme. Training was also a key feature of the social theme, the target mainly being the unemployed (as opposed to employees). Programmes also included a variety of community safety projects (addressing high levels of crime), community capacity building programmes and measures to address drug abuse.

93
4.0 Delivery Structures of URBAN II
4.1 Introduction
This section assesses the delivery mechanisms for URBAN II. It draws on programme documentation, discussions with programme managers and uses evidence from the case studies.
4.2 Summary of key points
• Based on our analysis of all 70 programmes30 local authorities had the lead responsibility for programme delivery in 80% of cases, organized directly thorough a department, or (and most frequently) through a bespoke programme management team employed through the local authority. On a few occasions a third party (e.g. a private organization) was commissioned through the local authority. Local authorities played a lead role in the delivery of 40% of the projects funded through URBAN II, especially the large and more complex physical regeneration and infrastructure projects.
• The local approach to the delivery of URBAN II was a strong feature allowing for a more flexible bottom-up style of delivery that focused on local issues and engaged local partners. It also helped in the involvement of community organizations, some of whom felt alienated from the workings of national and regional bodies.
• The authority programme managers and their teams had on influencing policy makers within their cities was mixed but was more difficult where the programme areas were a small part of the city. Furthermore, it was generally difficult to engage key city policy makers or strategic players – who had a city wide or sub-regional interest – in the workings of URBAN II.
• Strong partnerships were central to the success of URBAN II programmes. Of the 15 case studies, 13 had strong and inclusive partnerships. This translated into an active involvement of a range of partners from the public (all programmes had partners from this cohort), private and community sectors Strong partnerships were in a position to influence and shape the development of URBAN II programmes from an early stage from strategy development through to project implementation. Partnership size was not seen as an issue (10-15 core partners was commonplace) as long as partners were active and were geared up to playing a full role (including leading sub-committees and having a responsibility for specific elements of the programme).
• Capacity building was important in forming strong partnerships. Typically this was focused on voluntary and community organizations (in 9 of the case studies) and involved training and informal learning through joint working. Some of the training was technical (including employment and tax law) and in other cases community organizations were supported during project delivery in order to build their capacity. Local authority officials also benefited from training programmes.
• In most cases the formal programme management ceased after URBAN II funding ended as did
30 According to interviews with Programme Managers

94
some of the partnership structures, although not immediately. This is not surprising and nor is it necessarily negative – URBAN II was intended to create the conditions for sustainable urban development, not the indefinite support of organizational structures. There is evidence of continuing regeneration activity in all of the case studies, delivered by local organizations once URBAN II had finished, and of regeneration skills, learnt by participants being put to good use elsewhere, often in other neighbourhoods in the city.
• Local communities were consulted on elements of the programmes in 10 of the case studies, although consultation in the early stages of programme development was often not carried through to subsequent stages. Most programmes engaged with community organizations but the active involvement of residents in programme management and formal partnership activities proved more difficult to achieve.
4.3 Management arrangements
This sub-section describes the strengths and weaknesses of the management arrangements URBAN II programmes adopted. Although each programme adopted their own management arrangements to implement URBAN II activity, there were clearly a number of defined characteristics which spanned across each of them. These included:
• Decentralised management to the local level: a key characteristic of URBAN II management arrangements was the level of decentralisation which was apparent across programmes. This localised approach to management meant less responsibility for national and regional governments and more power being found at the local, city and neighbourhood level.
• Flexibility and empowerment of local management arrangements: linked in with the above point was the fact that many managers of URBAN II programmes felt empowered in relation to deciding upon the focus and priorities of their own particular programme.
• Local Authority/ City Authority led: 80% of URBAN II programmes were managed by local/ city authorities. Local and or city authorities can bring local knowledge of both the target neighbourhoods and the capacity of partners who could be involved in the delivery of the programme.
Of the range of strengths stakeholders identified, the following were most frequently mentioned:
• Proactive management – URBAN II management teams were very involved in supporting the delivery of projects. 10 of the 15 case studies noted that a proactive management team was a key strength of the programme; this view was backed up by the review of all 70 programmes.
Case study examples: proactive management
In Arhus, the management team’s hands-on role ensured that projects delivered. The team did not simply “sit in their offices counting outputs”, as one stakeholder put it. The team helped project managers to link to other URBAN II activity within the area (to stimulate cross-referral), assisted

95
managers in marketing and public relations, and helped them to establish monitoring systems to effectively record output and financial information.
Bristol’s management team also supported project managers, visiting projects to troubleshoot and resolve any problems they were experiencing.
Localised, flexible management at local level – a key strength of URBAN II management was the level of decentralisation across programmes. This localised approach meant that influence over the programme lay at city level. In all of the 15 case studies programme teams had developed links within local authorities, with relevant departments and officials. Local city stakeholders felt more empowered to make decisions, were free of perceived top down constraints from regional or national organisations, and better understood the issues that programmes were tackling.
Case study example: localised management
In Le Havre, local stakeholders felt empowered in deciding on the focus and priorities of their particular programme, which in turn made the programme more “relevant and appropriate” to local needs. Other French regeneration programmes had often been controlled by regional bodies, influenced by national policy which was less tailored to local requirements.
In Sambreville, the approach was more top down, with management at regional level and key decisions made remotely from the city authority by the regional government. This meant that much of the learning and capacity building on urban development remained at this regional government level with practitioners in the city feeling that they learnt little from the URBAN experience.
• Local authority led – local authorities managed 80% of URBAN II programmes31. Local authorities
brought local knowledge of the target neighbourhoods and the partners, and often had the capacity to manage large regeneration programmes. It was not always local authority staff who were responsible for carrying out management duties with other arms length organisations having a key role.
Case study examples: management by external organisations
In Leipzig and Graz, the local authorities employed an external organisation to manage the URBAN II programmes, bringing in additional capacity, expertise and skills the authority did not have. Similarly, Le Mantois and Halifax assigned management to an external organisation (EPAMSA in Le Mantois, and Action Halifax in Halifax). These organisations were funded to manage the programme on behalf of the local authority, while the authority retained control over the direction and priorities of the programme.
31 According to interviews with Programme Managers

96
Whilst views of URBAN II management arrangements were generally positive, the following weaknesses also emerged:
• Perceived bureaucracy – some stakeholders perceived the programme management and monitoring requirements to be overly bureaucratic. The general perception was also that projects (including very small ones) had to spend a disproportionate amount of time recording activity, spend and output information, and that managers were kept away from actual delivery, spending more time on administrative management than on managing the programme activities. Dortmund and Bristol, for example, noted that project managers were often from small voluntary organisations with little experience of managing larger budgets, but also had no internal financial expertise to support them. However, the extent to which the monitoring that programme managers undertook was sufficient should be questioned, as the level of evidence of targets and outcomes had limitations – more so in some URBAN II programmes and some Member States than others. A key function of the programme manager’s role was to monitor performance – this was a responsibility set out in the funding agreement with the European Commission.
• Lack of trust in management bodies – 5 of the 15 case studies highlighted some partners’ lack of trust of the local authorities managing URBAN II programmes. Local community and voluntary groups, were sometimes sceptical of city authorities because of their control over regeneration funds in the past and the lack of inclusivity in the past when forming partnerships. It should be noted that this lack of trust was more an issue at the beginning of the programme and that as the timeframe went on the level of trust with the local authority increased.
• Lack of experience – some programmes lacked capacity in terms of delivery and management. This was more apparent in those more affluent areas where experience and previous knowledge of delivering regeneration initiatives was more limited, and the management was often outsourced to other organisations in these areas and therefore not embedded within local organisations. However, the use of external organisations can be a positive (as noted above in Halifax), as they provided a solution to any shortfalls in the skills and experience of local organisations.
• Management not embedded in the wider regeneration agenda – problems also arose from the management team not being embedded or involved in broader city-wide regeneration agendas, normally because of their tight focus on the programme and its target area. About a third of managers noted that they were too engaged with the delivery of their programme and were detached from broader strategic thinking concerning the city’s urban development.
4.4 Linkages between URBAN II and wider policy and practice
URBAN II programmes were aligned with other initiatives and strategies in terms of their objectives and vision. 12 of the 15 case studies showed clear alignment and a strong match between what the URBAN II programme was trying to do and what, for instance, the city regeneration strategy or an existing neighbourhood action plan aimed to achieve. Many URBAN II programmes undoubtedly played a role in and added value to wider regeneration agendas within the host city. The following examples provide evidence for this.

97
Case study examples: URBAN II and wider regeneration agendas
Regeneration activity in Le Mantois has been guided for some years by the Mantes en Yvelines project, devised in 1995 and with a budget of over €130 million. The priorities of the URBAN II programme were designed to complement this broader regeneration strategy, ensuring that activities funded through URBAN II benefited from a high level of leverage (i.e. visibility, structures, political support) and from being part of a wider strategy. By integrating URBAN II within a broader development framework, the programme has had a level of impact beyond its original funding allocation. For example, joining the funding streams together to support the building of a larger community facility in the neighbourhood (which has multiple different uses) as opposed to two smaller facilities separately funded by each programme.
In Rotterdam, the URBAN II programme was designed to add value to the objectives of a number of strategies at local and national level. At national level, the Large City Policy (1999-2004) was a key influence on URBAN II, particularly in terms of promoting an integrated, holistic approach to regeneration. The Large City Policy in Rotterdam was translated into a local initiative, Rotterdam op Koers (Rotterdam on course), which promoted a neighbourhood-based approach to regeneration that URBAN II was able to build on and enhance. URBAN II helped sustain many of the projects which the Large City Policy initially developed, including the provision of revenue funding to carry on activities taking place in capital projects originally supported by this programme (e.g. URBAN II supported a business support mentoring project that took place in a incubator facility funded by the Large City Policy)
Prior to URBAN II, the most deprived areas of Sambreville had not benefited from a local regeneration strategy or programme. However, the URBAN II programme, in promoting an area-based approach to regeneration, means that Sambreville now has a 15-20 year policy to guide its regeneration activity, based on the URBAN II strategy.
In 3 case study programmes there was no link between broader city-wide or regional strategies and the URBAN II programme. However, this was because no such strategies existed outside of the URBAN II programme meaning, in the case of Sambreville, the URBAN II strategy became the approach adopted by the city as a whole.
Some programme managers felt isolated from wider city and regional agendas. As URBAN II programmes often covered only a small part of the city, managers’ remits were relatively narrow and their level of influence at the wider level was often questioned, particularly by regeneration managers for the host city or those responsible for establishing regional priorities. This was particularly apparent during the case study research: stakeholder interviewees with a role at city or regional level often lacked any real understanding of the URBAN II programme and saw it as a relatively small element of the city’s overall approach to urban regeneration.
The extent to which URBAN II was integrated into wider policy within the city was complex. URBAN II certainly supported and reinforced wider regeneration policy and added value to the general aims of urban growth, but the extent to which it strongly influenced wider policy was less obvious. This was partly down to the small and well-defined target areas of most URBAN II programmes, but also because they mostly operated within large city areas which had many other regeneration activities targeted on them.

98
4.5 Administrative costs
The terms of reference required an analysis of whether the level of technical assistance was reasonable.
Of the total allocation of URBAN II funds, € 80.5 million (5.1%) was spent on technical assistance. The Nordic countries and Greece spent higher proportions of their allocations on technical assistance activity (around 8%),although even the highest figure under this budget heading (Belfast, with 11.8%) was not particularly high. The case study work helped in understanding some of the variances, but revealed no sign of any excessive expenditure on administration.
Programmes counted some administrative activities as URBAN II ‘projects’, meaning that these costs did not always appear in the technical assistance budget. Examples included mid-term and end-of-term evaluations, promotion/marketing and consultancy (management) costs. This means that the declared technical assistance allocation is somewhat undervalued. However, without a specific audit of programme expenditure and accounts it is difficult to assess how much this was the norm for URBAN II programmes.
Nevertheless, information collected from programme spend data under the technical assistance budget shows that the administrative costs attached to URBAN II were generally in proportion to overall spend allocations. It can therefore be concluded that the level of technical assistance was reasonable and corresponded to the needs of managing the programmes.
4.6 Delivery of projects funded by URBAN II
Table 4.1 Delivery of URBAN II projects by organisational type
Organisational type Proportion of projects led by organisational type Local/city authority 40% Mainstream partner (police, health authority, housing)
40%
Voluntary/community 10% Other 10% Source: ECOTEC analysis of all 70 URBAN II programmes
Table 4.1 shows that URBAN II projects were mostly delivered by public sector organisations and local authorities in particular. It was rare for the voluntary and community sector to play a direct role in leading URBAN II projects, although they may have been actively involved in aspects of delivery without actually managing the project. It was noted that local authorities were well placed to lead on many URBAN II projects because they were large organisations which had a board set of skilled staff who had good access to information and who could bring together (relatively easily) a broad range of partners.
The following key issues relate to the types of organisation delivering URBAN II projects:
• In almost all cases, local authorities were responsible for managing physical regeneration projects. However, the nature of some of the physical regeneration projects meant that local authorities were often the best placed organisations to lead such initiatives, particularly the larger and more complex

99
projects. For example, the development of a road in Perama, would normally be led the local authority (as it was the case here).
• The small number of projects managed by voluntary and community organisations were almost all concerned with the social regeneration theme and dealt with matters such as community development, capacity building and resident engagement.
• Programme managers perceived that mainstream partners fared better than non-mainstream ones when it came to capacity to deliver; they were more able to deal with the rigours of managing an EU-funded project (including monitoring, expenditure reports) and had previous experience to ensure that outputs and results were more likely to be achieved.
4.7 Local partnerships in URBAN II
4.7.1 The strength of partnership working
The level of partnership working was generally a strength of URBAN II. Our assessment of the strength of each programme’s partnership32 showed that 47% of URBAN II programmes had very inclusive partnership arrangements, 36% had relatively inclusive partnerships, and just 17% were generally not inclusive. 13 out of the 15 case studies identified their partnership structures as either ‘strong’ and/or ‘inclusive’.
Stakeholders referred to a ‘strong partnership’ in a variety of ways. Some perceived good partnership working to be about involving as many people as possible in the monitoring committees. Others saw strong partnerships as including new types of organisations or giving local organisations a voice.
Case study examples: partnership working
Local stakeholders in Sambreville thought that the most important impact of URBAN II was that the programme has encouraged collaboration and helped to develop new partnerships in the city. The programme provided the impetus to bring together local businesses, associations and public organisations whose previous perception was that they could not work together. It helped to promote a common understanding of the key issues and priorities in the programme area, and encouraged partners to work collaboratively to develop integrated solutions. Many of the partnerships developed have been sustained post-URBAN II. For example, the Industrial School in Sambreville continues to work with GABS (a local social association) on an initiative to develop a new training programme (for local people with low skill levels).
In Carrara, partnership working contributed to the success of URBAN II. The continuous involvement of social and economic institutions during the planning and implementation of the programme helped the managing authority to respond to the problems in the programme area. In addition to the institutional
32 Assessment was made on inclusiveness (the extent to which a wide variety and high number – over 6 – of partners were involved), partners’ role (whether partners were observers or more involved in leading key elements/decisions) and level of local involvement (the extent to which local players, including the local community, were involved in the partnership and the nature of their involvement).

100
stakeholders, trade associations (from industry, artisan craft trades, small businesses, commerce and tourism) and NGOs were involved in the programme partnership. With the exception of the industrialist’s association, all the partners actively participated in all phases of the programme.
In Arhus, local community organisations (with close contact to the resident target groups) initiated a number of projects, and were heavily involved in managing and administering regeneration activity. An executive committee (comprising representatives from the public, private and community and voluntary sectors) was created to work with local partnerships and build the capacity of community organisations, so they could manage projects throughout their lifecycle.
In Dortmund, a number of local networks existed before 2000. However, key stakeholders believed that partnership working has intensified as a result of URBAN II. They also perceived that the programme has been the driving force behind the creation of new forms of networking and joint working. URBAN II has also helped to build local capacity by promoting networking which is independent of the city council; examples include companies liaising with each other through the local business associations, resident forums as part of neighbourhood management, and resident juries supervising the work of projects.
4.7.2 Approaches to URBAN II partnerships
Although programmes adopted a wide variety of different partnership approaches, some key characteristics could still be identified:
Relatively large and broad partnerships – a key characteristic was the number of organisations involved in each partnership. On average, each partnership had approximately 10-15 core partners, and many had additional sub-groups or wider partnership groups. Partnerships were also relatively broad in the types of organisations involved, often with partners from the health, crime, housing, employment, and training and education domains (which shows the holistic approach adopted by most programmes). Table 4.2 gives a breakdown of partner type across URBAN II programmes drawn from the analysis of programme documentation and discussions with programme managers.
Table 4.2 Composition of URBAN II programme partnerships
Partner type Number and proportion of the 70 URBAN II partnerships containing organisational type
Local authority/city government 70 (100%) Employment agency or organisation addressing unemployment issues
60 (85%)
Training and education providers and professionals addressing low skills/poor educational attainment
56 (80%)
Development agencies and planning authorities
56 (80%)
Law enforcement and community safety organisations and professionals (such as police)
42 (60%)

101
Partner type Number and proportion of the 70 URBAN II partnerships containing organisational type
Health authority and health professionals
35 (50%)
Regional/national government 18 (25%) Community/resident/voluntary groups 14 (20%) Private companies/enterprises 7 (10%)
Source: ECOTEC analysis of all 70 URBAN II programmes
• Empowered partners – the organisations involved in URBAN II partnerships seemed relatively empowered regarding their level of influence on the programme’s priorities, including its spending. Partners played an active role in management arrangements; they had authority to affect the programme’s direction and spending patterns (as opposed to simply attending partnership meetings, for example).
However, URBAN II partnership arrangements also typically lacked the following:
• Local residents on core URBAN partnerships– Community members (i.e. local residents) were rarely in the main partnership group. Some URBAN II programmes had residents in their main partnership, but the majority engaged with communities through specific sub-groups or through one-off consultation exercises (community forums).
• Participation by key individuals – about a quarter of programme managers found it difficult to encourage key strategic players onto their URBAN II partnership. As programmes were often concerned with just a few neighbourhoods within a city, it was sometimes difficult to secure the involvement of key individuals with more of a city-wide remit (e.g. head of city development, director of regeneration). Often, cities had a number of area-based programmes each focused on different target neighbourhoods and all with their own partnership arrangements. The focus of URBAN II on smaller areas was a key reason why some felt that their partnerships lacked real influence at city level, and why partnerships sometimes felt detached from the city’s wider regeneration agenda. In Arhus, the partnership was strong on community representatives, which some stakeholders felt was at the expense of involving more strategically influential stakeholders, including the person in charge of the city authority and the local development organisation.
• Sustainability – partnerships’ sustainability after the end of the URBAN II programme was an issue although it was not an objective to maintain delivery structures post URBAN II. Some 80% of the formally constituted URBAN II partnerships ended once the funding finished as might be expected. Partnership sustainability seemed to be an issue because of a lack of purpose once the funding was spent, and acceptance that the partnership’s scale and scope needed to be rethought after its principal function had ceased to exist. Partnerships which continued usually took responsibility for another funding stream, which suggests that the existence of funding is essential for the sustainability of partnership arrangements. For example, the Halifax programme was managed by a partnership run by Action Halifax, which struggled to find a role for itself post-URBAN II and itself closed in December 2009 along with its associated partnership arrangements.

102
4.7.3 Involvement of private and voluntary sector partners
The case studies provided useful insights into the level of private and voluntary sector involvement in URBAN II partnerships. Partners from these two sectors often struggled to be heard above public sector partners, who dominate regeneration partnerships:
• Private sector representatives were both programme participants and recipients of URBAN funding in all but 2 of the 15 case studies. In most of these cases, private sector representatives were partners on the Monitoring Committee or associated sub-groups. They tended to play an equal role to their public sector counterparts in decision-making, and in one case (Halifax) a private sector representative chaired the URBAN II partnership.
• All but 2 case studies highlighted that they were trying to “create an environment to stimulate private sector investment” where inward investors and property developers would be encouraged into an area on the back of an injection of resources from URBAN II. For example, in Leipzig the physical regeneration projects for improving the area’s image aimed to kick-start more private sector investment from property developers, with the programme “laying the foundations and building blocks for the private sector to show interest in the area”. Programme managers felt that the private sector was a key stakeholder, and recognised that the public sector (with URBAN II resources) was only part of the solution in tackling the decline of their neighbourhoods.
• The voluntary sector was a key recipient within most programmes too. Nine of the 15 case studies supported voluntary organisations to build their capacity. Most of the case studies saw the voluntary sector as a key player to involve if URBAN II were truly to regenerate their area, but also that voluntary and community organisations needed support before they could play a meaningful role in the regeneration process.
Case study example: capacity building voluntary organisations
Le Havre developed a capacity-building programme for local voluntary organisations on topics such as internal management, financial control and funding applications, so that they were “more professional” (as stakeholders put it) to deliver projects. Local stakeholders felt that the voluntary sector saw capacity building as a way of promoting a lasting legacy for their programme. This was because the newly strengthened voluntary sector could continue to play an important role in the local regeneration agenda post-URBAN II and carry on supporting target groups, building on what they had learnt from their experiences of URBAN II.
• 5 of the 15 case studies used the voluntary sector to contact hard to reach communities that were
hard to engage with. Most of the voluntary organisations had better links into local communities than did their public sector counterparts – partly because they were often based within programme areas, but also because local people tended to trust them more than the city authorities. In 9 of the 15 case studies, the voluntary sector was an active deliverer of projects, particularly those on social regeneration.
• In 4 of the 15 case studies stakeholders felt that the voluntary sector was viewed as being a ‘riskier’ delivery partner than the public sector. Some stakeholders perceived that voluntary organisations

103
lacked a track record and experience, particularly in delivering European-funded projects. However, as a majority of the case study programmes funded projects led by the voluntary sector, they clearly felt the risk was worth taking (although it was unclear whether any of the concerns about using the voluntary sector came to fruition).
4.8 Capacity building of partners The partners who felt that their capacity had been built most through URBAN II were those which had not previously been involved in similar regeneration activity. Voluntary and community sector partners in particular felt stronger because of involvement having had experience of managing a European-funded project. In many cases voluntary and community sector partners had established financial and data monitoring systems which they continued to use, and were more professional in their marketing and communication to reach out to their target groups. This specific capacity building of voluntary sector partners was seen in 9 of the 15 case studies, and brought lasting benefits to organisations well beyond the lifetime of URBAN II.
Case study examples: capacity building in voluntary and community sector partners
In Arhus, URBAN II had a specific capacity-building programme for voluntary and community organisations so they could better deliver projects to their target communities. It consisted of training on organisational management, financial control and maintaining robust organisational systems (from health and safety through to employment law and tax).
In Halifax, the Monitoring Committee commissioned voluntary and community sector organisations to deliver regeneration projects, rather than simply working with mainstream providers; approximately half of projects were delivered by the third sector. This strategic decision not only enabled the programme to support the hardest-to-reach groups, but also helped to build the capacity of the voluntary and community sector so that it became more professional and was able to diversify into new types of provision for its target groups. Halifax also funded a Community Development Consortium, with four outreach workers to provide additional help to build capacity, fund raise and provide grants to various local resident organisations.
Although URBAN II featured fewer instances of capacity building with core organisations in the regeneration field (e.g. city authorities), the case study work still uncovered some clear examples. Most of this capacity building was in teaching city authorities how to approach regeneration activity in a slightly different way, and certain new techniques when it came to planning, managing and delivering regeneration activity.
Case study example: capacity building within a city authority
In Perama, the Municipality’s inexperience in managing and administering regeneration projects was a weakness in the programme, resulting in delays and inefficiencies in the early stages. However, over the course of the programme the Municipality’s capacity was built up, particularly the technical team’s capabilities in monitoring and implementing complex regeneration projects. One key lesson the technical team learnt in programme management was the amount of time and resources needed to plan and monitor physical regeneration projects.

104
URBAN II also helped to build the capacity of city authorities to work more collaboratively with partners, involve the community, promote a bottom-up approach and adopt a holistic, integrated dimension to their regeneration agenda. The extent to which city authorities felt that their capacity had been built differed greatly across programmes, and was often related to how much previous experience they had of neighbourhood regeneration.
Caution is needed in concluding that URBAN II was key to building core regeneration organisations’ capacity to (for instance) work in partnership or adopt an integrated approach, as most had been working along these lines prior to the existence of URBAN II. Capacity was not built as much as it could have been in 4 of the 15 case studies (Graz, Crotone, Leipzig and Halifax) because these programmes used external organisations, usually management consultants, to oversee their programmes. This meant that the skills and experience often remained external to the city authorities.
Nevertheless, stakeholders highlighted capacity building as a key factor, as illustrated in the case studies above. For some smaller partners, the experience of URBAN II has strengthened their organisations in the long term. For larger regeneration players, including city authorities, URBAN II often reinforced existing capacity and skills within their regeneration approach.
4.9 Analysis by typology Table 4.3 highlights differences in the levels of partnership inclusiveness for the two main cluster groupings of programmes identified in Section 2. The latter group (with high spend on physical regeneration) generally had less inclusive partnerships: three times as many programmes in the physical regeneration meta-cluster had ‘non-inclusive’ partnerships compared with those in the social and economic regeneration meta-cluster.
The majority of programmes in the social and economic regeneration meta-cluster had very or relatively inclusive partnerships because of their focus on the ‘people’ side (e.g. tackling skills gaps and worklessness, dealing with health and community safety issues) of the regeneration agenda.
Table 4.3 Typology analysis for partnership inclusiveness
Cluster 1: mixed programmes covering all three themes
Cluster 2: physical regeneration focus
Very inclusive partnerships 18 15
Relatively inclusive partnerships 8 16
Not inclusive partnerships 4 9
Total 40 30
Source: ECOTEC analysis of URBAN II programmes

105
4.10 Involvement of local communities
Our review of the 70 programmes indicated that around 60% consulted with local people, using a variety of methods such as surveys, workshops and community meetings. A higher proportion of the case studies (10 out of 15) showed evidence of community consultation.
Case study example: local community involvement
In Halifax, community engagement and empowerment were designed into the programme from the start. A key strength of the programme was the Monitoring Committee, whose broad representation included people living in the target neighbourhoods. This wide ranging group of individuals ensured that discussions considered a range of viewpoints, including those of local residents and local business people (the chair was a local businessman). The programme also empowered the local community by placing residents at the heart of the programme’s key decisions. This was particularly the case for funding allocations and project appraisal, with local people always sitting on the appraisal or approval committees.
Views were mixed on the extent to which local communities influenced the focus and direction of their local URBAN II programme. However, a number of characteristics defined programmes’ overall approaches to involving local communities:
• Most community consultation was done at the inception stages of the programme, and effort to engage residents seemed to drop off further into the programme’s life. The community consultation focused on identifying need and issues within the programme area (to then design programmes and projects around them). But there was little evidence of community consultation actually influencing funding decisions or decisions on how the programme should tackle the problems identified.
• Many programmes consulted with local people through existing channels (such as resident panels and community forums) in the context of other regeneration activity. Only a small number set up specific engagement mechanisms related specifically to the URBAN II programme and its associated activity.
The quality and depth of community involvement was therefore mixed. Despite instances where programmes were relatively proactive in engaging with local people in a meaningful way (through electing local people onto their core partnership or having a resident sub-group), this was not the norm. However, some URBAN II programmes relied on their projects to consult with local people and businesses rather than organising and leading engagement work themselves at programme level. Hence some programme managers were unsure about the real extent of resident involvement, as this was done at the next level down within the delivery structure.

106
4.11 Sustainability of URBAN II programme legacies
4.11.1Sustainability of programme activities
All URBAN II programmes have now finished. So when stakeholders in Crotone, for instance, were asked “what has happened to the ‘Making Crotone more Attractive’ programme?” (the original name of the URBAN II programme), they said it had come to an end and had not continued post-URBAN II funding. Similar points were recorded in 14 of the 15 case studies but whilst URBAN II programme had finished, regeneration activity was often continuing within the programme area under another banner or guise.
While the actual projects funded by URBAN II have not carried on, much of their content, concept and ways of working have been incorporated into other activities and are continuing, as in the following case study examples.
Case study examples: sustaining URBAN II activities
The programme manager in Arhus estimated that up to 50% of the URBAN II activities have been sustained in some form or another, mainly through other organisations taking on funding responsibility. The education and employment guidance for young people and parents has been incorporated into a new youth guidance centre, funded nationally.
The programme managers in Sambreville and Le Havre said that over 80% of activities were continuing post-URBAN II, while in Halifax 60% of activities supported through URBAN II could still be found in the programme area.
URBAN II projects and programmes were not simply continued in the same way and under the same title, but evolved and aspects of them were passed on to other regeneration programmes or funding streams post-2007. This is a successful outcome and part of the legacy of URBAN II.
Case study evidence showed that some project activities simply came to an end because they finished naturally or were no longer required. For instance, almost all of the physical projects had been completed because their construction phase was over. Their continued legacy was often viewed in terms of buildings still in use, such as a community centre or a business incubator. None of the case studies found capital projects unsustainable because they were unable to secure revenue funding (an issue that physical regeneration programmes and projects sometimes suffer from).
Despite activities continuing post-URBAN II, there was little evidence of programmes developing robust exit or continuation strategies that helped to plan the continuation of their activities. About half of the case study interviewees felt that although regeneration activity was still very much present in their areas, the main driver for this was often the continued need to focus resources on areas of greatest need and disadvantage.
4.11.2Sustainability of impacts
Most stakeholders saw the main long-term impacts sustained post-URBAN II in terms of ‘approaches to regeneration’ – the URBAN II 'method' – with key examples being the lasting legacy of inclusive local

107
partnerships, integrated approaches to delivering regeneration and the involvement of local communities through community consultation and empowerment.
Case study examples: lasting impact of URBAN II
The main long-term impact of the URBAN II programme in Graz (West) has been its influence on an integrated urban development strategy for the regeneration of Graz South (which has attracted approximately €3m of national and regional resources).
In Arhus, the programme’s key lasting impact has been its influence on supporting a greater geographical focus in regeneration and development policy, partly evidenced through the development of the neighbourhood plan for Gellerup, which represents an effort to implement an integrated approach into mainstream regeneration policy.
Since many stakeholders saw the long-term impacts of URBAN II in terms of influence and approaches, very few quantified lasting impact as the jobs created post-funding or new businesses that have moved into an industrial area improved through URBAN II. Often they did not know what had happened since URBAN II had invested in (for instance) a business support project, or simply because they could not articulate the lasting impact of an investment in, say, a green space improved by URBAN II three years ago.
Stakeholders often referred to capital projects as lasting impacts of the programme. For instance, the creation of a theatre, museum and public square in Perama was seen to have created a “lasting impact in the form of increased tourism to the programme area as well as providing much-needed public realm space for local people to enjoy”. But stakeholders in the city were unsure about how many more visitors had come to the area as a consequence of the project, how much they may have spent in the local economy, and how many new jobs have been created.
4.11.3Success factors and barriers
A range of factors stimulated a lasting legacy for URBAN II programmes and projects. These are explained in more detail in the separate case studies, but are highlighted in outline here:
• In case study areas which had strong local involvement (including local people and local neighbourhood organisations) in the design and delivery of regeneration activity, the legacy of the programme appears to be more assured. This legacy was usually expressed in terms of building the capacity of local organisations (especially in the voluntary and community sector), which continued to deliver regeneration projects post-URBAN II, thus increasing the legacy.
• When URBAN II helped to develop a new regeneration strategy or simply a clearer vision for the programme area, the level of legacy and sustainability was greater. This was because the improved or clearer strategy was then taken up and continued beyond the life of the programme. For example, the programme in Sambreville led to the development of a long-term strategy for the city which remained the main document informing future activity in relation to regeneration post URBAN II.
• Rather than dispersing resources across the whole of a city, the focus on a very tightly defined geographical area was also important in creating a lasting legacy. If a programme created enough

108
critical mass and momentum in a small neighbourhood, this was often to “hold stakeholders’ attention” on the neighbourhood post-URBAN II, much more so than if the programme was broader.
However, there were also barriers to sustainability and the legacy after URBAN II:
• The time-specific nature of URBAN II programmes meant that managers often left prior to the end of the programme’s life. Around half of the programme managers left their posts before the final year of the programme (most moved on to other positions, usually within the same city or local authority). This was cited as one of the main reasons for the lack of a concerted effort to develop a proper exit strategy for programmes, as those who replaced the managers were often concerned with completing the programme’s contractual obligations rather than thinking strategically about sustainability.
• Since most URBAN II programmes focused tightly on small geographical areas, it was more difficult for some partnerships to attract key players from mainstream organisations (who often worked at city level and had less capacity to be involved in area-based regeneration initiatives).
4.12 Conclusions – the delivery of URBAN II
The summary from Section 4 based on the terms of reference questions is as follows:
What were the levels of partnership working like for URBAN II? Were municipalities and local actors involved in the design and implementation and how has this influenced programmes?
Partnership working was generally strong and inclusive. Partnerships were large and broad, involving a range of players from the grassroots upwards. Partners were also empowered to make decisions on funding allocations and strategic direction.
Local authorities were key players in URBAN II, they managed the majority of the programmes and delivered a good proportion of the projects. Most programmes were managed at city level by the city authority, giving control at the local level which all stakeholders welcomed. City authorities usually had the capacity and experience to manage a large regeneration programme, though not all had a previous track record of coordinating URBAN II-type programmes (leading some to outsource management to external organisations).
Local people were often consulted but not necessarily found within key decision making bodies although voluntary and community organisations were often an important benefactor of URBAN II funds.
Evidence about the role and involvement of the private and voluntary sectors was mixed, although the case studies found that these groups had a useful role in programme development and management.

109
How well have the programmes been managed in terms of selection, monitoring, evaluation etc? What have been the key factors underlying the success of management?. Have administration costs been reasonable and proportional? Where municipalities have been in the driving seat, how have they fared?
Management strengths included proactive managers who were ‘hands on’, and managers who understood the local needs of programme areas and communities. Weaknesses of the management arrangements included a lack of trust during the programmes early days (usually linked to the city authority’s previous efforts in managing similar programmes) and a high levels of requirements linked to monitoring (even for small projects). Another key issue was managers of URBAN II programmes not being part of, or linked into, wider regeneration agendas within the host city. This was a key issue and it affected the ability of URBAN II to influence the wider regeneration agenda of the city and the work of other agencies working on the urban agenda.
Monitoring and evaluation of programmes were mixed (an issue also highlighted in section 3). Programmes often did not set targets, were seen to 'over' monitor (even small) projects and impact information was limited at best. The use of the monitoring data is therefore relatively limited in terms of understanding the 'difference' URBAN II made (again, an issue mainly dealt with in Section 3).
Despite these weaknesses, the management of URBAN II was seen as a strength and a highlight of the programme overall.
The administrative costs associated with URBAN II was limited. Of the total allocation of URBAN II funds, €80.5 million (5.1%) was spent on technical assistance which is not untypical. The case study work helped in understanding some of the variances, but revealed no sign of any excessive expenditure on administration activity.
How successful have programmes been in building the capacity of local partners and the links between partners? What factors underlie success and failure?
Capacity building was a key success, and was particularly demonstrated in the case studies. For some smaller partners (particularly the voluntary sector, but also smaller city authorities), the 'experience' of URBAN II has strengthened their organisations in the long term. They have been up-skilled in terms of managing and/or delivering integrated regeneration programmes. This was highlighted as a lasting legacy of the initiative.
For larger regeneration players, including city authorities, URBAN II often reinforced existing capacity and skills within their regeneration approach, although even these stakeholders learnt from URBAN II’s integrated, bottom-up and holistic approach. This 'impact' of URBAN II is perhaps greatest in terms of how it has built capacity among urban practitioners.
What is the link between URBAN II and the wider policy of the city?
The extent to which URBAN II programmes were integrated into wider policy within the city was complex. URBAN II reinforced wider regeneration policy and added value to the overall goal of strengthening the urban area and its communities. However, the extent to which URBAN II programmes actually influenced wider policy was limited in most cases. This was partly because of the small and well-defined target areas

110
of most programmes, but also because they generally operated in large city areas which had many other regeneration activities targeted on them.
To what extent are the impacts of URBAN II likely to be sustainable?
Much of the content, concept and ways of working or URBAN II projects and programmes have been incorporated into other activities. About 60% of activities are still evident post-URBAN II, although they have evolved as they have been incorporated into new structures and funding regimes and been delivered by different organisations. However, there was little evidence of programmes or projects developing robust exit or continuation strategies to help promote or plan their sustainability.
Most stakeholders perceived the main long-term impacts of URBAN II in terms of ‘approaches to regeneration’ as opposed to actual hard impacts (such as jobs created or businesses supported). They found it hard to articulate or prove the lasting benefits, mainly because they had not invested time in understanding (for instance) whether the businesses supported were still in operation or had grown since being helped by an URBAN II project.

111
5.0 The Evaluation of URBACT I
5.1 Introduction
This section presents the main findings from the assessment of the first URBACT programme (2002-2006). The interim report provides a more detailed description of the evaluation and the approach used, as well as the objectives and context for the programme.
5.2 Summary of key points • The URBACT I programme was part of URBAN II with a separate budget of €18.03m (€28.2m
including match funding). The objective was to identify good practice and promote an exchange of experience from urban development projects, including those funded under URBAN II. URBACT was not approved until 2002, and did not start until early 2003. There was no opportunity therefore to build URBACT exchange into URBAN II programmes during their inception stage.
• URBACT I supported a range of interventions including thematic networks, studies, training, working groups and the deployment of experts to help promote knowledge transfer. URBACT continues under a second programme (not subject to this evaluation), URBACT II. Many participants reported that their project activities led to a considerable flow of ideas and lively exchanges and discussions among participants from different European cities. There was significant personal benefit to participants, but more those involved in face-to-face networking.
• Some elements of URBACT I had a greater take-up than others. There were for example, 20 thematic networks involving 248 cities and more than 4,000 individuals, whereas only 10-12 networks had been planned. Demand was limited for transnational training exercises and only three cross-cutting thematic working groups were established, mainly because prospective partners had not built in the time or budget to participate.
• Interest and participation levels also varied between Member States. Most interest, came from the (then) EU-15 with a history of involvement in urban programmes, but 28% of the cities participating in the thematic networks were from the newer EU-10 Member States, including Romania and Bulgaria (not EU Member States at that time). Interest from the new Member States increased during the period. Participation was lower in Member States (such as Germany) where active, alternative networks were already well established.
• Most participants were drawn from local authorities and similar organisations. In many cases the participants were 'European officers' with good language and networking skills but limited grounding in urban development. A lack of interpretation at network events (and the use of a single language, usually English, for written communications) was a barrier to participation for some. Overall, individuals rather than institutions got the most benefit from URBACT I, with limited dissemination and follow-through between those directly involved and colleagues in the same organisations.
• The focus for networks and other exchanges was also an issue, with examples of both overly restrictive and overly broad (or sometimes ambiguous) themes, lacking focus. Those interviewed

112
also said that they derived more benefits from active participation in events, rather than through written materials. The search facilities on the URBACT website also attracted some criticism (e.g. difficulties in finding documents, or specific parts of documents).
• The pattern of achievements of URBACT I in influencing urban policy thinking and working in tandem with other networks is patchy. We cannot point to specific influences on policy and URBACT tended to work alongside other networks, but separately. In turn though, this has negated concerns of duplication of activity. URBACT I provided an exchange of material and experiences that was generally not covered elsewhere.
• Overall, URBACT I was a meaningful, successful initiative that achieved its objective to promote good practice in urban development. This was sometimes difficult, and barriers – particularly relating to transferability (from one location to another, but also from individuals into their organisations) – sometimes hampered progress. Those responsible for URBACT II are aware of these issues and actions have been put in place to overcome the shortfalls identified here.
• Although many individuals involved in URBAN II took part in URBACT projects, the direct links between URBACT and URBAN II were often limited. This could partly be seen as a lack of complementarity between EU funding streams, but the timing of the URBACT launch and its much wider target audience (within and beyond URBAN II cities) made it inherently difficult to fully integrate the two programmes. URBAN II would certainly have delivered regardless of the existence of URBACT I, although many URBAN II practitioners valued the opportunity of learning together, a message URBACT aimed to promote.
5.3 Background and objectives of URBACT
The Communication establishing URBAN II33 stipulated that programmes should make provision for exchange and dissemination of their experiences. An indicative financial allocation of €15 million was made for identifying good practice and facilitating structured exchange of experience derived from the Urban Pilot Projects, URBAN I and URBAN II.
URBACT I was approved in 2002 for a period of four years, with a budget of €28.42 million (including €18.03 million from the ERDF). As no equivalent EU-level initiative had existed under URBAN I, and URBAN II programmes had already started in 2000, the managers of URBACT I not only entered new territory, but also had to begin implementation very rapidly when the programme started in the first quarter of 2003.34
33 Communication from the Commission to the Member States of 28 April 2000 (2000/C 141/04), Articles 14 and 15. 34 From the outset, France offered to support the programme by providing a management and payment authority and hosting the secretariat.

113
URBACT’s aim was to identify good or effective practice in one location and promote the use of lessons extracted from this practice in other urban locations. As such, the programme sought to promote the flow and application of knowledge on an EU-wide scale. This knowledge transfer process lay at the heart of the programme’s rationale and had an important bearing on our consideration of its results and impacts.
5.4 What outputs has URBACT achieved? The programme was broadly successful in disbursing the financial resources at its disposal within the programme period, although encountered difficulties in spending the funds initially allocated to ‘qualification’ actions, studies and programme-level information tools.
URBACT I was also generally successful in delivering the programme-level outputs (projects/activities) envisaged in the programme document. These outputs, along with the original output targets and budgetary allocations, are summarised in Table 5.1.

114
Table 5.1 URBACT I outputs Measure Original target outputs
(indicators) Original budget allocation
Final budget (total)
Final budget (ERDF)
Outputs achieved
Thematic networks
10-12 networks involving around 1,000 people
€12.4m €12.4m (43.6%)
€6.1m (33.8%)
20 thematic networks nominally involving 4,301 people 2 fast track pilot networks to test URBACT II (Task One)
Qualification 20-30 seminars involving 400-600 people
€2.4m €1.66m (5.6%)
€782,013 (4.3%)
4 qualification projects (29 meetings and 230 participants) Annual conferences
Studies 5-10 working groups 2-6 studies
€600,000 €340,800 (1.2%)
€125,000 (0.7%)
3 studies
Information tools Programme website 5 publications a year
€4.1m €3.52m (12.4%)
€3.17m (17.6%)
Programme website and monthly newsletter 4 URBACT thematic seminars 6 ‘thematic dossiers’ and 2 ‘virtual files’ for website Participation in external events (e.g. URBAN futures 2.0)
Coordination Provision of experts Organisation of meetings
€4.4m €5.43m (19.1%)
€4.85m (26.9%)
3-4 secretariat experts 52 thematic experts, supporting networks Support for 46 cities from new Member States and neighbourhood countries to participate in networks/working group as ‘experts’ Support for Cities initiative (43 cities)
Working groups Support for working groups (no target specified)
€1.5m €2.22m (7.8%)
€1.49m (8.6%)
8 working groups initiated by public authorities 3 cross-cutting thematic working groups35
Technical assistance 1
Operation of the programme secretariat
€2.4m €2.39m (8.4%)
€1.29m (7.1%)
Salary costs of 1 director + 5 staff Operational expenses of staff Preparing Programme Monitoring Committee
Technical assistance 2
Evaluation and communication expenses
€446,936 €446,936 (1.6%)
€222,968 (1.2%)
Evaluation (mid-term, ex-ante) Management information system Communication officer salary costs
TOTAL €28.42m €28.42m €18.03m Source: ECOTEC analysis of URBACT
35 1) Local economic development; 2) The role of inhabitants in public urban management; 3) Adapting public services to the integrated approach.

115
In quantitative terms, URBACT I supported more thematic networks than originally envisaged (20 compared to 10-12), bringing together 248 partner cities and, nominally, involving at least 4,301 people. Many cities participated in more than one network, however, meaning that the total number of individual cities taking part was lower. Also, definitions of ‘people involved’ – one output indicator specified by the programme – varied across networks and, in the case of those dealing with citizen participation for example, included people who attended public meetings and similar events. In addition, resources from the Thematic Networks measure of URBACT I were used to support the preparatory tasks of two pilot ‘fast track networks’36 for URBACT II, within the context of Regions for Economic Change. The implementation of these networks was supported by URBACT II; but their work has not been examined in detail in our evaluation.
In contrast to the thematic networks, the measures on qualification and studies attracted less interest from cities and did not evolve in line with original expectations. Although four qualification projects were supported (three of which focused on the new Member States – the EU-10), it proved difficult to find cities to lead transnational training exercises not linked to thematic networks. Three studies were funded, but again, demand was limited.
The Working Groups measure was used to support two types of working group: eight initiated by various public authorities (bottom-up), and three cross-cutting thematic working groups initiated by the programme secretariat to bring together participants and findings from different thematic networks and distil common lessons. In practice, those of the first type were similar to small thematic networks, but were notable for involving non-city partners, such as regional authorities. The Cross- Cutting Thematic Working Groups were initiated in 2005 with the aim of strengthening capitalisation of lessons learned. It proved difficult to persuade network partners to participate, as budget and time for these activities had not been built into their work programmes. As a result, only three working groups were implemented, rather than the four initially planned.
5.5 Who participated in URBACT? Of the 24837 cities in URBACT thematic networks,38 72% were eligible cities from the EU-15 (having participated in URBAN or Urban Pilot Projects), 25% came from the EU-10 Member States, and the remaining 3% from cities in neighbouring countries (including Bulgaria and Romania), universities, NGOs or networks. The highest levels of participation in thematic networks came from Italy and Spain, followed by the UK and France. Germany was the only EU-15 Member State notably under-represented in relation to its size. The commonest explanation39 was the existence of a well-established city exchange network in Germany (a practice less developed in other large Member States).
Cities from the EU-10 could participate in networks as a full partner, making a financial contribution to the network, or as an expert partner, receiving 100% funding for travel and subsistence costs from the Coordination measure of the programme. Most newly eligible cities chose to participate as expert
36 MILE, led by Venice, and URBAMECO, led by Grand Lyon. 37 This is the number of network partners rather than individual cities (some cities participated in more than one network). Data will be updated when the consolidated list of participating cities is available. 38 A total of 248 project partners, but some participated in more than one project. 39 Interviews with representatives of the Deutsch-Österreichisches URBAN Netzwerk and URBACT Secretariat.

116
partners. However, this evolved over time and by the end of the programme EU-10 cities had participated as full partners in networks in 38 cases,40 including as lead partner in the HOUS-ES project (Poznań).
EU-10 cities also led the qualification projects Pre Regeneration and URBAMUS, while the Support for Cities initiative explicitly focused on the new Member States. The URBACT secretariat and project partners from new Member States considered that taking part in URBACT I was valuable preparation for full integration of all Member States in URBACT II. They also frequently acknowledged that integrated approaches to urban development remain comparatively underdeveloped in most new Member States, and that URBACT II participants from those countries frequently aim to learn more than they contribute in terms of practice examples.
Within the thematic networks and other project types, URBACT I participants primarily came from city administrations. This was consistent with URBACT’s ambition to create a community of practice, rather than a political network. As might be expected, elected politicians tended to participate in the main events organised by projects, rather than the day-to-day working meetings. While there was broad consensus among interviewees that URBACT should be about practice rather than politics, political commitment to projects was also seen as important for ensuring that lessons learned were translated into policy and action.
Among participants from city administrations, a noticeable split existed between European officers (who were in the majority) and their colleagues from thematic departments. Language competence clearly played a role here, as many networks operated in one working language with little or no use of interpretation, which may well have restricted the range of those able to participate. While European and international officers had the language skills needed to participate in exchange of experience, several interviewees expressed concern that these participants were not sufficiently embedded in local urban development policy and practice to ensure local impact.
The commitment and motivation of URBACT I participants varied. Interviewees reported three main types of participant: those committed to and actively participating in the project; those who were more ‘passive observers’ and, in a few cases, those who were described as ‘professional tourists’. This is a qualitative assessment drawn from our discussions; to quantify the split would require a comprehensive survey of participants.
5.6 What results and impacts did URBACT 1 generate? The URBACT I Programme Complement limits itself to the basic implementation indicators already reviewed in the previous section, and does not specify explicit result and impact indicators. This shortcoming was highlighted in the ex-ante evaluation of URBACT II41 and has been addressed in the new programme through the development of indicators that measure results and impacts.42 The key success criterion has thus been the observed effectiveness of URBACT I in supporting the knowledge transfer process. The following sub-sections examine our evaluation findings in relation to the different stages in the process, from identification of (valuable) practice through to possible application of lessons on the ground.
40 Annual Implementation Report (AIR) 2006, p.16. 41 Ernst & Young (2007) ‘Evaluation ex-ante du programme URBACT 2 – Rapport final’ 42 URBACT II includes results and impact indicators, although their applicability is still being tested.

117
5.6.1 Identifying and recording practice
Defining project focus
Many interviewees stressed the need for projects to have a clearly defined focus from the outset, in order to provide a coherent framework for subsequent activities, increase the relevance of identified practice and findings and, as a result, maximise the potential for achieving impact on policy and practice. While most of the case study projects had a reasonably clear focus and strategy, this was not always the case. A number of URBACT I networks began with only a limited shared idea of ‘where they wanted to go’.
These difficulties can partly be explained by the innovative nature of URBACT I, as no one had direct experience of a similar programme in urban development. But they also reflect that the first projects had to be created and approved very quickly, and that several networks resulted from mergers of initially separate projects, ‘enforced’ by the programme management.43
It is difficult to generalise about the right focus for networking and exchange projects. While a more specific thematic focus helped to improve the relevance of findings in some cases (for example, the SecurCity network dealing with urban security), too restrictive a definition of theme could also limit the relevance of activities for participants and of the outputs for a wider audience. Some projects with broad topics, such as ‘inclusion of populations of foreign origin’ or ‘physical regeneration’, operated effectively and produced interesting results. Consistency and strong project leadership emerged as important factors in these cases, whereas weak or uncommitted lead partners appeared to exacerbate problems of project focus.
Capturing and presenting practice examples
URBACT I was somewhat successful in identifying and recording examples of practice. Most projects developed local case studies related to the topics covered (although not restricted to initiatives funded by EU interventions – a sensible broadening of the initial programme logic); city officials prepared these, often working with local or project experts. The identification and initial presentation of practice examples seems to have run smoothly in the projects examined, despite some problems with local surveys and studies (generally related to lack of focus, or working difficulties between cities and experts). The numerous case study reports and presentations on the project mini-sites of the URBACT website testify to the rich variety of urban development practice identified and shared within URBACT I. The subsequent relevance and utility of case study reports is another matter however, as discussed below.
A recurrent issue raised was the need to ensure critical presentation and analysis of cases. While a majority of participants in URBACT I projects took part with a commitment to objective presentation and discussion of their own cities’ practice, some appear to have taken the opportunity to indulge in municipal self-promotion.
This tendency is understandable for two main reasons. Firstly, some interviewees explicitly stated that their cities became involved in an URBACT project primarily or purely to enhance their reputation and profile on the European stage (and specifically in relation to the European Commission, which was seen as ‘owning’ the programme). Secondly, URBACT itself, in common with many EU programmes, placed
43 ISN and Citiz@move are notable examples here.

118
considerable emphasis on so-called good practice, which may suggest that the practice presented is expected to be excellent in all respects. Several interviewees made the point that practice is always embedded in local environments and can only ever be presented as effective in given context, rather than inherently good.
5.6.2 Results: exchanging and ‘capitalising’
Project-level activities – participation and ‘products’
The main intended results of URBACT I were to ‘create a flow of exchange of good practice’ between eligible cities and ‘capitalise lessons’ learned from EU urban development programmes. Generating exchange of practice at project level was one of the most effective aspects of URBACT I. Many participants reported that their project activities led to a considerable flow of ideas and lively exchanges and discussions among participants from different European cities.
A good number of those consulted highlighted as particularly valuable the interactive and reflective dimension of URBACT projects (some of which found innovative ways to go beyond the traditional ‘death by PowerPoint’ approach to seminars and conferences).44 This allowed participants to step outside their usual operating environment and consider their own activities in light of the experiences of others. Also of importance here is that networks enabled relationships to develop through a series of meetings over two or more years.
A majority of interviewees reported that taking part in URBACT had been beneficial in terms of personal knowledge of the subjects covered and in broadening their horizons regarding possible approaches to given problems. When asked about the relative usefulness of participatory projects or published outputs as a means of exchanging lessons about practice, most informants felt that participatory approaches (projects, events involving activities, etc) were more effective. This is not a particularly surprising finding, as it reflects a basic element of most theories of learning: that active and contextualised learning is more effective than passive review and absorption of facts and examples, even if the latter has a role.
Interviewees saw the value of written outputs of URBACT I projects45 primarily as a record of discussions and lessons learnt within URBACT activities, and for participants to use when communicating to others within their own organisations or policy-making hierarchies. In contrast, they saw published products as far less relevant for the wider public of urban development practitioners in Europe, not least because of time pressures: “tell me, who actually has time to read this sort of thing?” Language was an additional complication: documents in English or French are of limited use for wider dissemination in many EU countries, while translation is very costly and the results frequently unsatisfactory. Despite this, several case study networks translated at least one product into a wide range of languages.
The quality of outputs from URBACT I projects was highly variable. While some publications were very well written and of considerable potential interest, others were of lower quality and/or apparently limited
44 These included more interactive or activity-based forms of exchange and learning (‘action learning’), such as group tasks and challenges and visits to local organisations of relevance to network topics. In SecurCity, for example, participants in a workshop on fear of crime went out into the host city and interviewed (and videoed) representatives of different social groups, as a basis for discussing relevant issues. 45 Often referred to as ‘products’, from the French ‘produits’ (outputs).

119
relevance. Among the poorer quality products, some gave the impression of having been written by committee and lacked overall coherence, while others were too long or lacked any obvious practical application. To compound the problem, the sheer number of documents on the URBACT website project pages makes it difficult to identify the most relevant and interesting documents. Wider dissemination also appeared to be an issue: generally, documents produced by the case study networks were rarely found anywhere except on the URBACT website.
Programme-level capitalisation activities
In addition to the exchange and capitalisation activities supported in individual projects, URBACT I sought to develop and disseminate project findings through more centralised capitalisation activities, the programme website and events. However, the evaluation interviews revealed a widespread concern that the capitalisation workshops and programme website were among URBACT I’s least successful elements. This appeared to be for two main reasons. The first related to doubts, highlighted above, about the real added value of published outputs as a means of influencing policy and practice. The second was more to do with the planning and quality of the programme-level capitalisation activities.
The cross-cutting thematic working groups were intended to federate the results of thematic networks operating in similar thematic areas, in a bid to identify overall lessons. However, they were not planned until the implementation of thematic networks was underway, so networks had (rightly or wrongly) not allocated time and resources to participation. It thus proved difficult to ensure sufficient levels of participation in the working groups, while a lack of completed project outputs made the process of consolidating findings and extracting common lessons difficult. Though opinions varied on the usefulness of the events from the standpoint of those actually taking part, several interviewees doubted whether the outputs of the working groups justified the efforts made by project participants, coordinators and the programme secretariat.
The poor quality of the URBACT website was a source of contention at the time of the mid-term evaluation and update. The website’s functionality improved considerably with the change of service provider in 2006,46 but it appears to have retained a poor reputation among project participants. Moreover, our review of the project mini-sites revealed an unfortunate tendency to include a confusing array of documents, not always in a logical order. This is a pity, since some interesting and relevant documents are lost within the mass of material. A ‘less is more’ approach would have been more appropriate in terms of visibility and access. More positively, the hit rates for the programme website increased considerably in the course of 2007, and some project mini-sites are still visited regularly.47
5.6.3 Impacts: absorbing and applying lessons learned Capacity development in Europe’s cities
URBACT I aimed to contribute to the relevance and effectiveness of urban development actions in Europe mainly by improving the capacity of urban development practitioners (‘urban actors’). As already noted, individual project participants almost universally reported that their participation was an enriching and a learning experience on a personal level. Differences emerged between those who felt that they had
46 The programme secretariat encountered considerable problems with the previous service provider (AIR p.59). 47 AIR 2007, pp.48-49.

120
entered projects from a leading position in a particular field and sought to share their practice, and those who took more of a learning approach. Several interviewees highlighted that participants in their projects who started out believing they had little new to learn frequently found it valuable to reflect on their own practice.
In general, interviewees perceived the impact on others in their own organisation and on the wider audience of urban practitioners in Europe to have been far more limited and, perhaps obviously, found it difficult to make firm statements about such impacts. This lack of embeddedness is possibly of concern, not least because of the relative mobility of the individuals involved. Nevertheless, some URBACT I projects have led to improved working relationships between European affairs and thematic departments, and to other departments becoming more European-oriented.
Despite the overall objective, it would be unreasonable to expect a programme of URBACT’s size to have a local impact in cities. Indeed, the programme lacked an explicit mechanism to foster the application of lessons learned through the networking and exchange elements. Some project interviewees could point to the application of lessons learned through URBACT; for example, an adapted version of a UK approach to urban security (the ASBO) was developed in Rotterdam, while a Dutch anti-graffiti scheme was adapted and applied in Birmingham. Such concrete examples seemed to be the exception, however, rather than the rule. A number of interviewees highlighted Support for Cities as a particularly useful initiative. Support for Cities focused on developing local projects using lessons from URBACT, but was added right at the end of the programme.
Influence on EU policy
The most direct influence of URBACT I on EU policy has clearly been in the design of URBACT II which was launched without an accompanying URBAN programme (URBACT I was not exclusive to URBAN II and worked with other programmes and networks, a process that has been carried forward into URBACT II). Although URBACT I was designed to work alongside and support URBAN II, the timing of URBACT I reduced its level of usefulness as a vehicle for sharing experience among URBAN II stakeholders. Nevertheless, URBACT I developed a niche and role outside of URBAN II in addressing the needs of urban development practitioners – increasingly those from east and central Europe.
Key innovations in URBACT II – such as the restriction in partnership size and, most importantly, the requirement for local action plans and local support groups – have been introduced explicitly to address perceived weaknesses in URBACT I. Interviewees generally welcomed these changes as important improvements. Indeed, one strength of URBACT I from the perspective of a range of interviewees (projects, secretariat, other networks, European Commission) was to have acted as a testing ground for URBACT II. As such, the results and impacts of URBACT II will also be a test of URBACT I.
More generally, evidence of the influence of URBACT I on EU urban policy at strategic level is patchy, even though many interviewees commented on the secretariat’s energy in promoting a high profile for URBACT with the European Commission. Accurately identifying such policy influence and attributing causality is, however, notoriously difficult. The impact of the work undertaken at operational level through Support for Cities will need evaluating in the context of regional programme evaluations, but – based on evidence now available – may prove to have been important.

121
5.7 URBACT and other networks
URBACT I was seen as largely complementary to national URBAN II networks (in Germany-Austria, France) and existing European networks such as EUROCITIES and ERAN-Quartiers en Crise. These other networks existed in tandem with URBACT and, although they had similar aims and objectives, most stakeholders were neither confused about this nor felt that there was duplication.
URBACT was also seen as a valuable vehicle for transnational exchange at thematic and strategic level, promoting good practice across urban development practitioners. However, national networks of cities (such as that in Germany and Austria) were considered better placed to interpret lessons from other countries for application in their own national context. It was difficult to understand exactly why these other networks were seen to be better at interpretation, although some stakeholders put this down to focusing on just two Member States (i.e. Germany and Austria), rather than URBACT’s broader remit of trying to exchange good practice across the whole of Europe.
Another network, EUROCITIES, was seen as being more political, with a lobbying role promoting the cause and needs of cities and their communities on various national and international stages. Although EUROCITIES calls itself a network, it was felt to have less of a practice-oriented approach, as actual urban project and programme experiences were not necessarily shared and promoted among participating stakeholders. In addition, it brought together only large European cities (the key ‘big hitters’ as one stakeholder put it), whereas URBACT I also catered for small and medium-sized ones and tended not to exclude areas simply because they had less political ‘clout’.
Thus URBACT both added value to and supported these other networks. It seemed to carve out a particular role for itself, taking into consideration the existence of these similar (but not identical) programmes.
5.8 Conclusions and lessons learnt The main conclusions of the evaluation of URBACT 1 are as follows:
What outputs (e.g. in terms of knowledge, exchange of experience) have been generated by URBACT? Did networks tend to focus on practicalities or new ideas?
URBACT I effectively delivered the intended programme-level outputs in terms of exchange and networking projects supported.
The projects involved both direct exchange (between project participants and with wider audiences through events) and the production of publishable outputs (products). The direct exchange and qualification activities appear to have greater potential to influence policy and practice than the published outputs.
Projects tended to focus on strategic, policy-related discussions, as practical issues related to implementation were highly conditioned by local context. New ideas thus played a more important role.
URBACT II should ensure that direct exchange activities continue to be supported, and that projects incorporate skills and capacity building (in a broad sense), even if there is no longer a specific ‘qualification’ measure.

122
Future urban networking programmes at EU level, if supported, should recognise the inherent value of people-to-people exchanges and, equally, the limitations of written practice reports and outputs. Such programmes should strive to ensure that as many practitioners as possible can benefit from exchanges and that exchange is linked to the possibility of implementation on the ground (see below).
Who has participated and why? To what extent have new Member States been involved? What concretely could be done to optimise participation?
The level of participation from eligible cities was generally good. However, from the start of the programme, networks involved individuals and practice unrelated to the specific experience of Urban Pilot Projects and URBAN, which suggests that initially restricting participation to those cities was unduly constraining.
Motivation for participating in URBACT I varied from a real commitment to transnational exchange and learning to municipal self-promotion and even, in a few cases, apparent ‘professional tourism’. Language issues may have been a barrier to the ‘right’ people participating in some instances.
Cities from the new Member States were relatively well represented in URBACT projects (25% in thematic networks), considering that they only became eligible after programme implementation began.
In terms of lessons for the future, the question is rather how to optimise meaningful and useful participation – participation is not and should not be an end in itself. The requirements of URBACT II in relation to local action plans and local support groups appear to be a good step towards guaranteeing the commitment and engagement of project participants, from wherever in Europe. Opening URBACT II to all cities in the EU-27 also seems very sensible. The evaluation of URBACT II will be needed to examine the extent to which the new programme has met these expectations.
To what extent have the outputs generated concrete results and impacts ‘on the ground’? What could be done to optimise this final impact?
If ‘outputs’ are understood as projects, there is considerable evidence of individual learning (capacity enhancement). Evidence is more limited for institutional learning, influence on policy and the application of lessons learned on the ground, but examples of all exist. This largely reflects the focus of URBACT I on exchange of practice rather than on its direct application.
Evidence that published practice material and written project outputs have had a direct influence on policy and practice on the ground is very limited. While this may be partly attributable to variable quality and limited dissemination, in our view it principally reflects a flaw in the assumption that practitioners are likely to draw inspiration from such sources when they have had no involvement in developing them.
As the weaknesses of URBACT I in terms of local impact were explicitly acknowledged and addressed when preparing URBACT II, particular attention should be paid to this area in implementing the successor programme. In particular, the resources required to develop effective local action plans and manage local support groups should not be underestimated.

123
Future EU urban networking programmes should also include a clear focus on local relevance and impact. The evidence from the evaluation suggests that the URBACT approach has greatest potential to develop human capital through participatory projects rather than published outputs.
How efficiently has URBACT I achieved the outputs, results and impacts identified?
The answer needs to be set in the context of the comparatively limited budget (albeit €28m) available to URBACT I and the programme’s innovative character. In light of feedback from project participants and its role as a testing ground for URBACT II, we believe that URBACT I can be considered an efficient use of Community Funds.
The procedures used in URBACT I for first level financial control were ineffective and disproportionate. Although some projects simplified matters by maintaining centralised control of budgets, the administrative burden on public sector institutions in Europe’s cities was excessive. The efficiency of URBACT II, which has in principle learned from the limitations of URBACT I, will need to be judged more rigorously. The successor programme will not have the excuse of being a pioneer in the field of urban networking and exchange.
Procedures for financial control of expenditure, which have already been simplified under URBACT II, should be reviewed and compared to those used in other Community programmes (such as INTERREG IVC) to verify their appropriateness.
The answers to the previous questions should be used to give an overall judgement as to how effective the networks have been, as well as recommendations for good practice
Despite some shortcomings, URBACT I proved a highly popular programme among Europe’s cities. Moreover, the relevance of a networking and exchange programme at EU level was not questioned by any of those consulted for this evaluation.
The correct form for a networking and exchange programme is more open to debate. The design of URBACT I can be criticised for paying insufficient attention to local impact and ensuring an arena for applying lessons identified in exchange and networking activities. Moreover, the programme focused excessively on developing publishable outputs, the relevance of which is far from proven, rather than on developing human capital.
Demand for an EU-wide community of exchange and practice in the field of sustainable development appears real. And the case for such a network does not seem to depend on the existence of EU funding for urban development projects. Those consulted for this evaluation saw the added value of an URBACT-style programme focused on practice at strategic level, in addition to existing EU networks (which are more political) and national networks (which can focus on more detailed implementation issues in national contexts).
Nevertheless, the possibility of EU support for local action plans and local support groups under URBACT II would be a useful mechanism to increase the relevance and local impact of exchange (even if the results have yet to be tested). Any future network programme will also likely need to ensure sufficient resources for local action to justify its relevance.

124
6.0 Conclusions and Lessons
6.1 Introduction This section brings together the main findings of the URBAN II and URBACT I evaluation and concludes with key lessons for urban policy makers, especially those in the new Member States who were not party to URBAN II but whose cities face similar challenges.
Before setting out the main findings it is helpful to cover the parameters of URBAN II and URBACT I which informed the interpretation of evidence, namely:
• The relatively low level of resources at the programme level in the context of the deep-seated nature of the challenges which programmes were aiming to tackle. The average ERDF allocation per programme was €10.7 Million, ranging from €3.5 to €19.4 Million across the 70 programmes. Whilst these are not insignificant sums, especially when matched funding is considered, they are not enough to tackle citywide structural economic problems such as unemployment and de-industrialisation..
• Whilst the Commission set the guidelines, principles and objectives for URBAN II, they were neither detailed nor prescriptive. This was deliberate, and the flexibility of URBAN II, relative to the mainstream Structural Funds, was an attraction for many participating cities. A consequence of this flexibility was a very wide range of URBAN II supported activities, many unique to local circumstances and challenges.
• There were a wide range of participating cities, some (especially those in the UK, France, Netherlands, Austria and Germany) had a long tradition in urban development, but others were less familiar with urban policy and therefore gained valuable experience through their participation in URBAN II. Consequently, there was a steep learning curve for some of those involved in developing and implementing programmes. This inexperience was sometimes reflected in the management processes attached to URBAN II such as a lack of baseline data to formulate strategies or in developing effective monitoring and evaluation systems, tracking progress against key indicators.
• Whilst several individuals involved with URBAN II programmes did manage to participate in URBACT I networking events, the later start for URBACT I (effectively from the beginning of 2003) meant that activities supported by URBACT were less effective in involving URBAN II partnerships than originally conceived. This was largely because the strategies and networking arrangements (and budgets) had already been set. Some programmes opted for alternative networks, often national networks of cities.
6.2 Conclusions This section sets out the main policy conclusions from the evaluation.
6.2.1 Did URBAN II areas improve?
Areas supported through URBAN II were all characterised by a set of significant economic and social problems, including common challenges typical of urban areas in crisis across Europe, such as long term unemployment, poor economic performance and low quality urban environments.

125
Whilst the main economic problems of the programme areas largely remained after the completion of the programmes, there was quantitative and qualitative evidence of economic stabilisation and in some cases improvements in the performance of local economies in 13 of the 15 case studies. For example, where unemployment48 could be measured between 2000 and 2006 (in 37 programme areas), overall levels of unemployment were virtually the same for the two time periods (although there were variations between cities) and in some cases the gap in unemployment levels in the programme areas with their host cities reduced over the programme period.
Changes could also be quantified through the use of crime, education, business and other key statistics. For example, over the period of URBAN II:
• education attainment levels doubled in Bristol's programme areas • road congestion fell by 22% in Carrara and dust levels fell by 32%, • there was a 13% increase in people achieving a secondary education qualification in Gijon's
programme area, • long term unemployment dropped by 8% in Halifax's programme area, • there was a 21% rise in the number of companies found in the programme areas of Le Havre and a
54% rise in business numbers in the Leipzig programme area, The majority of the above changes were at a better rate than the city average. Consultations with stakeholders as part of the case studies also highlighted important improvements that were either difficult to quantify or were simply not measured. For example, most of the stakeholders felt that the case study areas now had a better image, were generally safer places to live, had a more confident business community and had local residents who felt more positive about their neighbourhoods. Very few of these important improvements were measured through any primary or secondary research or picked up in any of the monitoring information collected by programmes.
6.2.2 Were improvements to urban areas driven by URBAN II programmes?
URBAN II programmes were an important driver of change in their areas but normally not the most important factor within their areas.
The evaluation found that other factors generally were stronger influences on change, especially where areas had experienced positive changes in terms of employment and the business base. Here national and regional policies tackling unemployment, skills development or the diversification of the business base were the main policy drivers. Improvements at the city level and within neighbourhoods was also strongly influenced by the work of mainstream organisations, their programmes and their funding. This was especially so for policies concerned with health, education and reducing crime. In some cases the main policy drivers were other, well established, regeneration programmes operating in the programme area or close by.
Not surprisingly the scale of funding and the fixed timescales were limiting factors in the extent to which URBAN II could influence positive change in the socio-economic performance of their areas. Stakeholders generally felt that the URBAN II programmes could not be expected to make any significant
48 The main quantifiable comparator indicator. Not all programmes though had unemployment data for their areas, for 2006. Hence the analysis was limited to 38 of the 70 programmes.

126
headway in solving deep seated challenges that had often been in existence for decades. Stakeholders also perceived that the underpinning causes of many urban problems, whilst manifest in the programme areas, were sourced elsewhere (e.g. perceived failings of training provision at a city or regional level). Programmes were more effective at influencing local change and in improving the 'life chances' of residents (e.g. ensuring that migrant workers and ethnic minority groups were better equipped to take advantage of new job opportunities that would arise from programmes delivered at a larger spatial level (such as the city or the region).
6.2.3 What difference did URBAN II make?
Despite external drivers and issues of scale and intensity affecting the level of impact, the evaluation found that URBAN II programmes were still important players in addressing locally based regeneration challenges. The evaluation has found that the positive benefits of URBAN II can be split into two broad categories: the impacts on tackling local regeneration problems in target neighbourhoods; and the impacts on improving regeneration methods and approaches.
Changes at the neighbourhood level
In some cases changes at the neighbourhood level were evidenced through statistical data (for example, educational attainment) with a narrowing of gaps between the programme area and the city and, whilst the precise cause and effect is difficult to measure, the actions supported by URBAN II made an important contribution. By reference to the three themes some of the main changes are highlighted below:
• The physical theme – there was tangible evidence of improved land and buildings with subsequent re-use for economic and social end uses (such as enterprise and community centres), the provision of new green space, cycle and footpaths. In a few cases there was survey evidence in a few cases of increased usage of spaces and buildings, and increased appreciation of physical improvements whilst some of the environmental projects lead to reductions in energy consumption plus campaigns that helped to raise environmental awareness.
• The economic theme – many of the projects focused on SMEs, providing business support and vocational training to both existing businesses and new starts. Some programmes concentrated on ICT improvements. Stakeholders saw employee training programmes to develop new skills (and to up-skill) as the most effective use of resources under this theme. Whilst many programmes reported job creation, this was normally based on simple evidence such as a head count of those involved in supported projects, rather than a more careful look at net employment effects.
• The social theme – training was also a key feature of the social theme, the primary target being unemployed and other disadvantaged groups (as opposed to employees). Programmes also included a variety of community safety projects (addressing high levels of crime), community capacity building programmes and measures to address drug abuse. The more successful projects under this theme were often those that focused on clearly identified priority groups (such as migrants and the long term unemployed).
A summary of the key outputs arising from URBAN II programmes, categorised by theme is set out in Table 6.1

127
Table 6.1 Summary Headlines – Key URBAN II Outputs
Under the physical theme the key outputs were:
372 restoration projects
2.3 Million m2 of converted public space plus a further 557,115 m2 of space developed for social, sports, education and health uses
3.2 Million m2 of new green space
80 Kilometres of cycle and footpaths plus 11,614 m2 of renovated surfaces for cyclists and pedestrians
10,712 m2 of new water collectors designed to reduce energy consumption
194 environmental equipment projects to recover liquid and toxic waste
Under the social theme the key outputs were:
982 training projects with 64,801 training places for individuals
246 security projects tackling crime and fear of crime
593 community capacity building initiatives
16 employment centres and 22 health and community centres
162 drug advice interventions
949 cultural events projects
443 childcare places
Under the economic theme the key outputs were:
5,984 business support and advisory interventions
43,004 training places for businesses
23 commercial centres and stores renewed
7 innovation projects and 20 business incubator units
43,942 m2 of new commercial floorspace
7 ICT projects and services
There was little evidence to suggest that particular measures or themes were more successful than others although there were particular 'headline' projects that were perceived by stakeholders to be especially important to the programme as a whole, generally because they cut across themes and realised the potential synergies between different interventions (e.g. the refurbishment of a derelict mill

128
into a business incubator facility, that helped to develop and diversify the local business base, and space for local community organisations).
Evidence from the case studies highlighted the contribution of URBAN II programmes to improvements in the image, confidence and positive perception. In 10 of the 15 case studies there was evidence that URBAN II had improved the image of the programme areas and raised their profile among investors and key decision makers in the public sector. There were examples where URBAN II actions – and often a set of inter-related actions – had made a significant impact in the appearance of and perceptions of areas, amongst residents, businesses and visitors. These actions tended to be physical projects that in combination made a visual and tangible impact which in turn was seen by stakeholders to create the right conditions for new public and private investment in the future.
Embedding the URBAN 'method'
The second main area of positive change identified by the evaluation was the way URBAN II encouraged cities to develop new regeneration methods and approaches. Stakeholders often highlighted the level of learning from the URBAN II 'method' as the key impact and also the key legacy of the programme - often seeing the impact of the 'method' as more important than the direct impacts of the funding itself. The process of developing and implementing URBAN II programmes taught many urban development practitioners about new ways to approach urban decline and helped them to understand the benefits of, for example, adopting an integrated approach, building up partnerships of organisations or consulting and engaging with local people during the regeneration of their neighbourhoods. This process was far from perfect and there was scope for improvement at all levels from the limited participation of key 'strategic' regional and city levels in many programmes to difficulties in getting the active involvement of local residents in projects and the programme overall, in some programmes.
6.2.4 Critical success factors
The case studies provided strong evidence on the factors that contributed to the impact of URBAN II, and conversely factors that constrained impact. Two main factors were regularly highlighted which again point to the importance and benefits of the URBAN 'method': the integration of URBAN II with other programmes; and an inclusive partnership approach.
Strong inclusive partnerships
URBAN II was characterised by strong, inclusive local partnerships, often involving the public, private and voluntary sectors, although the formal involvement of community organisations and private companies in partnership structures and management was limited. Several programmes had sought to address this over time through capacity building measures, including legal and financial training for partners and prospective partners. Community organisations were more commonly involved in project management, often seen by the programme managers as a way for those organisations to gain experience. Subsequent to URBAN II community organisations have played an important role in sustaining regeneration in the programme areas once EU funding had ceased.
Practice varied but in most cases the local authorities provided the administrative 'glue' to bring partners together through the provision of programme secretariat and often, the programme manager.

129
The more successful partnerships were those which brought together a number of partners to tackle challenges from a range of different angles (e.g. high female unemployment tackled by childcare providers, employers, training organisations and local community organisations). Some partnerships had developed from existing networks but in many cases URBAN II was the main reason and stimulant for new inter-agency working. This multi-agency approach was again highlighted as a common critical success factor.
Integrated approaches to urban regeneration
The integration of URBAN II with other programmes has added to the impact of URBAN II, allowing for a pooling of resources and a forging of links with other policies and programmes. There are examples where URBAN II has been integrated with national programmes and also with the mainstream Structural Funds to provide more 'flexible' resources that were targeted at specific local neighbourhoods (whereas the mainstream programmes tended to have a regional or sub-regional focus). In many programme areas URBAN II played a central role in providing the conditions for integration, mostly through partnership working and in getting individuals across departments and agencies to work together.
However, evidence of URBAN II programmes going one step further and influencing wider city strategies and policies is much more limited. This is not necessarily a failing, rather recognition that in most URBAN II cities the programme was a relatively small and discrete element of a much bigger regeneration agenda.
There was also strong evidence of integration within URBAN II programmes, both at a thematic and project level. There are many examples where projects have addressed multiple objectives, across the economic, social and physical themes. These include physical projects that have bought a redundant building back into use for economic benefits or a community childcare project that has also reduced a large barrier to employment for local women.
6.2.5 The sustainability of URBAN II
There is the high probability with fixed term regeneration initiatives that the programme 'collapses' once funding ceases to exist. In URBAN II there were relatively few detailed exit/succession strategies and in several cases the incumbent programme managers left early (50% left in the final year of the programmes, because of future funding and employment uncertainties).
In URBAN II, whilst the original programmes have closed, some 60% of the projects continued under a different guise, even where the attention of the cities regeneration practitioners has moved elsewhere, and resources have followed.
Again, the URBAN 'method' seems to be the area where sustainability has seen the most success. Although project activity was supported post URBAN II, most stakeholders stated that it was the approach to regeneration, encouraged by URBAN II, that was most likely to remain as the main legacy of the
130
Community Initiative. In many programme areas a multi-agency partnership approach continues with a focus on community engagement and tackling issues at a very local level.
6.2.6 The assessment of URBACT I
The first URBACT programme set out to "contribute to the improved relevance and effectiveness" of urban development activities in Europe by supporting knowledge transfer between policy makers and practitioners from EU-15 cities involved in URBAN II, as well as cities from the new Member States. URBACT I focused on bring together actors from participating cities in networks to identify, analyse and "externalise" elements of their own practice and communicate these to other stakeholders, through events and published outputs.
URBACT I effectively mobilised relevant actors from eligible cities and supported a wide range of exchange and networking projects. Projects tended to focus on strategic, policy-related discussions, as practical issues related to implementation are often highly conditioned by local context. At an individual and city level, motivations for participating in URBACT I varied from a real commitment to trans-national exchange and learning to city promotion and even, in a small minority of cases, apparent ‘professional tourism”.
The evaluation revealed considerable evidence of individual learning within URBACT I projects. However, evidence of institutional learning, influence on policy and the application of lessons learned on the ground is more limited, even if examples of all these types of wider impact exist. This finding largely reflects the focus of URBACT I on exchange of practice rather than on its direct application. There is very limited evidence that published practice material and written project outputs have had a direct influence on policy and practice on the ground. While this may in part be attributable to variable quality and rather limited dissemination, in our view, it principally reflects a flaw in the assumption that practitioners are likely to draw inspiration from such sources where they have had no involvement in developing them. Learning together, and through the experiences of colleagues in other cities, rather than learning from publications was a central message from the evaluation.
Although many individuals involved in URBAN II took part in URBACT projects, the direct links between URBACT and URBAN II projects were often limited. Although this could to some extent be seen as a lack of complementarity between EU funding streams, the timing of the launch of URBACT and the much wider target audience (within and beyond URBAN II cities) made it inherently difficult to fully integrate the two programmes.
6.3 The policy and delivery lessons from URBAN II
There are valuable lessons from URBAN II for European and national programmes tackling the complex challenges of urban areas. Those challenges are as severe now as they were in 2000 and are especially evident in the new Member States as their economies continue to experience major restructuring. Many of these do not have the traditions of partnership working, or evidence of either integrated programmes or community involvement. Neither do they necessarily have strong local structures given the dominance of a centralised system. Applying the URBAN 'method' in this type of environment would therefore require a large level of support but would also act as a significant learning experience for those participating,

131
helping them to develop methods and approaches to tackling urban decline but also giving them the resources with which to try these methods out.
The evaluation conclusions, policy and delivery lessons are also relevant for national programmes, the debates around the future of EU Cohesion Policy, including the merits of area based programmes compared to 'traditional' regional development programmes.
The main lessons we draw from the evaluation are set out below.
6.3.1 Programme development and delivery requires strong and inclusive partnerships
Local authorities are likely to continue to play a lead role in future urban regeneration programmes. They combine local knowledge and resources, capacity - through their structures and staffing - and political legitimacy through their elected members. However, locally based urban regeneration requires a wide range of expertise and resources including the other public agencies with interests in and services operating in those areas, as well as local businesses and communities. Resources are required to develop partnership working and raise the skill levels of partners so that they can participate effectively in programme management. The evaluation shows that this is a valuable investment and one that can generate a momentum to allow regeneration to continue once finding programmes have ceased.
6.3.2 The area based local approach
The area based approach to tackling urban problems has been an essential ingredient of the success of URBAN II. It is unlikely to have been as successful if the funding had been allocated and run as a regional programme. This is because the 'essence' of URBAN II has been the 'bottom up' approach where, in the best examples, a wide range of public, private and community sector partners have been energised around a set of locally owned challenges and solutions. Having tightly defined programme area boundaries is another lesson. Smaller area based programmes cannot resolve deep rooted and wider physical, economic and social problems, but they can make an effective contribution, particularly if linked to other strategies and programmes operating at a city or regional level.
6.3.3 Method is as important as funding
A key lesson for future European regeneration programmes similar to URBAN is that they should be as much about helping and challenging cities to develop new approaches to urban development as they are about trying to solve urban decline. Area based initiatives such as URBAN II will impact on issues such as unemployment or business growth but because of the limitations of scale and timescales they will only be a contributor rather than a major driver of change. If future programmes are viewed as relatively efficient ways of capacity building cities and their urban development practitioners to test out and embed principles such as integration and bottom up approaches, then this in itself will make a useful contribution to tackling the problems of urban decline. If future regeneration programmes are instead viewed as instruments that will try and 'solve' urban challenges then they are likely to fall short of expectations.
6.3.4 Programmes need guidance
The step change that new Member States would need to implement principles such as community development or partnership working would be significant and would require support and guidance in respect of partnership development, programme management, methods for encouraging multi-agency

132
working, and developing baselines to understand root causes of decline or simply around developing priorities and projects. This could be delivered through networking and capacity building programmes that tackle all of the elements of delivering locally based urban programmes and are aimed at both programme managers and their teams, and partners. Regional agencies and cities with expertise and experience can play an important role in supporting and advising bottom-up partnerships from strategy development through to effective monitoring and evaluation systems. This support should not stifle the flexibility and devolved nature of URBAN type programmes but it should help them to maximise the opportunities they have to make a difference to local neighbourhoods.

Responsible editor: Veronica GAFFEY © European Commission, Regional Policy, Evaluation UnitThe texts of this publication do not bind the Commission.
Report on behalf of the European Commission by ECOTEC.
Consult this website for further information:
http://ec.europa.eu/regional_policy/sources/docgener/evaluation/evaluation_en.htm
Cover page: Vermeer: View of Delft. Courtesy of Royal Picture Gallery Mauritshuis, the Hague, Netherlands.