Evolution Of Traffic Management At Indianapolis Motor ...
31
INDIANA DEPARTMENT OF TRANSPORTATION Driving Indiana’s Economic Growth E ol tion of Traffic Management at E ol tion of Traffic Management at Evolution of Traffic Management at Evolution of Traffic Management at the Indianapolis Motor Speedway the Indianapolis Motor Speedway Jay Wasson, P.E. Traffic Management Centers Division Director
-
Upload
khangminh22 -
Category
Documents
-
view
4 -
download
0
Transcript of Evolution Of Traffic Management At Indianapolis Motor ...

INDIANA DEPARTMENT OF TRANSPORTATION
Driving Indiana’s Economic Growth
E ol tion of Traffic Management atE ol tion of Traffic Management atEvolution of Traffic Management at Evolution of Traffic Management at the Indianapolis Motor Speedwaythe Indianapolis Motor Speedway
Jay Wasson, P.E.
yy
Traffic Management Centers Division Director

Indianapolis Motor SpeedwayIndianapolis Motor Speedway
INDIANA DEPARTMENT OF TRANSPORTATION 2

History of the I.M.S.History of the I.M.S.Track built as an automobileTrack built as an automobile industry testing facility in 1909Th fi t 500 ilThe first 500 mile race was held May 30, 1911The track closed for both World WarsTony Hulman bought the track in November 1945in November 1945Today’s Traffic Management Plan has evolved since 1947C ti t b i t l
INDIANA DEPARTMENT OF TRANSPORTATION 3
Continues to be privately owned and operated

1949 Traffic Pattern Map1949 Traffic Pattern Map
INDIANA DEPARTMENT OF TRANSPORTATION 4

Indianapolis Motor Speedway VenueIndianapolis Motor Speedway VenueUnprecedented Scale & Scope of VenueUnprecedented Scale & Scope of Venue
2.5 mile oval trackMore than 257 000 seatsMore than 257,000 seats
Four World Class Annual RacesIndianapolis 500 Mile RaceAllstate 400 at the Brickyard (est. 1994)United State Grand Prix (est. 2000)MotoGP (est. 2008)
INDIANA DEPARTMENT OF TRANSPORTATION 5~$1 Billion Economic Impact

Indianapolis Motor SpeedwayIndianapolis Motor Speedway
INDIANA DEPARTMENT OF TRANSPORTATION 6

Geographic Location of I.M.S.Geographic Location of I.M.S.Not directlyNot directly serviced by StateState highway InterstateInterstate access within 2 milesSurrounded by residential
INDIANA DEPARTMENT OF TRANSPORTATION 7
& commercial

Public Safety Traffic CommitteePublic Safety Traffic CommitteeMeets Feb through Sept Town of Speedway Meets Feb. through Sept.
Law EnforcementLocal, State & Federal
Fi /EMS
Police
Law Enforcement Transportation Providers
Fire/EMSIndiana D.O.T.Department of Public Works
Providers
Business & Industry State DOT
Emergency ManagementPublic TransitTaxi/Limo Services
Local Streets (DPW)
Communications (Signs & Maps)
Taxi/Limo ServicesCity-County CouncilNeighborhood AssociationsC ’ Offi
Parking IMS Safety Office
INDIANA DEPARTMENT OF TRANSPORTATION 8
Coroner’s Office Fire/EMS Area Residents
Traffic Management PlanningTraffic Management PlanningPl i & R D t S itPlanning & Resource Document Suite Continually Refined
Agreed Upon Traffic Flow PatternAgency Specific Tactical Documents for “N l O ti ”“Normal Operations”
Resource Assignments & Interface Protocols
C h i EMA “Di t ” PlComprehensive EMA “Disaster” PlanBombs, Weather, Food Poisoning, Structural Collapse Debris in Stands Terrorist Attacks etc
INDIANA DEPARTMENT OF TRANSPORTATION 9
Collapse, Debris in Stands, Terrorist Attacks, etc.

Traffic Management Planning Traffic Management Planning (cont’d)(cont’d)
INDIANA DEPARTMENT OF TRANSPORTATION 10
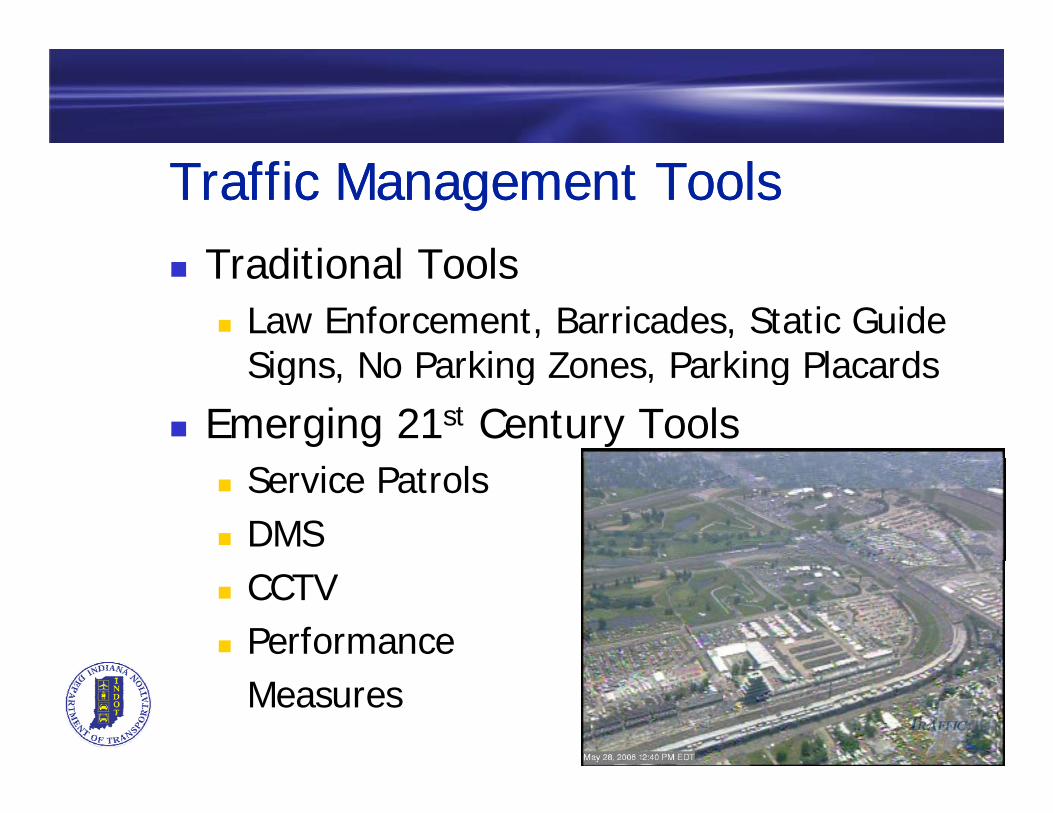
Traffic Management ToolsTraffic Management ToolsT diti l T lTraditional Tools
Law Enforcement, Barricades, Static Guide Si N P ki Z P ki Pl dSigns, No Parking Zones, Parking Placards
Emerging 21st Century ToolsService PatrolsDMSCCTVPerformance
INDIANA DEPARTMENT OF TRANSPORTATION 11
Measures
Race Day OperationsRace Day OperationsMAC M lti A C dMAC – Multi-Agency Command
“the buck stops here”co-location of empowered personnel to allocate resources and make decisions
i iNot a micro-management tactic Facilitates lower level & autonomous “Mobile C d C t ” t k i tCommand Centers” to work in concert through coordinated interface
INDIANA DEPARTMENT OF TRANSPORTATION 12

Race Day OperationsRace Day Operations
INDIANA DEPARTMENT OF TRANSPORTATION 13
Special Event Planning ConclusionsSpecial Event Planning ConclusionsA il bl id d tAvailable guidance documents are very good, but one size doesn’t fit all.Like most endeavors communications and relationships between the stakeholders are the keys to success.
Using relationships forged in Special Event Planning & Management can transition into improved daily traffic management operations
INDIANA DEPARTMENT OF TRANSPORTATION 14
operations.

BLUETOOTH PROBE DATABLUETOOTH PROBE DATANASCAR – Brickyard 400
BLUETOOTH PROBE DATA BLUETOOTH PROBE DATA
INDIANA DEPARTMENT OF TRANSPORTATION 15

Bluetooth Probes PioneeringBluetooth Probes Pioneering
16
June 2008 ITE Journal
INDIANA DEPARTMENT OF TRANSPORTATION 16
June 2008 – ITE Journal
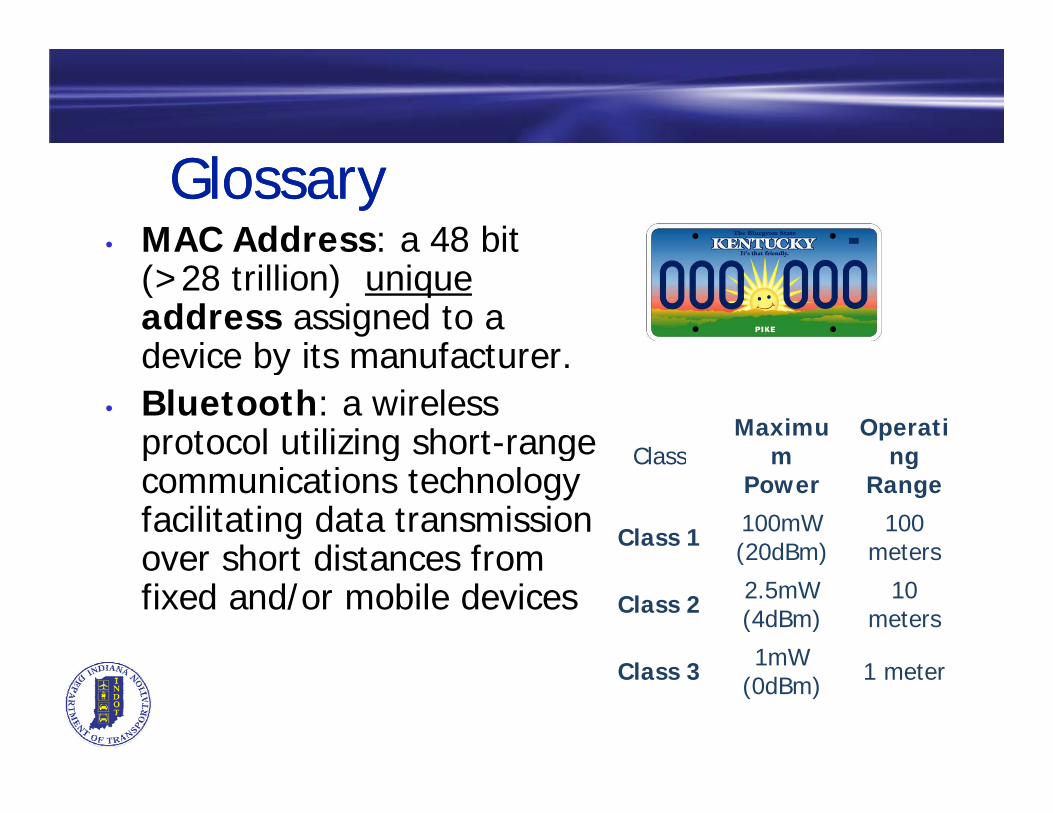
GlossaryGlossary• MAC Address: a 48 bit
(>28 trillion) uniqueaddress assigned to a device by its manufacturerdevice by its manufacturer.
• Bluetooth: a wireless protocol utilizing short-range Class
Maximum
Operatingp g g
communications technology facilitating data transmission over short distances from
Class m Power
ng Range
Class 1 100mW (20dBm)
100 metersover short distances from
fixed and/or mobile devices ( )
Class 2 2.5mW (4dBm)
10 meters
Cl 3 1mW 1 tClass 3 1mW (0dBm) 1 meter

Useful DataUseful DataStation 1 Station 2Station 1
AddressFirst Detected
OnLast Detected
OnDetection Counter
Station 2
On On Counter
00:17:4b:de:12:56 9:00:25 PM 9:10:02 PM 700:10:86:e8:56:14 9:00:44 PM 9:00:44 PM 100:1a:dc:b9:78:53 9:00:44 PM 9:01:23 PM 300:1a:dc:b7:0c:b7 9:04:18 PM 9:04:52 PM 3 Address
First Detected On
Last Detected On
Detection Counter
00:17:e3:3a:b7:8a 9:04:52 PM 9:04:52 PM 100:1a:dc:b3:d2:ca 9:05:14 PM 9:06:31 PM 500:18:af:e1:84:50 9:05:48 PM 9:05:48 PM 100:1c:c1:7b:b7:06 9:06:09 PM 9:06:09 PM 100:c0:1b:04:d6:9d 9:06:09 PM 9:07:10 PM 400 1 45 69 4d 1f 9 06 48 PM 9 06 48 PM 1
00:10:86:e8:56:14 9:05:44 PM 9:05:44 PM 100:1e:45:69:4d:1f 9:12:00 PM 9:12:00 PM 100:c0:1b:04:d6:9d 9:12:15 PM 9:12:35 PM 400:15:b9:d2:82:e2 9:18:40 PM 9:18:40 PM 1
00:1e:45:69:4d:1f 9:06:48 PM 9:06:48 PM 100:1c:cc:90:12:d7 9:10:24 PM 9:10:24 PM 100:15:b9:d2:82:e2 9:12:45 PM 9:12:45 PM 100:18:c5:ac:50:c3 9:14:09 PM 9:14:29 PM 200:1c:d4:8f:e5:7a 9:14:29 PM 9:14:29 PM 1

Typical Data Collection SitesTypical Data Collection Sites5 INDOT Stations 3 Portable UMD Stations5 INDOT Stations 3 Portable UMD Stations
Bluetooth Antenna at
Site I 2Site I-2
Battery
Blimp
Battery powered
unit at Site I-1
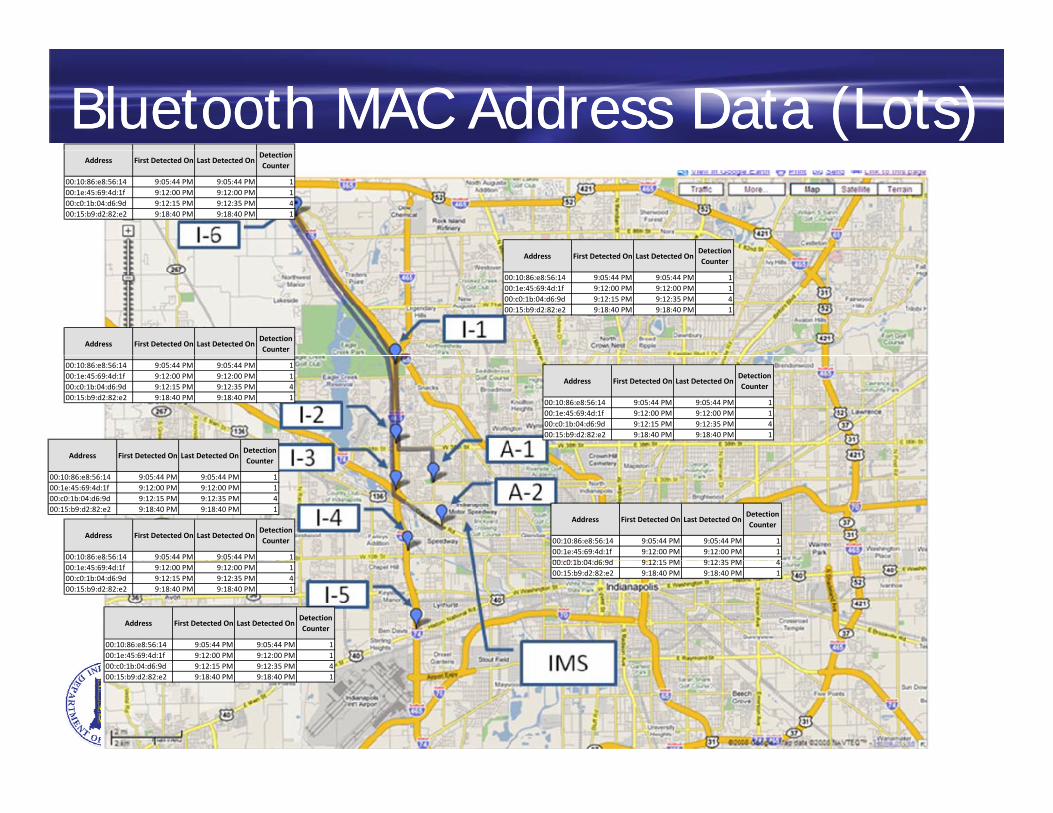
Bluetooth MAC Address Data (Lots)Bluetooth MAC Address Data (Lots)
Detection
Address First Detected On Last Detected OnDetection Counter
00:10:86:e8:56:14 9:05:44 PM 9:05:44 PM 100:1e:45:69:4d:1f 9:12:00 PM 9:12:00 PM 100:c0:1b:04:d6:9d 9:12:15 PM 9:12:35 PM 400:15:b9:d2:82:e2 9:18:40 PM 9:18:40 PM 1
Address First Detected On Last Detected OnDetection Counter
00:10:86:e8:56:14 9:05:44 PM 9:05:44 PM 100:1e:45:69:4d:1f 9:12:00 PM 9:12:00 PM 100:c0:1b:04:d6:9d 9:12:15 PM 9:12:35 PM 400:15:b9:d2:82:e2 9:18:40 PM 9:18:40 PM 1
Address First Detected On Last Detected OnDetection Counter
Address First Detected On Last Detected OnDetection Counter
00:10:86:e8:56:14 9:05:44 PM 9:05:44 PM 100:1e:45:69:4d:1f 9:12:00 PM 9:12:00 PM 100:c0:1b:04:d6:9d 9:12:15 PM 9:12:35 PM 400:15:b9:d2:82:e2 9:18:40 PM 9:18:40 PM 1
Address First Detected On Last Detected OnDetection
00:10:86:e8:56:14 9:05:44 PM 9:05:44 PM 100:1e:45:69:4d:1f 9:12:00 PM 9:12:00 PM 100:c0:1b:04:d6:9d 9:12:15 PM 9:12:35 PM 400:15:b9:d2:82:e2 9:18:40 PM 9:18:40 PM 1
Address First Detected On Last Detected OnDetection Counter
00:10:86:e8:56:14 9:05:44 PM 9:05:44 PM 100:1e:45:69:4d:1f 9:12:00 PM 9:12:00 PM 100 0 1b 04 d6 9d 9 12 15 PM 9 12 35 PM 4
Address First Detected On Last Detected OnDetection Counter
00:10:86:e8:56:14 9:05:44 PM 9:05:44 PM 1
Address First Detected On Last Detected OnCounter
00:10:86:e8:56:14 9:05:44 PM 9:05:44 PM 100:1e:45:69:4d:1f 9:12:00 PM 9:12:00 PM 100:c0:1b:04:d6:9d 9:12:15 PM 9:12:35 PM 400:15:b9:d2:82:e2 9:18:40 PM 9:18:40 PM 1
00:c0:1b:04:d6:9d 9:12:15 PM 9:12:35 PM 400:15:b9:d2:82:e2 9:18:40 PM 9:18:40 PM 1
Address First Detected On Last Detected OnDetection Counter
00:10:86:e8:56:14 9:05:44 PM 9:05:44 PM 100:1e:45:69:4d:1f 9:12:00 PM 9:12:00 PM 1
00:1e:45:69:4d:1f 9:12:00 PM 9:12:00 PM 100:c0:1b:04:d6:9d 9:12:15 PM 9:12:35 PM 400:15:b9:d2:82:e2 9:18:40 PM 9:18:40 PM 1
00:c0:1b:04:d6:9d 9:12:15 PM 9:12:35 PM 400:15:b9:d2:82:e2 9:18:40 PM 9:18:40 PM 1

SB I2SB I2--I1 Segment (~2 miles)I1 Segment (~2 miles)
(S)
Time
Travel
578 unique probeT probe
samples 1500-1800

A closer look at I1A closer look at I1--I2 on I2 on RacedayRacedayTransient spike in NBTransient spike in NB travel Time observed
over ~23 minutes with ~70 probes~70 probes

II--465 Corridor to South Arterial 465 Corridor to South Arterial (S)
IMS T ffi
thbo
und
vel Time ( IMS Traffic
departing from A2 to I1
Nort
Trav
und
me (S)
Southb
ouTravel Tim
Friday evening IMS T ffiFriday evening incident, Southbound Travel time from I1 to
I3 triples
IMS Traffic arriving from
I1 to A2

1200
I5I4 I5I3 I5I2 I5I1 I5I6
II--465/65 Corridor 465/65 Corridor 09000900--21002100I t f 10th
900
I5I4 I5I3 I5I2 I5I1 I5I6
boun
d Tim
e (S) Impact of 10th
Street Ramp Queue
300
600
North
Travel
‐300
0
7/27/2008 9:00 7/27/2008 12:00 7/27/2008 15:00 7/27/2008 18:00 7/27/2008 21:00
boun
dTime (S)
‐600Southb
Travel
Slight increase in travel time from
I5 to I1 after
‐1200
‐900 Race
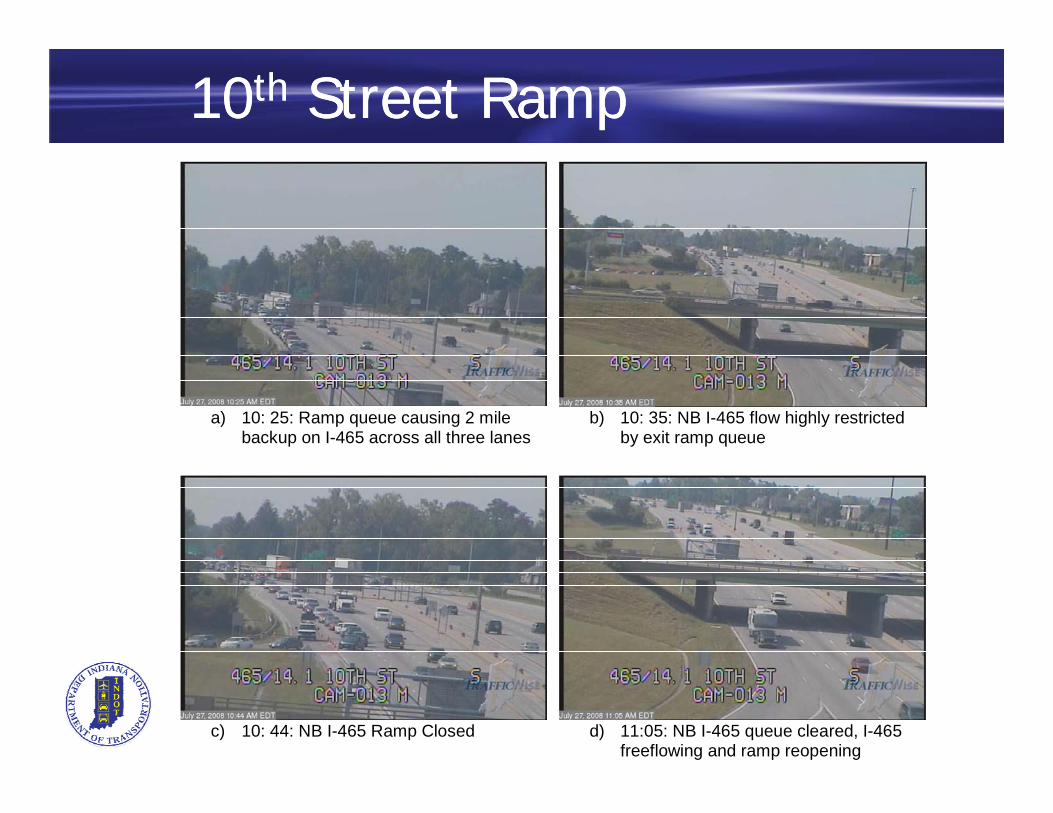
1010thth Street RampStreet Ramp
a) 10: 25: Ramp queue causing 2 mile backup on I-465 across all three lanes
b) 10: 35: NB I-465 flow highly restricted by exit ramp queue
c) 10: 44: NB I-465 Ramp Closed d) 11:05: NB I-465 queue cleared, I-465 freeflowing and ramp reopening

10: 25: 1010: 25: 10thth St. Ramp Queue St. Ramp Queue

10: 35: I10: 35: I--465 Flow Restricted by Queue465 Flow Restricted by Queue

10: 44: 1010: 44: 10thth Street Ramp ClosedStreet Ramp Closed

11:05: Queue Cleared and Ramp Reopen11:05: Queue Cleared and Ramp Reopen

Origin Destination MatrixOrigin Destination MatrixT bl 1 MAC dd O i i D ti ti T bl f J l 27 2008 10 00 14 00Table 1: MAC address Origin Destination Table for July 27, 2008 10:00– 14:00 Destination Site Code Origin Site
I-6 I-1 I-2 I-3 I-4 I-5 A-1 A-2 Site Code I-6 32 29 28 27 9 0 0 I-1 88 158 160 151 37 2 1 I 2 99 368 159 135 31 2 2I-2 99 368 159 135 31 2 2I-3 70 259 292 236 43 5 10 I-4 43 184 207 264 79 4 7 I-5 22 73 84 104 167 2 4I 5 22 73 84 104 167 2 4A-1 12 37 35 34 35 1 16 A-2 26 53 55 63 58 7 6 Average ofAverage of
one match every 40s!

QUESTIONS?QUESTIONS?QUESTIONS?QUESTIONS?
INDIANA DEPARTMENT OF TRANSPORTATION 31