Evolution and origin of the Miocene intraplate basalts on the Aleppo Plateau, NW Syria
23
Evolution and origin of the Miocene intraplate basalts on the Aleppo Plateau, NW Syria George S.-K. Ma a, b, ⁎, John Malpas b , Katsuhiko Suzuki c , Ching-Hua Lo d , Kuo-Lung Wang a , Yoshiyuki Iizuka a , Costas Xenophontos b a Institute of Earth Sciences, Academia Sinica, Taipei 11529, Taiwan b Department of Earth Sciences, The University of Hong Kong, Pokfulam Road, Hong Kong c Institute for Research on Earth Evolution/PEL/Seafloor Resources Research Project, Japan Agency for Marine-Earth Science and Technology (JAMSTEC), Natsushima, Yokosuka 237-0061, Japan d Department of Geosciences, National Taiwan University, 245 Choushan Road, Taipei 106, Taiwan abstract article info Article history: Received 21 December 2011 Received in revised form 1 November 2012 Accepted 2 November 2012 Available online 12 November 2012 Editor: L. Reisberg Keywords: 40 Ar/ 39 Ar geochronology Re–Os isotope Metasomatic vein Intraplate volcanism Amphibole Crustal contamination The source of intraplate basalts has long been a controversial topic, particularly in continental settings where am- biguity increases because both crustal contamination and crystal fractionation may mask important source char- acteristics. We present geochemical data to constrain the source and the chemical evolution of the continental intraplate magmas from the Aleppo Plateau and vicinity, NW Syria. New 40 Ar/ 39 Ar ages, coupled with published 40 Ar/ 39 Ar and K–Ar ages, reveal two discrete Miocene volcanic phases, ~19–18 Ma (Phase 1) and ~13.5–12 Ma (Phase 2), in the studied area. New chemical and isotopic compositions [ 87 Sr/ 86 Sr=0.7036–0.7051, εNd= +4.5 to +1.1 and ( 187 Os/ 188 Os) t = 0.151–0.453] of the lavas reflect the unequivocal influence of crustal assimi- lation and fractional crystallisation (AFC). Despite the effects of the AFC processes, there still appear to be some differences between the most-primitive, least contaminated magmas of the two volcanic phases, interpreted as a result of source heterogeneity. Whereas the Phase 1 lavas, with relatively high Si, low Ti and trace-element con- tents, are consistent with partial melting of a largely peridotitic mantle source, the origin of the Phase 2 lavas is more complicated. The latter are characterised by a source component depleted in Si and enriched in Ti, Fe, Ca, P, alkalis, light and middle rare earth elements (REEs) relative to heavy REEs and with sub-chondritic Th–(U)/ Nb, Pb/Ce and Zr/Sm. They approach compositions of experimental melts of amphibole-rich metasomatic veins. The compositional variations among the most primitive Phase 2 lavas are difficult to reconcile with varying de- grees of partial melting of either the metasomatic veins or peridotite, but could be explained if partial melts of both lithologies were variably mixed, a scenario that could be sensibly envisioned as ascending (peridotitic) plume/asthenosphere derived melts assimilating highly fusible metasomatic veins during their traverse through the lithosphere. This process can be loosely quantified by trace-element forward partial melting modelling that suggests mixing of up to 80% metasomatic melts derived from ~40% melting of amphibole-rich meta- somatic veins (which themselves were inevitably compositionally and mineralogically heterogeneous) with 20% plume/asthenospheric melts derived from ~7% melting of a garnet peridotite. Within the compres- sional framework of northern Arabia, invocation of diapiric material reasonably accounts for the generation of the intraplate basalts in Syria. Derivation of the Phase 2 hybrid melts was probably triggered by lateral flow of this diapiric material beneath the lithosphere subsequent to its arrival, with the migrating flow-front controlling the locus of volcanism. The increase in degree of Si-undersaturation with time for the Phase 1 and Phase 2 lavas is best explained by decreasing temperatures of this flow-front that resulted in less melt contribution from the di- apiric mantle while the amphibole-rich veins within the lithosphere continued to be easily fusible, although we cannot totally exclude the possibility that the Phase 2 volcanism tapped a vein-richer domain which formed sub- sequent to the Phase 1 volcanism. © 2012 Elsevier B.V. All rights reserved. 1. Introduction The continental lithosphere is thicker and compositionally more variable than its oceanic counterpart. As such, magmas generated in continental settings are potentially more susceptible to compositional modification via magma–lithosphere interaction during their ascent to the surface. This is supported by the wide range of chemical and Chemical Geology 335 (2013) 149–171 ⁎ Corresponding author at: Institute of Earth Sciences, Academia Sinica, Taipei 11529, Taiwan. Tel.: +886 2 2783 9910x618; fax: +886 2 2783 9871. E-mail address: [email protected] (G.S.-K. Ma). 0009-2541/$ – see front matter © 2012 Elsevier B.V. All rights reserved. http://dx.doi.org/10.1016/j.chemgeo.2012.11.001 Contents lists available at SciVerse ScienceDirect Chemical Geology journal homepage: www.elsevier.com/locate/chemgeo
Transcript of Evolution and origin of the Miocene intraplate basalts on the Aleppo Plateau, NW Syria

Chemical Geology 335 (2013) 149–171
Contents lists available at SciVerse ScienceDirect
Chemical Geology
j ourna l homepage: www.e lsev ie r .com/ locate /chemgeo
Evolution and origin of the Miocene intraplate basalts on the Aleppo Plateau,NW Syria
George S.-K. Ma a,b,⁎, John Malpas b, Katsuhiko Suzuki c, Ching-Hua Lo d, Kuo-Lung Wang a,Yoshiyuki Iizuka a, Costas Xenophontos b
a Institute of Earth Sciences, Academia Sinica, Taipei 11529, Taiwanb Department of Earth Sciences, The University of Hong Kong, Pokfulam Road, Hong Kongc Institute for Research on Earth Evolution/PEL/Seafloor Resources Research Project, Japan Agency for Marine-Earth Science and Technology (JAMSTEC), Natsushima, Yokosuka 237-0061, Japand Department of Geosciences, National Taiwan University, 245 Choushan Road, Taipei 106, Taiwan
⁎ Corresponding author at: Institute of Earth Sciences, ATaiwan. Tel.: +886 2 2783 9910x618; fax: +886 2 2783
E-mail address: [email protected] (G.S.
0009-2541/$ – see front matter © 2012 Elsevier B.V. Allhttp://dx.doi.org/10.1016/j.chemgeo.2012.11.001
a b s t r a c t
a r t i c l e i n f oArticle history:Received 21 December 2011Received in revised form 1 November 2012Accepted 2 November 2012Available online 12 November 2012
Editor: L. Reisberg
Keywords:40Ar/39Ar geochronologyRe–Os isotopeMetasomatic veinIntraplate volcanismAmphiboleCrustal contamination
The source of intraplate basalts has long been a controversial topic, particularly in continental settingswhere am-biguity increases because both crustal contamination and crystal fractionation may mask important source char-acteristics. We present geochemical data to constrain the source and the chemical evolution of the continentalintraplate magmas from the Aleppo Plateau and vicinity, NW Syria. New 40Ar/39Ar ages, coupled with published40Ar/39Ar and K–Ar ages, reveal two discrete Miocene volcanic phases, ~19–18 Ma (Phase 1) and ~13.5–12 Ma(Phase 2), in the studied area. New chemical and isotopic compositions [87Sr/86Sr=0.7036–0.7051, εNd=+4.5 to +1.1 and (187Os/188Os)t=0.151–0.453] of the lavas reflect the unequivocal influence of crustal assimi-lation and fractional crystallisation (AFC). Despite the effects of the AFC processes, there still appear to be somedifferences between the most-primitive, least contaminated magmas of the two volcanic phases, interpreted asa result of source heterogeneity.Whereas the Phase 1 lavas, with relatively high Si, low Ti and trace-element con-tents, are consistent with partial melting of a largely peridotitic mantle source, the origin of the Phase 2 lavas ismore complicated. The latter are characterised by a source component depleted in Si and enriched in Ti, Fe, Ca,P, alkalis, light and middle rare earth elements (REEs) relative to heavy REEs and with sub-chondritic Th–(U)/Nb, Pb/Ce and Zr/Sm. They approach compositions of experimental melts of amphibole-rich metasomatic veins.The compositional variations among the most primitive Phase 2 lavas are difficult to reconcile with varying de-grees of partial melting of either the metasomatic veins or peridotite, but could be explained if partial melts ofboth lithologies were variably mixed, a scenario that could be sensibly envisioned as ascending (peridotitic)plume/asthenosphere derived melts assimilating highly fusible metasomatic veins during their traverse throughthe lithosphere. This process can be loosely quantified by trace-element forward partial melting modellingthat suggests mixing of up to 80% metasomatic melts derived from ~40% melting of amphibole-rich meta-somatic veins (which themselves were inevitably compositionally and mineralogically heterogeneous)with 20% plume/asthenospheric melts derived from ~7%melting of a garnet peridotite. Within the compres-sional framework of northern Arabia, invocation of diapiric material reasonably accounts for the generation ofthe intraplate basalts in Syria. Derivation of the Phase 2 hybrid melts was probably triggered by lateral flow ofthis diapiricmaterial beneath the lithosphere subsequent to its arrival, with themigrating flow-front controllingthe locus of volcanism. The increase in degree of Si-undersaturationwith time for the Phase 1 and Phase 2 lavas isbest explained by decreasing temperatures of this flow-front that resulted in less melt contribution from the di-apiric mantle while the amphibole-rich veins within the lithosphere continued to be easily fusible, although wecannot totally exclude the possibility that the Phase 2 volcanism tapped a vein-richer domainwhich formed sub-sequent to the Phase 1 volcanism.
© 2012 Elsevier B.V. All rights reserved.
cademia Sinica, Taipei 11529,9871.-K. Ma).
rights reserved.
1. Introduction
The continental lithosphere is thicker and compositionally morevariable than its oceanic counterpart. As such, magmas generated incontinental settings are potentially more susceptible to compositionalmodification via magma–lithosphere interaction during their ascentto the surface. This is supported by the wide range of chemical and
150 G.S.-K. Ma et al. / Chemical Geology 335 (2013) 149–171
isotopic compositions of continental intraplate basalts, of which somedisplay compositions akin to oceanic basalts and others have signa-tures more typical of continental crust (e.g. Carlson, 1991). The latteris normally characterised by high large ion lithophile elements (LILEs,e.g. Rb) and “enriched” isotopic signatures (e.g. low εNd and high87Sr/86Sr) that must reflect some contributions from the continentallithosphere traversed by the magmas (Hawkesworth et al., 1984;Baker et al., 1996a, 2000). Consequently, understanding magma gen-esis and its related geodynamics in continental settings is generallymore difficult, and requires unravelling the complex evolutionary his-tory (crystal fractionation and wall-rock assimilation) of the magmasduring lithospheric mantle and crustal passage and storage.
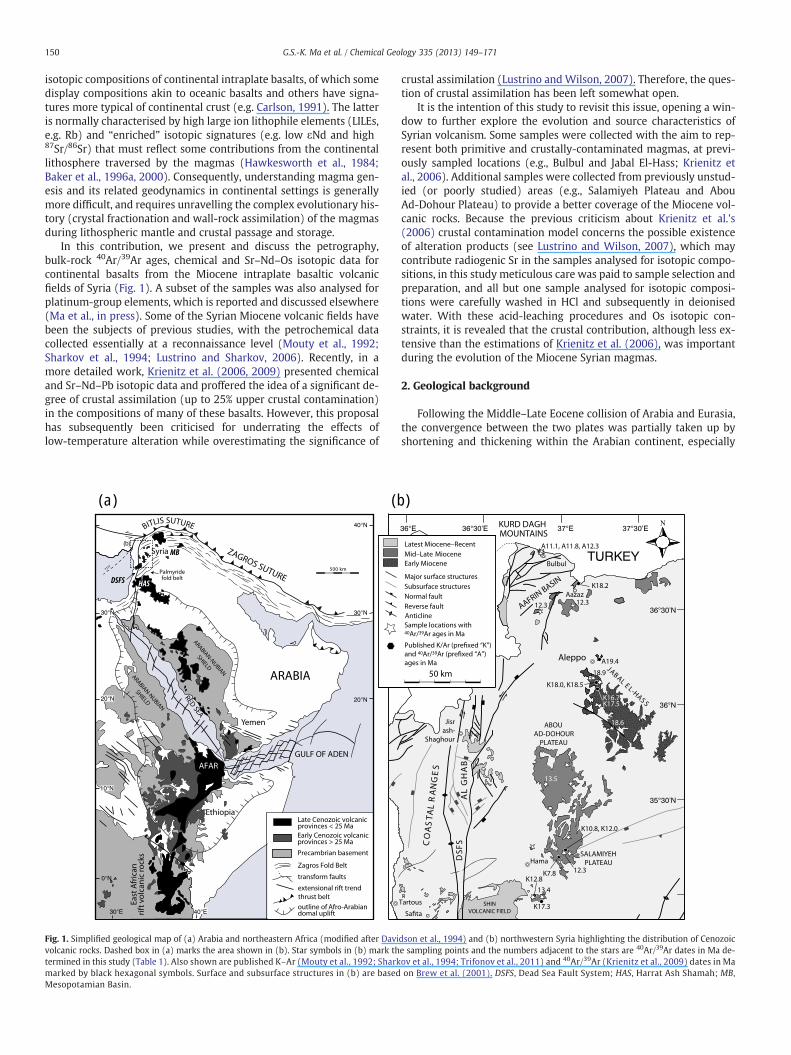
In this contribution, we present and discuss the petrography,bulk-rock 40Ar/39Ar ages, chemical and Sr–Nd–Os isotopic data forcontinental basalts from the Miocene intraplate basaltic volcanicfields of Syria (Fig. 1). A subset of the samples was also analysed forplatinum-group elements, which is reported and discussed elsewhere(Ma et al., in press). Some of the Syrian Miocene volcanic fields havebeen the subjects of previous studies, with the petrochemical datacollected essentially at a reconnaissance level (Mouty et al., 1992;Sharkov et al., 1994; Lustrino and Sharkov, 2006). Recently, in amore detailed work, Krienitz et al. (2006, 2009) presented chemicaland Sr–Nd–Pb isotopic data and proffered the idea of a significant de-gree of crustal assimilation (up to 25% upper crustal contamination)in the compositions of many of these basalts. However, this proposalhas subsequently been criticised for underrating the effects oflow-temperature alteration while overestimating the significance of
(a) (b
Fig. 1. Simplified geological map of (a) Arabia and northeastern Africa (modified after Davivolcanic rocks. Dashed box in (a) marks the area shown in (b). Star symbols in (b) mark thtermined in this study (Table 1). Also shown are published K–Ar (Mouty et al., 1992; Sharkmarked by black hexagonal symbols. Surface and subsurface structures in (b) are basedMesopotamian Basin.
crustal assimilation (Lustrino and Wilson, 2007). Therefore, the ques-tion of crustal assimilation has been left somewhat open.
It is the intention of this study to revisit this issue, opening a win-dow to further explore the evolution and source characteristics ofSyrian volcanism. Some samples were collected with the aim to rep-resent both primitive and crustally-contaminated magmas, at previ-ously sampled locations (e.g., Bulbul and Jabal El-Hass; Krienitz etal., 2006). Additional samples were collected from previously unstud-ied (or poorly studied) areas (e.g., Salamiyeh Plateau and AbouAd-Dohour Plateau) to provide a better coverage of the Miocene vol-canic rocks. Because the previous criticism about Krienitz et al.'s(2006) crustal contamination model concerns the possible existenceof alteration products (see Lustrino and Wilson, 2007), which maycontribute radiogenic Sr in the samples analysed for isotopic compo-sitions, in this study meticulous care was paid to sample selection andpreparation, and all but one sample analysed for isotopic composi-tions were carefully washed in HCl and subsequently in deionisedwater. With these acid-leaching procedures and Os isotopic con-straints, it is revealed that the crustal contribution, although less ex-tensive than the estimations of Krienitz et al. (2006), was importantduring the evolution of the Miocene Syrian magmas.
2. Geological background
Following the Middle–Late Eocene collision of Arabia and Eurasia,the convergence between the two plates was partially taken up byshortening and thickening within the Arabian continent, especially
)
dson et al., 1994) and (b) northwestern Syria highlighting the distribution of Cenozoice sampling points and the numbers adjacent to the stars are 40Ar/39Ar dates in Ma de-ov et al., 1994; Trifonov et al., 2011) and 40Ar/39Ar (Krienitz et al., 2009) dates in Maon Brew et al. (2001). DSFS, Dead Sea Fault System; HAS, Harrat Ash Shamah; MB,

151G.S.-K. Ma et al. / Chemical Geology 335 (2013) 149–171
along its northern margin (Hempton, 1985). Although convergencebetween the continents began to slow down in the Oligocene, manypre-existing extensional features and depocentres were tectonicallyinverted as a consequence of continued stress created by the juxtapo-sition of the two continents. The continuous convergence also led to theseparation of Arabia from Africa along the Red Sea, Gulf of Aden andDead Sea Fault System in the Late Oligocene–Early Miocene, and to thewestward extrusion of Anatolia along the North and East AnatolianFaults since the latest Miocene (Hempton, 1987). McQuarrie et al.(2003) estimate that convergence is still ongoing today at a rate of24±4 mm/year.
The wealth of Cenozoic intraplate volcanic occurrences in westernArabia and eastern Africa is a prominent feature of the region(Fig. 1a). The outpouring of voluminous flood basalts in Yemen, Djibouti
0.0 0.1 0.2 0.3 0.4 0.5 0.6 0.7 0.8 0.9 1.0
Fraction of 39ArK released
App
aren
t Age
(M
a)
11
12
13
14
15
AL-08
App
aren
t Age
(M
a)
12.3 ± 0.2 Ma
57.1% 39Ar intergrated
MSWD = 0.51, p = 0.77
(a)
11
12
13
14
15
AL-24
App
aren
t Age
(M
a)
13.5 ± 0.1 Ma
71.7% 39Ar intergrated
MSWD = 1.14, p = 0.34
(b)
App
aren
t Age
(M
a)
17
19
21
23
25
JEH-02
18.9 ± 0.4 Ma
66.7% 39Ar intergrated
MSWD = 0.14, p = 0.94
(c)
12
14
16
18
20
22
JEH-14
18.6 ± 0.2 Ma
87.4% 39Ar intergrated
MSWD = 0.57, p = 0.80
(d)
Fig. 2. 40Ar/39Ar age spectra for bulk-rock samples from the Miocene intraplat
and Ethiopia, classically related to the emplacement of the Afar plume at~30–25 Ma, probably marks the beginning of this active magmatic pe-riod. Subsequent volcanic activity (25–0 Ma) along the eastern coastof the Red Sea and the Gulf of Aqaba, and as far north as the vicinity ofthe northern Dead Sea Fault System in Syria has been linked to thenorthward channelling of such Afar plume material at the base of thelithosphere (Camp and Roobol, 1992; Krienitz et al., 2009), althoughother models exist. These alternative models include emplacement of(1) asthenospheric diapirs, independent of the Afar plume, beneath in-dividual volcanic fields (Camp and Roobol, 1992; Krienitz et al., 2007;Ma et al., 2011a), and passive asthenospheric flows associated with(2) lithospheric transtension (Shaw et al., 2003; Lustrino and Sharkov,2006) or (3) delamination of the Eastern Anatolian lithosphere in con-junction with steepening and subsequent break-off of the subducted
App
aren
t Age
(M
a)
12
14
16
18
20
NW-06
12.3 ± 0.2 Ma
90.7% 39Ar intergrated
MSWD = 0.62, p = 0.60
(f)
7.5
10.0
12.5
15.0
17.5
20.0
NW-01
App
aren
t Age
(M
a)
12.3 ± 0.1 Ma
83.8% 39Ar intergrated
MSWD = 0.59, p = 0.74
(e)
0.0 0.1 0.2 0.3 0.4 0.5 0.6 0.7 0.8 0.9 1.0
Fraction of 39ArK released
App
aren
t Age
(M
a)
10
11
12
13
14
15
RA-0313.4 ± 0.2 Ma
56.9% 39Ar intergrated
MSWD = 0.14, p = 0.97
(g)
e volcanism in NW Syria. Steps used for age calculations are shaded grey.

152 G.S.-K. Ma et al. / Chemical Geology 335 (2013) 149–171
Arabian slab beneath Eastern Anatolia and northernmost Syria (Keskin,2003; Krienitz et al., 2006).
The present investigation deals with the volcanic fields cropping outon the Aleppo Plateau and to the south of the Kurd Dagh Mountains.These include, from south to north, the Salamiyeh volcanic field, theAbou Ad-Dohour volcanic field, Jabal El-Hass and scattered occurrencesaround the Aafrin Basin along the border with Turkey (Fig. 1). All ofthese volcanic plateaux were active before the onset of the Dead SeaFault System in Syria. From limited exposures as well as the size andamounts of the lava boulders, it appears that theseMiocene volcanic oc-currences are relatively thin inmost areas (b10 m thick) and are of “aa”type. Although there has beenmention of an up to 350 m-thick lava se-quence (Krienitz et al., 2006), individual flows are normally not thickerthan 2 m. Pillow lavas, attesting to underwater eruptions, are occasion-ally observed. In this paper, theseMiocene lavas are collectively referredto as Aleppo Plateau lavas, unless otherwise stated.
The majority of the Miocene Aleppo Plateau lavas rest upon theMiddle Eocene clay-rich limestones of the Ma'arra Formation. Early–Middle Miocene organic limestones are locally present as a promi-nent marker separating the Early Miocene lavas from the youngerones, but the age of the youngest lavas is controversial.
3. 40Ar/39Ar geochronology
Seven new 40Ar/39Ar bulk-rock ages are determined for lavas fromthe Aleppo Plateau in this study (Figs. 1b and 2, and Table 1; seeAppendix A for methodology). Both age spectra and inverse iso-chrons, which use the same plateau increments as the age spectra,are used to evaluate the results of the step-heating experiments.Ages obtained from both methods are entirely concordant at the95% confidence level, although several samples (AL-24, NW-01,NW-06 and RA-03) returned atmospheric 40Ar/36Ar slightly deviatingfrom 295.5. Plateau ages are used for all samples in this study.
Volcanic rocks in Jabal El-Hass were previously mapped as UpperPliocene, overlying Lower Pliocene conglomerates in some areas(Wappy et al., 2003). However, no such conglomerates have been ob-served in the present fieldwork. In light of this, two Jabal El-Hass ba-salts were dated, yielding ages of 18.9±0.4 Ma and 18.6±0.2 Ma.These two ages are comparable to another 40Ar/39Ar age of 19.5±0.5 Ma reported by Krienitz et al. (2009) for a sample from immedi-ately east of the city of Aleppo. These Early Miocene basalts are con-sidered samples from a single suite of volcanism, herein tagged asPhase 1.
Younger Miocene volcanism peaked in the Serravallian accordingto the 40Ar/39Ar dates obtained in this study and that of Krienitz etal. (2009). Five samples from this study give an age range between13.5±0.1 Ma and 12.3±0.2 Ma. The slightly older samples (13.6±0.3 Ma and 13.3±0.2 Ma) crop out at the northern part of the Aleppo
Table 1Bulk-rock 40Ar/39Ar data for volcanic rocks from the Aleppo Plateau and its vicinity, NW Sy
Sample Locality n/Na Fraction of 39Arreleased
Total gas age(Ma)±2σ
Age spec
Age (Ma
Phase 2AL-08 35°10′32″N 36°58′54″E 6/16 0.571 12.5±0.2 12.3±0AL-24 35°33′19″N 36°51′19″E 7/17 0.717 13.0±0.2 13.5±0NW-01 36°30′32″N 37°02′02″E 7/16 0.838 11.6±0.2 12.3±0NW-06 36°28′01″N 36°47′19″E 4/16 0.907 12.5±0.2 12.3±0RA-03 34°56′35″N 36°50′43″E 5/16 0.569 12.8±0.2 13.4±0
Phase 1JEH-02 36°07′47″N 37°10′16″E 4/16 0.667 19.1±0.4 18.9±0JEH-14 35°50′32″N 37°24′44″E 9/17 0.874 18.1±0.2 18.6±0
Bold: preferred age.a n, number of steps integrated; N, total number of steps.b MSWD, mean square weighted deviate calculated following the approach of Baksi (200c P, probability of occurrence calculated using the relevant Chi Square value (e.g. DeVor
Plateau (Abou Ad-Dohour volcanic field) and areas east of Rastan(east of the Early Pliocene Homs basalts). Between these two areaslies the Salamiyeh volcanic field (southern part of the Aleppo Plateau)with a single sample dated at 12.3±0.2 Ma. Other lavas of identicalages (12.3±0.2 and 12.3±0.1 Ma) are scattered in areas northwestof Aleppo (Fig. 1b), and are comparable with three samples with40Ar/39Ar dates 11.1±0.9 Ma, 11.8±0.2 Ma and 12.3±0.3 Ma re-spectively, from a lava section north of Bulbul near the Syrian–Turkishborder in northwesternmost Syria (Krienitz et al., 2009). All these Mid-dle Miocene ages are considered as the Phase 2 volcanism.
Supported by newer 40Ar/39Ar dates, the Miocene volcanismshows two peaks of activity (top panel of Fig. 3). Previously publishedK–Ar dates appear to be more dispersed compared to the 40Ar/39Ardates of this study and those of Krienitz et al. (2009), somethingwhich may be speculatively attributed to non-equilibration of thesamples with atmospheric argon (36Ar). The use of 36Ar contents togauge the reliability of 40Ar/39Ar and K–Ar dates has been demon-strated by Roddick (1978) and Baksi (1987) who showed that the36Ar contents of volcanic rocks seem to increase with the amount ofdevitrification and alteration exhibited by the rocks. Whereas no36Ar data is available for any of the published Syrian K–Ar dates, theAleppo Plateau samples (18.0–16.7 Ma) measured by Mouty et al.(1992) do possess low 40K/36Ar ratios (8770–13,490), casting doubtson the reliability of the published K–Ar dates of the Syrian volcanism.In comparison, Baker et al. (1996b), in examining K–Ar and 40Ar/39Ardates of Yemeni and Ethiopian volcanic rocks, suggest that only sam-ples with 40K/36Ar>500,000 provide reliable bulk-rock K–Ar dates.Nevertheless, the two peaks of volcanism as revealed from relativeprobability analysis (Ludwig, 2008) are convincing.
A comparison of the volcanic activity on the Aleppo Plateau,northern Dead Sea Fault System, Syrian Mesopotamian Basin andHarrat Ash Shamah (HAS) suggests that each of these regions inSyria and vicinity possesses its distinct period and climax of volca-nism (Fig. 3), an observation made also by Krienitz et al. (2009).
4. Petrography and mineral chemistry
The basalts are invariably olivine-phyric, with a microcrystallinegroundmass of plagioclase (40–60 vol.%), clinopyroxene (10–30 vol.%),olivine (3–15 vol.%) and Fe–Ti oxides (3–10 vol.%). Groundmass nephe-line and apatite are found in one of the Si-undersaturated samples(AL-07) and groundmass pigeonite in one of the Si-saturated samples(JEH-14). In the “most-primitive” samples (MgO>~9 wt.%), olivine(~10–15 vol.%) is the only phenocryst phase. Clinopyroxene and plagio-clase phenocrysts become increasingly more abundant in the more-evolved samples. Each of their modes varies from 1–5 vol.% in sampleswith 8–9 wt.% MgO to ~10 vol.% in those with b6 wt.% MgO. Wherepresent, the clinopyroxenes are commonly zoned (both sector and
ria.
trum plateau age Inverse isochron analysis
)±2σ MSWDb Pc Age (Ma)±2σ MSWDb Pc (40Ar/36Ar)Air±1σ
.2 0.51 0.77 12.5±0.3 0.76 0.55 297±3
.1 1.14 0.34 13.3±0.2 1.0 0.39 298±2
.1 0.59 0.74 12.4±0.2 0.72 0.61 294±1
.2 0.62 0.60 12.4±0.2 0.62 0.54 292±2
.2 0.14 0.97 13.6±0.3 0.33 0.80 292±3
.4 0.14 0.94 19.0±0.3 0.41 0.67 295±1
.2 0.57 0.80 18.8±0.6 0.78 0.60 293±4
3).et al., 1992) following the approach of Baksi (2003).

Fre
quen
cy
0
10
20
30
40
50
60
70
Fre
quen
cy
0
5
10
15
20
25
30
Fre
quen
cy
0
2
4
6
8
10
Fre
quen
cy
0
1
2
3
4
5
6
7
8
Age (Ma)0 5 10 15 20 25 30 35 40 45
Aleppo Plateau and vicinity(NW Syria)
n = 21
Mesopotamian Basin(E & NE Syria)
n = 20
DSFS-related(W Syria)
n = 50
Harrat Ash Shamah & Palmyrides(S. Syria, S. Lebanon & Golan Heights)
n= 238
Rel
ativ
e P
roba
bilit
yR
elat
ive
Pro
babi
lity
Rel
ativ
e P
roba
bilit
yR
elat
ive
Pro
babi
lity
Ar-Ar (step heating)Ar-Ar (total gas age)K-Ar
153G.S.-K. Ma et al. / Chemical Geology 335 (2013) 149–171
concentric) and are occasionally observed as glomerocrysts togetherwith other clinopyroxene, olivine and plagioclase grains. The grainswithin these clusters are generally smaller than the individually occur-ring ones. Intergranular and pilotaxitic textures are most common inthe samples, but in several coarser-grained samples, sub-ophitic textureis more obvious than intergranular texture. One sample differing fromthe above descriptions is a scoria (JEH-07; 5.1 wt.% MgO), which islargely vitreous but somewhat devitrified to plagioclase microcrysts.Several sub-equant, six-sided, highly altered grainsmay be relics of oliv-ine phenocrysts. Because of its intense vesicularity (>30 vol.%), thissample is more altered than the others and it was meticulouslyhandpicked under a binocular microscope to remove visible impuritiesand cleaned in acid and deionised water before geochemical analysis.
Electron microprobe (EMP) analysis (see Appendix A) was carriedout to study whether the minerals, particularly olivines, could havecrystallised in equilibrium with the magmas, or are xenocrysts fromthe lithospheric mantle. Representative data are provided in Table 2and the results are summarised as follows.
Olivine compositions are Fo84–42 for the phenocrysts, and Fo66–39for the groundmass. Embayed phenocrysts tend to have high Fo(Fo82–79). The majority of the olivines are normally zoned, with a~10% or less drop in Fo from core to rim (Supplementary Fig. S1).There is no evidence that any of these olivines represents a fragmentof the lithospheric mantle, judging from their relatively low Fo andlack of kink-banding. The olivine compositions are summarised asFo vs bulk-rock Mg# in Fig. 4. In brief, most Phase 2 samples havetheir most magnesian olivines lying within and other less magnesianones below the field defined by Fe–Mg exchange coefficients ofRoeder and Emslie (1970) for olivine crystallised in equilibriumwith a given liquid (bulk rock) composition. It is interpreted thatthe magnesian phenocryst cores represent the first-formed crystalswhereas the composition ranges reflect evolving liquid compositionsas crystallisation proceeded. In contrast, the olivines of the threeanalysed Phase 1 samples (JEH-01, JEH-02 and JEH-014) plot belowRoeder and Emslie's (1970) olivine–liquid equilibrium field. Thismay result from accumulation of olivines, as supported by their pe-trography (olivine phenocryst-rich).
The clinopyroxene phenocrysts (Wo41–49En37–46Fs10–15) are poorerin the ferrosilite [Fs: mol% Fe/(Fe+Mg+Ca)] component than those ofthe groundmass (Wo28–51En32–49Fs13–26). Both straddle the diopside–augite fields, using the classification of Morimoto et al. (1988). All theporphyritic plagioclases are labradorite (An53–66Ab33–45Or1–2) whereasthe groundmass plagioclases are labradorite, andesine or rarely oligo-clase (An29–66Ab33–67Or1–4). Only on very rare occasions are sanidinelaths (An6Ab47–50Or44–47) encountered in the groundmass of some sam-ples (e.g. AL-07). Spinels included in olivine and clinopyroxene pheno-crysts range from Cr-spinel (Cr# up to 65.6) to titanomagnetite (up to68.5 mol% MgFe23+O4 component). In the more evolved samples,titanomagnetite inclusions become more abundant than Cr-spinel(lower Cr#). Groundmass Fe–Ti oxides are mainly titanomagnetite andilmenite.
5. Geochemical results
The bulk-rockmajor- and trace-element compositions and Sr–Nd–Osisotopic compositions of the Miocene volcanic rocks from the AleppoPlateau and vicinity are provided in Table 3, whereas the CIPW normsare included in the supplementary Table S1 and the analytical proce-dures in the Appendix A.
Fig. 3.Histograms and relative probability (bold curves; Ludwig, 2008) of Cenozoic vol-canism in Syria and the vicinity, complied from K–Ar and 40Ar/39Ar dates from the lit-erature (Raad, 1979; Heimann and Steinitz, 1989; Mouty et al., 1992; Mor, 1993;Sharkov et al., 1994, 1998; Butler et al., 1997; Ilani et al., 2001; Demir et al., 2007;Krienitz et al., 2007, 2009; Searle et al., 2010; Trifonov et al., 2011; G. Ma et al.,unpublished data) and this study. DSFS, Dead Sea Fault System.

Table 2Representative electron microprobe analyses (wt.%) of minerals from the Miocene Aleppo Plateau lavas.
Sample Lab ID Comment SiO2 TiO2 Al2O3 Fe2O3a FeO MnO MgO CaO Na2O K2O Cr2O3 NiO Total Mg# Cr# An
(En)Ab(Fs)
Or(Wo)
OlivinesAL-08 AL08_GZ01 Core 39.36 bdl 0.04 – 18.51 0.29 41.18 0.22 0.04 bdl bdl 0.17 99.81 79.9 – – – –
AL-08 AL08_GZ17 Groundmass 37.30 bdl 0.05 – 29.49 0.55 32.26 0.30 bdl 0.03 bdl bdl 99.98 66.1 – – – –
AL-07 AL07_OL1-4 Core 38.50 0.06 0.03 – 16.44 0.37 44.69 0.28 bdl na bdl 0.29 100.66 82.9 – – – –
AL-07 AL07_OL1-1 Rim ofAL07_OL1-4
38.44 0.05 bdl – 17.55 0.22 44.33 0.35 0.02 na bdl 0.28 101.25 81.8 – – – –
AL-07 AL07_A-14 Groundmass 34.19 0.06 0.35 – 46.93 0.08 17.84 1.02 0.11 0.03 bdl bdl 100.64 40.4 – – – –
NW-14 NW14_GZ25 Core 40.04 bdl 0.04 – 17.22 0.24 42.20 0.21 bdl bdl bdl 0.16 100.12 81.4 – – – –
RA-03 RA03_GZ22 Core 38.54 bdl bdl – 17.85 0.15 42.82 0.20 bdl bdl bdl 0.34 99.89 81.1 – – – –
RA-03 RA03_GZ23 Rim ofRA03_GZ22
38.27 bdl 0.04 – 19.62 0.26 41.22 0.26 0.06 bdl bdl 0.19 99.92 78.9 – – – –
RA-03 RA03_GZ38 Microphenocrystcore
39.09 bdl 0.06 – 16.47 0.19 43.73 0.22 0.05 bdl bdl 0.29 100.10 82.6 – – – –
S71-05 S71_GZ01 Core 40.11 bdl bdl – 16.12 0.20 43.47 0.20 bdl bdl 0.07 0.38 100.55 82.8 – – – –
S71-05 S71_GZ02 rim of S71_GZ01 40.34 bdl bdl – 16.41 0.20 43.10 0.19 bdl bdl bdl 0.29 100.53 82.4 – – – –
JEH-02 JEH02_GZ01 Core 38.81 bdl 0.07 – 17.62 0.20 41.91 0.20 bdl bdl 0.11 0.25 99.17 80.9 – – – –
JEH-02 JEH02_GZ02 Rim ofJEH02_GZ01
38.32 bdl bdl – 21.67 0.28 38.52 0.20 0.06 bdl bdl 0.20 99.25 76.0 – – – –
JEH-02 JEH02_GZ10 Microphenocrystcore
37.82 bdl bdl – 24.08 0.29 37.64 0.22 bdl bdl bdl 0.16 100.21 73.6 – – – –
ClinopyroxenesAL-08 AL08_GZ18 Core 50.45 1.23 4.68 – 7.16 0.12 14.29 20.86 0.61 bdl 0.17 bdl 99.56 78.1 – 42.8 12.2 44.9AL-08 AL08_GZ19 Rim of
AL08_GZ1847.95 2.24 4.91 – 8.52 0.11 12.41 22.12 0.66 0.11 bdl bdl 99.03 72.2 – 37.4 14.6 48.0
AL-08 AL08_GZ35 Microphenocrystcore
49.49 1.24 4.71 – 7.29 0.09 13.80 22.36 0.54 0.02 0.12 bdl 99.65 77.1 – 40.6 12.2 47.3
AL-08 AL08_GZ09 Groundmass 49.40 1.68 4.21 – 8.33 0.15 13.00 22.29 0.70 0.05 0.08 bdl 99.88 73.6 – 38.5 14.1 47.4NW-14 NW14_GZ01 Inclusion in ol
phenocryst50.42 1.07 4.17 – 7.58 0.16 14.70 20.79 0.44 bdl 0.59 bdl 99.92 77.6 – 43.3 12.8 44.0
RA-03 RA03_GZ13 Core 48.34 1.78 7.29 – 7.56 0.14 12.98 20.32 0.61 bdl 0.38 bdl 99.39 75.4 – 40.7 13.6 45.8RA-03 RA03_GZ14 Rim of
RA03_GZ1349.07 2.21 4.95 – 8.61 0.16 12.72 20.42 0.54 bdl 0.43 bdl 99.09 72.5 – 39.4 15.2 45.4
JEH-02 JEH02_GZ08 Groundmass 52.50 0.52 1.43 – 8.38 0.20 17.33 18.33 0.22 bdl 0.40 bdl 99.31 78.6 – 49.1 13.6 37.3
FeldsparsAL-08 AL08_GZ16 Groundmass 54.64 0.12 27.56 – 0.46 bdl bdl 10.61 5.60 0.40 bdl bdl 99.40 – – 50.0 47.8 2.2AL-08 AL08_GZ33 Core 50.30 0.11 29.96 – 0.33 bdl bdl 13.80 3.82 0.29 bdl bdl 98.61 – – 65.5 32.8 1.7AL-08 AL08_GZ34 Rim of
AL08_GZ3353.36 0.16 28.61 – 0.25 bdl bdl 12.03 4.75 0.40 bdl 0.11 99.67 – – 57.0 40.7 2.3
AL-07 AL07_A-23 Groundmass 63.46 0.18 19.76 – 0.58 bdl 0.08 1.13 5.25 7.98 bdl bdl 98.41 – – 5.6 47.2 47.2AL-24 AL24_GZ17 Core 54.51 bdl 27.98 – 0.49 bdl 0.13 11.59 5.03 0.41 bdl bdl 100.13 – – 54.7 43.0 2.3AL-24 AL24_GZ18 Rim of
AL24_GZ1755.17 0.20 27.66 – 0.58 bdl 0.10 11.30 5.28 0.29 bdl bdl 100.57 – – 53.3 45.1 1.6
JEH-02 JEH02_GZ09 Groundmass 53.32 0.19 27.81 – 0.65 bdl 0.12 11.72 4.91 0.27 bdl bdl 98.99 – – 56.0 42.4 1.6
OxidesAL-24 AL24_GZ24 Titanomagnetite
groundmass0.13 26.97 1.33 15.43 53.20 0.56 1.65 na na na bdl bdl 99.27 – – – – –
NW-14 NW14_GZ14 Titanomagnetitegroundmass
0.28 20.73 0.85 26.88 48.85 0.45 0.77 na na na bdl bdl 98.84 – – – – –
AL-07 AL07_OL1-7 Cr-spinelinclusion in olcore(AL07-OL1-4)
0.37 2.60 33.70
RA-03 RA03_GZ19 Cr-spinelinclusion in cpxglomerocrysts
0.25 4.59 18.26 25.39 25.02 0.26 8.91 na na na 17.55 0.29 100.52 39.2 38.8 – – –
RA-03 RA03_GZ35 Titanomagnetitegroundmass
0.17 24.79 2.03 19.79 52.13 0.73 1.37 na na na 0.10 bdl 101.17 3.16 4.47 – – –
AL-24 AL24_GZ04 Ilmenitegroundmass
0.15 49.78 0.07 5.42 41.22 0.69 1.68 0.07 na na bdl bdl 99.13 6.8 – – – –
JEH-02 JEH02_GZ14 Ilmenitegroundmass
0.35 47.38 0.14 11.43 38.16 0.41 2.41 0.39 na na bdl bdl 100.73 10.1 – – – –
Nepheline Ne Ks 0.5An 2QtzAL-07 AL07_C-23 Groundmass 52.76 0.08 28.69 1.53 – 0.09 0.45 0.53 14.79 1.74 bdl 0.16 100.66 71.4 5.5 1.4 21.7Pigeonite
Mg#=mol%Mg/(Mg+Fe2+); Cr#=mol% Cr/(Cr+Al); bdl, below detection limit; na, not analysed; –, not calculated.a Fe2O3 in oxides calculated assuming perfect stoichiometry.
154 G.S.-K. Ma et al. / Chemical Geology 335 (2013) 149–171

35
45
55
65
75
85
95
50 52 54 56 58 60 62 64 66 68
Oliv
ine
Fo
Bulk-rock Mg#
phenocrystgroundmass
KD=0.33
KD=0.30
KD=0.23
KD=0.27
JEH
-14
AL-
07
JEH
-01
JEH
-02
S71
-05
AL-
08
RA
-03
AL-
24
NW
-14
Fig. 4. Olivine forsterite (Fo) content (mol% Fo) vs bulk-rockMg# [mol%Mg/(Mg+Fe2+),assuming 10% total iron oxide is ferric]. Bold and dashed curves show predicted olivine Focontents in equilibriumwith the bulk-rock, using different values of partition coefficients(KD). Symbols: phenocrysts are in bars (−) and groundmass in crosses (x). Vertical linesconnect analyses from the same samples.
155G.S.-K. Ma et al. / Chemical Geology 335 (2013) 149–171
5.1. Major and trace elemental geochemistry
The two phases of Miocene volcanism in NW Syria exhibit differentbulk-rock compositions. The Phase 1 samples are mainly hypersthene(hy)-olivine (ol) normative (Hy1–29)with a subordinate number of sam-ples beingmarginally quartz (qz) normative (up to Qz5). These samplesare considered as a single series in this study. The Phase 2 samples rangefrom nepheline (ne) normative (up to Ne14) to hy-normative (Hy27).They are hereafter considered as two distinct groups, ne-normativeand hy-normative, and it will be shown that these two groups oflavas experienced different evolutionary histories. For comparisonwith the IUGS classification scheme, the Phase 1 and 2 samples areplotted on the TAS diagram of Le Maitre (2002), and fall into thefields of (1) tholeiitic basalt and basaltic andesite for the Phase 1samples, and (2) basanite, alkali basalt, hawaiite, mugearite, tholeiit-ic basalt and basaltic andesite for the Phase 2 volcanism (Fig. 5).
Major- and selected trace-element data for the basalts are plottedvs MgO in Figs. 6 and 7, together with literature data (Mouty et al.,1992; Krienitz et al., 2006, 2009; Lustrino and Sharkov, 2006). ThePhase 1 and Phase 2 lava series exhibit similar and wide ranges ofMgO (Phase 1: 4.7–11.0 wt.%; Phase 2: 4.2–9.5 wt.%; volatile-freebasis), overall positively correlated with Ni and Cr. The Phase 1 ba-salts define limited ranges of SiO2 (Phase 1: 50.2–54.0 wt.%), TiO2
and incompatible trace elements (e.g. Nb; Fig. 7c). They exhibit flatSiO2, increasing TiO2, P2O5, incompatible trace elements as exempli-fied by Zr, and to a lesser extent Al2O3, FeOT and Na2O over the courseof decreasing MgO. On the contrary, the Phase 2 basalts arecharacterised by wider ranges of SiO2 (43.7–50.5 wt.%), TiO2, FeOT,P2O5 and incompatible trace elements, with more samples in thehy-normative group being more evolved (lower MgO) than thene-normative group. In general, the Phase 2 ne- and hy-normativebasalts define continuous trends in several instances: increasingSiO2, Al2O3, and decreasing FeOT over the course of MgO decline.TiO2, CaO, Na2O, K2O, P2O5, and incompatible trace elements arescattered but their variability decreases in the Phase 2 hy-normativebasalts and becomes even less in the Phase 1 basalts.
Chondrite and primitivemantle normalisedmulti-element diagramsare shown in Fig. 8. The Phase 2 ne-normative basalts are characterisedby greater fractionation of LREE over HREE [(La/Yb)N=6.8–26.5; the Ndenotes primitive mantle (McDonough and Sun, 1995)-normalisedvalues], compared to the Phase 2 hy-normative basalts [(La/Yb)N=5.1–12.5] and Phase 1 basalts [(La/Yb)N=3.1–7.0]. Two Phase 1 lavas(JEH-03 and JEH-05) show slight positive Eu-anomalies [Eu/Eu*=1.27and 1.47, respectively]. Other samples have more subdued or noEu-anomalies: Eu/Eu*=0.96–1.14 in the Phase 2 ne-normative samples,
0.95–1.12 in the Phase 2 hy-normative samples and 1.02–1.19 in thePhase 1 samples. On the primitive mantle normalised multi-element di-agrams, the Phase 2 ne-normative basalts exhibit prominent Th–U, K, Pband Zr negative anomalies and positive Nb anomalies, with overalltrace-element abundances similar to their hy-normative counterpartsand higher than the Phase 1 lavas. These anomalies become weaker orabsent, or even opposite (e.g. Nb) in the Phase 2 hy-normative groupand Phase 1 series. In general, the Phase 1 and Phase 2 hy-normativesamples have smooth, mildly concave downward patterns that peak atTh–U–Nb (~20–30 times the primitive mantle for the Phase 1 samplesand ~20–60 times for the Phase 2 hy-normative ones), typical of manytholeiitic OIBs (Sun and McDonough, 1989). Some of the Phase 1 lavasare characterised by a Ba spike up to ~200 times chondrite values.
5.2. Sr–Nd isotopic compositions
The Miocene Aleppo Plateau basalts analysed in this study display awide range of 87Sr/86Sr and 143Nd/144Nd isotopic ratios, from0.70356 to0.70511 and 0.51269 to 0.51287 (εNd=+1.1 to +4.5), respectively(Table 4). These ranges are considerably more (Sr) and less (Nd) radio-genic than the latest Miocene–Quaternary lavas along the Dead SeaFault System in northwestern Syria as well as most of the Late Cenozoicintraplate volcanic rocks of southern Syria, Jordan, Israel and SaudiArabia (Fig. 9a and b). Except for one sample (AL-11), the Nd andSr isotopic ratios are negatively correlated, with several Phase 2ne-normative samples extending to higher 143Nd/144Nd and lower87Sr/86Sr. AL-11 is at variance with other samples not only in its radio-genic Sr isotopic composition, but also in its very high Sr content(2158 ppm; compared to ≪1000 ppm for other samples). The highSr abundance is neither consistent with accumulation of feldspar inthe sample, as deduced petrographically and geochemically (no con-comitant enrichment in Eu and Al2O3), nor an origin involving crust-al contamination because of the modest Sr abundance in continentalcrust [~650 ppm in average Jordanian upper crust (Jarrar et al.,2003) and b350 ppm in both global gross upper and lower crust(Rudnick and Gao, 2003)]. This “exotic” Sr may be a result of alter-ation or incorporation of carbonate amygdales during analysis, al-though the sample was acid-leached prior to isotope analysis.Alternatively, assimilation of carbonates on the surface may producethe elevated Sr abundance and 87Sr/86Sr. One sample from the literaturealso possesses comparably coupled elevated Sr concentration and 87Sr/86Sr (SY-053 of Krienitz et al., 2009: Sr=979 ppm and 87Sr/86Sr=0.7051), for which a similar foreign origin can be considered, giventhe lack of petrographic information.
The Sr–Nd isotopic ranges of the newly analysed Miocene AleppoPlateau lavas are similar to those of previously reported data. However,it is important to note that many of the literature data are displacedto slightly higher 87Sr/86Sr at similar 143Nd/144Nd. It is found that theMiocene basalts are somewhat more altered, judging from their pe-trography, than younger ones (latest Miocene–Quaternary) from north-western Syria. This is probably the reason for the more-radiogenicSr isotopic compositions observed in the literature data, in which themajority of samples were not acid-leached prior to isotope analysis[i.e., those of Krienitz et al. (2006, 2009)]. Similar comments have beenmade by Lustrino and Wilson (2007). It is therefore considered thatthe isotopic values, particularly those of Sr, obtained in this study betterrepresent the “true” compositions of the Aleppo Plateau lavas.
5.3. Os isotopic compositions
A subset of seven samples was measured for Os isotopic composi-tions as well as Re and Os abundances (Table 4). They contain low Re(57.0–144 ppt) and Os (10.3–183 ppt), and varying Re/Os (0.6–9.7),corresponding to the analysed 187Re/188Os of 3.13–48.2. The rangeof the initial 187Os/188Os values is rather large, from 0.151 to 0.453.Primitive-mantle (187Os/188Os=0.1290±0.0009; Meisel et al.,

Table 3Major (wt.%) and trace element (ppm) data of Miocene lavas analysed in this study.
Sample JEH-01 JEH-02 JEH-03 JEH-05 JEH-07 JEH-14 AL-04 AL-07
Lat. (°N) 36°07′36″ 36°07′47″ 36°06′11″ 35°59′53″ 35°59′34″ 35°50′32″ 35°15′58″ 35°10′30″
Long. (°E) 37°09′18″ 37°10′16″ 37°12′25″ 37°10′40″ 37°13′06″ 37°24′44″ 37°00′45″ 37°01′08″
Province P1 P1 P1 P1 P1 P1 P2n P2n
SiO2 49.92 49.34 51.26 52.57 51.20 50.93 47.34 42.69TiO2 1.60 1.58 1.67 1.48 1.74 1.66 2.17 2.85Al2O3 13.37 13.24 13.85 13.68 14.43 13.40 14.89 13.66Fe2O3 11.48 11.37 11.70 11.27 12.62 11.88 13.61 14.19MnO 0.08 0.08 0.09 0.08 0.07 0.08 0.08 0.10MgO 10.66 10.39 7.75 8.19 5.05 9.36 6.94 8.59CaO 7.16 7.48 7.89 7.72 7.84 7.75 9.49 10.96Na2O 2.45 2.63 3.10 2.87 2.85 2.88 3.18 3.81K2O 0.82 0.68 0.51 0.45 0.50 0.66 0.99 1.32P2O5 0.19 0.23 0.21 0.12 0.12 0.16 0.36 1.04LOI 1.71 0.83 0.46 0.56 1.77 0.22 0.47 0.87Total 99.44 97.85 98.49 98.99 98.19 98.98 99.52 100.08Mg# 67.2 66.8 59.3 61.5 46.8 63.4 52.9 57.1Sc 19.4 19.4 19.0 19.2 22.3 21.9 19.5 18.6V 157 171 184 171 97.0 201 205 205Cr 358 344 294 334 338 366 310 264Ni 288 278 237 256 270 267 225 195Cu 48.0 63.0 65.0 67.0 105.0 76.0 83.0 66.0Zn 94.7 96.3 106 96.5 111 96.1 101 116Ga 20.0 21.4 22.0 20.6 23.7 20.6 20.6 21.4Rb 14.2 8.9 8.0 10.1 3.1 8.5 12.5 15.9Sr 267 313 304 317 286 308 520 995Y 18.1 18.5 20.6 16.4 20.6 18.9 17.7 24.4Zr 111 113 95.2 86.2 113 107 136 195Nb 13.4 14.1 11.7 8.8 14.3 14.0 26.8 58.2Ba 131 142 1082 1436 124 262 338 506La 11.2 11.6 9.0 6.5 9.9 10.0 19.2 49.6Ce 24.4 25.8 20.2 14.9 23.4 22.0 40.0 103Pr 3.12 3.30 2.70 1.90 3.09 2.78 5.00 12.70Nd 14.0 14.4 12.3 8.9 13.5 12.5 21.0 51.6Sm 3.67 3.67 3.61 2.59 3.76 3.51 4.89 10.30Eu 1.32 1.34 1.68 1.42 1.36 1.46 1.77 3.30Gd 3.99 4.29 4.51 3.39 4.35 4.03 4.87 9.99Tb 0.63 0.64 0.69 0.52 0.71 0.66 0.70 1.22Dy 3.50 3.56 3.86 3.06 4.12 3.64 3.68 5.52Ho 0.73 0.69 0.81 0.63 0.79 0.75 0.75 1.00Er 1.89 1.80 1.93 1.56 2.00 1.85 1.81 2.22Tm 0.22 0.23 0.25 0.20 0.26 0.25 0.22 0.27Yb 1.58 1.46 1.62 1.41 1.64 1.59 1.42 1.54Lu 0.21 0.20 0.21 0.18 0.21 0.21 0.20 0.21Hf 2.87 2.75 2.43 2.21 2.85 2.69 3.29 4.29Ta 0.90 1.13 0.78 0.60 0.87 1.01 1.78 2.95Pb 2.35 2.36 1.37 1.43 2.20 1.95 2.08 2.49Th 1.76 1.63 0.95 1.08 1.52 1.40 2.13 3.39U 0.60 0.56 0.35 0.41 0.22 0.46 0.67 0.90
Sample AL-08 AL-11 AL-15 AL-24 NW-01 NW-06 RA-01 RA-03
Lat. (°N) 35°10′32″ 35°32′34″ 35°38′44″ 35°33′19″ 36°30′32″ 36°28′01″ 34°55′49″ 34°56′35″
Long. (°E) 36°58′54″ 37°01′15″ 37°00′46″ 36°51′19″ 37°02′02″ 36°47′19″ 36°47′14″ 36°50′43″
Province P2n P2n P2n P2n P2n P2n P2n P2n
SiO2 45.53 46.68 46.31 47.78 46.70 47.30 45.63 46.18TiO2 2.56 2.75 2.31 2.21 2.35 2.09 2.31 2.32Al2O3 13.65 13.65 13.45 13.69 14.82 14.06 13.14 13.38Fe2O3 13.59 12.89 13.60 12.66 13.18 13.45 14.08 14.32MnO 0.08 0.14 0.09 0.08 0.08 0.08 0.09 0.09MgO 9.01 5.51 7.36 7.42 6.43 8.51 9.11 8.94CaO 8.86 10.89 8.84 9.71 10.59 8.60 9.23 8.88Na2O 3.19 2.62 3.52 3.18 2.58 3.05 3.03 3.23K2O 1.03 1.45 1.34 1.10 0.93 0.93 0.70 0.75P2O5 0.62 0.67 0.58 0.44 0.54 0.28 0.49 0.46LOI 0.33 1.47 1.24 0.96 0.90 0.53 0.54 0.44Total 98.45 98.72 98.64 99.23 99.10 98.88 98.35 98.99Mg# 59.3 48.5 54.4 56.3 51.8 58.2 58.8 57.9Sc 20.1 20.8 18.0 18.2 23.6 21.0 17.7 17.5V 225 230 165 182 267 215 198 198Cr 256 115 216 262 272 328 300 302Ni 196 70.0 202 198 87.0 199 250 231Cu 87.0 71.0 37.0 49.0 38.0 44.0 55.0 52.0Zn 116 110 110 97.6 115 109 110 112
156 G.S.-K. Ma et al. / Chemical Geology 335 (2013) 149–171

Table 3 (continued)
Sample AL-08 AL-11 AL-15 AL-24 NW-01 NW-06 RA-01 RA-03
Lat. (°N) 35°10′32″ 35°32′34″ 35°38′44″ 35°33′19″ 36°30′32″ 36°28′01″ 34°55′49″ 34°56′35″
Long. (°E) 36°58′54″ 37°01′15″ 37°00′46″ 36°51′19″ 37°02′02″ 36°47′19″ 36°47′14″ 36°50′43″
Province P2n P2n P2n P2n P2n P2n P2n P2n
Ga 22.6 24.6 22.4 21.0 22.7 22.2 21.4 21.8Rb 13.8 19.5 15.3 15.6 13.8 11.9 8.7 9.7Sr 840 2158 644 545 617 494 587 589Y 20.2 25.4 20.4 19.8 20.9 18.0 18.5 18.1Zr 159 212 193 156 141 130 128 130Nb 44.4 51.4 41.4 31.4 30.8 25.0 32.8 32.6Ba 362 360 346 582 365 202 332 292La 27.4 35.6 28.0 22.6 31.3 15.1 24.6 23.0Ce 58.2 73.8 56.4 46.4 63.4 31.8 50.6 48.8Pr 7.22 9.04 6.82 5.68 7.46 3.98 6.22 5.96Nd 29.8 37.4 28.8 24.2 29.8 16.7 26.2 25.2Sm 6.47 7.71 6.67 5.59 6.12 4.13 5.77 5.47Eu 2.34 2.56 2.08 1.94 2.15 1.61 2.12 1.98Gd 6.59 7.85 6.13 5.61 6.45 4.55 5.63 5.61Tb 0.85 1.04 0.88 0.79 0.84 0.69 0.80 0.77Dy 4.16 5.06 4.34 4.00 4.27 3.62 4.06 3.82Ho 0.78 0.96 0.83 0.83 0.83 0.73 0.81 0.77Er 1.84 2.42 2.02 2.00 2.16 1.82 1.87 1.82Tm 0.22 0.29 0.24 0.25 0.27 0.24 0.23 0.22Yb 1.40 1.78 1.39 1.53 1.78 1.51 1.39 1.34Lu 0.19 0.22 0.20 0.21 0.24 0.21 0.19 0.19Hf 3.49 4.69 4.33 3.89 3.26 3.13 3.25 3.15Ta 2.27 2.87 2.25 1.92 1.53 1.55 2.35 1.95Pb 2.30 3.13 2.61 2.57 3.59 2.05 1.88 1.70Th 2.41 3.23 2.67 2.55 3.17 1.79 2.09 2.00U 0.97 0.69 0.76 0.77 0.92 0.62 0.63 0.54
Sample NW-11 NW-12 NW-13 NW-14 S71-05 G73a AGV-2 BHVO-2
Lat. (°N) 36°46′24″ 36°46′33″ 36°46′40″ 36°46′32″ 35°12′05″
Long. (°E) 36°49′06″ 36°49′10″ 36°49′02″ 36°49′13″ 36°45′58″
Province P2h P2h P2h P2h P2h Hbd n=1 n=3
SiO2 49.83 50.46 50.04 51.17 50.67 35.65 59.01 49.4TiO2 1.77 2.28 1.78 1.83 1.79 6.42 1.07 2.8Al2O3 14.59 14.62 14.41 15.00 13.61 13.69 17.01 13.4Fe2O3 13.34 12.26 13.24 11.89 11.65 19.85 6.77 12.5MnO 0.08 0.06 0.08 0.09 0.15 0.12 0.10 0.16MgO 6.54 6.00 7.44 5.82 7.98 11.09 1.53 7.13CaO 7.13 7.48 7.06 7.64 8.60 9.55 5.01 11.32Na2O 3.22 3.57 3.22 3.44 2.66 1.73 4.34 2.2K2O 1.03 1.54 1.03 1.11 0.90 1.23 2.94 0.53P2O5 0.19 0.36 0.19 0.23 0.26 0.18 0.52 0.258LOI 0.97 0.33 0.44 0.20 0.47 1.10 – –
Total 98.69 98.96 98.93 98.42 98.74 99.52 98.29 99.68Mg# 51.9 51.9 55.3 51.9 60.1 55.2
n=4 n=5Sc 19.2 19.2 18.4 21.0 17.4 17.7 13.2 29V 174 200 171 198 183 488 118 320Cr 330 302 326 240 284 3.6 17 293Ni 194 99.0 189 76.0 – 43.2 – 124Cu 37.0 27.0 38.0 24.0 80.0 58.6 – 119Zn 111 101 106 96.9 105 106 91 113Ga 22.2 21.6 21.0 21.6 21.3 25.2 20.1 21Rb 19.2 29.5 18.5 21.1 14.5 3.3 71 9.7Sr 372 547 359 366 392 461 638 382Y 18.1 19.0 17.2 18.6 19.9 17.6 19.9 25.5Zr 129 168 126 132 136 65.3 228 168Nb 17.4 33.0 17.1 17.1 14.5 17.4 14.1 17.9Ba 232 378 228 246 160 256 1141 137La 15.3 25.6 14.5 14.9 14.5 15.9 40 15Ce 30.6 51.6 30.0 31.8 32.3 – 72 38Pr 3.80 6.16 3.70 3.82 4.24 3.87 8.4 5.3Nd 16.2 25.0 16.0 16.4 17.5 18 30 24Sm 3.99 5.43 3.87 4.05 4.60 4.77 5.6 6.1Eu 1.50 1.89 1.46 1.49 1.54 1.71 1.5 2.0Gd 4.35 5.77 4.15 4.41 4.38 4.83 4.8 6.2Tb 0.64 0.80 0.61 0.68 0.69 0.70 0.66 0.94Dy 3.68 4.06 3.38 3.70 4.01 3.47 3.5 5.2Ho 0.76 0.80 0.71 0.79 0.76 0.61 0.67 1.01Er 1.85 2.00 1.84 1.92 1.93 1.34 1.84 2.5
(continued on next page)
157G.S.-K. Ma et al. / Chemical Geology 335 (2013) 149–171

Table 3 (continued)
Sample NW-11 NW-12 NW-13 NW-14 S71-05 G73a AGV-2 BHVO-2
Lat. (°N) 36°46′24″ 36°46′33″ 36°46′40″ 36°46′32″ 35°12′05″
Long. (°E) 36°49′06″ 36°49′10″ 36°49′02″ 36°49′13″ 36°45′58″
Province P2h P2h P2h P2h P2h Hbd n=1 n=3
Tm 0.26 0.26 0.24 0.27 0.26 0.16 0.256 0.33Yb 1.64 1.64 1.53 1.75 1.51 0.81 1.61 1.9Lu 0.23 0.23 0.22 0.24 0.22 0.11 0.25 0.28Hf 3.29 4.25 3.33 3.35 3.81 2.60 5.0 4.1Ta 1.36 2.15 1.32 1.24 1.30 1.39 0.83 1.1Pb 3.95 5.13 3.65 4.03 2.83 0.33 13.3 1.6Th 2.89 4.23 2.61 2.73 2.05 0.25 6.1 1.22U 0.75 1.16 0.68 0.62 0.64 0.15 1.9 0.413
Bulk-rock Mg#=mol%Mg/(Mg+Fe2+) assuming 10% total Fe as Fe2O3; LOI, loss on ignition; –, data not available; P1, Phase 1 volcanism; P2n, Phase 2 nepheline-normative volcanism;P2h, Phase 2 hypersthene-(olivine)-normative volcanism; Hbd, hornblendite.
a Hornblendite xenolith from the Plio-Quaternary Al Ghab volcanic field. The hornblendite is used for partial melting modelling in Section 6.3. Description of this rock can befound in electronic supplementary file.
158 G.S.-K. Ma et al. / Chemical Geology 335 (2013) 149–171
1996) like, low 187Os/188Os, which are reported in many peridotitesamples from the continental lithospheric mantle (Walker et al.,1989; Xu et al., 2008) and in many primitive high-Mg ocean island ba-salts (OIBs) (Widom et al., 1999; Ireland et al., 2009), are not found inthe Syrian Miocene Aleppo Plateau volcanic province [neither in theSyrian latest Miocene–Quaternary and Cretaceous basalts (Ma et al.,2010a, 2010b)]. The high 187Os/188Os (>0.4) in the Aleppo Plateau ba-salts are comparable with those of basalts from continental intraplateor flood basalt province settings such as the Columbia River region,western USA (Chesley and Ruiz, 1998), the Newer Volcanics Province,SE Australia (McBride et al., 2001), the Rhön area (Germany) of the Cen-tral European Volcanic Province (Jung et al., 2005) and various districtsof the Emeishan large igneous province, SW China (Xu et al., 2007; Qiand Zhou, 2008), which are usually interpreted as a result of magma–crust interactions.
The Os isotopes do not show any clear correlations with thetrace-element, and Nd and Sr isotopic data. In contrast, on plots of187Os/188Os vs 187Re/188Os and initial 187Os/188Os vs 1/Os (Fig. 9cand d), the samples are positively correlated, but on Fig. 9c none fallon the 19 Ma reference isochron, which is drawn with respect to thepossible oldest age of these rocks (a younger reference isochronwould have a shallower slope). All but one sample are more radiogenic
Basanite
Mugearite
Hawaiite
Tholeiitic basaltPicrobasalt BasalticAndersite
Alkali basalt
Alkaline
Sub-alkaline
Na 2O
+ K
2O
2
3
4
5
6
7
8
SiO2
40 42 44 46 48 50 52 54
Ne-norm, this studyNe-norm, literatureHy-norm, this studyHy-norm, literature
LiteratureThis study
Phase 2 Phase 1
Fig. 5. Plot of total alkalis vs SiO2 for the Miocene volcanic rocks from NW Syria. In thisstudy, the samples are grouped on the basis of their CIPW normative compositions, butthe IUGS classification scheme of Le Maitre (2002) and the alkaline–sub-alkaline divideof Irvine and Baragar (1971) are also shown for comparison. Samples plotted includethose analysed in this study and those reported in published works (Mouty et al.,1992; Krienitz et al., 2006, 2009; Lustrino and Sharkov, 2006). Note the trends and rel-atively wide range of SiO2 exhibited by the Phase 2 samples, especially the nepheline-normative ones.
than OIBs (Hauri, 2002) and lie above the 19-Ma reference line, indi-cating that they have 187Os/188Os higher than expected. Re-drawingthe reference isochron with a more radiogenic source composition,e.g. 187Os/188 Os=0.15 or higher, as expected if a mafic lithology ispresent in the source, has the effect of reducing some of the sam-ple–reference line deviation. However, these “correctable” samples,i.e. samples with relatively low 187Os/188Os (e.g. JEH-02), haveother geochemical characteristics, such as low Nb/U and radiogenic87Sr/86Sr, more consistent with crustal contamination and shouldtherefore have their initial pre-contamination 187Os/188Os lower(not higher) than presently shown. This point will be furtherdiscussed below when assessing the role of crustal contamination.
6. Discussion
6.1. Role of crystal fractionation
In this section, we assess the role of crystal fractionation to thevariability of the lava chemistry. We also assess whether the differentseries of Aleppo Plateau lavas (Phase 1 vs Phase 2, and Phase 2ne-normative vs Phase 2 hy-normative) can be linked by a single,simple crystal fractionation process. Mineral chemical data andbulk-rock major–trace element variations with respect to MgO suggestthat mineral crystallisation has been important during the evolution ofthe Aleppo Plateaumagmas. The decreases of Ni and Crwith decreasingMgO for both Phase 1 and Phase 2 volcanism are consistent with majorroles for olivine and spinel±clinopyroxene fractionation. For morequantitative constraints of the evolution of the Aleppo Plateau lavasand to evaluate thermodynamic feasibility, we performed MELTSmodelling.
6.1.1. MELTS modellingWe used the MELTS programme (Ghiorso and Sack, 1995; Asimow
and Ghiorso, 1998) to model the fractionation paths of the Aleppo Pla-teau magmas under various combinations of conditions (oxygen fugac-ity, pressure and parental magma composition). For clarity, only threerepresentative trends are shown in Table 5 and Fig. 6. The results (notshown) suggest that an important role of high-pressure crystallisation(~10 kbar; lower crust depth) is not consistent with any of the AleppoPlateau lava series. At high pressures, the models predict thatclinopyroxene is a major liquidus phase and olivine is not crystallising.This results in a drop of SiO2 during the MgO decline. No such mineral-ogical and chemical evolution is observed. The Aleppo Plateau lavas areinvariably olivine-phyric. Modelling crystallisation at shallower depthsproduces more encouraging results. The best fits are obtained forcrystallisation at 1 kbar for the Phase 1 basalts and 5 kbar for thePhase 2 ne-normative basalts (~3–4 km and ~18 km, respectively;

SiO
2
42
44
46
48
50
52
54
56
TiO
2
1.5
2.0
2.5
3.0
Al 2O
3
13
14
15
16
17
18
MgO3 4 5 6 7 8 9 10 11 12
CaO
7
8
9
10
11
12
13
14
FeO
T
9
10
11
12
13
14
Na 2O
2.5
3.0
3.5
4.0
4.5
MgO3 4 5 6 7 8 9 10 11 12
K2O
0
0.5
1.0
1.5
2.0
P2O
5
0
0.2
0.4
0.6
0.8
1.0
1.2
CaO
/Al 2O
3
0.4
0.5
0.6
0.7
0.8
0.9
1.0
MgO3 4 5 6 7 8 9 10 11 12
Ne-norm, this studyNe-norm, literatureHy-norm, this studyHy-norm, literature
Phase 2
LiteratureThis studyPhase 1MELTS modelling
Fractional crystallisation curve: Phase 1 (QFM, 1 kbar)Fractional crystallisation curve: Phase 2 (QFM, 5 kbar)Combined assimilation and fractional crystallisation curve: Phase 2 (QFM+1, 5 kbar)
(a) (d) (g)
(h)(e)(b)
(i)(f)(c)
Fig. 6. Plots of major elements vs MgO (wt.%). The continuous lines (black: Phase 1; grey: Phase 2) show the fractional crystallisation trends and the dashed line (Phase 2) shows thecombined assimilation–fractional crystallisation modelled by MELTS between 1 and 5 kbar. Details of the modelling parameters are provided in Table 5 and discussed in the text.
159G.S.-K. Ma et al. / Chemical Geology 335 (2013) 149–171
within the granitic crust of Nasir and Safarjalani, 2000), and at the QFMbuffer (Table 5 and Fig. 6). Varying the fO2 over ±1 QFMwould changethe shapes of the liquid lines of descent slightly, but these changes aregenerally smaller than the scatter of the lavas. For all the modelling,the parental magmas are assumed to have 0.5 wt.% H2O, except thatof the Phase 1. Using a 0.5 wt.% H2O content in the assumed parentalmagma of the Phase 1 series yields excessive amounts of feldspar andclinopyroxene crystallisation at 1 and 5 kbar respectively, which areat variance with the petrography. Increasing the H2O content to1 wt.% yields more sensible results. With such conditions (1 wt.% H2O,QFM and 1 kbar), the MELTS programme predicts ~14% olivine and~3% plagioclase fractionation for the Phase 1 basalts. For the Phase 2ne-normative basalts, the MELTS modelling (0.5 wt.% H2O, QFM,5 kbar) suggests ~7% olivine and ~13% clinopyroxene fractionation fortheir range of MgO. In both cases, the modelled paths do not perfectlyreproduce the compositional ranges of the lavas, mainly owing to thecompositional variations at a given MgO within individual lava series.This suggests that crystal fractionation is not the only factor controllingthe chemistry of the lavas.
Modelling a crystal fractionation relationship between the Phase 1and Phase 2 lava series using a common parental magma has not beensuccessful. The same failure is also encountered when modelling sucha relationship between the Phase 2 ne- and hy-normative lava groups.However, using the same parental magma for crystallisation of thePhase 2 ne-normative group and buffering the fO2 at QFM+1, thePhase 2 hy-normative group can be modelled if assimilation of
upper continental crust occurs concomitantly. This highlights the im-portance of combined assimilation and fractional crystallisation pro-cesses (AFC) for the evolution of the Phase 2 hy-normative basalts.The requirement of using a slightly higher QFM buffer in the AFCmodel may imply that the assimilant was more oxidising than the pa-rental magma. According to the MELTS model, by the time it reachesMgO of 4.4 wt.% (similar to that of the most evolved Phase 2hy-normative lava), the magma would have assimilated ~24% of thecontinental crust and crystallised ~1% olivine and ~15% clinopyroxene.
6.2. Role of crustal contamination
Mantle-derived magmas in continental settings can hardly escapeinteractionwith the crust to a certain extent during their ascent throughor stagnation in such a thick and compositionally variable region. In-variant ratios such as Ce/Pb, Nb/U, La/Nb and Th/Ce are considered asuseful indicators to quickly assess the influence of crustal assimilationon basaltic rocks, with the latter two ratios additionally having themerit that the elements are less mobile during low-temperature alter-ation. These four ratios in many of the Syrian Miocene samples, partic-ularly the Phase 2 hy-normative ones, are lower (for Nb/U and Ce/Pb)and higher (for La/Nb and Th/Ce) than for unaltered mafic oceanicrocks (Hofmann et al., 1986; Weaver, 1991; Condie, 2003; Sun et al.,2008) and to a certain extent vary with the Sr–Nd isotopes, trending to-wards continental crust compositions (Fig. 10), and suggesting an im-portant role for crustal assimilation in the evolution of these rocks.

(a) Ni
0
50
100
150
200
250
300
350
(b) Cr
0
50
100
150
200
250
300
350
(c) Nb
0
10
20
30
40
50
60
MgO3 4 5 6 7 8 9 10 11 12
Ne-norm, this studyNe-norm, literatureHy-norm, this studyHy-norm, literature
LiteratureThis study
Phase 2
Phase 1
Fig. 7. Plots of selected trace elements (ppm) vs MgO (wt.%) for the Miocene AleppoPlateau lavas.
160 G.S.-K. Ma et al. / Chemical Geology 335 (2013) 149–171
6.2.1. Constraints from Nd–Sr isotopesThe Nd–Sr isotopic array in Fig. 9a can be interpreted as a result ei-
ther of crustal contamination or source heterogeneity, or a combina-tion of both. The lavas with lowest εNd exhibit “crust-like” Nb/U,Ce/Pb, La/Nb and Th/Ce, characteristics seen in the majority of thePhase 2 hy-normative lavas and some of the Phase 1 lavas (Fig. 10).These low εNd lavas thus appear to have been crustally contaminated.Likewise, Krienitz et al. (2006) contend that the negative correlationbetween Nd–Sr isotopes of the Miocene to Quaternary basalts innorthwesternmost Syria is a result of AFC processes involving up to25% assimilation of upper continental crust by at least two differentparental magmas. The 87Sr/86Sr of the assimilant used in theirmodel was 0.7220, higher than that of any of the nearby basementrocks in Jordan (Jarrar et al., 2003) which average only 0.7072. Thelatter, less radiogenic Sr isotopic signature appears more consistentwith the young, Late Proterozoic nature of the crust in this region.We re-modelled the AFC processes (DePaolo, 1981) by consideringa more likely scenario of assimilating a young crust akin to the ex-posed Late Proterozoic basement rocks in Jordan. The results of tworepresentative curves with different parental Nd–Sr abundances areshown in Fig. 9a. To simplify the models, only upper crust assimila-tion was considered. The Syrian lower crust has a distinct composi-tion (e.g. variable but generally higher Ce/Pb that averages 30.3)and less radiogenic 87Sr/86Sr at a given εNd compared to the Aleppo
Plateau lavas, making it unlikely to be the dominant control of thecorrelations amongst εNd, 87Sr/86Sr, Nb/U, Ce/Pb, Th/Ce and La/Nbseen in the Aleppo Plateau lavas (Figs. 9b and 10).
The Aleppo Plateau lavas have a wide range of trace elementabundances. Their differences in Nd and Sr contents certainly affectthe susceptibility of isotopic ratios towards crustal contamination.The use of two parental magmas (with different Nd–Sr contents) inour models is only a simplification. A lower Nd–Sr starting composi-tion would be more appropriate for the trace-element poorer Phase 1lavas and vice versa for the trace-element richer Phase 2 lavas. Assum-ing a parental composition similar to the Syrian lava with the highestεNd and lowest 87Sr/86Sr and a rate of assimilation relative to fractionalcrystallisation (r) of 0.6, ~27% and ~57% (ρ=crust/magma of Aitchesonand Forrest, 1994) upper crust assimilation would be required to ac-count for the most evolved lavas in the Phase 1 and Phase 2 series re-spectively (Fig. 9a). The calculated amounts of AFC are substantiallyhigher than those estimated from the MELTS programme on the basisof the major-element variations, and for the Phase 2 lavas so high thatthe thermodynamic feasibility is questioned. Thus, it appears to bemore reasonable to consider the Nd–Sr isotopic array of the Aleppo Pla-teau basalts as a consequence of both source heterogeneity and crustalcontamination.
6.2.2. Constraints from Os isotopesThe Os isotopic data of the Aleppo Plateau lavas confirm the occur-
rence of crustal contamination, although they show no clear correla-tions with the Nd–Sr isotopes and invariant ratios (e.g. Nb/U). Thelack of such correlations is not surprising, given the potential Os het-erogeneity of continental crust and source mantle, as well as the con-trasting magmatic behaviours among these elements — whereas Sm,Nd, Rb and Sr are all incompatible lithophile elements, Re and Osare siderophile elements, and in addition Re is only mildly incompat-ible, while Os is highly compatible during partial melting of the man-tle. There is a large contrast in 187Os/188Os between primitivemantle-derived magmas (~0.123–0.150 for OIBs; Hauri, 2002) andupper continental crust (~1.4±0.3 for average continental crust of2.2 Gyr old; Peucker-Ehrenbrink and Jahn, 2001), making the 187Os/188Os a useful indicator of crustal contamination. The most prominentfeatures of the Os isotopic data of the Aleppo Plateau lavas are that allthe initial 187Os/188Os are higher than 0.15 and they correlate tightlywith 1/Os (Fig. 9d). There are two ways to explain this correlation.First, it can be explained by crustal contamination plus fractionalcrystallisation of a common parental magma which has low 187Os/188Os. During the AFC process, an Os-bearing phase(s) is fractionatedout of the system. However, the lava with the higher 187Os/188Os(0.453) is actually that of the highest εNd (+4.3) whereas the onewith the lowest 187Os/188Os (0.151) shows lowest εNd (+1.2), cast-ing doubts on a simple AFC process. A more probable explanation isthat the Aleppo Plateau lavas are characterised by varying Os abun-dances, thereby having different susceptibility to crustal contamina-tion. A series of lavas with different Os contents being contaminatedby the same amount of continental crust can result in variable187Os/188Os.
6.3. Sources of the Phase 1 and Phase 2 volcanism
6.3.1. Information from the most primitive Aleppo Plateau lavasThe preceding discussion suggests that the Phase 1 and Phase 2
lavas are two distinct series not related to each other by either crystalfractionation or crustal assimilation. For instance, many of the largeion lithophile elements (LILEs) such as Th and K correlate negativelywith SiO2 (Figs. e and f), but not so much with MgO (e.g. Fig. 6g). Ifthe compositional range of the Aleppo Plateau lavas was to relatesolely to crustal contamination, an increase in SiO2 would have beencoupled with increases in the LILEs, which are high in upper conti-nental crust. The positions (relatively high K, Th and SiO2) of the

Phase 2, Ne-norm
Phase 1
Phase 2, Hy-norm
Phase 1
(a)
(b)
(c)
(d)
(e)
(f)
Phase 2, Ne-norm
Phase 2, Hy-norm
1
10
100
1
10
100
1
10
100
Rb LaK
NbU
ThBa Ce
PbPr
SrP
NdZr
SmEu
TiDy
YYb
Lu
Rb LaK
NbU
ThBa Ce
PbPr
SrP
NdZr
SmEu
TiDy
YYb
Lu
Rb LaK
NbU
ThBa Ce
PbPr
SrP
NdZr
SmEu
TiDy
YYb
Lu
1
10
100
1
10
100
1
10
100
La Ce Pr Nd PmSm Eu Gd Tb Dy Ho Er Tm Yb Lu
La Ce Pr Nd PmSm Eu Gd Tb Dy Ho Er Tm Yb Lu
La Ce Pr Nd PmSm Eu Gd Tb Dy Ho Er Tm Yb Lu
rock
s / c
ho
nd
rite
rock
s / p
rim
itiv
e m
antl
e
Fig. 8. (a–c) Chondrite- and (d–f) primitive-mantle normalised multi-element variation diagrams for the Miocene Aleppo Plateau lavas. Shaded fields indicate the compositionalranges of individual groups from the literature (Krienitz et al., 2006, 2009; Lustrino and Sharkov, 2006). Chondrite- and primitive mantle normalizing values are from Sun andMcDonough (1989) and McDonough and Sun (1995), respectively.
161G.S.-K. Ma et al. / Chemical Geology 335 (2013) 149–171
Phase 2 hy-normative basalts in Fig. 11 are consistent with this inter-pretation, derivation from the ne-normative counterparts throughcrustal contamination. In contrast, the negative correlations betweenthe Phase 1 and Phase 2 ne-normative basalts must be inherited fromthe source(s) or resulted from varying degrees/depths of partial melt-ing. Indeed, in Sections 5.1 and 6.1, and in Fig. 6, it has been shownthat the Phase 1 and Phase 2 ne-normative basalts exhibit wide vari-ations in SiO2, TiO2, FeO, CaO and P2O5 at a given range of MgO, andthese variations cannot be explained by simple crystal fractionation.These oxides correlate much better with SiO2 (Fig. 11), further con-solidating the view that the compositional variations between thePhase 1 and Phase 2 ne-normative basalts are to a larger extent pri-mary features from the source or melting processes, and to a lesserextent from post-genesis processes. These major oxides vs SiO2 corre-lations are comparable with those of intraplate basaltic rocks of oce-anic and continental settings (Pilet et al., 2008; Dasgupta et al.,2010) and are reminiscent of the current debate on the origin of theseglobal intraplate basalts, in which volatile-free/poor peridotite can bea suitable source only for the Si-richer (tholeiitic) basalts and an addi-tional Si-deficient component (lithological or volatile) capable of generat-ing Fe-, Ti-, Ca-, alkalis-, and incompatible trace element-enriched liquids
is needed for the Si-poorer (alkalic) basalts (e.g. Pilet et al., 2008). We areinclined to explain the Syrian compositional variations in the sameway—variable contributions from two distinct mantle components. This issupported by the following: (1) there is a large variation of SiO2 contentsamong the Phase 1 and Phase 2 Ne-normativemagmas (~44–54 wt.% forthose with MgO≥7.5 wt.%; Fig. 11). Such a wide variation does notchange very much even after fractionation corrections (see caption ofFig. 11 for fractionation corrections); and (2) the sample (AL-07) that de-fines the Si-poor endmember of themajor oxide–SiO2 arrays in Fig 11 has43.6 wt.% SiO2 (on a volatile-free basis) and 43 wt.% SiO2 in its calculated(by addition of olivines back to the magma) primitive composition inequilibrium with olivines of Fo89, lower than any liquid (≥45 wt.% SiO2)that has been produced from partial melting of volatile-free/poor perido-tite in experiments (Takahashi, 1986; Hirose and Kushiro, 1993; Baker etal., 1995; Kushiro, 1996; Kinzler, 1997; Robinson et al., 1998; Walter,1998; Falloon et al., 1999; Wasylenki et al., 2003; Davis et al., 2011).
Regarding the potential sources for Si-undersaturated OIBs andcontinental intraplate basalts (CIBs), current debates revolve around(1) CO2-bearing peridotite (Dasgupta et al., 2007), (2) Si-deficienteclogites/garnet pyroxenites with or without CO2 (Hirschmann et al.,2003; Kogiso et al., 2003; Dasgupta et al., 2006) and (3) amphibole-rich

Table 4Nd–Sr–Os isotopic and the corresponding elemental data of the Miocene volcanic rocks measured in this study.
Sample Rbppm
Sr Nd Sm 87Sr/86Sr (±2σ) 143Nd/144Nd (±2σ) εNd Re (±2σ)ppt
Os (±2σ) 187Re/188Os (±2σ) 187Os/188Os (±2σ) (187Os/188Os)I
Phase 1JEH-01 14.2 267 14.0 3.67 0.704798 (13) 0.512694 (9) +1.1JEH-02 8.9 313 14.4 3.67 0.704740 (14) 0.512698 (8) +1.2 118.7 (14) 183.1 (3) 3.13 (4) 0.1519 (5) 0.151JEH-03 8.0 304 12.3 3.61 0.704211 (11) 0.512866 (8) +4.5JEH-14 8.5 308 12.5 3.51 0.704198 (13) 0.512757 (8) +2.3 56.97 (14) 42.59 (6) 6.56 (16) 0.2737 (9) 0.272
Phase 2AL-04 12.5 520 21.0 4.89 0.703629 (14) 0.512849 (8) +4.1 76.07 (13) 22.40 (4) 16.7 (3) 0.2798 (15) 0.276AL-08 13.8 840 29.8 6.47 0.703914 (13) 0.512866 (7) +4.5 79.32 (14) 17.92 (4) 21.6 (4) 0.2372 (17) 0.233AL-11 19.5 2158 37.4 7.71 0.705108 (17) 0.512843 (8) +4.0AL-15 15.3 644 28.8 6.67 0.703625 (17) 0.512867 (7) +4.5AL-24 15.6 545 24.2 5.59 0.703776 (14) 0.512856 (7) +4.3 61.76 (13) 10.31 (2) 30.0 (6) 0.460 (4) 0.453NW-01 13.8 617 29.8 6.12 0.703957 (13) 0.512803 (9) +3.2NW-06 11.9 494 16.7 4.13 0.704059 (10) 0.512796 (13) +3.1 144.3 (14) 14.89 (5) 48.2 (5) 0.3948 (23) 0.385RA-03 9.7 589 25.2 5.47 0.703564 (14) 0.512842 (8) +4.0 117.6 (14) 16.45 (3) 35.1 (4) 0.2885 (21) 0.281S71-05 14.5 392 17.5 4.60 0.704365 (13) 0.512743 (6) +2.0
Reference materialBHVO-2 0.703486 (21) 0.512987 (6) +2.0
εNdwas calculated using modern (143Nd/144Nd)CHUR=0.5126387 (Goldstein et al., 1984); initial 187Os/188Os was calculated according to the age reported in Table 1, with the age ofAL-04 assumed to be the same as AL-08; Rb, Sr, Nd and Sm are ICP-MS data from Table 3. For the Re–Os data, the uncertainties include the internal precision of the analyses and thevariability of the blanks' concentrations and isotopic ratios.
162 G.S.-K. Ma et al. / Chemical Geology 335 (2013) 149–171
metasomatic lithospheric veins (Pilet et al., 2008). Carbonated peridotite,in spite of its ability to generate sufficiently lowSiO2 liquids, tends topro-duce Ti- and Fe-poor liquids that do not resemble primary OIBs andCIBs (Dasgupta et al., 2010). The eclogite story is appealing becausesubduction ultimately recycles oceanic crust back into the mantlethereby creating eclogitic heterogeneity in the mantle. With suffi-ciently long storage (1–2 Ga) in the mantle, these eclogites havethe ability to create extreme isotopic compositions that may conve-niently explain the isotopic compositions of some OIBs (seeHofmann, 1997). However, recycling of oceanic crust through subduc-tion is unlikely to produce Si-deficient eclogites/garnet pyroxenites.MORB-like eclogites are Si-excess that in theory should give rise toSi-saturated/oversaturated liquids (Pertermann and Hirschmann, 2003;Spandler et al., 2008; Mallik and Dasgupta, 2012). On the other hand,Si-deficient garnet pyroxenites are more commonly seen as dykes orveins in ophiolites and orogenic peridotites (Bodinier et al., 1987, 2004;Fabries et al., 2001). They, togetherwith the amphibole-richmetasomaticlithospheric veins, can be considered as the same category—metasomaticcumulates representing former conduits of magma through the litho-spheric mantle. Whereas these pyroxenite or amphibole-dominatedmetasomatic mafic lithologies are suitable source components forSi-poor lavas from the major element perspective, their relevance to thelow-Si Aleppo Plateau lavas in terms of the trace-element budgetsneeds explanations.
To better decipher the primitive signatures, only the most primitivesamples least contaminated by continental crust are considered. For thisreasonwe filtered out samples that have Th/Ce>0.5, MgOb7.5 wt.% andLOI>2 wt.%. This excludes all the Phase 2 hy-normative lavas, and leavesone Phase 1 lava (JEH-03) and six Phase 2 ne-normative lavas. The prim-itive mantle normalised trace-element pattern of the single Phase 1 lavaapproaches that of the trace-element poor sample (SY-291 fromKrienitzet al., 2009) in the Phase 2 ne-normative group (Fig. 12a). The relativelysmooth patterns of these two samples and their fractionated HREEstestify to a garnet-bearing source (peridotite) for their origin. On the con-trary, within the ne-normative group, the Phase 2 lavas display increas-ingly stronger positive Nb anomaly, negative Pb and Zr anomalies, andhigher L-MREE/HREE as the total trace-element abundances get larger.These features are difficult to reconcile withmelting of (anhydrous) pe-ridotite to varying degrees and/or at different pressures (as we willshow in the partial melting modelling below).
However, it is noteworthy that these anomalies on the primitivemantle normalised basis are also features of many metasomatic veins
in oceanic and continental lithospheric mantle. A Syrian hornblendite,G73, which is interpreted as a fragment of a lithospheric metasomaticvein (see electronic supplementary file) and an amphibole-garnet py-roxenite vein from Lherz (Bodinier et al., 2004) are shown in Fig. 12along with the three representative Aleppo Plateau lavas. These meta-somatic veins possess the key trace-element features (i.e. positive Nbanomaly, etc.) that could represent the source features of the Syrianne-normative lavas. As already discussed by Pilet et al. (2008) and Maet al. (2011a), the low solidus temperatures of metasomatic lithologiesfavour high melt productivity and as a result themelt compositions ap-proach that of the source instead of being controlled by partition coeffi-cients at low-degrees of melting. To summarise, from both major- andtrace-element perspectives, amphibole-rich metasomatic veins aregood candidates of the source or source component that was respon-sible for the production of the ne-normative lavas from the AleppoPlateau, Syria (or even globally).
6.3.2. Partial melting modellingPrimitive mantle (McDonough and Sun, 1995) normalised Th/Nb
(Nb anomaly), Zr/Sm (Zr anomaly), Tb/Yb, La/Tb and La/Yb of themost-primitive Aleppo Plateau lavas are considered for partial meltingmodelling. This is to testwhether some of the key trace-element featuresof the Aleppo Plateau lavas can be reproduced by melting of peridotiteand amphibole-rich metasomatic veins and to semi-quantitatively con-strain the partial melting/mixing processes. The batch melting equationof Shaw (1970) and incongruent melting algorithms of Zou (2007, pp10–17) were employed. Starting source compositions were, for perido-tite melting (1) the depleted MORB mantle (DMM) of Workman andHart (2005) and (2) an enriched mantle (EM) calculated by refertilisingthe DMMwith 10% of a 1%melt derived from the sameDMM, and (3) formetasomatic veinmelting, the Syrianhornblendite G73. The sourcemin-eralogy, melting modes and partition coefficients are listed in Table 5.We emphasise that this particular hornblendite G73 would not itself bethe source (or part of the source) of theMiocene lavas of the Aleppo Pla-teau, because it occurs as a xenolith entrained in the younger, Plio–Qua-ternary lava cropping out to the west of the Aleppo Plateau. The notion,however, is that any amphibole-richmetasomatic vein similar in compo-sition to this hornblendite xenolith can be a suitable source componentfor the Si-undersaturated lavas of the Miocene Aleppo Plateau suite.
The peridotite melting models predict that with increasing La/Tb(decreasing degrees of partial melting), Th/Nb and Zr/Sm increaseslightly (consistent with DTh
Cpx/meltbDNbCpx/melt and DZr
Cpx/meltbDSmCpx/melt,

OIB
AL-04(22.4)
AL-08(17.9)
AL-24(10.3 ppt Os)
JEH-02(183)
JEH-14(42.6)
NW-06(14.9)
RA-03(16.5)
19 Ma reference isochron
S. Syria, Jordan & Israel
N-DSFS
Saudi Arabia
Afarplume
AL-11
SY-053
Red Sea MORB
Syrian lower crust
Arabianlithospheric
mantle
KarasuValley
DMM
LVC
PREMA
BS
E (
0.70
45) Arabian
upper crust
EMI
EMII
0.5120
0.5122
0.5124
0.5126
0.5128
0.5130
0.5132
0.702 0.704 0.706 0.708 0.710
143 N
d/14
4 Nd
0.5126
0.5127
0.5128
0.5129
0.5130
0.5131
0.5132
0.7025 0.7030 0.7035 0.7040 0.7045 0.7050 0.7055
187 O
s/18
8 Os
0
0.1
0.2
0.3
0.4
0.5
0.6
187Re/188Os0 10 20 30 40 50 60
143 N
d/14
4 Nd
87Sr/86Sr 87Sr/86Sr
Initi
al 18
7 Os/
188 O
s
0
0.1
0.2
0.3
0.4
0.5
0.6
1/Os (1/ppt)0 0.02 0.04 0.06 0.08 0.10 0.12
R2 = 0.77
SY-053AL-11
Phase 2 ne-norm
Phase 2 hy-normPhase 1(a) (b)
(d)(c)
AFC: DNd = 0.2DSr = 0.5
Ne-norm, this studyNe-norm, literature
Hy-norm, this studyHy-norm, literature
Phase 2
LiteratureThis study
Phase 1
F = 0.90, P = 0.15
F = 0.70, P = 0.45
F = 0.62, P = 0.57F = 0.50, P = 0.75
F = 0.90P = 0.15
F = 0.82P = 0.27
F = 0.70P = 0.45
F = 0.50P = 0.75
-10
-5
0
5
10
pres
ent-
day
eNd
0
2
4
6
8
10
pres
ent-
day
eNd
Fig. 9. Variations of (a and b) 87Sr/86Sr, (a and b) 143Nd/144Nd and (c and d) 187Os/188Os for the Miocene volcanic rocks from NW Syria. (a) 87Sr/86Sr vs 143Nd/144Nd. Comparisonwith Arabian upper crust (Hegner and Pallister, 1989; Jarrar et al., 2003) and global mantle reservoirs [DMM, Depleted MORB Mantle (Workman and Hart, 2005); EMI, EnrichedMantle I (Lustrino and Dallai, 2003); EMII, Enriched Mantle II (Workman et al., 2004); LVC, Low Velocity Component (Hoernle et al., 1995); PREMA, Prevalent Mantle (Wörneret al., 1986)]. 87Sr/86Sr value of BSE, bulk silicate earth, is from DePaolo (1988). Also shown are two AFC curves (DePaolo, 1981; Aitcheson and Forrest, 1994), one using an incom-patible trace-element depleted parental magma (10 ppm Nd and 250 ppm Sr; dashed line) and the other enriched (25 ppm Nd and 600 ppm Sr; continuous line), calculated as-suming a parental isotopic composition (143Nd/144Nd=0.5129 and 87Sr/86Sr=0.7034) equivalent to the average of the two Miocene Aleppo Plateau lavas with lowest 87Sr/86Sr andassuming a rate of assimilation relative to fractional crystallisation (r) of 0.6, although the value was undoubtedly variable during fractionation. The assimilant was the averagecomposition (22.5 ppm Nd, 570 ppm Sr, 143Nd/144Nd=0.5124 and 87Sr/86Sr=0.7072) of the Late Proterozoic basement rocks from Jordan (Jarrar et al., 2003). Italic (with bar sym-bol) and regular (with star symbol) numbers along the curves are the degrees of AFC for the trace-element poorer (dashed) and richer (continuous) curves respectively, with Frepresenting the fraction of magma remaining in the system and ρ representing the amount of assimilation (i.e. the mass of assimilated crust relative to the mass of initialmagma in the system; Aitcheson and Forrest, 1994). The trace-element poorer AFC curve is more suitable for the Phase 1 lavas and the richer one more suitable for the Phase 2lavas (see text). (b) 87Sr/86Sr vs 143Nd/144Nd. Comparison with nearby Cenozoic intraplate volcanic rocks from the northearn Dead Sea Fault System (N–DSFS; Ma et al., 2011a),Karasu Valley, SE Turkey (Çapan et al., 1987), and Saudi Arabia, southern Syria, Jordan and Israel (Altherr et al., 1990; Stein and Hofmann, 1992; Bertrand et al., 2003; Shaw etal., 2003; Weinstein et al., 2006; Krienitz et al., 2007). Additional fields of mantle sources for comparison in (b) include the Arabian lithospheric mantle (clinopyroxene separatesfrom mantle xenoliths; Henjes-Kunst et al., 1990; Stein et al., 1993; Blusztajn et al., 1995; Baker et al., 1998, 2002; Shaw et al., 2007; Nasir and Rollinson, 2009), the Syrian lowercrust (Krienitz and Haase, 2011), the Red Sea MORB mantle (Volker et al., 1993), the high 3He/4He Afar plume (Pik et al., 1999). (c) 187Re/188Os vs 187Os/188Os. The 19 Ma referenceisochron is drawn assuming 187Os/188Os of the mantle source is 0.129 (Meisel et al., 1996) Numbers in the brankets indicated Os concentrations in ppt. (d) Initial 187Os/188Os vs 1/Os. Note the good correlation among the samples.
163G.S.-K. Ma et al. / Chemical Geology 335 (2013) 149–171
and clinopyroxene being a major control of these elements in the pe-ridotite four-phase system), rather than decrease as shown by theSyrian Phase 2 ne-normative basalts (Fig. 12a and b). Furthermore,the model defines a curved partial melting trend on Tb/Yb vs La/Yb(Fig. 12c) as opposed to the straight trend shown by the Syrianne-normative samples. The straight trend, because of the commondenominator (Yb) of the plot, can be interpreted as a binary mixingline (Langmuir et al., 1978) with the two end-members yet to be de-fined. Nevertheless, the peridotite melting curves may still be used toexplain the single Phase 1 sample (JEH-03) and the La/Yb- (La/Tb-)poor Phase 2 sample (SY291). To fit JEH-03, the DMM would haveto melt at a very low degree, ~3%, which is not consistent with thetholeiitic characteristic of this lava. In addition, DMM appears to betoo low in Th/Nb to produce any melts similar to JEH-03. Using therefertilised, EM source produces better fits for JEH-03 (~12% melting)and SY-291 (~5–6% melting).
The other Phase 2 ne-normative lavas fall nether along the perido-tite melting nor the amphibole-rich vein melting curve. Yet, their
positions overlap with a mixing curve between a 7% melt derivedfrom the peridotite and a 40% melt derived from the amphibole-richvein. The lava (AL-07) with the highest La/Yb, La/Tb and Tb/Yb, andlowest Zr/Sm can be explained by mixing up to 80% of such avein-derived melt and 20% of such a peridotite-derived melt(Fig. 13b and c), although this vein-derived melt/peridotite-derivedmelt ratio differs if one considers the Th/Nb vs La/Tb variations(Fig. 13a). This discrepancy may simply reflect the heterogeneous na-ture, particularly Th/Nb, of lithospheric metasomatic veins in general,as demonstrated by the amphibole compilation of Pilet et al. (2008).
6.4. Petrogenetic model for the generation of the Miocene basalts of theAleppo Plateau and vicinity
6.4.1. Development of the metasomatised source regionAmphibole-rich metasomatic veins (here and elsewhere regarded
as an important source of alkaline magmas; Pilet et al., 2008, 2011;Ma et al., 2011a,b) are generally considered as concentrations of

Table 5Parameters used in MELTS modelling.
Phase 1a Phase 2 ne-normb Phase 2 hy-normb
SiO2 (wt.%) 50.74 46.87 46.83TiO2 (wt.%) 1.74 2.50 2.50Al2O3 (wt.%) 13.54 13.77 13.76Fe3O2 (wt.%) 1.68 1.93 2.88FeO (wt.%) 9.26 11.07 10.20MnO (wt.%) 0.09 0.09 0.09MgO (wt.%) 9.94 9.32 9.31CaO (wt.%) 8.15 9.30 9.29Na2O (wt.%) 2.91 3.20 3.20K2O (wt.%) 0.73 0.89 0.89P2O (wt.%) 0.23 0.57 0.57H2O (wt.%) 1 0.5 0.5fO2 QFM QFM QFM+1Pressure 1 kbar 5 kbar 5 kbarLiquidus temperature 1269.9 °C 1276.2 °C 1268.2 °CEnding temperature 900 °C 900 °C 900 °CAssimilant composition(wt.%)c
10.5 Hd; 66.9 Fsp(Ab54.3An20.6Or24.1);21.3 Qtz; 2.8 Crn; 0.3 Ap
Assimilant temperature 600 °CInitial mass ofassimilant/ liquid
0.4
For all the modelling, crystallisation phases were restricted to those observed asphenocrysts in the thin-sections. Ab, albite; An, anorthite; Ap, apatite; Crn, corundum;Fsp, feldspar; Hd, hedenbergite; Qtz, quartz; Sa, sanidine.
a Average of JEH-01, JEH-14 and SY-088; the composition of SY-088 is from Krienitzet al. (2009).
b Average of RA-01 and AL-08.c Feldspar components in mol%.
Oce
anic
bas
alts
(Hof
man
n)O
cean
ic b
asal
ts(H
ofm
ann)
Oce
anic
bas
alts
(Hof
man
n)
MO
RB
(S
un)
MO
RB
(S
un)
MO
RB
(S
un)
eNd
0
1
2
3
4
5
6
7
Nb/U10 20 50 100
(c)
Upp. cont.
crust
La/N
b
0.5
1
2
Nb/U10 100
UCC
LCC
(a)
Ne-norm, this studyNe-norm, literatureHy-norm, this studyHy-norm, literature
LiteratureThis study
Phase 2
Phase 1
LCCUCC
Th/
Ce
0.05
0.1
0.2
Nb/U10 100
(b)
Fig. 10. (a) La/Nb, (b) Th/Ce and (c) εNd vs Nb/U for the Miocene volcanic rocks fromthe Aleppo Plateau and vicinity. Note that many of the samples are displaced towardscompositions of continental crust. Data of continental crust (star symbols) shown in(a) and (b) are from Rudnick and Gao (2003). Two ranges of Nb/U for oceanic basalts(~37–57) and MORBs (~25–60) are shown and are from Hofmann et al. (1986) andSun et al. (2008) respectively.
164 G.S.-K. Ma et al. / Chemical Geology 335 (2013) 149–171
cumulates formed in the lithosphere during melt migration. In otherwords, they can be considered as fossil magma “conduits”. The con-cept is developed through numerous empirical studies of alpine peri-dotite massifs, ophiolites and mantle xenoliths (e.g. Harte et al., 1993;Lorand and Gregoire, 2010) and experimental work on basaltic melts'liquid lines of descents (e.g. Pilet et al., 2010 and references therein).These studies suggest that upon percolation through the lithosphere,basaltic melts, which are likely volatile-bearing, would initially crystal-lise and “deposit” on the wall rocks a variety of, mainly anhydrous min-erals dominated by clinopyroxene, with various amounts of olivine±garnet±orthopyroxene. As the residual melts further percolate andchange their compositions (thus the term “percolative fractionation”;Harte et al., 1993), crystallisation and eventually predominance of am-phibole result. The latter hydrous cumulates are thought to comprisein addition to amphibole, clinopyroxene±plagioclase±phlogopite±orthopyroxene±garnet and a variety of accessory phases such as rutileand apatite. In a recent study, Pilet et al. (2011) demonstrate using nu-merical modelling that through crystallisation and fractionation froman E-DMM derived melt (low-F melt from peridotite+H2O and/orCO2), the amphibole-rich portion of the metasomatic cumulates plussome trapped melts (the upper metasomatic column) have composi-tions suitable for the source of alkaline magmas. Also worth noting isthat the composition of the amphibole modelled in this way is verysimilar to the Syrian hornblendite we used in the melting model above.
If a hydrous melt is needed to form amphibole-rich metasomaticveins (the crystallisation of amphibole seems to depend on the hydrousnature of the initial liquid, rather than composition; see Pilet et al.,2010), a brief account of how and why hydrous melts exist in an intra-plate setting seems necessary. Of relevance is the experimental studiesof Green et al. (2010, 2011), who show that because of instability ofpargasite above 3 GPa there is a sharp change in water-storage capacity(from ~0.3–0.4 wt.% to ~180 ppm) in the upper mantle. This depth(~100 km) coincideswith that of the lithosphere–asthenosphere bound-aries (LABs) ofmature oceanic lithosphere andmuch non-cratonic conti-nental lithosphere, including that of Syria, and suggests it is a naturalconsequence of the existence of hydrous interstitial melts at the LAB.This is probably the origin of the seismic Lower Velocity Zone as observed
beneath many mature oceanic basins and much of western and north-westernArabia. Upwardmigration of such incipient hydrousmelts duringtimes of rifting or localised lithospheric extension (e.g. in the Cretaceousin northwestern Arabia; Kazmin, 2002) provides a plausible mechanismfor the development ofmetasomatic veins and of the source of some alka-line magmas. In Syria, the “depleted” nature of the most-primitive,least-contaminated alkaline lavas (Phase 2 ne-normative series: 87Sr/86Sr=~0.703–0.704 and εNd=~+4 to +5.5) suggests development ofthe metasomatised source not long before eruption, considering thatsuch a source would have high Rb/Sr and low Sm/Nd.
6.4.2. Partial melting and metasomatised lithosphere–asthenosphere(plume?) interaction beneath the Aleppo Plateau
Krienitz et al. (2006) consider the Miocene volcanism in north-western Syria as part of the larger intraplate volcanic province of

upper crust
contamination
variation from the source(s)
or partial melting
(e)
K2O
0
0.5
1.0
1.5
SiO2
42 44 46 48 50 52 54 56
upper crust
contamination
variation from the source(s)
or partial melting
(f)T
h
1
10
TiO
2
1.5
2.0
2.5
3.0
FeO
T
9
10
11
12
13
14
CaO
6
7
8
9
10
11
12
13
P2O
5
0
0.2
0.4
0.6
0.8
1.0
SiO2
42 44 46 48 50 52 54 56
(c) (d)
(a) (b)AL-07
JEH-03
AL-07
JEH-03
AL-07
JEH-03
AL-07
AL-07
JEH-03
AL-07
JEH-03
Ne-norm, this studyNe-norm, literatureHy-norm, this studyHy-norm, literature
LiteratureThis study
Phase 2 Phase 1
Fig. 11. (a) TiO2, (b) FeOT, (c) CaO, (d) P2O5, (e) K2O and (f) Th vs SiO2 for the Miocene volcanic rocks from the Aleppo Plateau and vicinity. The fields mark the more primitivesamples with MgO≥7.5 wt.%. Crosses in (a)–(e) shown the assumed primitive magma compositions of JEH-03 and AL-07 (representative samples of Phase 1 and Phase 2 lavas,respectively, along the major-element vs SiO2 arrays), computed by adding olivines, the major phenocryst phase of these samples, back to the magmas in small increments untilthe magmas could be equilibrated with olivine Fo89. The dashed arrows show the olivine-addition trends. This approach is to show that with reasonable fractionation correction,the large range of SiO2 in the Aleppo Plateau lavas persists.
165G.S.-K. Ma et al. / Chemical Geology 335 (2013) 149–171
Eastern Anatolia and propose that the volcanism was triggered by aMiddle Miocene slab-breakoff event associated with the collision ofthe Arabian and Eurasian continents. However, this proposal appearsto be at spatial and temporal variance with the corresponding volca-nism in Syria. The original Arabian slab-breakoff model, as proposedby Keskin (2003, 2007), deals with the Erzurum–Kars Plateau volca-nic activity, a region some 600–800 km north of the area investigatedin this study. Whereas the Erzurum–Kars Plateau is located to thenorth of the Bitlis Suture Zone, in the hinterland of the Arabia–Eurasiacollision system, Syria is located to the south, in the foreland region ofArabia. A causative link between the Syrian volcanism and the Arabi-an slab break-off therefore seems tenuous.
Furthermore, it has been suggested that the corresponding upliftand magmatism in Eastern Anatolia and thus the slab-breakoff (or de-lamination) did not commence until ~11–10 Ma (Keskin, 2003, 2007)or even later (~8–7 Ma; Göğöş and Pysklywec, 2008). This time frameis not compatiblewith the two-phaseMiocenemagmatismon theAlep-po Plateau, which began at ~19–18 Ma and renewed at ~13–12 Ma.Other explanations are needed.
In the Miocene, the Aleppo Plateau appears to have acted as a stableplatform as evidenced by its sub-horizontal strata, but an overall N–Scompressive regime is certain, considering the noticeable ~E–Wstrikingreverse faults and gentle folds in many of the Late Cretaceous–MiddleMiocene strata (Zanchi et al., 2002). Transient and localised E–W andNE–SW extension, possibly serving as σ3 stress associated with the
regional N–S compression, may have occurred (Zanchi et al., 2002),but it is unlikely that such extension could have caused significantenough decompression to promote the Miocene partial melting. A heatsource seems to be necessary to initiate melting.
Widespread upper mantle low-velocity anomalies have been de-lineated beneath much of Arabia and northeastern Africa in severaltomographic studies (Debayle et al., 2001; Al-Damegh et al., 2004;Al-Lazki et al., 2004; Park et al., 2008; Legendre et al., 2012). Althoughdiverse opinions exist, these anomalies have in recent years been re-lated to one or more quasi-vertical features extending down to thetransition zone (e.g. Legendre et al., 2012) or lower mantle (Changand Van der Lee, 2011; Hansen et al., 2012). In Hansen et al.'s(2012) model, all of the low-velocity anomalies are related to the em-placement of the single, African superplume that initially gave rise tothe Afar large igneous province. In Chang and Van der Lee's (2011)model, three distinct quasi-vertical low-velocity features running be-neath Jordan, Afar and Kenya are delineated. A detailed review of allthe existing tomographic models for Arabia and Africa is beyond thescope of this paper. Nevertheless, low-velocity anomalies, presum-ably related to elevated temperatures, in at least some parts of themantle beneath the Arabian lithosphere are quite certain. Of rele-vance to the study of Syrian volcanism is the low-velocity anomalybeneath northwestern Arabia mapped in Chang and Van der Lee's(2011) tomographic model. The authors interpreted this structure asa mantle plume with its head located beneath Jordan, responsible for

0.5
5.0
50.0
Rb Th U Nb La Ce Pb Pr Sr Nd Zr Sm Gd Tb Dy Y Er Yb Lu
Ro
ck/P
rim
itiv
e M
antl
e
AL-07 (42.7 wt.% SiO2)
JEH-03 (51.3 wt.% SiO2)SY-291 (44.9 wt.% SiO2)
0.5
5.0
50.0
Rb Th U Nb La Ce Pb Pr Sr Nd Zr Sm Gd Tb Dy Y Er Yb Lu
Ro
ck/P
rim
itiv
e M
antl
e
Syrian hornblendite (G73)
Lherz Amph-Grt pyroxenite (Bodinier et al. 2004)
(a)
(b)
Fig. 12. Primitive mantle (McDonough and Sun, 1995) normalised multi-element dia-grams for the representative samples from (a) Phase 1 (JEH-03) and Phase 2 (AL-07and SY-291) volcanism, and (b) for the Syrian hornblendite G73 (Table 3) and an am-phibole–garnet pyroxenite from Lherz (Bodinier et al., 2004). Provided also in the leg-end box of (a) are the basalts' SiO2 contents, which vary systematically with the traceelements. The sample SY-291 shown in (a) is from Krienitz et al. (2009).
0 10 20 30 40 50 600
1
2
3
4
5
(Tb/
Yb)
N
(La/Yb)N
(La/Tb)N
0 5 10 15 200.4
0.6
0.8
1.0
1.2
1.4
1.6
(Zr/
Sm
) N
0 5 10 15 200.0
0.2
0.4
0.6
0.8
(Th/
Nb)
N
(La/Tb)N
DMM
DMM
DMM
10%
F20%
F30%F40%F
60%
F
2%F5%
F7%F12%F
Syrianhornblendite
EM
45%
F
10%F
20%F
30%F
40%F
45%F
2%F
5%F7%
F
12%F
Syrianhornblendite
EM
60%F
45%F
30%F
20%F
10%F
60%F
7%F
5%F
2%F
12%
F
40%FSyrian
hornblendite
EM
Ne-norm, this studyNe-norm, literature
This study
Phase 2
Phase 1
80%
60%
40%
20%
80%
60%40%
20%
80%
60%40%
20%
2%F
5%F15%F
2%F
2%F
15%F
5%F
5%F
15%F
AL-07
JEH-03
SY-291
AL-07
JEH-03
SY-291
AL-07
SY-291
JEH-03(a)
(b)
(c)
Fig. 13. (a) (Th/Nb)N vs (La/Tb)N, (b) (Zr/Sm)N vs (La/Tb)N and (c) (Tb/Yb)N vs (La/Yb)Nfor the most-primitive Aleppo Plateau lavas (Th/Ce≤0.5, MgO≥7.5 wt.% and LOI≤2)from theAleppo Plateau and vicinity. The continuous curves show three non-modal incon-gruent batchmeltingmodels startingwith (1) a DMM (Workman andHart, 2005) compo-sition within the garnet stability, (2) a hypothetical enriched mantle (EM) compositionproduced by fluxing the DMMwith 10% of a 1% partial melt derived from the DMM sourcewithin the garnet stability and (3) a bulk composition of hornblendite xenolith entrainedin Plio–Quaternary volcanic rocks from Al Ghab, NW Syria. The kink in the hornblenditemelting curve marks the complete consumption of amphibole at 44.8% melting; beyondthis point,meltingmodeof the residual “pyroxenite” is assumed to bemodal for simplicity.Thehornblendite (metasomatic vein) is described in the electronic supplementfile and thecomposition is given in Table 3. Additional parameters relevant to the melting modellingare provided in Table 6. The melting equation was CL=C0/[D0+F(1−Q0)] (Shaw, 1970;Zou, 2007, p10–17), where CL is the concentration of a trace element in the melt, C0 isthe concentration in the source,D0 is the bulk partition coefficient, F is the degree of partialmelting, andQ0=∑qiKiwhere qi is the proportion of phase i relative to that of themelt inthe melting reaction and Ki is the partition coefficient of phase i. The primitive mantlenormalising values are from McDonough and Sun (1995). Note that most of the Phase 2ne-normative lavas fall within the space bounced by the melting curves of the EMgarnet-bearing peridotite and the metasomatic vein, and can be explained by variablymixing~7% and~40%melt fractionsgenerated from thegarnet peridotite andmetasomaticvein, respectively. Numbers along themixing curve (dashed)denote theproportion of veinderivedmelt relative to peridotite derivedmelt. Italic numbers (thosewith a suffix F) alongthe continuous curves are the degrees of partial melting.
166 G.S.-K. Ma et al. / Chemical Geology 335 (2013) 149–171
the Cenozoic volcanism at Harrat Ash Shamah (HAS) and in other partsof northern Arabia, and possibly southern Turkey (Chang and Van derLee, 2011). This assignment of plume head location appears to be con-sistentwith the fact that theHAS represents the largest intraplate volca-nic field in this region and documents some of the earliest volcanism(~22 Ma). If this hypothesis is valid, the Aleppo Plateau volcanism,whose initiation age of ~18–19 Ma (Fig. 3) is only slightly youngerbut is located ~500 km north of the proposed plume head, may argu-ably have resulted from bifurcation of the greater Jordanian plume be-fore its emplacement.
On the Aleppo Plateau, the first phase of volcanism occurred in aconfined area near the city of Aleppo (Jabal El-Hass). Younger volca-nism climaxing a few million years later extended further north intothe Aafrin Basin and south to the region of Hama (Fig. 1b). The com-positional differences between the two phases of volcanism as docu-mented in this study are best summarised on a plot of La/Yb vs time(Fig. 14). The data clearly show that the younger volcanism ischaracterised by higher La/Yb. The large range of La/Yb cannot besimply a result of crustal contamination and is better considered tobe the product of varying contributions of metasomatic vein meltswhich have high La/Yb (see Section 6.3). With this observation, thequestion becomes why the younger lavas attained a greater metaso-matic component (Fig. 14).
The key to a plausible explanation lies in the low solidus (e.g. Pilet etal., 2008) of amphibole-rich metasomatic veins, lower than that of theanhydrous assemblage (garnet+clinopyroxene±olivine) in the lowerpart of the metasomatic cumulate column. Assume that before the vol-canism, the Syrian lithosphere had been pervasively metasomatisedand contained metasomatic veins, which is likely judging from the hy-drous nature of most of the mantle xenoliths (G. Ma et al., unpublisheddata) in NW Syria (see also Section 6.4.1). Then a hot diapir arriving be-neath Jabal El-Hass, because of its decompression due to rising, wouldproduce melts derived dominantly from peridotite. During ascent, as-similation of the metasomatic veins into the peridotite melts would bepossible, but the high ratio of peridotite-derived melts to vein-derived

Table 6Mineral–melt partition coefficients, source compositions and source modes used in partial melting forward modelling.
Partition coefficient Source composition (ppm)
Ola Opxa Cpx (3 GPa)b Cpx (1.5 GPa) Spl Grt Ampha DMMh EMi Amph-rich veinj
Th 0.00001 0 0.0008 0.0008b 0.0024d 0.0015f 0.018 0.0079 0.085 0.248Nb 0.005 0.0031 0.0077 0.02c 0.86d 0.0031g 0.53 0.1485 1.15 17.4Zr 0.01 0.01 0.12 0.27c 0.56d 0.27g 0.43 5.082 15.5 65.3La 0.0004 0.002 0.0536 0.089c 0.0006e 0.0016g 0.23 0.192 1.25 15.9Sm 0.001 0.01 0.29 0.67c 0.0006e 0.25g 1.39 0.239 0.59 4.77Tb 0.002 0.019 0.48 1.1c 0.001e 1.6g 1.62 0.070 0.11 0.70Yb 0.0015 0.049 0.43 1.48c 0.0045e 6.6g 1.1 0.365 0.42 0.81
Mode
Ol Opx Cpx Spl Grt Amph
Grt lherzoliteMineral modek 0.56 0.25 0.14 0.05Melting model 0.07 −0.16 0.68 0.25
Amph-rich metasomatic veinMineral modem 0.107 0.146 0.747Melting moden −0.05 −0.3 −0.05 1
Notes: Negative values of melting modes denote that the minerals are producing during incongruent partial melting. The starting composition of the garnet-facies lherzolite usedthe primitive mantle values of McDonough and Sun (1995). Ol, olivine; Opx, orthopyroxene; Cpx, clinopyroxene; Spl, spinel; Grt, garnet; Amph, amphibole; DMM, depleted MORBmantle; EM, enriched mantle.
a Pilet et al. (2011).b Hart and Dunn (1993).c Blundy et al. (1998) with interpolated DTb
Cpx/melt.d run# MHD19_3 of Klemme et al. (2006).e Run#1955 (3.5 GPa) of Adam and Green (2006).f Klemme et al. (2002).g Johnson (1998).h Workman and Hart (2005).i DMM refertilised by 10% of a 1% melt derived from the same source with mineral and melting modes as k and l respectively.j Hornblendite xenolith (G73) from Plio-Quaternary Al Ghab volcanic field, NW Syria, listed in Table 3.k Assumed.l Walter (1998).m Supplementary file.n Pilet et al. (2008).
167G.S.-K. Ma et al. / Chemical Geology 335 (2013) 149–171
melts would obscure the metasomatic signature seen in the Phase 1magmas. Later, the formation of the younger, more Si-undersaturatedlavas (Phase 2) would be related to a stage of lateral or channelled(north towards the Aafrin basin and south towards Hama) spread ofthe diapiric material at the base of the lithosphere. Acquisition of themore pronounced metasomatic component would be a consequenceof cooling of the diapir and less efficient penetration of themelts derivedfrom the peridotitic material. Given that the metasomatic veins in thelithosphere would continue to be readily fusible (low solidus), thiswould result in an increased vein-melt/peridotite-melt ratio. Thewhole scenario is very similar to the channelled flow model described
La/Y
b
5
10
15
20
Age (Ma)6 8 10 12 14 16 18 20
K/Ar and 40Ar/39Ar
Fig. 14. La/Yb vs age for the Miocene basalts from the Aleppo Plateau and vicinity, NWSyria. Data for K/Ar and 40Ar/39Ar are from this study, Sharkov et al. (1994) andKrienitz et al. (2009). Error bars show the 2σ of the analyses.
for the latest Miocene–Quaternary volcanism along the northern DeadSea Fault System (Ma et al., 2011a). Alternatively, during the genesis ofthe Phase 1 magmas, the metasomatic veined domain had not been de-veloped. Such a domain could have developed later during themagmat-ic quiescence between the Phase 1 and Phase 2 volcanism, or eventhrough percolation of the non-erupted Phase 1 magmas.
As noted by Ma et al. (2011a), when a sub-lithospheric melt passesthrough the lithosphere and assimilates metasomatic veins, a thirdcomponent, the lithospheric peridotitic wall-rock of the veins, may beconsumed aswell. In this study, this additional component does not ap-pear to be readily resolvable among the Aleppo Plateau basalts, al-though we agree that an involvement of peridotite wall-rock duringmelt–vein interaction is unavoidable.
7. Conclusions
New 40Ar/39Ar data provide additional constraints on the tempo-ral evolution of the Cenozoic volcanism in NW Syria. The volcanic ac-tivity on the Aleppo Plateau and vicinity, which clearly pre-dated thedevelopment of the Dead Sea Fault System in the region, occurred intwo discrete time periods that peaked at ~19–18 Ma (Phase 1) and~13.5–12 Ma (Phase 2). These periods are distinct from those volca-nic episodes of other parts of Syria.
Mineral chemistry and the chemical compositions of the lavassuggest that fractionation of olivine±clinopyroxene±plagioclasehas taken place. MELTS modelling suggests that the Phase 1 lavaswere stagnated and evolved at upper crustal depth (~1 kbar), andthe Phase 2 lavas at slightly greater depths (~5 kbar) which never-theless is still within the granitic upper crust of the Syrian litho-sphere. It also suggests that some of the Phase 2 lavas have evolved

168 G.S.-K. Ma et al. / Chemical Geology 335 (2013) 149–171
from nepheline- to hypersthene-normative compositions throughcombined assimilation–fractional crystallisation at the same depths(~5 kbar).
Crustal contamination is also supported by the trace element andisotopic compositions of the lavas. The hypersthene-normative lavasof the Phase 2 volcanism have lower Nb/U, Ce/Pb and εNd and higherTh/Ce, La/Nb and 87Sr/86Sr compared to the nepheline-normativelavas of the same volcanic phase, consistent with their derivationfrom the latter through crustal contamination. There are also substan-tial ranges of these elemental and isotopic ratios, many of which tendtowards upper continental crust, in the Phase 1 lavas, indicating thatthese earlier lavas have also interacted with the continental crust.
Among the most-primitive, least contaminated Phase 1 and Phase 2lavas, considerablemajor- and trace-element compositional differencesare noted, which cannot be accounted for by progressive crustal con-tamination. With time (from Phase 1 to Phase 2), the lavas becomemore Si-undersaturated (decreasing Si, increasing Ti, Fe, Ca, alkalisand P), accompanied by increases in trace-element abundances, LREE/HREE, MREE/HREE and more pronounced positive Nb, and negative Pband Zr anomalies on primitive mantle normalised multi-element dia-grams. The end member that led to these changes is considered to beamphibole-rich metasomatic veins in the lithosphere. The Phase 1magmas are thought to have formed from a largely peridotitic sourceand the Phase 2 magmas from mixing of melts derived from peridotiteand the amphibole-rich metasomatic veins. The latter scenario can beachieved by assimilating ascending plume/asthenospheric melts withmetasomatic veinswithin the lithosphere. The compositional variationswith time, resulting from increasing contributions of amphibole-richveins during genesis of the Phase 2 magmas, can be explained by (1) ageodynamic model involving the arrival of a diapir, possibly related tothe Jordanian plume (Chang and Van der Lee, 2011), and subsequentnorth- and southward flow of the diapir beneath the Aleppo Plateau,or (2) formation of metasomatic veins during and/or after the Phase 1volcanism.
Supplementary data to this article can be found online at http://dx.doi.org/10.1016/j.chemgeo.2012.11.001.
Acknowledgements
We thank M.-F. Zhou for supporting EMP analysis, X. Fu, J.-F.Gao, J.P.M. Wong, G.H.-N. Chan, S.H.S. Leung, K.D. Cai, J.-Z. Shi andH. Yamamoto for analytical assistance. L. Castano, M. Searle, B.Wood, M. Al-Shara'a, A.A. Turkmani, T. Darouz and N. Wappyhelped greatly with G.S.K.M's fieldwork in Syria. The fieldwork waskindly permitted and assisted by the General Establishment ofGeology and Mineral Resources, Dove Energy Syria and Maurel &Prom Syria. Two anonymous reviewers and the editor Laurie Reisbergprovided invaluable and constructive reviews. Comments by SébastienPilet and an anonymous reviewer on an earlier version of thismanuscript were beneficial. This work was funded by research grantsprovided by The University of Hong Kong (grant# 200607176152 and200807176091 to J.M.) and JSPS (grant# 20340158 and 20109006 toK.S.).
Appendix A. Analytical techniques
For all analysis, only the freshest portions of the volcanic rocks wereselected; calcite amygdales and other visible alterationweremeticulouslyremoved. For isotope analysis, the samples (except S71-05)were leachedwith 6 N HCl for 5 min and then repeatedly rinsed with high-puritydeionised water before digestion. This rinsing procedure was also carriedout for sample JEH-07 before major- and trace-element analysis, becauseof its more altered and calcite-amygdaloidal nature.
Bulk-rock major-element analysis was carried out on fused glassdiscs, and Ni and Cu on pressed powder pellets, by X-ray fluores-cence spectrometry (XRF) on a Philips PW2400 spectrometer at
The University of Hong Kong, where loss on ignition (LOI) wasalso determined. Trace element analysis was performed using aVG-Plasma-Quad Excell inductively-coupled plasma mass spec-trometer (ICP-MS) at the same laboratory, after a 12-hour digestionusing a HF–HNO3 mixture in high-pressure bombs (Liang et al.,2000). The analytical protocols were outlined in Ma et al. (2011a).The “within-run” precision of XRF and ICP-MS as monitored bythe replicate analyses was generally better than 2% for most majorelements, 1% for Ni, 5% for Cu and most other trace elements. Thelong-term precision of these methods as monitored by analysed in-ternational reference materials in different runs (days) was gener-ally better than 5% for most major elements and 10% for mosttrace elements. These results of the international reference mate-rials (AGV-2 and BHVO-2; Table 3) are also in good agreement (ac-curacy) with the published recommended values.
Nd and Sr isotope measurements for bulk-rock samples wereconducted at the Key Laboratory of Isotope Geochronology andGeochemistry, Guangzhou Institute of Geochemistry, ChineseAcademy of Sciences (GIG-CAS), as described by Ma et al. (2010a,2010b). Approximately 100 mg of sample powder was dissolvedin a Teflon beaker using a HF–HNO3 mixture for 14 days at~80 °C. Sr and REE were extracted by conventional cation exchangechromatography (AG50-X8 cation resin) with HCl as a solvent, Thiswas followed by extraction of Nd from the REE portion using RE Speccolumns, and subsequently, LN Spec (HDEHP-based) columns. The iso-topes were analysed by a Micromass IsoProbe multi-collector ICP-MSand the measured 143Nd/144Nd and 87Sr/86Sr ratios were corrected formass fractionation relative to 146Nd/144Nd=0.7219 and 86Sr/88Sr=0.1194, respectively. The Shin Etsu JNdi-1 and NBS-987 referencemate-rials (n=16) determined during the period of data acquisition gave av-erage values of 143Nd/144Nd=0.512106±10 (2σ) and 87Sr/86Sr=0.71025±7 (2σ), respectively. The Nd and Sr blanks were 0.3 ng and0.5 ng, respectively.
The procedures for Re–Os isotope and abundance determinationare described in Suzuki et al. (2004), Kato et al. (2005) and Ma et al.(2011b). In brief, ~1–3 g of sample powder, spiked with 190Os and185Re, was digested in reverse aqua regia in Carius tubes (Shirey andWalker, 1995). Os was separated by carbon tetrachloride solvent ex-traction (Cohen and Waters, 1996; Pearson and Woodland, 2000)and purified using a micro distillation method (Roy-Barman, 1993).The remaining solution was further purified and extracted for Re byMuromac AG 1-X8 anion exchange resin (100–200 mesh). All analysiswas performed on a ThermoFinnigan TRITON®, equipped with oxy-gen gas leak valve and an ion counting multiplier, at IFREE, JAMSTEC.The analytical protocol was the same as Ma et al. (2011b). Instrumen-tal mass fractionation of Os was corrected for 192Os/188Os=3.08271(Nier, 1937). Oxygen subtraction for Os and Re was based on the ra-tios of 17O/16O=0.00037 and 18O/16O=0.002047 (Nier, 1950). Theprocedural blanks (n=6) averaged 7.0±1.4 ρg Re and 1.060±0.068 ρg Os with 187Os/188Os of 0.1934±0.0089 (all in 1σ), and allthe reported Re–Os data are blank-corrected. External uncertainties(1σ) of 187Re/185Re and 187Os/188Os of the in-house Re and Os stan-dards were approximately 0.1% and 0.3%, respectively.
Major element concentrations for most minerals were obtained atGIG-CAS using a JEOL JXA-8100 Superprobe equipped with fivewavelength-dispersive spectrometers (WDSs; ~1 μm beam, 15 kV,20 nA and 10–30s counting time). Standardisation was performedon well-characterised natural oxides and silicates, which were sys-tematically analysed to monitor instrumental drift, as described inMa et al. (2011a). All data were ZAF corrected. A subset of analyseswas obtained at the Institute of Earth Sciences, Academia Sinica, Taipei,using a JEOL JXA-8500F FE-EPMA equippedwith fiveWDSs on standardconditions (2 μm beam, 12 kv, 6 nA and 15 s counting time).Standardisation and ZAF corrections are detailed in Zellmer et al.(2011) and were similar to those at GIG-CAS. For mineral grains thatwere analysed at both laboratories, the results agree very well.

169G.S.-K. Ma et al. / Chemical Geology 335 (2013) 149–171
40Ar/39Ar dating was conducted on fresh bulk-rock samples bystep-heating at the Argon Geochronology Laboratory, National TaiwanUniversity, using a Varian-MAT VG1200 mass spectrometer equippedwith a double-vacuum Mo furnace and an all-metal extraction line.The procedures were identical to those of Ma et al. (2011b) and are de-tailed in Lo et al. (2002). In short, after acid leaching and deionisedwater rinsing, the samples (only the 315–425 μm portion was used)were further cleaned in acetone, followed by deionised water, anddried. Aliquots of ~400 mg were wrapped in aluminium foil and neu-tron irradiated at the Tsing-Hua Open Pool Reactor (THOR) in Taiwan.Neutron flux was monitored with an in-house biotite standard Km3and all dates are reported relative to an age of 94.95 Ma for Km3, calcu-lated using the decay constants from Steiger and Jäger (1977). Sampleswere degassed by the double-vacuumMo furnace in steps from 400 to1500 °C with a 30-minute heating schedule. Raw mass spectrometerpeaks were corrected for mass discrimination and background noise.In this study, the recognition of a valid plateau follows the recommen-dations of Dalrymple and Lanphere (1974), and all the ages are reportedwithin 2σ errors (Table 1), which include the uncertainty of the J-value.
References
Adam, J., Green, T.H., 2006. Trace element partitioning between mica- and amphibole-bearing garnet lherzolite and hydrous basanitic melt: 1. Experimental results andthe investigation of controls on partitioning behaviour. Contributions to Mineralo-gy and Petrology 152, 1–17.
Aitcheson, S.J., Forrest, A.H., 1994. Quantification of crustal contamination in openmagmatic systems. Journal of Petrology 35, 461–488.
Al-Damegh, K., Sandvol, E., Al-Lazki, A., Barazangi, M., 2004. Regional seismic wavepropagation (Lg and Sn) and Pn attenuation in the Arabian Plate and surroundingregions. Geophysical Journal International 157. http://dx.doi.org/10.1111/j.1365-246X.2004.02246.x.
Al-Lazki, A.I., Sandvol, E., Seber, D., Barazangi, M., Turkelli, N., Mohamad, R., 2004. Pntomographic imaging of mantle lid velocity and anisotropy at the junction of theArabian, Eurasian and African plates. Geophysical Journal International 158,1024–1040.
Altherr, R., Henjeskunst, F., Baumann, A., 1990. Asthenosphere versus lithosphere aspossible sources for basaltic magmas erupted during formation of the Red-Sea:constraints from Sr, Pb and Nd isotopes. Earth and Planetary Science Letters 96,269–286.
Asimow, P.D., Ghiorso, M.S., 1998. Algorithmic modifications extending MELTS to cal-culate subsolidus phase relations. American Mineralogist 83, 1127–1132.
Baker, M.B., Hirschmann, M.M., Ghiorso, M.S., Stolper, E.M., 1995. Compositions ofnear-solidus peridotite melts from experiments and thermodynamic calculations.Nature 375, 308–311.
Baker, J., Snee, L., Menzies, M., 1996a. A brief Oligocene period of flood volcanism inYemen: implications for the duration and rate of continental flood volcanism atthe Afro-Arabian triple junction. Earth and Planetary Science Letters 138, 39–55.
Baker, J.A., Thirlwall, M.F., Menzies, M.A., 1996b. Sr–Nd–Pb isotopic and trace elementevidence for crustal contamination of plume-derived flood basalts: oligocene floodvolcanism in western Yemen. Geochimica et Cosmochimica Acta 60, 2559–2581.
Baker, J., Chazot, G., Menzies, M., Thirlwall, M., 1998. Metasomatism of the shallowmantle beneath Yemen by the Afar plume—implications for mantle plumes, floodvolcanism, and intraplate volcanism. Geology 26, 431–434.
Baker, J.A.,MacPherson,C.G.,Menzies,M.A., Thirlwall,M.F., Al-Kadasi,M.,Mattey,D.P., 2000.Resolving crustal and mantle contributions to continental flood volcanism, Yemen:constraints from mineral oxygen isotope data. Journal of Petrology 41, 1805–1820.
Baker, J., Chazot, G., Menzies, M.A., Thirlwall, M., 2002. Lithospheric mantle beneathArabia: a Pan-African protolith modified by the Afar and older plumes, ratherthan a source for continental flood volcanism? In: Menzies, M.A., Klemperer, S.L.,Ebinger, C.J., Baker, J. (Eds.), Volcanic Rifted Margins: Geological Society of AmericaSpecial Paper, 362 (65–80 pp.).
Baksi, A.K., 1987. Critical evaluation of the age of the Deccan Traps, India: implicationsfor flood-basalt volcanism and faunal extinctions. Geology 15, 147–150.
Baksi, A.K., 2003. Critical evaluation of 40Ar/39Ar ages from the Central Atlantic Mag-matic Province. In: Hames, W., McHone, J.G., Renne, P., Ruppel, C. (Eds.), The Cen-tral Atlantic Magmatic Province: Insights from Fragments of Pangea. GeophysicalMonograph, 136. American Geophysical Union, Washington (77–90 pp.).
Bertrand, H., Chazot, G., Blichert-Toft, J., Thoral, S., 2003. Implications of widespreadhigh-μ volcanism on the Arabian Plate for Afar mantle plume and lithosphere com-position. Chemical Geology 198, 47–61.
Blundy, J.D., Robinson, J.A.C., Wood, B.J., 1998. Heavy REE are compatible in clinopyroxeneon the spinel lherzolite solidus. Earth and Planetary Science Letters 160, 493–504.
Blusztajn, J., Hart, S.R., Shmizu, N., McGuire, A.V., 1995. Trace-element and isotopiccharacteristics of spinel peridotite xenoliths from Saudi Arabia. Chemical Geology123, 53–65.
Bodinier, J.-L., Fabriès, J., Lorand, J.-P., Dostal, J., Dupuy, C., 1987. Geochemistry of am-phibole pyroxenite veins from the Lherz and Freychinède ultramafic bodies(Ariège, French Pyrénées). Bulletin de Mineralogie 110, 345–358.
Bodinier, J.-L., Menzies, M.A., Shimizu, N., Frey, F.A., McPherson, E., 2004. Silicate, hy-drous and carbonate metasomatism at Lherz, France: contemporaneous deriva-tives of silicate melt–harzburgite reaction. Journal of Petrology 45, 299–320.
Brew, G., Barazangi, M., Al-Maleh, A.K., Sawaf, T., 2001. Tectonic and geologic evolutionof Syria. GeoArabia 6, 573–616.
Butler, R.W.H., Spencer, S., Griffiths, H.M., 1997. Transcurrent fault activity on the DeadSea Transform in Lebanon and its implications for plate tectonics and seismic haz-ard. Journal of the Geological Society of London 154, 757–760.
Camp, V.E., Roobol, M.J., 1992. Upwelling asthenosphere beneath western Arabia andits regional implications. Journal of Geophysical Research 97, 15225–15271.
Çapan, U.Z., Vidal, P., Cantagrel, L.M., 1987. K–Ar, Nd, Sr and Pb isotopic study of Quater-nary volcanism in Karasu Valley (Hatay), N-end of Dead-Sea rift zone in SE-Turkey.Yerbilimleri 14, 165–178.
Carlson, R.W., 1991. Physical and chemical evidence on the cause and source char-acteristics of flood basalt volcanism. Australian Journal of Earth Sciences 38,525–544.
Chang, S.-J., Van der Lee, S., 2011. Mantle plumes and associated flow beneath Arabiaand East Africa. Earth and Planetary Science Letters 302, 448–454.
Chesley, J.T., Ruiz, J., 1998. Crust-mantle interaction in large igneous provinces: impli-cations from the Re–Os isotope systematics of the Columbia River flood basalts.Earth and Planetary Science Letters 154, 1–11.
Cohen, A.S., Waters, G.G., 1996. Separation of osmium from geological materials by sol-vent extraction for analysis by thermal ionization mass spectrometry. AnalyticaChimica Acta 332, 269–275.
Condie, K., 2003. Incompatible element ratios in oceanic basalts and komatiites: track-ing deep mantle sources and continental growth rates with time. Geochemistry,Geophysics, Geosystems 4. http://dx.doi.org/10.1029/2002GC000333.
Dalrymple, G.B., Lanphere, M.A., 1974. 40Ar/39Ar age spectra of some undisturbed ter-restrial samples. Geochimica et Cosmochimica Acta 38, 715–738.
Dasgupta, R., Hirschmann, M.M., Stalker, K., 2006. Immiscible transition from carbonate-rich to silicate-rich melts in the 3 GPa melting interval of eclogite +CO2 and genesisof silica-undersaturated ocean island lavas. Journal of Petrology 47, 647–671.
Dasgupta, R., Hirschmann, M.M., Smith, N.D., 2007. Partial melting experiments of pe-ridotite CO2 at 3 GPa and genesis of alkalic ocean island basalts. Journal of Petrol-ogy 48, 2093–2124.
Dasgupta, R., Jackson, M.G., Lee, C.-T.A., 2010. Major element chemistry of ocean islandbasalts — conditions of mantle melting and heterogeneity of mantle source. Earthand Planetary Science Letters 289, 377–392.
Davidson, I., Al-Kadasi, M., Al-Khirbash, S., Al-Subbary, A.K., Baker, J., Blakey, S.,Bosence, D., Dart, C., Heaton, R., McClay, K., Menzies, M., Nichols, G., Owen, L.,Yelland, A., 1994. Geological evolution of the southeastern Red Sea Rift margin, Re-public of Yemen. Geological Society of America Bulletin 106, 1474–1493.
Davis, F.A., Hirschmann, M.M., Humayun, M., 2011. The composition of the incipientpartial melt of garnet peridotite at 3 GPa and the origin of OIB. Earth and PlanetaryScience Letters 308, 380–390.
Debayle, E., Lévêque, J.-J., Cara, M., 2001. Seismic evidence for a deeply rooted low-velocity anomaly in the upper mantle beneath the northeastern Afro/Arabian con-tinent. Earth and Planetary Science Letters 193, 423–436.
Demir, T., Westaway, R., Bridgland, D., Pringle, M., Yurtmen, S., Beck, A., Rowbotham, G.,2007. Ar–Ar dating of late Cenozoic basaltic volcanism in northern Syria: implica-tions for the history of incision by the River Euphrates and uplift of the northernArabian Platform. Tectonics 26. http://dx.doi.org/10.1029/2006TC001959.
DePaolo, D.J., 1981. Trace element and isotopic effects of combined wallrock assimila-tion and fractional crystallization. Earth and Planetary Science Letters 53, 189–202.
DePaolo, D.J., 1988. Neodymium Isotope Geochemistry: An Introduction. SpringerVerger, New York.
DeVor, R.E., Chang, T.-H., Sutherland, J.W., 1992. Statistical Quality Design and Control.Prentice-Duncan, Upper Saddle River, New Jersey.
Fabries, J., Lorand, J., Guiraud, M., 2001. Petrogenesis of the amphibole-rich veins fromthe Lherz orogenic Iherzolite massif (Eastern Pyrenees, France): a case study forthe origin of orthopyroxene-bearing amphibole pyroxenites in the lithosphericmantle. Contributions to Mineralogy and Petrology 140, 383–403.
Falloon, T.J., Green, D.H., Danyushevsky, L.V., Faul, U.H., 1999. Peridotite melting at 1.0and 1.5 GPa: an experimental evaluation of techniques using diamond aggregatesandmineral mixes for determination of near-solidus melts. Journal of Petrology 40,1343–1375.
Ghiorso, M.S., Sack, R.O., 1995. Chemical mass-transfer in magmatic processes, IV, arevised and internally consistent thermodynamic model for the interpolationand extrapolation of liquid–solid equilibria in magmatic systems at elevated-temperatures and pressures. Contributions to Mineralogy and Petrology 119,197–212.
Göğöş, O.H., Pysklywec, R.N., 2008. Mantle lithosphere delamination driving plateauuplift and synconvergent extension in eastern Anatolia. Geology 26, 723–726.
Goldstein, S.L., O'Nions, R.K., Hamilton, P.J., 1984. A Sm–Nd isotopic study of atmo-spheric dusts and particulates from major river systems. Earth and Planetary Sci-ence Letters 70, 221–236.
Green, D.H., Hibberson, W.O., Kovács, I., Rosenthal, A., 2010. Water and its influence onthe lithosphere–asthenosphere boundary. Nature 467, 448–451.
Green, D.H., Hibberson, W.O., Kovács, I., Rosenthal, A., 2011. Addendum: water and itsinfluence on the lithosphere–asthenosphere boundary. Nature 472, 504.
Hansen, A.D., Nyblade, A.A., Benoit, M.H., 2012. Mantle structure beneath Africa andArabia from adaptively parameterized P-wave tomography: implications for theorigin of Cenozoic Afro-Arabian tectonism. Earth and Planetary Science Letters319–320, 23–34.
Hart, S.R., Dunn, T., 1993. Experimental cpx melt partitioning of 24 trace-elements.Contributions to Mineralogy and Petrology 113, 1–8.

170 G.S.-K. Ma et al. / Chemical Geology 335 (2013) 149–171
Harte, B., Hunter, R.H., Kinny, P.D., 1993. Melt geometry, movement and crystallization,in relation to mantle dykes, veins and metasomatism. Philosophical Transactions ofthe Royal Society of London. Series A 342, 1–21.
Hauri, E.H., 2002. Osmium isotopes and mantle convection. Philosophical Transactionsof the Royal Society of London. Series A 360, 2371–2382.
Hawkesworth, C.J., Marsh, J.S., Duncan, A.R., Erlank, A.J., Norry, M.J., 1984. The role ofcontinental lithosphere in the generation of the Karoo volcanic rocks: evidencefrom combined Nd- and Sr-isotope studies. In: Erlank, A.J. (Ed.), Petrogenesis ofthe Volcanic Rocks of the Karoo Province: Special Publication of the Geological So-ciety of South Africa, 13 (341–354 pp.).
Hegner, E., Pallister, J.S., 1989. Pb, Sr, and Nd isotopic characteristics of Tertiary Red-SeaRift volcanics from the central Saudi Arabian coastal plain. Journal of GeophysicalResearch 94, 7749–7755.
Heimann, A., Steinitz, G., 1989. 40Ar/39Ar total gas ages of basalts from Notera #3 well,Hula Valley, Dead Sea Rift: stratigraphic and tectonic implications. Israel Journal ofEarth Sciences 38, 173–184.
Hempton, M.R., 1985. Structure and deformation history of the Bitlis suture near LakeHazar, southeastern Turkey. Geological Society of America Bulletin 96, 233–243.
Hempton, M.R., 1987. Constraints on Arabian plate motion and extensional history ofthe Red Sea. Tectonics 6, 687–705.
Henjes-Kunst, F., Altherr, R., Baumann, A., 1990. Evolution and composition of the litho-spheric mantle underneath the western Arabian peninsula: constraints from Sr–Ndisotope systematics of mantle xenoliths. Contributions to Mineralogy and Petrology105, 460–472.
Hirose, K., Kushiro, I., 1993. Partial melting of dry peridotites at high-pressures: deter-mination of compositions of melts segregated from peridotite using aggregates ofdiamond. Earth and Planetary Science Letters 114, 477–489.
Hirschmann, M.M., Kogiso, T., Baker, M.B., Stolper, E.M., 2003. Alkalic magmas generat-ed by partial melting of garnet pyroxenite. Geology 31, 481–484.
Hoernle, K., Zhang, Y.-S., Graham, D., 1995. Seismic and geochemical evidence for large-scale mantle upwelling beneath the eastern Atlantic and western and central Europe.Nature 374, 34–39.
Hofmann, A.W., 1997. Mantle geochemistry: the message from oceanic volcanism. Na-ture 385, 219–229.
Hofmann, A.W., Jochum, K.P., Seufert, M., White, W.M., 1986. Nb and Pb in oceanic basalts:new constraints on mantle evolution. Earth and Planetary Science Letters 79, 33–45.
Ilani, S., Harlavan, Y., Tarawneh, K., Rabba, I., Weinberger, R., Ibrahim, K., Peltz, S.,Steinitz, G., 2001. New K–Ar ages of basalts from the Harrat Ash Shaam volcanicfield in Jordan: implications for the span and duration of the upper-mantle upwell-ing beneath the western Arabian plate. Geology 29, 171–174.
Ireland, T.J., Walker, R.J., Garcia, M.O., 2009. Highly siderophile element and 187Os iso-tope systematics of Hawaiian picrites: implications for parental melt compositionand source heterogeneity. Chemical Geology 260, 112–128.
Irvine, T.N., Baragar, W.R.A., 1971. A guide to the chemical classification of the commonvolcanic rocks. Canadian Journal of Earth Sciences 8, 523–548.
Jarrar, G., Stern, R.J., Saffarine, G., Al-Zubi, H., 2003. Late- and post-orogenic Neoproterozoicintrusions of Jordan: implications for crustal growth in the northernmost segment ofthe East African Orogen. Precambrian Research 123, 295–319.
Johnson, K.T.M., 1998. Experimental determination of partition coefficients for rareearth and high-field-strength elements between clinopyroxene, garnet, and basal-tic melt at high pressures. Contributions to Mineralogy and Petrology 133, 60–68.
Jung, S., Pfänder, J.A., Brügmann, G., Stracke, A., 2005. Sources of primitive alkaline vol-canic rocks from the Central European Volcanic Province (Rhön, Germany) in-ferred from Hf, Os and Pb isotopes. Contributions to Mineralogy and Petrology150, 546–559.
Kato, Y., Fujinaga, K., Suzuki, K., 2005. Major and trace element geochemistry and Osisotopic composition of metalliferous umbers from the Late Cretaceous Japaneseaccretionary complex. Geochemistry, Geophysics, Geosystems 6, Q07004. http://dx.doi.org/10.1029/2005GC000920.
Kazmin, V.G., 2002. The late Paleozoic to Cainozoic intraplate deformation in NorthArabia: a response to plate boundary-forces. In: Cloetingh, S.A.P.L., Ben-Avraham,Z. (Eds.), From Continental Extension to Collision: Africa–Europe Interaction, theDead Sea and Analogue Natural Laboratories: European Geosciences Union (EGU)Stephen Mueller Special Publication Series, 2 (123–138 pp.).
Keskin, M., 2003.Magma generation by slab steepening and breakoff beneath a subduction–accretion complex: an alternative model for collision-related volcanism in EasternAnatolia, Turkey. Geophysical Research Letters 30. http://dx.doi.org/10.1029/2003GL018019.
Keskin, M., 2007. Eastern Anatolia: a hot spot in a collision zone without a mantleplume. In: Foulger, G.R., Jurdy, D.M. (Eds.), Plates, Plumes, and Planetary Processes:Geological Society of America Special Paper, 430 (693–722 pp.).
Kinzler, R.J., 1997. Melting of mantle peridotite at pressures approaching the spinel togarnet transition: application to mid-ocean ridge basalt petrogenesis. Journal ofGeophysical Research 102, 853–874.
Klemme, S., Blundy, J.D., Wood, B.J., 2002. Experimental constraints on major and traceelement partitioning during partial melting of eclogite. Geochimica etCosmochimica Acta 66, 3109–3123.
Klemme, S., Günther, D., Hametner, K., Prowatke, S., Zack, T., 2006. The partitioning of traceelements between ilmenite, ulvospinel, armalcolite and silicate melts with implica-tions for the early differentiation of the moon. Chemical Geology 234, 251–263.
Kogiso, T., Hirschmann, M.M., Frost, D.J., 2003. High-pressure partial melting of garnetpyroxenite: possible mafic lithologies in the source of ocean island basalts. Earthand Planetary Science Letters 216, 603–617.
Krienitz, M.-S., Haase, K.M., 2011. The evolution of the Arabian lower crust and litho-spheric mantle — geochemical constraints from southern Syrian mafic and ultra-mafic xenoliths. Chemical Geology 280, 271–283.
Krienitz, M.-S., Haase, K.M., Mezger, K., Eckardt, V., Shaikh-Mashail, M.A., 2006. Magmagenesis and crustal contamination of continental intraplate lavas in northwesternSyria. Contributions to Mineralogy and Petrology 151, 698–716.
Krienitz, M.-S., Haase, K.M., Mezger, K., Shaikh-Mashail, M.A., 2007. Magma genesis andmantle dynamics at the Harrat Ash Shamah volcanic field (southern Syria). Journalof Petrology 48, 1513–1542.
Krienitz, M.-S., Haase, K.M., Mezger, K., van den Bogaard, P., Thiemann, V., Shaikh-Mashail, M.A., 2009. Tectonic events, continental intraplate volcanism, and mantleplume activity in northern Arabia: constraints from geochemistry and Ar–Ar dat-ing of Syrian lavas. Geochemistry, Geophysics, Geosystems 10. http://dx.doi.org/10.1029/2008GC002254.
Kushiro, I., 1996. Partial melting of a fertile peridotite at high pressure: an experimen-tal study using aggregates of diamond. In: Basu, A., Hart, S. (Eds.), Earth Processes:Reading the Isotope Code. Geophysical Monography, 95. American GeophysicalUnion, pp. 109–122.
Langmuir, C.H., Vocke, R.D., Hanson, G.N., Hart, S.R., 1978. General mixing equationwith applications to Icelandic basalts. Earth and Planetary Science Letters 37,380–392.
Le Maitre, R.W., 2002. Igneous rocks: a classification and glossary of terms: recommen-dations of international union of geological sciences subcommission on the sys-tematics of igneous rocks. Cambridge University Press, Cambridge.
Legendre, C.P., Meier, T., Lebedev, S., Friederich, W., Viereck-Götte, L., 2012. A shearwave velocity model of the European upper mantle from automated inversionof seismic shear and surface waveforms. Geophysical Journal International 91.http://dx.doi.org/10.1111/j.1365-246X.2012.05613.x.
Liang, Q., Jing, H., Grégoire, D.C., 2000. Determination of trace elements in granites byinductively coupled plasma mass spectrometry. Talanta 51, 507–513.
Lo, C.-H., Chung, S.-L., Lee, T.-Y., Wu, G., 2002. Age of the Emeishan flood magmatismand relations to Permian–Triassic boundary events. Earth and Planetary ScienceLetters 198, 449–458.
Lorand, J.-P., Gregoire, M., 2010. Petrogenesis of Fe–Ti oxides in amphibole-rich veinsfrom the Lherz orogenic peridotite (Northeastern Pyrénées, France). Contributionsto Mineralogy and Petrology 160, 99–113.
Ludwig, K., 2008. Isoplot 3.6: a geochronological toolkit for Microsoft Excel. BerkelyGeochronology Center Special publication, 4.
Lustrino, M., Dallai, L., 2003. On the origin of EM-I end-member. Neues Jahrbuch furMineralogie, Abhandlungen 179, 85–100.
Lustrino, M., Sharkov, E., 2006. Neogene volcanic activity of western Syria and its rela-tionship with Arabian plate kinematics. Journal of Geodynamics 42, 115–139.
Lustrino, M., Wilson, M., 2007. The circum-Mediterranean anorogenic Cenozoic igne-ous province. Earth-Science Reviews 81, 1–65.
Ma, J., Wei, G., Xu, Y., Long, W., 2010a. Variations of Sr–Nd–Hf isotopic systematics inbasalt during intensive weathering. Chemical Geology 269, 376–385.
Ma, G.S., Malpas, J., Xenophontos, C., Suzuki, K., 2010b. Metasomatic origin for the genesisof the latest Miocene–Quaternary intraplate basalts in northwestern Syria. AGU Fallmeeting. San Francisco. (Abstract #V11B-2276).
Ma, G.S.-K., Malpas, J., Xenophontos, C., Chan, G.H.-N., 2011a. Petrogenesis of latestMiocene–Quaternary continental intraplate volcanism along the northern Dead SeaFault System (Al Ghab–Homs Volcanic Field), western Syria: evidence for lithosphere–asthenosphere interaction. Journal of Petrology 52, 401–430.
Ma, G.S.-K., Malpas, J., Xenophontos, C., Suzuki, K., Lo, C.-H., 2011b. Early Cretaceousvolcanism of the Coastal Ranges, NW Syria: magma genesis and regional dynamics.Lithos 126, 290–306.
Ma, G.S.-K., Malpas, J., Gao, J.F., Wang, K.-L., Qi, L., Xenophontos, C., in press. Platinum-group element geochemistry of intraplate basalts from the Aleppo Plateau, NWSyria. Geological Magazine. http://dx.doi.org/10.1017/S0016756812000696.
Mallik, A., Dasgupta, R., 2012. Reaction between MORB-eclogite derived melts and fer-tile peridotite and generation of ocean island basalts. Earth and Planetary ScienceLetters 329–330, 97–108.
McBride, J.S., Lambert, D.D., Nicholls, I.A., Price, R.C., 2001. Osmium isotopic evidence forcrust–mantle interaction in the genesis of continental intraplate basalts from theNewer Volcanics Province, southeastern Australia. Journal of Petrology 42, 1197–1218.
McDonough, W.F., Sun, S.S., 1995. The composition of the earth. Chemical Geology 120,223–253.
McQuarrie, N., Stock, J.M., Verdel, C., Wernicke, B.P., 2003. Cenozoic evolution ofNeotethys and implications for the causes of plate motions. Geophysical ResearchLetters 30. http://dx.doi.org/10.1029/2003GL017992.
Meisel, T., Walker, R.J., Morgan, J.W., 1996. The osmium isotopic composition of theEarth's primitive upper mantle. Nature 383, 517–520.
Mor, D., 1993. A time-table for the Levant Volcanic Province, according to K–Ar datingin the Golan-Heights, Israel. Journal of African Earth Sciences 16, 223–234.
Morimoto, N., Fabries, J., Ferguson, A.K., Ginzburg, I.V., Ross, M., Seifert, F.A., Zussman, J.,Aoki, K., Gottardi, G., 1988. Nomenclature of pyroxenes. American Mineralogist 73,1123–1133.
Mouty, M., Delaloye, M., Fontignie, D., Piskin, O., Wagner, J.J., 1992. The volcanic activityin Syria and Lebanon between Jurassic and Actual. Schweizerische Mineralogischeund Petrographische Mitteilungen 72, 91–105.
Nasir, S., Rollinson, H., 2009. The nature of the subcontinental lithospheric mantle be-neath the Arabian Shield: mantle xenoliths from southern Syria. Precambrian Re-search 172, 323–333.
Nasir, S., Safarjalani, A., 2000. Lithospheric petrology beneath the northern part of theArabian Plate in Syria: evidence from xenoliths in alkali basalts. Journal of AfricanEarth Sciences 30, 149–168.
Nier, A.O., 1937. The isotopic constitution of osmium. Physics Reviews B52, 885.Nier, A.O., 1950. A redetermination of the relative abundances of the isotopes of car-
bon, nitrogen, oxygen, argon and potassium. Physics Reviews B77, 789–793.

171G.S.-K. Ma et al. / Chemical Geology 335 (2013) 149–171
Park, Y., Nyblade, A., Rodgers, A., Al-Amri, A., 2008. S wave velocity structure of the ArabianShield upper mantle from Rayleigh wave tomography. Geochemistry, Geophysics,Geosystems 9. http://dx.doi.org/10.1029/2007GC001895.
Pearson, D.G., Woodland, S.J., 2000. Solvent extraction/anion exchange separation anddetermination of PGEs (Os, Ir, Pt, Pd, Ru) and Re–Os isotopes in geological samplesby isotope dilution ICP-MS. Chemical Geology 165, 87–107.
Pertermann, M., Hirschmann, M.M., 2003. Anhydrous partial melting experiments onMORB-like eclogite: phase relations, phase compositions andmineral-melt partitioningof major elements at 2–3 GPa. Journal of Petrology 44, 2173–2201.
Peucker-Ehrenbrink, B., Jahn, B.-M., 2001. Rhenium-osmium isotope systematics and plat-inum group element concentrations: loess and the upper continental crust. Geochem-istry, Geophysics, Geosystems 2, 1061. http://dx.doi.org/10.1029/2001GC000172.
Pik, R., Deniel, C., Coulon, C., Yirgu, G., Marty, B., 1999. Isotopic and trace element sig-natures of Ethiopian flood basalts: evidence for plume–lithosphere interactions.Geochimica et Cosmochimica Acta 63, 2263–2279.
Pilet, S., Baker, M.B., Stolper, E.M., 2008. Metasomatized lithosphere and the origin ofalkaline lavas. Science 320, 916–919.
Pilet, S., Ulmer, P., Villiger, S., 2010. Liquid line of descent of a basanitic liquid at1.5 Gpa: constraints on the formation of metasomatic veins. Contributions to Min-eralogy and Petrology 159, 621–643.
Pilet, S., Baker, M.B., Müntener, O., Stolper, E.M., 2011. Monte Carlo simulations ofmetasomatic enrichment in the lithosphere and implications for the source of alka-line basalts. Journal of Petrology 52, 1415–1442.
Qi, L., Zhou, M.F., 2008. Platinum-group elemental and Sr–Nd–Os isotopic geochemistryof Permian Emeishan flood basalts in Guizhou Province, SW China. Chemical Geol-ogy 248, 83–103.
Raad, K., 1979. Les Formations Volcaniques du Liban. PhD Thesis, Universite ́ de Paris-Sud,Centre d'Orsay, France.
Robinson, J.A.C., Wood, B.J., Blundy, J.D., 1998. The beginning of melting of fertile anddepleted peridotite at 1.5 GPa. Earth and Planetary Science Letters 155, 97–111.
Roddick, J.C., 1978. The application of isochron diagrams in 40Ar–39Ar dating: a discus-sion. Earth and Planetary Science Letters 41, 233–244.
Roeder, P.L., Emslie, R.F., 1970. Olivine-liquid equilibrium. Contributions to Mineralogyand Petrology 29, 275–289.
Roy-Barman, M., 1993. Mesure du rapport 187Os/188Os dans les basaltes et les péridotites:contribution à la systematique 187Re-187Os dans lemanteau. PhDThesis, University deParis VII, Paris.
Rudnick, R.L., Gao, S., 2003. Composition of the continental crust. In: Rudnick, R.L. (Ed.),The Crust. : Treatise on Geochemistry, 3. Elsevier-Pergamon, Oxford (1–64 pp.).
Searle, M.P., Chung, S.-L., Lo, C.-H., 2010. Geological offsets and age constraints alongthe northern Dead Sea fault, Syria. Journal of the Geological Society of London167, 1001–1008.
Sharkov, E.V., Chernyshev, I.V., Devyatkin, E.V., Dodonov, A.E., Ivanenko, V.V.,Karpenko, M.I., Leonov, Y.G., Novikov, V.M., Hanna, S., Khatib, K., 1994. Geochronol-ogy of Late Cenozoic basalts in western Syria. Petrology 2, 439–448.
Sharkov, E.V., Chernyshev, I.V., Devyatkin, E.V., Dodonov, A.E., Ivanenko, V.V., Karpenko,M.I., Leonov, Y.G., Novikov, V.M., Hanna, S., Khatib, K., 1998. New data on the geo-chronology of upper Cenozoic plateau basalts from the northeastern periphery ofthe Red Sea Rift area (northern Syria). Doklady Earth Sciences 358, 19–22.
Shaw, D.M., 1970. Trace element fractionation during anatexis. Geochimica etCosmochimica Acta 34, 237–243.
Shaw, J.E., Baker, J.A., Menzies, M.A., Thirlwall, M.F., Ibrahim, K.M., 2003. Petrogene-sis of the largest intraplate volcanic field on the Arabian Plate (Jordan): a mixedlithosphere–asthenosphere source activated by lithospheric extension. Journalof Petrology 44, 1657–1679.
Shaw, J.E., Baker, J.A., Kent, A.J.R., Ibrahim, K.M., Menzies, M.A., 2007. The geochemistryof the Arabian lithospheric mantle—a source for intraplate volcanism? Journal ofPetrology 48, 1495–1512.
Shirey, S.B., Walker, R.J., 1995. Carius tube digestion for low-blank rhenium–osmiumanalysis. Analytical Chemistry 67, 2136–2141.
Spandler, C., Yaxley, G.M., Green, D.H., Rosenthal, A., 2008. Phase relations and meltingof anhydrous K-bearing eclogite from 1200 to 1600 °C and 3 to 5 GPa. Journal ofPetrology 49, 771–795.
Steiger, R.H., Jäger, E., 1977. Subcommission on geochronology: convention on the useof decay constants in geo- and cosmochronology. Earth and Planetary Science Let-ters 36, 359–362.
Stein, M., Hofmann, A.W., 1992. Fossil plume head beneath the Arabian lithosphere?Earth and Planetary Science Letters 114, 193–209.
Stein, M., Garfunkel, Z., Jagoutz, E., 1993. Chronothermometry of peridotitic and pyrox-enitic xenoliths: implications for the thermal evolution of the Arabian lithosphere.Geochimica et Cosmochimica Acta 57, 1325–1337.
Sun, S.S., McDonough, W.F., 1989. Chemical and isotopic systematics of oceanic basalts:implications for mantle composition and processes. In: Saunders, A.D., Norry, M.J.(Eds.), Magmatism in the Ocean Basins: Geological Society Special Publication, 42(313–345 pp.).
Sun, W., Hu, Y., Kamenetsky, V.S., Eggins, S.M., Chen, M., Arculus, R.J., 2008. Constancyof Nb/U in the mantle revisited. Geochimica et Cosmochimica Acta 72, 3542–3549.
Suzuki, K., Miyata, Y., Kanazawa, N., 2004. Precise Re isotope ratio measurements bynegative thermal ionization mass spectrometry (NTI-MS) using total evaporationtechnique. International Journal of Mass Spectrometry 235, 97–101.
Takahashi, E., 1986. Melting of a dry peridotite KLB-1 up to 14 GPa: implications on theorigin of peridotitic upper mantle. Journal of Geophysical Research-Solid 91,9367–9382.
Trifonov, V.G., Dodonov, A.E., Sharkov, E.V., Golovin, D.I., Chernyshev, I.V., Lebedev,V.A., Ivanova, T.P., Bachmanov, D.M., Rukieh, M., Ammar, O., Minini, H., Kafri,A.A., Ali, O., 2011. New data on the Late Cenozoic basaltic volcanism in Syria, ap-plied to its origin. Journal of Volcanology and Geothermal Research 199, 177–192.
Volker, F., McCulloch, M.T., Altherr, R., 1993. Submarine basalts from the Red Sea: newPb, Sr, and Nd isotopic data. Geophysical Research Letters 20, 927–930.
Walker, R.J., Carlson, R.W., Shirey, S.B., Boyd, F.R., 1989. Os, Sr, Nd, and Pb isotope system-atics of southern African peridotite xenoliths: implications for the chemical evolutionof subcontinental mantle. Geochimica et Cosmochimica Acta 53, 1583–1595.
Walter, M.J., 1998. Melting of garnet peridotite and the origin of komatiite and deplet-ed lithosphere. Journal of Petrology 39, 29–60.
Wappy, N. A., Al-Beb, S., Khateeb, A. B., 2003. Al - Hajeb Sheet NI. 37XIII F-d. TheGeologicalMap of Syria, 1:50000. Directorate of Geological Survey and Studies, General Estab-lishment of Geology and Mineral Resources, Ministry of Petroleum and Mineral Re-sources, Damascus, Syrian Arab Republic.
Wasylenki, L.E., Baker, M.B., Kent, A.J.R., Stolper, E.M., 2003. Near-solidus melting of theshallow upper mantle: partial melting experiments on depleted peridotite. Journalof Petrology 44, 1163–1191.
Weaver, B.L., 1991. Trace element evidence for the origin of ocean-island basalts. Geol-ogy 19, 123–126.
Weinstein, Y., Navon, O., Altherr, R., Stein, M., 2006. The role of lithospheric mantle het-erogeneity in the generation of Plio–Pleistocene alkali basaltic suites from NWHarrat Ash Shaam (Israel). Journal of Petrology 47, 1017–1050.
Widom, E., Hoernle, K.A., Shirey, S.B., Schmincke, H.U., 1999. Os isotope systematics inthe Canary Islands and Madeira: lithospheric contamination andmantle plume sig-natures. Journal of Petrology 40, 279–296.
Workman, R.K., Hart, S.R., 2005. Major and trace element composition of the depletedMORB mantle (DMM). Earth and Planetary Science Letters 231, 53–72.
Workman, R.K., Hart, S.R., Jackson, M., Regelous, M., Farley, K.A., Blusztajn, J., Kurz, M.,Staudigel, H., 2004. Recycledmetasomatized lithosphere as the origin of the EnrichedMantle II (EM2) end-member: evidence from the Samoan Volcanic Chain. Geochem-istry, Geophysics, Geosystems. http://dx.doi.org/10.1029/2003gc000623.
Wörner, G., Zindler, A., Staudigel, H., Schmincke, H.U., 1986. Sr, Nd and Pb isotope geo-chemistry of Tertiary and Quaternary volcanics from West Germany. Earth andPlanetary Science Letters 79, 107–119.
Xu, J.-F., Suzuki, K., Xu, Y.-G., Mei, H.-J., Li, J., 2007. Os, Pb, and Nd isotope geochemistryof the Permian Emeishan continental flood basalts: insights into the source of alarge igneous province. Geochimica et Cosmochimica Acta 71, 2104–2119.
Xu, Y.-G., Blusztajn, J., Ma, J.-L., Suzuki, K., Liu, J.F., Hart, S.R., 2008. Late Archean to EarlyProterozoic lithospheric mantle beneath the western North China craton: Sr–Nd–Osisotopes of peridotite xenoliths from Yangyuan and Fansi. Lithos 102, 25–42.
Zanchi, A., Crosta, G.B., Darkal, A.N., 2002. Paleostress analyses in NW Syria: constraintson the Cenozoic evolution of the northwestern margin of the Arabian plate.Tectonophysics 357, 255–278.
Zellmer, G.F., Rubin, K.H., Dulski, P., Iizuka, Y., Goldstein, S.L., Perfit, M.R., 2011. Crystalgrowth during dike injection of MOR basaltic melts: evidence from preservation oflocal Sr disequilibria in plagioclase. Contributions to Mineralogy and Petrology 161,153–173.
Zou, H., 2007. Quantitative Geochemistry. Imperial College Press, London.


![طریقت صفویه در شام و حلب (Safavid order in Syria and Aleppo) [Farsi]](https://static.fdokumen.com/doc/165x107/6331e33a576b626f850d268f/-safavid-order-in-syria-and-aleppo.jpg)