EVO-2x2: a Modelling Framework to Study the Evolution of Strategies in 2x2 Symmetric Games under...
8
EVO-2x2: a Modelling Framework to Study the Evolution of Strategies in 2x2 Symmetric Games under Various Competing Assumptions Luis R. Izquierdo † , Segismundo S. Izquierdo ⌂ , J. Gary Polhill † † The Macaulay Institute, Craigiebuckler, AB15 8QH, Aberdeen, UK {l.izquierdo, g.polhill}@macaulay.ac.uk ⌂ Department of Industrial Organization, University of Valladolid, 47011, Spain. [email protected] Abstract This paper describes EVO-2x2, a computer simulation modelling framework designed to formally investigate the evolution of strategies in 2-player 2-strategy (2x2) symmetric games under various competing assumptions. EVO- 2x2 enables the user to explore the implications of alternative assumptions (all of which are fully consistent with the essence of the theory of evolution) in a coherent and systematic way. It thus provides a single framework within which results obtained using different assumptions can be contrasted and compared with analytical approaches. We illustrate the usefulness of EVO-2x2 by studying the evolution of cooperation in the Prisoner’s Dilemma under different settings. 1. Introduction This paper describes EVO-2x2, a computer simulation modelling framework designed to formally investigate the evolution of strategies in 2-player 2-strategy (2x2) symmetric games under various competing assumptions. EVO- 2x2 enables the user to set up and run many computer simulations (effectively many different models) aimed at investigating the same question from different angles. The specific question to be addressed is usually of the form: “In a population of individuals who interact with each other by repeatedly playing a certain 2x2 symmetric game, what strategies are likely to emerge and be sustained under evolutionary pressures?”. Naturally, the answer to such a question may depend on a number of assumptions regarding population size, magnitude of payoffs, population structure, the implementation of the natural selection algorithm, and the mutation mechanism. EVO-2x2 enables the researcher to assess the impact of many such assumptions by providing a single coherent framework within which results obtained from different models can be contrasted and compared with analytical approaches. EVO-2x2 implements a wide range of competing plausible assumptions, all of which are fully consistent with the most basic principles of the theory of evolution. Thus, in broader terms, EVO-2x2 can be used to assess the extent to which the assumptions made in mainstream evolutionary game theory (Weibull, 1995) for the sake of tractability (e.g. infinite populations, random pairings, finite set of deterministic strategies, continuous time, and proportional fitness rule) are affecting its conclusions. This paper is divided into two parts: a description of EVO-2x2 (section 2) and an illustration of how EVO-2x2 can be used in practice (section 3). This latter section is focused on a study of the evolutionary emergence of cooperation among individuals playing the Prisoner’s Dilemma. 2. Description of EVO-2x2 2.1. The conceptual model In this section we explain the conceptual model that EVO-2x2 implements. The information provided here should suffice to re-implement the same conceptual model in any platform. Figure 1 provides a snapshot of EVO-2x2 interface, which is included here to clarify the explanation of the model. The reader may also want to consider following the explanation of the model using it at the same time. For this purpose, we have uploaded an applet of EVO-2x2 at http://www.izqui.org/wcss2006 . We use bold red italicised arial font to denote parameter names.
-
Upload
independent -
Category
Documents
-
view
1 -
download
0
Transcript of EVO-2x2: a Modelling Framework to Study the Evolution of Strategies in 2x2 Symmetric Games under...
EVO-2x2: a Modelling Framework to Study the Evolution of Strategies in 2x2 Symmetric Games under Various Competing
Assumptions Luis R. Izquierdo†, Segismundo S. Izquierdo⌂, J. Gary Polhill†
†The Macaulay Institute, Craigiebuckler, AB15 8QH, Aberdeen, UK {l.izquierdo, g.polhill}@macaulay.ac.uk
⌂ Department of Industrial Organization, University of Valladolid, 47011, Spain. [email protected]
Abstract This paper describes EVO-2x2, a computer simulation modelling framework designed to formally investigate the evolution of strategies in 2-player 2-strategy (2x2) symmetric games under various competing assumptions. EVO-2x2 enables the user to explore the implications of alternative assumptions (all of which are fully consistent with the essence of the theory of evolution) in a coherent and systematic way. It thus provides a single framework within which results obtained using different assumptions can be contrasted and compared with analytical approaches. We illustrate the usefulness of EVO-2x2 by studying the evolution of cooperation in the Prisoner’s Dilemma under different settings.
1. Introduction This paper describes EVO-2x2, a computer simulation modelling framework designed to formally investigate the evolution of strategies in 2-player 2-strategy (2x2) symmetric games under various competing assumptions. EVO-2x2 enables the user to set up and run many computer simulations (effectively many different models) aimed at investigating the same question from different angles. The specific question to be addressed is usually of the form: “In a population of individuals who interact with each other by repeatedly playing a certain 2x2 symmetric game, what strategies are likely to emerge and be sustained under evolutionary pressures?”. Naturally, the answer to such a question may depend on a number of assumptions regarding population size, magnitude of payoffs, population structure, the implementation of the natural selection algorithm, and the mutation mechanism. EVO-2x2 enables the researcher to assess the impact of many such assumptions by providing a single coherent framework within which results obtained from different models can be contrasted and compared with analytical approaches. EVO-2x2 implements a wide range of competing plausible assumptions, all of which are fully consistent with the most basic principles of the theory of evolution. Thus, in broader terms, EVO-2x2 can be used to assess the extent to which the assumptions made in mainstream evolutionary game theory (Weibull, 1995) for the sake of tractability (e.g. infinite populations, random pairings, finite set of deterministic strategies, continuous time, and proportional fitness rule) are affecting its conclusions. This paper is divided into two parts: a description of EVO-2x2 (section 2) and an illustration of how EVO-2x2 can be used in practice (section 3). This latter section is focused on a study of the evolutionary emergence of cooperation among individuals playing the Prisoner’s Dilemma.
2. Description of EVO-2x2
2.1. The conceptual model In this section we explain the conceptual model that EVO-2x2 implements. The information provided here should suffice to re-implement the same conceptual model in any platform. Figure 1 provides a snapshot of EVO-2x2 interface, which is included here to clarify the explanation of the model. The reader may also want to consider following the explanation of the model using it at the same time. For this purpose, we have uploaded an applet of EVO-2x2 at http://www.izqui.org/wcss2006. We use bold red italicised arial font to denote parameter names.
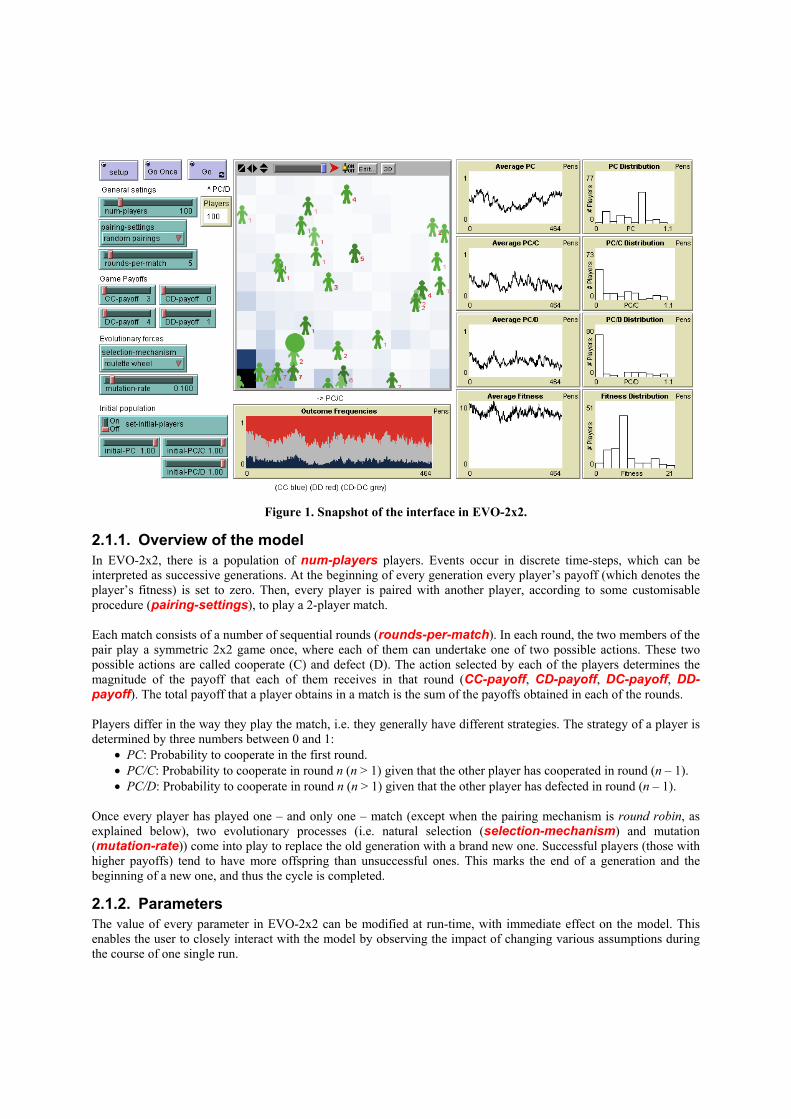
Figure 1. Snapshot of the interface in EVO-2x2.
2.1.1. Overview of the model In EVO-2x2, there is a population of num-players players. Events occur in discrete time-steps, which can be interpreted as successive generations. At the beginning of every generation every player’s payoff (which denotes the player’s fitness) is set to zero. Then, every player is paired with another player, according to some customisable procedure (pairing-settings), to play a 2-player match. Each match consists of a number of sequential rounds (rounds-per-match). In each round, the two members of the pair play a symmetric 2x2 game once, where each of them can undertake one of two possible actions. These two possible actions are called cooperate (C) and defect (D). The action selected by each of the players determines the magnitude of the payoff that each of them receives in that round (CC-payoff, CD-payoff, DC-payoff, DD-payoff). The total payoff that a player obtains in a match is the sum of the payoffs obtained in each of the rounds. Players differ in the way they play the match, i.e. they generally have different strategies. The strategy of a player is determined by three numbers between 0 and 1:
• PC: Probability to cooperate in the first round. • PC/C: Probability to cooperate in round n (n > 1) given that the other player has cooperated in round (n – 1). • PC/D: Probability to cooperate in round n (n > 1) given that the other player has defected in round (n – 1).
Once every player has played one – and only one – match (except when the pairing mechanism is round robin, as explained below), two evolutionary processes (i.e. natural selection (selection-mechanism) and mutation (mutation-rate)) come into play to replace the old generation with a brand new one. Successful players (those with higher payoffs) tend to have more offspring than unsuccessful ones. This marks the end of a generation and the beginning of a new one, and thus the cycle is completed.
2.1.2. Parameters The value of every parameter in EVO-2x2 can be modified at run-time, with immediate effect on the model. This enables the user to closely interact with the model by observing the impact of changing various assumptions during the course of one single run.

Population parameters num-players: Number of players in the population. This number is necessarily even for pairing purposes. set-initial-players: This is a binary variable that is either on or off. If on, every player in the initial population will have the same strategy, which is determined using the following parameters: initial-PC, initial-PC/C, and initial-PC/D. If off, the initial population of strategies will be created at random.
Rounds and Payoffs
rounds-per-match: Number of rounds in a match. CC-payoff: Payoff obtained by a player who cooperates when the other player cooperates too. CD-payoff: Payoff obtained by a player who cooperates when the other player defects. DC-payoff: Payoff obtained by a player who defects when the other player cooperates. DD-payoff: Payoff obtained by a player who defects when the other player also defects.
Pairing settings This parameter (pairing-settings) determines the algorithm that should be used to form pairs of players. There are three different options:
• random pairings: Pairs are made at random, without any bias. Every player plays one and only one match in a generation.
• round robin: Every player is paired with every other player once, so every player plays exactly (num-players – 1) matches per generation.
• children together: Players are paired preferentially with their siblings (and at random among siblings). Once all the possible pairs between siblings have been made, the rest of the players are paired at random. Every player plays one and only one match in a generation. This procedure was implemented because it seems plausible in many biological contexts that individuals belonging to the same family tend to interact more often among them than with individuals from other families.
Evolutionary forces
selection-mechanism: This parameter determines the algorithm used to create the new generation. There are four possible options:
• roulette wheel: This procedure involves conducting num-players replications, which form the new generation. In each replication, players from the old generation are given a probability of being chosen to be replicated that is proportional to their total payoff (which denotes their fitness).
• Moran process: In each time-step (i.e. generation), one player is chosen for replication with a probability proportional to its fitness. The offspring replaces a randomly chosen player (possibly its parent). Payoff totals are set to zero at the beginning of every time-step.
• winners take all: This method selects the player(s) with the highest total payoff (i.e. the “winners”). Then, for num-players times, a random player within this “winners set” is chosen to be replicated. The num-players replications constitute the new generation. Note that this mechanism violates the proportional fitness rule.
• tournament: This method involves selecting two agents from the population at random and replicating the one with the higher payoff for the next generation. In case of tie, one of them is selected at random. This process is repeated num-players times. The num-players replications form the new generation.
mutation-rate: This is the probability that any newly created player is a mutant. A mutant is a player whose strategy (the 3-tuple formed by PC, PC/C, and PC/D) has been determined at random.
2.2. Displays EVO-2x2 provides various displays which are shown in Figure 1. Some of these displays are time-series plots showing the historical evolution of the value of a particular variable throughout generations (e.g. frequency of outcomes and population average values of fitness, PC, PC/C, and PC/D), whereas others refer only to the last generation (e.g. population distributions of fitness, PC, PC/C, and PC/D).
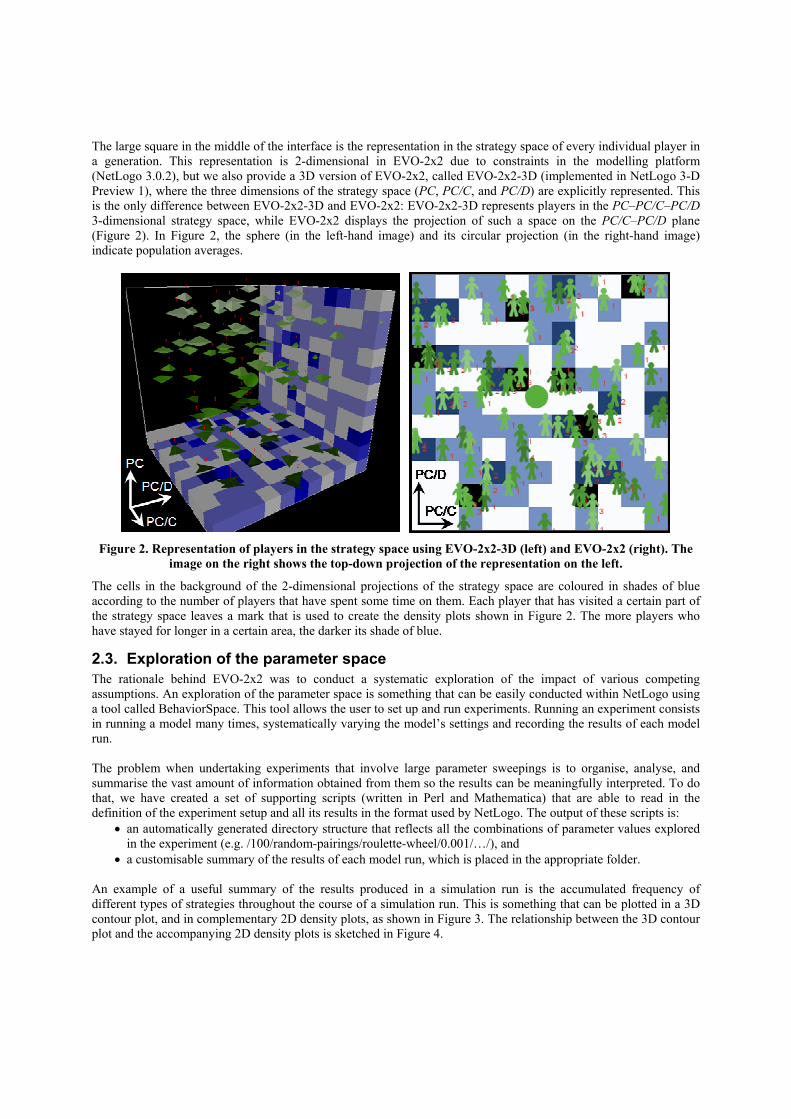
The large square in the middle of the interface is the representation in the strategy space of every individual player in a generation. This representation is 2-dimensional in EVO-2x2 due to constraints in the modelling platform (NetLogo 3.0.2), but we also provide a 3D version of EVO-2x2, called EVO-2x2-3D (implemented in NetLogo 3-D Preview 1), where the three dimensions of the strategy space (PC, PC/C, and PC/D) are explicitly represented. This is the only difference between EVO-2x2-3D and EVO-2x2: EVO-2x2-3D represents players in the PC–PC/C–PC/D 3-dimensional strategy space, while EVO-2x2 displays the projection of such a space on the PC/C–PC/D plane (Figure 2). In Figure 2, the sphere (in the left-hand image) and its circular projection (in the right-hand image) indicate population averages.
Figure 2. Representation of players in the strategy space using EVO-2x2-3D (left) and EVO-2x2 (right). The
image on the right shows the top-down projection of the representation on the left.
The cells in the background of the 2-dimensional projections of the strategy space are coloured in shades of blue according to the number of players that have spent some time on them. Each player that has visited a certain part of the strategy space leaves a mark that is used to create the density plots shown in Figure 2. The more players who have stayed for longer in a certain area, the darker its shade of blue.
2.3. Exploration of the parameter space The rationale behind EVO-2x2 was to conduct a systematic exploration of the impact of various competing assumptions. An exploration of the parameter space is something that can be easily conducted within NetLogo using a tool called BehaviorSpace. This tool allows the user to set up and run experiments. Running an experiment consists in running a model many times, systematically varying the model’s settings and recording the results of each model run. The problem when undertaking experiments that involve large parameter sweepings is to organise, analyse, and summarise the vast amount of information obtained from them so the results can be meaningfully interpreted. To do that, we have created a set of supporting scripts (written in Perl and Mathematica) that are able to read in the definition of the experiment setup and all its results in the format used by NetLogo. The output of these scripts is:
• an automatically generated directory structure that reflects all the combinations of parameter values explored in the experiment (e.g. /100/random-pairings/roulette-wheel/0.001/…/), and
• a customisable summary of the results of each model run, which is placed in the appropriate folder. An example of a useful summary of the results produced in a simulation run is the accumulated frequency of different types of strategies throughout the course of a simulation run. This is something that can be plotted in a 3D contour plot, and in complementary 2D density plots, as shown in Figure 3. The relationship between the 3D contour plot and the accompanying 2D density plots is sketched in Figure 4.

Figure 3. Example of a graphical summary of the results obtained with EVO-2x2. This figure is automatically
created and placed in the appropriate folder by the supporting scripts.
Figure 4. Sketch showing the relationship between the 3D contour plot and the accompanying 2D density plots
created by the supporting scripts.
PC/C
PC/D
PC
PC/D
PC/D PC/C
PC PC
PC/C
2.4. Implementation details EVO-2x2 has been implemented in NetLogo 3.0.2 (Wilensky, 1999). We also provide a 3-D version of EVO-2x2, called EVO-2x2-3D, which has been implemented in NetLogo 3-D Preview 1 (Wilensky, 1999).
3. The Evolutionary Emergence of Tit-For-Tat In this section we illustrate the usefulness of EVO-2x2 by applying it to advance our formal understanding of the evolution of cooperation in social dilemmas (Dawes, 1980). Specifically, we aim to determine what behavioural traits are likely to emerge and be sustained under evolutionary pressures in the Prisoner’s Dilemma (PD). To do this rigorously, we have run many computer simulations (effectively many different models) aimed at addressing the same question: “In a population of individuals who interact with each other by repeatedly playing the PD, what strategies are likely to emerge and be sustained under evolutionary pressures?”.
3.1. Background The first study aimed to answer this question was conducted by Axelrod (1987). Axelrod had previously organised two open tournaments in which the participant strategies played an iterated PD in a round robin fashion (Axelrod, 1984). Tit for Tat (TFT) was the winner in both tournaments, and also in an ecological analysis that Axelrod (1984) conducted after the tournaments. This ecological analysis consisted in studying the evolution of the strategies entered in the tournaments using the replicator dynamics, or proportional fitness rule, without mutation. Encouraged by these results, Axelrod (1987) investigated the generality of TFT’s success by studying the evolution of a randomly generated population of strategies (as opposed to the arguably arbitrary set of strategies submitted to the tournament) using a particular genetic algorithm. The set of possible strategies in this study consisted of all deterministic strategies able to consider the 3 preceding actions by both players. From this study, Axelrod (1987) concluded: “So the evolving social environment led to a pattern of decreased cooperation and decreased effectiveness, followed by a complete reversal based upon an evolved ability to discriminate between those who will reciprocate cooperation and those who will not. As the reciprocators do well, they spread in the population, resulting in more and more cooperation and greater and greater effectiveness”. The generality of Axelrod’s study (1987) is doubtful for two reasons: (1) he used a very specific set of assumptions, the impact of which was not tested, and (2) even if we constrain the scope of his conclusions to his particular model, the results should not be trusted since Axelrod only conducted 10 runs of 50 generations each. As a matter of fact, Binmore (1994, p. 202; 1998) cites unpublished work by Probst (1996) that contradicts Axelrod’s results. In a more comprehensive fashion, Linster (1992) studied the evolution of strategies that can be implemented by two-state Moore machines in the infinitely repeated PD. He found a strategy called GRIM remarkably successful. In particular, GRIM was significantly more successful than TFT. GRIM always cooperates until the opponent defects, in which case it switches to defection forever. Linster (1992) attributed the success of GRIM over TFT to the fact that GRIM is able to exploit poor strategies while TFT is not. Linster’s investigation was truly remarkable at its time, but technology has advanced remarkably since then, and we are now in a position to expand his work significantly by conducting parameter explorations beyond what was possible before. As an example, note that Linster (1992) could only consider deterministic strategies and one specific value for the mutation rate; furthermore, in the cases he studied where the dynamics were not deterministic, there is no guarantee that his simulations had reached its asymptotic behaviour. Since Linster’s work (1992), a number of studies on the evolution of cooperation in the repeated PD have investigated the impact of various alternative assumptions (see sections 2 and 4 in the review conducted by Gotts et al. (2003)). Some of these investigations have considered finite vs. infinite populations (Imhof et al., 2005; Nowak et al., 2004; Taylor et al., 2004), different pairing settings or population structures (see section 6 in Gotts et al. (2003)), deterministic vs. stochastic strategies (Nowak and Sigmund, 1990; Nowak and Sigmund, 1992), and finite vs. infinitely repeated games (Nowak and Sigmund, 1995). However, mainly due to analytical and technological limitations, most of these studies have had to be conducted in a somewhat disorganised and arbitrary way. EVO-2x2 aims to facilitate a more consistent and systematic exploration of competing assumptions within one single framework.
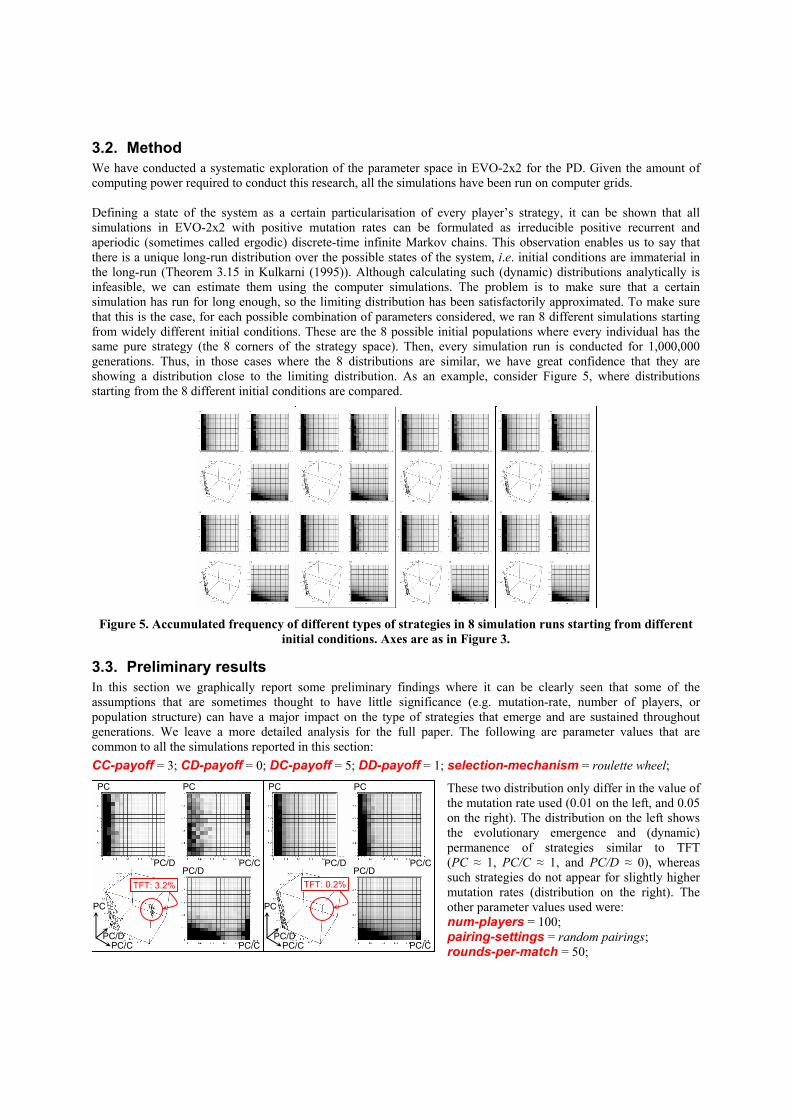
3.2. Method We have conducted a systematic exploration of the parameter space in EVO-2x2 for the PD. Given the amount of computing power required to conduct this research, all the simulations have been run on computer grids. Defining a state of the system as a certain particularisation of every player’s strategy, it can be shown that all simulations in EVO-2x2 with positive mutation rates can be formulated as irreducible positive recurrent and aperiodic (sometimes called ergodic) discrete-time infinite Markov chains. This observation enables us to say that there is a unique long-run distribution over the possible states of the system, i.e. initial conditions are immaterial in the long-run (Theorem 3.15 in Kulkarni (1995)). Although calculating such (dynamic) distributions analytically is infeasible, we can estimate them using the computer simulations. The problem is to make sure that a certain simulation has run for long enough, so the limiting distribution has been satisfactorily approximated. To make sure that this is the case, for each possible combination of parameters considered, we ran 8 different simulations starting from widely different initial conditions. These are the 8 possible initial populations where every individual has the same pure strategy (the 8 corners of the strategy space). Then, every simulation run is conducted for 1,000,000 generations. Thus, in those cases where the 8 distributions are similar, we have great confidence that they are showing a distribution close to the limiting distribution. As an example, consider Figure 5, where distributions starting from the 8 different initial conditions are compared.
Figure 5. Accumulated frequency of different types of strategies in 8 simulation runs starting from different
initial conditions. Axes are as in Figure 3.
3.3. Preliminary results In this section we graphically report some preliminary findings where it can be clearly seen that some of the assumptions that are sometimes thought to have little significance (e.g. mutation-rate, number of players, or population structure) can have a major impact on the type of strategies that emerge and are sustained throughout generations. We leave a more detailed analysis for the full paper. The following are parameter values that are common to all the simulations reported in this section: CC-payoff = 3; CD-payoff = 0; DC-payoff = 5; DD-payoff = 1; selection-mechanism = roulette wheel;
These two distribution only differ in the value of the mutation rate used (0.01 on the left, and 0.05 on the right). The distribution on the left shows the evolutionary emergence and (dynamic) permanence of strategies similar to TFT (PC ≈ 1, PC/C ≈ 1, and PC/D ≈ 0), whereas such strategies do not appear for slightly higher mutation rates (distribution on the right). The other parameter values used were: num-players = 100; pairing-settings = random pairings; rounds-per-match = 50; PC/C
PC/D
PC
PC/C
PC/C PC/D
PC/D
PC PC
PC/C PC/D
PC
PC/C
PC/C PC/D
PC/D
PC PC
TFT: 3.2% TFT: 0.2%

These two distributions only differ in the number of players in the population (100 on the left, and 10 on the right). The distribution on the left shows the evolutionary emergence and (dynamic) permanence of strategies similar to TFT (PC ≈ 1, PC/C ≈ 1, and PC/D ≈ 0), whereas such strategies do not appear in smaller populations (distribution on the right). The other parameter values used were: pairing-settings = random pairings; rounds-per-match = 50; mutation-rate = 0.01;
These two distributions only differ in the algorithm used to form the pairs of players (random pairings on the left, and children together on the right). The difference in the type of strategies that emerge in each case is obvious. On the left, strategies tend to be strongly uncooperative (PC ≈ 0, PC/C ≈ 0, and PC/D ≈ 0), while the distribution on the right is concentrated around strategies similar to TFT. The other parameter values used were: num-players = 100; mutation-rate = 0.01; rounds-per-match = 5;
4. Acknowledgements We would like to thank Edoardo Pignotti for his great help setting up the simulations. We also gratefully acknowledge financial support from the Scottish Executive Environment and Rural Affairs Department.
5. References Axelrod, R., 1984. The Evolution of Cooperation. Basic Books, USA. Axelrod, R., 1987. The Evolution of Strategies in the Iterated Prisoner’s Dilemma. In Davis, L. (Ed.) Genetic Algorithms and Simulated
Annealing, 32-41. London: Pitman; Los Altos, CA: Morgan Kaufman. Reprinted in Axelrod, R., 1997. The complexity of cooperation. Agent-based models of competition and collaboration. Princeton, NJ: Princeton University Press.
Binmore, K., 1994. Playing Fair: Game Theory and the Social Contract I. MIT Press, Cambridge, MA. Binmore, K., 1998. Review of the book: The Complexity of Cooperation: Agent-Based Models of Competition and Collaboration, by Axelrod, R.,
Princeton, NJ: Princeton University Press, 1997. Journal of Artificial Societies and Social Simulation, 1 (1) http://jasss.soc.surrey.ac.uk/1/1/review1.html.
Dawes, R. M., 1980. Social Dilemmas. Annu. Rev. Psychol. 31, 169-193. Gotts, N. M., Polhill, J. G., and Law, A. N. R., 2003. Agent-based simulation in the study of social dilemmas. Artificial Intelligence Review, 19
(1), 3-92. Imhof, L. A., Fudenberg, D., and Nowak M. A., 2005. Evolutionary cycles of cooperation and defection. Proceedings of the National Academy of
Sciences USA, 102 (31), 10797-10800. Kulkarni, V. G., 1995. Modelling and Analysis of Stochastic Systems. Boca Raton, Florida: Chapman & Hall/CRC. Linster, B. 1992. Evolutionary stability in the repeated Prisoners' Dilemma played by two-state Moore machines. Southern Economic Journal, 58,
880-903. Nowak, M. A., and Sigmund K., 1990. The evolution of stochastic strategies in the Prisoners’ Dilemma. Acta Applicandae Mathematicae, 20,
247-265. Nowak, M. A., and Sigmund K., 1992. Tit for tat in heterogeneous populations. Nature, 355, 250-253. Nowak, M. A., Sasaki, A., Taylor, C., and Fudenberg, D., 2004. Emergence of cooperation and evolutionary stability in finite populations. Nature,
428, 646-650. Nowak, M. A., and Sigmund K., 1995. Invasion Dynamics of the Finitely Repeated Prisoner’s Dilemma. Games and Economic Behavior, 11 (2),
364-390. Probst, D., 1996. On Evolution and Learning in Games. PhD thesis, University of Bonn. Taylor, C., Fudenberg, D., Sasaki, A., and Nowak, M. A., 2004. Evolutionary Game Dynamics in Finite Populations. Bulletin of Mathematical
Biology, 66, 1621–1644. Weibull, J. W., 1995. Evolutionary Game Theory. MIT Press. Wilensky, U., 1999. NetLogo. http://ccl.northwestern.edu/netlogo/. Center for Connected Learning and Computer-Based Modeling, Northwestern
University, Evanston, IL, 1999.
PC/C PC/D
PC
PC/C
PC/C PC/D
PC/D
PC PC
PC/C PC/D
PC
PC/C
PC/C PC/D
PC/D
PC PC
TFT: 0.3%
PC/C PC/D
PC
PC/C
PC/C PC/D
PC/D
PC PC
PC/C PC/D
PC
PC/C
PC/C PC/D
PC/D
PC PC
TFT: 2% TFT: 41%
ALLD: 74% ALLD: 0.03%
TFT: 3.2%