Evidence from Pre-Qin Coin Analyses
27
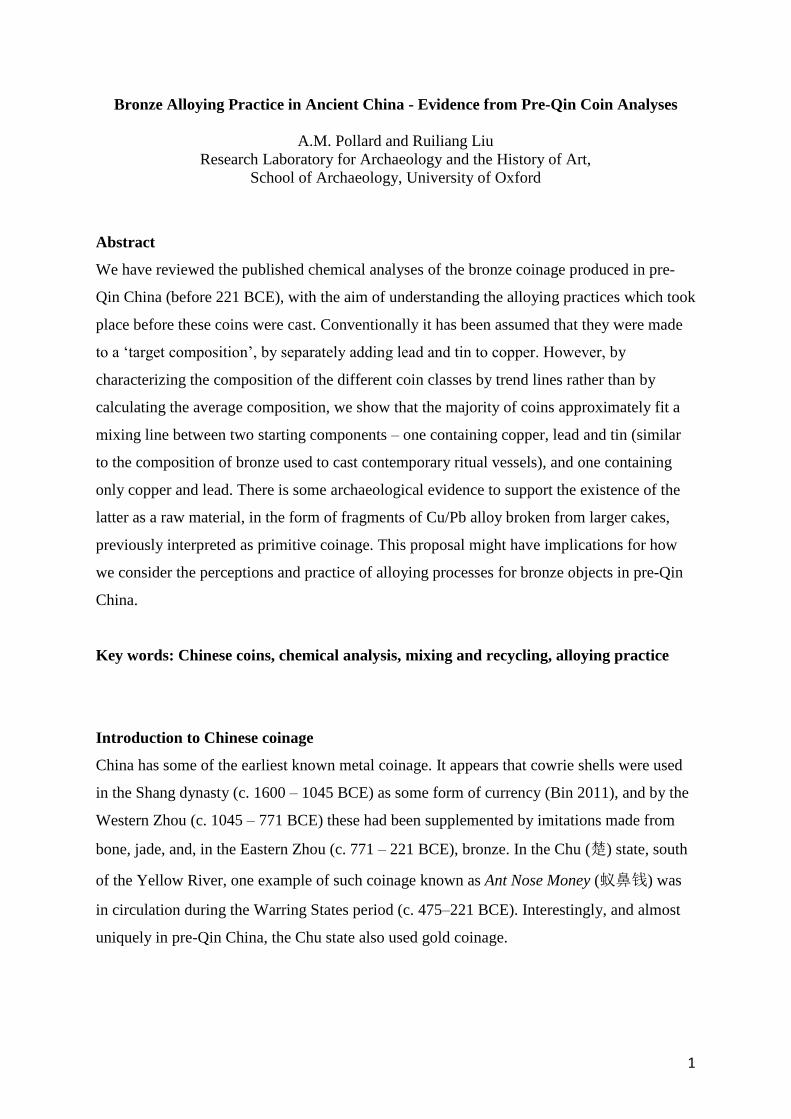
1 Bronze Alloying Practice in Ancient China - Evidence from Pre-Qin Coin Analyses A.M. Pollard and Ruiliang Liu Research Laboratory for Archaeology and the History of Art, School of Archaeology, University of Oxford Abstract We have reviewed the published chemical analyses of the bronze coinage produced in pre- Qin China (before 221 BCE), with the aim of understanding the alloying practices which took place before these coins were cast. Conventionally it has been assumed that they were made to a ‘target composition’, by separately adding lead and tin to copper. However, by characterizing the composition of the different coin classes by trend lines rather than by calculating the average composition, we show that the majority of coins approximately fit a mixing line between two starting components – one containing copper, lead and tin (similar to the composition of bronze used to cast contemporary ritual vessels), and one containing only copper and lead. There is some archaeological evidence to support the existence of the latter as a raw material, in the form of fragments of Cu/Pb alloy broken from larger cakes, previously interpreted as primitive coinage. This proposal might have implications for how we consider the perceptions and practice of alloying processes for bronze objects in pre-Qin China. Key words: Chinese coins, chemical analysis, mixing and recycling, alloying practice Introduction to Chinese coinage China has some of the earliest known metal coinage. It appears that cowrie shells were used in the Shang dynasty (c. 1600 – 1045 BCE) as some form of currency (Bin 2011), and by the Western Zhou (c. 1045 – 771 BCE) these had been supplemented by imitations made from bone, jade, and, in the Eastern Zhou (c. 771 – 221 BCE), bronze. In the Chu (楚) state, south of the Yellow River, one example of such coinage known as Ant Nose Money (蚁鼻钱) was in circulation during the Warring States period (c. 475–221 BCE). Interestingly, and almost uniquely in pre-Qin China, the Chu state also used gold coinage.
-
Upload
khangminh22 -
Category
Documents
-
view
2 -
download
0
Transcript of Evidence from Pre-Qin Coin Analyses
1
Bronze Alloying Practice in Ancient China - Evidence from Pre-Qin Coin Analyses
A.M. Pollard and Ruiliang Liu
Research Laboratory for Archaeology and the History of Art,
School of Archaeology, University of Oxford
Abstract
We have reviewed the published chemical analyses of the bronze coinage produced in pre-
Qin China (before 221 BCE), with the aim of understanding the alloying practices which took
place before these coins were cast. Conventionally it has been assumed that they were made
to a ‘target composition’, by separately adding lead and tin to copper. However, by
characterizing the composition of the different coin classes by trend lines rather than by
calculating the average composition, we show that the majority of coins approximately fit a
mixing line between two starting components – one containing copper, lead and tin (similar
to the composition of bronze used to cast contemporary ritual vessels), and one containing
only copper and lead. There is some archaeological evidence to support the existence of the
latter as a raw material, in the form of fragments of Cu/Pb alloy broken from larger cakes,
previously interpreted as primitive coinage. This proposal might have implications for how
we consider the perceptions and practice of alloying processes for bronze objects in pre-Qin
China.
Key words: Chinese coins, chemical analysis, mixing and recycling, alloying practice
Introduction to Chinese coinage
China has some of the earliest known metal coinage. It appears that cowrie shells were used
in the Shang dynasty (c. 1600 – 1045 BCE) as some form of currency (Bin 2011), and by the
Western Zhou (c. 1045 – 771 BCE) these had been supplemented by imitations made from
bone, jade, and, in the Eastern Zhou (c. 771 – 221 BCE), bronze. In the Chu (楚) state, south
of the Yellow River, one example of such coinage known as Ant Nose Money (蚁鼻钱) was
in circulation during the Warring States period (c. 475–221 BCE). Interestingly, and almost
uniquely in pre-Qin China, the Chu state also used gold coinage.

2
The later pre-Imperial period of China had several forms of coinage, in addition to the
familiar circular coins. The earliest appears to be the Hollow handled spade (布币), which
has the form of an agricultural implement (including the hollow socket to which a handle
could in principle be attached), but is too insubstantial to have been functional. This link with
agricultural tools is, however, significant. Writing in the late second or early first century
BCE, Sima Qian (司马迁; c. 145 – 86 BCE), the Grand Historian of the Western Han
(Watson 1961: vol. 2, p. 83), said:
“When the farmers, the artisans and the merchants first began to exchange articles
among themselves, that was when currency came into being – tortoise shells and sea
shells, gold and copper coins, knife-shaped money and spade-shaped money. Thus
its origin is very old.”
Prototype Hollow-handled spade money was originally the same size and shape as the
original tools, and has been reported from Shang and Western Zhou tombs (Harthill 2005).
The first inscriptions on the blade of the spade can be dated to around 700 BCE. The form
subsequently evolved and the size was reduced. Recognized types include square shoulder
spades, sloping shoulder spades and pointed shoulder spades. The hollow handle form was
subsequently replaced by a completely flat form, which also showed a variety of shapes,
including arched foot, pointed foot and square foot spades. Several of these shapes are
associated with different states during the Warring States period, such as the pointed foot
with the Zhou state, covering modern Shanxi and Hebei provinces. From the inscriptions on
the spade coins, it has proved possible to identify a number of specific ‘mints’, or at least the
locations of the city where they were cast (Harthill 2005).
Another characteristic form of pre-Qin coinage is the knife money (刀币), which copy the
form of knives known to be in use during the Zhou dynasty. Several shapes have been
identified, such as Qi knives, which are related to the Qi state during the Warring States, and
are found in modern Shandong province. Others include Yan (pointed tip) knives, identified
with the Yan state in north-east China, Needle tip knives (with longer points than Yan) from
modern Hebei province, and Ming knives, named from the inscription on the blade, rather
than from the much later Ming dynasty. Moulds for Ming knives have been found in the
Beijing area and Shandong province, in the Yan state area (Li 1987). The final major
category of pre-Imperial coinage is the circular coin, often with a square hole in the centre,
3
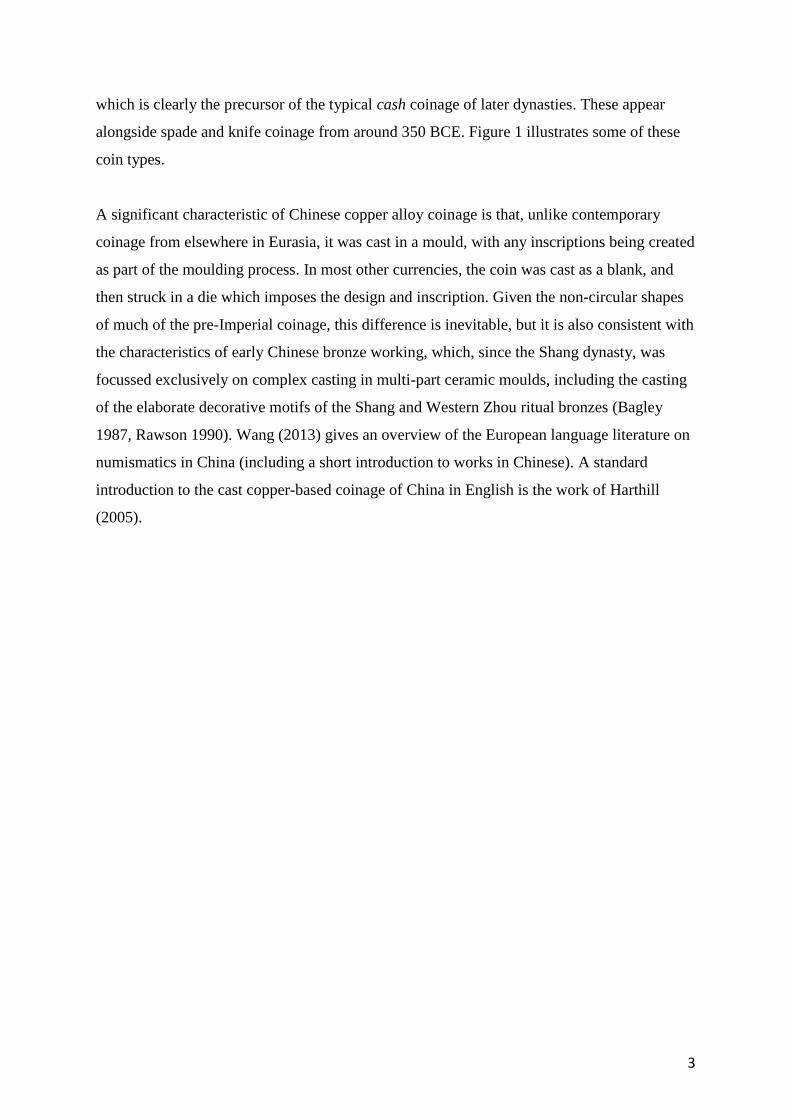
which is clearly the precursor of the typical cash coinage of later dynasties. These appear
alongside spade and knife coinage from around 350 BCE. Figure 1 illustrates some of these
coin types.
A significant characteristic of Chinese copper alloy coinage is that, unlike contemporary
coinage from elsewhere in Eurasia, it was cast in a mould, with any inscriptions being created
as part of the moulding process. In most other currencies, the coin was cast as a blank, and
then struck in a die which imposes the design and inscription. Given the non-circular shapes
of much of the pre-Imperial coinage, this difference is inevitable, but it is also consistent with
the characteristics of early Chinese bronze working, which, since the Shang dynasty, was
focussed exclusively on complex casting in multi-part ceramic moulds, including the casting
of the elaborate decorative motifs of the Shang and Western Zhou ritual bronzes (Bagley
1987, Rawson 1990). Wang (2013) gives an overview of the European language literature on
numismatics in China (including a short introduction to works in Chinese). A standard
introduction to the cast copper-based coinage of China in English is the work of Harthill
(2005).
4
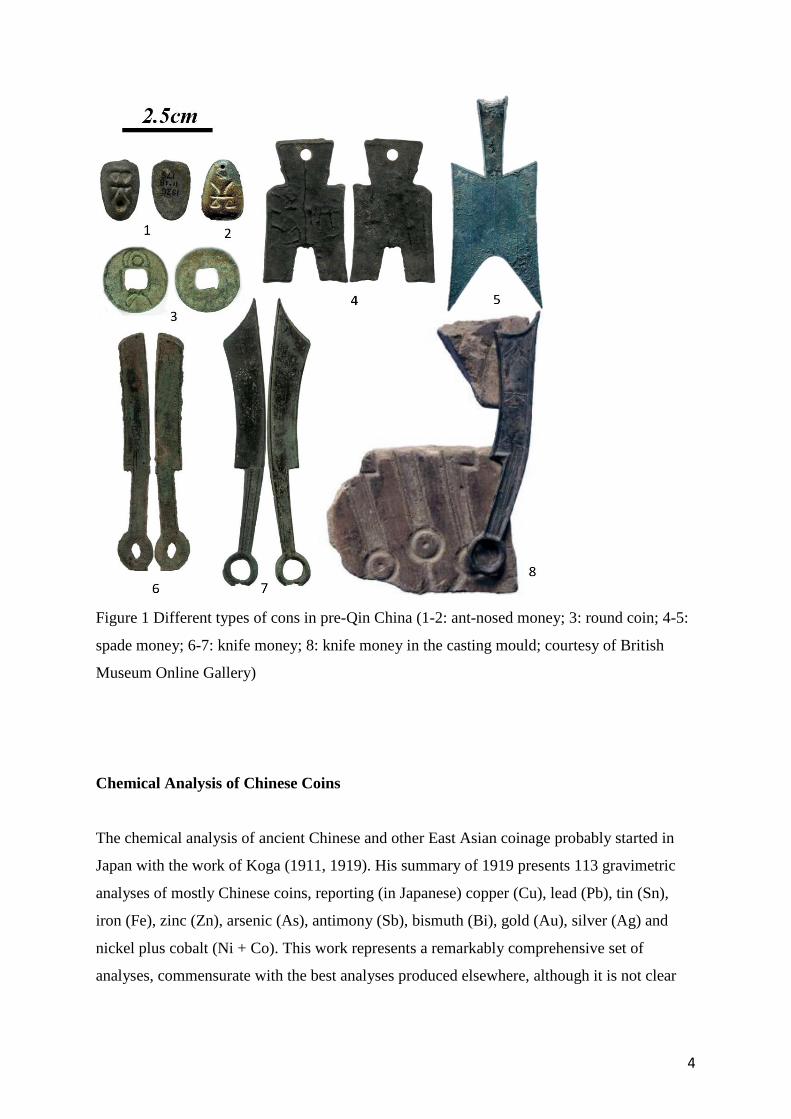
Figure 1 Different types of cons in pre-Qin China (1-2: ant-nosed money; 3: round coin; 4-5:
spade money; 6-7: knife money; 8: knife money in the casting mould; courtesy of British
Museum Online Gallery)
Chemical Analysis of Chinese Coins
The chemical analysis of ancient Chinese and other East Asian coinage probably started in
Japan with the work of Koga (1911, 1919). His summary of 1919 presents 113 gravimetric
analyses of mostly Chinese coins, reporting (in Japanese) copper (Cu), lead (Pb), tin (Sn),
iron (Fe), zinc (Zn), arsenic (As), antimony (Sb), bismuth (Bi), gold (Au), silver (Ag) and
nickel plus cobalt (Ni + Co). This work represents a remarkably comprehensive set of
analyses, commensurate with the best analyses produced elsewhere, although it is not clear

5
whether the corrosion was removed before analysis. Many subsequent analyses of Chinese
coinage report a much more restrictive range of elements, sometimes only Cu, Pb and Sn.
Table S1 gives a list of 40 publications which contain analyses of Chinese copper-based
copper coinage of all periods, many of which have been transcribed into the database
(Chinese Coins) available at http://flame.arch.ox.ac.uk/public-resources/. Although the total
number of analyses tabulated here is 4763, the total number of individual coins analysed will
be less than this, since there are a number of compilations which republish previous data. The
most comprehensive data source for the analysis of Chinese coinage is that of Zhou (2004),
which reports 1250 new analyses, plus a further c. 700 from 20 other publications. The new
analyses in this paper are by X-ray fluorescence (XRF), and the data are not normalized. The
average analytical total for the new XRF data is 97.4%. In western scholarship, the largest
contribution is that of the British Museum (Wang et al. 2005), which collects c. 700 analyses
from earlier Museum publications (Bowman et al. 1989, Cowell et al. 1993, Cowell and
Wang 1998) and adds more illustrations and commentary. The majority of the British
Museum data are collected by XRF (divided into those in which the surface was abraded
before analysis (XRFA: n = 421, average analytical total 99.8%), and those which were
unabraded (XRFU: n = 85, average analytical total 99.9%)) The remainder (n = 60) were
done by atomic absorption spectrometry (AAS), in which copper was not directly
determined. Many of the publications listed in Table S1 have been reproduced in a summary
volume (Zhou and Dai 2002), which republishes 28 papers in Chinese and 12 in English.
It is inevitable that, by using a chemical database compiled from data acquired over a period
of many decades, the quality of the data will be variable. This disadvantage has to be offset
against the benefit of having a much larger database, and, providing that the data are
interpreted cautiously, we believe that such a database can still prove useful. This is
extensively discussed in Pollard et al. (2018, chapter 3), which concludes that, by restricting
the questions to those that can be addressed using suitable robust numerical approaches (i.e.,
those which are unlikely to be sensitive to underlying variations in data quality), such
heterogeneous datasets can still be useful (see also Liu 2016 chapter 3). The most likely
source of inconsistency is in the comparison of trace element data. In the work presented
here, we have only used large-scale variations in the major element data (copper, tin and
lead) and are therefore satisfied that the data are sufficiently robust to draw the conclusions
set out below.
6
Alloying of Pre-Qin Coinage
Many of the papers listed in Table S1 include discussions of the compositions of the various
categories of Pre-Qin coinage, but almost all of the discussion of these coins is based on
producing average compositions for each class of coin. A cursory glance shows that the three
main alloying elements (Cu, Sn and Pb) vary widely, even within a specific type of coinage,
so that a simple average does not adequately characterize the nature of the metal. For
example, in Zhou’s compilation of c. 500 pre-Qin coins (Zhou 2004), the copper ranges from
0.1 to 99.31%, the lead from 0.19 to 95.65%, and the tin from 0 to 18.8%. In order to
determine the alloying practices for the manufacture of these coins (by which we mean the
way in which the constituent metals are mixed at the point of casting, Pollard et al. 2019), we
have chosen to look at trend lines, rather than averages.
Table S1 lists the total number of analyses of pre-Qin coins in each of the published papers
(c. 1200), but many are repeated in subsequent publications. For this study (apart from the
earliest period) we have mostly chosen to rely on the data compiled by Zhou Weirong (2004),
who lists the analyses of 520 pre-Qin coins. This is because these coins are catalogued in a
systematic way (in some of the earlier publications, such coins are often too poorly described
to assign them confidently to a particular type), and it also reproduces most of the useable
data produced before 2004. Subsequent publications (e.g., Wang et al. 2005) add very little
additional data for the pre-Qin period (in this case, only 6 coins).
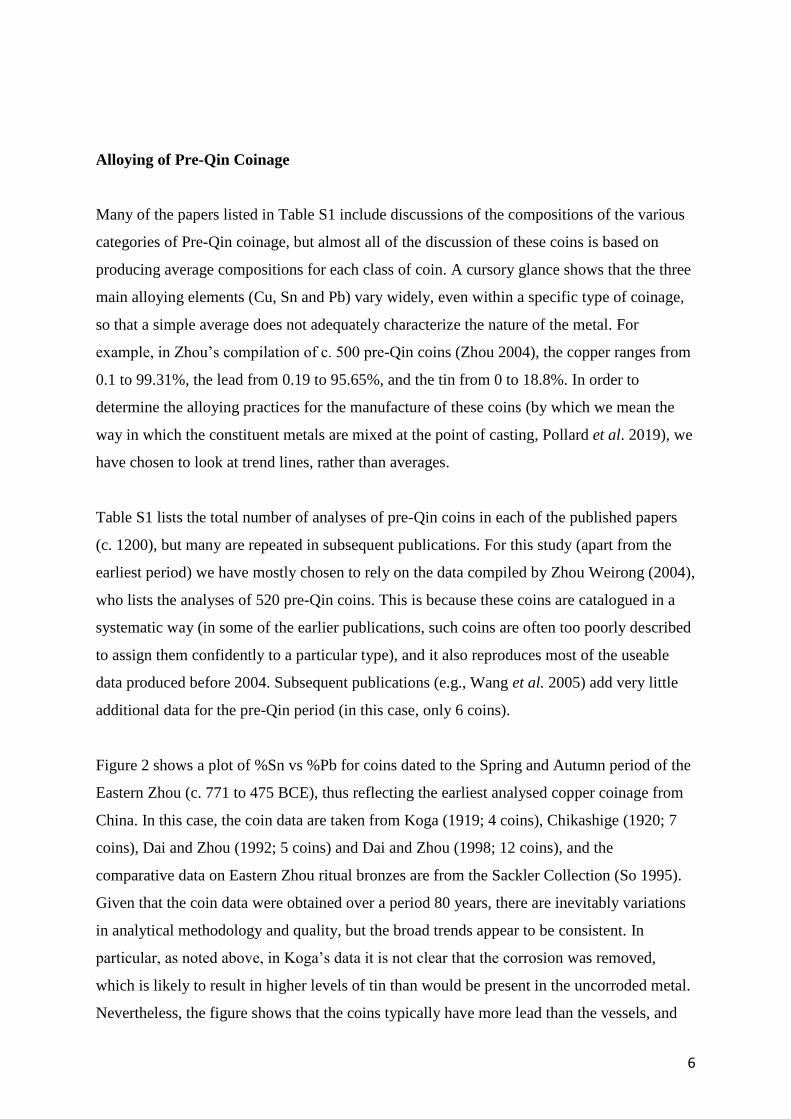
Figure 2 shows a plot of %Sn vs %Pb for coins dated to the Spring and Autumn period of the
Eastern Zhou (c. 771 to 475 BCE), thus reflecting the earliest analysed copper coinage from
China. In this case, the coin data are taken from Koga (1919; 4 coins), Chikashige (1920; 7
coins), Dai and Zhou (1992; 5 coins) and Dai and Zhou (1998; 12 coins), and the
comparative data on Eastern Zhou ritual bronzes are from the Sackler Collection (So 1995).
Given that the coin data were obtained over a period 80 years, there are inevitably variations
in analytical methodology and quality, but the broad trends appear to be consistent. In
particular, as noted above, in Koga’s data it is not clear that the corrosion was removed,
which is likely to result in higher levels of tin than would be present in the uncorroded metal.
Nevertheless, the figure shows that the coins typically have more lead than the vessels, and
7
that 15 of the coins contain significant tin (>5%), whereas 13 have tin below 2%, with many
recorded as zero. The maximum level of tin in the coins reaches about 18% (but see previous
comment), which is very similar to the highest tin seen in the vessels, but the lead
concentration reaches c. 55% in the coins, whereas the maximum in the vessels is c. 32%.
The significance of the existence of coins with less than 2% tin is discussed below.
Figure 2. %Pb vs %Sn for Eastern Zhou vessels (c. 771–256 BCE) and Spring and Autumn
period (c. 771 to 475 BCE) coins (sources as in text).
In the subsequent Warring States period (c. 475–221 BCE), Zhou (2004) presents data on
four broad classes of coin:
i. Spade coins (布币), divided into Hollow handle spades (21 coins), pointed-foot and
similar square foot spades (17), square foot spades (27) and arched-foot spades (55),
and other spades (4).
ii. Knife coins (刀币), divided into Yan knives (178), Qi knives (35), Straight knives
(16) and other knives (6);
iii. Ant nosed money (蚁鼻钱), associated with the Chu state;
iv. Round coins, divided into Yi hua (19), Banliang and Liangzao (13), Yuanzi (4), and
Min yue (2).
0
2
4
6
8
10
12
14
16
18
20
0 10 20 30 40 50 60
%Sn
%Pb
Vessels
Coins

8
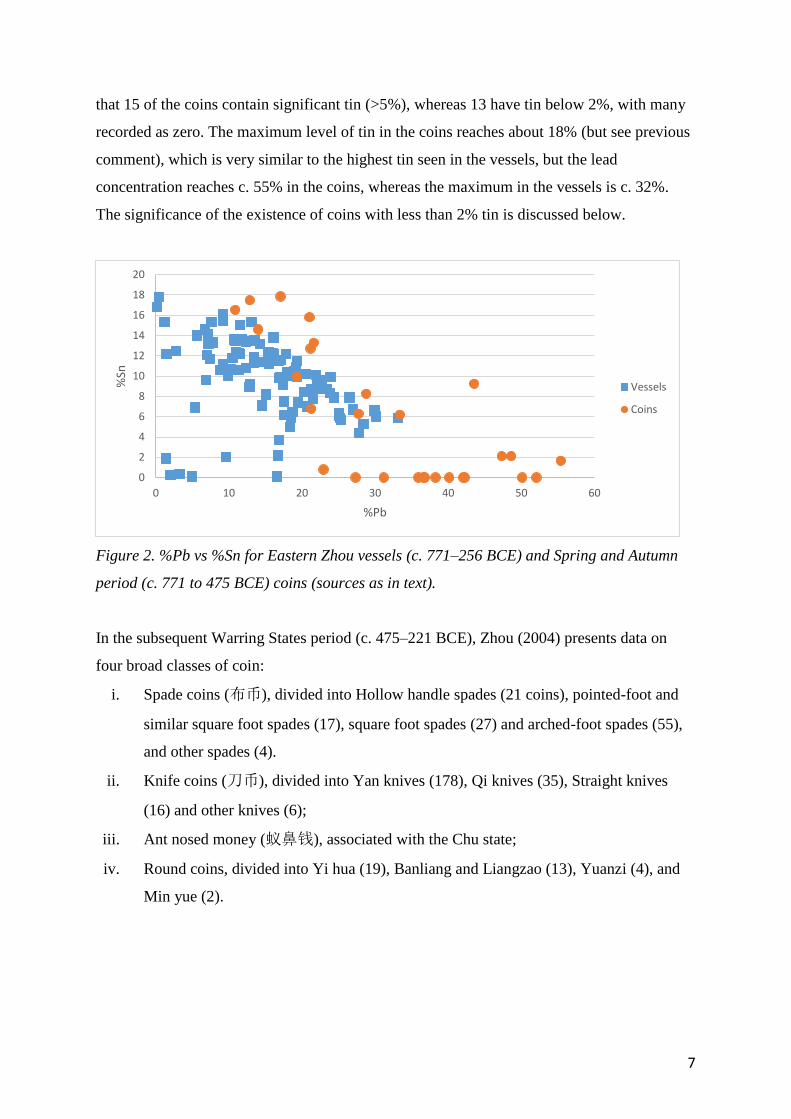
Figure 3. Plots of %Sn vs %Pb for a) spade coins, b) knife coins, c) ant-nosed money and d)
round coins. Data re-plotted from Zhou (2004).
Figure 3 show plots of %Sn vs %Pb for each of these categories, divided into the various sub-
categories as given by Zhou (2004). As noted above, some of these sub-categories can be
explicitly associated with particular States (e.g., Qi and Yan knives), so the categorization
shown in Fig 3 is also a first approximation to a regional categorization. A striking feature,
seen most clearly in the knife coins, is the strong anti-correlation between tin and lead. It is
clear from this figure that an average composition for, say, the Yan knives, would be an
inadequate description of their composition as a group, and it is best described by a trend
line, reflecting a linear relationship between lead and tin, discussed further below. At first
glance, the figure for the spade coins (Fig. 3a) shows a different structure, but this resolved in
Figure 4, in which the arched-foot spades are plotted separately from the others. This shows
that the majority of spade coins fit the general pattern of an anti-correlation between tin and
lead, with the arched-foot spades (associated with the Wei State) behaving differently. The
significance of this in terms of possible alloying practice is discussed below.
0
2
4
6
8
10
12
14
16
18
20
0 20 40 60 80
%Sn
%Pb
a)Spades
Hollowhandlespades
Pointed-footspades
Squarefootspades
Archedfootspades
Otherspades0
2
4
6
8
10
12
14
16
18
20
0 20 40 60 80
%Sn
%Pb
b)Knifecoins
Yanknives
Qiknives
Straightknives
Otherknives
0
2
4
6
8
10
12
14
16
18
20
0 10 20 30 40 50 60 70 80 90
%Sn
%Pb
c)Ant-nosedmoney
0
2
4
6
8
10
12
14
16
18
20
0 20 40 60 80%Sn
%Pb
d)RoundCoins
Yihua
BanliangandLiangzao
Yuanzi
Mingyue
9
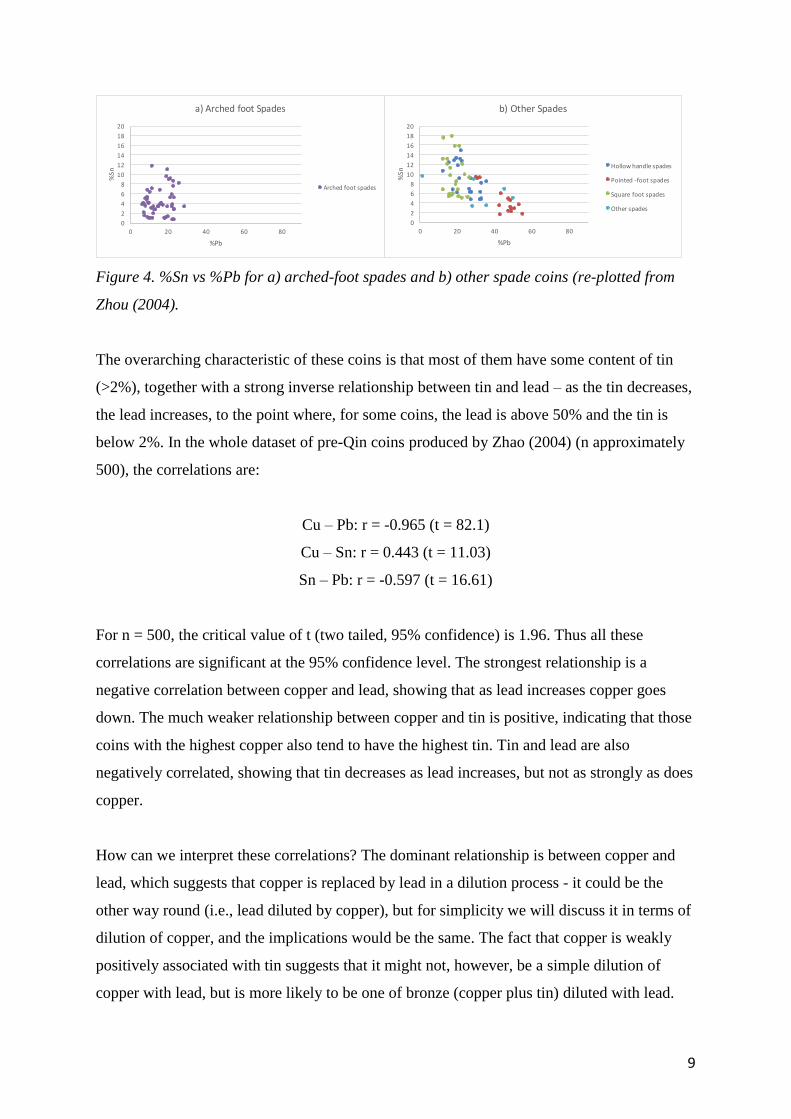
Figure 4. %Sn vs %Pb for a) arched-foot spades and b) other spade coins (re-plotted from
Zhou (2004).
The overarching characteristic of these coins is that most of them have some content of tin
(>2%), together with a strong inverse relationship between tin and lead – as the tin decreases,
the lead increases, to the point where, for some coins, the lead is above 50% and the tin is
below 2%. In the whole dataset of pre-Qin coins produced by Zhao (2004) (n approximately
500), the correlations are:
Cu – Pb: r = -0.965 (t = 82.1)
Cu – Sn: r = 0.443 (t = 11.03)
Sn – Pb: r = -0.597 (t = 16.61)
For n = 500, the critical value of t (two tailed, 95% confidence) is 1.96. Thus all these
correlations are significant at the 95% confidence level. The strongest relationship is a
negative correlation between copper and lead, showing that as lead increases copper goes
down. The much weaker relationship between copper and tin is positive, indicating that those
coins with the highest copper also tend to have the highest tin. Tin and lead are also
negatively correlated, showing that tin decreases as lead increases, but not as strongly as does
copper.
How can we interpret these correlations? The dominant relationship is between copper and
lead, which suggests that copper is replaced by lead in a dilution process - it could be the
other way round (i.e., lead diluted by copper), but for simplicity we will discuss it in terms of
dilution of copper, and the implications would be the same. The fact that copper is weakly
positively associated with tin suggests that it might not, however, be a simple dilution of
copper with lead, but is more likely to be one of bronze (copper plus tin) diluted with lead.
0
2
4
6
8
10
12
14
16
18
20
0 20 40 60 80
%Sn
%Pb
a)ArchedfootSpades
Archedfootspades
0
2
4
6
8
10
12
14
16
18
20
0 20 40 60 80
%Sn
%Pb
b)OtherSpades
Hollowhandlespades
Pointed-footspades
Squarefootspades
Otherspades

10
The negative correlation between lead and tin rules out the possibility of the simple dilution
of copper with a lead-tin alloy (in which case lead and tin would be positively correlated).
We further note that if we are correct in assuming that the process is a dilution of a bronze
with lead, then those coins with the highest values of tin and the lowest values of lead should
approximate the composition of the the bronze component before the lead is added.
Inspection of Figs. 2, 3 and 4 suggests that the highest tin values in the pre-Qin coinage are
around 18%, and the corresponding lead value is around 15%. This composition is close to
that of the Eastern Zhou ritual vessels with the highest tin values – shown in Figure 1 to be
approximately 10% lead, 18% tin and 72% copper. For the purposes of the modelling
described below, we assume that this might reflect the composition of the undiluted raw
‘stock bronze’. This does not necessarily imply that coins were made from ‘recycled’ ritual
vessels (although that could be true), simply that the stock bronze alloy for coins was similar
to that used for making ritual bronzes.
The majority of the coins lie on a curve which suggests that this stock metal has been diluted
with lead, explaining the gradual decrease in tin and increase in lead. Figure 5 shows the
effect on the tin and lead of some modelled mixing to simulate this situation. The starting
point for this model is arbitrarily chosen to be an alloy of composition 80% Cu, 15% Sn and
5% Pb, to which increasing proportions of a diluent are added and the compositions re-
normalised. The proportions of diluent are calculated step-wise from 0, +10% (by weight
relative to the original mass), +20% (relative to original mass), and so on up to +1000%,
which corresponds to an addition of ten times the weight of diluent compared to the original
sample. In Figure 5 a number of diluting materials have been modelled - pure Pb, 50/50
Pb/Sn, 90/10 Pb/Sn and 50/50 Cu/Pb. The numerical data for the models concerning pure
lead and 50/50 Cu/Pb are given in the Appendix.
11
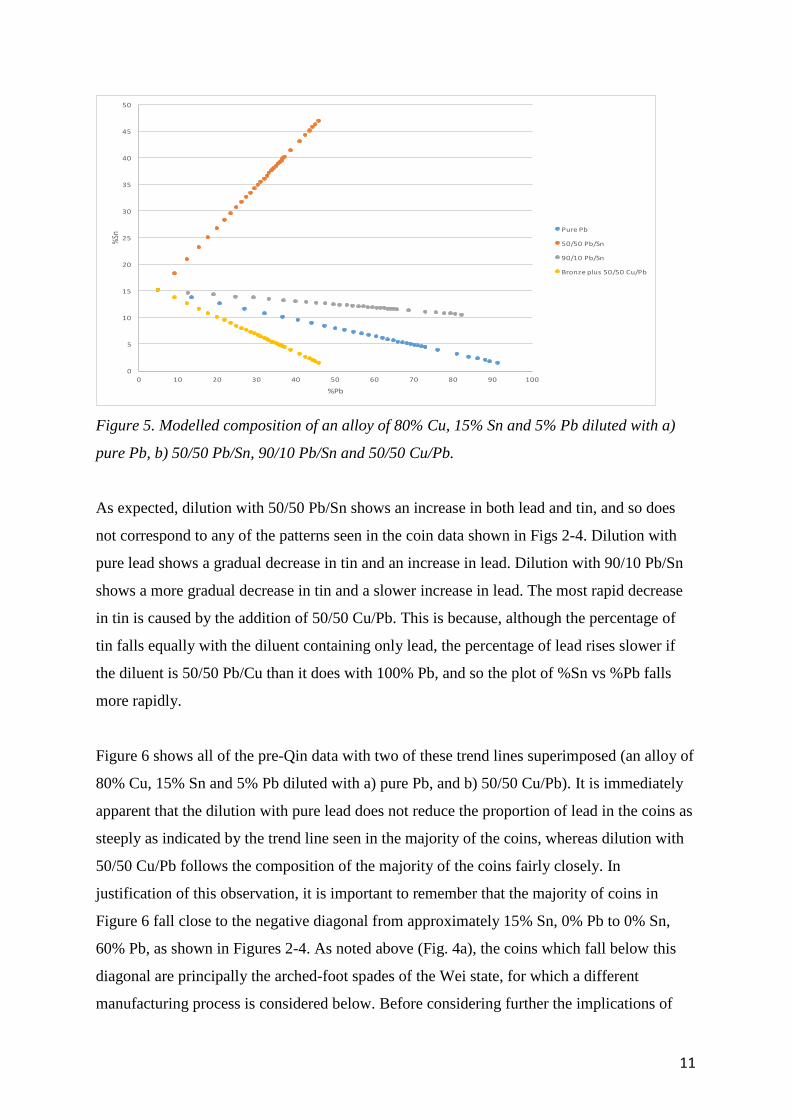
Figure 5. Modelled composition of an alloy of 80% Cu, 15% Sn and 5% Pb diluted with a)
pure Pb, b) 50/50 Pb/Sn, 90/10 Pb/Sn and 50/50 Cu/Pb.
As expected, dilution with 50/50 Pb/Sn shows an increase in both lead and tin, and so does
not correspond to any of the patterns seen in the coin data shown in Figs 2-4. Dilution with
pure lead shows a gradual decrease in tin and an increase in lead. Dilution with 90/10 Pb/Sn
shows a more gradual decrease in tin and a slower increase in lead. The most rapid decrease
in tin is caused by the addition of 50/50 Cu/Pb. This is because, although the percentage of
tin falls equally with the diluent containing only lead, the percentage of lead rises slower if
the diluent is 50/50 Pb/Cu than it does with 100% Pb, and so the plot of %Sn vs %Pb falls
more rapidly.
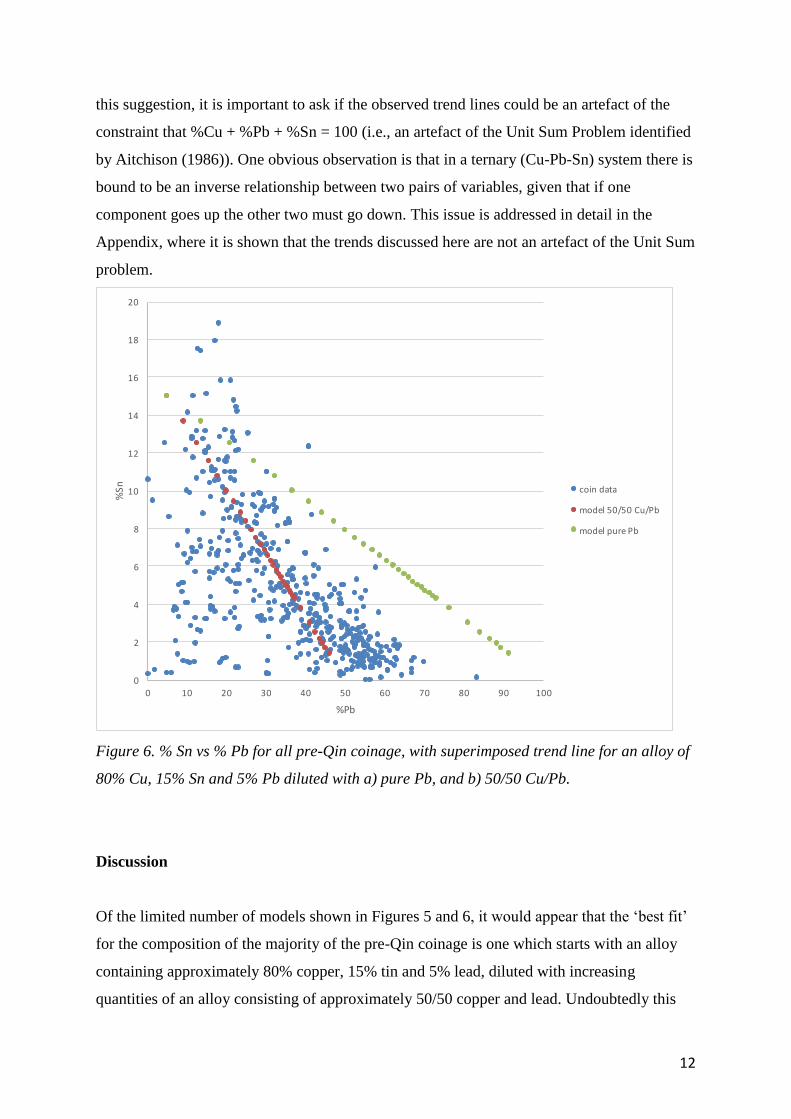
Figure 6 shows all of the pre-Qin data with two of these trend lines superimposed (an alloy of
80% Cu, 15% Sn and 5% Pb diluted with a) pure Pb, and b) 50/50 Cu/Pb). It is immediately
apparent that the dilution with pure lead does not reduce the proportion of lead in the coins as
steeply as indicated by the trend line seen in the majority of the coins, whereas dilution with
50/50 Cu/Pb follows the composition of the majority of the coins fairly closely. In
justification of this observation, it is important to remember that the majority of coins in
Figure 6 fall close to the negative diagonal from approximately 15% Sn, 0% Pb to 0% Sn,
60% Pb, as shown in Figures 2-4. As noted above (Fig. 4a), the coins which fall below this
diagonal are principally the arched-foot spades of the Wei state, for which a different
manufacturing process is considered below. Before considering further the implications of
0
5
10
15
20
25
30
35
40
45
50
0 10 20 30 40 50 60 70 80 90 100
%Sn
%Pb
PurePb
50/50Pb/Sn
90/10Pb/Sn
Bronzeplus50/50Cu/Pb
12
this suggestion, it is important to ask if the observed trend lines could be an artefact of the
constraint that %Cu + %Pb + %Sn = 100 (i.e., an artefact of the Unit Sum Problem identified
by Aitchison (1986)). One obvious observation is that in a ternary (Cu-Pb-Sn) system there is
bound to be an inverse relationship between two pairs of variables, given that if one
component goes up the other two must go down. This issue is addressed in detail in the
Appendix, where it is shown that the trends discussed here are not an artefact of the Unit Sum
problem.
Figure 6. % Sn vs % Pb for all pre-Qin coinage, with superimposed trend line for an alloy of
80% Cu, 15% Sn and 5% Pb diluted with a) pure Pb, and b) 50/50 Cu/Pb.
Discussion
Of the limited number of models shown in Figures 5 and 6, it would appear that the ‘best fit’
for the composition of the majority of the pre-Qin coinage is one which starts with an alloy
containing approximately 80% copper, 15% tin and 5% lead, diluted with increasing
quantities of an alloy consisting of approximately 50/50 copper and lead. Undoubtedly this
0
2
4
6
8
10
12
14
16
18
20
0 10 20 30 40 50 60 70 80 90 100
%Sn
%Pb
coindata
model50/50Cu/Pb
modelpurePb

13
modelling could and should be improved (by altering the starting composition and the ratio of
copper to lead in the diluent for each class of coin) to give a better fit to the data, but that is
not the primary purpose of this paper. The aim here is simply to show an alternative way of
viewing the alloying practices which might have given rise to the data, without assuming that
the aim was to conform to specific target compositions. For the majority of pre-Qin coin
types, the data are consistent with a simple two component dilution model between a stock
bronze (Cu/Pb/Sn) and a leaded copper (Cu/Pb).
Figure 7. Correlation structure for Arched-foot spade coins a) %Sn vs %Pb, b) %Sn vs %Cu,
c) %Pb vs %Cu
One major group of coins which does not conform to this model are, as noted above (Fig. 4a),
the arched-foot spades, associated with the Wei state during the Warring States period (n
approximately 50). These seem to have been made to a different ‘recipe’. The correlation
structure within this group of coins is quite different from that shown by the main body of
data, as shown in Figure 7. Here all three correlations are shown, and tabulating the
correlation data shown in these three figures gives the following:
Cu – Pb: r = -0.752 (t = 8.07)
0
2
4
6
8
10
12
14
0 5 10 15 20 25 30
%Sn
%Pb
a)%Pbvs%Sn
0
2
4
6
8
10
12
14
60 65 70 75 80 85 90
%Sn
%Cu
b)%Snvs%Cu
0
5
10
15
20
25
30
60 65 70 75 80 85 90
%Pb
%Cu
c)%Pbvs%Cu
14
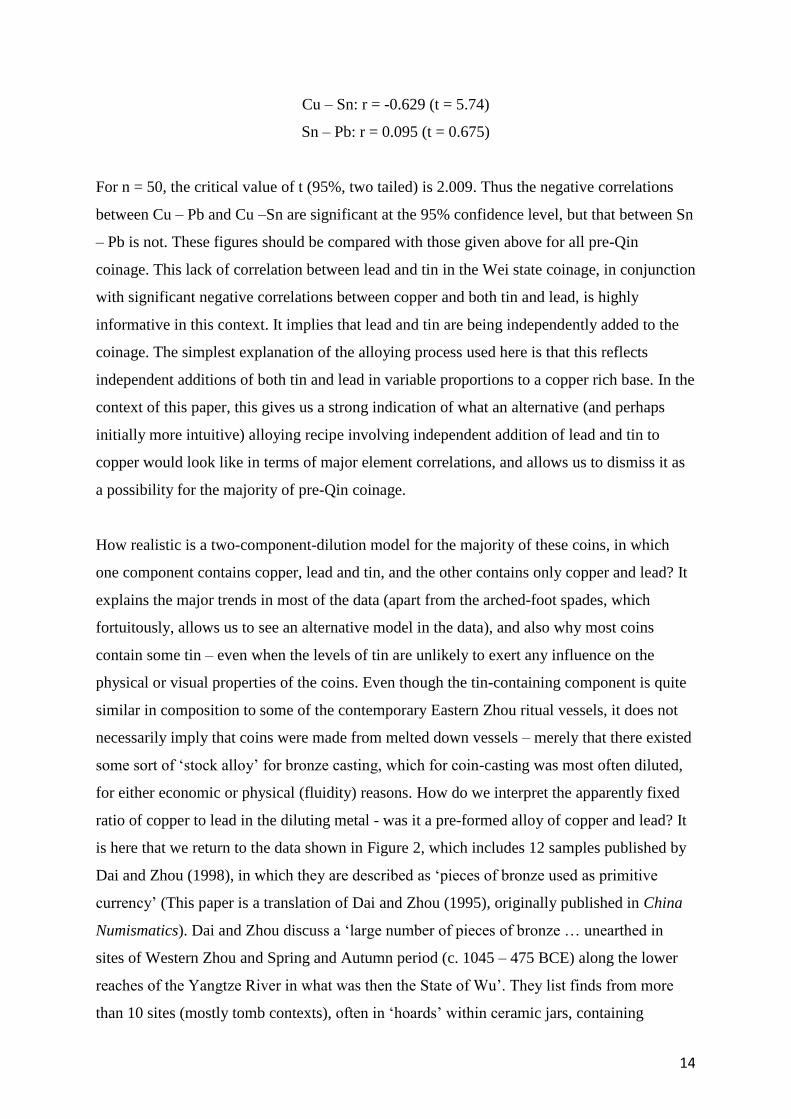
Cu – Sn: r = -0.629 (t = 5.74)
Sn – Pb: r = 0.095 (t = 0.675)
For n = 50, the critical value of t (95%, two tailed) is 2.009. Thus the negative correlations
between Cu – Pb and Cu –Sn are significant at the 95% confidence level, but that between Sn
– Pb is not. These figures should be compared with those given above for all pre-Qin
coinage. This lack of correlation between lead and tin in the Wei state coinage, in conjunction
with significant negative correlations between copper and both tin and lead, is highly
informative in this context. It implies that lead and tin are being independently added to the
coinage. The simplest explanation of the alloying process used here is that this reflects
independent additions of both tin and lead in variable proportions to a copper rich base. In the
context of this paper, this gives us a strong indication of what an alternative (and perhaps
initially more intuitive) alloying recipe involving independent addition of lead and tin to
copper would look like in terms of major element correlations, and allows us to dismiss it as
a possibility for the majority of pre-Qin coinage.
How realistic is a two-component-dilution model for the majority of these coins, in which
one component contains copper, lead and tin, and the other contains only copper and lead? It
explains the major trends in most of the data (apart from the arched-foot spades, which
fortuitously, allows us to see an alternative model in the data), and also why most coins
contain some tin – even when the levels of tin are unlikely to exert any influence on the
physical or visual properties of the coins. Even though the tin-containing component is quite
similar in composition to some of the contemporary Eastern Zhou ritual vessels, it does not
necessarily imply that coins were made from melted down vessels – merely that there existed
some sort of ‘stock alloy’ for bronze casting, which for coin-casting was most often diluted,
for either economic or physical (fluidity) reasons. How do we interpret the apparently fixed
ratio of copper to lead in the diluting metal - was it a pre-formed alloy of copper and lead? It
is here that we return to the data shown in Figure 2, which includes 12 samples published by
Dai and Zhou (1998), in which they are described as ‘pieces of bronze used as primitive
currency’ (This paper is a translation of Dai and Zhou (1995), originally published in China
Numismatics). Dai and Zhou discuss a ‘large number of pieces of bronze … unearthed in
sites of Western Zhou and Spring and Autumn period (c. 1045 – 475 BCE) along the lower
reaches of the Yangtze River in what was then the State of Wu’. They list finds from more
than 10 sites (mostly tomb contexts), often in ‘hoards’ within ceramic jars, containing
15
between 1 and 150 kg of metal. The form is described as pieces resulting from the breakage
(or cutting) of ‘large bronze cakes with different shape and weight’; the pieces themselves
weigh between 10 g and 1 kg. Crucially, they contain copper and lead, but no tin - they have
a range of compositions, but the average is 60% Cu and 40% Pb. Dai and Zhou (1998) argue
that they are deliberately made (since the lead is much higher than would be expected by
accidental smelting of a copper ore containing traces of lead), but that they were not the raw
materials for bronze casting (since they contain no tin). Their composition is at the extreme
(high lead/low tin) end of the range of analysed pre-Qin coinage, and so they conclude that
they were ‘deliberately made to be used as a primitive currency.’ Here we endorse this
interpretation, but suggest a significant extension to this conclusion – that these ‘primitive
lumps’ are in fact one of the two raw materials used to make coinage – the ‘diluting metal’
(without tin) added to a ‘stock bronze’ (containing tin). If this is true, it poses a number of
archaeological and numismatic questions:
i) Why use two pre-prepared alloys rather than three pure metals? Potentially it
simplifies the preparation of the alloy before casting, requiring only two
components rather than three. It would consequently require less metallurgical
skill to prepare the casting alloy, but might be more related to the control and
supply of raw materials rather than any skill limitations on behalf of the coin
producers.
ii) It poses significant questions about how the production of coins was organized.
The apparent ubiquity of the practice (over several States and several hundred
years) strongly suggests some unified practical approach to casting coins, which is
unlikely to be the consequence of a large number of privately-owned mints.
Equally importantly, why was the practice in the Wei state during the Warring
States period different? – arched-foot spade coins appear to have been made by
independent additions of lead and tin to copper.
iii) How did the metal economy work? Where were the sources of the raw materials,
where were the two raw material ingots created, and how were they supplied to
numerous mints? How much do the data reflect recycling of coinage, perhaps with
dilution, against the use of new metal?
These questions can only be answered by further archaeological and chemical research on a
wider range of coins and coin production sites in pre-Qin China.
16
Conclusion
A study of the chemistry of pre-Qin coinage, focussing on correlations between elements
rather than considering averages, has suggested that the composition of the majority of coin
types can be explained by a model in which a ‘stock bronze’ (of approximate composition 70
– 80 % copper, 5 - 10% lead and 15 – 20% tin) is diluted with an alloy containing
approximately equal weights of copper and lead. Importantly, the Wei State arched-foot
spades show a completely different chemical correlation structure, which probably represents
the direct and independent addition of lead and tin to copper, and which allows us to
eliminate this as a model for the majority of pre-Qin coins. Consideration of the ‘Unit Sum’
problem has shown that these trend lines are not an artefact of the compositional constraint,
and a series of numerical simulations show the plausibility of a binary model. The physical
evidence for a two-component model comes from the observation that there is a similarity
between the composition of the most tin-rich coins and those contemporary Eastern Zhou
ritual vessels with the highest tin, suggesting the existence of a ‘stock bronze’ containing
copper, lead and tin, which is diluted to make most coins. The evidence for the binary Cu/Pb
diluent in this ‘recipe’ comes from a reconsideration of a small number of analyses of early
‘primitive lumps’ from the Wu State, which are irregular fragments of copper-lead cakes,
previously interpreted as primitive coinage. Perhaps further archaeological research focussing
on known sites of coin casting in other States may help to support or refute this interpretation.
If this model proves to be plausible, however, it leads to further speculation about the
possible ‘recipes’ for bronze casting more generally in pre-Qin China, given the similarity
seen between coins and ritual vessels in Figure 2. Is it possible that even ritual bronzes were
cast using an alloy constituted from a mixture of two basic raw materials – one containing
copper plus tin and lead, and one containing only copper and lead? This question requires a
re-consideration of the existing chemical data on pre-Qin Chinese bronzes.
Acknowledgement
This work is funded by European Research Council Horizon 2020 (ERC advanced project
FLAME, Flow of Ancient Metal Across Eurasia, 670010).

17
References
AITCHISON, J., The Statistical Analysis of Compositional Data. Blackburn Press, Caldwell,
NJ (1986). (reprinted 2003).
BAGLEY, R.W., Shang Ritual Bronzes in the Arthur M. Sackler Collections. Arthur M.
Sackler Foundation, Washington, D.C. (1987).
BIN YANG, The rise and fall of cowrie shells: The Asian story. Journal of World History 22,
1-25 (2011).
BOWMAN, S.E., COWELL, M.R. and CRIBB, J., Two thousand years of coinage in China:
an analytical survey. Journal of the Historical Metallurgy Society 23(1), 25-30 (1989).
CHIKASHIGE, M., The composition of ancient eastern bronzes. Journal of the Chemical
Society 117, 917-922 (1920).
COWELL, M. and WANG, H., Metal supply for the metropolitan coinage of the Kangxi
period (1662–1721). Numismatic Chronicle 158, 185–196 (1998).
COWELL, M.R., CRIBB, J., BOWMAN, S.G.E and SHASHOUA, Y., The Chinese cash:
composition and production. In Archibald, M.M. and Cowell, M.R. (eds.), Metallurgy and
Numismatics 3, pp.185-198, Royal Numismatic Society Special Publication 24, London
(1993).
DAI ZHIQIANG and ZHOU WEIRONG, 中国早期的称量货币:青铜─长江下游地区出
土青铜块的科学验证 (The weighting currency of China in the early time: bronze - a
scientific test to the bronze lumps excavated from lower reaches of Yangtze River).
Zhongguo qianbi (China Numismatics) 1995(2), 3-7 (1995).

18
DAI ZHIQIANG and ZHOU WEIRONG, A study of the pieces of bronze used as primitive
currency in Ancient China. In Oddy, A. and Cowell, M. (eds.), Metallurgy in Numismatics 4,
pp. xx-yy, RNS Special Publication 30, London (1998).
DAI ZHIQIANG and ZHOU WEIRONG, Studies of the alloy composition of more than two
thousand years of Chinese coins (5th century BC–20th century AD). Journal of the Historical
Metallurgy Society 26(2), 45-55 (1992).
HARTILL, D., Cast Chinese Coins. A Historical Catalogue (Victoria BC: Trafford Pub-
lishing, 2005).
KOGA, N., A table of the Chemical analysis of old Japanese and Chinese copper coins
assayed by Mr. Koga. Kokogaku Zasshi (Journal of the Archaeological Society of Nippon)
9(7), 35-52 (1919).
KOGA, N., Chemical composition of ancient coins. Suiyōkai shi (Journal of mining and
metallurgy, Kyoto) 1, 517 (1911).
LI, L., The discovery for the Yan knife moulds at Chengde, Hebei. Kaogu 1987(6): 196.
LIU, R., Capturing changes: applying the Oxford system to further understand the movement
of metal in Shang China, DPhil Thesis, University of Oxford (2016).
POLLARD, A.M., BRAY, P., CUÉNOD, A., HOMMEL, P., HSU, Y.-K., PERUCCHETTI,
L., POUNCETT, J. and LIU, R., Beyond Provenance: New Approaches to Interpreting the
Chemistry of Archaeological Copper Alloys. Leiden University Press, Leiden (2018).
POLLARD, A. M., LIU, R., RAWSON, J., and Tang, X. From alloy composition to alloying
practice: Chinese bronzes. Archaeometry, 61(1), 70-82,(2019)..
RAWSON, J., Western Zhou Ritual Bronzes from the Arthur M. Sackler Collections. Arthur
M. Sackler Foundation, Washington, D.C. (1990).
19
SO, J., Eastern Zhou ritual bronzes in the Arthur M. Sackler Collections, Arthur M. Sackler
Foundation, Washington, DC. (1995).
WANG, H., A short history of Chinese numismatics in European languages. Early China 35,
395-429 (2013).
WANG, H., COWELL, M., CRIBB, J. and BOWMAN, S. (eds.), Metallurgical Analysis of
Chinese Coins at the British Museum. British Museum Research Publications 152, London
(2005).
WATSON, B., Records of the Grand Historian of China (Sima Qian). Columbia University
Press, New York (1961). (2 vols.).
ZHOU WEIRONG and DAI ZHIQIANG, Qianbixue yu yezhu shi luncong (Papers on
Numismatics and the History of Metallurgy). Zhonghua shuju, Beijing (2002).
ZHOU WEIRONG, Zhongguo gudai qianbi hejin chengfen yanjiu (Chinese Coins. Alloy
Composition and Metallurgical Research). Zhongghua shiju, Beijing (2004).

20
Appendix: The ‘Unit Sum’ Problem
It is important to know whether the trends discussed here are real and not an artefact of
the bound nature of what is essentially a ternary system in which %Cu + %Pb + %Sn = 100.
This ‘Unit Sum’ problem has been recognized for many years as a potential issue when
dealing with chemical compositional data - the fact that major element compositional data
is constrained to add up to 100% leads inevitably to an interdependence between the
constituent elements. Aitchison (1986, xiii) has stated that the interpretation of such data is
‘fraught with danger’. In summary, the unit sum problem can be explained as follows. The
simple definition of the concentration of a component expressed as a percentage involves
not only the concentration of that particular element, but also the sum of the
concentrations of all other elements, i.e., in a ternary copper, lead and tin alloy, the
percentage of copper is calculated as:
wt % Cu= [Cu]
[Cu]+[Pb]+[Sn] × 100
where square brackets denote the determined weight of each element. Generalizing,
wt% Cu= [Cu]
∑ [all elements]× 100
or
wt% Cu = 𝑓[𝑎𝑙𝑙 𝑒𝑙𝑒𝑚𝑒𝑛𝑡𝑠]
This inevitably leads to correlations between elemental concentrations arising from this
constraint. This has been pointed out systematically since 1982, particularly in relation to
the interpretation of geochemical data (Aitchison 1982, 1984, 1999; Aitchison et al. 2000).
In 1986, Aitchison proposed the use of logratos to counter these problems, by generating
variables that are independent of each other. It should be noted that this use of logratios
has been challenged (Tangri and Wright 1993) (but rebutted in Aitchison et al. 2002), or at
least met with a degree of caution (Baxter et al. 2005) in the statistical world, and in many
areas of geochemistry the unit sum problem continues to be ignored. It is also true to say
that it has been widely adopted as a means of avoiding the problem by a number of
21
tephrochronologists (e.g., Stokes and Lowe 1988, Stokes et al. 1992, Pollard et al. 2006),
who rely on making chemical comparisons between groups of vitreous tephra sherds.
Aitchison (1986) proposed the use of a number of different logratios to address particular
problems:
i) the natural log of all possible component ratios;
ii) the natural log of the ratio of all other components to a common component;
iii) the natural log of the ratio of all component values to the geometric mean of all
components in a particular sample (the ‘centred logratio’).
In order to investigate whether the trend lines observed in this study of Chinese pre-Qin
coinages are an artefact of the Unit Sum Problem, we have used approach ii) to decouple
the variables. In the case of an (approximately) ternary system (where %Cu + %Pb + %Sn =
100), this gives the relatively simple approach of calculating ln(Pb/Cu) and ln(Sn/Cu), which
can then be plotted as a bivariate scattergram.
Figure 1 shows a plot of % Pb vs % Sn for all of the pre-Qin coinage, together with the
modelled data for an alloy composed of 80% Cu, 15% Sn and 5% Pb diluted with increasing
proportions of i) a mixture of 50/50 Cu/Pb and ii) pure Pb, as shown in Figure 5 of the text.
As noted in the text, this suggests that most of the data can be explained by dilution of a
‘stock’ bronze with 50/50 Cu/Pb, but not by simple additions of lead.

22
Figure 1. %Sn vs %Pb for all pre-Qin coinage, with superimposed trend line for an alloy of
80%Cu, 15%Sn and 10 %Pb diluted with a) pure Pb, and b) 50/50 Cu/Pb.
Figures 2 and 3 show the same data, but plotted as (Pb/Cu) vs (Sn/Cu) and ln(Pb/Cu) and
ln(Sn/Cu).
Figure 2. As Figure 1, but plotted as Pb/Cu vs Sn/Cu.
0
2
4
6
8
10
12
14
16
18
20
0 10 20 30 40 50 60 70 80 90 100
%Sn
%Pb
coindata
model50/50Cu/Pb
modelpurePb
0
0.05
0.1
0.15
0.2
0.25
0.3
0.35
0 1 2 3 4
Sn/C
u
Pb/Cu
coin data
model 50/50 Cu/Pb
model pure Pb
23
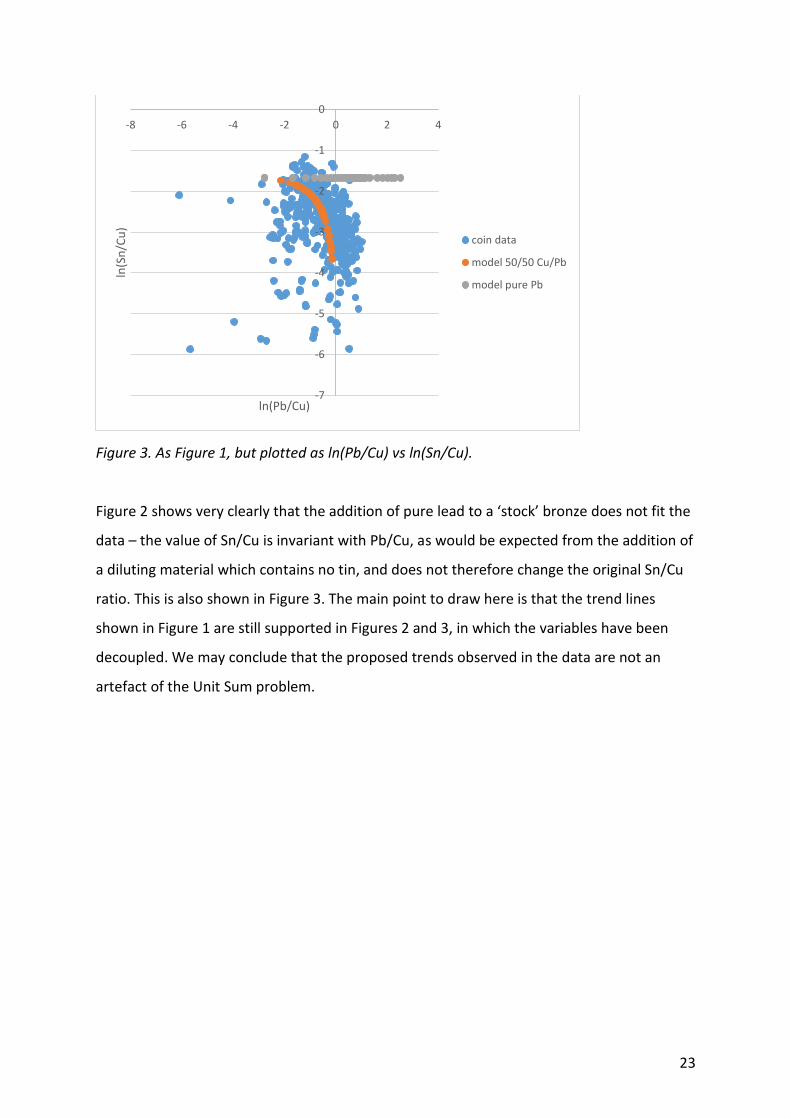
Figure 3. As Figure 1, but plotted as ln(Pb/Cu) vs ln(Sn/Cu).
Figure 2 shows very clearly that the addition of pure lead to a ‘stock’ bronze does not fit the
data – the value of Sn/Cu is invariant with Pb/Cu, as would be expected from the addition of
a diluting material which contains no tin, and does not therefore change the original Sn/Cu
ratio. This is also shown in Figure 3. The main point to draw here is that the trend lines
shown in Figure 1 are still supported in Figures 2 and 3, in which the variables have been
decoupled. We may conclude that the proposed trends observed in the data are not an
artefact of the Unit Sum problem.
-7
-6
-5
-4
-3
-2
-1
0
-8 -6 -4 -2 0 2 4ln
(Sn
/Cu
)
ln(Pb/Cu)
coin data
model 50/50 Cu/Pb
model pure Pb

24
Figure 4. The same data as Fig. 1, but plotted as a ternary (Cu-Pb-Sn) diagram.
Finally, Figure 4 shows a ternary (Cu-Pb-Sn) diagram of the same raw data as used to
produce Figure 1, together with the same two modelled dilution trends. Again this makes
clear that the primary effect for the majority of the data is best explained by a dilution with
with 50/50 Cu/Pb rather than with pure lead.
Each method of presentation has advantages. Figure 1 (plotting %Pb vs % Sn) is most easily
related to the original data, but does not account for concomitant changes in copper,
whereas Figures 2 and 3 are both more robust in terms of having independent axes and
presenting all the variables (since copper is included), but are less intuitive to interpret. The
ternary diagram (Figure 4) again presents all the data, but the diagrams are less easy to
draw. Hence, in this paper, we have chosen to present the data as in Figure 1.
References AITCHISON, J., The statistical analysis of compositional data. Journal of the Royal Statistical Society Series B – Methodology 44, 139–177 (1982). AITCHISON, J., The statistical analysis of geochemical compositions. Journal of the International Association for Mathematical Geology 16, 531–564 (1984).

25
AITCHISON, J., The Statistical Analysis of Compositional Data. Blackburn Press, Caldwell, NJ (1986). (reprinted 2003). AITCHISON, J., Logratios and natural laws in compositional data analysis. Mathematical Geology 31, 563–580 (1999). AITCHISON, J., BARCELÓ-VIDAL, C., MARTÍN-FERNÁNDEZ, J.A. and PAWLOWSKY-GLAHN, V., Logratio analysis and compositional distance. Mathematical Geology 32, 271–275 (2000). AITCHISON, J., BARCELÓ -VIDAL, C. and PAWLOWSKY-GLAHN, V., Some comments on compositional data analysis in archaeometry, in particular the fallacies in Tangri and Wright’s dismissal of logratio analysis. Archaeometry 44, 295–304 (2002). BAXTER, M.J., BEARDAH, C.C., COOL, H.E.M. and JACKSON, C.M., Compositional data analysis of some alkaline glasses. Mathematical Geology 37, 183–196 (2005). POLLARD, A.M., BLOCKLEY, S.P.E. and LANE, C.S., Some numerical considerations in the geochemical analysis of distal microtephra. Applied Geochemistry 21 1692-1714 (2006). STOKES, S. and LOWE, D.J., Discriminant Function Analysis of late Quaternary tephras from five volcanoes in New Zealand using glass shard major element chemistry. Quaternary Research 30, 270–283 (1988). STOKES, S., LOWE, D.J. and FROGGATT, P.C., Discriminant Function Analysis and correlation of late Quaternary rhyolithic tephra deposits from Taupo and Okataina volcanoes, New Zealand, using glass shard major element composition. Quaternary International 13-14, 103–117 (1992). TANGRI, D. and WRIGHT, R.V.S., Multivariate analysis of compositional data: applied comparisons favour standard principal components over Aitchison’s loglinear contrast method. Archaeometry 35, 103–112 (1993). Data Generated by Models
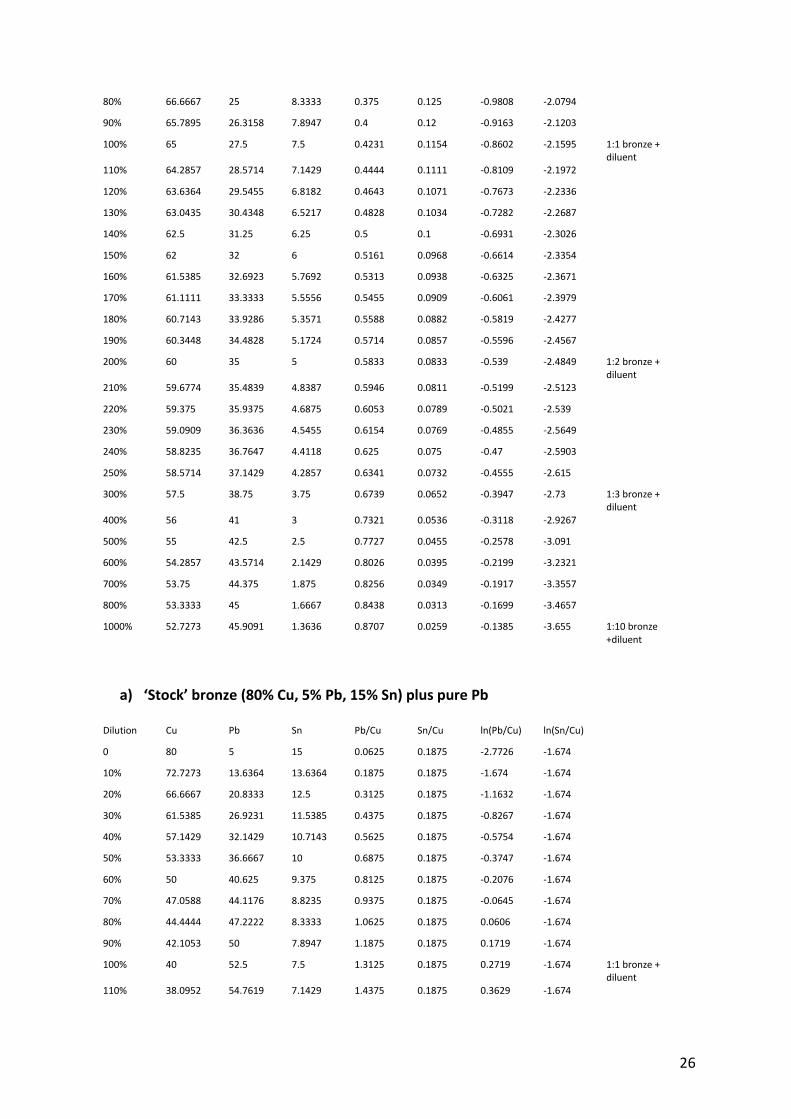
a) ‘Stock’ bronze (80% Cu, 5% Pb, 15% Sn) plus 50/50 Cu/Pb
Dilution Cu Pb Sn Pb/Cu Sn/Cu ln(Pb/Cu) ln(Sn/Cu)
0 80 5 15 0.0625 0.1875 -2.7726 -1.674
10% 77.2727 9.0909 13.6364 0.1176 0.1765 -2.1401 -1.7346
20% 75 12.5 12.5 0.1667 0.1667 -1.7918 -1.7918
30% 73.0769 15.3846 11.5385 0.2105 0.1579 -1.5581 -1.8458
40% 71.4286 17.8571 10.7143 0.25 0.15 -1.3863 -1.8971
50% 70 20 10 0.2857 0.1429 -1.2528 -1.9459
60% 68.75 21.875 9.375 0.3182 0.1364 -1.1451 -1.9924
70% 67.6471 23.5294 8.8235 0.3478 0.1304 -1.0561 -2.0369
26
80% 66.6667 25 8.3333 0.375 0.125 -0.9808 -2.0794
90% 65.7895 26.3158 7.8947 0.4 0.12 -0.9163 -2.1203
100% 65 27.5 7.5 0.4231 0.1154 -0.8602 -2.1595 1:1 bronze + diluent
110% 64.2857 28.5714 7.1429 0.4444 0.1111 -0.8109 -2.1972
120% 63.6364 29.5455 6.8182 0.4643 0.1071 -0.7673 -2.2336
130% 63.0435 30.4348 6.5217 0.4828 0.1034 -0.7282 -2.2687
140% 62.5 31.25 6.25 0.5 0.1 -0.6931 -2.3026
150% 62 32 6 0.5161 0.0968 -0.6614 -2.3354
160% 61.5385 32.6923 5.7692 0.5313 0.0938 -0.6325 -2.3671
170% 61.1111 33.3333 5.5556 0.5455 0.0909 -0.6061 -2.3979
180% 60.7143 33.9286 5.3571 0.5588 0.0882 -0.5819 -2.4277
190% 60.3448 34.4828 5.1724 0.5714 0.0857 -0.5596 -2.4567
200% 60 35 5 0.5833 0.0833 -0.539 -2.4849 1:2 bronze + diluent
210% 59.6774 35.4839 4.8387 0.5946 0.0811 -0.5199 -2.5123
220% 59.375 35.9375 4.6875 0.6053 0.0789 -0.5021 -2.539
230% 59.0909 36.3636 4.5455 0.6154 0.0769 -0.4855 -2.5649
240% 58.8235 36.7647 4.4118 0.625 0.075 -0.47 -2.5903
250% 58.5714 37.1429 4.2857 0.6341 0.0732 -0.4555 -2.615
300% 57.5 38.75 3.75 0.6739 0.0652 -0.3947 -2.73 1:3 bronze + diluent
400% 56 41 3 0.7321 0.0536 -0.3118 -2.9267
500% 55 42.5 2.5 0.7727 0.0455 -0.2578 -3.091
600% 54.2857 43.5714 2.1429 0.8026 0.0395 -0.2199 -3.2321
700% 53.75 44.375 1.875 0.8256 0.0349 -0.1917 -3.3557
800% 53.3333 45 1.6667 0.8438 0.0313 -0.1699 -3.4657
1000% 52.7273 45.9091 1.3636 0.8707 0.0259 -0.1385 -3.655 1:10 bronze +diluent
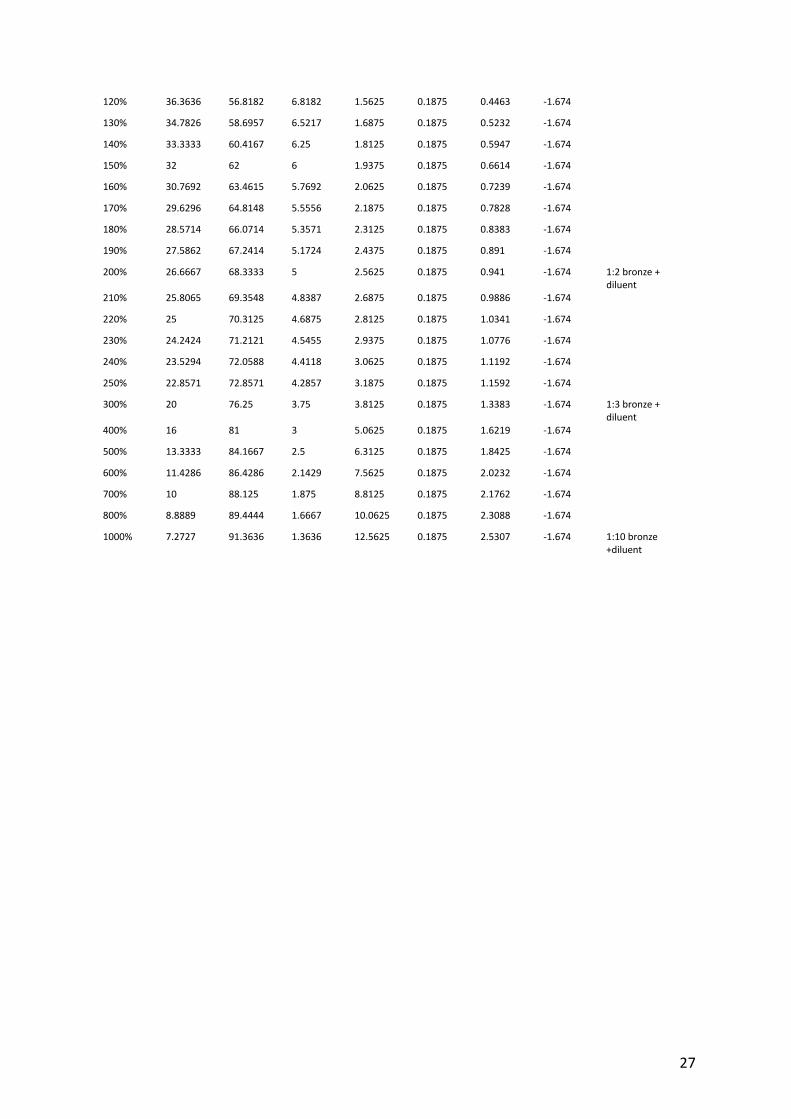
a) ‘Stock’ bronze (80% Cu, 5% Pb, 15% Sn) plus pure Pb
Dilution Cu Pb Sn Pb/Cu Sn/Cu ln(Pb/Cu) ln(Sn/Cu)
0 80 5 15 0.0625 0.1875 -2.7726 -1.674
10% 72.7273 13.6364 13.6364 0.1875 0.1875 -1.674 -1.674
20% 66.6667 20.8333 12.5 0.3125 0.1875 -1.1632 -1.674
30% 61.5385 26.9231 11.5385 0.4375 0.1875 -0.8267 -1.674
40% 57.1429 32.1429 10.7143 0.5625 0.1875 -0.5754 -1.674
50% 53.3333 36.6667 10 0.6875 0.1875 -0.3747 -1.674
60% 50 40.625 9.375 0.8125 0.1875 -0.2076 -1.674
70% 47.0588 44.1176 8.8235 0.9375 0.1875 -0.0645 -1.674
80% 44.4444 47.2222 8.3333 1.0625 0.1875 0.0606 -1.674
90% 42.1053 50 7.8947 1.1875 0.1875 0.1719 -1.674
100% 40 52.5 7.5 1.3125 0.1875 0.2719 -1.674 1:1 bronze + diluent
110% 38.0952 54.7619 7.1429 1.4375 0.1875 0.3629 -1.674
27
120% 36.3636 56.8182 6.8182 1.5625 0.1875 0.4463 -1.674
130% 34.7826 58.6957 6.5217 1.6875 0.1875 0.5232 -1.674
140% 33.3333 60.4167 6.25 1.8125 0.1875 0.5947 -1.674
150% 32 62 6 1.9375 0.1875 0.6614 -1.674
160% 30.7692 63.4615 5.7692 2.0625 0.1875 0.7239 -1.674
170% 29.6296 64.8148 5.5556 2.1875 0.1875 0.7828 -1.674
180% 28.5714 66.0714 5.3571 2.3125 0.1875 0.8383 -1.674
190% 27.5862 67.2414 5.1724 2.4375 0.1875 0.891 -1.674
200% 26.6667 68.3333 5 2.5625 0.1875 0.941 -1.674 1:2 bronze + diluent
210% 25.8065 69.3548 4.8387 2.6875 0.1875 0.9886 -1.674
220% 25 70.3125 4.6875 2.8125 0.1875 1.0341 -1.674
230% 24.2424 71.2121 4.5455 2.9375 0.1875 1.0776 -1.674
240% 23.5294 72.0588 4.4118 3.0625 0.1875 1.1192 -1.674
250% 22.8571 72.8571 4.2857 3.1875 0.1875 1.1592 -1.674
300% 20 76.25 3.75 3.8125 0.1875 1.3383 -1.674 1:3 bronze + diluent
400% 16 81 3 5.0625 0.1875 1.6219 -1.674
500% 13.3333 84.1667 2.5 6.3125 0.1875 1.8425 -1.674
600% 11.4286 86.4286 2.1429 7.5625 0.1875 2.0232 -1.674
700% 10 88.125 1.875 8.8125 0.1875 2.1762 -1.674
800% 8.8889 89.4444 1.6667 10.0625 0.1875 2.3088 -1.674
1000% 7.2727 91.3636 1.3636 12.5625 0.1875 2.5307 -1.674 1:10 bronze +diluent