Evidence from 575 Brands over Five Years - Marketing ...
56
“Advertising and Brand Attitudes: Evidence from 575 Brands over Five Years” © 2018 Rex Yuxing Du, Mingyu Joo, and Kenneth C. Wilbur; Report Summary © 2018 Marketing Science Institute MSI working papers are distributed for the benefit of MSI corporate and academic members and the general public. Reports are not to be reproduced or published in any form or by any means, electronic or mechanical, without written permission. Marketing Science Institute Working Paper Series 2018 Report No. 18-138 Advertising and Brand Attitudes: Evidence from 575 Brands over Five Years Rex Yuxing Du, Mingyu Joo, and Kenneth C. Wilbur
-
Upload
khangminh22 -
Category
Documents
-
view
3 -
download
0
Transcript of Evidence from 575 Brands over Five Years - Marketing ...
“Advertising and Brand Attitudes: Evidence from 575 Brands over Five Years” © 2018 Rex
Yuxing Du, Mingyu Joo, and Kenneth C. Wilbur; Report Summary © 2018 Marketing Science
Institute
MSI working papers are distributed for the benefit of MSI corporate and academic members
and the general public. Reports are not to be reproduced or published in any form or by any
means, electronic or mechanical, without written permission.
Marketing Science Institute Working Paper Series 2018 Report No. 18-138
Advertising and Brand Attitudes: Evidence from 575
Brands over Five Years Rex Yuxing Du, Mingyu Joo, and Kenneth C. Wilbur
Report Summary
The ultimate goal of advertising is to influence sales. However, recent literature shows that it is
very difficult to estimate advertising effectiveness on sales. Extremely large sample sizes are
required to adequately power advertising experiments and observational methods may be a poor
substitute for experimental estimates. Sales data are sparse and highly variable, ad effects tend to
be small and short-lived, and advertising exposures are nonrandomly assigned.
Rex Yuxing Du, Mingyu Joo, and Kenneth Wilbur investigate whether brand attitudes can be
reliable measures of advertising effectiveness. In contrast with sales data, brand attitude data are
non-sparse and relatively stable, possibly more influenced by advertising (though most of the
effect signs and magnitudes remain unknown), and measurable in large samples of consumers
whose selection is unrelated to advertising treatment.
They examine a unique dataset of 575 established brands from 37 industries over a five-year
observation window, merging weekly brand attitude survey data with weekly advertising
expenditure data. In totality, the data include $264 billion spent on advertising, 37% of all ad
spend measured during the observation window, and approximately ten million brand attitude
surveys.
They address the following three questions for mature brands that advertise regularly:
• How do brand attitudes change with advertising by the same brand and its competitors?
• How do these relationships vary across attitude measures and types of advertising media?
• How do various strategies to control for time-varying unobservables change effect sizes
and precision?
The brand attitude metrics they consider are the percentages of survey respondents indicating
favorable perceived quality, perceived value, and recent satisfaction for each brand in each week.
The three types of advertising media they consider are national traditional media, local
traditional media, and digital media. The models they estimate all include lagged brand attitudes,
contemporaneous and lagged ad spending by type of media, brand fixed effects, week fixed
effects, and weighted standard errors to reflect exogenous variation in the number of survey
respondents each week.
They investigate two sets of control variables as partial remedies to this advertising timing
endogeneity problem: brand/quarter fixed effects; and industry/week fixed effects. The data
indicate that brand/quarter and industry/week fixed effects are individually and jointly important
determinants of brand attitude data.
The key findings are that
• brand attitude metrics all rise with multiple lags of the brand’s own national traditional
advertising;
• local traditional ads increase perceived quality and perceived value;
• digital ads increase perceived value;
• the effects of competitors’ ads are generally negative.
Marketing Science Institute Working Paper Series

The results indicate that inclusion of proper control variables brings advertising parameter
estimates closer to expectations without major reductions in estimation precision. However, the
brand attitude data analyzed in this study provide insufficient power to estimate precise industry-
specific effects, suggesting further investigation of other intermediate metrics such as store
traffic, consideration, or information acquisition via online search as candidate advertising
response measures.
Put into Practice
These findings and empirical strategies may aid marketers and their agencies in using data to
guide important practical questions such as whether to advertise, how much to spend, and how to
allocate ad budgets. Such empirical guidance may be especially needed in industries where
available data complicate the estimation of causal effects of ads on sales, such as markets with
long purchase cycles or long interpurchase times.
Rex Yuxing Du is Bauer Professor of Marketing, Bauer College of Business, University of
Houston. Mingyu Joo is Assistant Professor of Marketing, School of Business, University of
California, Riverside. Kenneth C. Wilbur is Associate Professor of Marketing, Rady School of
Management, University of California, San Diego.
Marketing Science Institute Working Paper Series

1 Introduction
Advertisers seek to influence sales. Yet recent literature has called into serious question firms’
ability to estimate how advertising influences sales. Consider two recent, prominent papers
which rely on the “gold standard” of causal inference: randomized, controlled trials (RCTs).
Lewis and Rao (2015) reported the results of 25 advertising RCTs run on Yahoo.com, with
an average of 1.3 million consumers per experiment. Despite these large sample sizes, most of
the experiments were insufficiently powered to estimate positive advertising effects. Authors
concluded that “we are making the admittedly strong claim that most advertisers do not, and
indeed some cannot, know the effectiveness of their advertising spend.”
Gordon et al. (2017) reported 15 advertising RCTs run on Facebook. With a total sample
size of more than 500 million consumers, they were able to identify and precisely estimate
positive treatment effects on sales. The main focus of the paper was to assess whether (non-
experimental) observational methods such as matching and regression could recover causal effects
of online advertising. The answer, broadly, was no, even when relying on extensive demographic
and behavioral control variables.
From these two papers, we may conclude that extremely large sample sizes are required
to adequately power advertising experiments and that observational methods may be a poor
substitute for experimental estimates. The underlying reasons are that (i) sales data are sparse
and highly variable, (ii) ad effects tend to be small and short-lived, and (iii) advertising exposures
are nonrandomly assigned.1
The purpose of the current paper, broadly, is to investigate whether brand attitude data
can be reliably linked to advertising expenditures. In contrast with sales data, brand attitude
data are (i) non-sparse and relatively stable, (ii) possibly more influenced by advertising, though
most of the effect signs and magnitudes remain unknown, and (iii) measurable in large samples
of consumers whose selection is unrelated to advertising treatment. Many large brands have
subscribed to “brand tracking” surveys for decades, and the supply of such data may be increas-
ing. For example, Facebook and Google both recently introduced products to estimate “lifts”
1One might expect advertisers to frequently run highly powered RCTs, yet there is scant evidence of suchpractices (Rao and Simonov 2018).
2Marketing Science Institute Working Paper Series
in brand attitudes resulting from advertising.
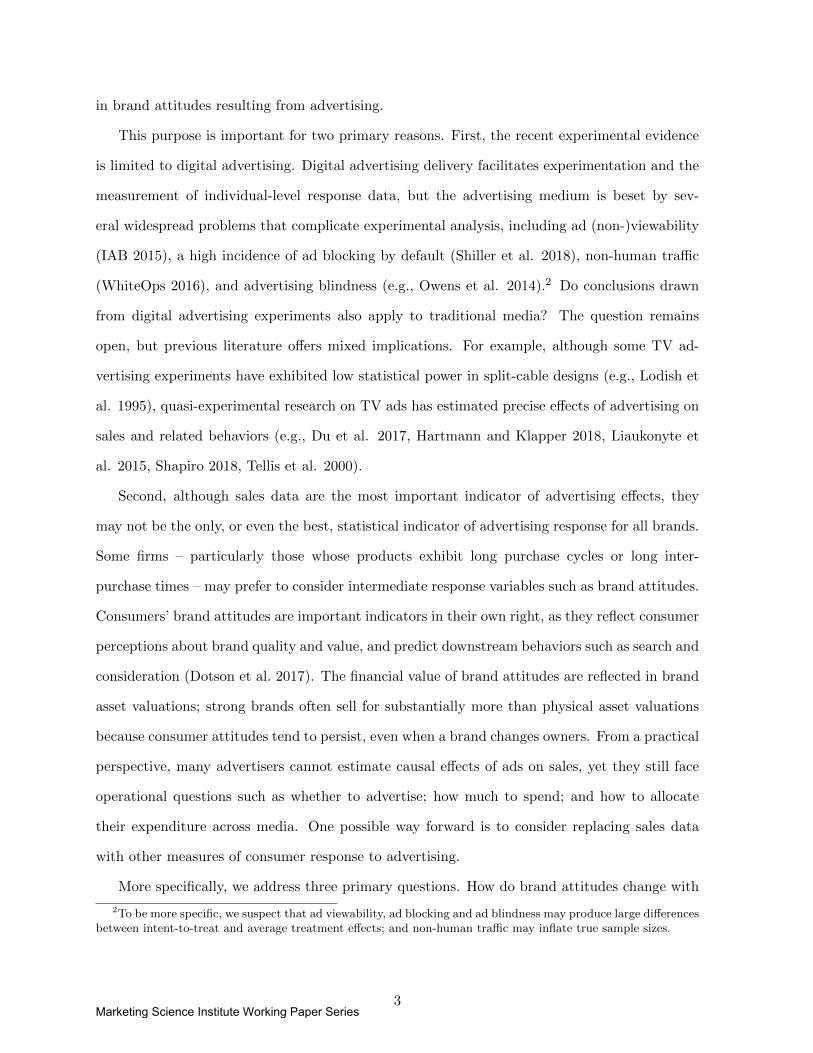
This purpose is important for two primary reasons. First, the recent experimental evidence
is limited to digital advertising. Digital advertising delivery facilitates experimentation and the
measurement of individual-level response data, but the advertising medium is beset by sev-
eral widespread problems that complicate experimental analysis, including ad (non-)viewability
(IAB 2015), a high incidence of ad blocking by default (Shiller et al. 2018), non-human traffic
(WhiteOps 2016), and advertising blindness (e.g., Owens et al. 2014).2 Do conclusions drawn
from digital advertising experiments also apply to traditional media? The question remains
open, but previous literature offers mixed implications. For example, although some TV ad-
vertising experiments have exhibited low statistical power in split-cable designs (e.g., Lodish et
al. 1995), quasi-experimental research on TV ads has estimated precise effects of advertising on
sales and related behaviors (e.g., Du et al. 2017, Hartmann and Klapper 2018, Liaukonyte et
al. 2015, Shapiro 2018, Tellis et al. 2000).
Second, although sales data are the most important indicator of advertising effects, they
may not be the only, or even the best, statistical indicator of advertising response for all brands.
Some firms – particularly those whose products exhibit long purchase cycles or long inter-
purchase times – may prefer to consider intermediate response variables such as brand attitudes.
Consumers’ brand attitudes are important indicators in their own right, as they reflect consumer
perceptions about brand quality and value, and predict downstream behaviors such as search and
consideration (Dotson et al. 2017). The financial value of brand attitudes are reflected in brand
asset valuations; strong brands often sell for substantially more than physical asset valuations
because consumer attitudes tend to persist, even when a brand changes owners. From a practical
perspective, many advertisers cannot estimate causal effects of ads on sales, yet they still face
operational questions such as whether to advertise; how much to spend; and how to allocate
their expenditure across media. One possible way forward is to consider replacing sales data
with other measures of consumer response to advertising.
More specifically, we address three primary questions. How do brand attitudes change with
2To be more specific, we suspect that ad viewability, ad blocking and ad blindness may produce large differencesbetween intent-to-treat and average treatment effects; and non-human traffic may inflate true sample sizes.
3Marketing Science Institute Working Paper Series
advertising by the same brand and its competitors? How do these relationships vary across
attitude measures and types of advertising media? How do various strategies to control for
time-varying unobservables change effect sizes and precision? Our goal, to the extent possible,
is to “let the data speak” by applying comparable methods to comparable measures for many
advertising brands.
To answer these questions, we examine a unique dataset of 575 established brands from 37
industries over a five-year observation window, merging weekly brand attitude data with weekly
advertising expenditure data. In totality, the data include $264 billion spent on advertising,
37% of all ad spend measured during the observation window, and approximately ten million
brand attitude surveys. We study mature brands that advertise regularly.
The brand attitude metrics we consider are the percentages of survey respondents indicating
favorable perceived quality, perceived value and recent satisfaction for each brand in each week.
The three types of advertising media we consider are national traditional media, local tradi-
tional media, and digital media. We suspect that each type of advertising could operate directly
on each brand attitude: advertising content may communicate differentiating features, thereby
influencing perceived quality; it could communicate current pricing terms, thereby influencing
perceived value; and it could lead a consumer directly to purchase, thereby increasing the pro-
portion of people who indicate recent satisfaction. Although we believe that any of these effects
may operate, we expect perceived quality to be most strongly linked to national advertising,
as national ads typically convey product information and differentiating messages (Liaukonyte
et al. 2015). We expect perceived value to rise more strongly with local traditional advertis-
ing and digital advertising, as pricing and availability frequently vary geographically and such
information is often communicated via advertising in geographically targeted media (Kaul and
Wittink 1995, Lee et al. 2017, Xu et al. 2014).
The models we estimate all include lagged brand attitudes, contemporaneous and lagged
ad spending by type of media, brand fixed effects, week fixed effects, and weighted standard
errors to reflect exogenous variation in the number of survey respondents each week. The
fundamental challenge to causal inference in this setting is not in the nonrandom assignment of
advertisements to consumers; brand attitude data are collected from large samples of consumers
4Marketing Science Institute Working Paper Series
whose selection is unrelated to advertising efforts. Instead, there is a primary difficulty in the
timing of advertising expenditure, as advertising timing may be nonrandomly selected and could
coincide with periods of peak demand or heightened responsiveness to advertising.
We investigate two sets of control variables as partial remedies to this advertising timing
endogeneity problem: brand/quarter fixed effects, to control for time-varying, brand-related
unobservables that may drive both advertising and brand attitudes; and industry/week fixed
effects, to control for industry-level unobservables that may affect multiple competing brands’
advertising and brand attitudes. When both sets of control variables are included, causal inter-
pretation requires an assumption that advertising expenditures are not chosen with knowledge
of future brand/week departures from brand/quarter unobservables or future brand/week de-
partures from industry/week unobservables. Although this identifying assumption is unlikely to
apply to every brand, we suspect it applies to the large majority of brands in the sample.
To summarize the primary findings, the data indicate that brand/quarter and industry/week
fixed effects are individually and jointly important determinants of brand attitude data. Further,
the model that includes both sets of control variables produces results that comport better
with expectations, and exhibit greater internal coherence, than a descriptive model without
either set of control variables. The estimates indicate that (i) brand attitude metrics all rise
with multiple lags of the brand’s own national traditional advertising; (ii) local traditional ads
increase perceived quality and perceived value; (iii) digital ads increase perceived value; (iv) the
effects of competitors’ ads are generally negative.
Next, we discuss how the current study relates to extant literature. The subsequent sections
explain the data and provide some model-free evidence; discuss identification issues; specify the
empirical models; report and interpret the findings; and discuss the overall learnings, limitations
and implications of the exercise.
1.1 Relationship to Previous Literature
The empirical literature on advertising is vast. Most relevant is the set of papers that demon-
strates that advertising can affect intermediate consumer outcomes, i.e., behaviors and attitudes
that occur prior to sales. For example, Draganska and Klapper (2011) show that advertising
5Marketing Science Institute Working Paper Series
increases brand awareness and expands consumer choice sets; Joo et al. (2014) found that TV
advertising increases the number of product category-related Google searches and the propor-
tion of searches that contain brand-specific keywords; and Hu et al. (2014) show that advertising
predicts monthly search for automotive brands, which in turn predicts monthly purchase data.
There are also several papers that estimate industry-specific correlations between brand atti-
tudes and advertising expenditures (Hanssens et al. 2014, Srinivasan et al. 2010).
The most closely related paper is Clark, Doraszelski, and Draganska (2009), which estimated
advertising effects on brand awareness and perceived quality in a large annual panel dataset,
including $96B in ad spending by 348 brands from 2000-2005. As that paper explains, most
of the prior literature was based on cross-sectional data, with questionable ability to separate
effects of advertising from unobserved confounds such as product quality. Clark et al. (2009)
found, in their preferred specification, that a focal brand’s own advertising increased its own
awareness but did not significantly change perceived quality. The focal brand’s competitor
advertising, by contrast, reduced brand awareness and increased perceived quality. Although
the current analysis replicates some aspects of Clark et al. (2009), our incremental contribution
rests on several important differences: temporal disaggregation, methods, measures and results.
The most important difference may be the temporal dimension of the data. Clark et al. (2009)
analyzed a “large-N, small-T” type panel with 4.2 observations available for the average brand.
The current paper, by contrast, investigates a balanced panel of 575 brands over 252 weeks of
data, consistent with the central findings of Tellis and Franses (2006) that “too disaggregate data
does not cause any disaggregation bias.” More granular data allow for more extensive controls
for possible time-varying confounds, one of the central themes of our paper. In fact, Clark et
al. (2009, p. 229) said “Perhaps the ideal data for analyzing the effect of advertising are time
series of advertising expenditures, brand awareness, and perceived quality for the brands being
studied. With long enough time series we could then try to identify for each brand in isolation
the effect of advertising expenditures on brand awareness and perceived quality.” Intuitively, the
more disaggregated data allows for a sharper delineation of the lead/lag relationships between
the timing of ad spend (which is highly variable over time) and brand attitudes (which mostly
exhibit stable long-run averages). There is further interest in contrasting results based on their
6Marketing Science Institute Working Paper Series

2000-2005 sample period with the later time period of 2008-2012, as consumer media habits
and firm ad spending changed significantly between these two time periods; for example, digital
advertising increased substantially.
There are also important differences in attitude measures, methods and results. Clark et al.
(2009) observed average ratings of perceived quality on a 0-10 scale, and defined awareness as
the percentage of respondents who rated the brand’s quality. The metrics studied in this paper
indicate multiple dimensions of brand attitudes, including one (recent satisfaction) which may
reflect recent purchase activity; but they do not explicitly separate awareness from other atti-
tudes. We further distinguish between the effects of three types of ad spend (national traditional,
local traditional and digital). Clark et al. (2009) relied on dynamic panel instrumental variables
estimators to control for advertising endogeneity, with findings that differed qualitatively across
estimators. The exogeneity conditions require knowledge about the serial correlation of the
error terms, information which is difficult to derive from theory or test in “small-T” settings.
Finally, the empirical findings differ substantially: we find positive effects of own ad spend on
perceived quality; we offer the first findings related to perceived value, recent satisfaction and
individual types of advertising; and we find that competitor ad spending generally decreases
brand attitudes.
The current study is further related to a set of papers comparing advertising effects across
media and across competitors. For example, Danaher and Dagger (2013) offered an approach to
help brands evaluate relative media effectiveness by linking loyalty program members’ purchases
to their responses on a media consumption survey. Draganska et al. (2014) showed that televi-
sion advertisements produced statistically indistinguishable “lift” in aided brand recall to three
formats of online advertisements (video, banner and rich media); but proper inference depends
critically on accounting for differences in pre-existing brand knowledge between people exposed
to different ad formats. Lovett et al. (2017) investigated a large panel of brands, showing that in-
ternet and television ad spend both have small but significant positive effects on word-of-mouth.
There is also evidence that competitor advertising can interfere with advertisement recall (Kent
and Allen 1994) and sales response (Danaher et al. 2008).
More broadly, the current study relates to the literature that estimates advertising effects on
7Marketing Science Institute Working Paper Series
brand equity. Ailawadi et al. (2003) introduced estimation of customer-based brand equity and
reported a positive association between advertising and brand equity. Borkovsky et al. (2017)
found that advertising investment increases the expected net present value of future cash flows
due to a brand in a dynamic model of advertising investment. Mela et al. (1997) found that
advertising makes consumers less price sensitive and reduces the size of the non-loyal segment.
Our results offer evidence consistent with possible attitude-related mechanisms underlying these
important findings.
2 Data and Model-free Evidence
Two large-scale commercial databases are combined – brand attitude survey data from YouGov
and ad spending data from Kantar. We believe both data sources to be “best in class.” Both
Kantar and YouGov are leading market research agencies.3 To the best of our knowledge, there
are no data sources that provide both better quality and similar coverage. We further believe
that these two databases are the market leaders in their product categories, suggesting that we
are using similar data to what many practitioners have available. However, the data do have
some nuances that are important to consider when interpreting the results of the analysis. We
first describe the data sources and focal metrics, then the sample selection, followed by summary
statistics and model-free evidence.
2.1 Brand Tracking Data
Brands employ market research firms to conduct longitudinal surveys to monitor consumers’
brand attitudes. Although such surveys have traditionally been quite costly, there are numerous
research agencies that offer similar products, including GfK, Millward Brown, TNS and YouGov.
Recently, Facebook introduced its own survey platform to enable brands to “accurately measure
brand awareness, impact and ad recall.”4 The weaknesses of survey data are numerous and well
documented. However, regular surveys of large consumer panels produce brand attitude data
that are reasonably stable over time, although individual data points can be affected by sampling
3https://www.ama.org/publications/MarketingNews/Documents/2017-top-50-gold-report-article.pdf, ac-cessed March 2018.
4https://www.facebook.com/business/learn/facebook-brand-polling, accessed March 2018.
8Marketing Science Institute Working Paper Series
error. When meaningful changes do occur, they often correspond to identifiable shocks, such as
news events or quality changes.
Brand tracking data were drawn from the largest available survey panel, the YouGov BrandIn-
dex. YouGov maintains a panel of more than 1.5 million U.S. consumers, with each panelist
invited to complete up to one survey online each month. Panelists are compensated with re-
deemable “points” each time they complete a survey, but survey participation is not mandatory,
leading to some exogenous fluctuations in the number of surveys completed for each industry in
each week.
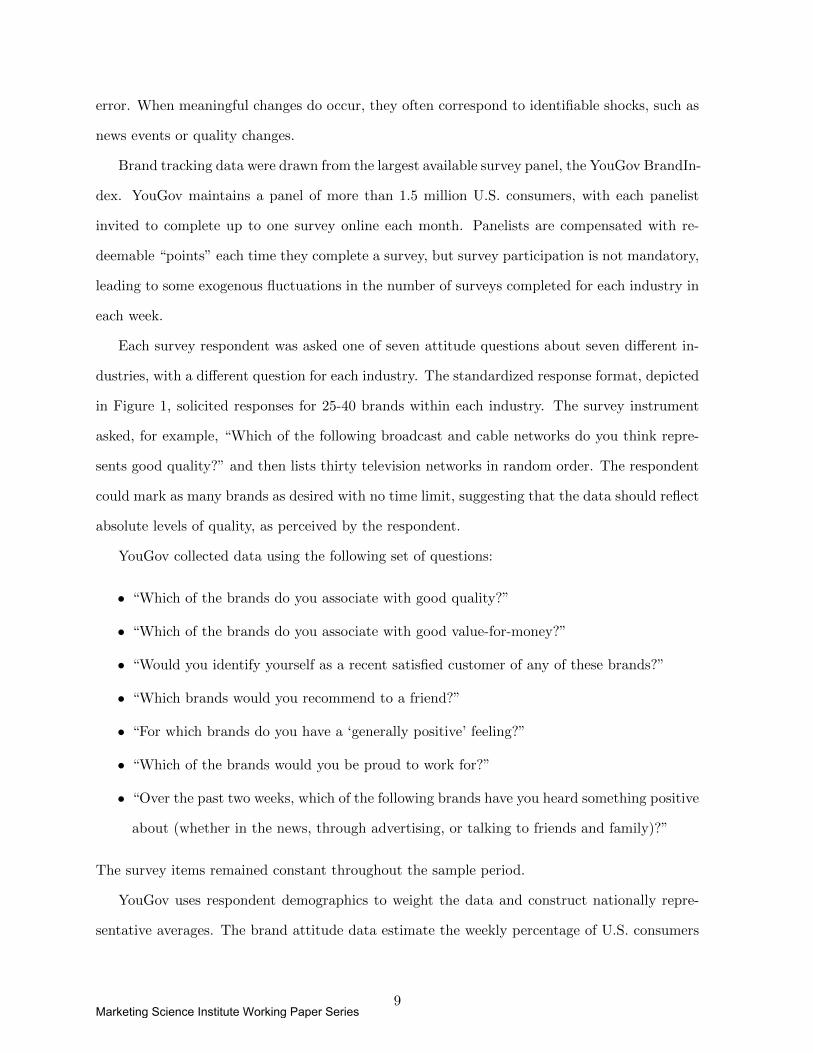
Each survey respondent was asked one of seven attitude questions about seven different in-
dustries, with a different question for each industry. The standardized response format, depicted
in Figure 1, solicited responses for 25-40 brands within each industry. The survey instrument
asked, for example, “Which of the following broadcast and cable networks do you think repre-
sents good quality?” and then lists thirty television networks in random order. The respondent
could mark as many brands as desired with no time limit, suggesting that the data should reflect
absolute levels of quality, as perceived by the respondent.
YouGov collected data using the following set of questions:
• “Which of the brands do you associate with good quality?”
• “Which of the brands do you associate with good value-for-money?”
• “Would you identify yourself as a recent satisfied customer of any of these brands?”
• “Which brands would you recommend to a friend?”
• “For which brands do you have a ‘generally positive’ feeling?”
• “Which of the brands would you be proud to work for?”
• “Over the past two weeks, which of the following brands have you heard something positive
about (whether in the news, through advertising, or talking to friends and family)?”
The survey items remained constant throughout the sample period.
YouGov uses respondent demographics to weight the data and construct nationally repre-
sentative averages. The brand attitude data estimate the weekly percentage of U.S. consumers
9Marketing Science Institute Working Paper Series
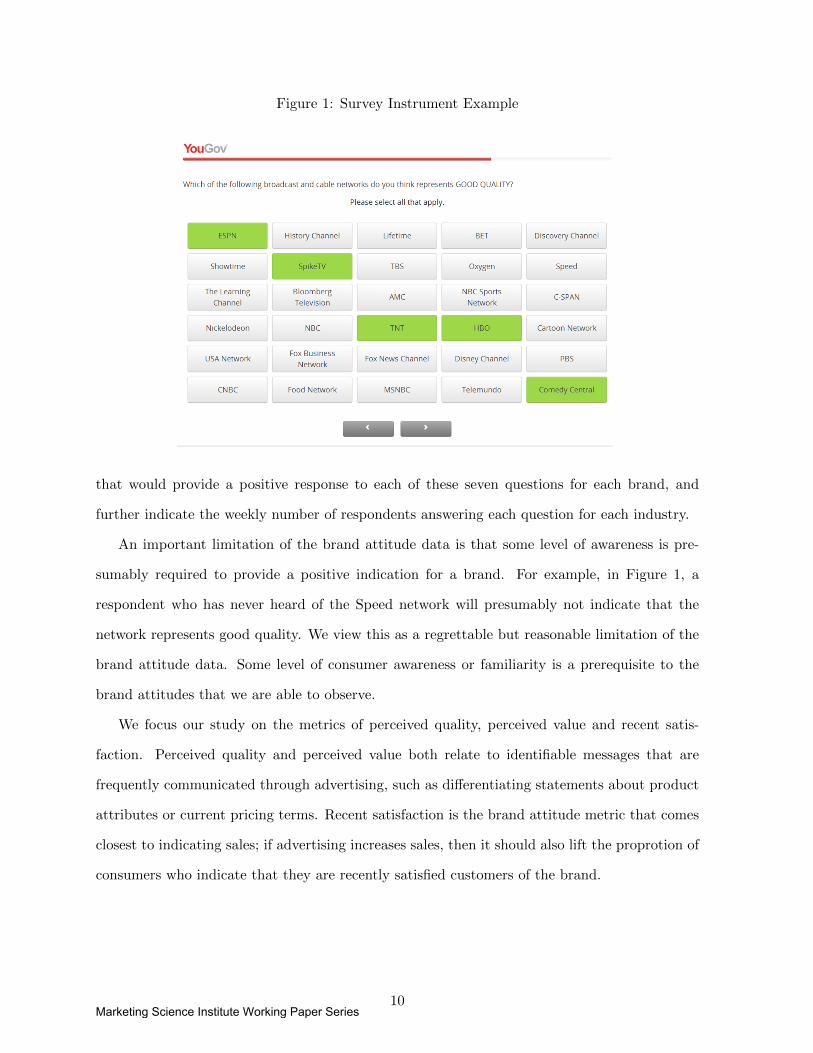
Figure 1: Survey Instrument Example
that would provide a positive response to each of these seven questions for each brand, and
further indicate the weekly number of respondents answering each question for each industry.
An important limitation of the brand attitude data is that some level of awareness is pre-
sumably required to provide a positive indication for a brand. For example, in Figure 1, a
respondent who has never heard of the Speed network will presumably not indicate that the
network represents good quality. We view this as a regrettable but reasonable limitation of the
brand attitude data. Some level of consumer awareness or familiarity is a prerequisite to the
brand attitudes that we are able to observe.
We focus our study on the metrics of perceived quality, perceived value and recent satis-
faction. Perceived quality and perceived value both relate to identifiable messages that are
frequently communicated through advertising, such as differentiating statements about product
attributes or current pricing terms. Recent satisfaction is the brand attitude metric that comes
closest to indicating sales; if advertising increases sales, then it should also lift the proprotion of
consumers who indicate that they are recently satisfied customers of the brand.
10Marketing Science Institute Working Paper Series
2.2 Advertising Expenditure Data
Kantar Media compiles comprehensive data on advertising placements and expenditure esti-
mates across the broad range of advertising media listed in Table 1. Kantar is widely viewed
as the market leader in “competitive advertising intelligence,” i.e., the service of monitoring
competitors’ advertisement placements and expenditures.
Kantar tracks television, print and digital media by logging brand advertisement insertions
algorithmically through continuous monitoring of media content. For television and print media,
estimated advertising prices are provided by media outlets indirectly through the Standard Rate
and Data Service (SRDS). Although the SRDS price estimates are known to be imperfect, they
are commonly used by brands to plan future advertising efforts, and are the only available
source of widespread information about advertising prices.5 Digital advertising placements are
collected by an elaborate system of web crawlers. Outdoor and radio ad placements and prices,
and digital advertising price data, are provided directly to Kantar by industry partners.
We paid particular attention to Kantar’s data quality in internet display and internet search
data, as these measures were relatively new at the time we collected the data. The internet
search ad spend data did not appear reliable: they were unreasonably sparse. Our investigations
of internet display data did not indicate any identifiable problems. Therefore our measure of
digital advertising includes internet display media only. We remain cognizant of the possibility
of classical errors-in-variables problems which may bias parameter estimates toward zero and
bias t-statistics downward (Griliches 1977), thereby yielding false null results. However, we do
find significant effects of own digital and competitor digital advertising on brand attitudes.
Advertising content varies by type of media. National traditional ads are often used to
communicate information and differentiating messages (Liaukonyte et al. 2015), while local
traditional ads focus more on current price and availability, as these variables typically vary
across local markets, while also conveying some quality-relevant information (Kaul and Wittink
1995). Digital advertising also frequently communicates current pricing and availability. For
5The reporting incentives are mixed. A media outlet could exaggerate its ad price to offer perceived discounts innegotiations with advertisers. Or, a media outlet might underreport its ad price to attract interested advertisers.Actual ad prices in traditional media are typically set in confidential bilateral negotiations and may reflect pricediscrimination or quantity discounts. Digital advertising prices are typically set in complex, rapidly changing spotauction markets within or between ad networks, demand-side platforms and supply-side platforms.
11Marketing Science Institute Working Paper Series
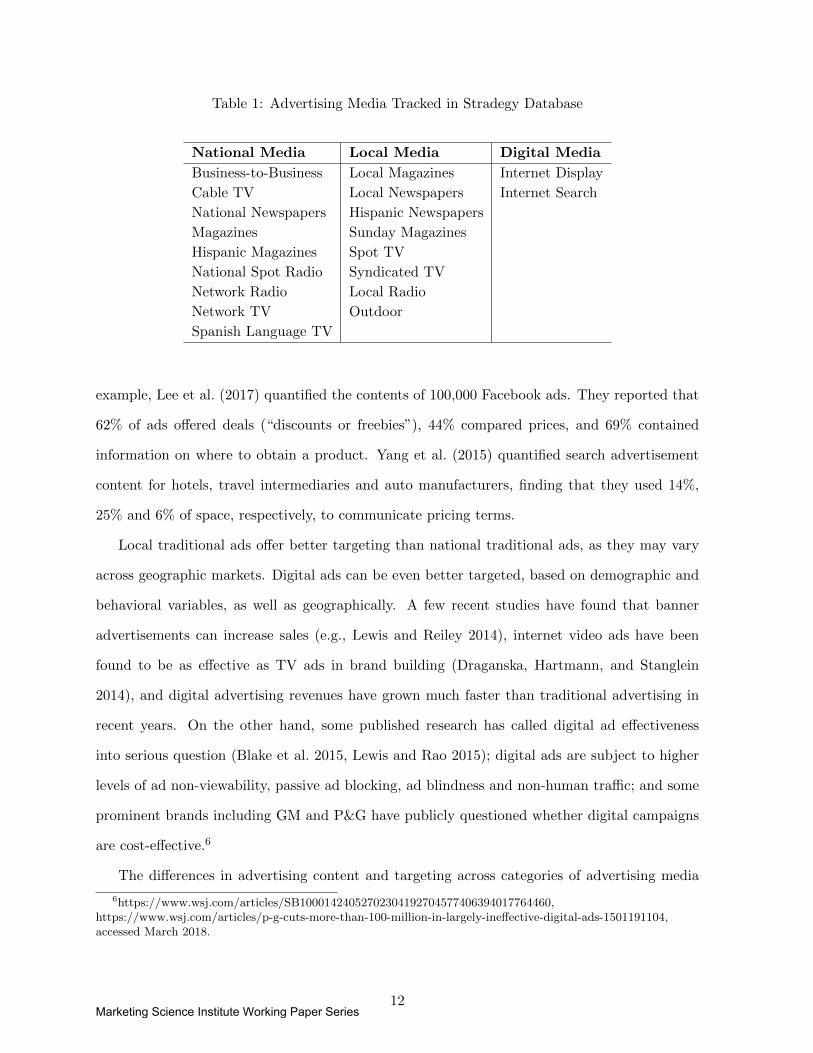
Table 1: Advertising Media Tracked in Stradegy Database
National Media Local Media Digital Media
Business-to-Business Local Magazines Internet Display
Cable TV Local Newspapers Internet Search
National Newspapers Hispanic Newspapers
Magazines Sunday Magazines
Hispanic Magazines Spot TV
National Spot Radio Syndicated TV
Network Radio Local Radio
Network TV Outdoor
Spanish Language TV
example, Lee et al. (2017) quantified the contents of 100,000 Facebook ads. They reported that
62% of ads offered deals (“discounts or freebies”), 44% compared prices, and 69% contained
information on where to obtain a product. Yang et al. (2015) quantified search advertisement
content for hotels, travel intermediaries and auto manufacturers, finding that they used 14%,
25% and 6% of space, respectively, to communicate pricing terms.
Local traditional ads offer better targeting than national traditional ads, as they may vary
across geographic markets. Digital ads can be even better targeted, based on demographic and
behavioral variables, as well as geographically. A few recent studies have found that banner
advertisements can increase sales (e.g., Lewis and Reiley 2014), internet video ads have been
found to be as effective as TV ads in brand building (Draganska, Hartmann, and Stanglein
2014), and digital advertising revenues have grown much faster than traditional advertising in
recent years. On the other hand, some published research has called digital ad effectiveness
into serious question (Blake et al. 2015, Lewis and Rao 2015); digital ads are subject to higher
levels of ad non-viewability, passive ad blocking, ad blindness and non-human traffic; and some
prominent brands including GM and P&G have publicly questioned whether digital campaigns
are cost-effective.6
The differences in advertising content and targeting across categories of advertising media
6https://www.wsj.com/articles/SB10001424052702304192704577406394017764460,https://www.wsj.com/articles/p-g-cuts-more-than-100-million-in-largely-ineffective-digital-ads-1501191104,accessed March 2018.
12Marketing Science Institute Working Paper Series
lead us to suspect that relationships between brand attitudes and advertising expenditures may
vary across these three categories of advertising media.
2.3 Sample Selection
The goal of this study is to estimate relationships between advertising expenditures and brand
attitudes for mature brands that advertise regularly. We select brands with these particular
criteria in mind, so we begin with the acknowledgement that the results can only be interpreted
as applicable to the set of brands studied and may not generalize beyond that set. Although this
strategy does not represent the full population of brands, this subset is large and particularly
important, as it accounted for 37% of all advertising expenditure measured during the sample
period.
We first matched each brand in the YouGov data to its equivalent entity in the Kantar
database. We then downloaded weekly ad spend data for each brand in each equivalent time
period. Finally, we retained brands that (a) were tracked by YouGov for the entire sample
period, (b) advertised in at least 30% of the observed weeks, and (c) did not go more than
thirteen consecutive weeks with zero advertising. The set of 575 brands meeting these criteria
is provided in the appendix, along with each brand’s industry as indicated by YouGov. In total,
these brands spent $264 billion on advertising from 2008-2012, or $92 million per brand per year.
The corresponding brand attitude metrics are based on about ten million surveys, yielding a
weekly average of 595 responses per question per brand (SD=77).
2.4 Descriptive Statistics and Model-free Evidence
We first summarize the brand attitude data, followed by the ad spend data. We then visualize
the relationships between them for a few selected brands, then present quantiles of brand-level
correlations between the key variables in the analysis.
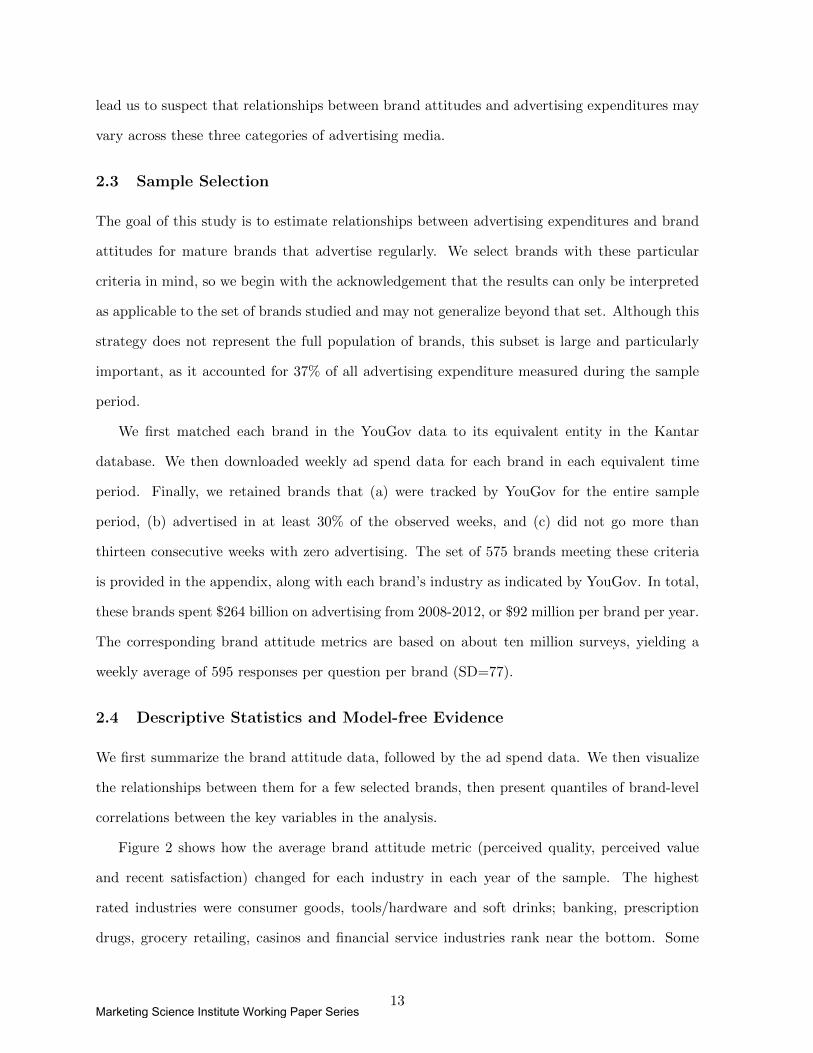
Figure 2 shows how the average brand attitude metric (perceived quality, perceived value
and recent satisfaction) changed for each industry in each year of the sample. The highest
rated industries were consumer goods, tools/hardware and soft drinks; banking, prescription
drugs, grocery retailing, casinos and financial service industries rank near the bottom. Some
13Marketing Science Institute Working Paper Series
of these industry-level differences are partially driven by brand awareness, as large consumer
goods brands are available throughout the U.S., whereas many brands in some of the lower-
rated industries are more geographically dispersed (e.g., grocery retailers, consumer banks).
Consumers in unserved regions would not indicate positive attitudes toward brands they have not
encountered, as awareness must precede perceived quality, perceived value or recent satisfaction.
Figure 2: Brand Attitudes by Industry and Year
Mea
n B
rand
Atti
tude
(%
)
10
20
30
40
50
Con
sum
er G
oods
Tool
s/H
ardw
are
Sof
t Drin
ks
Bev
erag
es: G
ener
alM
edia
Dev
ices
Dru
gs: O
TC
Ele
ctro
nics
: A
udio
/Vis
ual
Inte
rnet
Site
s
Hom
e/Fu
rnis
hing
Sto
res
App
lianc
esD
ept.
Sto
res
App
arel
and
Sho
es
Car
Man
ufac
ture
rsTV
Net
wor
ksH
otel
sFa
st F
ood
Liqu
or
Ice
Cre
am/P
izza
/Cof
fee
Clo
thin
g S
tore
s
Boo
ks/K
ids/
Offi
ce S
tore
sC
asua
l Din
ing
Bee
r
Fast
Cas
ual D
inin
g
Gas
olin
e/A
utoA
cces
sorie
s
Spo
rts/E
lect
roni
cs S
tore
s
Cru
ise/
Trav
elA
gent
sM
edia
Ser
vice
sIn
sura
nce
Ste
akho
uses
/Cas
ualD
inin
g
Wom
en's
Clo
thin
g S
tore
sA
irlin
esC
asin
os
Fina
ncia
l Ser
vice
sG
roce
ry S
tore
sD
rugs
: Gen
eral
Dru
gs: P
resc
riptio
nC
onsu
mer
Ban
ks
20082009201020112012
The industry-level averages of brand attitude metrics are fairly stable across years in the
sample, with a few exceptions. For example, consumer perceptions of soft drinks slipped sharply
during the sample period. There is also a general negative trend in audio/visual electronics,
though this shift in averages masks heterogeneity and consolidation; a few newer brands like
LG and Acer improved, whereas some older brands (e.g., Kodak, Sony, Panasonic) fell. Despite
these few exceptions, the industry-year averages were mostly stable during the sample period.
Table 2 provides further information about how brand attitudes changed across years of the
sample. Across all brands, perceived quality fell by an average of 1.6% between 2008 and 2012;
perceived value fell by 0.3% and recent satisfaction fell by 0.9%. These trends speak to the
14Marketing Science Institute Working Paper Series
importance of controlling for time-varying unobservables in estimating relationships between ad
spend and brand attitudes.
Table 2: Mean Brand Attitudes
Perceived Quality Perceived Value Recent Satisfaction
In 2008 In 2012 In 2008 In 2012 In 2008 In 2012
Mean 26.5% 24.9% 20.6% 20.3% 20.2% 19.3%
Median 24.4% 22.8% 17.4% 17.1% 15.9% 15.0%
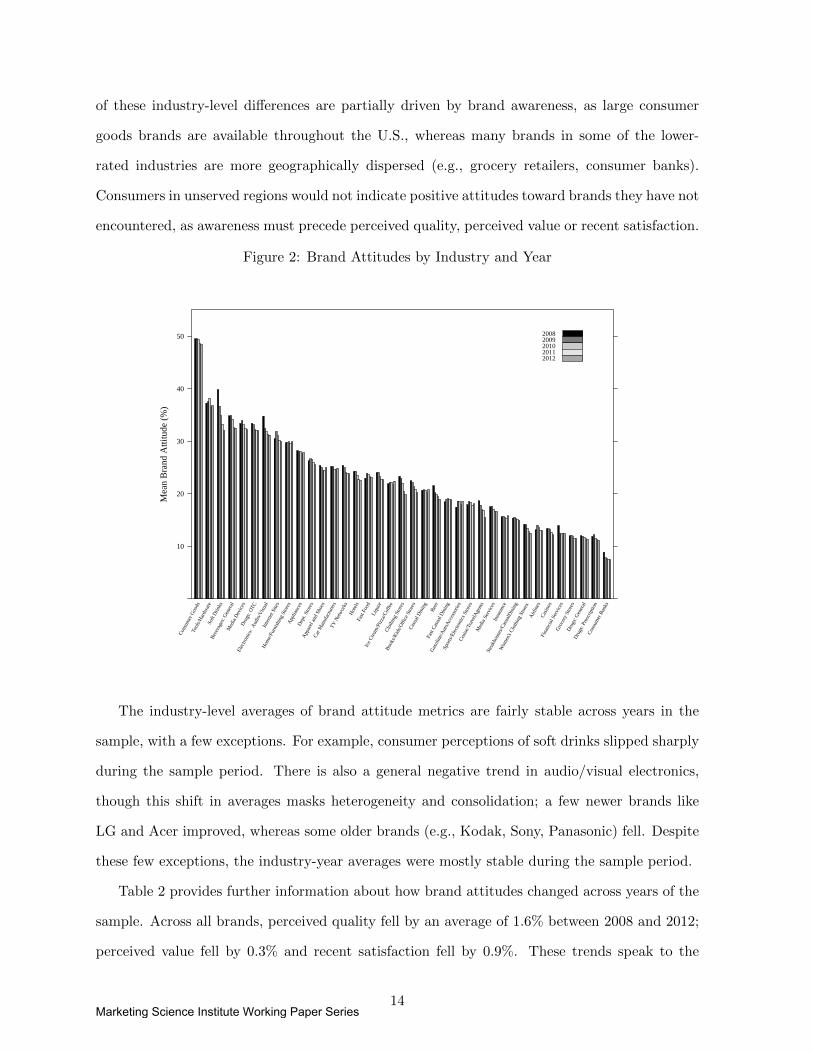
Next, we summarize the ad spend data. Figure 3 displays mean brand ad spend by industry
and year. Media and automotive brands spent the most on advertising, followed by department
store, insurance and quick service restaurant brands. Except for a few notable exceptions (e.g.,
media, department stores, insurance), most industries did not exhibit large changes in mean
brand ad spend between 2008 and 2012.
Figure 3: Ad Spending by Industry and Year
Mea
n A
dver
tisin
g E
xpen
ditu
res
($ M
illio
n)
2
4
6
8
Con
sum
er G
oods
Tool
s/H
ardw
are
Sof
t Drin
ks
Bev
erag
es: G
ener
alM
edia
Dev
ices
Dru
gs: O
TC
Ele
ctro
nics
: A
udio
/Vis
ual
Inte
rnet
Site
s
Hom
e/Fu
rnis
hing
Sto
res
App
lianc
esD
ept.
Sto
res
App
arel
and
Sho
es
Car
Man
ufac
ture
rsTV
Net
wor
ksH
otel
sFa
st F
ood
Liqu
or
Ice
Cre
am/P
izza
/Cof
fee
Clo
thin
g S
tore
s
Boo
ks/K
ids/
Offi
ce S
tore
sC
asua
l Din
ing
Bee
r
Fast
Cas
ual D
inin
g
Gas
olin
e/A
utoA
cces
sorie
s
Spo
rts/E
lect
roni
cs S
tore
s
Cru
ise/
Trav
elA
gent
sM
edia
Ser
vice
sIn
sura
nce
Ste
akho
uses
/Cas
ualD
inin
g
Wom
en's
Clo
thin
g S
tore
sA
irlin
esC
asin
os
Fina
ncia
l Ser
vice
sG
roce
ry S
tore
sD
rugs
: Gen
eral
Dru
gs: P
resc
riptio
nC
onsu
mer
Ban
ks
20082009201020112012
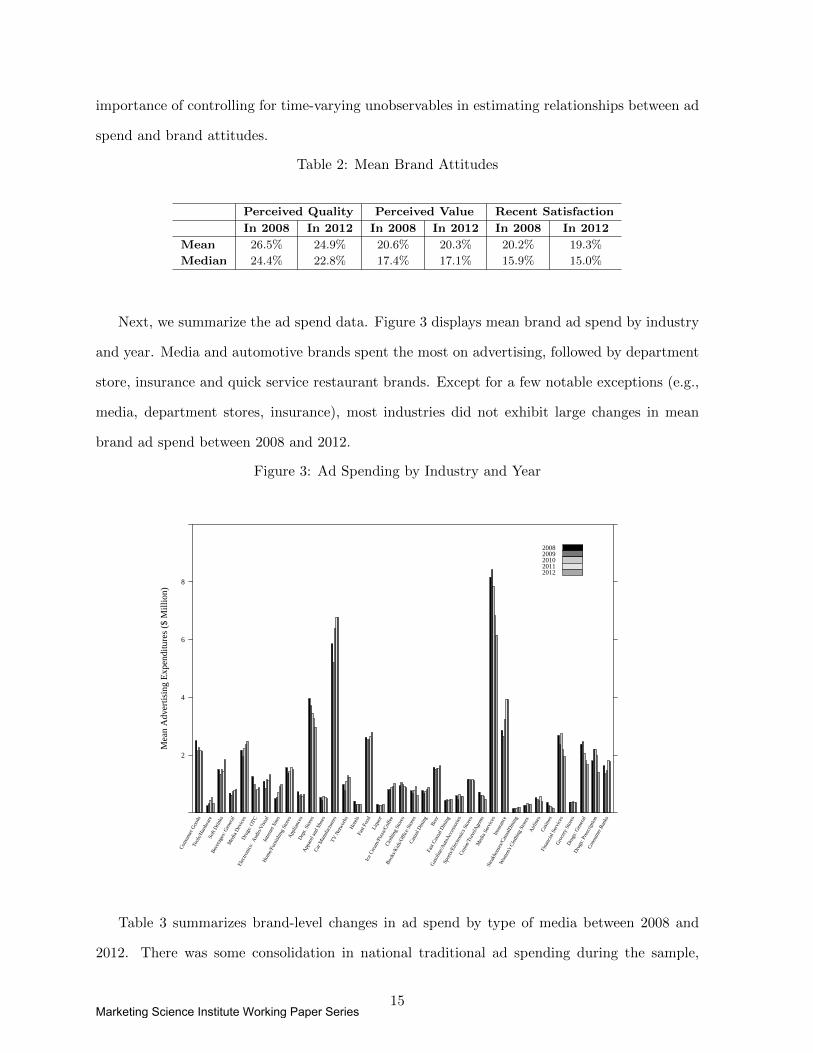
Table 3 summarizes brand-level changes in ad spend by type of media between 2008 and
2012. There was some consolidation in national traditional ad spending during the sample,
15Marketing Science Institute Working Paper Series
as the average brand’s weekly expenditure rose by about $50,000, whereas the median brand’s
weekly ad spend fell by $22,000. Local traditional advertising fell substantially during the
sample, with the average brand spending 25% less per week in 2012 relative to 2008. Digital
ads rose from $110,000 per brand per week in 2008 to $130,000 in 2012.
Table 3: Mean Advertising Expenditure ($ Millions)
National Trad. Ads Local Trad. Ads Digital Ads
In 2008 In 2012 In 2008 In 2012 In 2008 In 2012
Mean $1.02 $1.07 $0.51 $0.38 $0.11 $0.13
Median $0.27 $0.25 $0.11 $0.09 $0.01 $0.02
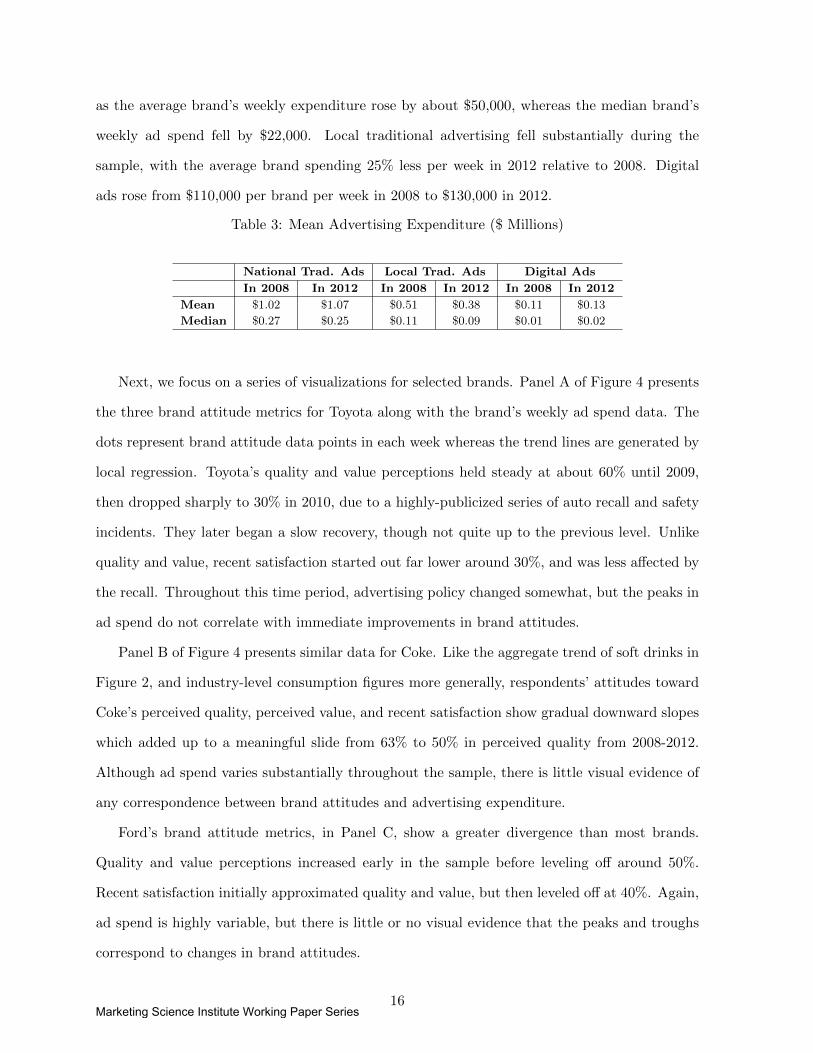
Next, we focus on a series of visualizations for selected brands. Panel A of Figure 4 presents
the three brand attitude metrics for Toyota along with the brand’s weekly ad spend data. The
dots represent brand attitude data points in each week whereas the trend lines are generated by
local regression. Toyota’s quality and value perceptions held steady at about 60% until 2009,
then dropped sharply to 30% in 2010, due to a highly-publicized series of auto recall and safety
incidents. They later began a slow recovery, though not quite up to the previous level. Unlike
quality and value, recent satisfaction started out far lower around 30%, and was less affected by
the recall. Throughout this time period, advertising policy changed somewhat, but the peaks in
ad spend do not correlate with immediate improvements in brand attitudes.
Panel B of Figure 4 presents similar data for Coke. Like the aggregate trend of soft drinks in
Figure 2, and industry-level consumption figures more generally, respondents’ attitudes toward
Coke’s perceived quality, perceived value, and recent satisfaction show gradual downward slopes
which added up to a meaningful slide from 63% to 50% in perceived quality from 2008-2012.
Although ad spend varies substantially throughout the sample, there is little visual evidence of
any correspondence between brand attitudes and advertising expenditure.
Ford’s brand attitude metrics, in Panel C, show a greater divergence than most brands.
Quality and value perceptions increased early in the sample before leveling off around 50%.
Recent satisfaction initially approximated quality and value, but then leveled off at 40%. Again,
ad spend is highly variable, but there is little or no visual evidence that the peaks and troughs
correspond to changes in brand attitudes.
16Marketing Science Institute Working Paper Series
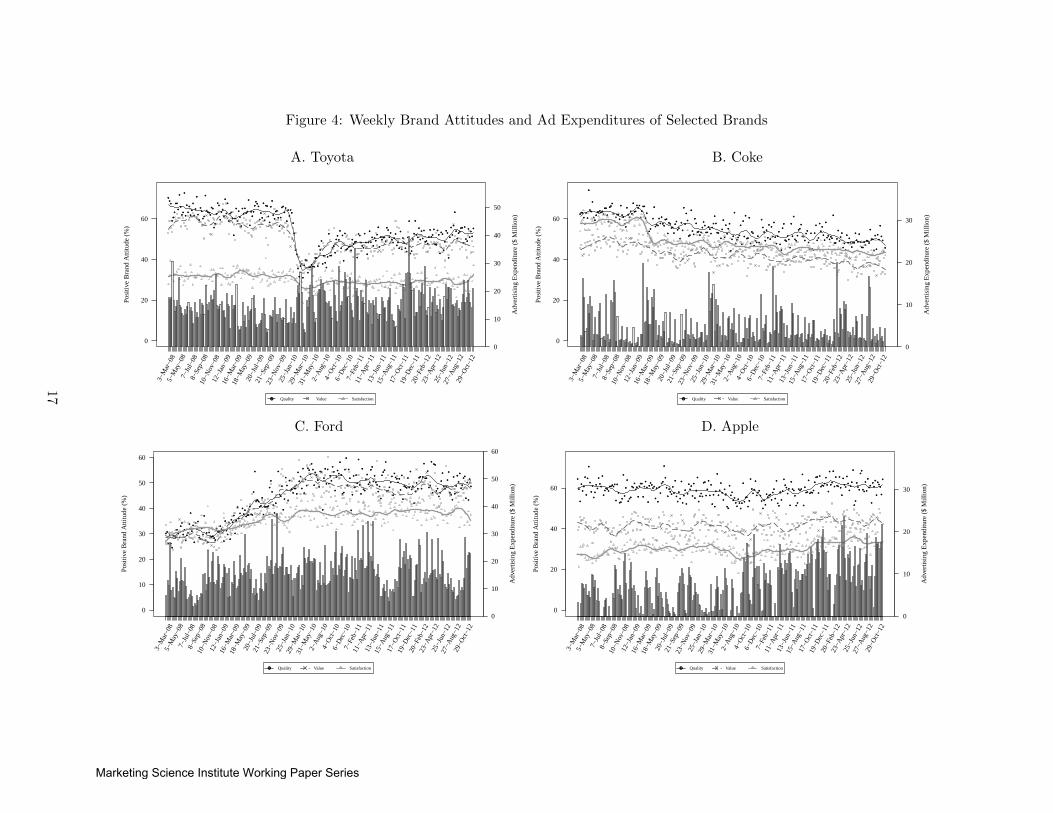
Figure 4: Weekly Brand Attitudes and Ad Expenditures of Selected Brands
A. Toyota B. Coke
0
20
40
60
Pos
itive
Bra
nd A
ttitu
de (
%)
3−M
ar−0
85−
May
−08
7−Ju
l−08
8−S
ep−0
810
−Nov
−08
12−J
an−0
916
−Mar
−09
18−M
ay−0
920
−Jul
−09
21−S
ep−0
923
−Nov
−09
25−J
an−1
029
−Mar
−10
31−M
ay−1
02−
Aug
−10
4−O
ct−1
06−
Dec
−10
7−Fe
b−11
11−A
pr−1
113
−Jun
−11
15−A
ug−1
117
−Oct
−11
19−D
ec−1
120
−Feb
−12
23−A
pr−1
225
−Jun
−12
27−A
ug−1
229
−Oct
−12
●
●
●
●
●
●
● ●
●
●
●
●
●
●
●
●
●
●
●
●
●
●
●
●
●
●
●
●
●
●
●
●
●●
●
●
●
●
●
●
●
●
●
●
●
●
●
●
●
●
●
●
●
●
●
●
●
●
●
●
●
●
●
●
●
●
●
●
●
●
●
●
●
●
●
●
●
●
●
● ●
●
●
●
●
●
●
●●
●
●
●
●●
●
●
●
●
●
●
●
●
●
●
●
●
●
●
●
●
●
● ●
●
● ●
●
● ●
● ●
●
●
●
●
●
●
●
●
●
●
● ●
●
●
●
●
●
●
●
●
●
●
●
●●
●●
●
●
●
●●
●
●
●
●
●
●
●
●
●
●
●
●
●
●
●
●
●
●
●
●
●
● ●
●
●
●
●
●
●
●
●
●
●
●
●
●
●
●
●
●
●
●
●
●
●
●
●
●
●
●
●
●
●
●
●
●●
●
●
●
●
●
●
●●
●
●
●
●
●
●
●
●
●
●
●
●
●
●
●
●
●
●
●
● ●
●
●
●
●
●
●
●
●
●
0
10
20
30
40
50
Adv
ertis
ing
Exp
endi
ture
($
Mill
ion)
● Quality Value Satisfaction
0
20
40
60
Pos
itive
Bra
nd A
ttitu
de (
%)
3−M
ar−0
85−
May
−08
7−Ju
l−08
8−S
ep−0
810
−Nov
−08
12−J
an−0
916
−Mar
−09
18−M
ay−0
920
−Jul
−09
21−S
ep−0
923
−Nov
−09
25−J
an−1
029
−Mar
−10
31−M
ay−1
02−
Aug
−10
4−O
ct−1
06−
Dec
−10
7−Fe
b−11
11−A
pr−1
113
−Jun
−11
15−A
ug−1
117
−Oct
−11
19−D
ec−1
120
−Feb
−12
23−A
pr−1
225
−Jun
−12
27−A
ug−1
229
−Oct
−12
●
● ●
●
●
●
●
●
●
●
●
●
●
●
● ●
●
●
●
●
● ●
●
●
●
●
●
●
●
●
● ●
●
●
●
●
●
●
●
●
●
●
●
●
● ●
●
●
●
●
●
● ●
●
●
●
●
●
●
●
●
●
●●
●
●
●
●
●
● ●
●
●
●
●●
●
●
●
●
●
●
●
●
●
●
●
●
●●
●
●
●
●
●
●●
●
●
●
●
●
● ●
●
●
●
●
●
●
●
● ●
●
●
●
●
●
●
●
●
●
●
●
●
●
●
●
●
●
●
●
●
●
●
●●
●
●
●
●
●
●
●
●
●
●
●
●
●
●
●
●
●
●
●
●
●
●
●
●
●
●
●
●
●
●●
●
●
●
●
●
●
●
●
●
●
●
●
● ●
●
●
●
●
●
●
●●
●
●
●
●
●
●
●
●
●
●
●
●
●
●
●
●
● ●
●
●
●
●
●
●
●
●
●
●
●
●
●
● ●
●
●
●
●
●
● ●
●
●
● ●
●
●
● ●
●
●
●
●
●
●
●
●
●
●
0
10
20
30
Adv
ertis
ing
Exp
endi
ture
($
Mill
ion)
● Quality Value Satisfaction
C. Ford D. Apple
0
10
20
30
40
50
60
Pos
itive
Bra
nd A
ttitu
de (
%)
3−M
ar−0
85−
May
−08
7−Ju
l−08
8−S
ep−0
810
−Nov
−08
12−J
an−0
916
−Mar
−09
18−M
ay−0
920
−Jul
−09
21−S
ep−0
923
−Nov
−09
25−J
an−1
029
−Mar
−10
31−M
ay−1
02−
Aug
−10
4−O
ct−1
06−
Dec
−10
7−Fe
b−11
11−A
pr−1
113
−Jun
−11
15−A
ug−1
117
−Oct
−11
19−D
ec−1
120
−Feb
−12
23−A
pr−1
225
−Jun
−12
27−A
ug−1
229
−Oct
−12
●
●
●
●
●
●
●●
●
●
●
●
●
●
●
●
●
●
●
●
●
●
●
●
●
●
●
●
●
●
●
●
●
●
●
●
● ●●
●
●
●
●●
●
●●
●
●
●
●
●
●
●
●
●
●
●
●
●
●
●
●
●
●
●
● ●
●
●●
●
●
●●
●
●●
●
●
● ● ●●
●
●
●
●
●
●
●
●
●
●
●
●
●
●
●
●
●
●
●
●
● ●
●
●
●
●
●
●
●
●
●
●
●
●
●
●
●
●
●
●
●
●●
●
●
●
●
●
●
●
●
●
●
●
●
●
●
●
●
●
●
●
●
●
●
●
●
●
●
●
●
●
●
●
●
●
●
●
●
●
●
●
●
●
●
●
●
●
●
●
●
●
●
●
●
● ●
●
●
●
●
●
●
●
●
●
●
●
●
●●
●
●
●
●
●
●
●
●
●
●
●●
●
●
●
● ●
●
●
●
●
●
●●
●
●
●
●
●
●
●
●
●
●
●
●
●
●
●
●
●
●
●
●
●
●
●
●
●
●
●
●
●
0
10
20
30
40
50
60
Adv
ertis
ing
Exp
endi
ture
($
Mill
ion)
● Quality Value Satisfaction
0
20
40
60
Pos
itive
Bra
nd A
ttitu
de (
%)
3−M
ar−0
85−
May
−08
7−Ju
l−08
8−S
ep−0
810
−Nov
−08
12−J
an−0
916
−Mar
−09
18−M
ay−0
920
−Jul
−09
21−S
ep−0
923
−Nov
−09
25−J
an−1
029
−Mar
−10
31−M
ay−1
02−
Aug
−10
4−O
ct−1
06−
Dec
−10
7−Fe
b−11
11−A
pr−1
113
−Jun
−11
15−A
ug−1
117
−Oct
−11
19−D
ec−1
120
−Feb
−12
23−A
pr−1
225
−Jun
−12
27−A
ug−1
229
−Oct
−12
●
●
●
●
●
●
●
●
●
●
●
●
●
●
●
●
●
●
●
●
●
●
●
●●
●
● ●
●
●
●
●
●
●
●●
●
●
●
●
●
●
●
●
●●
●
●
●
●
●
● ●
●
●
●
●
●
●
●
●
●
●
●
●
●
●
●
●
●
●
●
●
●
●
●
●
●
●
●
●
●
●
●
●
●
●
●
●
●
●
●
●
●
●
●
●
●
●
●
●
●
●●
●
●
●
●
●
●
●
●
●
●
●
●
●
●
●
●
●
●
●
●
●
●
●
●
●
●
●
●
●
●
●
●
● ●
●
●
●
●
●
●
●
●
●
●
●
●
●
●
●
●
●
●●
●
●
●
●
●
●
●
●
●
●
●
●
●
●
●
●
●
●
●
●
●
●
●
●
●
●
●
●
●●
●
●
●●
●
●
●●
●
●
●
●●
●
●
●
●
●
●
●
●
●
●
●●
●
●
●
●
●
●
●
●
●
●
●
●
●
●
●
●
●
●
●
●
●
●
●
●
●
●
●
●
●
●
●
●
●
●
●
●
0
10
20
30
Adv
ertis
ing
Exp
endi
ture
($
Mill
ion)
● Quality Value Satisfaction
17
Marketing Science Institute Working Paper Series
Finally, Apple’s brand attitudes (Panel D) were fairly stable throughout the sample period.
However, the three attitude metrics differed substantially, as perceived quality (about 60%)
was far higher than perceived value (about 40%), which in turn substantially exceeded recent
satisfaction (about 30%). As in the other case studies, the brand’s ad spend varied substantially,
though it is again difficult to see a correspondence between advertising and brand attitudes.
Several aspects of these four case studies replicate broadly throughout the sample. First,
weekly brand attitude data generally vary around stable long-run averages. For this reason, we
will use the number of survey respondents in each brand/week/metric observation to differen-
tially weight observations according to how informative each observation is. Second, ad spend
data are highly variable across weeks within each advertiser/quarter, though annual totals of
advertising spend typically do not change much. Third, the relationship between advertising
expenditure and brand attitudes is difficult to discern visually, even across long time horizons,
motivating an econometric modeling approach to isolate the effects of advertising from possible
confounding variables. Fourth, non-advertising events (such as the Toyota product harm crisis)
may change brand attitudes significantly, suggesting a substantial importance of controlling for
such confounds in a modeling framework.
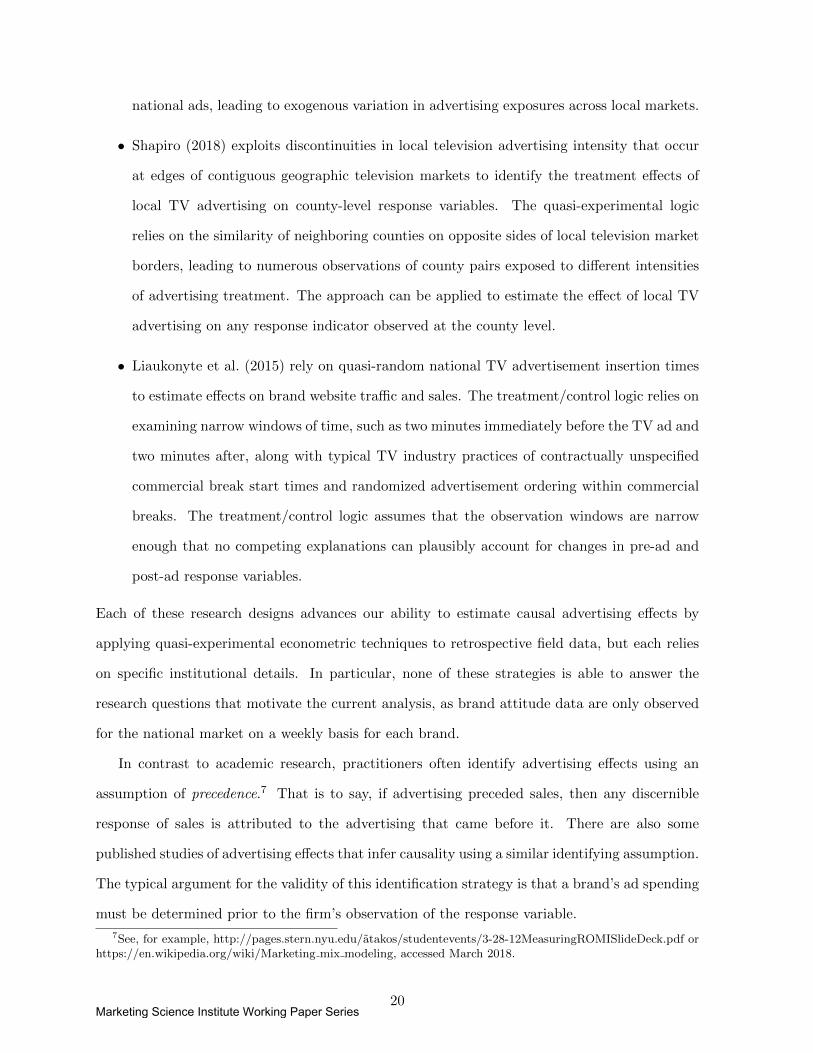
Finally, we use the 252 weeks of data to construct brand-level correlations among the key
variables. Table 4 presents the medians and central 90% ranges of the brand-level correlations.
Overall, brand attitude metrics are positively correlated with each other for most brands, with
median correlations ranging from .10-.13. Among the ad spend variables, national and local
traditional advertising are the most highly correlated (median of .24) whereas digital is weakly
correlated with each (median .06 with national, .04 with local). Finally, confirming what we saw
in the four brand case studies, the median correlations between brand attitudes and ad spend
measures are all near zero, ranging from .00 (digital/satisfaction) to .03 (national/quality and
national/value).
18Marketing Science Institute Working Paper Series
Table 4: 5th, 50th, and 95th Percentiles among Brand-level Correlations
Perceived Quality Perceived Value Recent Sat. Nat’l Trad. Local Trad. Digital
Perceived Quality 1Perceived Value [-.04, .12, .49] 1Recent Satisfaction [-.04, .13, .51] [-.06, .10, .47] 1
National Trad. [-.14, .03, .22] [-.12, .03, .22] [-.13, .02, .20] 1Local Trad. [-.15, .01, .20] [-.14, .02, .16] [-.14, .01, .18] [-.05, .24, .62] 1Digital [-.19, .01, .19] [-.14, .01, .18] [-.16, .00, .18] [-.09, .06, .38] [-.10, .04, .33] 1
3 Endogeneity, Identifying Assumptions and Control Variables
Numerous measurement and endogeneity problems arise in advertising response estimation. Tra-
ditional mass media advertisements are simultaneously transmitted to many people, either at
the national or local level. Firms can often obtain noisy estimates of ad reach, and they can often
directly measure or estimate the number of conversions (e.g. store visits, sales, leads accrued)
that occurred after the message was transmitted. However, in the case of traditional advertising,
they typically cannot link advertisement exposure with conversions at the individual level, as is
often possible in digital advertising. In both traditional and digital advertising, it is difficult to
separate advertising treatment effects from strategic targeting policies. In all cases, the funda-
mental difficulty is in determining what conversions would have occurred had the advertising not
taken place. Estimation of weak advertising effects in statistically noisy environments is further
complicated by frequent consumer disregard or avoidance of advertisements; repeated exposures
and possibly nonlinear effects of ads on sales; frequent misattribution of advertised messages to
competing brands, and other forms of competitive advertising interference; and advertisement
copy rotation, “wear-out” and time-varying message effectiveness.
We are aware of three prominent research designs to estimate quasi-experimental advertising
effects in traditional media. Each exploits particular institutional details:
• Hartmann and Klapper (2018) rely on local variation in regional preferences for watching
featured sports teams, along with the simultaneous carriage of national ads in all local
markets, and the allocation of ad slots to advertisers before the competing teams are
known, to estimate the impact of national Super Bowl ads on local beverage sales. Under
these conditions, each local market has a quasi-random component of its viewership of
19Marketing Science Institute Working Paper Series
national ads, leading to exogenous variation in advertising exposures across local markets.
• Shapiro (2018) exploits discontinuities in local television advertising intensity that occur
at edges of contiguous geographic television markets to identify the treatment effects of
local TV advertising on county-level response variables. The quasi-experimental logic
relies on the similarity of neighboring counties on opposite sides of local television market
borders, leading to numerous observations of county pairs exposed to different intensities
of advertising treatment. The approach can be applied to estimate the effect of local TV
advertising on any response indicator observed at the county level.
• Liaukonyte et al. (2015) rely on quasi-random national TV advertisement insertion times
to estimate effects on brand website traffic and sales. The treatment/control logic relies on
examining narrow windows of time, such as two minutes immediately before the TV ad and
two minutes after, along with typical TV industry practices of contractually unspecified
commercial break start times and randomized advertisement ordering within commercial
breaks. The treatment/control logic assumes that the observation windows are narrow
enough that no competing explanations can plausibly account for changes in pre-ad and
post-ad response variables.
Each of these research designs advances our ability to estimate causal advertising effects by
applying quasi-experimental econometric techniques to retrospective field data, but each relies
on specific institutional details. In particular, none of these strategies is able to answer the
research questions that motivate the current analysis, as brand attitude data are only observed
for the national market on a weekly basis for each brand.
In contrast to academic research, practitioners often identify advertising effects using an
assumption of precedence.7 That is to say, if advertising preceded sales, then any discernible
response of sales is attributed to the advertising that came before it. There are also some
published studies of advertising effects that infer causality using a similar identifying assumption.
The typical argument for the validity of this identification strategy is that a brand’s ad spending
must be determined prior to the firm’s observation of the response variable.
7See, for example, http://pages.stern.nyu.edu/atakos/studentevents/3-28-12MeasuringROMISlideDeck.pdf orhttps://en.wikipedia.org/wiki/Marketing mix modeling, accessed March 2018.
20Marketing Science Institute Working Paper Series
One need not presume much sophistication on the part of a marketer to show that the
precedence assumption can be tainted by unobserved variables. As a simple example, suppose
that a brand knows that demand tends to rise in a promotion week, and that the brand prefers to
advertise more heavily during periods of peak demand; then both sales and advertising could be
simultaneously influenced by the third variable (promotion week), yielding a spurious or inflated
finding of ad effects on sales. Similar arguments can be based on any number of unobserved
variables—e.g., changes in wholesale or retail prices, distribution, product assortments and line
extensions, trade promotions, competitor marketing mix variables—that may correlate with
both advertising and sales.
Arguments against precedence need not depend on unobserved variables. For example, if
the marketer correctly anticipated a likely future change in future revenues, and set ad spend
as a proportion of anticipated future revenues, then ad effect estimates may be biased upward
by simultaneity. The key problem is that the advertising policy function is unobserved by the
econometrician and may depend on anticipation of future changes in the response variable.
Anecdotally, when we discuss such issues with practitioners, we find three typical reactions.
One is an understanding and agreement that advertising response estimates are likely to be
biased, coupled with a belief that biased estimates are likely better than no estimates at all.
Another common response is a gap in understanding endogeneity issues: we rationalize this with
the observation that most business schools did not start teaching causal methods until relatively
recently; large brands have traditionally not screened their marketing recruits for this skill; and
incentives to experiment may be distorted by the principal/agent relationships that are nearly
ubiquitous in practice. The third common refrain is a deep skepticism that brand advertising
decisions are made strategically. Executives in several organizations have told us that their
company sets quarterly or annual advertising budgets and that the agencies allocate the budget
across media programs and weeks without anticipation of likely changes in the market.8
Naturally, we are unable to characterize the full set of endogeneity problems for the 575
brands and 37 different industries represented in these data. Yet we would like to consider how
8We remain circumspect about this argument, as agencies may be aware of their clients’ evaluation functionand act to maximize their own incentives to demonstrate advertising effects to their clients.
21Marketing Science Institute Working Paper Series

various control strategies might influence estimates of advertising effects on brand attitudes in
a broad sample of mature brands that advertise regularly. We consider four main specifications:
1. Descriptive regression with multiple lags of brand advertising and competitor advertising,
controlling for lagged response variables, brand effects, time effects and weighted standard
errors.
2. Descriptive regression (1) with industry/year/week fixed effects added (we call these “in-
dustry/week” effects).
3. Descriptive regression (1) with brand/year/quarter fixed effects added (we call these
“brand/quarter” effects).
4. Descriptive regression (1) with both industry/week and brand/quarter fixed effects added,
21,194 fixed effects in all.
The industry/week fixed effects should control for any industry-level unobservables in a given
week that affect all brands’ advertising expenditures, such as seasonal fluctuations in industry
demand. There are many brands observed within every industry, providing sufficient variation
to estimate a separate industry fixed effect for each week of the sample.
The brand/quarter fixed effects should control for any brand-level unobservables that persist
across weeks within a quarter, such as budgetary changes or persistent changes in unobserved
marketing variables. There are 13 weeks of brand attitude data within each quarter, yielding
sufficient data to estimate a separate brand fixed effect for each quarter in the sample.
In the model that contains both industry/week and brand/quarter fixed effects, the as-
sumption required for causal interpretation is that brand-week fluctuations of ad spending are
uncorrelated with (i) brand-week departures from brand-quarter unobservables and (ii) brand-
week departures from industry-week unobservables. Although still imperfect, this assumption
is much weaker and more plausible than the typical assumption that advertising spend is un-
correlated with brand-week unobservables. We think this assumption is probably reasonable
for most brands whose attitudes are largely stable across quarters, as is typical in the sample
that we study. However, we acknowledge that the assumption may be violated, especially in the
22Marketing Science Institute Working Paper Series
presence of systematic weekly fluctuations in drivers of brand attitudes that can be anticipated
by the brand and are used to set advertising policies.
Of course, what we would really like to control for is brand/week fixed effects, but these
would covary perfectly with the advertising data and therefore would prevent estimation of the
quantities of primary interest. Still, we believe that the two sets of control variables might,
together, handle some common sources of endogeneity and let us offer, at minimum, a first
approximation of the effects of ad spend on brand attitudes. We also think it might be instructive
to observe how the control variables change the qualitative conclusions.
In sum, we try to control for time-varying confounds as much as possible, so the main model
results can be interpreted as causal subject to a clearly specified identifying assumption. As
we await highly powered RCTs in traditional media or more comprehensive quasi-experimental
research designs, we hope that the estimates below may be viewed as suggestive of causal effects,
subject to appropriate caveats, and possibly useful to marketers and their advertising agencies
as they think about how to allocate advertising budgets and apply appropriate control variables
in similar settings.
4 Models
The main goals of this paper are to estimate relationships between brand attitudes and ad spend
variables; to show how these effects vary across types of advertising media; and to illustrate how
control variables change the estimates. We seek to “let the data speak” by specifying simple
models and contrasting the results across comparable metrics and control variables.
We represent the log of one plus any focal brand attitude metric for brand b in industry i in
week t as ybt and the other two metrics with y′bt and y′′bt. The log of one plus national traditional,
local traditional and digital ad spend for brand b in week t are nabt, labt and dabt, respectively;
its competitors’ log of one plus ad spend observed in week t are nacbt, lacbt, and dacbt in national,
local and digital media, respectively.
23Marketing Science Institute Working Paper Series
The model specification is
ybt =
Ty∑τ=1
αyτyb,t−τ +
Ty∑τ=1
αy′τ y′b,t−τ +
Ty∑τ=1
αy′′τ y′′b,t−τ
+
Ta∑τ=0
βnyτ nab,t−τ +
Ta∑τ=0
βlyτ lab,t−τ +
Ta∑τ=0
βdyτ dab,t−τ (1)
+
Ta∑τ=0
βny,cτ nacb,t−τ +
Ta∑τ=0
βly,cτ lacb,t−τ +
Ta∑τ=0
βdy,cτ dacb,t−τ
+ ZbtΘy + εybt.
The number of lags of attitude metrics is held constant at Ty = 13. The model also includes
Ta = 5 lags of each advertising variable, on the theory that the direct effects of advertising
on brand attitudes seem unlikely to persist beyond five weeks. The qualitative results change
remarkably little with Ta, as shown in Table 20 in the appendix.
Zbt specifies the vector of fixed effects. The baseline specification includes fixed effects
for each brand in the sample and for each week in the sample. Subsequent regressions also
include industry/week interactions; brand/quarter interactions; and both industry/week and
brand/quarter interactions.
We use the number of survey respondents for brand attitude y in week t to weight the
standard errors, as brand attitudes based on larger sample sizes are more informative. Parame-
ters for each brand attitude model y are estimated by minimizing {(NyEy)′ · (NyEy)}, where
Ny = [nybt], nybt is the number of survey respondents for brand attitude question y for brand b
in week t, and Ey = [εybt].
5 Findings
We start by comparing fit statistics across models (Table 5). The descriptive model explains
the large majority of variation in the brand attitude data, with adjusted R-squared statistics
ranging from .955 to .978. These high model fit statistics are to be expected, as the brand
attitude data are strongly autocorrelated, and the baseline specification includes lagged brand
attitudes in addition to the 575 brand fixed effects and 252 week fixed effects.
24Marketing Science Institute Working Paper Series
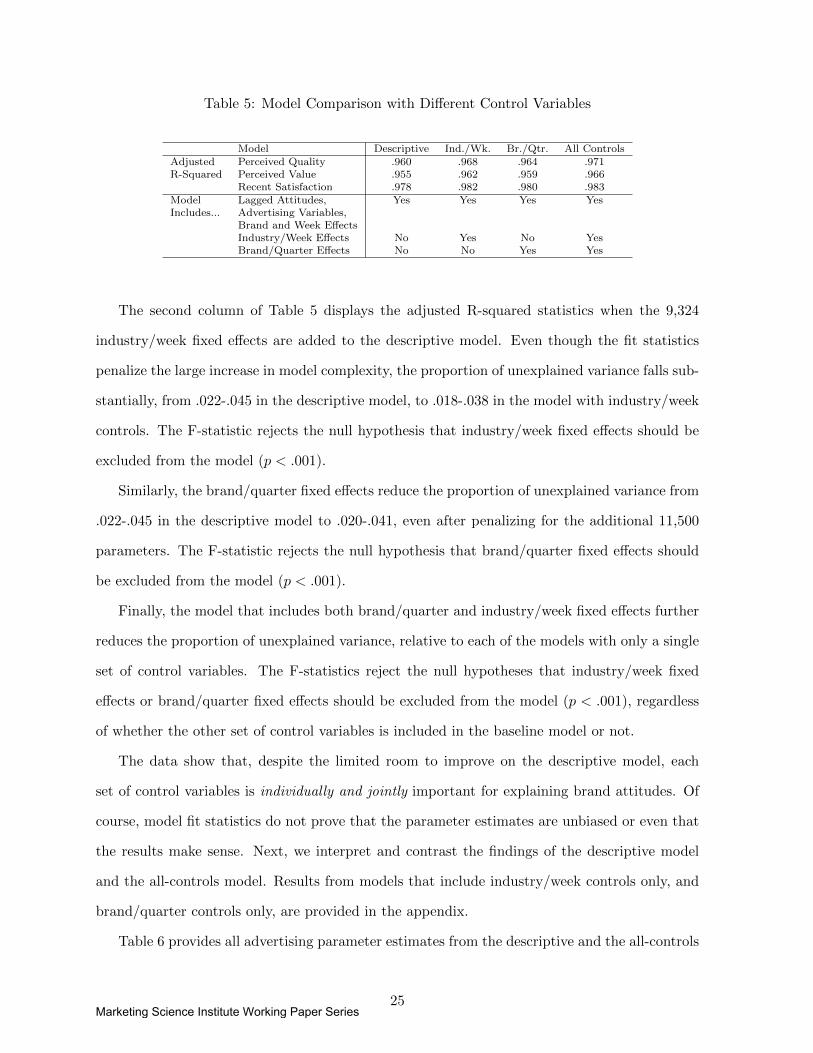
Table 5: Model Comparison with Different Control Variables
Model Descriptive Ind./Wk. Br./Qtr. All ControlsAdjusted Perceived Quality .960 .968 .964 .971R-Squared Perceived Value .955 .962 .959 .966
Recent Satisfaction .978 .982 .980 .983Model Lagged Attitudes, Yes Yes Yes YesIncludes... Advertising Variables,
Brand and Week EffectsIndustry/Week Effects No Yes No YesBrand/Quarter Effects No No Yes Yes
The second column of Table 5 displays the adjusted R-squared statistics when the 9,324
industry/week fixed effects are added to the descriptive model. Even though the fit statistics
penalize the large increase in model complexity, the proportion of unexplained variance falls sub-
stantially, from .022-.045 in the descriptive model, to .018-.038 in the model with industry/week
controls. The F-statistic rejects the null hypothesis that industry/week fixed effects should be
excluded from the model (p < .001).
Similarly, the brand/quarter fixed effects reduce the proportion of unexplained variance from
.022-.045 in the descriptive model to .020-.041, even after penalizing for the additional 11,500
parameters. The F-statistic rejects the null hypothesis that brand/quarter fixed effects should
be excluded from the model (p < .001).
Finally, the model that includes both brand/quarter and industry/week fixed effects further
reduces the proportion of unexplained variance, relative to each of the models with only a single
set of control variables. The F-statistics reject the null hypotheses that industry/week fixed
effects or brand/quarter fixed effects should be excluded from the model (p < .001), regardless
of whether the other set of control variables is included in the baseline model or not.
The data show that, despite the limited room to improve on the descriptive model, each
set of control variables is individually and jointly important for explaining brand attitudes. Of
course, model fit statistics do not prove that the parameter estimates are unbiased or even that
the results make sense. Next, we interpret and contrast the findings of the descriptive model
and the all-controls model. Results from models that include industry/week controls only, and
brand/quarter controls only, are provided in the appendix.
Table 6 provides all advertising parameter estimates from the descriptive and the all-controls
25Marketing Science Institute Working Paper Series
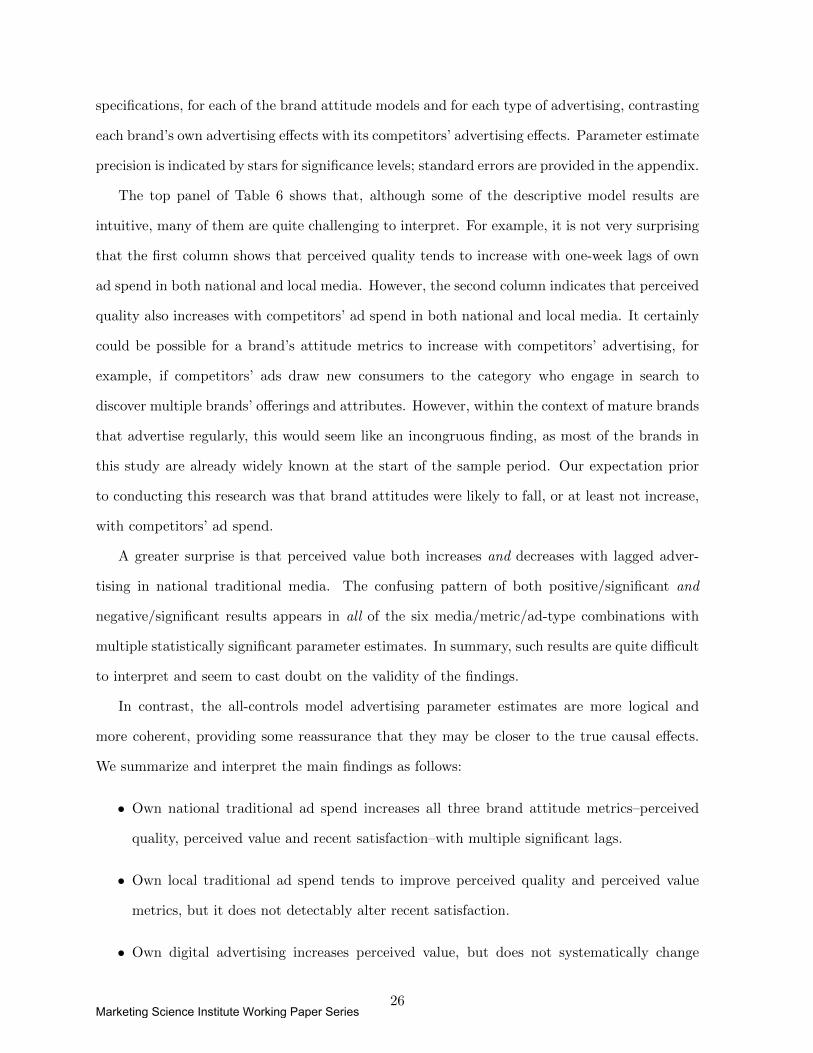
specifications, for each of the brand attitude models and for each type of advertising, contrasting
each brand’s own advertising effects with its competitors’ advertising effects. Parameter estimate
precision is indicated by stars for significance levels; standard errors are provided in the appendix.
The top panel of Table 6 shows that, although some of the descriptive model results are
intuitive, many of them are quite challenging to interpret. For example, it is not very surprising
that the first column shows that perceived quality tends to increase with one-week lags of own
ad spend in both national and local media. However, the second column indicates that perceived
quality also increases with competitors’ ad spend in both national and local media. It certainly
could be possible for a brand’s attitude metrics to increase with competitors’ advertising, for
example, if competitors’ ads draw new consumers to the category who engage in search to
discover multiple brands’ offerings and attributes. However, within the context of mature brands
that advertise regularly, this would seem like an incongruous finding, as most of the brands in
this study are already widely known at the start of the sample period. Our expectation prior
to conducting this research was that brand attitudes were likely to fall, or at least not increase,
with competitors’ ad spend.
A greater surprise is that perceived value both increases and decreases with lagged adver-
tising in national traditional media. The confusing pattern of both positive/significant and
negative/significant results appears in all of the six media/metric/ad-type combinations with
multiple statistically significant parameter estimates. In summary, such results are quite difficult
to interpret and seem to cast doubt on the validity of the findings.
In contrast, the all-controls model advertising parameter estimates are more logical and
more coherent, providing some reassurance that they may be closer to the true causal effects.
We summarize and interpret the main findings as follows:
• Own national traditional ad spend increases all three brand attitude metrics–perceived
quality, perceived value and recent satisfaction–with multiple significant lags.
• Own local traditional ad spend tends to improve perceived quality and perceived value
metrics, but it does not detectably alter recent satisfaction.
• Own digital advertising increases perceived value, but does not systematically change
26Marketing Science Institute Working Paper Series
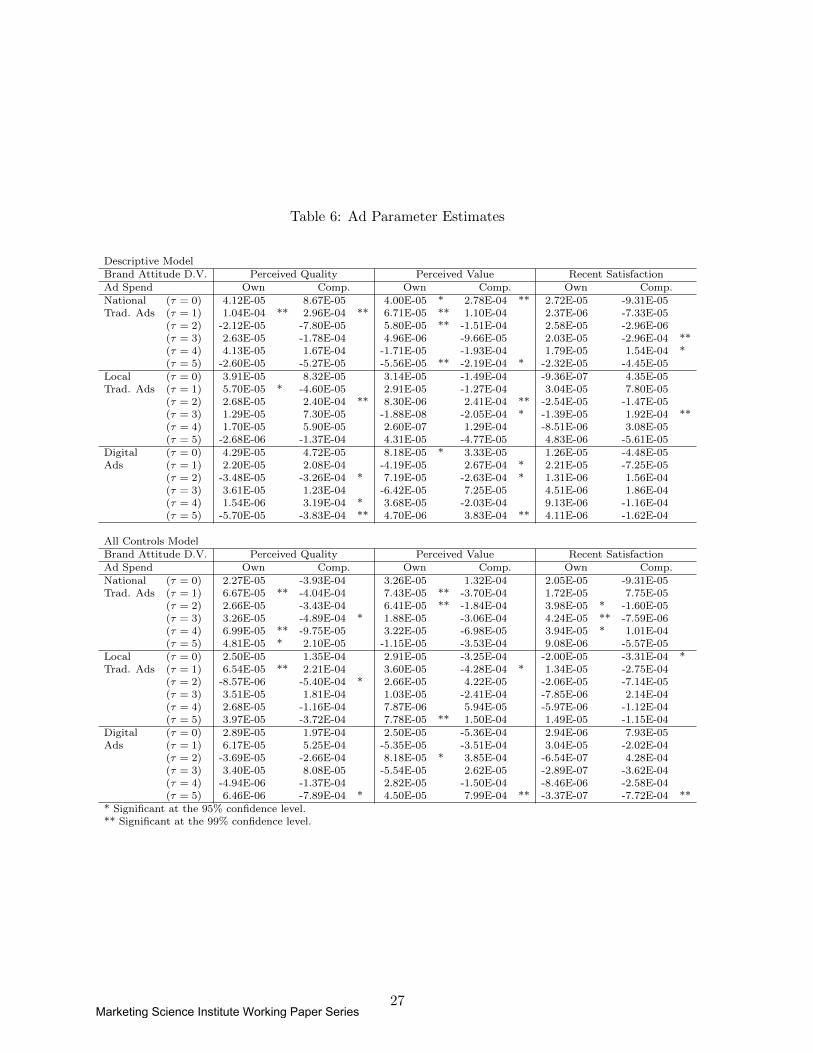
Table 6: Ad Parameter Estimates
Descriptive ModelBrand Attitude D.V. Perceived Quality Perceived Value Recent SatisfactionAd Spend Own Comp. Own Comp. Own Comp.National (τ = 0) 4.12E-05 8.67E-05 4.00E-05 * 2.78E-04 ** 2.72E-05 -9.31E-05Trad. Ads (τ = 1) 1.04E-04 ** 2.96E-04 ** 6.71E-05 ** 1.10E-04 2.37E-06 -7.33E-05
(τ = 2) -2.12E-05 -7.80E-05 5.80E-05 ** -1.51E-04 2.58E-05 -2.96E-06(τ = 3) 2.63E-05 -1.78E-04 4.96E-06 -9.66E-05 2.03E-05 -2.96E-04 **(τ = 4) 4.13E-05 1.67E-04 -1.71E-05 -1.93E-04 1.79E-05 1.54E-04 *(τ = 5) -2.60E-05 -5.27E-05 -5.56E-05 ** -2.19E-04 * -2.32E-05 -4.45E-05
Local (τ = 0) 3.91E-05 8.32E-05 3.14E-05 -1.49E-04 -9.36E-07 4.35E-05Trad. Ads (τ = 1) 5.70E-05 * -4.60E-05 2.91E-05 -1.27E-04 3.04E-05 7.80E-05
(τ = 2) 2.68E-05 2.40E-04 ** 8.30E-06 2.41E-04 ** -2.54E-05 -1.47E-05(τ = 3) 1.29E-05 7.30E-05 -1.88E-08 -2.05E-04 * -1.39E-05 1.92E-04 **(τ = 4) 1.70E-05 5.90E-05 2.60E-07 1.29E-04 -8.51E-06 3.08E-05(τ = 5) -2.68E-06 -1.37E-04 4.31E-05 -4.77E-05 4.83E-06 -5.61E-05
Digital (τ = 0) 4.29E-05 4.72E-05 8.18E-05 * 3.33E-05 1.26E-05 -4.48E-05Ads (τ = 1) 2.20E-05 2.08E-04 -4.19E-05 2.67E-04 * 2.21E-05 -7.25E-05
(τ = 2) -3.48E-05 -3.26E-04 * 7.19E-05 -2.63E-04 * 1.31E-06 1.56E-04(τ = 3) 3.61E-05 1.23E-04 -6.42E-05 7.25E-05 4.51E-06 1.86E-04(τ = 4) 1.54E-06 3.19E-04 * 3.68E-05 -2.03E-04 9.13E-06 -1.16E-04(τ = 5) -5.70E-05 -3.83E-04 ** 4.70E-06 3.83E-04 ** 4.11E-06 -1.62E-04
All Controls ModelBrand Attitude D.V. Perceived Quality Perceived Value Recent SatisfactionAd Spend Own Comp. Own Comp. Own Comp.National (τ = 0) 2.27E-05 -3.93E-04 3.26E-05 1.32E-04 2.05E-05 -9.31E-05Trad. Ads (τ = 1) 6.67E-05 ** -4.04E-04 7.43E-05 ** -3.70E-04 1.72E-05 7.75E-05
(τ = 2) 2.66E-05 -3.43E-04 6.41E-05 ** -1.84E-04 3.98E-05 * -1.60E-05(τ = 3) 3.26E-05 -4.89E-04 * 1.88E-05 -3.06E-04 4.24E-05 ** -7.59E-06(τ = 4) 6.99E-05 ** -9.75E-05 3.22E-05 -6.98E-05 3.94E-05 * 1.01E-04(τ = 5) 4.81E-05 * 2.10E-05 -1.15E-05 -3.53E-04 9.08E-06 -5.57E-05
Local (τ = 0) 2.50E-05 1.35E-04 2.91E-05 -3.25E-04 -2.00E-05 -3.31E-04 *Trad. Ads (τ = 1) 6.54E-05 ** 2.21E-04 3.60E-05 -4.28E-04 * 1.34E-05 -2.75E-04
(τ = 2) -8.57E-06 -5.40E-04 * 2.66E-05 4.22E-05 -2.06E-05 -7.14E-05(τ = 3) 3.51E-05 1.81E-04 1.03E-05 -2.41E-04 -7.85E-06 2.14E-04(τ = 4) 2.68E-05 -1.16E-04 7.87E-06 5.94E-05 -5.97E-06 -1.12E-04(τ = 5) 3.97E-05 -3.72E-04 7.78E-05 ** 1.50E-04 1.49E-05 -1.15E-04
Digital (τ = 0) 2.89E-05 1.97E-04 2.50E-05 -5.36E-04 2.94E-06 7.93E-05Ads (τ = 1) 6.17E-05 5.25E-04 -5.35E-05 -3.51E-04 3.04E-05 -2.02E-04
(τ = 2) -3.69E-05 -2.66E-04 8.18E-05 * 3.85E-04 -6.54E-07 4.28E-04(τ = 3) 3.40E-05 8.08E-05 -5.54E-05 2.62E-05 -2.89E-07 -3.62E-04(τ = 4) -4.94E-06 -1.37E-04 2.82E-05 -1.50E-04 -8.46E-06 -2.58E-04(τ = 5) 6.46E-06 -7.89E-04 * 4.50E-05 7.99E-04 ** -3.37E-07 -7.72E-04 **
* Significant at the 95% confidence level.** Significant at the 99% confidence level.
27Marketing Science Institute Working Paper Series

perceived quality or recent satisfaction.
• Competitors’ national traditional ad spend negatively impacts perceived quality, but does
not reliably change perceived value or recent satisfaction metrics.
• Competitors’ local traditional advertising tends to reduce brands’ perceived quality, per-
ceived value and recent satisfaction metrics.
• Competitors’ digital ads tend to reduce perceived quality and recent satisfaction measures,
as expected. Perhaps surprisingly, competitor digital ads tend to increase perceived value.
Table 7 presents the estimates of lagged brand attitudes within each model. As one would
expect, brand attitudes are strongly correlated across time and metrics. Inclusion of the
brand/quarter control variables primarily changes the correlation between each dependent vari-
able and its own lags from positive to negative. This is because the brand/quarter estimates
control for local trends in brand attitudes, so the model including brand/quarter fixed effects
produces autocorrelation parameter estimates that reflect the tendency toward local mean re-
version observed in Figure 4.
To summarize the primary findings, the all-controls model indicates that (i) brand attitude
metrics all rise with multiple lags of the brand’s own national traditional advertising; (ii) local
traditional ads increase quality and value perceptions; (iii) digital ads increase perceived value;
(iv) the effects of competitors’ ads are generally negative. Further, inclusion of proper con-
trol variables produces patterns of effects that appear more consistent with expectations than
descriptive results without controls, without major reductions in the number of statistically
significant parameter estimates.
28Marketing Science Institute Working Paper Series
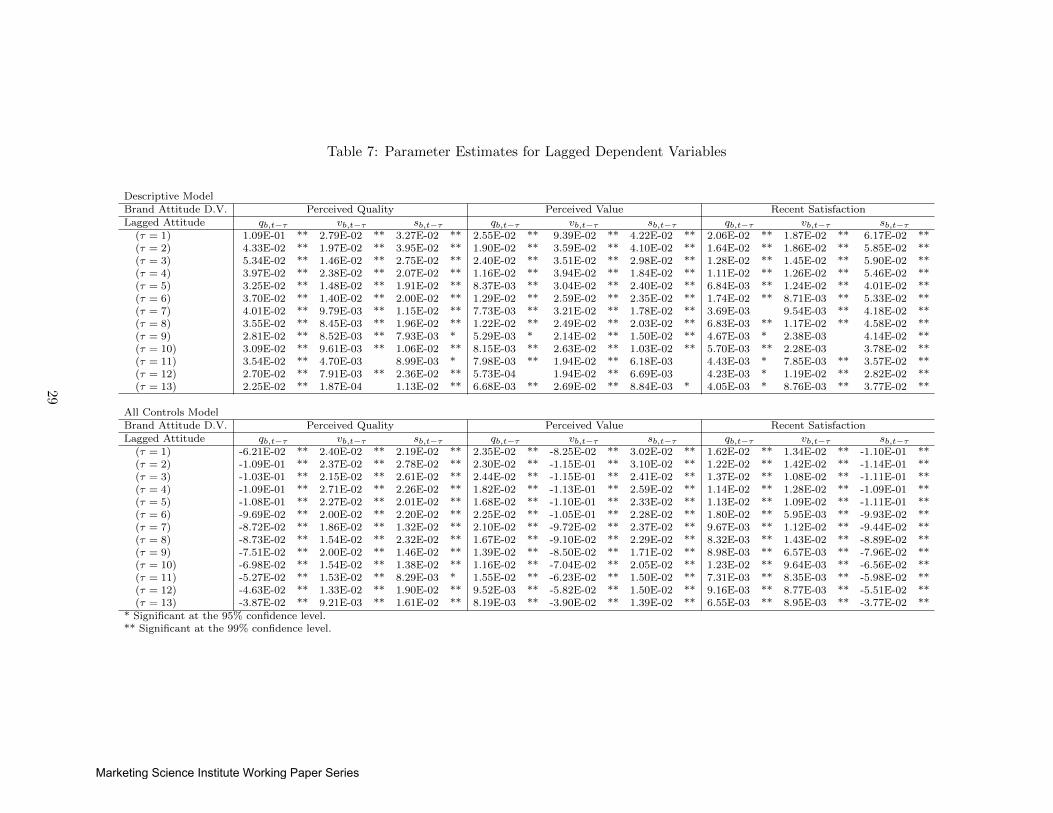
Table 7: Parameter Estimates for Lagged Dependent Variables
Descriptive ModelBrand Attitude D.V. Perceived Quality Perceived Value Recent SatisfactionLagged Attitude qb,t−τ vb,t−τ sb,t−τ qb,t−τ vb,t−τ sb,t−τ qb,t−τ vb,t−τ sb,t−τ
(τ = 1) 1.09E-01 ** 2.79E-02 ** 3.27E-02 ** 2.55E-02 ** 9.39E-02 ** 4.22E-02 ** 2.06E-02 ** 1.87E-02 ** 6.17E-02 **(τ = 2) 4.33E-02 ** 1.97E-02 ** 3.95E-02 ** 1.90E-02 ** 3.59E-02 ** 4.10E-02 ** 1.64E-02 ** 1.86E-02 ** 5.85E-02 **(τ = 3) 5.34E-02 ** 1.46E-02 ** 2.75E-02 ** 2.40E-02 ** 3.51E-02 ** 2.98E-02 ** 1.28E-02 ** 1.45E-02 ** 5.90E-02 **(τ = 4) 3.97E-02 ** 2.38E-02 ** 2.07E-02 ** 1.16E-02 ** 3.94E-02 ** 1.84E-02 ** 1.11E-02 ** 1.26E-02 ** 5.46E-02 **(τ = 5) 3.25E-02 ** 1.48E-02 ** 1.91E-02 ** 8.37E-03 ** 3.04E-02 ** 2.40E-02 ** 6.84E-03 ** 1.24E-02 ** 4.01E-02 **(τ = 6) 3.70E-02 ** 1.40E-02 ** 2.00E-02 ** 1.29E-02 ** 2.59E-02 ** 2.35E-02 ** 1.74E-02 ** 8.71E-03 ** 5.33E-02 **(τ = 7) 4.01E-02 ** 9.79E-03 ** 1.15E-02 ** 7.73E-03 ** 3.21E-02 ** 1.78E-02 ** 3.69E-03 9.54E-03 ** 4.18E-02 **(τ = 8) 3.55E-02 ** 8.45E-03 ** 1.96E-02 ** 1.22E-02 ** 2.49E-02 ** 2.03E-02 ** 6.83E-03 ** 1.17E-02 ** 4.58E-02 **(τ = 9) 2.81E-02 ** 8.52E-03 ** 7.93E-03 * 5.29E-03 * 2.14E-02 ** 1.50E-02 ** 4.67E-03 * 2.38E-03 4.14E-02 **(τ = 10) 3.09E-02 ** 9.61E-03 ** 1.06E-02 ** 8.15E-03 ** 2.63E-02 ** 1.03E-02 ** 5.70E-03 ** 2.28E-03 3.78E-02 **(τ = 11) 3.54E-02 ** 4.70E-03 8.99E-03 * 7.98E-03 ** 1.94E-02 ** 6.18E-03 4.43E-03 * 7.85E-03 ** 3.57E-02 **(τ = 12) 2.70E-02 ** 7.91E-03 ** 2.36E-02 ** 5.73E-04 1.94E-02 ** 6.69E-03 4.23E-03 * 1.19E-02 ** 2.82E-02 **(τ = 13) 2.25E-02 ** 1.87E-04 1.13E-02 ** 6.68E-03 ** 2.69E-02 ** 8.84E-03 * 4.05E-03 * 8.76E-03 ** 3.77E-02 **
All Controls ModelBrand Attitude D.V. Perceived Quality Perceived Value Recent SatisfactionLagged Attitude qb,t−τ vb,t−τ sb,t−τ qb,t−τ vb,t−τ sb,t−τ qb,t−τ vb,t−τ sb,t−τ
(τ = 1) -6.21E-02 ** 2.40E-02 ** 2.19E-02 ** 2.35E-02 ** -8.25E-02 ** 3.02E-02 ** 1.62E-02 ** 1.34E-02 ** -1.10E-01 **(τ = 2) -1.09E-01 ** 2.37E-02 ** 2.78E-02 ** 2.30E-02 ** -1.15E-01 ** 3.10E-02 ** 1.22E-02 ** 1.42E-02 ** -1.14E-01 **(τ = 3) -1.03E-01 ** 2.15E-02 ** 2.61E-02 ** 2.44E-02 ** -1.15E-01 ** 2.41E-02 ** 1.37E-02 ** 1.08E-02 ** -1.11E-01 **(τ = 4) -1.09E-01 ** 2.71E-02 ** 2.26E-02 ** 1.82E-02 ** -1.13E-01 ** 2.59E-02 ** 1.14E-02 ** 1.28E-02 ** -1.09E-01 **(τ = 5) -1.08E-01 ** 2.27E-02 ** 2.01E-02 ** 1.68E-02 ** -1.10E-01 ** 2.33E-02 ** 1.13E-02 ** 1.09E-02 ** -1.11E-01 **(τ = 6) -9.69E-02 ** 2.00E-02 ** 2.20E-02 ** 2.25E-02 ** -1.05E-01 ** 2.28E-02 ** 1.80E-02 ** 5.95E-03 ** -9.93E-02 **(τ = 7) -8.72E-02 ** 1.86E-02 ** 1.32E-02 ** 2.10E-02 ** -9.72E-02 ** 2.37E-02 ** 9.67E-03 ** 1.12E-02 ** -9.44E-02 **(τ = 8) -8.73E-02 ** 1.54E-02 ** 2.32E-02 ** 1.67E-02 ** -9.10E-02 ** 2.29E-02 ** 8.32E-03 ** 1.43E-02 ** -8.89E-02 **(τ = 9) -7.51E-02 ** 2.00E-02 ** 1.46E-02 ** 1.39E-02 ** -8.50E-02 ** 1.71E-02 ** 8.98E-03 ** 6.57E-03 ** -7.96E-02 **(τ = 10) -6.98E-02 ** 1.54E-02 ** 1.38E-02 ** 1.16E-02 ** -7.04E-02 ** 2.05E-02 ** 1.23E-02 ** 9.64E-03 ** -6.56E-02 **(τ = 11) -5.27E-02 ** 1.53E-02 ** 8.29E-03 * 1.55E-02 ** -6.23E-02 ** 1.50E-02 ** 7.31E-03 ** 8.35E-03 ** -5.98E-02 **(τ = 12) -4.63E-02 ** 1.33E-02 ** 1.90E-02 ** 9.52E-03 ** -5.82E-02 ** 1.50E-02 ** 9.16E-03 ** 8.77E-03 ** -5.51E-02 **(τ = 13) -3.87E-02 ** 9.21E-03 ** 1.61E-02 ** 8.19E-03 ** -3.90E-02 ** 1.39E-02 ** 6.55E-03 ** 8.95E-03 ** -3.77E-02 **
* Significant at the 95% confidence level.** Significant at the 99% confidence level.
29
Marketing Science Institute Working Paper Series
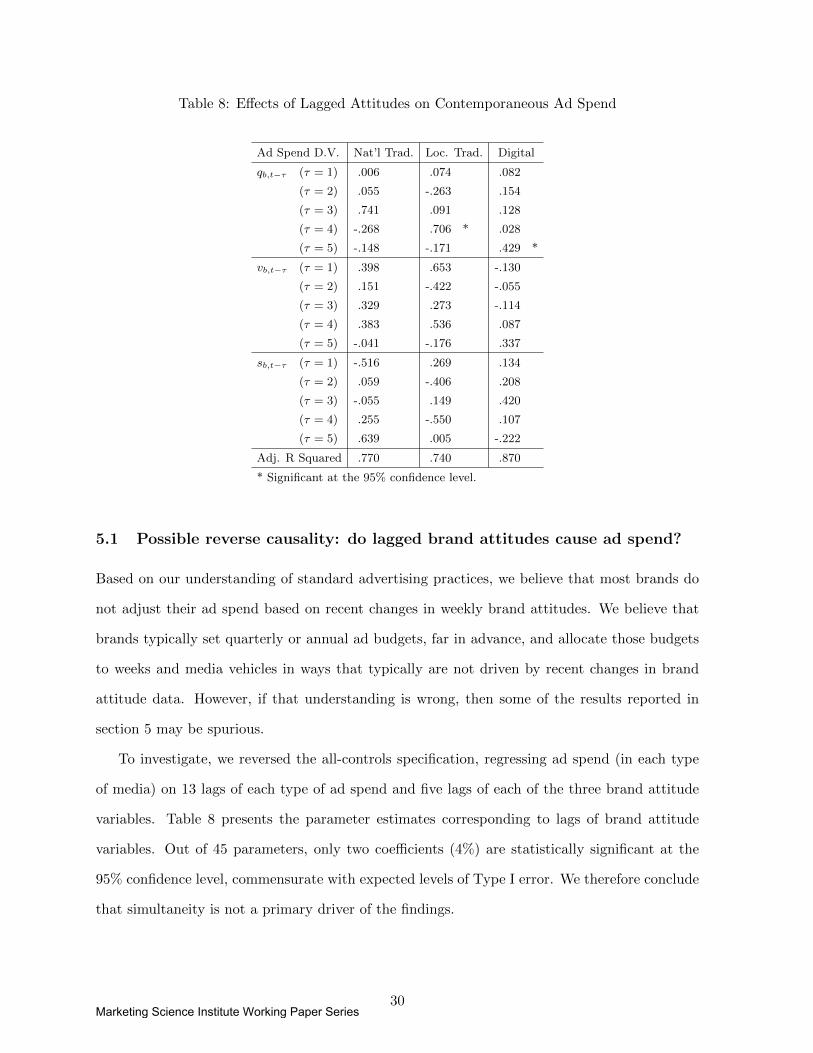
Table 8: Effects of Lagged Attitudes on Contemporaneous Ad Spend
Ad Spend D.V. Nat’l Trad. Loc. Trad. Digital
qb,t−τ (τ = 1) .006 .074 .082
(τ = 2) .055 -.263 .154
(τ = 3) .741 .091 .128
(τ = 4) -.268 .706 * .028
(τ = 5) -.148 -.171 .429 *
vb,t−τ (τ = 1) .398 .653 -.130
(τ = 2) .151 -.422 -.055
(τ = 3) .329 .273 -.114
(τ = 4) .383 .536 .087
(τ = 5) -.041 -.176 .337
sb,t−τ (τ = 1) -.516 .269 .134
(τ = 2) .059 -.406 .208
(τ = 3) -.055 .149 .420
(τ = 4) .255 -.550 .107
(τ = 5) .639 .005 -.222
Adj. R Squared .770 .740 .870
* Significant at the 95% confidence level.
5.1 Possible reverse causality: do lagged brand attitudes cause ad spend?
Based on our understanding of standard advertising practices, we believe that most brands do
not adjust their ad spend based on recent changes in weekly brand attitudes. We believe that
brands typically set quarterly or annual ad budgets, far in advance, and allocate those budgets
to weeks and media vehicles in ways that typically are not driven by recent changes in brand
attitude data. However, if that understanding is wrong, then some of the results reported in
section 5 may be spurious.
To investigate, we reversed the all-controls specification, regressing ad spend (in each type
of media) on 13 lags of each type of ad spend and five lags of each of the three brand attitude
variables. Table 8 presents the parameter estimates corresponding to lags of brand attitude
variables. Out of 45 parameters, only two coefficients (4%) are statistically significant at the
95% confidence level, commensurate with expected levels of Type I error. We therefore conclude
that simultaneity is not a primary driver of the findings.
30Marketing Science Institute Working Paper Series
5.2 Ad effects by industry
Seeking a deeper understanding of the drivers of the main results, we re-estimated the all-controls
model within industry-specific partitions.9 Table 9 presents findings from the perceived quality
model with statistically significant effects in bold. Results from the perceived value and recent
satisfaction models are presented in the appendix.
The main takeaway is that, despite numerous brands available for each industry, the industry-
specific effects exhibit weak statistical power relative to the results calibrated on the full sample.
The industry-specific estimates exhibit rates of statistical significance that approximate that
expected from Type I error alone. Within national traditional ads, only 16 of 222 estimates
(7.2%) are statistically significant at the 95% confidence level; comparable figures for local
traditional and digital, respectively, are 12 of 222 (5.2%) and 11 of 222 (5.0%).
5.3 All Brand Attitude Metrics
We restricted primary attention in the analysis to three particular brand attitude variables that
we thought were most likely to be influenced by advertising and to matter to advertisers. How
do the effects look when we consider all seven available brand attitude metrics? To investigate,
we estimated the all-controls model, but this time for each of the seven brand attitude metrics,
and including 13 lags of all seven metrics in each of the seven models.
Table 10 ad parameter estimates for all seven models. The qualitative conclusions for the
three metrics we have focused on (perceived quality, perceived value and recent satisfaction) are
nearly identical to the findings reported in section 5, showing robustness of the estimates to the
set of brand attitudes considered. The next three attitude metrics (willingness to recommend,
general affect, proud to work) can be positively influenced by own advertising in traditional me-
dia; and the proud-to-work attitude is positively related to own digital advertising. Relationships
to competitor advertising are mixed.
9Industry/week fixed effects were essentially replaced by a separate set of week fixed effects estimated withineach partition.
31Marketing Science Institute Working Paper Series
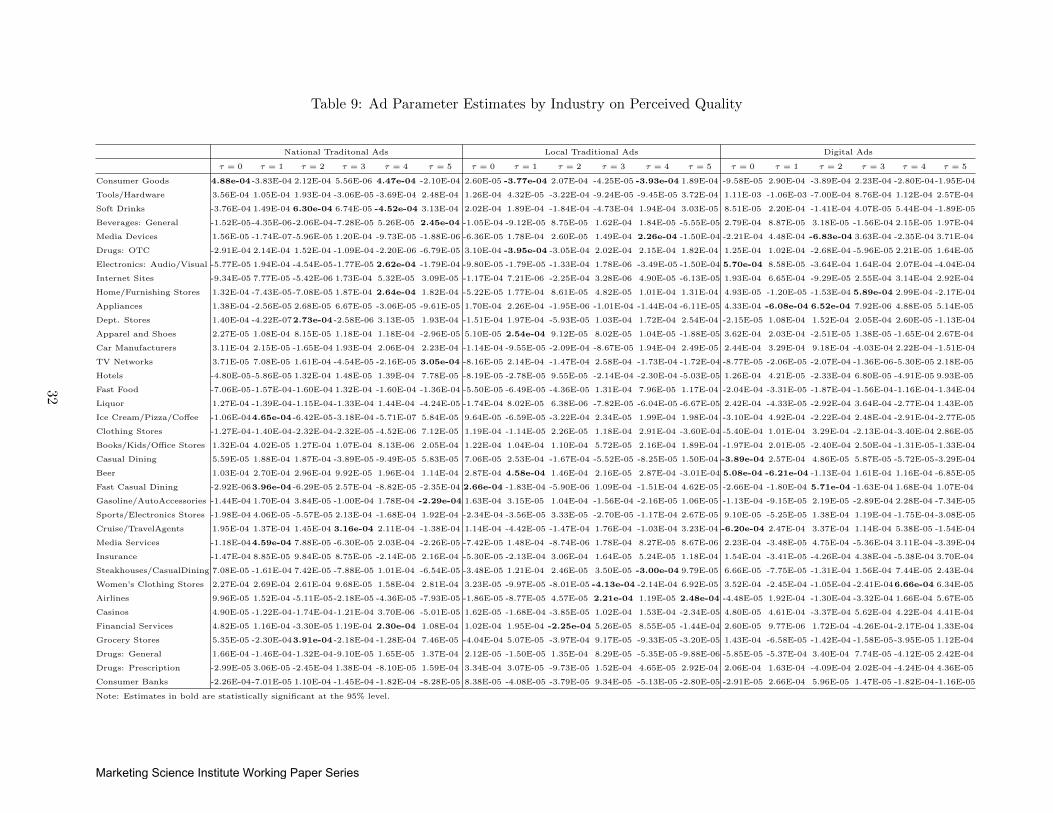
Table 9: Ad Parameter Estimates by Industry on Perceived Quality
National Traditonal Ads Local Traditional Ads Digital Ads
τ = 0 τ = 1 τ = 2 τ = 3 τ = 4 τ = 5 τ = 0 τ = 1 τ = 2 τ = 3 τ = 4 τ = 5 τ = 0 τ = 1 τ = 2 τ = 3 τ = 4 τ = 5
Consumer Goods 4.88e-04 -3.83E-04 2.12E-04 5.56E-06 4.47e-04 -2.10E-04 2.60E-05 -3.77e-04 2.07E-04 -4.25E-05 -3.93e-04 1.89E-04 -9.58E-05 2.90E-04 -3.89E-04 2.23E-04 -2.80E-04-1.95E-04
Tools/Hardware 3.56E-04 1.05E-04 1.93E-04 -3.06E-05 -3.69E-04 2.48E-04 1.26E-04 4.32E-05 -3.22E-04 -9.24E-05 -9.45E-05 3.72E-04 1.11E-03 -1.06E-03 -7.00E-04 8.76E-04 1.12E-04 2.57E-04
Soft Drinks -3.76E-04 1.49E-04 6.30e-04 6.74E-05 -4.52e-04 3.13E-04 2.02E-04 1.89E-04 -1.84E-04 -4.73E-04 1.94E-04 3.03E-05 8.51E-05 2.20E-04 -1.41E-04 4.07E-05 5.44E-04 -1.89E-05
Beverages: General -1.52E-05-4.35E-06-2.06E-04-7.28E-05 5.26E-05 2.45e-04 -1.05E-04 -9.12E-05 8.75E-05 1.62E-04 1.84E-05 -5.55E-05 2.79E-04 8.87E-05 3.18E-05 -1.56E-04 2.15E-05 1.97E-04
Media Devices 1.56E-05 -1.74E-07-5.96E-05 1.20E-04 -9.73E-05 -1.88E-06 -6.36E-05 1.78E-04 2.60E-05 1.49E-04 2.26e-04 -1.50E-04 -2.21E-04 4.48E-04 -6.83e-04 3.63E-04 -2.35E-04 3.71E-04
Drugs: OTC -2.91E-04 2.14E-04 1.52E-04 -1.09E-04 -2.20E-06 -6.79E-05 3.10E-04 -3.95e-04 -3.05E-04 2.02E-04 2.15E-04 1.82E-04 1.25E-04 1.02E-04 -2.68E-04 -5.96E-05 2.21E-05 1.64E-05
Electronics: Audio/Visual -5.77E-05 1.94E-04 -4.54E-05-1.77E-05 2.62e-04 -1.79E-04 -9.80E-05 -1.79E-05 -1.33E-04 1.78E-06 -3.49E-05 -1.50E-04 5.70e-04 8.58E-05 -3.64E-04 1.64E-04 2.07E-04 -4.04E-04
Internet Sites -9.34E-05 7.77E-05 -5.42E-06 1.73E-04 5.32E-05 3.09E-05 -1.17E-04 7.21E-06 -2.25E-04 3.28E-06 4.90E-05 -6.13E-05 1.93E-04 6.65E-04 -9.29E-05 2.55E-04 3.14E-04 2.92E-04
Home/Furnishing Stores 1.32E-04 -7.43E-05-7.08E-05 1.87E-04 2.64e-04 1.82E-04 -5.22E-05 1.77E-04 8.61E-05 4.82E-05 1.01E-04 1.31E-04 4.93E-05 -1.20E-05 -1.53E-04 5.89e-04 2.99E-04 -2.17E-04
Appliances 1.38E-04 -2.56E-05 2.68E-05 6.67E-05 -3.06E-05 -9.61E-05 1.70E-04 2.26E-04 -1.95E-06 -1.01E-04 -1.44E-04 -6.11E-05 4.33E-04 -6.08e-04 6.52e-04 7.92E-06 4.88E-05 5.14E-05
Dept. Stores 1.40E-04 -4.22E-072.73e-04 -2.58E-06 3.13E-05 1.93E-04 -1.51E-04 1.97E-04 -5.93E-05 1.03E-04 1.72E-04 2.54E-04 -2.15E-05 1.08E-04 1.52E-04 2.05E-04 2.60E-05 -1.13E-04
Apparel and Shoes 2.27E-05 1.08E-04 8.15E-05 1.18E-04 1.18E-04 -2.96E-05 5.10E-05 2.54e-04 9.12E-05 8.02E-05 1.04E-05 -1.88E-05 3.62E-04 2.03E-04 -2.51E-05 1.38E-05 -1.65E-04 2.67E-04
Car Manufacturers 3.11E-04 2.15E-05 -1.65E-04 1.93E-04 2.06E-04 2.23E-04 -1.14E-04 -9.55E-05 -2.09E-04 -8.67E-05 1.94E-04 2.49E-05 2.44E-04 3.29E-04 9.18E-04 -4.03E-04 2.22E-04 -1.51E-04
TV Networks 3.71E-05 7.08E-05 1.61E-04 -4.54E-05 -2.16E-05 3.05e-04 -8.16E-05 2.14E-04 -1.47E-04 2.58E-04 -1.73E-04 -1.72E-04 -8.77E-05 -2.06E-05 -2.07E-04 -1.36E-06-5.30E-05 2.18E-05
Hotels -4.80E-05-5.86E-05 1.32E-04 1.48E-05 1.39E-04 7.78E-05 -8.19E-05 -2.78E-05 9.55E-05 -2.14E-04 -2.30E-04 -5.03E-05 1.26E-04 4.21E-05 -2.33E-04 6.80E-05 -4.91E-05 9.93E-05
Fast Food -7.06E-05-1.57E-04-1.60E-04 1.32E-04 -1.60E-04 -1.36E-04 -5.50E-05 -6.49E-05 -4.36E-05 1.31E-04 7.96E-05 1.17E-04 -2.04E-04 -3.31E-05 -1.87E-04 -1.56E-04-1.16E-04-1.34E-04
Liquor 1.27E-04 -1.39E-04-1.15E-04-1.33E-04 1.44E-04 -4.24E-05 -1.74E-04 8.02E-05 6.38E-06 -7.82E-05 -6.04E-05 -6.67E-05 2.42E-04 -4.33E-05 -2.92E-04 3.64E-04 -2.77E-04 1.43E-05
Ice Cream/Pizza/Coffee -1.06E-044.65e-04 -6.42E-05-3.18E-04 -5.71E-07 5.84E-05 9.64E-05 -6.59E-05 -3.22E-04 2.34E-05 1.99E-04 1.98E-04 -3.10E-04 4.92E-04 -2.22E-04 2.48E-04 -2.91E-04-2.77E-05
Clothing Stores -1.27E-04-1.40E-04-2.32E-04-2.32E-05 -4.52E-06 7.12E-05 1.19E-04 -1.14E-05 2.26E-05 1.18E-04 2.91E-04 -3.60E-04 -5.40E-04 1.01E-04 3.29E-04 -2.13E-04-3.40E-04 2.86E-05
Books/Kids/Office Stores 1.32E-04 4.02E-05 1.27E-04 1.07E-04 8.13E-06 2.05E-04 1.22E-04 1.04E-04 1.10E-04 5.72E-05 2.16E-04 1.89E-04 -1.97E-04 2.01E-05 -2.40E-04 2.50E-04 -1.31E-05-1.33E-04
Casual Dining 5.59E-05 1.88E-04 1.87E-04 -3.89E-05 -9.49E-05 5.83E-05 7.06E-05 2.53E-04 -1.67E-04 -5.52E-05 -8.25E-05 1.50E-04 -3.89e-04 2.57E-04 4.86E-05 5.87E-05 -5.72E-05-3.29E-04
Beer 1.03E-04 2.70E-04 2.96E-04 9.92E-05 1.96E-04 1.14E-04 2.87E-04 4.58e-04 1.46E-04 2.16E-05 2.87E-04 -3.01E-04 5.08e-04 -6.21e-04 -1.13E-04 1.61E-04 1.16E-04 -6.85E-05
Fast Casual Dining -2.92E-063.96e-04 -6.29E-05 2.57E-04 -8.82E-05 -2.35E-04 2.66e-04 -1.83E-04 -5.90E-06 1.09E-04 -1.51E-04 4.62E-05 -2.66E-04 -1.80E-04 5.71e-04 -1.63E-04 1.68E-04 1.07E-04
Gasoline/AutoAccessories -1.44E-04 1.70E-04 3.84E-05 -1.00E-04 1.78E-04 -2.29e-04 1.63E-04 3.15E-05 1.04E-04 -1.56E-04 -2.16E-05 1.06E-05 -1.13E-04 -9.15E-05 2.19E-05 -2.89E-04 2.28E-04 -7.34E-05
Sports/Electronics Stores -1.98E-04 4.06E-05 -5.57E-05 2.13E-04 -1.68E-04 1.92E-04 -2.34E-04 -3.56E-05 3.33E-05 -2.70E-05 -1.17E-04 2.67E-05 9.10E-05 -5.25E-05 1.38E-04 1.19E-04 -1.75E-04-3.08E-05
Cruise/TravelAgents 1.95E-04 1.37E-04 1.45E-04 3.16e-04 2.11E-04 -1.38E-04 1.14E-04 -4.42E-05 -1.47E-04 1.76E-04 -1.03E-04 3.23E-04 -6.20e-04 2.47E-04 3.37E-04 1.14E-04 5.38E-05 -1.54E-04
Media Services -1.18E-044.59e-04 7.88E-05 -6.30E-05 2.03E-04 -2.26E-05 -7.42E-05 1.48E-04 -8.74E-06 1.78E-04 8.27E-05 8.67E-06 2.23E-04 -3.48E-05 4.75E-04 -5.36E-04 3.11E-04 -3.39E-04
Insurance -1.47E-04 8.85E-05 9.84E-05 8.75E-05 -2.14E-05 2.16E-04 -5.30E-05 -2.13E-04 3.06E-04 1.64E-05 5.24E-05 1.18E-04 1.54E-04 -3.41E-05 -4.26E-04 4.38E-04 -5.38E-04 3.70E-04
Steakhouses/CasualDining 7.08E-05 -1.61E-04 7.42E-05 -7.88E-05 1.01E-04 -6.54E-05 -3.48E-05 1.21E-04 2.46E-05 3.50E-05 -3.00e-04 9.79E-05 6.66E-05 -7.75E-05 -1.31E-04 1.56E-04 7.44E-05 2.43E-04
Women’s Clothing Stores 2.27E-04 2.69E-04 2.61E-04 9.68E-05 1.58E-04 2.81E-04 3.23E-05 -9.97E-05 -8.01E-05 -4.13e-04 -2.14E-04 6.92E-05 3.52E-04 -2.45E-04 -1.05E-04 -2.41E-046.66e-04 6.34E-05
Airlines 9.96E-05 1.52E-04 -5.11E-05-2.18E-05 -4.36E-05 -7.93E-05 -1.86E-05 -8.77E-05 4.57E-05 2.21e-04 1.19E-05 2.48e-04 -4.48E-05 1.92E-04 -1.30E-04 -3.32E-04 1.66E-04 5.67E-05
Casinos 4.90E-05 -1.22E-04-1.74E-04-1.21E-04 3.70E-06 -5.01E-05 1.62E-05 -1.68E-04 -3.85E-05 1.02E-04 1.53E-04 -2.34E-05 4.80E-05 4.61E-04 -3.37E-04 5.62E-04 4.22E-04 4.41E-04
Financial Services 4.82E-05 1.16E-04 -3.30E-05 1.19E-04 2.30e-04 1.08E-04 1.02E-04 1.95E-04 -2.25e-04 5.26E-05 8.55E-05 -1.44E-04 2.60E-05 9.77E-06 1.72E-04 -4.26E-04-2.17E-04 1.33E-04
Grocery Stores 5.35E-05 -2.30E-043.91e-04 -2.18E-04 -1.28E-04 7.46E-05 -4.04E-04 5.07E-05 -3.97E-04 9.17E-05 -9.33E-05 -3.20E-05 1.43E-04 -6.58E-05 -1.42E-04 -1.58E-05-3.95E-05 1.12E-04
Drugs: General 1.66E-04 -1.46E-04-1.32E-04-9.10E-05 1.65E-05 1.37E-04 2.12E-05 -1.50E-05 1.35E-04 8.29E-05 -5.35E-05 -9.88E-06 -5.85E-05 -5.37E-04 3.40E-04 7.74E-05 -4.12E-05 2.42E-04
Drugs: Prescription -2.99E-05 3.06E-05 -2.45E-04 1.38E-04 -8.10E-05 1.59E-04 3.34E-04 3.07E-05 -9.73E-05 1.52E-04 4.65E-05 2.92E-04 2.06E-04 1.63E-04 -4.09E-04 2.02E-04 -4.24E-04 4.36E-05
Consumer Banks -2.26E-04-7.01E-05 1.10E-04 -1.45E-04 -1.82E-04 -8.28E-05 8.38E-05 -4.08E-05 -3.79E-05 9.34E-05 -5.13E-05 -2.80E-05 -2.91E-05 2.66E-04 5.96E-05 1.47E-05 -1.82E-04-1.16E-05
Note: Estimates in bold are statistically significant at the 95% level.
32
Marketing Science Institute Working Paper Series
The final attitude metric (heard about) is extremely strongly related to all lags of own ad-
vertising in traditional media. These results are unsurprising; the survey instrument explicitly
asks about recent advertising exposure. What is surprising is the absence of any detectable rela-
tionship between “heard about” and own digital advertising. However, it is the case that “heard
about” decreases with contemporaneous competitor digital advertising. Recall that YouGov
panelists answer brand attitude questions online, so the results came from respondents who may
even be skewed more toward digital advertising exposures than the overall population.
5.4 Temporal aggregation
A frequent question in the advertising literature is how temporal (dis)aggregation affects esti-
mation results (see, e.g., Tellis and Franses 2006 and references therein). To investigate, we
aggregated the brand attitude and ad spend variables into two-week and four-week intervals,
then ran comparable versions of the all-controls specification within each dataset. The qualita-
tive results using two-week interval data, which are provided in Table 23 in the appendix, are
very similar to weekly-level all-controls model. The four-week results in Table 24 are also quite
similar, though less so. The aggregated data yield higher proportions of advertising parameters
that are statistically significant at the 95% level, with 39% of advertising parameters exhibiting
statistical significance in the four-week data, followed by 31% and 20% in the two-week and one-
week datasets, respectively. We favor the results based on weekly data, as we believe that they
are more conservative and that the weekly data enable better controls for unobserved confounds.
6 Conclusions, Limitations and Implications
In this research, we analyzed a unique “large-N, large-T” panel dataset of brand attitudes and
advertising expenditures to investigate three specific research questions. We applied straightfor-
ward models to comparable metrics to provide a first evaluation of how ads in different media
may change consumers’ brand attitudes, subject to a clear identifying assumption. We further
showed how those effects are impacted by various controls for unobserved variables, finding that
industry/week and brand/quarter fixed effects are individually and jointly important control
variables whose inclusion brings advertising parameter estimates closer to expectations without
33Marketing Science Institute Working Paper Series

Table 10: Ad Parameter Estimates for All Brand Attitude D.V.’s
Brand Attitude Perceived Perceived Recent Willing to General Proud to HeardD.V. Quality Value Satisfaction Recommend Affect Work AboutOwn (τ = 0) 3.06E-05 3.89E-05 2.35E-05 7.90E-06 2.11E-05 3.37E-05 1.32E-04 **Nat’l (τ = 1) 6.39E-05 ** 7.20E-05 ** 1.59E-05 6.40E-05 ** 5.50E-05 * 6.03E-05 ** 2.55E-04 **Trad. (τ = 2) 1.49E-05 5.19E-05 * 3.48E-05 * 6.63E-06 8.24E-06 -5.91E-06 1.23E-04 **Ads (τ = 3) 1.93E-05 7.84E-06 3.76E-05 * 3.55E-05 1.74E-05 4.47E-05 * 9.23E-05 **
(τ = 4) 5.32E-05 * 1.80E-05 3.26E-05 * 5.94E-06 -5.74E-06 1.24E-05 1.00E-04 **(τ = 5) 2.67E-05 -2.94E-05 2.44E-06 5.57E-06 2.22E-06 1.96E-05 1.12E-04 **
Own (τ = 0) 2.91E-05 3.17E-05 -1.87E-05 5.21E-05 * 3.85E-05 3.48E-05 1.29E-04 **Local (τ = 1) 6.24E-05 ** 3.29E-05 1.22E-05 3.68E-05 6.67E-05 ** 8.39E-05 ** 1.36E-04 **Trad. (τ = 2) -1.85E-05 1.60E-05 -2.60E-05 1.97E-05 6.37E-08 3.00E-05 1.03E-04 **Ads (τ = 3) 2.64E-05 1.11E-06 -1.22E-05 -6.13E-06 4.66E-05 3.37E-05 1.10E-04 **
(τ = 4) 1.41E-05 -2.59E-06 -1.02E-05 2.68E-05 5.78E-06 2.25E-05 5.95E-05 **(τ = 5) 2.33E-05 6.45E-05 ** 8.77E-06 1.39E-05 3.62E-05 -2.28E-05 9.75E-05 **
Own (τ = 0) 2.54E-05 2.40E-05 1.37E-06 5.22E-05 9.35E-06 1.20E-04 ** 5.80E-05Digital (τ = 1) 5.63E-05 -5.93E-05 2.62E-05 -6.81E-05 4.94E-05 -2.25E-05 -2.24E-05Ads (τ = 2) -4.26E-05 7.85E-05 -2.94E-06 6.13E-05 2.83E-05 2.11E-05 4.68E-05
(τ = 3) 2.83E-05 -6.03E-05 -3.02E-06 -1.66E-06 8.22E-07 -1.13E-05 4.38E-05(τ = 4) -1.09E-05 2.29E-05 -1.03E-05 1.72E-05 4.28E-05 -1.19E-05 1.93E-05(τ = 5) -1.23E-05 2.81E-05 -8.79E-06 5.10E-06 -2.87E-05 1.87E-05 4.27E-05
Comp. (τ = 0) -4.46E-04 * 1.06E-04 -1.09E-04 1.28E-05 1.43E-04 8.59E-05 -1.80E-04Nat’l (τ = 1) -4.36E-04 * -3.87E-04 6.75E-05 -5.84E-04 ** -2.58E-04 2.51E-05 -8.95E-04 **Trad. (τ = 2) -3.42E-04 -1.70E-04 -1.42E-05 -1.51E-04 -3.30E-04 1.54E-04 -1.87E-04Ads (τ = 3) -4.95E-04 * -3.00E-04 -1.64E-05 2.92E-04 2.00E-05 5.17E-04 * -6.53E-04 **
(τ = 4) -9.49E-05 -4.91E-05 9.86E-05 -2.92E-04 7.19E-05 -1.40E-04 1.60E-04(τ = 5) 4.92E-05 -3.33E-04 -4.89E-05 -2.52E-04 9.01E-05 -2.22E-04 -1.89E-04
Comp. (τ = 0) 1.37E-04 -3.25E-04 -3.23E-04 * -3.99E-04 -1.05E-04 3.05E-04 -2.40E-05Local (τ = 1) 2.30E-04 -4.09E-04 -2.62E-04 1.73E-04 3.42E-04 -3.80E-04 5.03E-06Trad. (τ = 2) -5.25E-04 * 4.97E-05 -6.31E-05 1.29E-05 6.63E-05 -6.73E-05 4.85E-05Ads (τ = 3) 2.04E-04 -2.17E-04 2.28E-04 -1.06E-04 4.44E-04 * -1.55E-05 9.24E-05
(τ = 4) -8.36E-05 6.34E-05 -1.01E-04 1.10E-04 3.22E-05 -8.14E-06 -3.09E-04(τ = 5) -3.38E-04 1.82E-04 -1.03E-04 9.54E-05 1.08E-04 2.62E-04 -1.00E-04
Comp. (τ = 0) 1.59E-04 -5.74E-04 6.02E-05 6.28E-04 * -1.06E-03 ** 1.90E-04 -6.59E-04 *Digital (τ = 1) 5.16E-04 -3.56E-04 -2.19E-04 -5.35E-04 1.03E-03 ** -2.13E-04 -5.55E-04Ads (τ = 2) -2.47E-04 4.11E-04 4.33E-04 1.01E-04 6.02E-04 -4.38E-04 -4.63E-04
(τ = 3) 1.40E-04 7.19E-05 -3.33E-04 4.05E-04 -2.56E-04 -3.25E-04 1.14E-04(τ = 4) -1.12E-04 -1.32E-04 -2.58E-04 -1.54E-04 6.82E-04 * 2.74E-04 8.20E-05(τ = 5) -7.82E-04 * 7.91E-04 ** -7.97E-04 ** 3.64E-04 -4.80E-04 1.62E-04 -2.40E-04
Adj. R Squared .971 .966 .983 .968 .972 .961 .947* Significant at the 95% confidence level.** Significant at the 99% confidence level.
34Marketing Science Institute Working Paper Series
major reductions in estimation precision. Although the controls employed may not apply per-
fectly to every brand in the sample, we believe that the identifying assumption is reasonable for
most of the brands considered, and that the overall results are likely to approximate the true
effects.
The primary learnings indicate that (i) brand attitude metrics all rise with multiple lags
of the brand’s own national traditional advertising; (ii) local traditional ads increase perceived
quality and perceived value; (iii) digital ads increase perceived value; and (iv) the effects of
competitors’ ads are generally negative. The qualitative results are robust, as the data indicate
that they are not solely driven by the set of brand attitudes considered, the number of lags of
ad spend included in the model, the assumption that ad spend precedes brand attitudes, or the
temporal disaggregation of the data.
In particular, the data seemed to indicate that own digital advertising was less impactful
on brand attitudes than national traditional and local traditional media. The rapid growth
in digital advertising expenditures may reflect efforts that are focused more on direct response
than branding efforts, or are more effective in harming competing brands than on building own
brands. It also could be that the large brands such as P&G and GM which have raised public
questions about digital advertising cost-effectiveness are correct, and that the findings of Lewis
and Rao (2015) and Blake et al. (2015) about small digital ad effects on sales also apply to
digital ad effects on brand attitudes. It is also entirely possible that the measures of digital
ad spend contain greater measurement error than the measures of traditional ad spend, leading
digital estimates to be biased downward. On the other hand, competitor digital ads influenced
all three brand attitude metrics considered, so it is possible to find significant effects of digital
ads on brand atittudes. The data do not allow us to disentangle these competing hypotheses,
so we view these as important and compelling questions for further research.
We hope that the findings and control strategies offered may aid marketers and their agencies
in using data to guide important practical questions such as whether to advertise, how much to
spend, and how to allocate ad budgets. Such empirical guidance may be especially needed in
industries where available data complicate the estimation of causal effects of ads on sales, such
as markets with long purchase cycles or long inter-purchase times. However, it is important to
35Marketing Science Institute Working Paper Series
note that the concerns about statistical power that have been raised in the advertising/sales
literature also apply to advertising effects on brand attitudes. Practitioners interested in esti-
mating precise effects of ad spend on brand attitudes should seriously consider running digital
experiments, randomizing traditional ad spend across time and geography, and using one of the
quasi-experimental approaches outlined in section 3. The data analyzed in this paper provide
insufficient power to estimate precise industry-specific effects, so brand-specific effects would
be even more difficult to estimate. It seems unlikely that many brands can use “media mix
modeling” to estimate precise ad effects on brand attitudes using their own data alone, so prac-
titioners should exercise appropriate caution and skepticism when considering vendors that offer
such services.
This research is subject to numerous caveats and limitations. Prominent among them is that
the findings and control strategies only apply to the set of brands studied, i.e. mature brands
that advertise regularly. We believe they will be of limited use in evolving categories, for new
brands, or for brands that advertise irregularly. Understanding the links between ad spend and
brand attitudes in those situations therefore remains as another topic for future research, as it
likely requires customized approaches to control for unobserved variables that drive both firm
advertising and brand attitudes.
We believe the most important implication of these findings is a renewed call for highly
powered field experiments. Ideally these would run simultaneously across multiple types of
media, vary treatments across time and space, allow for interactions between media, and estimate
treatment effects on multiple comparable behavioral and attitudinal metrics. In particular, such
ambitions should become increasingly feasible as more TV advertising is delivered digitally and
additional targeting capabilities are brought to market (Tuchman et al. 2017). We believe the
advertising industry will eventually reach the point that scientific understanding of causal ad
effects is used to set media budgets that can be provably linked to profit-relevant outcomes. We
hope the results in this paper will offer a useful signpost to help guide hypotheses and statistical
power calculations as the industry makes progress toward such efforts.
36Marketing Science Institute Working Paper Series
References
Ailawadi, Kusum L., Donald R. Lehmann, Scott A. Neslin. 2003. Revenue premium as an outcome
measure of brand equity. Journal of Marketing 67(4) 1–17.
Blake, Thomas, Chris Nosko, Steven Tadelis. 2015. Consumer heterogeneity and paid search effectiveness:
A large scale field experiment. Econometrica 83(1) 155—174.
Borkovsky, Ron N., Avi Goldfarb, Avery M. Haviv, Sridhar Moorthy. 2017. Measuring and understanding
brand value in a dynamic model of brand management. Marketing Science 36(4) 471–499.
Clark, C. Robert, Ulrich Doraszelski, Michaela Draganska. 2009. The effect of advertising on brand aware-
ness and perceived quality: An empirical investigation using panel data. Quantitative Marketing
and Economics 7(2) 207–236.
Danaher, Peter J., Andre Bonfrer, Sanjay Dhar. 2008. The effect of competitive advertising interference
on sales for packaged goods. Journal of Marketing Research 45(2) 211–225.
Danaher, Peter J., Tracey S. Dagger. 2013. Comparing the relative effectiveness of advertising channels:
A case study of a multimedia blitz campaign. Journal of Marketing Research 50 517–534.
Dotson, Jeffrey P., Ruixue Rachel Fan, Elea McDonnell Feit, Jeffrey D. Oldham, Yi-Hsin Yeh. 2017.
Brand attitudes and search engine queries. Journal of Interactive Marketing 37 105–116.
Draganska, Michaela, Wesley R. Hartmann, Gena Stanglein. 2014. Internet versus television advertising:
A brand-building comparison. Journal of Marketing Research 51(5) 578–590.
Draganska, Michaela, Daniel Klapper. 2011. Choice set heterogeneity and the role of advertising: An
analysis with micro and macro data. Journal of Marketing Research 48(4) 653–669.
Du, Rex Yuxing, Kenneth C. Wilbur, Linli Xu. 2017. Should tv advertisers maximize immediate online
response. Working paper .
Gordon, Brett R., Florian Zettelmeyer, Neha Bhargava, Dan Chapsky. 2017. A comparison of approaches
to advertising measurement: Evidence from big field experiments at Facebook. Working paper .
Griliches, Zvi. 1977. Errors in variables and other unobservables. Econometrica 42(6) 971–998.
Hanssens, Dominique M., Koen H. Pauwels, Shuba Srinivasan, Marc Vanhuele, Gokhan Yildirim. 2014.
Consumer attitude metrics for guiding marketing mix decisions. Marketing Science 33(4) 534–550.
Hartmann, Wesley R., Daniel Klapper. 2018. Super bowl ads. Marketing Science 37(1) 78–96.
Hu, Ye, Rex Yuxing Du, Sina Damangir. 2014. Decomposing the impact of advertising: Augmenting
sales with online search data. Journal of Marketing Research 51 300–319.
IAB, Internet Advertising Bureau. 2015. State of viewability transaction 2015. White paper .
Joo, Mingyu, Kenneth C. Wilbur, Bo Cowgill, Yi Zhu. 2014. Television advertising and online search.
Management Science 60(1) 56–73.
Kaul, Anil, Dick R. Wittink. 1995. Empirical generalizations about the impact of advertising on price
sensitivity and price. Marketing Science 14(3) 151–160.
37Marketing Science Institute Working Paper Series
Kent, Robert J., Chris T. Allen. 1994. Competitive interference effects in consumer memory for
advertising- the role of brand familiarity. Journal of Marketing 58 97–105.
Lee, Dokyun, Kartik Hosanagar, Harikesh Nair. 2017. Advertising content and consumer engagement on
social media: Evidence from Facebook. Management Science Forthcoming.
Lewis, Randall A., Justin M. Rao. 2015. The unfavorable economics of measuring the returns to adver-
tising. The Quarterly Journal of Economics 130(4) 1941–1973.
Lewis, Randall A., David H. Reiley. 2014. Online ads and offline sales: Measuring the effect of retail
advertising via a controlled experiment on Yahoo! Quantitative Marketing and Economics 12(3)
235–266.
Liaukonyte, Jura, Thales Teixeira, Kenneth C. Wilbur. 2015. Television advertising and online shopping.
Marketing Science 34(3) 311–330.
Lodish, Leonard M., Magid Abraham, Stuart Kalmenson, Jeanne Livelsberger, Beth Lubetkin, Bruce
Richardson, Mary Ellen Stevens. 1995. How t.v. advertising works A meta-analysis of 389 real
world split cable t.v. advertising experiments. Journal of Marketing Research 32 125–139.
Lovett, Mitchell J., Renana Peres, Linli Xu. 2017. There’s no free lunch conversation: The effect of brand
advertising on word of mouth. Working paper .
Mela, Carl F., Sunil Gupta, Donald R. Lehmann. 1997. The long-term impact of promotion and adver-
tising on consumer brand choice. Journal of Marketing Research 34(2) 248–261.
Owens, Justin W., Evan M. Palmer, Barbara S. Chaparro. 2014. The pervasiveness of text advertising
blindness. Journal of Usability Studies 9(2) 51–69.
Rao, Justin M., Andrey Simonov. 2018. Firms’ reactions to public information on business practices:
Case of search advertising. Working paper .
Shapiro, Bradley. 2018. Positive spillovers and free riding in advertising of prescription pharmaceuticals:
The case of antidepressants. Journal of Political Economy 126(1) 381–437.
Shiller, Benjamin, Joel Waldfogel, Johnny Ryan. 2018. The effect of ad blocking on website traffic and
quality. The RAND Journal of Economics 49(1) 43–63.
Srinivasan, Shuba, Marc Vanhuele, Koen H. Pauwels. 2010. Mind-set metrics in market response models:
An integrative approach. Journal of Marketing Research 47(4) 672–684.
Tellis, Gerard J., Rajesh K. Chandy, Pattana Thaivanish. 2000. Which ad works, when, where and how
often modeling the effects of direct television advertising. Journal of Marketing Research 37 32–46.
Tellis, Gerard J., Philip Hans Franses. 2006. Optimal data interval for estimating advertising response.
Marketing Science 25(3) 217–229.
Tuchman, Anna E., Harikesh S. Nair, Pedro M. Gardete. 2017. Television ad-skipping, consumption com-
plementarities and the consumer demand for advertising. Quantitative Marketing and Economics,
https://doi.org/10.1007/s11129-017-9192-y .
WhiteOps. 2016. The methbot operation. Working paper .
38Marketing Science Institute Working Paper Series

Xu, Linli, Kenneth C. Wilbur, S. Siddarth, Jorge Silva-Risso. 2014. Price advertising by manufacturers
and dealers. Management Science 60(11) 2816–2834.
Yang, Yupin, Qiang (Steven) Lu, Guanting Tang, Jian Pei. 2015. The impact of market competition on
search advertising. Journal of Interactive Marketing 30 46–55.
39Marketing Science Institute Working Paper Series
Appendix
This appendix presents information and results that are not included in the main body for
brevity. Table 11 lists all brands in the sample by industry. Tables 12-15 present ad parameter
estimates and their standard errors in descriptive models, models with industry/week controls,
models with brand/quarter controls, and all-controls models, respectively. Tables 16-19 present
parameter estimates and standard errors for lagged dependent variables in all four models.
Table 20 presents ad parameter estimate variation with number of lags included in the perceived
quality all-controls model specification. Tables 21 and 22 report industry-specific ad parameters
perceived value and recent satisfaction models. Tables 23 and 24 indicate results for the all-
controls models estimated in data aggregated into two-week and four-week intervals.
40Marketing Science Institute Working Paper Series
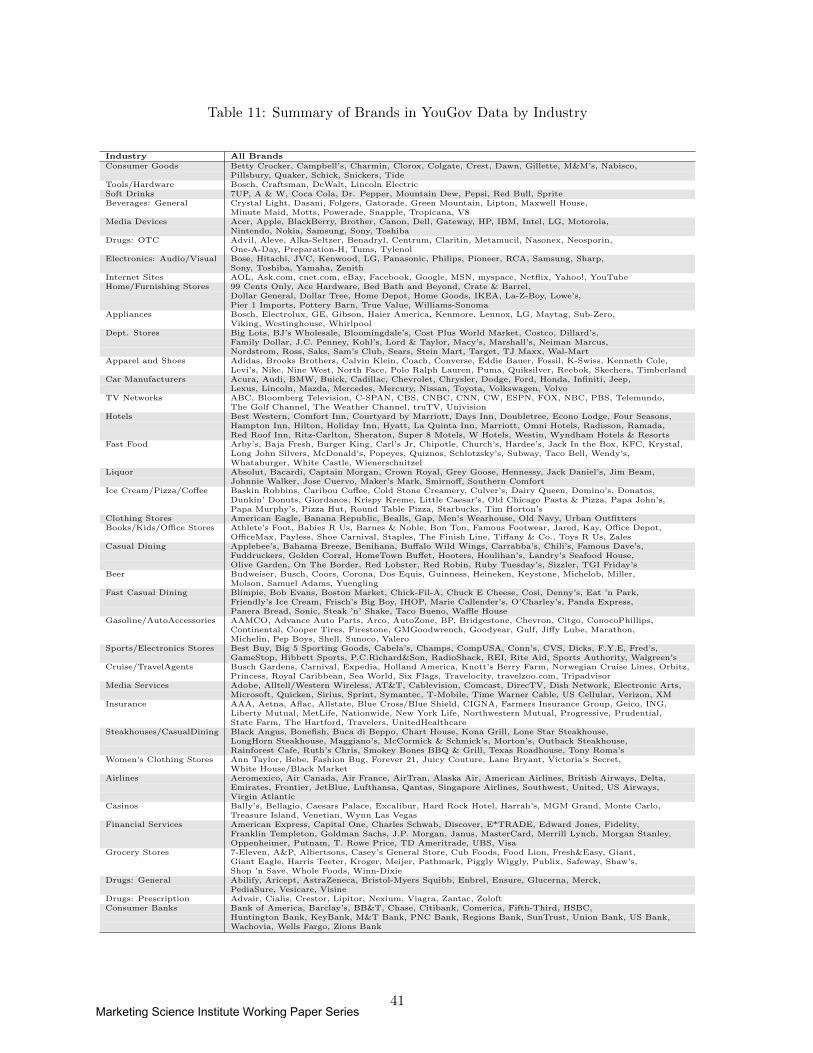
Table 11: Summary of Brands in YouGov Data by Industry
Industry All BrandsConsumer Goods Betty Crocker, Campbell’s, Charmin, Clorox, Colgate, Crest, Dawn, Gillette, M&M’s, Nabisco,
Pillsbury, Quaker, Schick, Snickers, TideTools/Hardware Bosch, Craftsman, DeWalt, Lincoln ElectricSoft Drinks 7UP, A & W, Coca Cola, Dr. Pepper, Mountain Dew, Pepsi, Red Bull, SpriteBeverages: General Crystal Light, Dasani, Folgers, Gatorade, Green Mountain, Lipton, Maxwell House,
Minute Maid, Motts, Powerade, Snapple, Tropicana, V8Media Devices Acer, Apple, BlackBerry, Brother, Canon, Dell, Gateway, HP, IBM, Intel, LG, Motorola,
Nintendo, Nokia, Samsung, Sony, ToshibaDrugs: OTC Advil, Aleve, Alka-Seltzer, Benadryl, Centrum, Claritin, Metamucil, Nasonex, Neosporin,
One-A-Day, Preparation-H, Tums, TylenolElectronics: Audio/Visual Bose, Hitachi, JVC, Kenwood, LG, Panasonic, Philips, Pioneer, RCA, Samsung, Sharp,
Sony, Toshiba, Yamaha, ZenithInternet Sites AOL, Ask.com, cnet.com, eBay, Facebook, Google, MSN, myspace, Netflix, Yahoo!, YouTubeHome/Furnishing Stores 99 Cents Only, Ace Hardware, Bed Bath and Beyond, Crate & Barrel,
Dollar General, Dollar Tree, Home Depot, Home Goods, IKEA, La-Z-Boy, Lowe’s,Pier 1 Imports, Pottery Barn, True Value, Williams-Sonoma
Appliances Bosch, Electrolux, GE, Gibson, Haier America, Kenmore, Lennox, LG, Maytag, Sub-Zero,Viking, Westinghouse, Whirlpool
Dept. Stores Big Lots, BJ’s Wholesale, Bloomingdale’s, Cost Plus World Market, Costco, Dillard’s,Family Dollar, J.C. Penney, Kohl’s, Lord & Taylor, Macy’s, Marshall’s, Neiman Marcus,Nordstrom, Ross, Saks, Sam’s Club, Sears, Stein Mart, Target, TJ Maxx, Wal-Mart
Apparel and Shoes Adidas, Brooks Brothers, Calvin Klein, Coach, Converse, Eddie Bauer, Fossil, K-Swiss, Kenneth Cole,Levi’s, Nike, Nine West, North Face, Polo Ralph Lauren, Puma, Quiksilver, Reebok, Skechers, Timberland
Car Manufacturers Acura, Audi, BMW, Buick, Cadillac, Chevrolet, Chrysler, Dodge, Ford, Honda, Infiniti, Jeep,Lexus, Lincoln, Mazda, Mercedes, Mercury, Nissan, Toyota, Volkswagen, Volvo
TV Networks ABC, Bloomberg Television, C-SPAN, CBS, CNBC, CNN, CW, ESPN, FOX, NBC, PBS, Telemundo,The Golf Channel, The Weather Channel, truTV, Univision
Hotels Best Western, Comfort Inn, Courtyard by Marriott, Days Inn, Doubletree, Econo Lodge, Four Seasons,Hampton Inn, Hilton, Holiday Inn, Hyatt, La Quinta Inn, Marriott, Omni Hotels, Radisson, Ramada,Red Roof Inn, Ritz-Carlton, Sheraton, Super 8 Motels, W Hotels, Westin, Wyndham Hotels & Resorts
Fast Food Arby’s, Baja Fresh, Burger King, Carl’s Jr, Chipotle, Church’s, Hardee’s, Jack In the Box, KFC, Krystal,Long John Silvers, McDonald’s, Popeyes, Quiznos, Schlotzsky’s, Subway, Taco Bell, Wendy’s,Whataburger, White Castle, Wienerschnitzel
Liquor Absolut, Bacardi, Captain Morgan, Crown Royal, Grey Goose, Hennessy, Jack Daniel’s, Jim Beam,Johnnie Walker, Jose Cuervo, Maker’s Mark, Smirnoff, Southern Comfort
Ice Cream/Pizza/Coffee Baskin Robbins, Caribou Coffee, Cold Stone Creamery, Culver’s, Dairy Queen, Domino’s, Donatos,Dunkin’ Donuts, Giordanos, Krispy Kreme, Little Caesar’s, Old Chicago Pasta & Pizza, Papa John’s,Papa Murphy’s, Pizza Hut, Round Table Pizza, Starbucks, Tim Horton’s
Clothing Stores American Eagle, Banana Republic, Bealls, Gap, Men’s Wearhouse, Old Navy, Urban OutfittersBooks/Kids/Office Stores Athlete’s Foot, Babies R Us, Barnes & Noble, Bon Ton, Famous Footwear, Jared, Kay, Office Depot,
OfficeMax, Payless, Shoe Carnival, Staples, The Finish Line, Tiffany & Co., Toys R Us, ZalesCasual Dining Applebee’s, Bahama Breeze, Benihana, Buffalo Wild Wings, Carrabba’s, Chili’s, Famous Dave’s,
Fuddruckers, Golden Corral, HomeTown Buffet, Hooters, Houlihan’s, Landry’s Seafood House,Olive Garden, On The Border, Red Lobster, Red Robin, Ruby Tuesday’s, Sizzler, TGI Friday’s
Beer Budweiser, Busch, Coors, Corona, Dos Equis, Guinness, Heineken, Keystone, Michelob, Miller,Molson, Samuel Adams, Yuengling
Fast Casual Dining Blimpie, Bob Evans, Boston Market, Chick-Fil-A, Chuck E Cheese, Cosi, Denny’s, Eat ’n Park,Friendly’s Ice Cream, Frisch’s Big Boy, IHOP, Marie Callender’s, O’Charley’s, Panda Express,Panera Bread, Sonic, Steak ’n’ Shake, Taco Bueno, Waffle House
Gasoline/AutoAccessories AAMCO, Advance Auto Parts, Arco, AutoZone, BP, Bridgestone, Chevron, Citgo, ConocoPhillips,Continental, Cooper Tires, Firestone, GMGoodwrench, Goodyear, Gulf, Jiffy Lube, Marathon,Michelin, Pep Boys, Shell, Sunoco, Valero
Sports/Electronics Stores Best Buy, Big 5 Sporting Goods, Cabela’s, Champs, CompUSA, Conn’s, CVS, Dicks, F.Y.E, Fred’s,GameStop, Hibbett Sports, P.C.Richard&Son, RadioShack, REI, Rite Aid, Sports Authority, Walgreen’s
Cruise/TravelAgents Busch Gardens, Carnival, Expedia, Holland America, Knott’s Berry Farm, Norwegian Cruise Lines, Orbitz,Princess, Royal Caribbean, Sea World, Six Flags, Travelocity, travelzoo.com, Tripadvisor
Media Services Adobe, Alltell/Western Wireless, AT&T, Cablevision, Comcast, DirecTV, Dish Network, Electronic Arts,Microsoft, Quicken, Sirius, Sprint, Symantec, T-Mobile, Time Warner Cable, US Cellular, Verizon, XM
Insurance AAA, Aetna, Aflac, Allstate, Blue Cross/Blue Shield, CIGNA, Farmers Insurance Group, Geico, ING,Liberty Mutual, MetLife, Nationwide, New York Life, Northwestern Mutual, Progressive, Prudential,State Farm, The Hartford, Travelers, UnitedHealthcare
Steakhouses/CasualDining Black Angus, Bonefish, Buca di Beppo, Chart House, Kona Grill, Lone Star Steakhouse,LongHorn Steakhouse, Maggiano’s, McCormick & Schmick’s, Morton’s, Outback Steakhouse,Rainforest Cafe, Ruth’s Chris, Smokey Bones BBQ & Grill, Texas Roadhouse, Tony Roma’s
Women’s Clothing Stores Ann Taylor, Bebe, Fashion Bug, Forever 21, Juicy Couture, Lane Bryant, Victoria’s Secret,White House/Black Market
Airlines Aeromexico, Air Canada, Air France, AirTran, Alaska Air, American Airlines, British Airways, Delta,Emirates, Frontier, JetBlue, Lufthansa, Qantas, Singapore Airlines, Southwest, United, US Airways,Virgin Atlantic
Casinos Bally’s, Bellagio, Caesars Palace, Excalibur, Hard Rock Hotel, Harrah’s, MGM Grand, Monte Carlo,Treasure Island, Venetian, Wynn Las Vegas
Financial Services American Express, Capital One, Charles Schwab, Discover, E*TRADE, Edward Jones, Fidelity,Franklin Templeton, Goldman Sachs, J.P. Morgan, Janus, MasterCard, Merrill Lynch, Morgan Stanley,Oppenheimer, Putnam, T. Rowe Price, TD Ameritrade, UBS, Visa
Grocery Stores 7-Eleven, A&P, Albertsons, Casey’s General Store, Cub Foods, Food Lion, Fresh&Easy, Giant,Giant Eagle, Harris Teeter, Kroger, Meijer, Pathmark, Piggly Wiggly, Publix, Safeway, Shaw’s,Shop ’n Save, Whole Foods, Winn-Dixie
Drugs: General Abilify, Aricept, AstraZeneca, Bristol-Myers Squibb, Enbrel, Ensure, Glucerna, Merck,PediaSure, Vesicare, Visine
Drugs: Prescription Advair, Cialis, Crestor, Lipitor, Nexium, Viagra, Zantac, ZoloftConsumer Banks Bank of America, Barclay’s, BB&T, Chase, Citibank, Comerica, Fifth-Third, HSBC,
Huntington Bank, KeyBank, M&T Bank, PNC Bank, Regions Bank, SunTrust, Union Bank, US Bank,Wachovia, Wells Fargo, Zions Bank
41Marketing Science Institute Working Paper Series
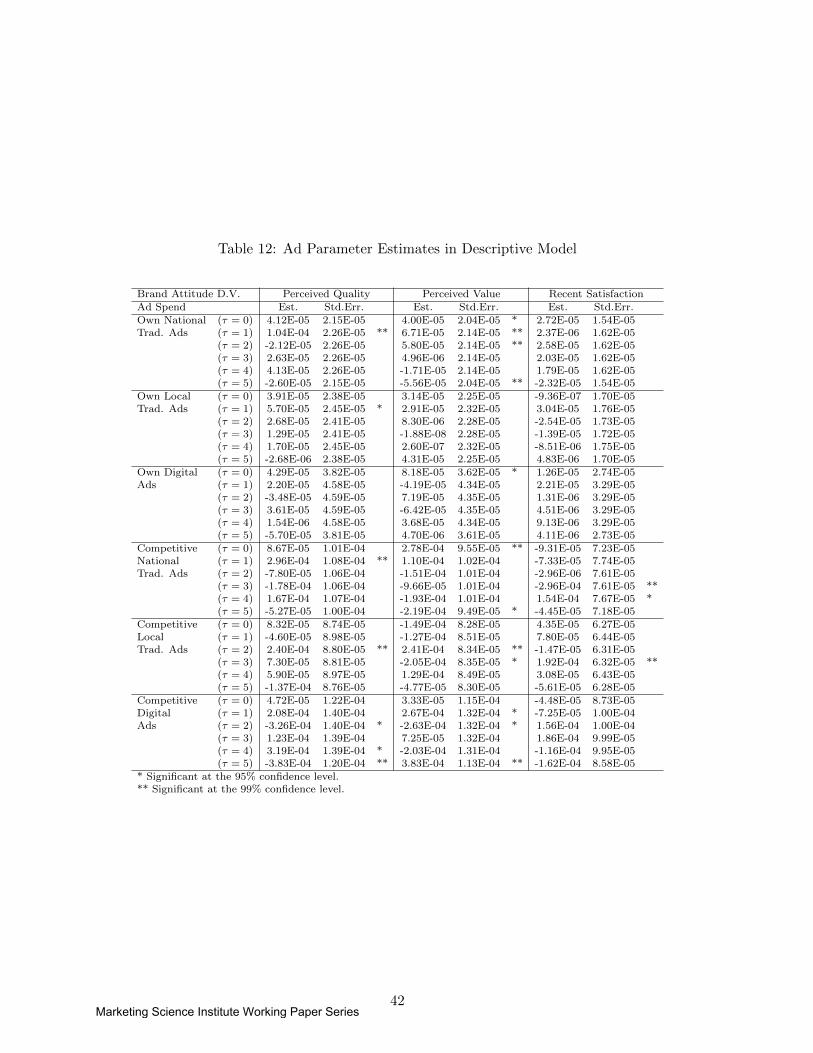
Table 12: Ad Parameter Estimates in Descriptive Model
Brand Attitude D.V. Perceived Quality Perceived Value Recent SatisfactionAd Spend Est. Std.Err. Est. Std.Err. Est. Std.Err.Own National (τ = 0) 4.12E-05 2.15E-05 4.00E-05 2.04E-05 * 2.72E-05 1.54E-05Trad. Ads (τ = 1) 1.04E-04 2.26E-05 ** 6.71E-05 2.14E-05 ** 2.37E-06 1.62E-05
(τ = 2) -2.12E-05 2.26E-05 5.80E-05 2.14E-05 ** 2.58E-05 1.62E-05(τ = 3) 2.63E-05 2.26E-05 4.96E-06 2.14E-05 2.03E-05 1.62E-05(τ = 4) 4.13E-05 2.26E-05 -1.71E-05 2.14E-05 1.79E-05 1.62E-05(τ = 5) -2.60E-05 2.15E-05 -5.56E-05 2.04E-05 ** -2.32E-05 1.54E-05
Own Local (τ = 0) 3.91E-05 2.38E-05 3.14E-05 2.25E-05 -9.36E-07 1.70E-05Trad. Ads (τ = 1) 5.70E-05 2.45E-05 * 2.91E-05 2.32E-05 3.04E-05 1.76E-05
(τ = 2) 2.68E-05 2.41E-05 8.30E-06 2.28E-05 -2.54E-05 1.73E-05(τ = 3) 1.29E-05 2.41E-05 -1.88E-08 2.28E-05 -1.39E-05 1.72E-05(τ = 4) 1.70E-05 2.45E-05 2.60E-07 2.32E-05 -8.51E-06 1.75E-05(τ = 5) -2.68E-06 2.38E-05 4.31E-05 2.25E-05 4.83E-06 1.70E-05
Own Digital (τ = 0) 4.29E-05 3.82E-05 8.18E-05 3.62E-05 * 1.26E-05 2.74E-05Ads (τ = 1) 2.20E-05 4.58E-05 -4.19E-05 4.34E-05 2.21E-05 3.29E-05
(τ = 2) -3.48E-05 4.59E-05 7.19E-05 4.35E-05 1.31E-06 3.29E-05(τ = 3) 3.61E-05 4.59E-05 -6.42E-05 4.35E-05 4.51E-06 3.29E-05(τ = 4) 1.54E-06 4.58E-05 3.68E-05 4.34E-05 9.13E-06 3.29E-05(τ = 5) -5.70E-05 3.81E-05 4.70E-06 3.61E-05 4.11E-06 2.73E-05
Competitive (τ = 0) 8.67E-05 1.01E-04 2.78E-04 9.55E-05 ** -9.31E-05 7.23E-05National (τ = 1) 2.96E-04 1.08E-04 ** 1.10E-04 1.02E-04 -7.33E-05 7.74E-05Trad. Ads (τ = 2) -7.80E-05 1.06E-04 -1.51E-04 1.01E-04 -2.96E-06 7.61E-05
(τ = 3) -1.78E-04 1.06E-04 -9.66E-05 1.01E-04 -2.96E-04 7.61E-05 **(τ = 4) 1.67E-04 1.07E-04 -1.93E-04 1.01E-04 1.54E-04 7.67E-05 *(τ = 5) -5.27E-05 1.00E-04 -2.19E-04 9.49E-05 * -4.45E-05 7.18E-05
Competitive (τ = 0) 8.32E-05 8.74E-05 -1.49E-04 8.28E-05 4.35E-05 6.27E-05Local (τ = 1) -4.60E-05 8.98E-05 -1.27E-04 8.51E-05 7.80E-05 6.44E-05Trad. Ads (τ = 2) 2.40E-04 8.80E-05 ** 2.41E-04 8.34E-05 ** -1.47E-05 6.31E-05
(τ = 3) 7.30E-05 8.81E-05 -2.05E-04 8.35E-05 * 1.92E-04 6.32E-05 **(τ = 4) 5.90E-05 8.97E-05 1.29E-04 8.49E-05 3.08E-05 6.43E-05(τ = 5) -1.37E-04 8.76E-05 -4.77E-05 8.30E-05 -5.61E-05 6.28E-05
Competitive (τ = 0) 4.72E-05 1.22E-04 3.33E-05 1.15E-04 -4.48E-05 8.73E-05Digital (τ = 1) 2.08E-04 1.40E-04 2.67E-04 1.32E-04 * -7.25E-05 1.00E-04Ads (τ = 2) -3.26E-04 1.40E-04 * -2.63E-04 1.32E-04 * 1.56E-04 1.00E-04
(τ = 3) 1.23E-04 1.39E-04 7.25E-05 1.32E-04 1.86E-04 9.99E-05(τ = 4) 3.19E-04 1.39E-04 * -2.03E-04 1.31E-04 -1.16E-04 9.95E-05(τ = 5) -3.83E-04 1.20E-04 ** 3.83E-04 1.13E-04 ** -1.62E-04 8.58E-05
* Significant at the 95% confidence level.** Significant at the 99% confidence level.
42Marketing Science Institute Working Paper Series
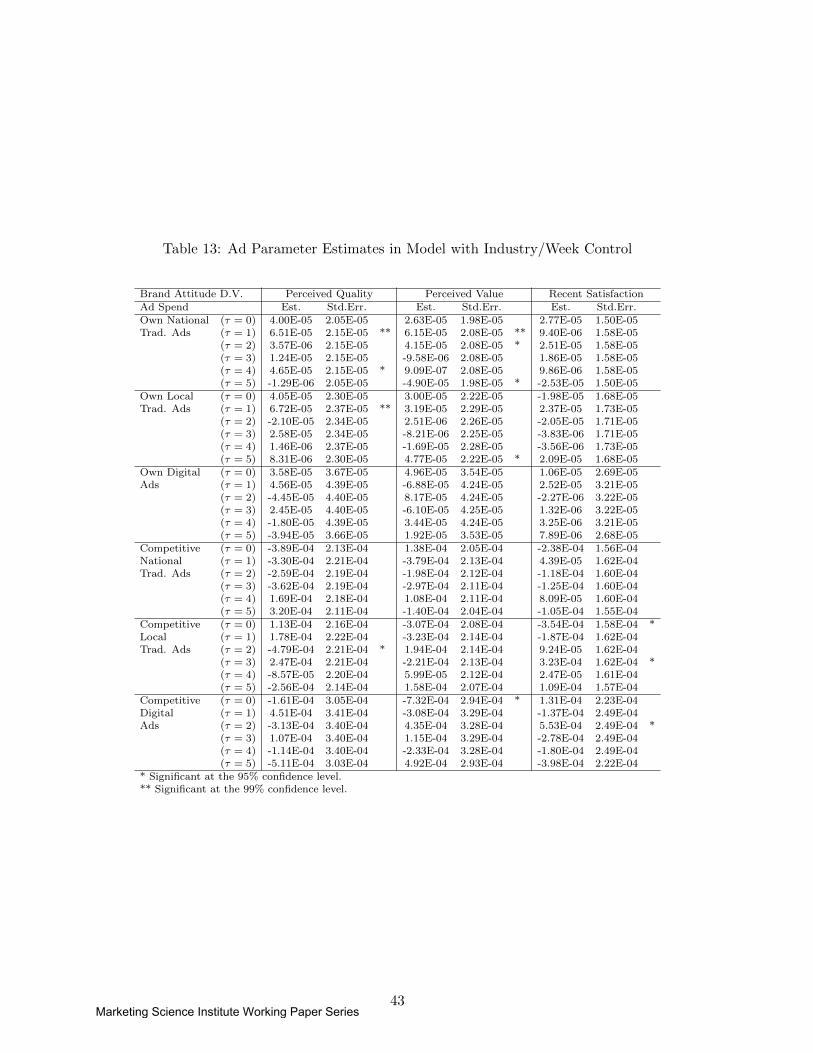
Table 13: Ad Parameter Estimates in Model with Industry/Week Control
Brand Attitude D.V. Perceived Quality Perceived Value Recent SatisfactionAd Spend Est. Std.Err. Est. Std.Err. Est. Std.Err.Own National (τ = 0) 4.00E-05 2.05E-05 2.63E-05 1.98E-05 2.77E-05 1.50E-05Trad. Ads (τ = 1) 6.51E-05 2.15E-05 ** 6.15E-05 2.08E-05 ** 9.40E-06 1.58E-05
(τ = 2) 3.57E-06 2.15E-05 4.15E-05 2.08E-05 * 2.51E-05 1.58E-05(τ = 3) 1.24E-05 2.15E-05 -9.58E-06 2.08E-05 1.86E-05 1.58E-05(τ = 4) 4.65E-05 2.15E-05 * 9.09E-07 2.08E-05 9.86E-06 1.58E-05(τ = 5) -1.29E-06 2.05E-05 -4.90E-05 1.98E-05 * -2.53E-05 1.50E-05
Own Local (τ = 0) 4.05E-05 2.30E-05 3.00E-05 2.22E-05 -1.98E-05 1.68E-05Trad. Ads (τ = 1) 6.72E-05 2.37E-05 ** 3.19E-05 2.29E-05 2.37E-05 1.73E-05
(τ = 2) -2.10E-05 2.34E-05 2.51E-06 2.26E-05 -2.05E-05 1.71E-05(τ = 3) 2.58E-05 2.34E-05 -8.21E-06 2.25E-05 -3.83E-06 1.71E-05(τ = 4) 1.46E-06 2.37E-05 -1.69E-05 2.28E-05 -3.56E-06 1.73E-05(τ = 5) 8.31E-06 2.30E-05 4.77E-05 2.22E-05 * 2.09E-05 1.68E-05
Own Digital (τ = 0) 3.58E-05 3.67E-05 4.96E-05 3.54E-05 1.06E-05 2.69E-05Ads (τ = 1) 4.56E-05 4.39E-05 -6.88E-05 4.24E-05 2.52E-05 3.21E-05
(τ = 2) -4.45E-05 4.40E-05 8.17E-05 4.24E-05 -2.27E-06 3.22E-05(τ = 3) 2.45E-05 4.40E-05 -6.10E-05 4.25E-05 1.32E-06 3.22E-05(τ = 4) -1.80E-05 4.39E-05 3.44E-05 4.24E-05 3.25E-06 3.21E-05(τ = 5) -3.94E-05 3.66E-05 1.92E-05 3.53E-05 7.89E-06 2.68E-05
Competitive (τ = 0) -3.89E-04 2.13E-04 1.38E-04 2.05E-04 -2.38E-04 1.56E-04National (τ = 1) -3.30E-04 2.21E-04 -3.79E-04 2.13E-04 4.39E-05 1.62E-04Trad. Ads (τ = 2) -2.59E-04 2.19E-04 -1.98E-04 2.12E-04 -1.18E-04 1.60E-04
(τ = 3) -3.62E-04 2.19E-04 -2.97E-04 2.11E-04 -1.25E-04 1.60E-04(τ = 4) 1.69E-04 2.18E-04 1.08E-04 2.11E-04 8.09E-05 1.60E-04(τ = 5) 3.20E-04 2.11E-04 -1.40E-04 2.04E-04 -1.05E-04 1.55E-04
Competitive (τ = 0) 1.13E-04 2.16E-04 -3.07E-04 2.08E-04 -3.54E-04 1.58E-04 *Local (τ = 1) 1.78E-04 2.22E-04 -3.23E-04 2.14E-04 -1.87E-04 1.62E-04Trad. Ads (τ = 2) -4.79E-04 2.21E-04 * 1.94E-04 2.14E-04 9.24E-05 1.62E-04
(τ = 3) 2.47E-04 2.21E-04 -2.21E-04 2.13E-04 3.23E-04 1.62E-04 *(τ = 4) -8.57E-05 2.20E-04 5.99E-05 2.12E-04 2.47E-05 1.61E-04(τ = 5) -2.56E-04 2.14E-04 1.58E-04 2.07E-04 1.09E-04 1.57E-04
Competitive (τ = 0) -1.61E-04 3.05E-04 -7.32E-04 2.94E-04 * 1.31E-04 2.23E-04Digital (τ = 1) 4.51E-04 3.41E-04 -3.08E-04 3.29E-04 -1.37E-04 2.49E-04Ads (τ = 2) -3.13E-04 3.40E-04 4.35E-04 3.28E-04 5.53E-04 2.49E-04 *
(τ = 3) 1.07E-04 3.40E-04 1.15E-04 3.29E-04 -2.78E-04 2.49E-04(τ = 4) -1.14E-04 3.40E-04 -2.33E-04 3.28E-04 -1.80E-04 2.49E-04(τ = 5) -5.11E-04 3.03E-04 4.92E-04 2.93E-04 -3.98E-04 2.22E-04
* Significant at the 95% confidence level.** Significant at the 99% confidence level.
43Marketing Science Institute Working Paper Series
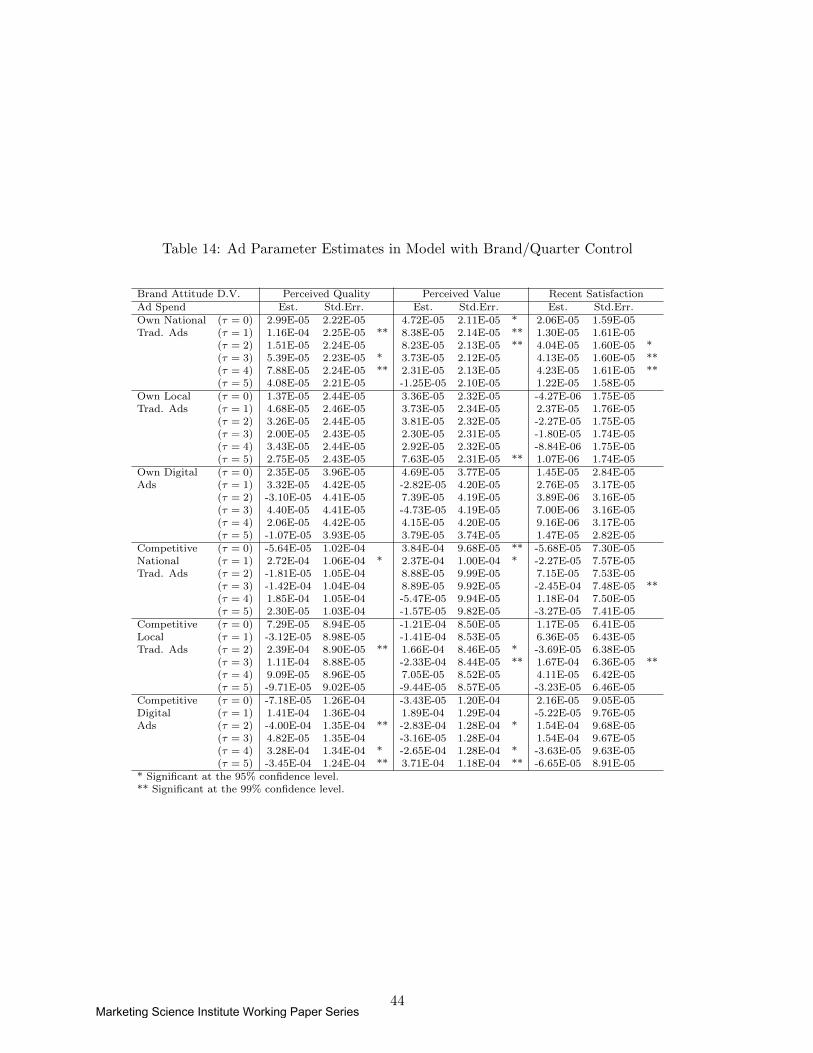
Table 14: Ad Parameter Estimates in Model with Brand/Quarter Control
Brand Attitude D.V. Perceived Quality Perceived Value Recent SatisfactionAd Spend Est. Std.Err. Est. Std.Err. Est. Std.Err.Own National (τ = 0) 2.99E-05 2.22E-05 4.72E-05 2.11E-05 * 2.06E-05 1.59E-05Trad. Ads (τ = 1) 1.16E-04 2.25E-05 ** 8.38E-05 2.14E-05 ** 1.30E-05 1.61E-05
(τ = 2) 1.51E-05 2.24E-05 8.23E-05 2.13E-05 ** 4.04E-05 1.60E-05 *(τ = 3) 5.39E-05 2.23E-05 * 3.73E-05 2.12E-05 4.13E-05 1.60E-05 **(τ = 4) 7.88E-05 2.24E-05 ** 2.31E-05 2.13E-05 4.23E-05 1.61E-05 **(τ = 5) 4.08E-05 2.21E-05 -1.25E-05 2.10E-05 1.22E-05 1.58E-05
Own Local (τ = 0) 1.37E-05 2.44E-05 3.36E-05 2.32E-05 -4.27E-06 1.75E-05Trad. Ads (τ = 1) 4.68E-05 2.46E-05 3.73E-05 2.34E-05 2.37E-05 1.76E-05
(τ = 2) 3.26E-05 2.44E-05 3.81E-05 2.32E-05 -2.27E-05 1.75E-05(τ = 3) 2.00E-05 2.43E-05 2.30E-05 2.31E-05 -1.80E-05 1.74E-05(τ = 4) 3.43E-05 2.44E-05 2.92E-05 2.32E-05 -8.84E-06 1.75E-05(τ = 5) 2.75E-05 2.43E-05 7.63E-05 2.31E-05 ** 1.07E-06 1.74E-05
Own Digital (τ = 0) 2.35E-05 3.96E-05 4.69E-05 3.77E-05 1.45E-05 2.84E-05Ads (τ = 1) 3.32E-05 4.42E-05 -2.82E-05 4.20E-05 2.76E-05 3.17E-05
(τ = 2) -3.10E-05 4.41E-05 7.39E-05 4.19E-05 3.89E-06 3.16E-05(τ = 3) 4.40E-05 4.41E-05 -4.73E-05 4.19E-05 7.00E-06 3.16E-05(τ = 4) 2.06E-05 4.42E-05 4.15E-05 4.20E-05 9.16E-06 3.17E-05(τ = 5) -1.07E-05 3.93E-05 3.79E-05 3.74E-05 1.47E-05 2.82E-05
Competitive (τ = 0) -5.64E-05 1.02E-04 3.84E-04 9.68E-05 ** -5.68E-05 7.30E-05National (τ = 1) 2.72E-04 1.06E-04 * 2.37E-04 1.00E-04 * -2.27E-05 7.57E-05Trad. Ads (τ = 2) -1.81E-05 1.05E-04 8.88E-05 9.99E-05 7.15E-05 7.53E-05
(τ = 3) -1.42E-04 1.04E-04 8.89E-05 9.92E-05 -2.45E-04 7.48E-05 **(τ = 4) 1.85E-04 1.05E-04 -5.47E-05 9.94E-05 1.18E-04 7.50E-05(τ = 5) 2.30E-05 1.03E-04 -1.57E-05 9.82E-05 -3.27E-05 7.41E-05
Competitive (τ = 0) 7.29E-05 8.94E-05 -1.21E-04 8.50E-05 1.17E-05 6.41E-05Local (τ = 1) -3.12E-05 8.98E-05 -1.41E-04 8.53E-05 6.36E-05 6.43E-05Trad. Ads (τ = 2) 2.39E-04 8.90E-05 ** 1.66E-04 8.46E-05 * -3.69E-05 6.38E-05
(τ = 3) 1.11E-04 8.88E-05 -2.33E-04 8.44E-05 ** 1.67E-04 6.36E-05 **(τ = 4) 9.09E-05 8.96E-05 7.05E-05 8.52E-05 4.11E-05 6.42E-05(τ = 5) -9.71E-05 9.02E-05 -9.44E-05 8.57E-05 -3.23E-05 6.46E-05
Competitive (τ = 0) -7.18E-05 1.26E-04 -3.43E-05 1.20E-04 2.16E-05 9.05E-05Digital (τ = 1) 1.41E-04 1.36E-04 1.89E-04 1.29E-04 -5.22E-05 9.76E-05Ads (τ = 2) -4.00E-04 1.35E-04 ** -2.83E-04 1.28E-04 * 1.54E-04 9.68E-05
(τ = 3) 4.82E-05 1.35E-04 -3.16E-05 1.28E-04 1.54E-04 9.67E-05(τ = 4) 3.28E-04 1.34E-04 * -2.65E-04 1.28E-04 * -3.63E-05 9.63E-05(τ = 5) -3.45E-04 1.24E-04 ** 3.71E-04 1.18E-04 ** -6.65E-05 8.91E-05
* Significant at the 95% confidence level.** Significant at the 99% confidence level.
44Marketing Science Institute Working Paper Series
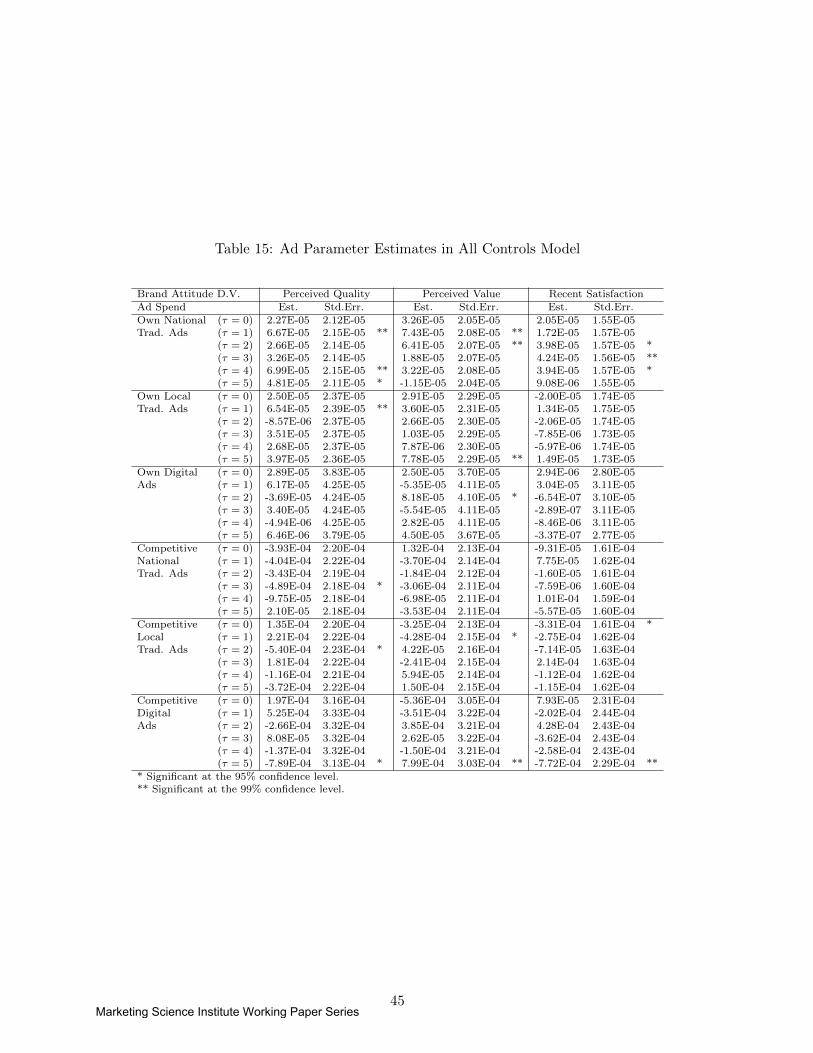
Table 15: Ad Parameter Estimates in All Controls Model
Brand Attitude D.V. Perceived Quality Perceived Value Recent SatisfactionAd Spend Est. Std.Err. Est. Std.Err. Est. Std.Err.Own National (τ = 0) 2.27E-05 2.12E-05 3.26E-05 2.05E-05 2.05E-05 1.55E-05Trad. Ads (τ = 1) 6.67E-05 2.15E-05 ** 7.43E-05 2.08E-05 ** 1.72E-05 1.57E-05
(τ = 2) 2.66E-05 2.14E-05 6.41E-05 2.07E-05 ** 3.98E-05 1.57E-05 *(τ = 3) 3.26E-05 2.14E-05 1.88E-05 2.07E-05 4.24E-05 1.56E-05 **(τ = 4) 6.99E-05 2.15E-05 ** 3.22E-05 2.08E-05 3.94E-05 1.57E-05 *(τ = 5) 4.81E-05 2.11E-05 * -1.15E-05 2.04E-05 9.08E-06 1.55E-05
Own Local (τ = 0) 2.50E-05 2.37E-05 2.91E-05 2.29E-05 -2.00E-05 1.74E-05Trad. Ads (τ = 1) 6.54E-05 2.39E-05 ** 3.60E-05 2.31E-05 1.34E-05 1.75E-05
(τ = 2) -8.57E-06 2.37E-05 2.66E-05 2.30E-05 -2.06E-05 1.74E-05(τ = 3) 3.51E-05 2.37E-05 1.03E-05 2.29E-05 -7.85E-06 1.73E-05(τ = 4) 2.68E-05 2.37E-05 7.87E-06 2.30E-05 -5.97E-06 1.74E-05(τ = 5) 3.97E-05 2.36E-05 7.78E-05 2.29E-05 ** 1.49E-05 1.73E-05
Own Digital (τ = 0) 2.89E-05 3.83E-05 2.50E-05 3.70E-05 2.94E-06 2.80E-05Ads (τ = 1) 6.17E-05 4.25E-05 -5.35E-05 4.11E-05 3.04E-05 3.11E-05
(τ = 2) -3.69E-05 4.24E-05 8.18E-05 4.10E-05 * -6.54E-07 3.10E-05(τ = 3) 3.40E-05 4.24E-05 -5.54E-05 4.11E-05 -2.89E-07 3.11E-05(τ = 4) -4.94E-06 4.25E-05 2.82E-05 4.11E-05 -8.46E-06 3.11E-05(τ = 5) 6.46E-06 3.79E-05 4.50E-05 3.67E-05 -3.37E-07 2.77E-05
Competitive (τ = 0) -3.93E-04 2.20E-04 1.32E-04 2.13E-04 -9.31E-05 1.61E-04National (τ = 1) -4.04E-04 2.22E-04 -3.70E-04 2.14E-04 7.75E-05 1.62E-04Trad. Ads (τ = 2) -3.43E-04 2.19E-04 -1.84E-04 2.12E-04 -1.60E-05 1.61E-04
(τ = 3) -4.89E-04 2.18E-04 * -3.06E-04 2.11E-04 -7.59E-06 1.60E-04(τ = 4) -9.75E-05 2.18E-04 -6.98E-05 2.11E-04 1.01E-04 1.59E-04(τ = 5) 2.10E-05 2.18E-04 -3.53E-04 2.11E-04 -5.57E-05 1.60E-04
Competitive (τ = 0) 1.35E-04 2.20E-04 -3.25E-04 2.13E-04 -3.31E-04 1.61E-04 *Local (τ = 1) 2.21E-04 2.22E-04 -4.28E-04 2.15E-04 * -2.75E-04 1.62E-04Trad. Ads (τ = 2) -5.40E-04 2.23E-04 * 4.22E-05 2.16E-04 -7.14E-05 1.63E-04
(τ = 3) 1.81E-04 2.22E-04 -2.41E-04 2.15E-04 2.14E-04 1.63E-04(τ = 4) -1.16E-04 2.21E-04 5.94E-05 2.14E-04 -1.12E-04 1.62E-04(τ = 5) -3.72E-04 2.22E-04 1.50E-04 2.15E-04 -1.15E-04 1.62E-04
Competitive (τ = 0) 1.97E-04 3.16E-04 -5.36E-04 3.05E-04 7.93E-05 2.31E-04Digital (τ = 1) 5.25E-04 3.33E-04 -3.51E-04 3.22E-04 -2.02E-04 2.44E-04Ads (τ = 2) -2.66E-04 3.32E-04 3.85E-04 3.21E-04 4.28E-04 2.43E-04
(τ = 3) 8.08E-05 3.32E-04 2.62E-05 3.22E-04 -3.62E-04 2.43E-04(τ = 4) -1.37E-04 3.32E-04 -1.50E-04 3.21E-04 -2.58E-04 2.43E-04(τ = 5) -7.89E-04 3.13E-04 * 7.99E-04 3.03E-04 ** -7.72E-04 2.29E-04 **
* Significant at the 95% confidence level.** Significant at the 99% confidence level.
45Marketing Science Institute Working Paper Series
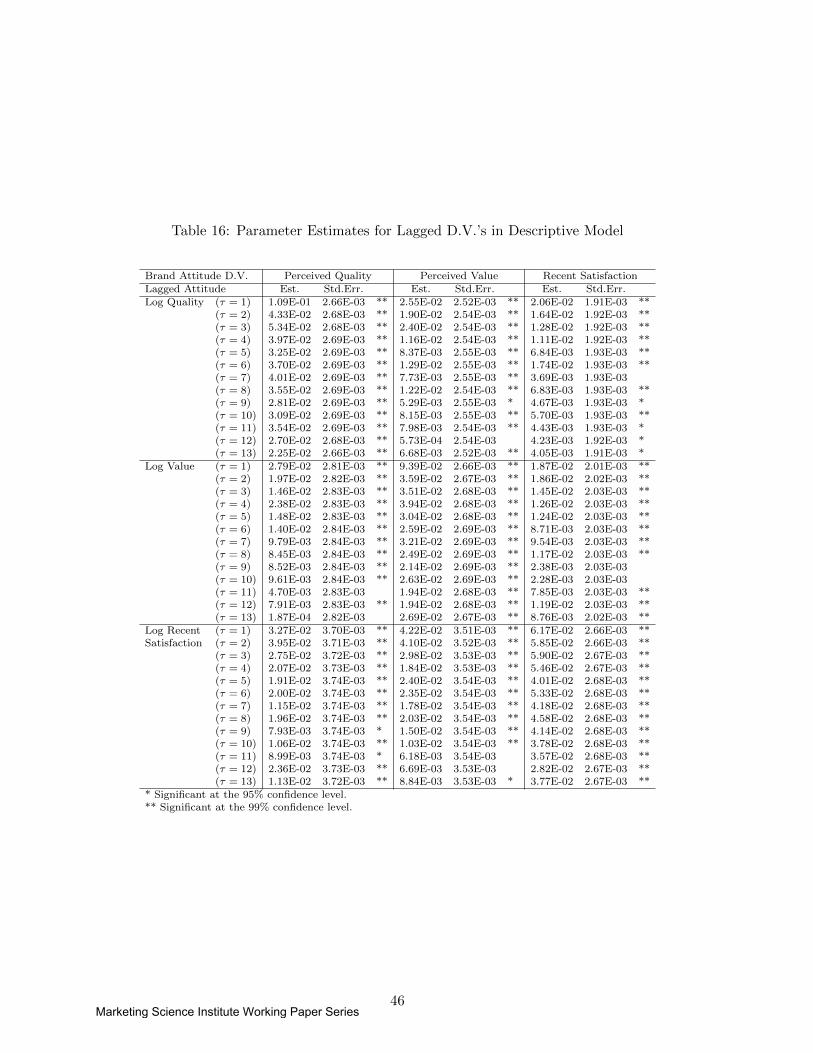
Table 16: Parameter Estimates for Lagged D.V.’s in Descriptive Model
Brand Attitude D.V. Perceived Quality Perceived Value Recent SatisfactionLagged Attitude Est. Std.Err. Est. Std.Err. Est. Std.Err.Log Quality (τ = 1) 1.09E-01 2.66E-03 ** 2.55E-02 2.52E-03 ** 2.06E-02 1.91E-03 **
(τ = 2) 4.33E-02 2.68E-03 ** 1.90E-02 2.54E-03 ** 1.64E-02 1.92E-03 **(τ = 3) 5.34E-02 2.68E-03 ** 2.40E-02 2.54E-03 ** 1.28E-02 1.92E-03 **(τ = 4) 3.97E-02 2.69E-03 ** 1.16E-02 2.54E-03 ** 1.11E-02 1.92E-03 **(τ = 5) 3.25E-02 2.69E-03 ** 8.37E-03 2.55E-03 ** 6.84E-03 1.93E-03 **(τ = 6) 3.70E-02 2.69E-03 ** 1.29E-02 2.55E-03 ** 1.74E-02 1.93E-03 **(τ = 7) 4.01E-02 2.69E-03 ** 7.73E-03 2.55E-03 ** 3.69E-03 1.93E-03(τ = 8) 3.55E-02 2.69E-03 ** 1.22E-02 2.54E-03 ** 6.83E-03 1.93E-03 **(τ = 9) 2.81E-02 2.69E-03 ** 5.29E-03 2.55E-03 * 4.67E-03 1.93E-03 *(τ = 10) 3.09E-02 2.69E-03 ** 8.15E-03 2.55E-03 ** 5.70E-03 1.93E-03 **(τ = 11) 3.54E-02 2.69E-03 ** 7.98E-03 2.54E-03 ** 4.43E-03 1.93E-03 *(τ = 12) 2.70E-02 2.68E-03 ** 5.73E-04 2.54E-03 4.23E-03 1.92E-03 *(τ = 13) 2.25E-02 2.66E-03 ** 6.68E-03 2.52E-03 ** 4.05E-03 1.91E-03 *
Log Value (τ = 1) 2.79E-02 2.81E-03 ** 9.39E-02 2.66E-03 ** 1.87E-02 2.01E-03 **(τ = 2) 1.97E-02 2.82E-03 ** 3.59E-02 2.67E-03 ** 1.86E-02 2.02E-03 **(τ = 3) 1.46E-02 2.83E-03 ** 3.51E-02 2.68E-03 ** 1.45E-02 2.03E-03 **(τ = 4) 2.38E-02 2.83E-03 ** 3.94E-02 2.68E-03 ** 1.26E-02 2.03E-03 **(τ = 5) 1.48E-02 2.83E-03 ** 3.04E-02 2.68E-03 ** 1.24E-02 2.03E-03 **(τ = 6) 1.40E-02 2.84E-03 ** 2.59E-02 2.69E-03 ** 8.71E-03 2.03E-03 **(τ = 7) 9.79E-03 2.84E-03 ** 3.21E-02 2.69E-03 ** 9.54E-03 2.03E-03 **(τ = 8) 8.45E-03 2.84E-03 ** 2.49E-02 2.69E-03 ** 1.17E-02 2.03E-03 **(τ = 9) 8.52E-03 2.84E-03 ** 2.14E-02 2.69E-03 ** 2.38E-03 2.03E-03(τ = 10) 9.61E-03 2.84E-03 ** 2.63E-02 2.69E-03 ** 2.28E-03 2.03E-03(τ = 11) 4.70E-03 2.83E-03 1.94E-02 2.68E-03 ** 7.85E-03 2.03E-03 **(τ = 12) 7.91E-03 2.83E-03 ** 1.94E-02 2.68E-03 ** 1.19E-02 2.03E-03 **(τ = 13) 1.87E-04 2.82E-03 2.69E-02 2.67E-03 ** 8.76E-03 2.02E-03 **
Log Recent (τ = 1) 3.27E-02 3.70E-03 ** 4.22E-02 3.51E-03 ** 6.17E-02 2.66E-03 **Satisfaction (τ = 2) 3.95E-02 3.71E-03 ** 4.10E-02 3.52E-03 ** 5.85E-02 2.66E-03 **
(τ = 3) 2.75E-02 3.72E-03 ** 2.98E-02 3.53E-03 ** 5.90E-02 2.67E-03 **(τ = 4) 2.07E-02 3.73E-03 ** 1.84E-02 3.53E-03 ** 5.46E-02 2.67E-03 **(τ = 5) 1.91E-02 3.74E-03 ** 2.40E-02 3.54E-03 ** 4.01E-02 2.68E-03 **(τ = 6) 2.00E-02 3.74E-03 ** 2.35E-02 3.54E-03 ** 5.33E-02 2.68E-03 **(τ = 7) 1.15E-02 3.74E-03 ** 1.78E-02 3.54E-03 ** 4.18E-02 2.68E-03 **(τ = 8) 1.96E-02 3.74E-03 ** 2.03E-02 3.54E-03 ** 4.58E-02 2.68E-03 **(τ = 9) 7.93E-03 3.74E-03 * 1.50E-02 3.54E-03 ** 4.14E-02 2.68E-03 **(τ = 10) 1.06E-02 3.74E-03 ** 1.03E-02 3.54E-03 ** 3.78E-02 2.68E-03 **(τ = 11) 8.99E-03 3.74E-03 * 6.18E-03 3.54E-03 3.57E-02 2.68E-03 **(τ = 12) 2.36E-02 3.73E-03 ** 6.69E-03 3.53E-03 2.82E-02 2.67E-03 **(τ = 13) 1.13E-02 3.72E-03 ** 8.84E-03 3.53E-03 * 3.77E-02 2.67E-03 **
* Significant at the 95% confidence level.** Significant at the 99% confidence level.
46Marketing Science Institute Working Paper Series
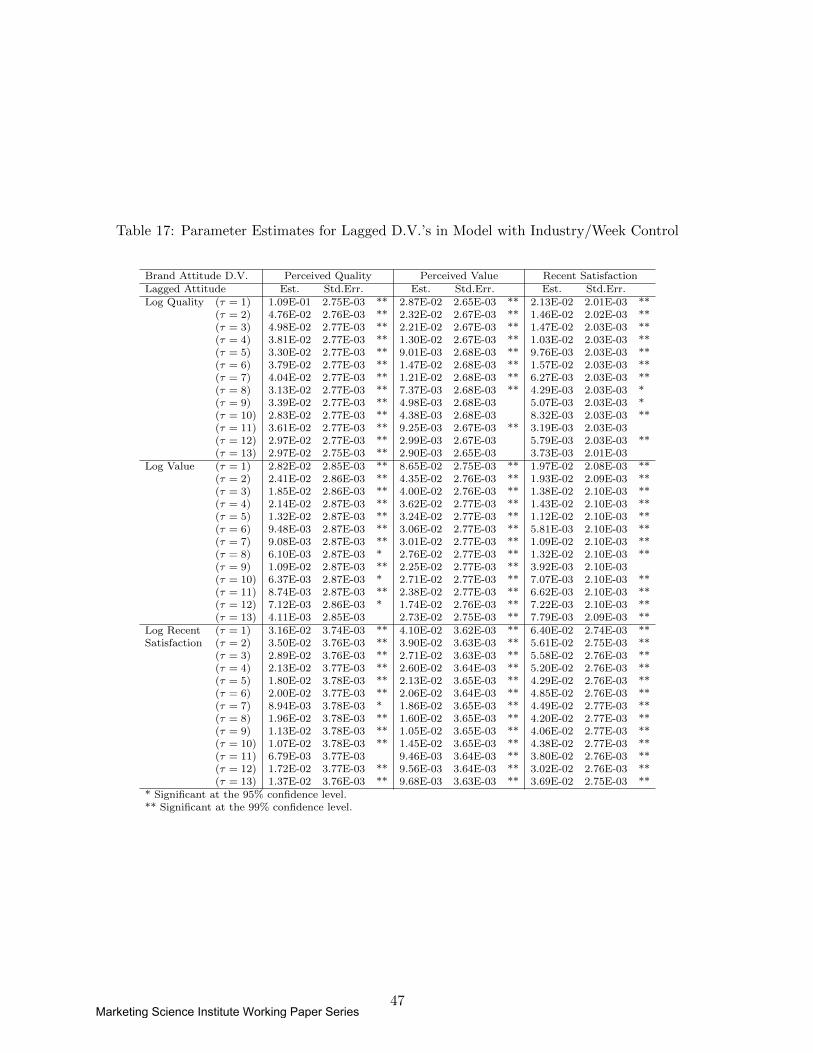
Table 17: Parameter Estimates for Lagged D.V.’s in Model with Industry/Week Control
Brand Attitude D.V. Perceived Quality Perceived Value Recent SatisfactionLagged Attitude Est. Std.Err. Est. Std.Err. Est. Std.Err.Log Quality (τ = 1) 1.09E-01 2.75E-03 ** 2.87E-02 2.65E-03 ** 2.13E-02 2.01E-03 **
(τ = 2) 4.76E-02 2.76E-03 ** 2.32E-02 2.67E-03 ** 1.46E-02 2.02E-03 **(τ = 3) 4.98E-02 2.77E-03 ** 2.21E-02 2.67E-03 ** 1.47E-02 2.03E-03 **(τ = 4) 3.81E-02 2.77E-03 ** 1.30E-02 2.67E-03 ** 1.03E-02 2.03E-03 **(τ = 5) 3.30E-02 2.77E-03 ** 9.01E-03 2.68E-03 ** 9.76E-03 2.03E-03 **(τ = 6) 3.79E-02 2.77E-03 ** 1.47E-02 2.68E-03 ** 1.57E-02 2.03E-03 **(τ = 7) 4.04E-02 2.77E-03 ** 1.21E-02 2.68E-03 ** 6.27E-03 2.03E-03 **(τ = 8) 3.13E-02 2.77E-03 ** 7.37E-03 2.68E-03 ** 4.29E-03 2.03E-03 *(τ = 9) 3.39E-02 2.77E-03 ** 4.98E-03 2.68E-03 5.07E-03 2.03E-03 *(τ = 10) 2.83E-02 2.77E-03 ** 4.38E-03 2.68E-03 8.32E-03 2.03E-03 **(τ = 11) 3.61E-02 2.77E-03 ** 9.25E-03 2.67E-03 ** 3.19E-03 2.03E-03(τ = 12) 2.97E-02 2.77E-03 ** 2.99E-03 2.67E-03 5.79E-03 2.03E-03 **(τ = 13) 2.97E-02 2.75E-03 ** 2.90E-03 2.65E-03 3.73E-03 2.01E-03
Log Value (τ = 1) 2.82E-02 2.85E-03 ** 8.65E-02 2.75E-03 ** 1.97E-02 2.08E-03 **(τ = 2) 2.41E-02 2.86E-03 ** 4.35E-02 2.76E-03 ** 1.93E-02 2.09E-03 **(τ = 3) 1.85E-02 2.86E-03 ** 4.00E-02 2.76E-03 ** 1.38E-02 2.10E-03 **(τ = 4) 2.14E-02 2.87E-03 ** 3.62E-02 2.77E-03 ** 1.43E-02 2.10E-03 **(τ = 5) 1.32E-02 2.87E-03 ** 3.24E-02 2.77E-03 ** 1.12E-02 2.10E-03 **(τ = 6) 9.48E-03 2.87E-03 ** 3.06E-02 2.77E-03 ** 5.81E-03 2.10E-03 **(τ = 7) 9.08E-03 2.87E-03 ** 3.01E-02 2.77E-03 ** 1.09E-02 2.10E-03 **(τ = 8) 6.10E-03 2.87E-03 * 2.76E-02 2.77E-03 ** 1.32E-02 2.10E-03 **(τ = 9) 1.09E-02 2.87E-03 ** 2.25E-02 2.77E-03 ** 3.92E-03 2.10E-03(τ = 10) 6.37E-03 2.87E-03 * 2.71E-02 2.77E-03 ** 7.07E-03 2.10E-03 **(τ = 11) 8.74E-03 2.87E-03 ** 2.38E-02 2.77E-03 ** 6.62E-03 2.10E-03 **(τ = 12) 7.12E-03 2.86E-03 * 1.74E-02 2.76E-03 ** 7.22E-03 2.10E-03 **(τ = 13) 4.11E-03 2.85E-03 2.73E-02 2.75E-03 ** 7.79E-03 2.09E-03 **
Log Recent (τ = 1) 3.16E-02 3.74E-03 ** 4.10E-02 3.62E-03 ** 6.40E-02 2.74E-03 **Satisfaction (τ = 2) 3.50E-02 3.76E-03 ** 3.90E-02 3.63E-03 ** 5.61E-02 2.75E-03 **
(τ = 3) 2.89E-02 3.76E-03 ** 2.71E-02 3.63E-03 ** 5.58E-02 2.76E-03 **(τ = 4) 2.13E-02 3.77E-03 ** 2.60E-02 3.64E-03 ** 5.20E-02 2.76E-03 **(τ = 5) 1.80E-02 3.78E-03 ** 2.13E-02 3.65E-03 ** 4.29E-02 2.76E-03 **(τ = 6) 2.00E-02 3.77E-03 ** 2.06E-02 3.64E-03 ** 4.85E-02 2.76E-03 **(τ = 7) 8.94E-03 3.78E-03 * 1.86E-02 3.65E-03 ** 4.49E-02 2.77E-03 **(τ = 8) 1.96E-02 3.78E-03 ** 1.60E-02 3.65E-03 ** 4.20E-02 2.77E-03 **(τ = 9) 1.13E-02 3.78E-03 ** 1.05E-02 3.65E-03 ** 4.06E-02 2.77E-03 **(τ = 10) 1.07E-02 3.78E-03 ** 1.45E-02 3.65E-03 ** 4.38E-02 2.77E-03 **(τ = 11) 6.79E-03 3.77E-03 9.46E-03 3.64E-03 ** 3.80E-02 2.76E-03 **(τ = 12) 1.72E-02 3.77E-03 ** 9.56E-03 3.64E-03 ** 3.02E-02 2.76E-03 **(τ = 13) 1.37E-02 3.76E-03 ** 9.68E-03 3.63E-03 ** 3.69E-02 2.75E-03 **
* Significant at the 95% confidence level.** Significant at the 99% confidence level.
47Marketing Science Institute Working Paper Series
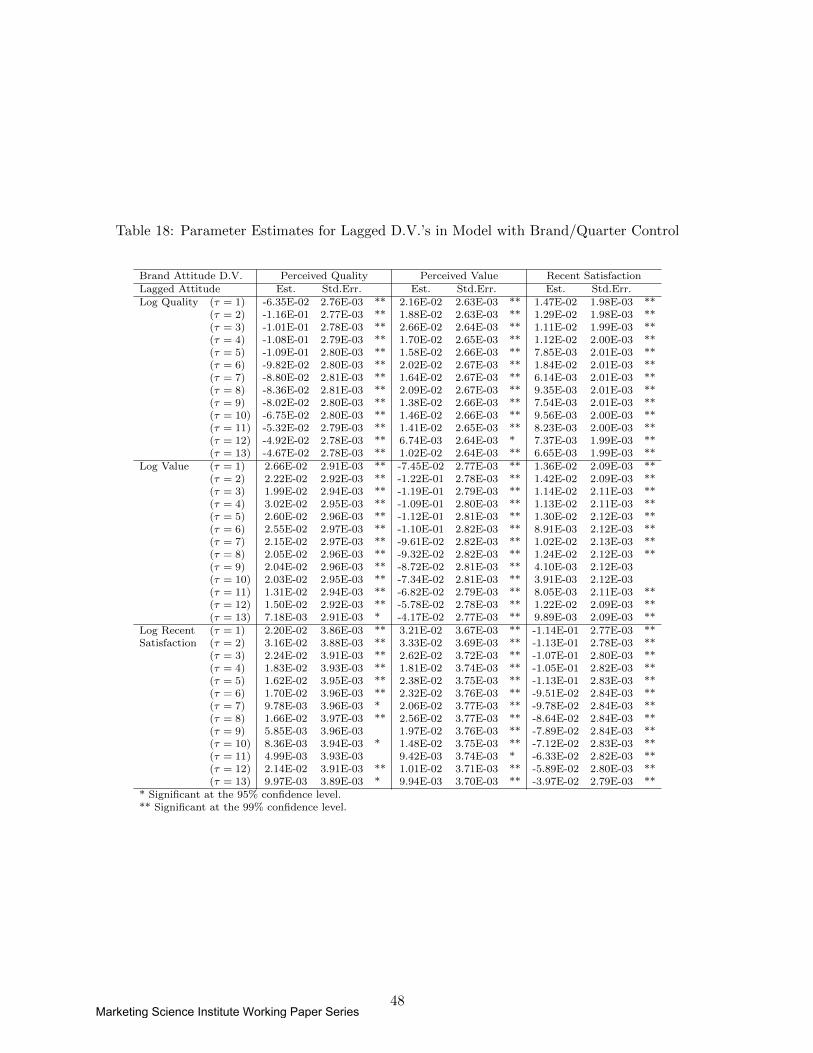
Table 18: Parameter Estimates for Lagged D.V.’s in Model with Brand/Quarter Control
Brand Attitude D.V. Perceived Quality Perceived Value Recent SatisfactionLagged Attitude Est. Std.Err. Est. Std.Err. Est. Std.Err.Log Quality (τ = 1) -6.35E-02 2.76E-03 ** 2.16E-02 2.63E-03 ** 1.47E-02 1.98E-03 **
(τ = 2) -1.16E-01 2.77E-03 ** 1.88E-02 2.63E-03 ** 1.29E-02 1.98E-03 **(τ = 3) -1.01E-01 2.78E-03 ** 2.66E-02 2.64E-03 ** 1.11E-02 1.99E-03 **(τ = 4) -1.08E-01 2.79E-03 ** 1.70E-02 2.65E-03 ** 1.12E-02 2.00E-03 **(τ = 5) -1.09E-01 2.80E-03 ** 1.58E-02 2.66E-03 ** 7.85E-03 2.01E-03 **(τ = 6) -9.82E-02 2.80E-03 ** 2.02E-02 2.67E-03 ** 1.84E-02 2.01E-03 **(τ = 7) -8.80E-02 2.81E-03 ** 1.64E-02 2.67E-03 ** 6.14E-03 2.01E-03 **(τ = 8) -8.36E-02 2.81E-03 ** 2.09E-02 2.67E-03 ** 9.35E-03 2.01E-03 **(τ = 9) -8.02E-02 2.80E-03 ** 1.38E-02 2.66E-03 ** 7.54E-03 2.01E-03 **(τ = 10) -6.75E-02 2.80E-03 ** 1.46E-02 2.66E-03 ** 9.56E-03 2.00E-03 **(τ = 11) -5.32E-02 2.79E-03 ** 1.41E-02 2.65E-03 ** 8.23E-03 2.00E-03 **(τ = 12) -4.92E-02 2.78E-03 ** 6.74E-03 2.64E-03 * 7.37E-03 1.99E-03 **(τ = 13) -4.67E-02 2.78E-03 ** 1.02E-02 2.64E-03 ** 6.65E-03 1.99E-03 **
Log Value (τ = 1) 2.66E-02 2.91E-03 ** -7.45E-02 2.77E-03 ** 1.36E-02 2.09E-03 **(τ = 2) 2.22E-02 2.92E-03 ** -1.22E-01 2.78E-03 ** 1.42E-02 2.09E-03 **(τ = 3) 1.99E-02 2.94E-03 ** -1.19E-01 2.79E-03 ** 1.14E-02 2.11E-03 **(τ = 4) 3.02E-02 2.95E-03 ** -1.09E-01 2.80E-03 ** 1.13E-02 2.11E-03 **(τ = 5) 2.60E-02 2.96E-03 ** -1.12E-01 2.81E-03 ** 1.30E-02 2.12E-03 **(τ = 6) 2.55E-02 2.97E-03 ** -1.10E-01 2.82E-03 ** 8.91E-03 2.12E-03 **(τ = 7) 2.15E-02 2.97E-03 ** -9.61E-02 2.82E-03 ** 1.02E-02 2.13E-03 **(τ = 8) 2.05E-02 2.96E-03 ** -9.32E-02 2.82E-03 ** 1.24E-02 2.12E-03 **(τ = 9) 2.04E-02 2.96E-03 ** -8.72E-02 2.81E-03 ** 4.10E-03 2.12E-03(τ = 10) 2.03E-02 2.95E-03 ** -7.34E-02 2.81E-03 ** 3.91E-03 2.12E-03(τ = 11) 1.31E-02 2.94E-03 ** -6.82E-02 2.79E-03 ** 8.05E-03 2.11E-03 **(τ = 12) 1.50E-02 2.92E-03 ** -5.78E-02 2.78E-03 ** 1.22E-02 2.09E-03 **(τ = 13) 7.18E-03 2.91E-03 * -4.17E-02 2.77E-03 ** 9.89E-03 2.09E-03 **
Log Recent (τ = 1) 2.20E-02 3.86E-03 ** 3.21E-02 3.67E-03 ** -1.14E-01 2.77E-03 **Satisfaction (τ = 2) 3.16E-02 3.88E-03 ** 3.33E-02 3.69E-03 ** -1.13E-01 2.78E-03 **
(τ = 3) 2.24E-02 3.91E-03 ** 2.62E-02 3.72E-03 ** -1.07E-01 2.80E-03 **(τ = 4) 1.83E-02 3.93E-03 ** 1.81E-02 3.74E-03 ** -1.05E-01 2.82E-03 **(τ = 5) 1.62E-02 3.95E-03 ** 2.38E-02 3.75E-03 ** -1.13E-01 2.83E-03 **(τ = 6) 1.70E-02 3.96E-03 ** 2.32E-02 3.76E-03 ** -9.51E-02 2.84E-03 **(τ = 7) 9.78E-03 3.96E-03 * 2.06E-02 3.77E-03 ** -9.78E-02 2.84E-03 **(τ = 8) 1.66E-02 3.97E-03 ** 2.56E-02 3.77E-03 ** -8.64E-02 2.84E-03 **(τ = 9) 5.85E-03 3.96E-03 1.97E-02 3.76E-03 ** -7.89E-02 2.84E-03 **(τ = 10) 8.36E-03 3.94E-03 * 1.48E-02 3.75E-03 ** -7.12E-02 2.83E-03 **(τ = 11) 4.99E-03 3.93E-03 9.42E-03 3.74E-03 * -6.33E-02 2.82E-03 **(τ = 12) 2.14E-02 3.91E-03 ** 1.01E-02 3.71E-03 ** -5.89E-02 2.80E-03 **(τ = 13) 9.97E-03 3.89E-03 * 9.94E-03 3.70E-03 ** -3.97E-02 2.79E-03 **
* Significant at the 95% confidence level.** Significant at the 99% confidence level.
48Marketing Science Institute Working Paper Series
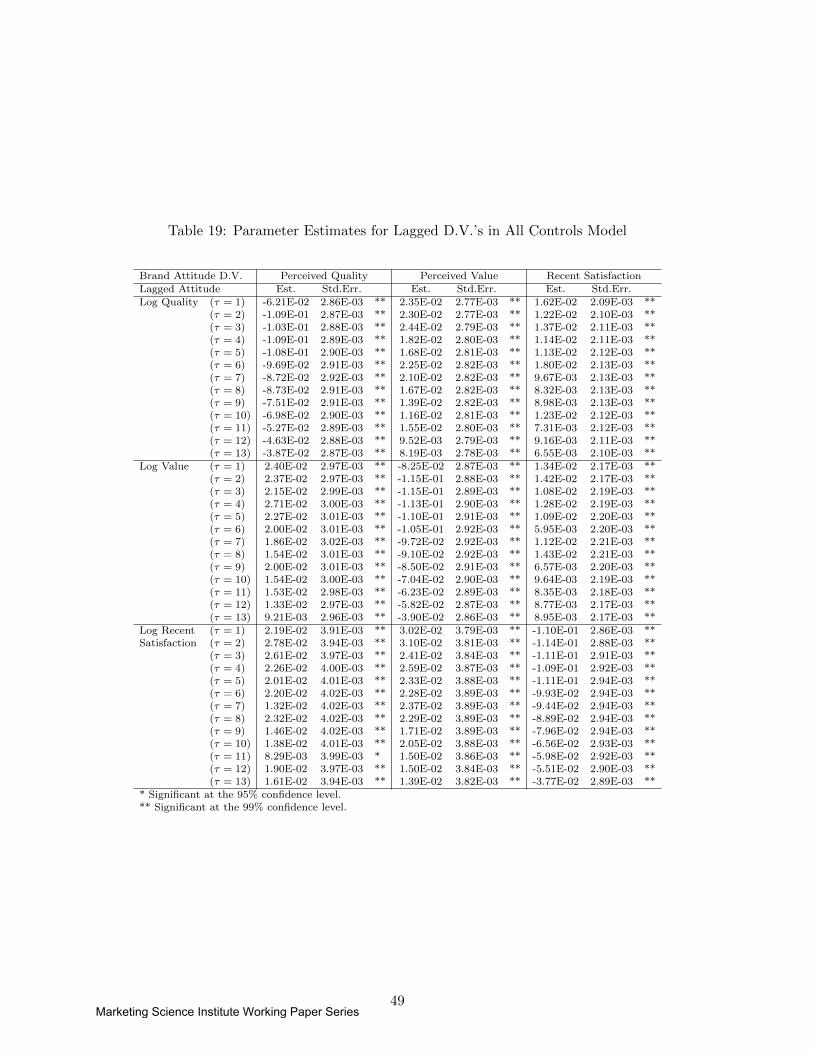
Table 19: Parameter Estimates for Lagged D.V.’s in All Controls Model
Brand Attitude D.V. Perceived Quality Perceived Value Recent SatisfactionLagged Attitude Est. Std.Err. Est. Std.Err. Est. Std.Err.Log Quality (τ = 1) -6.21E-02 2.86E-03 ** 2.35E-02 2.77E-03 ** 1.62E-02 2.09E-03 **
(τ = 2) -1.09E-01 2.87E-03 ** 2.30E-02 2.77E-03 ** 1.22E-02 2.10E-03 **(τ = 3) -1.03E-01 2.88E-03 ** 2.44E-02 2.79E-03 ** 1.37E-02 2.11E-03 **(τ = 4) -1.09E-01 2.89E-03 ** 1.82E-02 2.80E-03 ** 1.14E-02 2.11E-03 **(τ = 5) -1.08E-01 2.90E-03 ** 1.68E-02 2.81E-03 ** 1.13E-02 2.12E-03 **(τ = 6) -9.69E-02 2.91E-03 ** 2.25E-02 2.82E-03 ** 1.80E-02 2.13E-03 **(τ = 7) -8.72E-02 2.92E-03 ** 2.10E-02 2.82E-03 ** 9.67E-03 2.13E-03 **(τ = 8) -8.73E-02 2.91E-03 ** 1.67E-02 2.82E-03 ** 8.32E-03 2.13E-03 **(τ = 9) -7.51E-02 2.91E-03 ** 1.39E-02 2.82E-03 ** 8.98E-03 2.13E-03 **(τ = 10) -6.98E-02 2.90E-03 ** 1.16E-02 2.81E-03 ** 1.23E-02 2.12E-03 **(τ = 11) -5.27E-02 2.89E-03 ** 1.55E-02 2.80E-03 ** 7.31E-03 2.12E-03 **(τ = 12) -4.63E-02 2.88E-03 ** 9.52E-03 2.79E-03 ** 9.16E-03 2.11E-03 **(τ = 13) -3.87E-02 2.87E-03 ** 8.19E-03 2.78E-03 ** 6.55E-03 2.10E-03 **
Log Value (τ = 1) 2.40E-02 2.97E-03 ** -8.25E-02 2.87E-03 ** 1.34E-02 2.17E-03 **(τ = 2) 2.37E-02 2.97E-03 ** -1.15E-01 2.88E-03 ** 1.42E-02 2.17E-03 **(τ = 3) 2.15E-02 2.99E-03 ** -1.15E-01 2.89E-03 ** 1.08E-02 2.19E-03 **(τ = 4) 2.71E-02 3.00E-03 ** -1.13E-01 2.90E-03 ** 1.28E-02 2.19E-03 **(τ = 5) 2.27E-02 3.01E-03 ** -1.10E-01 2.91E-03 ** 1.09E-02 2.20E-03 **(τ = 6) 2.00E-02 3.01E-03 ** -1.05E-01 2.92E-03 ** 5.95E-03 2.20E-03 **(τ = 7) 1.86E-02 3.02E-03 ** -9.72E-02 2.92E-03 ** 1.12E-02 2.21E-03 **(τ = 8) 1.54E-02 3.01E-03 ** -9.10E-02 2.92E-03 ** 1.43E-02 2.21E-03 **(τ = 9) 2.00E-02 3.01E-03 ** -8.50E-02 2.91E-03 ** 6.57E-03 2.20E-03 **(τ = 10) 1.54E-02 3.00E-03 ** -7.04E-02 2.90E-03 ** 9.64E-03 2.19E-03 **(τ = 11) 1.53E-02 2.98E-03 ** -6.23E-02 2.89E-03 ** 8.35E-03 2.18E-03 **(τ = 12) 1.33E-02 2.97E-03 ** -5.82E-02 2.87E-03 ** 8.77E-03 2.17E-03 **(τ = 13) 9.21E-03 2.96E-03 ** -3.90E-02 2.86E-03 ** 8.95E-03 2.17E-03 **
Log Recent (τ = 1) 2.19E-02 3.91E-03 ** 3.02E-02 3.79E-03 ** -1.10E-01 2.86E-03 **Satisfaction (τ = 2) 2.78E-02 3.94E-03 ** 3.10E-02 3.81E-03 ** -1.14E-01 2.88E-03 **
(τ = 3) 2.61E-02 3.97E-03 ** 2.41E-02 3.84E-03 ** -1.11E-01 2.91E-03 **(τ = 4) 2.26E-02 4.00E-03 ** 2.59E-02 3.87E-03 ** -1.09E-01 2.92E-03 **(τ = 5) 2.01E-02 4.01E-03 ** 2.33E-02 3.88E-03 ** -1.11E-01 2.94E-03 **(τ = 6) 2.20E-02 4.02E-03 ** 2.28E-02 3.89E-03 ** -9.93E-02 2.94E-03 **(τ = 7) 1.32E-02 4.02E-03 ** 2.37E-02 3.89E-03 ** -9.44E-02 2.94E-03 **(τ = 8) 2.32E-02 4.02E-03 ** 2.29E-02 3.89E-03 ** -8.89E-02 2.94E-03 **(τ = 9) 1.46E-02 4.02E-03 ** 1.71E-02 3.89E-03 ** -7.96E-02 2.94E-03 **(τ = 10) 1.38E-02 4.01E-03 ** 2.05E-02 3.88E-03 ** -6.56E-02 2.93E-03 **(τ = 11) 8.29E-03 3.99E-03 * 1.50E-02 3.86E-03 ** -5.98E-02 2.92E-03 **(τ = 12) 1.90E-02 3.97E-03 ** 1.50E-02 3.84E-03 ** -5.51E-02 2.90E-03 **(τ = 13) 1.61E-02 3.94E-03 ** 1.39E-02 3.82E-03 ** -3.77E-02 2.89E-03 **
* Significant at the 95% confidence level.** Significant at the 99% confidence level.
49Marketing Science Institute Working Paper Series
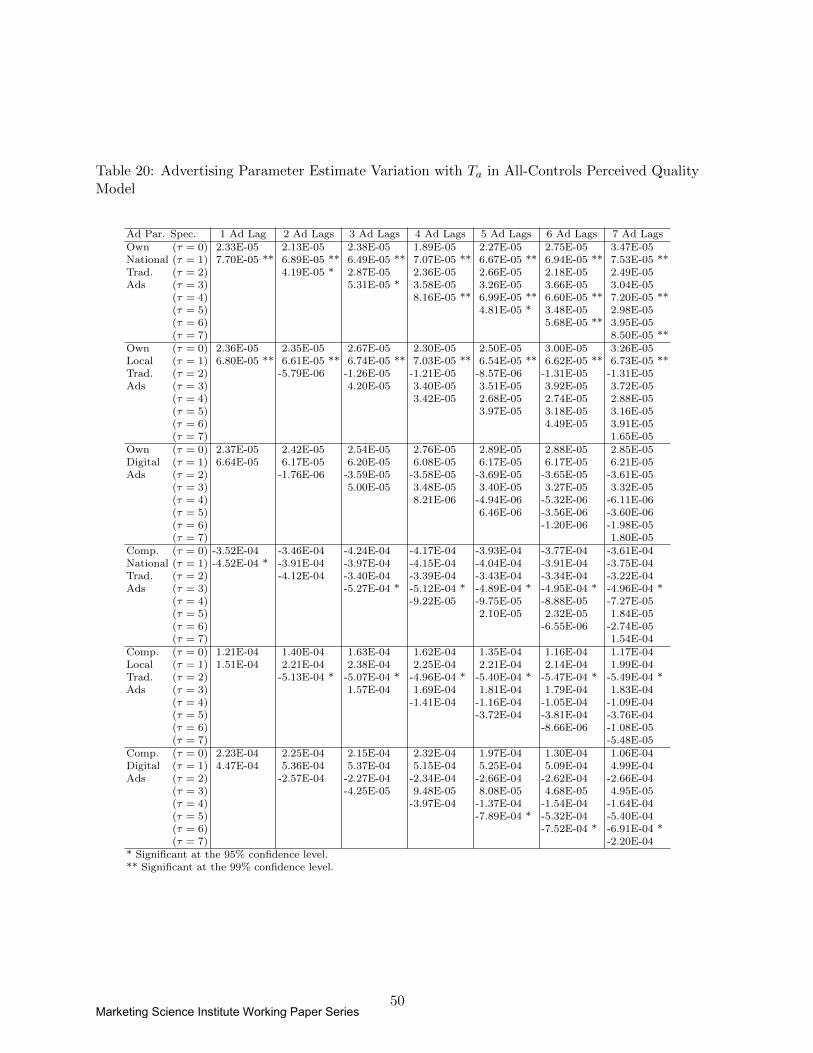
Table 20: Advertising Parameter Estimate Variation with Ta in All-Controls Perceived QualityModel
Ad Par. Spec. 1 Ad Lag 2 Ad Lags 3 Ad Lags 4 Ad Lags 5 Ad Lags 6 Ad Lags 7 Ad LagsOwn (τ = 0) 2.33E-05 2.13E-05 2.38E-05 1.89E-05 2.27E-05 2.75E-05 3.47E-05National (τ = 1) 7.70E-05 ** 6.89E-05 ** 6.49E-05 ** 7.07E-05 ** 6.67E-05 ** 6.94E-05 ** 7.53E-05 **Trad. (τ = 2) 4.19E-05 * 2.87E-05 2.36E-05 2.66E-05 2.18E-05 2.49E-05Ads (τ = 3) 5.31E-05 * 3.58E-05 3.26E-05 3.66E-05 3.04E-05
(τ = 4) 8.16E-05 ** 6.99E-05 ** 6.60E-05 ** 7.20E-05 **(τ = 5) 4.81E-05 * 3.48E-05 2.98E-05(τ = 6) 5.68E-05 ** 3.95E-05(τ = 7) 8.50E-05 **
Own (τ = 0) 2.36E-05 2.35E-05 2.67E-05 2.30E-05 2.50E-05 3.00E-05 3.26E-05Local (τ = 1) 6.80E-05 ** 6.61E-05 ** 6.74E-05 ** 7.03E-05 ** 6.54E-05 ** 6.62E-05 ** 6.73E-05 **Trad. (τ = 2) -5.79E-06 -1.26E-05 -1.21E-05 -8.57E-06 -1.31E-05 -1.31E-05Ads (τ = 3) 4.20E-05 3.40E-05 3.51E-05 3.92E-05 3.72E-05
(τ = 4) 3.42E-05 2.68E-05 2.74E-05 2.88E-05(τ = 5) 3.97E-05 3.18E-05 3.16E-05(τ = 6) 4.49E-05 3.91E-05(τ = 7) 1.65E-05
Own (τ = 0) 2.37E-05 2.42E-05 2.54E-05 2.76E-05 2.89E-05 2.88E-05 2.85E-05Digital (τ = 1) 6.64E-05 6.17E-05 6.20E-05 6.08E-05 6.17E-05 6.17E-05 6.21E-05Ads (τ = 2) -1.76E-06 -3.59E-05 -3.58E-05 -3.69E-05 -3.65E-05 -3.61E-05
(τ = 3) 5.00E-05 3.48E-05 3.40E-05 3.27E-05 3.32E-05(τ = 4) 8.21E-06 -4.94E-06 -5.32E-06 -6.11E-06(τ = 5) 6.46E-06 -3.56E-06 -3.60E-06(τ = 6) -1.20E-06 -1.98E-05(τ = 7) 1.80E-05
Comp. (τ = 0) -3.52E-04 -3.46E-04 -4.24E-04 -4.17E-04 -3.93E-04 -3.77E-04 -3.61E-04National (τ = 1) -4.52E-04 * -3.91E-04 -3.97E-04 -4.15E-04 -4.04E-04 -3.91E-04 -3.75E-04Trad. (τ = 2) -4.12E-04 -3.40E-04 -3.39E-04 -3.43E-04 -3.34E-04 -3.22E-04Ads (τ = 3) -5.27E-04 * -5.12E-04 * -4.89E-04 * -4.95E-04 * -4.96E-04 *
(τ = 4) -9.22E-05 -9.75E-05 -8.88E-05 -7.27E-05(τ = 5) 2.10E-05 2.32E-05 1.84E-05(τ = 6) -6.55E-06 -2.74E-05(τ = 7) 1.54E-04
Comp. (τ = 0) 1.21E-04 1.40E-04 1.63E-04 1.62E-04 1.35E-04 1.16E-04 1.17E-04Local (τ = 1) 1.51E-04 2.21E-04 2.38E-04 2.25E-04 2.21E-04 2.14E-04 1.99E-04Trad. (τ = 2) -5.13E-04 * -5.07E-04 * -4.96E-04 * -5.40E-04 * -5.47E-04 * -5.49E-04 *Ads (τ = 3) 1.57E-04 1.69E-04 1.81E-04 1.79E-04 1.83E-04
(τ = 4) -1.41E-04 -1.16E-04 -1.05E-04 -1.09E-04(τ = 5) -3.72E-04 -3.81E-04 -3.76E-04(τ = 6) -8.66E-06 -1.08E-05(τ = 7) -5.48E-05
Comp. (τ = 0) 2.23E-04 2.25E-04 2.15E-04 2.32E-04 1.97E-04 1.30E-04 1.06E-04Digital (τ = 1) 4.47E-04 5.36E-04 5.37E-04 5.15E-04 5.25E-04 5.09E-04 4.99E-04Ads (τ = 2) -2.57E-04 -2.27E-04 -2.34E-04 -2.66E-04 -2.62E-04 -2.66E-04
(τ = 3) -4.25E-05 9.48E-05 8.08E-05 4.68E-05 4.95E-05(τ = 4) -3.97E-04 -1.37E-04 -1.54E-04 -1.64E-04(τ = 5) -7.89E-04 * -5.32E-04 -5.40E-04(τ = 6) -7.52E-04 * -6.91E-04 *(τ = 7) -2.20E-04
* Significant at the 95% confidence level.** Significant at the 99% confidence level.
50Marketing Science Institute Working Paper Series
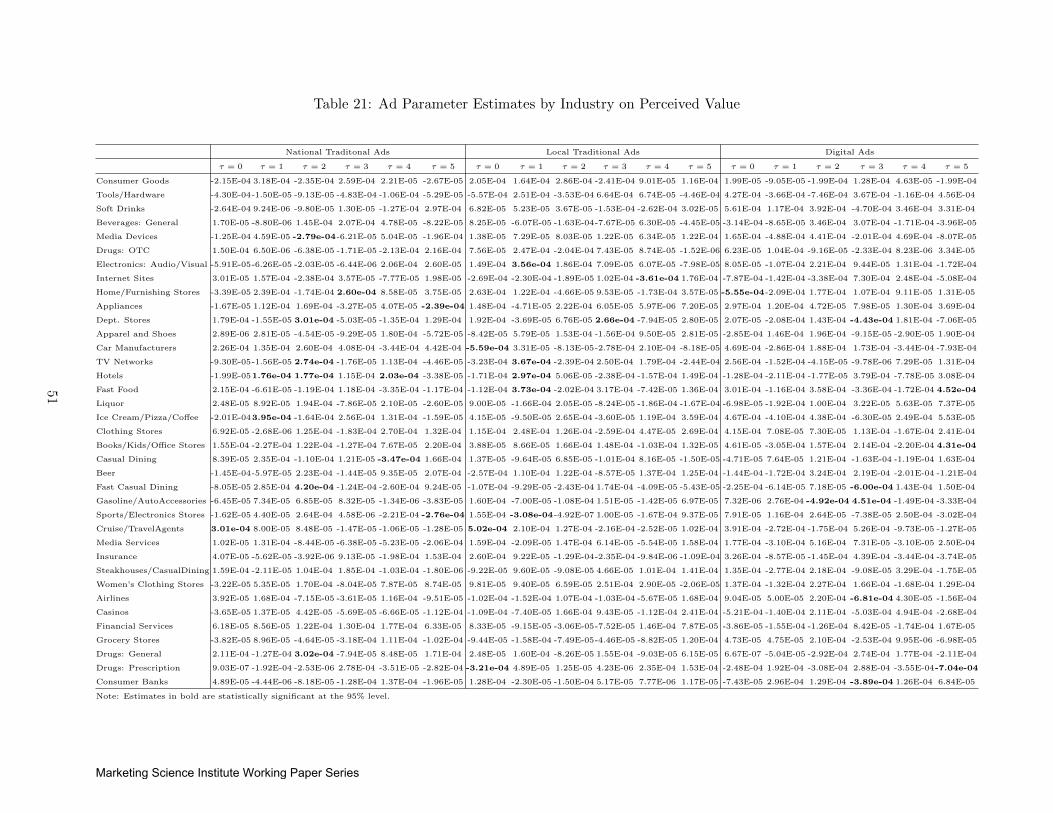
Table 21: Ad Parameter Estimates by Industry on Perceived Value
National Traditonal Ads Local Traditional Ads Digital Ads
τ = 0 τ = 1 τ = 2 τ = 3 τ = 4 τ = 5 τ = 0 τ = 1 τ = 2 τ = 3 τ = 4 τ = 5 τ = 0 τ = 1 τ = 2 τ = 3 τ = 4 τ = 5
Consumer Goods -2.15E-04 3.18E-04 -2.35E-04 2.59E-04 2.21E-05 -2.67E-05 2.05E-04 1.64E-04 2.86E-04 -2.41E-04 9.01E-05 1.16E-04 1.99E-05 -9.05E-05 -1.99E-04 1.28E-04 4.63E-05 -1.99E-04
Tools/Hardware -4.30E-04-1.50E-05 -9.13E-05 -4.83E-04 -1.06E-04 -5.29E-05 -5.57E-04 2.51E-04 -3.53E-04 6.64E-04 6.74E-05 -4.46E-04 4.27E-04 -3.66E-04 -7.46E-04 3.67E-04 -1.16E-04 4.56E-04
Soft Drinks -2.64E-04 9.24E-06 -9.80E-05 1.30E-05 -1.27E-04 2.97E-04 6.82E-05 5.23E-05 3.67E-05 -1.53E-04 -2.62E-04 3.02E-05 5.61E-04 1.17E-04 3.92E-04 -4.70E-04 3.46E-04 3.31E-04
Beverages: General 1.70E-05 -8.80E-06 1.45E-04 2.07E-04 4.78E-05 -8.22E-05 8.25E-05 -6.07E-05 -1.63E-04-7.67E-05 6.30E-05 -4.45E-05 -3.14E-04 -8.65E-05 3.46E-04 3.07E-04 -1.71E-04 -3.96E-05
Media Devices -1.25E-04 4.59E-05 -2.79e-04-6.21E-05 5.04E-05 -1.96E-04 1.38E-05 7.29E-05 8.03E-05 1.22E-05 6.34E-05 1.22E-04 1.65E-04 -4.88E-04 4.41E-04 -2.01E-04 4.69E-04 -8.07E-05
Drugs: OTC 1.50E-04 6.50E-06 -6.38E-05 -1.71E-05 -2.13E-04 2.16E-04 7.56E-05 2.47E-04 -2.04E-04 7.43E-05 8.74E-05 -1.52E-06 6.23E-05 1.04E-04 -9.16E-05 -2.33E-04 8.23E-06 3.34E-05
Electronics: Audio/Visual -5.91E-05-6.26E-05 -2.03E-05 -6.44E-06 2.06E-04 2.60E-05 1.49E-04 3.56e-04 1.86E-04 7.09E-05 6.07E-05 -7.98E-05 8.05E-05 -1.07E-04 2.21E-04 9.44E-05 1.31E-04 -1.72E-04
Internet Sites 3.01E-05 1.57E-04 -2.38E-04 3.57E-05 -7.77E-05 1.98E-05 -2.69E-04 -2.30E-04 -1.89E-05 1.02E-04 -3.61e-04 1.76E-04 -7.87E-04 -1.42E-04 -3.38E-04 7.30E-04 2.48E-04 -5.08E-04
Home/Furnishing Stores -3.39E-05 2.39E-04 -1.74E-04 2.60e-04 8.58E-05 3.75E-05 2.63E-04 1.22E-04 -4.66E-05 9.53E-05 -1.73E-04 3.57E-05 -5.55e-04-2.09E-04 1.77E-04 1.07E-04 9.11E-05 1.31E-05
Appliances -1.67E-05 1.12E-04 1.69E-04 -3.27E-05 4.07E-05 -2.39e-04 1.48E-04 -4.71E-05 2.22E-04 6.05E-05 5.97E-06 7.20E-05 2.97E-04 1.20E-04 4.72E-05 7.98E-05 1.30E-04 3.69E-04
Dept. Stores 1.79E-04 -1.55E-05 3.01e-04 -5.03E-05 -1.35E-04 1.29E-04 1.92E-04 -3.69E-05 6.76E-05 2.66e-04 -7.94E-05 2.80E-05 2.07E-05 -2.08E-04 1.43E-04 -4.43e-04 1.81E-04 -7.06E-05
Apparel and Shoes 2.89E-06 2.81E-05 -4.54E-05 -9.29E-05 1.80E-04 -5.72E-05 -8.42E-05 5.79E-05 1.53E-04 -1.56E-04 9.50E-05 2.81E-05 -2.85E-04 1.46E-04 1.96E-04 -9.15E-05 -2.90E-05 1.90E-04
Car Manufacturers 2.26E-04 1.35E-04 2.60E-04 4.08E-04 -3.44E-04 4.42E-04 -5.59e-04 3.31E-05 -8.13E-05-2.78E-04 2.10E-04 -8.18E-05 4.69E-04 -2.86E-04 1.88E-04 1.73E-04 -3.44E-04 -7.93E-04
TV Networks -9.30E-05-1.56E-05 2.74e-04 -1.76E-05 1.13E-04 -4.46E-05 -3.23E-04 3.67e-04 -2.39E-04 2.50E-04 1.79E-04 -2.44E-04 2.56E-04 -1.52E-04 -4.15E-05 -9.78E-06 7.29E-05 1.31E-04
Hotels -1.99E-051.76e-04 1.77e-04 1.15E-04 2.03e-04 -3.38E-05 -1.71E-04 2.97e-04 5.06E-05 -2.38E-04 -1.57E-04 1.49E-04 -1.28E-04 -2.11E-04 -1.77E-05 3.79E-04 -7.78E-05 3.08E-04
Fast Food 2.15E-04 -6.61E-05 -1.19E-04 1.18E-04 -3.35E-04 -1.17E-04 -1.12E-04 3.73e-04 -2.02E-04 3.17E-04 -7.42E-05 1.36E-04 3.01E-04 -1.16E-04 3.58E-04 -3.36E-04 -1.72E-04 4.52e-04
Liquor 2.48E-05 8.92E-05 1.94E-04 -7.86E-05 2.10E-05 -2.60E-05 9.00E-05 -1.66E-04 2.05E-05 -8.24E-05 -1.86E-04 -1.67E-04 -6.98E-05 -1.92E-04 1.00E-04 3.22E-05 5.63E-05 7.37E-05
Ice Cream/Pizza/Coffee -2.01E-043.95e-04 -1.64E-04 2.56E-04 1.31E-04 -1.59E-05 4.15E-05 -9.50E-05 2.65E-04 -3.60E-05 1.19E-04 3.59E-04 4.67E-04 -4.10E-04 4.38E-04 -6.30E-05 2.49E-04 5.53E-05
Clothing Stores 6.92E-05 -2.68E-06 1.25E-04 -1.83E-04 2.70E-04 1.32E-04 1.15E-04 2.48E-04 1.26E-04 -2.59E-04 4.47E-05 2.69E-04 4.15E-04 7.08E-05 7.30E-05 1.13E-04 -1.67E-04 2.41E-04
Books/Kids/Office Stores 1.55E-04 -2.27E-04 1.22E-04 -1.27E-04 7.67E-05 2.20E-04 3.88E-05 8.66E-05 1.66E-04 1.48E-04 -1.03E-04 1.32E-05 4.61E-05 -3.05E-04 1.57E-04 2.14E-04 -2.20E-04 4.31e-04
Casual Dining 8.39E-05 2.35E-04 -1.10E-04 1.21E-05 -3.47e-04 1.66E-04 1.37E-05 -9.64E-05 6.85E-05 -1.01E-04 8.16E-05 -1.50E-05 -4.71E-05 7.64E-05 1.21E-04 -1.63E-04 -1.19E-04 1.63E-04
Beer -1.45E-04-5.97E-05 2.23E-04 -1.44E-05 9.35E-05 2.07E-04 -2.57E-04 1.10E-04 1.22E-04 -8.57E-05 1.37E-04 1.25E-04 -1.44E-04 -1.72E-04 3.24E-04 2.19E-04 -2.01E-04 -1.21E-04
Fast Casual Dining -8.05E-05 2.85E-04 4.20e-04 -1.24E-04 -2.60E-04 9.24E-05 -1.07E-04 -9.29E-05 -2.43E-04 1.74E-04 -4.09E-05 -5.43E-05 -2.25E-04 -6.14E-05 7.18E-05 -6.00e-04 1.43E-04 1.50E-04
Gasoline/AutoAccessories -6.45E-05 7.34E-05 6.85E-05 8.32E-05 -1.34E-06 -3.83E-05 1.60E-04 -7.00E-05 -1.08E-04 1.51E-05 -1.42E-05 6.97E-05 7.32E-06 2.76E-04 -4.92e-04 4.51e-04 -1.49E-04 -3.33E-04
Sports/Electronics Stores -1.62E-05 4.40E-05 2.64E-04 4.58E-06 -2.21E-04 -2.76e-04 1.55E-04 -3.08e-04-4.92E-07 1.00E-05 -1.67E-04 9.37E-05 7.91E-05 1.16E-04 2.64E-05 -7.38E-05 2.50E-04 -3.02E-04
Cruise/TravelAgents 3.01e-04 8.00E-05 8.48E-05 -1.47E-05 -1.06E-05 -1.28E-05 5.02e-04 2.10E-04 1.27E-04 -2.16E-04 -2.52E-05 1.02E-04 3.91E-04 -2.72E-04 -1.75E-04 5.26E-04 -9.73E-05 -1.27E-05
Media Services 1.02E-05 1.31E-04 -8.44E-05 -6.38E-05 -5.23E-05 -2.06E-04 1.59E-04 -2.09E-05 1.47E-04 6.14E-05 -5.54E-05 1.58E-04 1.77E-04 -3.10E-04 5.16E-04 7.31E-05 -3.10E-05 2.50E-04
Insurance 4.07E-05 -5.62E-05 -3.92E-06 9.13E-05 -1.98E-04 1.53E-04 2.60E-04 9.22E-05 -1.29E-04-2.35E-04 -9.84E-06 -1.09E-04 3.26E-04 -8.57E-05 -1.45E-04 4.39E-04 -3.44E-04 -3.74E-05
Steakhouses/CasualDining 1.59E-04 -2.11E-05 1.04E-04 1.85E-04 -1.03E-04 -1.80E-06 -9.22E-05 9.60E-05 -9.08E-05 4.66E-05 1.01E-04 1.41E-04 1.35E-04 -2.77E-04 2.18E-04 -9.08E-05 3.29E-04 -1.75E-05
Women’s Clothing Stores -3.22E-05 5.35E-05 1.70E-04 -8.04E-05 7.87E-05 8.74E-05 9.81E-05 9.40E-05 6.59E-05 2.51E-04 2.90E-05 -2.06E-05 1.37E-04 -1.32E-04 2.27E-04 1.66E-04 -1.68E-04 1.29E-04
Airlines 3.92E-05 1.68E-04 -7.15E-05 -3.61E-05 1.16E-04 -9.51E-05 -1.02E-04 -1.52E-04 1.07E-04 -1.03E-04 -5.67E-05 1.68E-04 9.04E-05 5.00E-05 2.20E-04 -6.81e-04 4.30E-05 -1.56E-04
Casinos -3.65E-05 1.37E-05 4.42E-05 -5.69E-05 -6.66E-05 -1.12E-04 -1.09E-04 -7.40E-05 1.66E-04 9.43E-05 -1.12E-04 2.41E-04 -5.21E-04 -1.40E-04 2.11E-04 -5.03E-04 4.94E-04 -2.68E-04
Financial Services 6.18E-05 8.56E-05 1.22E-04 1.30E-04 1.77E-04 6.33E-05 8.33E-05 -9.15E-05 -3.06E-05-7.52E-05 1.46E-04 7.87E-05 -3.86E-05 -1.55E-04 -1.26E-04 8.42E-05 -1.74E-04 1.67E-05
Grocery Stores -3.82E-05 8.96E-05 -4.64E-05 -3.18E-04 1.11E-04 -1.02E-04 -9.44E-05 -1.58E-04 -7.49E-05-4.46E-05 -8.82E-05 1.20E-04 4.73E-05 4.75E-05 2.10E-04 -2.53E-04 9.95E-06 -6.98E-05
Drugs: General 2.11E-04 -1.27E-04 3.02e-04 -7.94E-05 8.48E-05 1.71E-04 2.48E-05 1.60E-04 -8.26E-05 1.55E-04 -9.03E-05 6.15E-05 6.67E-07 -5.04E-05 -2.92E-04 2.74E-04 1.77E-04 -2.11E-04
Drugs: Prescription 9.03E-07 -1.92E-04 -2.53E-06 2.78E-04 -3.51E-05 -2.82E-04 -3.21e-04 4.89E-05 1.25E-05 4.23E-06 2.35E-04 1.53E-04 -2.48E-04 1.92E-04 -3.08E-04 2.88E-04 -3.55E-04-7.04e-04
Consumer Banks 4.89E-05 -4.44E-06 -8.18E-05 -1.28E-04 1.37E-04 -1.96E-05 1.28E-04 -2.30E-05 -1.50E-04 5.17E-05 7.77E-06 1.17E-05 -7.43E-05 2.96E-04 1.29E-04 -3.89e-04 1.26E-04 6.84E-05
Note: Estimates in bold are statistically significant at the 95% level.
51
Marketing Science Institute Working Paper Series
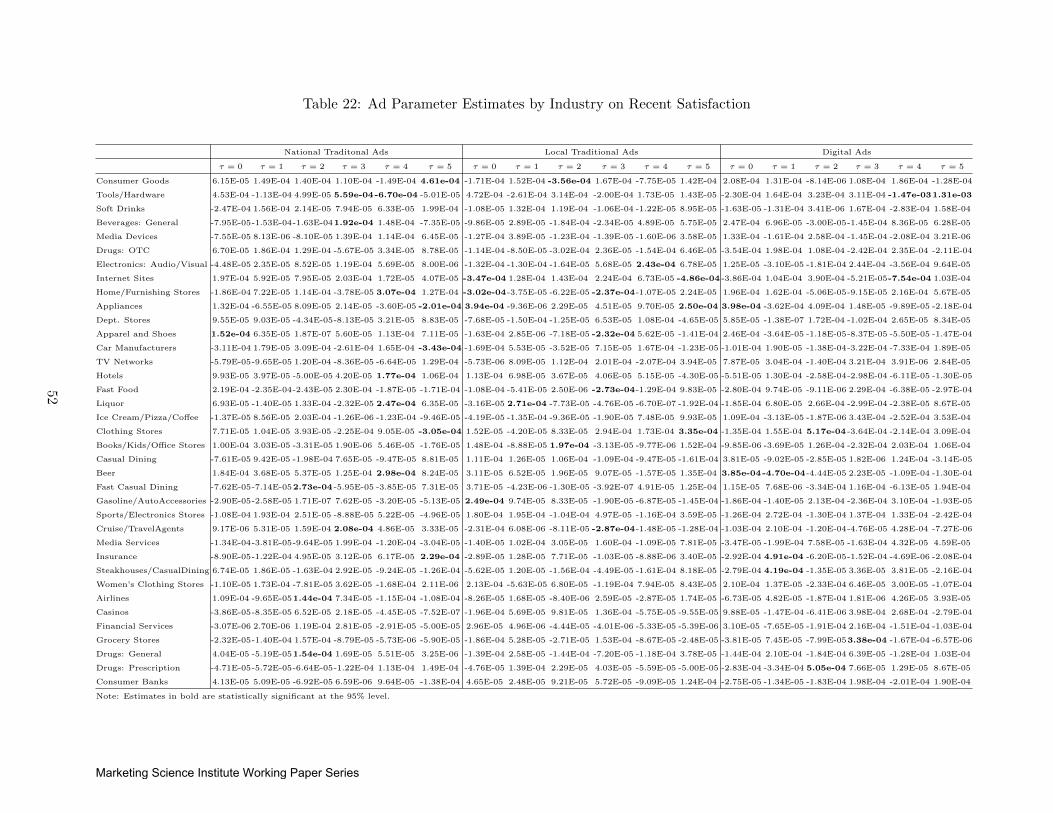
Table 22: Ad Parameter Estimates by Industry on Recent Satisfaction
National Traditonal Ads Local Traditional Ads Digital Ads
τ = 0 τ = 1 τ = 2 τ = 3 τ = 4 τ = 5 τ = 0 τ = 1 τ = 2 τ = 3 τ = 4 τ = 5 τ = 0 τ = 1 τ = 2 τ = 3 τ = 4 τ = 5
Consumer Goods 6.15E-05 1.49E-04 1.40E-04 1.10E-04 -1.49E-04 4.61e-04 -1.71E-04 1.52E-04 -3.56e-04 1.67E-04 -7.75E-05 1.42E-04 2.08E-04 1.31E-04 -8.14E-06 1.08E-04 1.86E-04 -1.28E-04
Tools/Hardware 4.53E-04 -1.13E-04 4.99E-05 5.59e-04-6.70e-04 -5.01E-05 4.72E-04 -2.61E-04 3.14E-04 -2.00E-04 1.73E-05 1.43E-05 -2.30E-04 1.64E-04 3.23E-04 3.11E-04 -1.47e-031.31e-03
Soft Drinks -2.47E-04 1.56E-04 2.14E-05 7.94E-05 6.33E-05 1.99E-04 -1.08E-05 1.32E-04 1.19E-04 -1.06E-04 -1.22E-05 8.95E-05 -1.63E-05 -1.31E-04 3.41E-06 1.67E-04 -2.83E-04 1.58E-04
Beverages: General -7.95E-05-1.53E-04-1.63E-041.92e-04 1.48E-04 -7.35E-05 -9.86E-05 2.89E-05 -1.84E-04 -2.34E-05 4.89E-05 5.75E-05 2.47E-04 6.96E-05 -3.00E-05-1.45E-04 8.36E-05 6.28E-05
Media Devices -7.55E-05 8.13E-06 -8.10E-05 1.39E-04 1.14E-04 6.45E-05 -1.27E-04 3.89E-05 -1.23E-04 -1.39E-05 -1.60E-06 3.58E-05 1.33E-04 -1.61E-04 2.58E-04 -1.45E-04 -2.08E-04 3.21E-06
Drugs: OTC 6.70E-05 1.86E-04 1.29E-04 -5.67E-05 3.34E-05 8.78E-05 -1.14E-04 -8.50E-05 -3.02E-04 2.36E-05 -1.54E-04 6.46E-05 -3.54E-04 1.98E-04 1.08E-04 -2.42E-04 2.35E-04 -2.11E-04
Electronics: Audio/Visual -4.48E-05 2.35E-05 8.52E-05 1.19E-04 5.69E-05 8.00E-06 -1.32E-04 -1.30E-04 -1.64E-05 5.68E-05 2.43e-04 6.78E-05 1.25E-05 -3.10E-05 -1.81E-04 2.44E-04 -3.56E-04 9.64E-05
Internet Sites 1.97E-04 5.92E-05 7.95E-05 2.03E-04 1.72E-05 4.07E-05 -3.47e-04 1.28E-04 1.43E-04 2.24E-04 6.73E-05 -4.86e-04 -3.86E-04 1.04E-04 3.90E-04 -5.21E-05-7.54e-04 1.03E-04
Home/Furnishing Stores -1.86E-04 7.22E-05 1.14E-04 -3.78E-05 3.07e-04 1.27E-04 -3.02e-04-3.75E-05 -6.22E-05 -2.37e-04-1.07E-05 2.24E-05 1.96E-04 1.62E-04 -5.06E-05-9.15E-05 2.16E-04 5.67E-05
Appliances 1.32E-04 -6.55E-05 8.09E-05 2.14E-05 -3.60E-05 -2.01e-04 3.94e-04 -9.36E-06 2.29E-05 4.51E-05 9.70E-05 2.50e-04 3.98e-04 -3.62E-04 4.09E-04 1.48E-05 -9.89E-05 -2.18E-04
Dept. Stores 9.55E-05 9.03E-05 -4.34E-05-8.13E-05 3.21E-05 8.83E-05 -7.68E-05 -1.50E-04 -1.25E-05 6.53E-05 1.08E-04 -4.65E-05 5.85E-05 -1.38E-07 1.72E-04 -1.02E-04 2.65E-05 8.34E-05
Apparel and Shoes 1.52e-04 6.35E-05 1.87E-07 5.60E-05 1.13E-04 7.11E-05 -1.63E-04 2.85E-06 -7.18E-05 -2.32e-04 5.62E-05 -1.41E-04 2.46E-04 -3.64E-05 -1.18E-05-8.37E-05 -5.50E-05 -1.47E-04
Car Manufacturers -3.11E-04 1.79E-05 3.09E-04 -2.61E-04 1.65E-04 -3.43e-04 -1.69E-04 5.53E-05 -3.52E-05 7.15E-05 1.67E-04 -1.23E-05 -1.01E-04 1.90E-05 -1.38E-04-3.22E-04 -7.33E-04 1.89E-05
TV Networks -5.79E-05-9.65E-05 1.20E-04 -8.36E-05 -6.64E-05 1.29E-04 -5.73E-06 8.09E-05 1.12E-04 2.01E-04 -2.07E-04 3.94E-05 7.87E-05 3.04E-04 -1.40E-04 3.21E-04 3.91E-06 2.84E-05
Hotels 9.93E-05 3.97E-05 -5.00E-05 4.20E-05 1.77e-04 1.06E-04 1.13E-04 6.98E-05 3.67E-05 4.06E-05 5.15E-05 -4.30E-05 -5.51E-05 1.30E-04 -2.58E-04-2.98E-04 -6.11E-05 -1.30E-05
Fast Food 2.19E-04 -2.35E-04-2.43E-05 2.30E-04 -1.87E-05 -1.71E-04 -1.08E-04 -5.41E-05 2.50E-06 -2.73e-04-1.29E-04 9.83E-05 -2.80E-04 9.74E-05 -9.11E-06 2.29E-04 -6.38E-05 -2.97E-04
Liquor 6.93E-05 -1.40E-05 1.33E-04 -2.32E-05 2.47e-04 6.35E-05 -3.16E-05 2.71e-04 -7.73E-05 -4.76E-05 -6.70E-07 -1.92E-04 -1.85E-04 6.80E-05 2.66E-04 -2.99E-04 -2.38E-05 8.67E-05
Ice Cream/Pizza/Coffee -1.37E-05 8.56E-05 2.03E-04 -1.26E-06 -1.23E-04 -9.46E-05 -4.19E-05 -1.35E-04 -9.36E-05 -1.90E-05 7.48E-05 9.93E-05 1.09E-04 -3.13E-05 -1.87E-06 3.43E-04 -2.52E-04 3.53E-04
Clothing Stores 7.71E-05 1.04E-05 3.93E-05 -2.25E-04 9.05E-05 -3.05e-04 1.52E-05 -4.20E-05 8.33E-05 2.94E-04 1.73E-04 3.35e-04 -1.35E-04 1.55E-04 5.17e-04 -3.64E-04 -2.14E-04 3.09E-04
Books/Kids/Office Stores 1.00E-04 3.03E-05 -3.31E-05 1.90E-06 5.46E-05 -1.76E-05 1.48E-04 -8.88E-05 1.97e-04 -3.13E-05 -9.77E-06 1.52E-04 -9.85E-06 -3.69E-05 1.26E-04 -2.32E-04 2.03E-04 1.06E-04
Casual Dining -7.61E-05 9.42E-05 -1.98E-04 7.65E-05 -9.47E-05 8.81E-05 1.11E-04 1.26E-05 1.06E-04 -1.09E-04 -9.47E-05 -1.61E-04 3.81E-05 -9.02E-05 -2.85E-05 1.82E-06 1.24E-04 -3.14E-05
Beer 1.84E-04 3.68E-05 5.37E-05 1.25E-04 2.98e-04 8.24E-05 3.11E-05 6.52E-05 1.96E-05 9.07E-05 -1.57E-05 1.35E-04 3.85e-04-4.70e-04-4.44E-05 2.23E-05 -1.09E-04 -1.30E-04
Fast Casual Dining -7.62E-05-7.14E-052.73e-04 -5.95E-05 -3.85E-05 7.31E-05 3.71E-05 -4.23E-06 -1.30E-05 -3.92E-07 4.91E-05 1.25E-04 1.15E-05 7.68E-06 -3.34E-04 1.16E-04 -6.13E-05 1.94E-04
Gasoline/AutoAccessories -2.90E-05-2.58E-05 1.71E-07 7.62E-05 -3.20E-05 -5.13E-05 2.49e-04 9.74E-05 8.33E-05 -1.90E-05 -6.87E-05 -1.45E-04 -1.86E-04 -1.40E-05 2.13E-04 -2.36E-04 3.10E-04 -1.93E-05
Sports/Electronics Stores -1.08E-04 1.93E-04 2.51E-05 -8.88E-05 5.22E-05 -4.96E-05 1.80E-04 1.95E-04 -1.04E-04 4.97E-05 -1.16E-04 3.59E-05 -1.26E-04 2.72E-04 -1.30E-04 1.37E-04 1.33E-04 -2.42E-04
Cruise/TravelAgents 9.17E-06 5.31E-05 1.59E-04 2.08e-04 4.86E-05 3.33E-05 -2.31E-04 6.08E-06 -8.11E-05 -2.87e-04-1.48E-05 -1.28E-04 -1.03E-04 2.10E-04 -1.20E-04-4.76E-05 4.28E-04 -7.27E-06
Media Services -1.34E-04-3.81E-05-9.64E-05 1.99E-04 -1.20E-04 -3.04E-05 -1.40E-05 1.02E-04 3.05E-05 1.60E-04 -1.09E-05 7.81E-05 -3.47E-05 -1.99E-04 7.58E-05 -1.63E-04 4.32E-05 4.59E-05
Insurance -8.90E-05-1.22E-04 4.95E-05 3.12E-05 6.17E-05 2.29e-04 -2.89E-05 1.28E-05 7.71E-05 -1.03E-05 -8.88E-06 3.40E-05 -2.92E-04 4.91e-04 -6.20E-05-1.52E-04 -4.69E-06 -2.08E-04
Steakhouses/CasualDining 6.74E-05 1.86E-05 -1.63E-04 2.92E-05 -9.24E-05 -1.26E-04 -5.62E-05 1.20E-05 -1.56E-04 -4.49E-05 -1.61E-04 8.18E-05 -2.79E-04 4.19e-04 -1.35E-05 3.36E-05 3.81E-05 -2.16E-04
Women’s Clothing Stores -1.10E-05 1.73E-04 -7.81E-05 3.62E-05 -1.68E-04 2.11E-06 2.13E-04 -5.63E-05 6.80E-05 -1.19E-04 7.94E-05 8.43E-05 2.10E-04 1.37E-05 -2.33E-04 6.46E-05 3.00E-05 -1.07E-04
Airlines 1.09E-04 -9.65E-051.44e-04 7.34E-05 -1.15E-04 -1.08E-04 -8.26E-05 1.68E-05 -8.40E-06 2.59E-05 -2.87E-05 1.74E-05 -6.73E-05 4.82E-05 -1.87E-04 1.81E-06 4.26E-05 3.93E-05
Casinos -3.86E-05-8.35E-05 6.52E-05 2.18E-05 -4.45E-05 -7.52E-07 -1.96E-04 5.69E-05 9.81E-05 1.36E-04 -5.75E-05 -9.55E-05 9.88E-05 -1.47E-04 -6.41E-06 3.98E-04 2.68E-04 -2.79E-04
Financial Services -3.07E-06 2.70E-06 1.19E-04 2.81E-05 -2.91E-05 -5.00E-05 2.96E-05 4.96E-06 -4.44E-05 -4.01E-06 -5.33E-05 -5.39E-06 3.10E-05 -7.65E-05 -1.91E-04 2.16E-04 -1.51E-04 -1.03E-04
Grocery Stores -2.32E-05-1.40E-04 1.57E-04 -8.79E-05 -5.73E-06 -5.90E-05 -1.86E-04 5.28E-05 -2.71E-05 1.53E-04 -8.67E-05 -2.48E-05 -3.81E-05 7.45E-05 -7.99E-053.38e-04 -1.67E-04 -6.57E-06
Drugs: General 4.04E-05 -5.19E-051.54e-04 1.69E-05 5.51E-05 3.25E-06 -1.39E-04 2.58E-05 -1.44E-04 -7.20E-05 -1.18E-04 3.78E-05 -1.44E-04 2.10E-04 -1.84E-04 6.39E-05 -1.28E-04 1.03E-04
Drugs: Prescription -4.71E-05-5.72E-05-6.64E-05-1.22E-04 1.13E-04 1.49E-04 -4.76E-05 1.39E-04 2.29E-05 4.03E-05 -5.59E-05 -5.00E-05 -2.83E-04 -3.34E-04 5.05e-04 7.66E-05 1.29E-05 8.67E-05
Consumer Banks 4.13E-05 5.09E-05 -6.92E-05 6.59E-06 9.64E-05 -1.38E-04 4.65E-05 2.48E-05 9.21E-05 5.72E-05 -9.09E-05 1.24E-04 -2.75E-05 -1.34E-05 -1.83E-04 1.98E-04 -2.01E-04 1.90E-04
Note: Estimates in bold are statistically significant at the 95% level.
52
Marketing Science Institute Working Paper Series
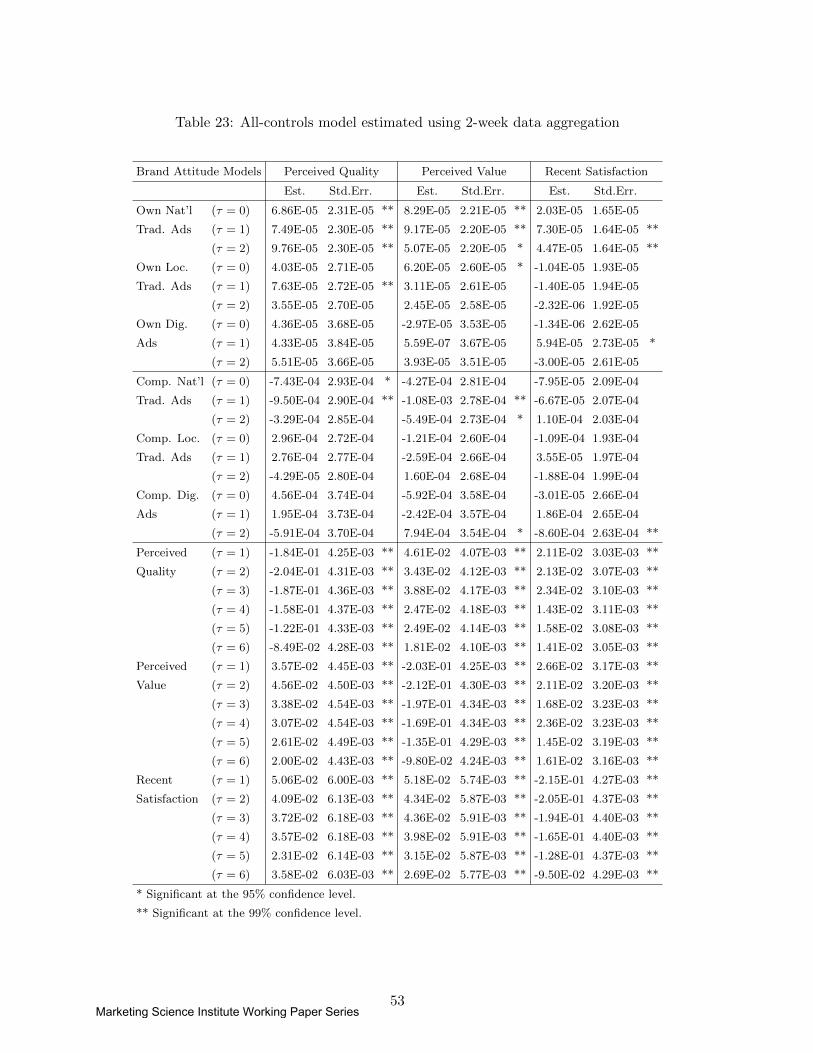
Table 23: All-controls model estimated using 2-week data aggregation
Brand Attitude Models Perceived Quality Perceived Value Recent Satisfaction
Est. Std.Err. Est. Std.Err. Est. Std.Err.
Own Nat’l (τ = 0) 6.86E-05 2.31E-05 ** 8.29E-05 2.21E-05 ** 2.03E-05 1.65E-05
Trad. Ads (τ = 1) 7.49E-05 2.30E-05 ** 9.17E-05 2.20E-05 ** 7.30E-05 1.64E-05 **
(τ = 2) 9.76E-05 2.30E-05 ** 5.07E-05 2.20E-05 * 4.47E-05 1.64E-05 **
Own Loc. (τ = 0) 4.03E-05 2.71E-05 6.20E-05 2.60E-05 * -1.04E-05 1.93E-05
Trad. Ads (τ = 1) 7.63E-05 2.72E-05 ** 3.11E-05 2.61E-05 -1.40E-05 1.94E-05
(τ = 2) 3.55E-05 2.70E-05 2.45E-05 2.58E-05 -2.32E-06 1.92E-05
Own Dig. (τ = 0) 4.36E-05 3.68E-05 -2.97E-05 3.53E-05 -1.34E-06 2.62E-05
Ads (τ = 1) 4.33E-05 3.84E-05 5.59E-07 3.67E-05 5.94E-05 2.73E-05 *
(τ = 2) 5.51E-05 3.66E-05 3.93E-05 3.51E-05 -3.00E-05 2.61E-05
Comp. Nat’l (τ = 0) -7.43E-04 2.93E-04 * -4.27E-04 2.81E-04 -7.95E-05 2.09E-04
Trad. Ads (τ = 1) -9.50E-04 2.90E-04 ** -1.08E-03 2.78E-04 ** -6.67E-05 2.07E-04
(τ = 2) -3.29E-04 2.85E-04 -5.49E-04 2.73E-04 * 1.10E-04 2.03E-04
Comp. Loc. (τ = 0) 2.96E-04 2.72E-04 -1.21E-04 2.60E-04 -1.09E-04 1.93E-04
Trad. Ads (τ = 1) 2.76E-04 2.77E-04 -2.59E-04 2.66E-04 3.55E-05 1.97E-04
(τ = 2) -4.29E-05 2.80E-04 1.60E-04 2.68E-04 -1.88E-04 1.99E-04
Comp. Dig. (τ = 0) 4.56E-04 3.74E-04 -5.92E-04 3.58E-04 -3.01E-05 2.66E-04
Ads (τ = 1) 1.95E-04 3.73E-04 -2.42E-04 3.57E-04 1.86E-04 2.65E-04
(τ = 2) -5.91E-04 3.70E-04 7.94E-04 3.54E-04 * -8.60E-04 2.63E-04 **
Perceived (τ = 1) -1.84E-01 4.25E-03 ** 4.61E-02 4.07E-03 ** 2.11E-02 3.03E-03 **
Quality (τ = 2) -2.04E-01 4.31E-03 ** 3.43E-02 4.12E-03 ** 2.13E-02 3.07E-03 **
(τ = 3) -1.87E-01 4.36E-03 ** 3.88E-02 4.17E-03 ** 2.34E-02 3.10E-03 **
(τ = 4) -1.58E-01 4.37E-03 ** 2.47E-02 4.18E-03 ** 1.43E-02 3.11E-03 **
(τ = 5) -1.22E-01 4.33E-03 ** 2.49E-02 4.14E-03 ** 1.58E-02 3.08E-03 **
(τ = 6) -8.49E-02 4.28E-03 ** 1.81E-02 4.10E-03 ** 1.41E-02 3.05E-03 **
Perceived (τ = 1) 3.57E-02 4.45E-03 ** -2.03E-01 4.25E-03 ** 2.66E-02 3.17E-03 **
Value (τ = 2) 4.56E-02 4.50E-03 ** -2.12E-01 4.30E-03 ** 2.11E-02 3.20E-03 **
(τ = 3) 3.38E-02 4.54E-03 ** -1.97E-01 4.34E-03 ** 1.68E-02 3.23E-03 **
(τ = 4) 3.07E-02 4.54E-03 ** -1.69E-01 4.34E-03 ** 2.36E-02 3.23E-03 **
(τ = 5) 2.61E-02 4.49E-03 ** -1.35E-01 4.29E-03 ** 1.45E-02 3.19E-03 **
(τ = 6) 2.00E-02 4.43E-03 ** -9.80E-02 4.24E-03 ** 1.61E-02 3.16E-03 **
Recent (τ = 1) 5.06E-02 6.00E-03 ** 5.18E-02 5.74E-03 ** -2.15E-01 4.27E-03 **
Satisfaction (τ = 2) 4.09E-02 6.13E-03 ** 4.34E-02 5.87E-03 ** -2.05E-01 4.37E-03 **
(τ = 3) 3.72E-02 6.18E-03 ** 4.36E-02 5.91E-03 ** -1.94E-01 4.40E-03 **
(τ = 4) 3.57E-02 6.18E-03 ** 3.98E-02 5.91E-03 ** -1.65E-01 4.40E-03 **
(τ = 5) 2.31E-02 6.14E-03 ** 3.15E-02 5.87E-03 ** -1.28E-01 4.37E-03 **
(τ = 6) 3.58E-02 6.03E-03 ** 2.69E-02 5.77E-03 ** -9.50E-02 4.29E-03 **
* Significant at the 95% confidence level.
** Significant at the 99% confidence level.
53Marketing Science Institute Working Paper Series
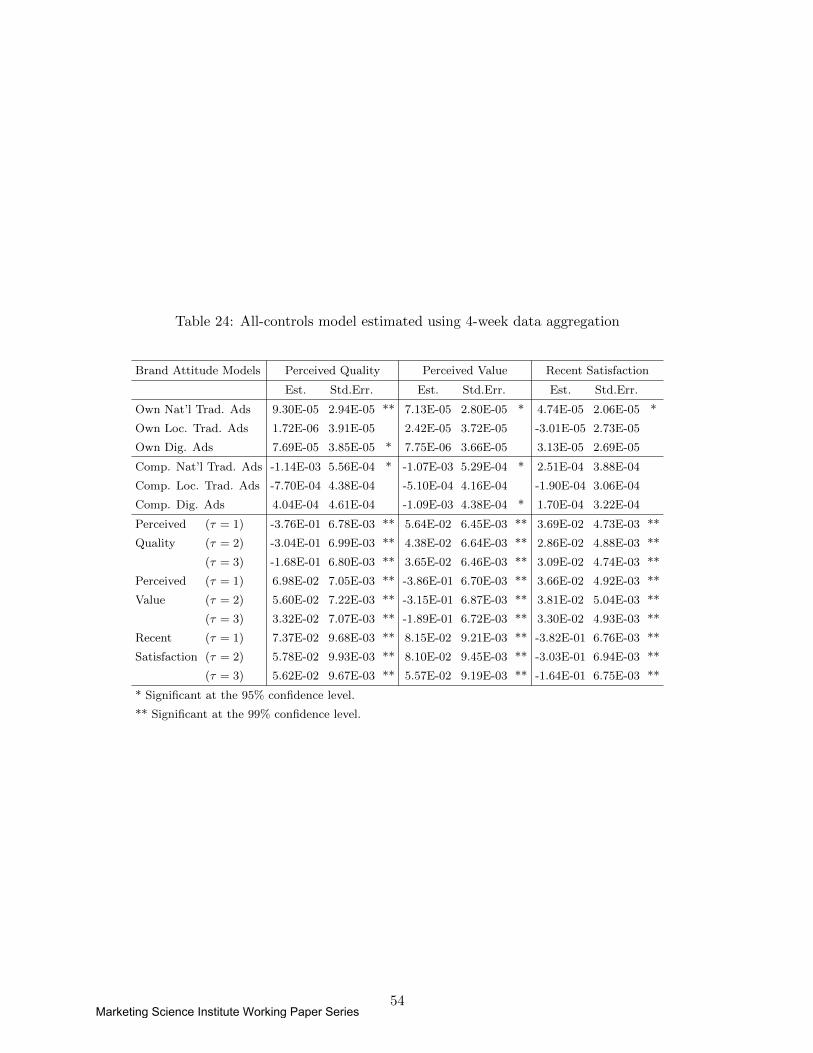
Table 24: All-controls model estimated using 4-week data aggregation
Brand Attitude Models Perceived Quality Perceived Value Recent Satisfaction
Est. Std.Err. Est. Std.Err. Est. Std.Err.
Own Nat’l Trad. Ads 9.30E-05 2.94E-05 ** 7.13E-05 2.80E-05 * 4.74E-05 2.06E-05 *
Own Loc. Trad. Ads 1.72E-06 3.91E-05 2.42E-05 3.72E-05 -3.01E-05 2.73E-05
Own Dig. Ads 7.69E-05 3.85E-05 * 7.75E-06 3.66E-05 3.13E-05 2.69E-05
Comp. Nat’l Trad. Ads -1.14E-03 5.56E-04 * -1.07E-03 5.29E-04 * 2.51E-04 3.88E-04
Comp. Loc. Trad. Ads -7.70E-04 4.38E-04 -5.10E-04 4.16E-04 -1.90E-04 3.06E-04
Comp. Dig. Ads 4.04E-04 4.61E-04 -1.09E-03 4.38E-04 * 1.70E-04 3.22E-04
Perceived (τ = 1) -3.76E-01 6.78E-03 ** 5.64E-02 6.45E-03 ** 3.69E-02 4.73E-03 **
Quality (τ = 2) -3.04E-01 6.99E-03 ** 4.38E-02 6.64E-03 ** 2.86E-02 4.88E-03 **
(τ = 3) -1.68E-01 6.80E-03 ** 3.65E-02 6.46E-03 ** 3.09E-02 4.74E-03 **
Perceived (τ = 1) 6.98E-02 7.05E-03 ** -3.86E-01 6.70E-03 ** 3.66E-02 4.92E-03 **
Value (τ = 2) 5.60E-02 7.22E-03 ** -3.15E-01 6.87E-03 ** 3.81E-02 5.04E-03 **
(τ = 3) 3.32E-02 7.07E-03 ** -1.89E-01 6.72E-03 ** 3.30E-02 4.93E-03 **
Recent (τ = 1) 7.37E-02 9.68E-03 ** 8.15E-02 9.21E-03 ** -3.82E-01 6.76E-03 **
Satisfaction (τ = 2) 5.78E-02 9.93E-03 ** 8.10E-02 9.45E-03 ** -3.03E-01 6.94E-03 **
(τ = 3) 5.62E-02 9.67E-03 ** 5.57E-02 9.19E-03 ** -1.64E-01 6.75E-03 **
* Significant at the 95% confidence level.
** Significant at the 99% confidence level.
54Marketing Science Institute Working Paper Series