Jarden Corporation Commission File No. - Newell Brands
76
-
Upload
khangminh22 -
Category
Documents
-
view
0 -
download
0
Transcript of Jarden Corporation Commission File No. - Newell Brands

C o n su m er A n aly st G ro u p o f N ew Y o rk Mich ael B . P o lk , P resid en t & C h ief E x ecu tiv e O fficer 1 9 F eb ru ary , 2 0 1 6 F iled b y N ew ell R u b b erm aid In c. p u rsu an t to R u le 4 2 5 u n d er th e S ecu rities A ct o f 1 9 3 3 an d d eem ed filed p u rsu an t to R u le 1 4 a-1 2 u n d er th e S ecu rities E x ch an g e A ct o f 1 9 3 4 S u b ject C o m p an y : Jard en C o rp o ratio n C o m m issio n F ile N o .: 0 0 1 -1 3 6 6 5 F eb ru ary 1 9 , 2 0 1 6

F o rw ard -lo o k in g S tatem en ts S tatem en ts in th is p resen tatio n th at are n o t h isto rical in n atu re co n stitu te fo rw ard -lo o k in g statem en ts. T h ese fo rw ard -lo o k in g statem en ts relate to in fo rm atio n o r assu m p tio n s ab o u t th e effects o f sales, in co m e/(lo ss), earn in g s p er sh are, o p eratin g in co m e, o p eratin g m arg in o r g ro ss m arg in im p ro v em en ts o r d eclin es, P ro ject R en ew al, cap ital an d o th er ex p en d itu res, cash flo w , d iv id en d s, restru ctu rin g an d o th er p ro ject co sts, co sts an d co st sav in g s, in flatio n o r d eflatio n , p articu larly w ith resp ect to co m m o d ities su ch as o il an d resin , d eb t ratin g s, ch an g es in ex ch an g e rates, p ro d u ct recalls, ex p ected b en efits, sy n erg ies an d fin an cial resu lts fro m recen tly co m p leted acq u isitio n s an d p lan n ed acq u isitio n s an d d iv estitu res an d m an ag em en t's p lan s, p ro jectio n s an d o b jectiv es fo r fu tu re o p eratio n s an d p erfo rm an ce. T h ese statem en ts are acco m p an ied b y w o rd s su ch as "an ticip ate," "ex p ect," "p ro ject," "w ill," "b eliev e," "estim ate" an d sim ilar ex p ressio n s. A ctu al resu lts co u ld d iffer m aterially fro m th o se ex p ressed o r im p lied in th e fo rw ard -lo o k in g statem en ts. Im p o rtan t facto rs th at co u ld cau se actu al resu lts to d iffer m aterially fro m th o se su g g ested b y th e fo rw ard -lo o k in g statem en ts in clu d e, b u t are n o t lim ited to , o u r d ep en d en ce o n th e stren g th o f retail, co m m ercial an d in d u strial secto rs o f th e eco n o m y in lig h t o f th e co n tin u atio n o r escalatio n o f th e g lo b al eco n o m ic slo w d o w n o r reg io n al so v ereig n d eb t issu es; cu rren cy flu ctu atio n s; co m p etitio n w ith o th er m an u factu rers an d d istrib u to rs o f co n su m er p ro d u cts; m ajo r retailers' stro n g b arg ain in g p o w er an d co n so lid atio n o f o u r retail cu sto m ers; ch an g es in th e p rices o f raw m aterials an d so u rced p ro d u cts an d o u r ab ility to o b tain raw m aterials an d so u rced p ro d u cts in a tim ely m an n er fro m su p p liers; o u r ab ility to d ev elo p in n o v ativ e n ew p ro d u cts an d to d ev elo p , m ain tain an d stren g th en o u r en d -u ser b ran d s, in clu d in g th e ab ility to realize an ticip ated b en efits o f in creased ad v ertisin g an d p ro m o tio n sp en d ; p ro d u ct liab ility , p ro d u ct recalls o r reg u lato ry actio n s; o u r ab ility to ex p ed itio u sly clo se facilities an d m o v e o p eratio n s w h ile m an ag in g fo reig n reg u latio n s an d o th er im p ed im en ts; a failu re o f o n e o f o u r k ey in fo rm atio n tech n o lo g y sy stem s o r related co n tro ls; th e p o ten tial in ab ility to attract, retain an d m o tiv ate k ey em p lo y ees; fu tu re ev en ts th at co u ld ad v ersely affect th e v alu e o f o u r assets an d req u ire im p airm en t ch arg es; o u r ab ility to im p ro v e p ro d u ctiv ity an d stream lin e o p eratio n s; ch an g es to o u r cred it ratin g s; sig n ifican t in creases in th e fu n d in g o b lig atio n s related to o u r p en sio n p lan s d u e to d eclin in g asset v alu es, d eclin in g in terest rates o r o th erw ise; th e im p o sitio n o ftax liab ilities g reater th an o u r p ro v isio n s fo r su ch m atters; th e risk s in h eren t in o u r fo reig n o p eratio n s, in clu d in g ex ch an g e co n tro ls an d p ricin g restrictio n s; o u r ab ility to realize th e ex p ected b en efits, sy n erg ies an d fin an cial resu lts fro m o u r recen tly acq u ired b u sin esses an d p en d in g acq u isitio n s; o u r in ab ility to o b tain sto ck h o ld er o r d o m estic an d fo reig n reg u lato ry ap p ro v als req u ired to co m p lete p lan n ed acq u isitio n s an d d iv estitu res; failu re to satisfy a co n d itio n to clo sin g o f p lan n ed acq u isitio n s an d d iv estitu res; o u r ab ility to co m p lete p lan n ed acq u isitio n s an d d iv estitu res; d ifficu lties o r h ig h co sts asso ciated w ith secu rin g fin an cin g n ecessary to p ay th e cash p o rtio n o f th e m erg er co n sid eratio n co n tem p lated b y th e p en d in g Jard en tran sactio n ; risk s related to th e su b stan tial in d eb ted n ess th at N ew ell R u b b erm aid w ill in cu r in co n n ectio n w ith th e p en d in g Jard en tran sactio n an d o u r ab ility to m ain tain o u r in v estm en t g rad e cred it ratin g s; d ifficu lties in teg ratin g o u r b u sin ess w ith Jard en an d u n ex p ected co sts o r ex p en ses asso ciated w ith th e p en d in g Jard en tran sactio n ; an d th o se facto rs listed in o u r m o st recen tly filed Q u arterly R ep o rt o n F o rm 1 0 -Q an d E x h ib it 9 9 .1 th ereto filed w ith th e S ecu rities an d E x ch an g e C o m m issio n . C h an g es in su ch assu m p tio n s o r facto rs co u ld p ro d u ce sig n ifican tly d ifferen t resu lts. T h e in fo rm atio n co n tain ed in th is p resen tatio n is as o f th e d ate in d icated . T h e co m p an y assu m es n o o b lig atio n to u p d ate an y fo rw ard -lo o k in g statem en ts co n tain ed in th is p resen tatio n as a resu lt o f n ew in fo rm atio n o r fu tu re ev en ts o r d ev elo p m en ts. T h is p resen tatio n co n tain s n o n -G A A P fin an cial m easu res w ith in th e m ean in g o f R eg u latio n G p ro m u lg ated b y th e S ecu rities an d E x ch an g e C o m m issio n an d in clu d es a reco n ciliatio n o f th ese n o n -G A A P fin an cial m easu res to th e m o st d irectly co m p arab le fin an cial m easu res calcu lated in acco rd an ce w ith G A A P . Wh ile th e co m p an y b eliev es th at th ese n o n -G A A P fin an cial m easu res are u sefu l in ev alu atin g th e co m p an y ’s p erfo rm an ce, th is in fo rm atio n sh o u ld b e co n sid ered as su p p lem en tal in n atu re an d n o t as a su b stitu te fo r o r su p erio r to th e related fin an cial in fo rm atio n p rep ared in acco rd an ce w ith G A A P . A d d itio n ally , th ese n o n -G A A P fin an cial m easu res m ay d iffer fro m sim ilar m easu res p resen ted b y o th er co m p an ies.

A d d itio n al In fo rm atio n N an cy O ’D o n n ell V P , In v esto r R elatio n s (7 7 0 ) 4 1 8 -7 7 2 3 n an cy .o d o n n ell@n ew ellco .co m A lish a D u b iq u e S r. Man ag er, In v esto r R elatio n s (7 7 0 ) 4 1 8 -7 7 0 6 alish a.d u b iq u e@n ew ellco .co m IN V E S T O R R E L A T IO N S C O N T A C T S : A d d itio n al In fo rm atio n an d Wh ere to F in d it In co n n ectio n w ith th e p en d in g Jard en tran sactio n , N ew ell R u b b erm aid an d Jard en h av e filed a reg istratio n statem en t o n F o rm S -4 th at in clu d es th e Jo in t P ro x y S tatem en t o f N ew ell R u b b erm aid an d Jard en an d th at also co n stitu tes a p ro sp ectu s o f N ew ell R u b b erm aid . N ew ell R u b b erm aid an d Jard en p lan to m ail to th eir resp ectiv e sh areh o ld ers th e Jo in t P ro x y S tatem en t/P ro sp ectu s in co n n ectio n w ith th e p en d in g Jard en tran sactio n . WE U R G E IN V E S T O R S A N D S H A R E H O L D E R S T O R E A D T H E JO IN T P R O X Y S T A T E ME N T /P R O S P E C T U S A N D A N Y O T H E R R E L E V A N T D O C U ME N T S , B E C A U S E T H E Y C O N T A IN IMP O R T A N T IN F O R MA T IO N A B O U T N E WE L L R U B B E R MA ID , JA R D E N , A N D T H E P E N D IN G JA R D E N T R A N S A C T IO N . In v esto rs an d sh areh o ld ers are ab le to o b tain co p ies o f th e Jo in t P ro x y S tatem en t/P ro sp ectu s an d o th er d o cu m en ts filed w ith th e S E C b y N ew ell R u b b erm aid an d Jard en free o f ch arg e at th e S E C ’s w eb site, w w w .sec.g o v . In ad d itio n , in v esto rs an d sh areh o ld ers are ab le to o b tain free co p ies o f th e Jo in t P ro x y S tatem en t/P ro sp ectu s an d o th er d o cu m en ts filed w ith th e S E C b y N ew ell R u b b erm aid b y accessin g N ew ell R u b b erm aid ’s w eb site at w w w .n ew ellru b b erm aid .co m b y click in g o n th e “In v esto r R elatio n s” lin k an d th en click in g o n th e “S E C F ilin g s” lin k o r b y co n tactin g N ew ell R u b b erm aid In v esto r R elatio n s at in v esto r.relatio n s@n ew ellru b b erm aid .co m o r b y callin g 1 -8 0 0 -4 2 4 -1 9 4 1 . S h areh o ld ers m ay also read an d co p y an y rep o rts, statem en ts an d o th er in fo rm atio n filed b y N ew ell R u b b erm aid o r Jard en w ith th e S E C , at th e S E C p u b lic referen ce ro o m at 1 0 0 F S treet, N .E ., Wash in g to n D .C . 2 0 5 4 9 . P lease call th e S E C at 1 -8 0 0 -S E C -0 3 3 0 o r v isit th e S E C ’s w eb site fo r fu rth er in fo rm atio n o n its p u b lic referen ce ro o m . P articip an ts in th e Merg er S o licitatio n N ew ell R u b b erm aid ,Jard en an d certain o f th eir resp ectiv e d irecto rs, ex ecu tiv e o fficers an d o th er p erso n s m ay b e co n sid ered p articip an ts in th e so licitatio n o f p ro x ies fro m th e resp ectiv e sh areh o ld ers o f N ew ell R u b b erm aid an d Jard en in resp ect o f th e p ro p o sed co m b in atio n co n tem p lated b y th e Jo in t P ro x y S tatem en t/P ro sp ectu s. In fo rm atio n reg ard in g N ew ell R u b b erm aid ’s d irecto rs an d ex ecu tiv e o fficers is av ailab le in N ew ell R u b b erm aid ’s F o rm 1 0 -K filed w ith th e S E C o n March 2 , 2 0 1 5 , its p ro x y statem en t filed w ith th e S E C o n A p ril 1 , 2 0 1 5 in co n n ectio n w ith its 2 0 1 5 an n u al m eetin g o f sto ck h o ld ers an d its F o rm s 8 -K filed w ith th e S E C o n F eb ru ary 1 2 , 2 0 1 5 , May 1 9 , 2 0 1 5 , O cto b er 9 , 2 0 1 5 , N o v em b er 1 6 , 2 0 1 5 , D ecem b er 1 4 , 2 0 1 5 an d D ecem b er 2 9 , 2 0 1 5 . In fo rm atio n reg ard in g Jard en ’s d irecto rs an d ex ecu tiv e o fficers is av ailab le in Jard en ’s F o rm 1 0 -K filed w ith th e S E C o n March 2 , 2 0 1 5 , its p ro x y statem en t filed w ith th e S E C o n A p ril 2 0 , 2 0 1 5 in co n n ectio n w ith its 2 0 1 5 an n u al m eetin g o f sto ck h o ld ers an d its F o rm s 8 -K filed w ith th e S E C o n Jan u ary 5 , 2 0 1 5 , Ju n e 9 , 2 0 1 5 , D ecem b er 1 7 , 2 0 1 5 an d Jan u ary 7 , 2 0 1 6 . O th er in fo rm atio n reg ard in g p erso n s w h o m ay b e co n sid ered p articip an ts in th e p ro x y so licitatio n an d a d escrip tio n o f th eir d irect an d in d irect in terests, b y secu rity h o ld in g s o r o th erw ise, are co n tain ed in th e Jo in t P ro x y S tatem en t/P ro sp ectu s an d o th er relev an t m aterials filed w ith th e S E C .

P o rtfo lio o f lead in g b ran d s ® ®

N ew ell strateg ic o p p o rtu n ity 2 0 1 1 “H o ld in g co m p an y ” ap p ro ach d elev erag ed scale H ig h co st stru ctu re an d lo w b ran d in v estm en t R eso u rces allo cated d em o cratically “H o ld in g co m p an y ” ap p ro ach d isab led co re cap ab ilities

L au n ch ed co rp o rate strateg y 2 0 1 2
N ew o p eratin g m o d el 2 0 1 3 B ran d D ev elo p m en t C o m m ercial D eliv ery N ew Mo d el T w o C o re A ctiv ity S y stem s

F ro m h o ld in g co m p an y to o p eratin g co m p an y C o rp o rate 3 G ro u p s 1 3 G lo b al B U s F u n ctio n s in G B U s H o ld in g C o m p an y C o rp o rate O p eratin g C o m p an y F u n ctio n s Writin g C o m m ercial T o o ls B ab y H o m e

R esu lts acceleratin g 2 .4 % 2 .7 % 3 .0 % 3 .0 % 3 .6 % * * E x clu d in g E ME A an d R u b b erm aid C o n su m er S to rag e ex its 5 .5 % C o re S ales G ro w th $ 1 .5 4 $ 1 .6 7 $ 1 .8 2 $ 2 .0 0 $ 2 .1 8 N o rm alized E P S

N ew ell p lay b o o k

In v estin g fo r co m p etitiv e ad v an tag e In sig h ts D esig n Mark etin g S ellin g E -co m m

Id eatio n sy stem d riv in g in n o v atio n In n o v atio n N O W In n o v atio n V alu e E n g in eerin g

R esearch as so u rce/v alid atio n o f id eas n u m b er o f n ew strateg ic stu d ies $ 6 0 m * in v ested O v er $ 3 b n o f u n m et n eed s id en tified O v er 1 ,2 0 0 in n o v atio n co n cep ts tested in 3 y ears In sig h ts to m ark etin g talen t ratio fro m 1 to 2 0 to 1 to 8 * R ep resen ts sp en d o n m ark etin g in sig h ts in 2 0 1 3 , 2 0 1 4 an d 2 0 1 5 .

S ig n ifican tly stro n g er in n o v atio n fu n n el 2 0 1 3 < $ 1 m $ 1 -5 m $ 5 -1 0 m $ 1 0 m an d ab o v e 2 0 1 5 + $ 7 0 0 m sin ce 2 0 1 3

2 0 1 6 L au n ch es: Writin g E x p o ® Mag n etic S h arp ie C lear V iew ® stix E x p o ® d u al en d ed Mr. S k etch ® scen ted cray o n s In k Jo y ® g el

2 0 1 6 L au n ch es: H o m e F resh w o rk s™ F asten + G o ™ S h arp In ™ k n iv es P an try o rg A u to seal® th erm al

2 0 1 6 L au n ch es: C o m m ercial Mix & m atch refu se D esig n er series refu se C h in a p ilo t S lim jim ® step o n C o lo r co d ed fo o d serv ice

2 0 1 6 L au n ch es: T o o ls D y m o X T L ™ V IS E -G R IP ® Mu lti-P liers S crew d riv ers P o w er B last T ech n o lo g y ™ A b rasiv es

2 0 1 6 L au n ch es: B ab y E x ten d ed leg ro o m G raco Mo d es d u o ™ B ab y jo g g er® city to u r B ab y jo g g er® city m in i trav el sy stem S o o th e su rro u n d ™ p lay ard s an d sw in g s

A d v ertisin g in v estm en t in creased 3 .4 x A d v ertisin g D o llars

A d v ertisin g in v estm en t m o re efficien t N O N -WO R K IN G WO R K IN G N o n -w o rk in g sp en d d o w n N u m b er o f 1 5 seco n d T R P s

A d v ertisin g v eh icles b ro ad en ed

Win n in g w ith w in n in g retailers A cq u isitio n s in clu d ed L ead cu sto m er categ o ry g ro w th 2 0 1 1 -1 5 D o llar/C lu b ch an n el d ev elo p m en t $ 1 1 3 m o f g ro w th $ 1 5 7 m o f g ro w th

E -co m m erce P O S $ acceleratin g P O S T ren d 5 9 % C A G R

S h arp ch o ices stren g th en in g p erfo rm an ce M& A lev erag e P ro fit in terv en tio n s N etw o rk o p tim izatio n L ab o r p ro d u ctiv ity P o rtfo lio ch o ices

Win B ig g er p erfo rm an ce acceleratin g * A m o u n ts calcu lated at av erag e 2 0 1 4 ex ch an g e rates. + 6 % C A G R + 7 8 % > 5 0 % R ev en u e + 9 .4 % C o re G ro w th 2 0 1 5

P ro fit in terv en tio n s fix p eren n ial p ro b lem s B ab y n o rm alized O I* reco v ery (N A an d Jap an ex clu d in g B ab y Jo g g er) E ME A n o rm alized O I* tran sfo rm atio n 8 .7 % C A G R 9 .8 % C A G R * A m o u n ts calcu lated at av erag e 2 0 1 4 ex ch an g e rates.

2 8 P ro ject R en ew al o p tim izin g n etw o rk $ 0 .7 5 n o rm alized E P S to g o ~ 1 2 % o f sales in an n u alized sav in g s N o te: $ 0 .7 5 n o rm alized E P S to g o calcu lated b ased o n $ 3 1 5 m an n u alized P ro ject R en ew al sav in g s to b e realized in 2 0 1 6 , 2 0 1 7 , 2 0 1 8 .

T ran sfo rm atio n o ffice D iscip lin ed p ro g ram m an ag em en t, reso u rced fo r sp eed $ 3 6 0 M sav in g s to d ate, an o th er $ 3 1 5 m to targ et in stru ctu ral co st sav in g s (su p p ly ch ain an d o v erh ead s) T arg etin g in efficien t stru ctu ral co sts in m an u factu rin g , D & T , n o n -w o rk in g o v erh ead T o p 5 (o f 1 3 ) w o rk stream s co m p rise 7 5 % o f sav in g s S ig n ifican t co m p lex ity red u ctio n 3 4 % red u ctio n in S K U s g lo b ally in 2 0 1 6 5 7 % red u ctio n in cu sto m ers in N A in 2 0 1 6 (m ig ratio n to d istrib u to rs) 4 5 % red u ctio n in co st cen ters ex ecu ted in 2 0 1 6 C o m m ercial tran sfo rm atio n th at is d riv in g g ro w th Jo in t p lan n in g / ch eck b o o k s, n ew p ricin g / trad e m an ag em en t p ro g ram w ith n ew so ftw are an d to o ls

Y ield in g in creased p ro d u ctiv ity S ales p er em p lo y ee ($ k ) V P + ex clu d in g M& A V P + en d 2 0 1 5 E x istin g N WL 5 2 % E x tern al 2 8 % P ro m o tio n 2 0 %
O rg an ic ag en d a co m p lem en ted b y M& A + 3 4 % A d ju sted E B IT D A + 2 7 % S ales

C o n tin u e to stren g th en p lay b o o k

Wh ile creatin g co m p etitiv e lev els o f v alu e N WL S & P 5 0 0 D O W JO N E S S to ck p rice ev o lu tio n A n n u alized d iv id en d 2 0 c to 7 6 c p er sh are N o rm alized E P S + 4 2 % in 4 y ears $ 1 .2 b n o f sh ares rep u rch ased 2 0 c an n u alized d iv id en d Jan u ary 2 0 1 1

B rin g in g N WL an d Jard en to g eth er

N o te: B ran d s sh o w n h av e lead in g m ark et sh are p o sitio n s in th eir resp ectiv e categ o ries. L ead in g b ran d ed co n su m er g o o d s co m p an y

S tro n g v alu e creatio n track reco rd s JA H N WL S & P 5 0 0 D O W JO N E S S to ck p rice ev o lu tio n

S tro n g p erfo rm an ce track reco rd s C o re sales g ro w th N o rm alized E P S O rg an ic sales g ro w th N o rm alized E P S N o te: P lease see Jard en p ress releases d ated 2 /1 5 /1 2 , 2 /1 4 /1 3 , 2 /1 3 /1 4 an d 2 /1 2 /1 5 fo r reco n ciliatio n s

C o m b in atio n stren g th s C reates $ 1 6 b illio n co m p an y w ith 2 0 % + E B IT D A m arg in s p o st sy n erg ies Mo re th an d o u b les scale in cu sto m ers, ch an n els, g eo g rap h ies, su p p liers E n ab les in creased access to n ew ch an n els an d accelerated in tern atio n al d ep lo y m en t A t least $ 5 0 0 m illio n in co st sy n erg ies . . . in crem en tal to P ro ject R en ew al G reater th an $ 8 0 0 m illio n w h en co m b in ed w ith P ro ject R en ew al 2 0 1 6 to 2 0 1 8 S tro n g cash flo w en ab les rap id d elev erag in g to 3 .0 to 3 .5 x lev erag e ratio targ et C o m m itm en t to in v estm en t g rad e cred it p ro file d riv es in itial cap ital allo catio n ch o ices O n ce lev erag e ratio targ ets ach iev ed , o p p o rtu n ity to stren g th en p o rtfo lio an d p u rsu e o th er v alu e creatio n o p tio n s T w o p ro v en m an ag em en t team s . . . b est o f b o th ap p ro ach to talen t an d cap ab ilities

H ig h ly co n cen trated fo o tp rin t 8 0 % + o f rev en u e in 3 0 b ran d s 8 0 % + o f rev en u e in 9 co u n tries 6 0 % + o f rev en u e in 9 ch an n els # 1 # 1

L O W C O S T N WL U S sh are o f v o ice H P C lead er sh are o f v o ice # 1 H P C 2 8 % N WL U S 6 0 % R E S P O N S IV E In n o v atio n v itality targ et In n o v atio n v itality targ et F MC G 3 0 % N WL U S 3 0 % o v er $ 3 5 b n N WL U S m ark et size L A R G E L E S S C O N S O L ID A T E D F MC G to p 3 categ o ry sh are N WL U S to p 3 categ o ry sh are F MC G 7 5 % + N WL U S 4 8 % O p p o rtu n ity to ap p ly N ew ell b u sin ess m o d el

A cro ss th e b ro ad er co m b in ed p o rtfo lio U S m ark et frag m en tatio n (sh are o f to p 3 p lay ers) U S m ark et size ($ b n ) 2 .5 % m ark et g ro w th 3 .0 % m ark et g ro w th

L ev erag in g lead in g b ran d s B ab y Writin g B ran d ed C o n su m ab les C o n su m er S o lu tio n s O u td o o r S o lu tio n s F o o d & B ev erag e

With scaled p o sitio n s in k ey g eo g rap h ies C o n su m p tio n ($ b n ) N WL S ales JA H S ales 2 .4 x 3 .4 x 2 .3 x Mu ltip le 2 .2 x F Y 1 5 sales F Y 1 5 estim ated sales Wo rld b an k

In tu itiv e categ o ry an d b ran d co m b in atio n s

Mean in g fu l b u t p ru d en t sy n erg ies * D ata fro m a lead in g g lo b al m an ag em en t co n su ltin g firm T o tal co st sy n erg ies as a p ercen t o f targ et rev en u e C lairo l/P & G S S L / R eck itt B en ck iser U S A D eterg en ts/C h u rch & D w ig h t G iv au d an /Q u est In t’l G illette/P & G P lay tex / E n erg izer A lb erto -C u lv er/U n ilev er O ran g e G lo / C h u rch & D w ig h t S C A / G eo rg ia P acific Wella/P & G May tag /Wh irlp o o l R alco rp /C o n A g ra S im p le/A lb erto -C u lv er Jard en /N ew ell R ev lo n /C o lo m er ~ 1 2 % N ew ell R u b b erm aid sales $ 6 7 5 m P ro ject R en ew al A n n u alized sav in g s
S y n erg y ro ad m ap C o rp o rate d u p licatio n E x ecu tiv e lead ers P ro cu rem en t C o st to serv e $ 5 0 0 m o f sy n erg ies S h ared serv ices S u p p ly C h ain C o m p lex ity O p eratin g Mo d el T ax Wo rk in g C ap ital In crem en tal sy n erg ies R ev en u e S y n erg ies S h ared S erv ices S u p p ly C h ain C o m p lex ity

C o m b in atio n fin an cials

A ssu m p tio n s co n serv ativ e N ew ell R u b b erm aid co re g ro w th at m id -p o in t o f 4 to 5 % g u id an ce ran g e Jard en o rg an ic g ro w th at lo w en d o f 3 to 5 % g u id an ce ran g e d esp ite co n sisten t d eliv ery at h ig h er en d o f th e ran g e $ 5 0 0 m illio n sy n erg ies o v er 4 y ears; n o rev en u e sy n erg ies B len d ed cu rren t p lan s fo r w o rk in g cap ital, cap ital ex p en d itu re, an d tax rates C u rren t N ew ell R u b b erm aid d iv id en d o f 7 6 cen ts p er sh are in 2 0 1 6

F in an cin g co n sid eratio n s/m ilesto n es $ 9 b n b rid g e facility an d $ 1 .5 b n th ree y ear term lo an in p lace R ev o lv in g cred it ag reem en t in creased to $ 1 .2 5 b n fro m $ 8 0 0 m E x p ect to ro llo v er ap p ro x im ately $ 6 3 0 m an d refin an ce $ 4 .5 b n o f ex istin g Jard en d eb t E x p ect to in cu r ad d itio n al ~ $ 8 .7 b n p erm an en t d eb t fin an cin g in lieu o f b rid g e facility E x p ect b len d ed in terest rate ~ 4 .5 % o n p erm an en t d eb t fin an cin g

E x p ect stro n g accretio n an d rap id d elev erag in g Y ear 1 H ig h sin g le d ig it Y ear 2 Mid to h ig h teen s Y ear 3 S tro n g d o u b le d ig it A ccretio n D elev erag in g $ 1 .5 b n 3 y ear term lo an ex p ected to b e p aid d o w n $ 0 .9 b n ex istin g m atu rities in first th ree y ears av ailab le to b e p aid d o w n

C ap ital flex ib ility an d cu sh io n to ach iev e g o als N WL 2 0 1 6 to 2 0 1 8 C ap ital A llo catio n P rio rities N o m aterial sh are rep u rch ase o r acq u isitio n s u n til lev erag e ratio ran g e ach iev ed 2 0 1 6 /1 7 free cash to fu n d p lan n ed d eb t red u ctio n , leav in g sig n ifican t u n allo cated cash o v er p erio d A ch iev e targ et lev erag e ratio o f 3 .0 to 3 .5 x w ith in 2 to 3 y ears O p p o rtu n ity fo r in crem en tal sy n erg ies (n et o f co sts) an d w o rk in g cap ital b en efits fu rth er stren g th en u n allo cated cash p o sitio n S o u rce: N ew ell B ran d s F in an cial Mo d el 2 0 1 6 th ro u g h 2 0 1 8 an d A m en d ed S -4 filin g ; m o d el assu m es d iv id en d in crease in 2 0 1 7 an d 2 0 1 8 ; 3 .0 X - 3 .5 X w ith in tw o to th ree y ears C u m u lativ e O p eratin g cash flo w ~ $ 5 .5 to $ 6 .0 b n C ap ex ~ $ 1 .2 to $ 1 .3 b n D iv id en d s ~ $ 1 .1 to $ 1 .2 b n U n allo cated cash D eb t rep ay m en t

E x p ect to clo se tran sactio n in Q 2 N o te: B ran d s sh o w n h av e lead in g m ark et sh are p o sitio n s in th eir resp ectiv e categ o ries.

C o n su m er A n aly st G ro u p o f N ew Y o rk Mich ael B . P o lk , P resid en t & C h ief E x ecu tiv e O fficer 1 9 F eb ru ary , 2 0 1 6

C o re S ales R eco n ciliatio n N ew ell R u b b erm aid N o n -G A A P R eco n ciliatio n C o n so lid ated C o re S ales Y ears E n d ed D ecem b er 3 1 , 2 0 1 5 , 2 0 1 4 , 2 0 1 3 , 2 0 1 2 an d 2 0 1 1 ($ am o u n ts in m illio n s) A s R ep o rted C o re S ales (1 ) Y ear-o v er-y ear In crease (D ecrease) C u rren t Y ear P rio r Y ear In crease C u rren t Y ear P rio r Y ear In crease A cq u isitio n s (2 ) 2 0 1 5 C o m p leted & P lan n ed D iv estitu res (3 ) 2 0 1 4 C o m p leted & P lan n ed D iv estitu res (3 ) In cr. E x cl. A cq u isitio n s an d D iv estitu res C u rren cy Im p act E x clu d in g C u rren cy In clu d in g C u rren cy C u rren cy Im p act A cq u isitio n s P lan n ed D iv estitu res C o re S ales G ro w th (1 ) 2 0 1 5 S ales $ 5 ,9 1 5 .7 $ 5 ,7 2 7 .0 $ 1 8 8 .7 $ 6 ,2 5 5 .8 $ 5 ,7 3 6 .1 $ 5 1 9 .7 $ 2 7 2 .1 $ 1 7 8 .1 $ 2 3 3 .1 $ 3 0 2 .6 $ (3 3 1 .0 ) 9 .1 % 3 .3 % -5 .8 % 4 .7 % -1 .1 % 5 .5 % 2 0 1 5 Win B ig g er S ales (4 ) $ 3 ,4 2 2 .1 $ 3 ,1 9 3 .6 $ 2 2 8 .5 $ 3 ,6 5 4 .8 $ 3 ,1 9 8 .8 $ 4 5 6 .0 $ 1 5 6 .3 $ - $ - $ 2 9 9 .7 $ (2 2 7 .5 ) 1 4 .3 % 7 .2 % -7 .1 % 4 .9 % 0 .1 % 9 .4 % 2 0 1 4 S ales (5 ) $ 5 ,7 2 7 .0 $ 5 ,6 0 7 .0 $ 1 2 0 .0 $ 5 ,8 4 8 .5 $ 5 ,6 1 3 .2 $ 2 3 5 .3 $ 6 8 .9 $ - $ - $ 1 6 6 .4 $ (1 1 5 .3 ) 4 .2 % 2 .1 % -2 .1 % 1 .2 % 0 .0 % 3 .0 % 2 0 1 3 S ales $ 5 ,6 0 7 .0 $ 5 ,5 0 8 .5 $ 9 8 .5 $ 5 ,6 7 7 .5 $ 5 ,5 1 2 .6 $ 1 6 4 .9 $ - $ - $ - $ 1 6 4 .9 $ (6 6 .4 ) 3 .0 % 1 .8 % -1 .2 % 0 .0 % 0 .0 % 3 .0 % 2 0 1 2 S ales $ 5 ,5 0 8 .5 $ 5 ,4 5 1 .5 $ 5 7 .0 $ 5 ,5 9 8 .5 $ 5 ,4 5 0 .6 $ 1 4 7 .9 $ - $ - $ - $ 1 4 7 .9 $ (9 0 .9 ) 2 .7 % 1 .0 % -1 .7 % 0 .0 % 0 .0 % 2 .7 % 2 0 1 1 S ales $ 5 ,4 5 1 .5 $ 5 ,2 2 4 .0 $ 2 2 7 .5 $ 5 ,3 4 9 .5 $ 5 ,2 2 4 .0 $ 1 2 5 .5 $ - $ - $ - $ 1 2 5 .5 $ 1 0 2 .0 2 .4 % 4 .4 % 2 .0 % 0 .0 % 0 .0 % 2 .4 % (1 ) "C o re S ales" is d eterm in ed b y ap p ly in g a fix ed ex ch an g e rate, calcu lated as th e 1 2 -m o n th av erag e o f th e resp ectiv e p rio r y ear, to th e cu rren t an d p rio r y ear lo cal cu rren cy sales am o u n ts, w ith th e d ifferen ce b etw een th e ch an g e in "A s R ep o rted " sales an d th e ch an g e in "C o re S ales" rep o rted in th e tab le as "C u rren cy Im p act". C o re S ales G ro w th ex clu d es th e im p act o f cu rren cy , acq u isitio n s an d p lan n ed an d actu al d iv estitu res fro m th e p erio d th e in ten t to d iv est is d eterm in ed th ro u g h th e d ate o f sale. (2 ) A cq u isitio n s reflects ap p ro x im ately o n e y ear o f sales after th e acq u isitio n d ates o f th e fo llo w in g co m p an ies at co n stan t cu rren cy rates:E lm er's P ro d u cts in O cto b er 2 0 1 5 B ab y Jo g g er H o ld in g s in D ecem b er 2 0 1 4 T h e assets o f b u b b a b ran d s in O cto b er 2 0 1 4 Ig n ite H o ld in g s in S ep tem b er 2 0 1 4 (3 ) A ctu al an d p lan n ed d iv estitu res rep resen t th e R u b b erm aid m ed ical cart b u sin ess o n a y ear-to -d ate b asis (su ch b u sin ess w as so ld in A u g u st 2 0 1 5 ) an d L ev o lo r an d K irsch w in d o w co v erin g s b ran d s ("D éco r") fo r th e th ird q u arter an d fo u rth q u arter w h ich th e C o m p an y is p lan n ed to sell. (4 ) Win B ig g er b u sin esses in clu d e Writin g & C reativ e E x p ressio n , w h ich is in clu d ed in th e Writin g seg m en t, T o o ls, C o m m ercial P ro d u cts (ex clu d in g Med ical) an d F o o d & B ev erag e, w h ich is in clu d ed in th e H o m e S o lu tio n s seg m en t. (5 ) A s ad ju sted fo r th e estim ated im p acts o f E ME A p ro d u ct an d g eo g rap h ic ex its an d R u b b erm aid C o n su m er S to re p ro d u ct ex its, w h ich to taled $ 3 7 M, th e in crease ex clu d in g acq u isitio n s an d d iv estitu res fo r 2 0 1 4 w as $ 2 0 3 .4 M, o r 3 .6 % .

N o rm alized E P S R eco n ciliatio n N ew ell R u b b erm aid N o n -G A A P R eco n ciliatio n N o rm alized E P S Y ears E n d ed D ecem b er 3 1 , 2 0 1 5 , 2 0 1 4 , 2 0 1 3 , 2 0 1 2 an d 2 0 1 1 2 0 1 5 2 0 1 4 2 0 1 3 2 0 1 2 2 0 1 1 D ilu ted E P S , as rep o rted $ 1 .2 9 $ 1 .3 5 $ 1 .6 3 $ 1 .3 7 $ 0 .4 2 R estru ctu rin g & restru ctu rin g -related co sts 0 .4 1 0 .2 5 0 .3 9 0 .2 3 0 .2 3 P ro d u ct recall co sts 0 .0 3 0 .0 3 - - - V en ezu ela d ev alu atio n 0 .0 2 0 .1 1 0 .0 2 - - V en ezu ela in v en to ry ch arg es 0 .0 1 0 .0 2 - - - A d v iso ry co sts - 0 .0 2 - - - A cq u isitio n & in teg ratio n co sts 0 .0 5 0 .0 1 - - - P en sio n settlem en t ch arg e 0 .1 2 0 .1 5 - - - L o sses o n ex tin g u ish m en t o f d eb t - 0 .0 8 - 0 .0 2 0 .0 1 Im p airm en t ch arg es - - - - 0 .8 3 C E O tran sitio n co sts - - - - 0 .0 2 N o n recu rrin g tax item s (0 .0 2 ) (0 .0 1 ) (0 .0 3 ) 0 .0 8 (0 .1 7 ) V en ezu ela d eco n so lid atio n ch arg e 0 .6 1 - - - - D isco n tin u ed o p eratio n s (0 .3 3 ) (0 .0 2 ) (0 .2 0 ) (0 .0 4 ) 0 .2 0 N o rm alized E P S * $ 2 .1 8 $ 2 .0 0 $ 1 .8 2 $ 1 .6 7 $ 1 .5 4 * T o tals m ay n o t ad d d u e to ro u n d in g .

A & P In crease R eco n ciliatio n A ctu al E stim ated (in m illio n s) 2 0 1 2 2 0 1 6 A d v ertisin g $ 5 3 .7 $ 1 8 4 .7 P ro m o tio n 8 7 .1 1 0 1 .0 T o tal, as rep o rted /estim ated $ 1 4 0 .8 $ 2 8 5 .7 A d v ertisin g in crease m u ltip le 3 .4

Win B ig g er C o re S ales R eco n ciliatio n N ew ell R u b b erm aid N o n -G A A P R eco n ciliatio n Win B ig g er C o re S ales Y ears E n d ed D ecem b er 3 1 , 2 0 1 1 an d 2 0 1 5 ($ am o u n ts in m illio n s) A s R ep o rted C o re S ales (1 ) Y ear-o v er-y ear In crease (D ecrease) 2 0 1 5 2 0 1 1 In crease C u rren t Y ear P rio r Y ear In crease A cq u isitio n s In cr. E x cl. A cq u isitio n s C u rren cy Im p act E x clu d in g C u rren cy In clu d in g C u rren cy C u rren cy Im p act A cq u isitio n s C o re S ales G ro w th (1 ) C A G R (2 ) Win B ig g er N et S ales (3 ) $ 3 ,4 2 2 .1 $ 2 ,8 2 3 .3 $ 5 9 8 .8 $ 3 ,6 5 4 .8 $ 2 ,7 5 0 .0 $ 9 0 4 .8 $ 2 3 2 .1 $ 6 7 2 .7 $ (3 0 6 .0 ) 3 2 .9 % 2 1 .2 % -1 1 .7 % 8 .4 % 2 4 .5 % 6 % (1 ) "C o re S ales" is d eterm in ed b y ap p ly in g a fix ed ex ch an g e rate, calcu lated as th e 1 2 -m o n th av erag e o f th e 2 0 1 4 m o n th ly ex ch an g e rates, to th e 2 0 1 5 an d 2 0 1 1 lo cal cu rren cy sales am o u n ts, w ith th e d ifferen ce b etw een th e ch an g e in "A s R ep o rted " sales an d th e ch an g e in "C o re S ales" rep o rted in th e tab le as "C u rren cy Im p act". C o re S ales G ro w th ex clu d es th e im p act o f cu rren cy , acq u isitio n s an d p lan n ed an d actu al d iv estitu res fro m th e p erio d th e in ten t to d iv est is d eterm in ed th ro u g h th e d ate o f sale. (2 ) C A G R is co m p o u n d an n u al g ro w th rate o v er th e 4 -y ear p erio d fro m 2 0 1 1 to 2 0 1 5 . (3 ) Win B ig g er b u sin esses in clu d e Writin g & C reativ e E x p ressio n , w h ich is in clu d ed in th e Writin g seg m en t, T o o ls, C o m m ercial P ro d u cts (ex clu d in g Med ical) an d F o o d & B ev erag e, w h ich is in clu d ed in th e H o m e S o lu tio n s seg m en t.

Win B ig g er A & P R eco n ciliatio n N ew ell R u b b erm aid N o n -G A A P R eco n ciliatio n Win B ig g er A d v ertisin g Y ears E n d ed D ecem b er 3 1 , 2 0 1 1 an d 2 0 1 5 ($ am o u n ts in m illio n s) 2 0 1 1 A d v ertisin g & P ro m o tio n 2 0 1 1 O th er item s (1 ) 2 0 1 1 A d v ertisin g & P ro m o tio n -F u n ctio n B ased C u rren cy Im p act (2 ) 2 0 1 1 at 2 0 1 4 A v erag e R ates Win B ig g er B u sin esses (3 ) 8 1 .5 2 5 .0 1 0 6 .5 3 .6 1 0 2 .9 O th er b u sin esses 6 9 .7 1 5 .7 8 5 .4 T o tal, A s R ep o rted 1 5 1 .2 4 0 .7 1 9 1 .9 3 .4 1 8 8 .5 2 0 1 5 A d v ertisin g & P ro m o tio n 2 0 1 5 O th er item s (1 ) 2 0 1 5 A d v ertisin g & P ro m o tio n -F u n ctio n B ased C u rren cy Im p act (2 ) 2 0 1 5 at 2 0 1 4 A v erag e R ates Win B ig g er B u sin esses (3 ) 1 3 3 .6 3 8 .7 1 7 2 .3 (1 1 .3 ) 1 8 3 .6 O th er b u sin esses 8 0 .3 3 6 .3 1 1 6 .6 T o tal, A s R ep o rted 2 1 3 .9 7 5 .0 2 8 8 .9 (1 6 .2 ) 3 0 5 .1 % C h an g e T o tal, A s R ep o rted 4 1 .5 % Win B ig g er, A d v ertisin g & P ro m o tio n , F u n ctio n -B ased at 2 0 1 4 A v erag e R ates 7 8 .4 % (1 ) O th er item s p rim arily in clu d es co sts o f d isp lay s an d ad v iso ry co sts. (2 ) C u rren cy im p act calcu lated b ased o n av erag e 2 0 1 4 ex ch an g e rates. (3 ) Win B ig g er b u sin esses in clu d e Writin g & C reativ e E x p ressio n , w h ich is in clu d ed in th e Writin g seg m en t, T o o ls, C o m m ercial P ro d u cts (ex clu d in g Med ical) an d F o o d & B ev erag e, w h ich is in clu d ed in th e H o m e S o lu tio n s seg m en t.

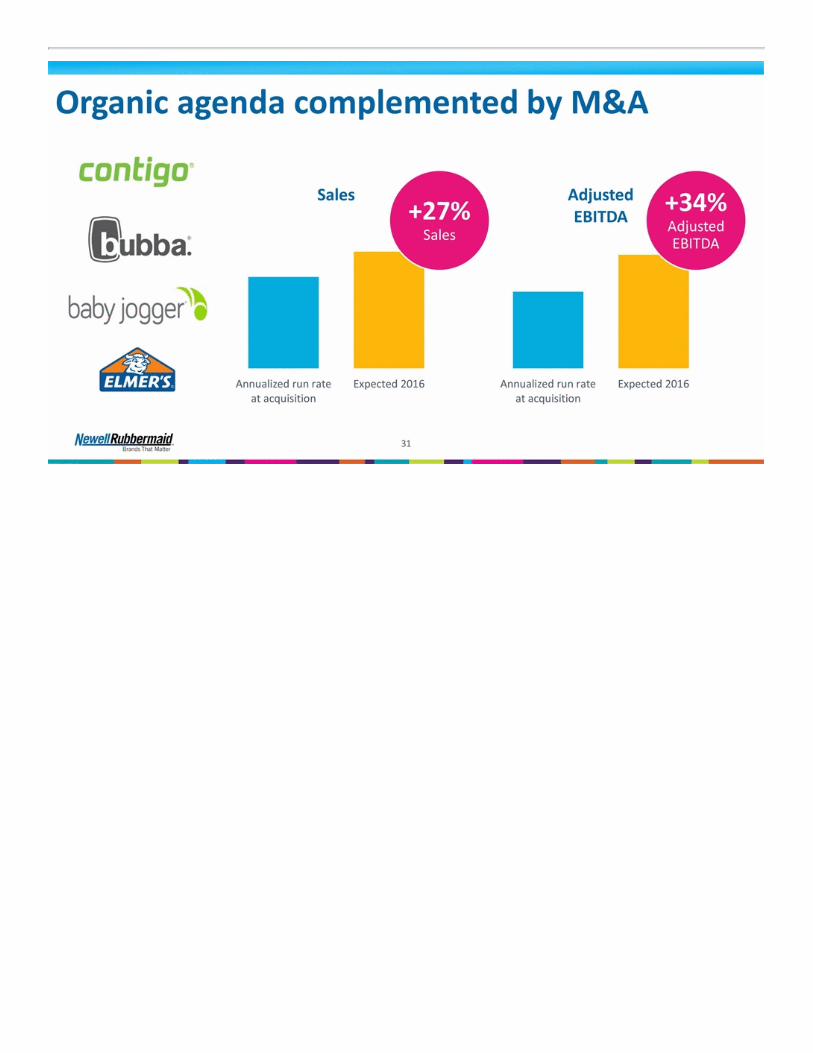
A cq u isitio n A d ju sted E B IT D A R eco n ciliatio n N ew ell R u b b erm aid N o n -G A A P R eco n ciliatio n 2 0 1 6 E B IT D A fo r A cq u isitio n s Y ear E n d in g D ecem b er 3 1 , 2 0 1 6 ($ am o u n ts in m illio n s) 2 0 1 6 E stim ated E stim ated O p eratin g In co m e D ep reciatio n & A m o rtizatio n R estru ctu rin g (2 ) A d ju sted E B IT D A T o tal N ew ell R u b b erm aid ex clu d in g 2 0 1 4 an d 2 0 1 5 acq u isitio n s $ 6 9 8 .0 $ 1 1 7 .1 $ 1 5 0 .0 $ 9 6 5 .1 2 0 1 4 an d 2 0 1 5 acq u isitio n s (1 ) 9 4 .8 3 4 .6 1 0 .0 1 3 9 .4 T o tal N ew ell R u b b erm aid $ 7 9 2 .8 $ 1 5 1 .7 $ 1 6 0 .0 $ 1 ,1 0 4 .5 A n n u alized R u n R ate at A cq u isitio n (3 ) O p eratin g In co m e D ep reciatio n & A m o rtizatio n R estru ctu rin g A d ju sted E B IT D A 2 0 1 4 an d 2 0 1 5 acq u isitio n s (1 ) $ 6 9 .4 $ 3 4 .6 $ - $ 1 0 4 .0 % In crease 3 4 .0 % (1 ) 2 0 1 4 an d 2 0 1 5 acq u isitio n s in clu d e Ig n ite H o ld in g , L L C , th e assets o f b u b b a b ran d s, B ab y Jo g g er H o ld in g s an d E lm er's P ro d u cts, w h ich o ccu rred in S ep tem b er 2 0 1 4 , O cto b er 2 0 1 4 , D ecem b er 2 0 1 4 an d O cto b er 2 0 1 5 , resp ectiv ely . (2 ) $ 1 5 0 .0 m illio n rep resen ts th e m id p o in t o f th e ran g e o f P ro ject R en ew al restru ctu rin g an d o th er P ro ject R en ew al tran sfo rm atio n co sts p rev io u sly d isclo sed in th e C o m p an y 's y ear-en d 2 0 1 5 p ress release in Jan u ary 2 0 1 6 . (3 ) A n n u alized ru n rate at acq u isitio n rep resen ts th e ap p ro x im ate trailin g tw elv e m o n th s' resu lts at th e resp ectiv e d ates o f acq u isitio n .

B ab y N o rm alized O I R eco n ciliatio n N ew ell R u b b erm aid N o n -G A A P R eco n ciliatio n B ab y & P aren tin g S eg m en t N o rm alized O p eratin g In co m e Y ears E n d in g D ecem b er 3 1 , 2 0 1 1 an d 2 0 1 6 ($ am o u n ts in m illio n s) O p eratin g In co m e (1 ) O p eratin g In co m e (1 ) C o n stan t C o n stan t A s R ep o rted C u rren cy C u rren cy E stim ated C u rren cy C u rren cy 2 0 1 1 Im p act 2 0 1 1 (2 ) 2 0 1 6 Im p act 2 0 1 6 (2 ) % C A G R N o rth A m erica & Jap an $ 5 0 .6 $ 1 .8 $ 4 8 .8 $ 7 1 .2 $ (2 .8 ) $ 7 4 .0 8 .7 % O th er reg io n s & B ab y Jo g g er (3 ) 1 .0 (0 .3 ) 1 .3 1 7 .3 (2 .2 ) 1 9 .5 B ab y & P aren tin g o p eratin g in co m e, as rep o rted $ 5 1 .6 $ 1 .5 $ 5 0 .1 $ 8 8 .5 $ (5 .0 ) $ 9 3 .5 (1 ) O p eratin g in co m e ex clu d es restru ctu rin g an d im p airm en t ch arg es w h ich are d isclo sed sep arately b y seg m en t in th e C o m p an y 's fin an cial statem en ts. (2 ) C o n stan t cu rren cy am o u n ts rep resen t am o u n ts at 2 0 1 4 av erag e an n u al ex ch an g e rates, an d th e cu rren cy im p act am o u n ts rep resen t th e d ifferen ce b etw een am o u n ts at actu al (o r estim ated rates in th e case o f 2 0 1 6 ) ex ch an g e rates an d am o u n ts at th e 2 0 1 4 av erag e an n u al ex ch an g e rates. (3 ) In clu d es im p acts o f B ab y & P aren tin g E ME A g eo g rap h ic ex its d u rin g 2 0 1 3 an d 2 0 1 4 . A lso in clu d es estim ated resu lts o f B ab y Jo g g er in 2 0 1 6 , w h ich th e C o m p an y acq u ired in D ecem b er 2 0 1 4 .

E ME A N o rm alized O I R eco n ciliatio n N ew ell R u b b erm aid N o n -G A A P R eco n ciliatio n E ME A N o rm alized O p eratin g In co m e Y ears E n d in g D ecem b er 3 1 , 2 0 1 1 an d 2 0 1 6 ($ am o u n ts in m illio n s) O p eratin g In co m e (1 ) O p eratin g In co m e (2 ) R estru ctu rin g , N o rm alized C o n stan t C o n stan t A s R ep o rted Im p airm en t & O I C u rren cy C u rren cy E stim ated C u rren cy C u rren cy 2 0 1 1 O th er C o sts 2 0 1 1 Im p act 2 0 1 1 (2 ) 2 0 1 6 Im p act 2 0 1 6 (2 ) % C A G R E ME A $ 1 7 .5 $ 6 6 .1 8 3 .6 $ 6 .9 $ 7 6 .7 $ 8 9 .3 $ (3 3 .3 ) $ 1 2 2 .6 9 .8 % (1 ) O p eratin g in co m e ex clu d es restru ctu rin g an d im p airm en t ch arg es w h ich are d isclo sed sep arately b y seg m en t in th e C o m p an y 's fin an cial statem en ts. O p eratin g in co m e also ex clu d es $ 3 7 .4 m illio n o f restru ctu rin g -related ch arg es asso ciated w ith th e E u ro p ean T ran sfo rm atio n P lan . (2 ) O p eratin g in co m e ex clu d es restru ctu rin g an d o th er ch arg es fo r 2 0 1 6 , w h ich are n o t cu rren tly estim ab le b y reg io n . T h e C o m p an y estim ates th at to tal P ro ject R en ew al an d related co sts w ill ap p ro x im ate $ 1 4 0 m illio n to $ 1 6 0 m illio n fo r th e to tal C o m p an y in 2 0 1 6 , as d isclo sed in its y ear-en d 2 0 1 5 p ress release in Jan u ary 2 0 1 6 . (3 ) C o n stan t cu rren cy am o u n ts rep resen t am o u n ts at 2 0 1 4 av erag e an n u al ex ch an g e rates, an d th e cu rren cy im p act am o u n ts rep resen t th e d ifferen ce b etw een am o u n ts at actu al (o r estim ated rates in th e case o f 2 0 1 6 ) ex ch an g e rates an d am o u n ts at th e 2 0 1 4 av erag e an n u al ex ch an g e rates.

S ales P er E m p lo y ee R eco n ciliatio n N ew ell R u b b erm aid N o n -G A A P R eco n ciliatio n S ales p er E m p lo y ee Y ears E n d ed D ecem b er 3 1 , 2 0 1 1 an d 2 0 1 5 (S ales am o u n ts in m illio n s) 2 0 1 1 2 0 1 5 S ales - C o n tin u in g o p eratio n s $ 5 ,4 5 1 .5 $ 5 ,9 1 5 .7 S ales - D isco n tin u ed o p eratio n s 4 7 1 .9 5 6 .5 T o tal sales $ 5 ,9 2 3 .4 $ 5 ,9 7 2 .2 E m p lo y ees at en d o f y ear 1 9 ,9 0 0 1 7 ,4 0 0 S ales p er em p lo y ee $ 2 9 7 ,6 5 8 $ 3 4 3 ,2 3 0

1
THOMSON REUTERS STREETEVENTS | www.streetevents.com | Contact Us © 2016 Thomson Reuters. All rights reserved. Republication or redistribution of Thomson Reuters content,including by framing or similar means, is prohibited without the prior written consent of Thomson Reuters.‘Thomson Reuters’ and the Thomson Reuters logo are registered trademarks of Thomson Reuters and its affiliatedcompanies.

FEBRUARY 19, 2016 / 12:00PM GMT, NWL - Newell Rubbermaid Inc at Consumer Analyst Group of New York Conference CORPORATE PARTICIPANTS
Mike Polk Newell Rubbermaid Inc. - President & CEO
PRESENTATION Unidentified Participant
Welcome back to the last day of the CAGNY conference. First, before we get started, I want to think Mike Polk and Newell Rubbermaid for their generoussponsorship of yesterday’s lunch. Mike has now been at Newell for almost five years as CEO and during that time, his team has really transformed NewellRubbermaid into an integrated company from a holding company. They are now posting upper tier organic sales growth versus the rest of the CPG group,which has been fueled by investment behind marketing and R&D, as well as peer-leading EPS growth fueled by productivity.
In December, they announced the merger with Jarden, which would transform the Company again, more than doubling its size. So this is a great time to haveMike here and I will turn things over to you, Mike. Mike Polk - Newell Rubbermaid Inc. - President & CEO
Glad to be here with you. Is everybody awake? I’ve got my double espresso up here, so you can count on me being alive and ready to go with you. I’ve got anhour to spend with you and I want to try to cover a couple things. One, I want to set up the progress that Newell Rubbermaid has made and give you thestrategic rationale for the deal that we’ve announced in December. So I will explain to you how the choices we’ve made in Newell have changed thetrajectory in that business and give you the sense that — I hope — give you the sense that those choices extended and transposed across a broader set ofcategories can unlock similar value. And then I will talk to you a little bit at the end around milestones with respect to the deal, the financials and give you asense of what comes next.
So unlike any presentation I’ve done before, I actually have two forward-looking disclosure statements. This is sort of representative of the kind ofinvolvement the legal community is giving me these days with respect to the work we’re doing. So I share that with you, not for any other purpose other thanto share some pain with you about that whole process. I will be governed in some ways with respect to what I can share with you at this point in the process,but I will try to go as far as I can without crossing any lines.
So let’s talk about Newell Rubbermaid. What has happened at Newell? We have the good fortune — I’ve had the good fortune since 2011 of having theopportunity to work with a great portfolio of brands, perhaps a group of businesses and brands that were a little bit malnourished at the beginning of mytimeframe in the role, but a terrific portfolio of brands. Number one in their positions, competing in large categories that are growing that theoretically areresponsive to activity and categories with low cost of growth.
So a very interesting group of businesses with lots of opportunity to connect into them, in some ways trapped within an infrastructure at the old NewellRubbermaid that limited the potential for those brands to grow in part because of how we were organized in the high cost structure that the businesses wereburdened with; in part because of the low level of brand investment; in part because of an approach to allocating resources that was very democratic. Soadvertising, promotion, people costs were allocated basically in line with revenue, the business model and the organization design against each one of thesebusinesses was the same.
Because we were organized as a holding company, our resources were disaggregated to a single point accountability general management model that wasorganized around revenue streams of $200 million to $300 million to $400 million, effectively deleveraging both the scale of the Company, but also thecapabilities that we had as a company. So in the old model within Newell, marketing was subjugated to the P&L owner; insights were subjugated to themarketing leader; R&D, all the functions were subjugated to a P&L owner at a revenue scale of $200 million to $500 million.
And so the Company — while the brands had tremendous potential, they were competing in very good categories with all kinds of upside opportunityconnected to them. The Company was constrained from unlocking its trapped capacity for growth, in part driven by the way we were organized, the way wewere designed.
In 2012, here at CAGNY, we articulated the roadmap forward and we launched what we called the Growth Game Plan. The Growth Game Plan was simply astrategy document on a page. It spoke to two basic sets of choices. One, focused on portfolio, we call those the Where to play choices. These were a set ofchoices that were made to enable the change in the democratic allocation of resources. We made a set of priority bets on writing tools in commercial productat that time and we said we
2

FEBRUARY 19, 2016 / 12:00PM GMT, NWL - Newell Rubbermaid Inc at Consumer Analyst Group of New York Conference picked those categories for prioritization because they had the greatest right to win in the marketplace and they had the opportunity to participate in trendsthat were happening around the world that could fuel their growth. These categories had the greatest tailwinds globally and they had the strongest brandpositions in their market segments.
So we made a set of Where to play choices that cut across three different clusters. We actually had three prioritization buckets at that time, win bigger, winwhere we are, which was really a statement of winning with less and then incubate for growth, a cluster of businesses that we either had to apply high heat toto change their performance trajectory or they were businesses that we would consider not belonging in the portfolio over time.
At the same time as we made our Way to Play choices, we made a set of choices around capabilities and we said we had five ways to win that were going tomake our brands really matter, that we were going to build an executional powerhouse that can create a commercial value from the ideas that our marketersgenerated, that we were going to attack this cost structure. At the time, if you recall, we had 37.5% gross margins, 25% SG&A ratios, but only 2.5% of revenuein A&P. So of the 25 points of SG&A, only 2.5 points behind the brands. And we said we had to unlock the trapped capacity for growth. We had to changethe structure in order to release and variablize that SG&A ratio so that we could drive accelerated growth.
We felt like we had to change the team — I will give you a sense for what’s happened on that front both in terms of numbers and composition — tostrengthen our capabilities for growth. And then we took a long view of building out the infrastructure to extend our geographic footprint on a select portionof our portfolio in a select set of emerging market geographies.
And so this document that we launched here at CAGNY in 2012 really set the framework that we’ve been executing for the last four years or so. And it’s animportant document to have in mind because a lot of the choices that were made in this context will be relevant to the choices we make with the combinedcompany as Newell and Jarden come together.
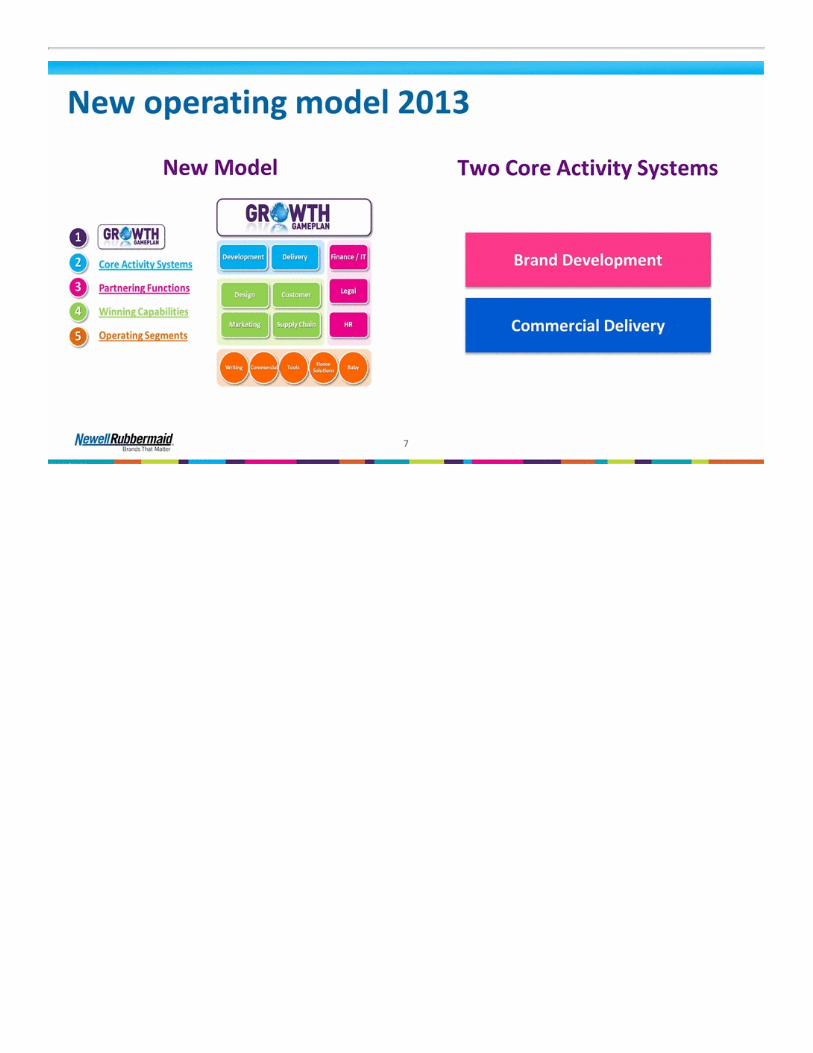
And effectively, in the middle of 2013, we changed the whole model. So while we took some — the first rounds of Project Renewal, which has been our bigrestructuring program, we took some first steps in 2011 into 2012 that were really cost-oriented, easy wins to take. We really changed the whole model in themiddle of 2013, effectively reorganizing the Company around the two first pillars of those five ways to win.
Making our brands really matter. That was the work of brand development. This is where category strategies are built. This is where the brand innovationactivity is generated. This is where all the insight work happens. This is where all the advertising and marketing activity is generated. This core activitysystem created an independent organization design that sat adjacent to a commercial delivery organization. So we talked about development and delivery asthe two core activity systems in the Company, supported by a set of business partnering function, investing in a set of core capabilities for advantagedperformance that I will speak to in a minute in service to what went from 13 GBUs, global business units, supported by three groups to five operatingsegments.
So these two core activity systems — brand development, commercial delivery — absolutely critical to unlocking the performance in the Company and theyare organizations of equal stature within Newell Rubbermaid. They are independent, but they are interdependent. They have a shared accountability fordelivery in the marketplace, but they have different work that they do. And so this is the core and the essence of how we’re organized today here in 2016 andit’s an important, again, benchmark for consideration as we think about what we do with the combined Jarden and Newell Rubbermaid companies.
Effectively in that timeframe, we went from a holding company with a corporate structure, three groups that were [span-break] structures, 13 global businessunits with functions subjugated to the GBUs to an operating company structure, leaned the top of the organization out with a fairly light-handed corporatestructure, but I will tell you that Jarden’s structure is the aspiration for the combined company. It’s much lighter touch at corporate with strong functions, withtheir own functional agenda in support of a set of operating units.
So that’s the move we made in 2013 and results have responded. So if you look at the progression in core sales growth over this timeframe and you look atthe progression of normalized EPS in this timeframe, these are pretty solid trends in their competitive sets of results. I think the thing to notice in them is that,despite $0.39 of EPS headwind connected to foreign exchange in 2015, we delivered good reported normalized operating — normalized EPS growth. And in2014, despite $0.17 of ForEx-related headwinds, we delivered good progress on EPS trajectory. And part of that is related to Project Renewal, part of that isrelated to the overall top-line momentum in the business.
The other thing that’s embed within these numbers is big stepups in advertising and promotion spending in these windows. Last year, we increasedadvertising and promotion 17% despite the pressure in the P&L related to foreign exchange. And I will walk you through that in a second.
3

FEBRUARY 19, 2016 / 12:00PM GMT, NWL - Newell Rubbermaid Inc at Consumer Analyst Group of New York Conference So what’s the playbook; what have we been doing; how have we been thinking about our business? Well, we’ve invested for competitive advantage in fivedifferent areas over the last five years. We’ve invested in insights. I will show you those numbers. We’ve invested in the design of our products and in ourindustrial and graphic capabilities as a company. We’ve invested and strengthened our marketing organization with a lot of outside-in talent. We’vestrengthened the collaborative nature of our selling infrastructure getting to one integrated approach to going to market and we’ve strengthened the team byattracting talent from the outside from the likes of Kraft, a few people from Procter. We’ve integrated those folks — and some folks from Unilever —integrated those folks into our selling infrastructure that is now organized around customers and channels, caring the full bag of Newell products. And we’vemade a big bet on e-commerce.
So these capabilities are the things we bet on for advantaged performance. And we believe these are important and differentiated and that at a company of ourscale today at $6 billion in revenue, they can create leverage versus our competitive set, which isn’t the Procters, the Nestles, the Unilevers, the Mondelez ofthis world. They are lesser competitors and so we can apply these capabilities transposed across five very different businesses to create competitiveadvantage.
Now how has that played out? Well, at the heart of all of this work is a commitment to strengthen innovation and we’ve built out an ideation system withinour infrastructure that it first was focused on product and on brand, which is what we described as a process called Innovation Now. And as you can see, therewere over 13,000 idea fragments generated through that process. And in the last year and a half, we’ve taken that capability and shifted it to focus on productdesign and costs. So we now have a business model and a system, an activity system within the Company that supports both our growth and our costoutcomes.
We’ve significantly increased the amount of money we do in research and so we’ve invested $60 million over the last number of years to strengthen ourinsights capability. We’ve articulated for ourselves over $3 billion worth of unmet needs globally in our core categories, which says that if we were to havethe resources to be able to play for marketshare consolidation, we have a roadmap of how and where we would go do that. We’ve tested over 1200 innovationconcepts over the last three years and we’ve increased the ratio of marketing insight people to marketers from one insight person to 20 marketers to oneinsight person for every eight marketers. This has been a really critical investment and in the scheme of the five big bets we made on capabilities, one that’sbeen essential to transforming the quality of our innovation funnel.
And we measure everything. We have a great chronology of where we were when we started and where we are today and we’ve increased the value in thefunnel by $700 million. Now these are projects that flow to market over three to four years, but the quality of our innovation activity has radically shifted.And we’re bringing these ideas increasingly to market, so we’ve got five big launches on writing this year. We’ve got a number of big launches onRubbermaid this year and on Calphalon this year with differentiated propositions that allow us to command premium price points because the valuepropositions are strengthened. We’re doing the same thing in commercial products. We’re doing the same thing in tools and we’re doing the same thing inbaby gear. So these capabilities, this investment in design, this investment in insights, this investment in marketing has strengthened the funnel.
At the same time, because of the work we’ve done on cost, we’ve been able to increase the amount of money we’re spending on advertising. And this givesyou a perspective from where we were in 2012 to where we expect to be in 2013 in absolute dollar terms and tells you the multiple on investment. So despitemaking this progress on EPS; despite making the progress on margins, which I haven’t spoken to, you see our ability and capacity because we’ve beenfocused on unlocking the trapped capacity for growth to invest in our brands.
And we’re not just spending more, we’re spending smarter. So we’ve gotten our non-working ratio in advertising down to 15%, which is just about as good asI think we can get, and what that means is the money that goes — in our advertising budget that goes to the production of commercials, or the production ofpoint-of-sale material relative to the amount of money in our advertising budget that’s spent on communicating.
We’ve also moved our media mix to shorter length commercials. So we’ve increased the number of 15s that we use in media by 7.6 times, so we werespending a lot of money in the past with 30-second, sometimes 60-second commercials. So we’ve increased the impact that we’re getting on ourcommunication.
And we’ve broadened the vehicles. So today, we’re not just a TV and print company; we’re a TV, digital and print company and we’re spending about 23% ofour working media dollars on digital and that will steadily increase. That’s about the right level from my judgment given our footprint and given theactivities we’ve got and given the fact that most of our media dollars are spent on new item launches where you want to build broad reach and awareness inorder to convert to trial. But over time, you should expect digital presence to continue to grow, but the right now mix of vehicles.
Beyond marketing, we’re winning with winning customers. It’s really important to focus all of your resources on where the growth is. So this gives you asense for our lead customer performance by category over the period from 2011 through 2015. So despite operating in a really tough environment, our leadcustomer has grown really, really nicely and we’ve made a bet in new channels, in dollar and club development over that same timeframe.
So the structure that we’ve built, which was organizing around customers and channels, which is not a really innovative breakthrough idea, but it was new toconsumer durables, has allowed us to broaden the coverage universe, direct selling coverage universe, to allow us to penetrate new channels. Again, animportant thing to recognize and think about as you think about the combination of Newell and Jarden.
4
FEBRUARY 19, 2016 / 12:00PM GMT, NWL - Newell Rubbermaid Inc at Consumer Analyst Group of New York Conference And obviously, we’ve made a big bet, as I mentioned, on e-commerce. And the CAGR on our e-commerce business, whether it’s short play e-com, whether it’sdirect-to-consumer, or whether it’s bricks and mortar dotcom, has been 59% over this timeframe led by our baby business, now really doubling down on ourwriting business and with the innovation funnel coming on the Rubbermaid brand, tremendous opportunity there with better-than-expected traction in toolsand commercial products.
So as consumers shift their purchasing patterns, obviously our business model needs to adapt to that and we’ve made a big investment in e-commerce andexpect to continue to over the coming number of years. And of course, Jarden has done the same in their business with a focus around direct-to-consumerthat’s very complementary to where we’ve made our bets.
We’ve made a set of sharp choices that have strengthened performance that serve as a good reference point as you think about what we could and should doas we move forward with the Jarden deal. We’ve made a set of portfolio choices that I mentioned to you. We established a set of profit interventions on babyand in Europe. We’ve worked through Project Renewal to strengthen the network to change the composition of the network and release a lot of costs. That’sresulted in labor productivity benefits that I will demonstrate to you and we’ve complemented that organic agenda with a strong set of bolt-ons that havereally turbocharged our performance and I will show you the metrics around that.
So on sharp choices in portfolio, here’s what happened last year with respect to our win bigger businesses. So our win bigger businesses, which are writing,commercial products tools and our food and beverage portion of the home solutions business, grew 9.4% in 2015 and now today represent over 50% of ourtotal revenue. If you look at growth from 2011 to 2015 picking a year to normalize that growth from a ForEx perspective — I think we use 2014 here — yousee a 6% CAGR and you see where the money has gone. The money has gone behind these businesses with a 78% increase in advertising investment —advertising and promotion investment.
So you see a sharp set of choices playing out in the marketplace with accelerated growth performance, strong contribution to the overall Company’s healthand great profit contribution to the Company’s performance. So if you were to go back and look back at the reported results in 2011 and compare them to2015 and look at the composition of our profit pools by these businesses, you would see a meaningful step forward.
The profit interventions on baby and on Europe have yielded great growth since we’ve done the interventions. This is really important. It’s reflective of amanagement capability to go in and fix broken businesses. That will be useful as we move forward in the Jarden Newell integration. And there’s more work todo on the Newell side.
And then Project Renewal in aggregate, this is a really important slide because it tells you where we are in the journey. Tells you what’s left to go with respectto savings. It also gives you a reference point for what’s possible when you’re really committed to attack the cost structures and change the model.
So if you look at the cumulative savings, which, in this framework, we’ve used the number of $675 million, which is the high side of the targeted outcome,that’s equivalent to about 12% of our revenue from the base with which we started. And we’ve got about $0.75 of cost to come out left to go in this programwith all of the initiatives in flight already and I will describe for you in a second the model we used to capture these benefits as a proxy for what we couldpotentially do going forward with respect to the Newell Jarden merger.
Now just to be clear, that $0.75 doesn’t offload to EPS. So we’ve said about 50% of that benefit will flow to EPS. 50% of that benefit will be reinvested backinto the business. This is how we fund the A&P increases that we’ve been building into the business. As you know, in 2015, many of you will, the A&P ratioin the business was 5% in 2015, up from 2.5% when we started on our way to an envisioned endgame of about 7%. So this model, really important. The waywe go after the money also really important as it shapes a framework for what we would do in the combination.
So we’ve got a transformation office in place, which we fund out of Project Renewal. It’s disciplined program management — there’s the disciplined programmanagement approach. These folks are 100% focused on work streams connected to renewal and as we’ve said, we’ve got $315 million more to go, focusedlargely now in overheads and in supply chain. Very focused, top-five work streams delivering 75% of the increment to be delivered and we’re really goingafter complexity reduction now. We started this in 2015, but we’re going hard against complexity reduction in 2016. And we’re also tackling the way we goto market and our program design with new tools and new program constructs that are very familiar to anybody that covers the consumer goods industry, butagain not familiar to the consumer durables space.
It’s yielding increased productivity. So if you look at our headcount of VPs and above from where we started in 2011 to where we are today, we’ve seen areally significant flattening of the top of the Company. As you create an operating company structure from a holding company structure, there’s opportunitythat happens with respect to pushing your resources out to the point of demand creation into selling, marketing or having your resources focused on thecapabilities that service the demands you create. And that’s what we’ve done.
5

FEBRUARY 19, 2016 / 12:00PM GMT, NWL - Newell Rubbermaid Inc at Consumer Analyst Group of New York Conference Now, importantly, the composition of the folks that are in the organization today is largely legacy Newell folks. We’ve promoted 20% of those 101 VPs; 52%were legacy Newell employees and we’ve gone to the outside where we needed specialist capabilities. But this is a nice blend of talent from the inside andthe outside and I think, again, a good reference point as you think about future choices we might make.
In that context, look what’s happened with labor productivity. So labor productivity has moved from 2011 from $298,000 per employee to $345,000 peremployee with more opportunity. Remember, we’re focused on overheads in 2016. So tremendous upside to this number as well.
And all of that complemented by — the organic agenda complemented by an M&A agenda that has really helped strengthen the momentum in the business.So this gives you a sense for what has happened on the businesses we’ve acquired since effectively a blended run rate annualized contribution at the start. Soour revenue is up 27%. Our adjusted EBITDA is up 34% since we acquired these assets. And so it tells you something about the capability we’ve got withrespect to M&A.
So again, a set of choices on capabilities for advantaged performance. Then they set up sharp choices in how to allocate our time and resources contributingto a set of outcomes. We don’t view our world as static, so we’ve taken another cut at the Growth Game Plan, which we did at the beginning of this year, tosharpen the choices even further. We’ve articulated a vision for what it feels like to work at our Company and what is the aspiration we have for our Companycalled the Newell Way, which adds a third component to the Growth Game Plan and we’ve sharpened the activities that fall under the five ways to win to arelevant set of activities for the work we’re doing today in the business.
And obviously, this has contributed to an interesting story with respect to value creation. The annualized dividend has moved from $0.20 to $0.76 over thistimeframe. We’ve increased normalized EPS by 42% in four years and we’ve repurchased and had the capacity to repurchase 1.2 billion shares of theCompany’s stock. So a good story, but just the preface for what we believe is to come next.
So context. That was the context setting for what we want to talk about now, which is the combination of Newell and Jarden. Both companies enter into thispartnership from positions of strength, very strong performance — I will show you the numbers in a second — over time. And we are creating a leadingbranded consumer goods company with this combination. We’ll have $16 billion of revenue; post-synergies, 20% plus EBITDA margins; a really interestingcash generative machine that will create lots of flexibility for the Company over time as — and for investors over time — as the debt is paid down on thecombination. So creating a leading branded consumer goods company.
Both companies have strong value creation track records. So I showed you Newell’s track record as a result of the choices. Jarden’s track record really isunparalleled in our industry over the last 10 years. And the team, the Jarden team, deserves tremendous credit for taking the risks. Investors have gained atremendous benefit as a result of the building out of that company, but there are very few stories of companies from a standing start built to $10 billion in thatshort of a 14-year timeframe and tremendous value creation relative to the S&P, relative to the Dow and even certainly relative to Newell.
So companies come together with strong value creation track records. The companies come together with strong performance track records and you can seethat in Newell’s 2011 through 2015 performance. You can see that in Jarden’s 2011 through 2014 performance and when the K comes out in a couple ofweeks, you will see that in 2015’s performance as well.
The combination creates a $16 billion company, as I said, with 20% EBITDA margins post-synergies. It more than doubles our scale in customers, channels,geographies, suppliers which will enable increased access to new channels and accelerated international deployment of our portfolio. None of those revenuesynergies have been counted in our model, but they are clearly available to us. There’s at least $500 million in cost synergies incremental to Project Renewal.So as I told you, there’s $315 million left to go on Project Renewal. That’s greater than $800 million in cost benefit when combined with renewal and wehave a line of sight to do both.
There’s strong cash flow, which will enable rapid deleveraging to the 3.0 to 3.5 times leverage ratio target that we’ve committed to live within and we arecommitted to an investment-grade credit profile, which will drive the initial capital allocation choices for the Company. But once that leverage target isachieved, there’s opportunity to both strengthen the portfolio and pursue other value-creation options.
And what you get through this combination is the creation of a strengthened team, leading a bigger company with more potential together than apart. And soyou get a combination of leaders. You get a combination and benefit of accessing different approaches from both sides of the Company and I think thatcreates a stronger company. It’s probably one of the most important, but intangible benefits through the combination. And we also get the opportunity toattract a different caliber of talent to both companies as we create the future of Newell brands.
This is a highly concentrated footprint. So some of the questions that I get often about the combination is this is too complex. It’s not too complex. This is ahighly concentrated portfolio with 80% plus of the revenue in nine countries; 60% of the revenue in nine channels; and 80% plus of the revenue in 30brands. So concentration matters. It allows you to efficiently target your SG&A against the growth potential of the business and scale matters in thesebusinesses. In the consumer goods industry, relative marketshare matters and scale matters because it affords you the capacity to invest in capabilities. So thisis a really important two sets of points with respect to the combination.
6

FEBRUARY 19, 2016 / 12:00PM GMT, NWL - Newell Rubbermaid Inc at Consumer Analyst Group of New York Conference There is an opportunity to apply the model that I just described to you across a broader set of categories. So what’s the model? Let me try to boil it down foryou. We compete in the large categories. They are growing categories. I will show you the category growth rate for Newell in a second and compare it toJarden. We compete in categories with unconsolidated or less consolidated share positions. So the top three in any one of our categories in the US has about a48% share. If you were to look at some of the colleagues that I have that are presenting here this week, the top three would have closer to a 75% share of theircategories. So there is much more share consolidation to play for.
At the beginning, we made a bet on the market’s responsiveness to innovation. When we started our innovation ratio, our rate, our vitality target ascompanies call it, was somewhere less than 20%. As we enter 2016, we’ve gotten our innovation rate closer to 30%, which is amongst — it’s the target thatthe best companies in brand development and innovation target. And we had a theory that the market would be responsive to that activity, but we’ve nowbegun to prove that out in the marketplace. So large company, large categories, growing, less consolidated, responsive to activity and perhaps mostimportantly low cost of growth because of the lack of consolidation in these categories. So we have a 60% share of voice in our categories in the US nowdespite spending less than 3% in advertising as a percent of revenue, whereas if you were to look at the number one HPC company in the US and look at theirshare of voice, it would be about 28% and they’d be spending closer to 10% of revenue in advertising. And so big difference in cost of growth.
So our model. Compete in large categories that are unconsolidated, less consolidated, responsive to activities. Categories that are growing that have low costof growth. We would never want to pivot this Company into Procter & Gamble’s categories, or pivot this Company into a Nestle or Mondelez set ofcategories because their scale would disable our capability advantage. That’s the logic for how we’ve thought about our positioning in our portfolio.
So as Newell and Jarden come together, what do you have? This is just the US market. If you’ve got our market growth at about 2.5%, you’ve got a bigger setof categories that Jarden competes in with market growth of closer to 3% combined market playing field that — the canvas that we’re playing on of $85billion. So big categories, growing nicely. The marketshare consolidation in Jarden’s categories looks very similar to the level of consolidation in ours.
So effectively if you take the playbook that we’ve developed and are proving out in the marketplace and deploy it across the combined portfolio, you havelike-sized opportunity to accelerate performance over time. We have not assumed growth acceleration in our model. In fact, we’ve assumed the low end ofJarden’s growth guidance in our model. So in any number I’ve given you on accretion, we assumed 3% for Jarden as opposed to their historical track record,which is towards the higher end of their range.
And so — interesting. This is one of those pieces of analysis that cause me to really get excited about possibility. Obviously, the power in the combination isin the power of the brands. So we have leading brand positions in a number of key categories and we’ve got great assets to potentially leverage here with themodel I’ve described. We can leverage those leading brands in a concentrated number of geographies, so this lays out the buying power in the countrieswhere our concentration will be, and it lays out the multiple to our scale that occurs in those geographies. So you see a significant strengthening of ourbusiness in Europe, which is important to Newell Rubbermaid because that allows us to avoid making an SG&A investment that we would have otherwisemade in our core model to access mass channels in places like France and Germany for our writing business.
Well, guess what? We’ve got that infrastructure through the Jarden acquisition, an opportunity to deploy our portfolio more aggressively cheaper. And soscale really does matter. So strong brand positions with leveraged scale positions in key geographies and a whole series of intuitive category and brandcombinations that should unlock both category growth ideas and efficiencies in the way we go to market. And so you can begin to see how we’ll thinkthrough the combination of the organizations.
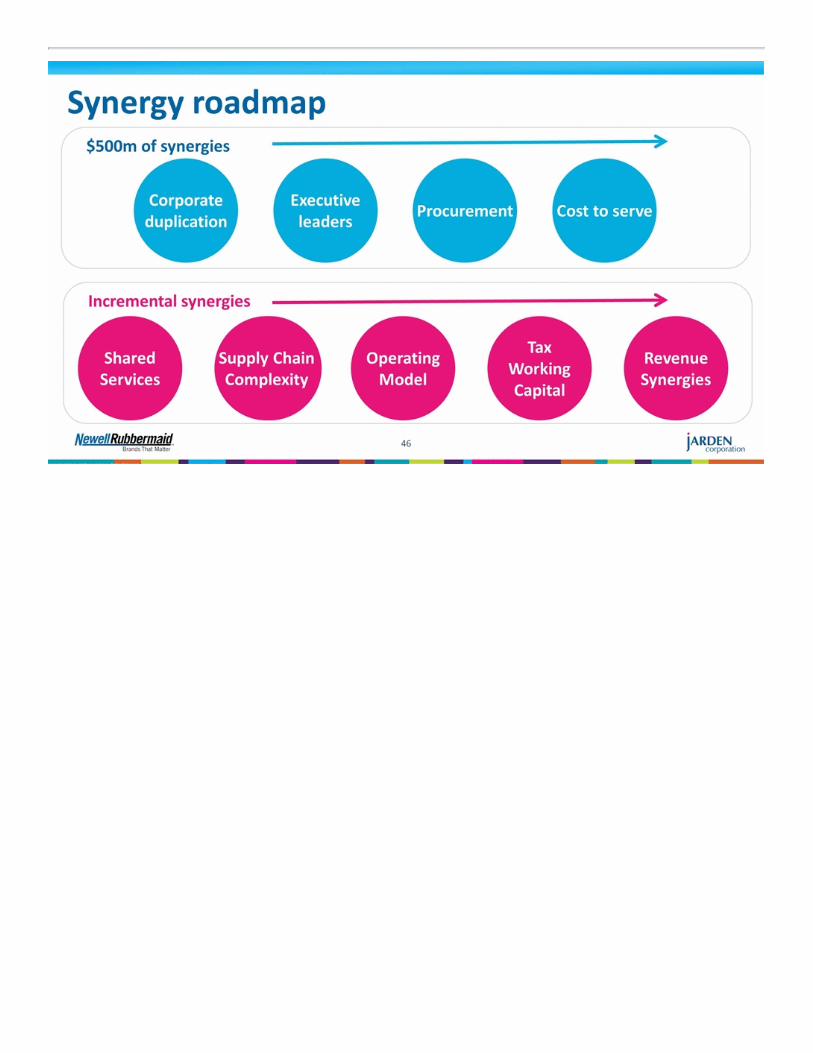
We’ve assumed meaningful, but prudent synergies. So you can see where our benchmark is versus pretty much the deals of like size that have occurred in thisindustry. And I will just leave it at that. For now, we’ve assumed 5% of revenue as the opportunity, which is about $500 million in synergies, but I will leaveyou with the reference point on what we’ve done with respect to Project Renewal over a five, six-year window. It shows you that it’s possible, depending onthe choices you make, to go beyond that.
And so as we get into this business, just like we did with Project Renewal, we learned more and different things and that unlocked opportunities beyond whatwe committed to deliver and we expect to find similar things as we get into the Jarden and Newell combination. But it’s premature to suggest that we knowthat there’s more. We’ve clearly articulated the roadmap to $500 million.
And that synergy roadmap at the beginning is focused in these spaces. There’s tremendous procurement opportunities connected to the combination. Thereour cost-to-serve route-to-market opportunities connected to the combination. There’s clearly a powerful opportunity connected to two publicly tradedcompanies coming together and then there’s executive synergies as well. The opportunities beyond that are in these areas and as I said, this is the area, this iswhere we’ll go fishing. We’re going to get our hands and our energies focused on the first $500 million, but these are opportunities beyond. Again, our modeldoesn’t contemplate any of this.
7

FEBRUARY 19, 2016 / 12:00PM GMT, NWL - Newell Rubbermaid Inc at Consumer Analyst Group of New York Conference So let’s get into the financials as far as I can at this point in the journey of the combination and I’m sure it will leave you looking for more answers and this iswhere the lawyers did chime in last night in rewriting the back end of my deck, but so be it. This is what we need to do given where we are in the process. ButI will go as far as I think I can go.
So what are the assumptions in the model? The assumptions in the model are that we take Newell’s base plan, which is we’ve got a very clear line of sight todeliver this out into the future with the changes that I’ve just articulated to you in the business, the midpoint of that 4% to 5% guidance range. We’ve beenconservative on the Jarden assumption, so we’ve taken the low end of their strategic guidance range, but despite their consistently delivering over the lastthree years towards the higher end of that guidance range. We’ve assumed $500 million in synergies over four years. There may be opportunity to get the first$500 million quicker than four years and we’ll work on that, but we’re not going to commit to that until we get into this a little bit more deeply.
There clearly are revenue synergies which we have not incorporated. We’ve blended the current plan for both businesses on working capital, on capitalexpenditure, on tax rates and we’ve held the dividend at the current dividend rate. We’ve got the capacity, as you’ll see, to increase the dividend over time in2017 and 2018 with performance.
Financing considerations. Milestones. Again, lots of questions about this. I will give you the facts. We’ve got a $9 billion bridge facility and a $1.5 billionthree-year term loan in place. Originally the bridge facility was bigger. We now have the term loan in place. This is the way you should think about thecombination. We’ve extended the revolver and increased it to $1.2 billion to give us flexibility. We expect to roll over a significant portion of Jarden’s debt,$630 million and we’ll refinance about $4.5 billion of the existing Jarden debt.
We expect to incur another $8.7 billion of permanent debt financing in lieu of the bridge facility. That’s how you need to think about that and depending ontenor, and we have not made the decision on whether we’re going to go short, mid-duration, long duration, but depending on tenor, the right way to thinkabout the blended interest rate between both the term and the permanent debt financing is about 4.5% today with credit spreads that have obviously widenedsince we announced the deal in the middle of December.
And so this last bullet point is important to just remember that that will be influenced either one way or the other depending on what the right economicchoice for us is as we get to the moment of placing the permanent debt.
So this is the work that’s been achieved to date. There are treasury locks in place as well that give us some [assurety] around rates that you should know aswell.
What are the outcomes? Well, I’ve said many of these before, but I want to bring a little bit more clarity to the deleveraging. So from an accretion perspective,with what I’ve shared with you as assumptions, we get to high single digit accretion in year one, mid to high teens in year two depending on choices andstrong double-digit accretion by year three.
In terms of deleveraging, that term loan is structured in the way it’s structured to enable us to pay it down over the first three years and then we’ve got about$900 million of existing maturities in the first three years that are available to be paid down. I’m not saying to you that we will because our goal is to get intothe leverage ratio range of 3.0 to 3.5 times, and that’s where we’ll operate this Company going forward. And we will probably need to, in order to achieve thatin the timeframe that we’ve articulated, access some of the $900 million of existing maturities, but maybe not all of them. And again, time will tell. It dependson how the performance of the Company plays out, but we’ve got the flexibility to access those to get the company’s leverage down to the ratios we’vecommitted to in the timeframe we’ve committed to get them down.
The Company combined should, by the end of 2018, assuming a Q2 close, generate between $5.5 billion and $6 billion of operating cash flow. A portion ofthat will be allocated back to dividends. So as you recall, $0.76 a share in the balance of (technical difficulty) [16] against a higher share count and then theopportunity to grow the dividend and increase the dividend with an earnings performance cash flow improvement.
CapEx, we’ve blended the two companies’ CapEx assumptions. The balance available for debt repayment and then the balance available either as a cushion— and it’s substantial — or to be reallocated into other activities depending on where we are in the progress of the Company. So I wanted to articulate foryou as best we can and with the kind of specificity that we can at this point how we envision allocating capital. So I think hopefully that’s clear.
Now where does the deal go from here? The deal goes and we hope to close the deal sometime in Q2. The regulatory filings have all been made. The amendedS-4 with our responses to the SEC comments that we’ve received has been filed this week, so it’s out there for your review, and we expect to proceed down thenormal regulatory filing resolution process. These are — the long leadtime item typically is Europe, but there is no real substantive issues that we see gettingin the way of the deal closing from a regulatory perspective.
8

FEBRUARY 19, 2016 / 12:00PM GMT, NWL - Newell Rubbermaid Inc at Consumer Analyst Group of New York Conference And so with that, hopefully, I’ve laid out for you two sets of insights. One, what’s made Newell Rubbermaid work for the last four, five years. Hopefully, I’veset up for you the places we could extend that model, give you a sense for how that model could be extended across a broader canvas, a broader set ofcategories and also give you enough specificity to give you a little bit more clarity and certainty with respect to the deal because I know there are a wholebunch of narratives out there that are not particularly constructive that I don’t think have much relevance to the future prospects of the deal coming off, or thecompanies coming together and us getting on with creating the future we envision for the combination, a combination that brings together two stronglyperforming companies that leverages the best of both portfolios, the best of both talent pools and the best of both sets of capabilities.
So with that, I’m happy to open it up for questions.
QUESTION AND ANSWER Unidentified Audience Member
Just two questions. So on capital allocation, can you talk philosophically on how you think about the dividend? So right now, you’re at the lower end of theoverall CPG payout range. So when you think about longer term, where would you like to be? What are the aspirations there? That’s number one. Andnumber two, there’s obviously a lot of concern about what’s going on in the US economy. I guess it depends on if stocks are green or red these days. What areyou seeing just generally speaking with the consumer across your categories right now? Mike Polk - Newell Rubbermaid Inc. - President & CEO
So POS trends that we were experiencing in 2015 continue into 2016. You can see that through the publicly available syndicated data and they’ve been quitehealthy for us. As I said, with earnings, Q4 earnings, in the US, we’ve built marketshare positions in 10 out of 13 product families that we can measure. Nineout of those 13 categories have POS growth of greater than 9% and so that’s really strong underlying momentum in the business. And the category growthrates in a big chunk of those are greater than 5%. So in the fourth quarter, very healthy metrics and that trend, there’s nothing that I’ve seen that suggests thattrend is moderating as we move into 2016, although we can convince ourselves that we’ve got an issue and then create an issue with all the media headlinesover the last number of weeks. And there is clearly a wealth creation effect that could lead into consumer spending, but we don’t see it today in the metrics.
And so in the US, I think relatively healthy, more of the same. In Brazil, Brazil is a struggle. That’s probably the hottest spot on earth at the moment. Chinagets all the headlines, but Brazil is the biggest problem I guess is the articulation I would make. And China is growing nicely ahead of GDP growth in mostmarkets. Whether it’s 5%, whether it’s 4%, whether it’s 6%, doesn’t really matter. It’s 1.3 billion people that are moving out of poverty into middle class,many of them with more buying power and strategically really quite attractive and interesting. And so that’s the type of issue I think about when I thinkabout China or framework I think about for China. I take a much longer view about — if you are going to be a global company, you have to play there, youhave to be successful and you have to have scale and share position in that geography to be healthy.
So the macros, US feels more of the same. Europe for us looks like more of the same, slow growth, but growth. And Latin America will be very different for usbecause of the things we’ll do to fix our margin structure in Brazil and if you strip out Venezuela from our numbers in the prior years, you’d see a moremodest growth than what we reported in terms of the region. But still we should be high single digits, low double-digit growth in Latin America.
So I don’t see some big shift that’s occurred at this point, but it’s important to watch whether attitudes become behavioral in the marketplace and we willkeep a close eye on that.
With respect to capital allocation and philosophy on dividends, I’m not going to go there yet. Let’s get this deal closed, then I will come back to you withguidance and I will give you my perspective across all dimensions. One of the powerful things about the Company is you are going to end up post-synergieswith over $3 billion of EBITDA, so we’re going to have the flexibility to do a lot of things. Obviously, we want to create the right dividend structure for acompany of our sort, but we have a lot of ambition to consolidate those market positions that I’m describing to you.
9

FEBRUARY 19, 2016 / 12:00PM GMT, NWL - Newell Rubbermaid Inc at Consumer Analyst Group of New York Conference When you look at the blended nature of the Company and you assess the fact that the top three only have 45% of these categories in the highly developedmarket like the US, you can get a sense for the opportunity to scale our position in a number of core categories. So capital deployed to those types ofactivities that complement an organic agenda with bolt-ons in the core probably make some sense in the future.
Priority number one though, hold the dividend, grow it with earnings probably is the right way to think about it and then pay down the debt and get theleverage ratio down into the targeted range. Those are the commitments we’ve made externally. Those are the commitments we’re going to live by and thenwithin two to three years, we’re in a really good place and have all kinds of optionality and we’ll try to bring a specific point of view to you so that you cancalibrate the value-creation potential in your models. Unidentified Audience Member
The comments of applying the Newell model to Jarden, does it imply that Jarden was underspending on A&P because the thought is they’ve been growing3% to 5% — they’ve been growing already in that range even before you caught up. So were they underspending, one? And then the question is, if not, if youapply this model, can you grow these businesses with marketshare gains even faster than they’ve historically done? Mike Polk - Newell Rubbermaid Inc. - President & CEO
Jarden’s performance has been pretty extraordinary, so their growth rate, their equivalent to what we describe as core growth has been stronger than Newell’sand they’ve done that through deployment of portfolio. They’ve been more aggressive than we have in geographic deployment, so I think there’s a lot tolearn on the Newell Rubbermaid side from the experiences that the Jarden leadership team has had on geographic deployment. One of the best examples ofthat would be Yankee Candle and their European performance, so they’ve been more aggressive in taking greater risks with respect to geographicdeployment than we have. There’s stuff we will learn from that experience.
They’ve also had a stronger performance in direct-to-consumer e-commerce than we have, very clever approach to building out a Web platform and a set ofbrand sites leveraging customization as the hook to bring consumers in, but then commercializing that involvement more broadly. That was really smart stuffthat they did there and there’s a lot we can learn in that space as well.
So there’s a number of things that have contributed to the work they’ve done. They’ve done a terrific job with Oster. They’ve done a terrific job with Yankee.I know Yankee well because I was on the Board of Yankee in 2005, 2006 and we hadn’t done — that team hadn’t done that work and you’ll look at whatthey’ve created in the two years they’ve had it and it’s really pretty interesting and remarkable.
And so there’s a lot of assets and management know-how in those experiences that we intend to tap. We’re selfish about that. We truly mean the best of both.There are things we do with respect to product design and with respect to marketing and we spend probably more than they would have the courage to spendtoday and we do more on insights that we can bring to those categories.
So I think the interesting thing here is the fact that there’s some management experiences that we will be able to tap that draw into our writing business, forexample, to think about how to be more aggressive on geographic deployment in writing. There are things we can bring through the design center, throughinsights and through innovation work that may strengthen their funnel of activities on their core brands. They should strengthen their funnel of activities onthose core brands, and our expectation is that they will. We’ve built none of that into our algorithm. There are no revenue synergies in the model that we’vearticulated. We think it’s unwise to count on them, but we strategically intend to unlock those. So, yes I think is the answer to your question long term, but Iwouldn’t expect that to happen in the first few quarters because we will be focused on coming together and getting to know each other. Unidentified Audience Member
Just following up on that on the deployment and the geographic expansion, is there a risk that they have overextended themselves and that there’s going tobe a period of time, just like you went through with Newell, where there’s an SKU rationalization or a pulling back and is there any concept at this point ofhow big an impact that could be in terms of a drag on their overall revenue base?
10

FEBRUARY 19, 2016 / 12:00PM GMT, NWL - Newell Rubbermaid Inc at Consumer Analyst Group of New York Conference Mike Polk - Newell Rubbermaid Inc. - President & CEO
Right. So we’ve conservatively assumed the low end of their guidance range in the model. So all the accretion numbers that I’ve shared contemplate thatthere is this period where you come together and you’re getting to know each other, that there may be some disruption. So we’ve been conservative on thelow end. I actually hope we don’t see any of that. We only saw modest levels of that within Newell. As you recall, we were able to get the growth to deliverbeyond the expectations that folks had faster than even we expected to.
I do not think there is a geographic risk with what they’ve done. There’s some really interesting opportunities now that they are doubling down on. So youknow that they are investing in the factory in Europe for Yankee; that’s going to open up all kinds of capacity and a cleaner route to market, a cheaper routeto market for them on that business and there’s lots of interesting things that are going on with respect to geographic footprint that they’ve done that weactually can benefit from. So I don’t think there’s a risk there. That’s obviously something you have to watch out for, sort of the hula hoop, but we didn’t seeany of that in due diligence. Unidentified Audience Member
And then just a second question if I can. In terms of the importance of the holding company structure and the flattening and the savings you’ve gotten fromthat, but also on locking the core capabilities, how important is that for you when you look at the Jarden portfolio because that business has been run sodifferently than Newell? And is there a risk that as you try to bring those businesses into the Newell model, something that has worked so well for Jarden inthe past gets lost? Mike Polk - Newell Rubbermaid Inc. - President & CEO
Sure. So it’s a really important question. The $500 million that we’ve articulated as the tranche of synergies that we’ve committed to doesn’t contemplatethat. So if we were to choose to consolidate categories or to deploy the model more aggressively, there would be more value released. But the offset to that —and this is something we want to be really careful of — is the most important variable in the whole deal is to get both companies to perform. So they’ve got todeliver their 2016 plan. We’ve got to deliver our 2016 plan. And then while we’re getting to know each other, we’ll think about options like that.
There are clearly a number of intuitive combinations that make sense, but it’s not as simple as deploying what I described as these advantaged capabilitiesacross the whole portfolio. There are differences in the portfolio and we’ll respect those differences. There are a number of places where it can be applieddirectly. What we learned in how we approached Project Renewal is we want through cycles. We got into the business. We learned the business. We activatedthe agenda. We learned a little bit more. We saw more opportunity. We activated the next tranche. And that’s what you should think — that’s how you shouldthink about our approach. That was a good approach. The risk in that approach is that you prolong the process, so we’ve got to weigh the benefits of thatagainst the risks and we’ll make those choices as we get further along. Unidentified Audience Member
Is there anything that you or your advisors or your consultants stumbled upon that suggests that 5% should be the right number when maybe just similarcompanies have averaged 10% of sales and synergy? Mike Polk - Newell Rubbermaid Inc. - President & CEO
No, I think the thing that’s driving that is our caution with respect to demand creation, that we want both companies to continue to execute and deliver theirplans and it’s in that design space where there will be opportunity. The other thing that’s going to be a big opportunity over time is distributiontransportation benefits, but that’s infrastructure related to the DC networks that are available — that will be present in the US and in Europe. So there clearlywill be opportunity to bring those things together. That takes a little bit longer periods of time.
All of our choices need to flow from a set of portfolio choices. The one thing that we want to be really disciplined about that we were very clear on withNewell is that the strategy drove the choices. So the portfolio strategy, the point of view on capabilities drove all of the choices. And so in the first six to ninemonths, what we’re going to do is get into that portfolio and the portfolio analytics that enable us to make a set of Where to play choices. We will do thatcollaboratively with the team from Jarden and with our own team, we will get it to the Board. We will socialize that with the Board. We’ll share it with you atthe appropriate moment and then that will end up driving how we think about organizational design, how we think about other choices we might make interms of resource allocation. And that’s the way you should think about the sequence of events. I would think that the summer is the period of time where wetry to get that work done. And then your design choices for the organization flow from that.
11

FEBRUARY 19, 2016 / 12:00PM GMT, NWL - Newell Rubbermaid Inc at Consumer Analyst Group of New York Conference Unidentified Audience Member
Got you. And then is there anything unique about the business? I think you’ve always said that, at some point, you can get to 14% of corporate overhead tosales, the target, which is best-in-class. Mike Polk - Newell Rubbermaid Inc. - President & CEO
Yes, it’s really unique in that they’ve got the right structure for a corporate entity and we don’t. That’s what we’ve been tackling. So they are really lighttouch at corporate and that’s what you should expect us to evolve to. That’s the other aspect of their model that I really like. They have a very lean corporatestructure. We went from a very heavy corporate structure that included real estate commitments that were really difficult to unwind. It took us five years tomake the choice to get out of the building in Atlanta. That was an incredibly expensive piece of real estate. But the economics didn’t work for us because ofthe length of the lease. The team has made the right choices at Jarden on a very lean corporate structure across the top and that’s the model we will embrace. Unidentified Audience Member
Got you. So you still think you can get there to that 14%? Mike Polk - Newell Rubbermaid Inc. - President & CEO
Yes. I think, first of all, when we built — I think there’s opportunity beyond — Newell has articulated 16% as the overhead ratio target for our Company. Themodel contemplates us getting there faster with the Jarden integration. But as you know, we’ve always used Clorox as the benchmark and we’ve said they areat about 16%, including R&D, and with the scale we will have in the combination, we should be able to get beyond that. Unidentified Participant
I think we’ll head to breakout. Thank you again for sponsoring yesterday’s lunch and being here.
DISCLAIMER
Thomson Reuters reserves the right to make changes to documents, content, or other information on this web site without obligation to notify any personof such changes. In the conference calls upon which Event Transcripts are based, companies may make projections or other forward-looking statements regarding a varietyof items. Such forward-looking statements are based upon current expectations and involve risks and uncertainties. Actual results may differ materiallyfrom those stated in any forward-looking statement based on a number of important factors and risks, which are more specifically identified in thecompanies’ most recent SEC filings. Although the companies may indicate and believe that the assumptions underlying the forward-looking statementsare reasonable, any of the assumptions could prove inaccurate or incorrect and, therefore, there can be no assurance that the results contemplated in theforward-looking statements will be realized. THE INFORMATION CONTAINED IN EVENT TRANSCRIPTS IS A TEXTUAL REPRESENTATION OF THE APPLICABLE COMPANY’SCONFERENCE CALL AND WHILE EFFORTS ARE MADE TO PROVIDE AN ACCURATE TRANSCRIPTION, THERE MAY BE MATERIAL ERRORS,OMISSIONS, OR INACCURACIES IN THE REPORTING OF THE SUBSTANCE OF THE CONFERENCE CALLS. IN NO WAY DOES THOMSONREUTERS OR THE APPLICABLE COMPANY ASSUME ANY RESPONSIBILITY FOR ANY INVESTMENT OR OTHER DECISIONS MADE BASEDUPON THE INFORMATION PROVIDED ON THIS WEB SITE OR IN ANY EVENT TRANSCRIPT. USERS ARE ADVISED TO REVIEW THEAPPLICABLE COMPANY’S CONFERENCE CALL ITSELF AND THE APPLICABLE COMPANY’S SEC FILINGS BEFORE MAKING ANYINVESTMENT OR OTHER DECISIONS. © 2016 Thomson Reuters. All Rights Reserved.
12

Caution Concerning Forward-Looking Statements
Statements that are not historical in nature constitute forward-looking statements. These forward-looking statements relate to information or assumptionsabout the effects of sales, income/(loss), earnings per share, operating income, operating margin or gross margin improvements or declines, Project Renewal,capital and other expenditures, cash flow, dividends, restructuring and other project costs, costs and cost savings, inflation or deflation, particularly withrespect to commodities such as oil and resin, debt ratings, changes in exchange rates, product recalls, expected benefits, synergies and financial results fromrecently completed acquisitions and planned acquisitions and divestitures and management’s plans, projections and objectives for future operations andperformance. These statements are accompanied by words such as “anticipate,” “expect,” “project,” “will,” “believe,” “estimate” and similar expressions.Actual results could differ materially from those expressed or implied in the forward-looking statements. Important factors that could cause actual results todiffer materially from those suggested by the forward-looking statements include, but are not limited to, our dependence on the strength of retail, commercialand industrial sectors of the economy in light of the continuation or escalation of the global economic slowdown or regional sovereign debt issues; currencyfluctuations; competition with other manufacturers and distributors of consumer products; major retailers’ strong bargaining power and consolidation of ourretail customers; changes in the prices of raw materials and sourced products and our ability to obtain raw materials and sourced products in a timely mannerfrom suppliers; our ability to develop innovative new products and to develop, maintain and strengthen our end-user brands, including the ability to realizeanticipated benefits of increased advertising and promotion spend; product liability, product recalls or regulatory actions; our ability to expeditiously closefacilities and move operations while managing foreign regulations and other impediments; a failure of one of our key information technology systems orrelated controls; the potential inability to attract, retain and motivate key employees; future events that could adversely affect the value of our assets andrequire impairment charges; our ability to improve productivity and streamline operations; changes to our credit ratings; significant increases in the fundingobligations related to our pension plans due to declining asset values, declining interest rates or otherwise; the imposition of tax liabilities greater than ourprovisions for such matters; the risks inherent in our foreign operations, including exchange controls and pricing restrictions; our ability to realize theexpected benefits, synergies and financial results from our recently acquired businesses and pending acquisitions; our inability to obtain stockholder ordomestic and foreign regulatory approvals required to complete planned acquisitions and divestitures; failure to satisfy a condition to closing of plannedacquisitions and divestitures; our ability to complete planned acquisitions and divestitures; difficulties or high costs associated with securing financingnecessary to pay the cash portion of the merger consideration contemplated by the pending Jarden transaction; risks related to the substantial indebtednessthat Newell Rubbermaid will incur in connection with the pending Jarden transaction and our ability to maintain our investment grade credit ratings;difficulties integrating our business with Jarden and unexpected costs or expenses associated with the pending Jarden transaction; and those factors listed inour most recently filed Quarterly Report on Form 10-Q and Exhibit 99.1 thereto filed with the Securities and Exchange Commission. Changes in suchassumptions or factors could produce significantly different results. The information contained in this communication is as of the date indicated. Thecompany assumes no obligation to update any forward-looking statements contained in this communication as a result of new information or future events ordevelopments.
Additional Information and Where to Find it
In connection with the pending Jarden transaction, Newell Rubbermaid and Jarden have filed a registration statement on Form S-4 that includes the JointProxy Statement of Newell Rubbermaid and Jarden and that also constitutes a prospectus of Newell Rubbermaid. Newell Rubbermaid and Jarden plan to mailto their respective shareholders the Joint Proxy Statement/Prospectus in connection with the pending Jarden transaction. WE URGE INVESTORS ANDSHAREHOLDERS TO READ THE JOINT PROXY STATEMENT/PROSPECTUS AND ANY OTHER RELEVANT DOCUMENTS, BECAUSE THEYCONTAIN IMPORTANT INFORMATION ABOUT NEWELL RUBBERMAID, JARDEN, AND THE PENDING JARDEN TRANSACTION. Investors andshareholders are able to obtain copies of the Joint Proxy Statement/Prospectus and other documents filed with the SEC by Newell Rubbermaid and Jardenfree of charge at the SEC’s website, www.sec.gov. In addition, investors and shareholders are able to

obtain free copies of the Joint Proxy Statement/Prospectus and other documents filed with the SEC by Newell Rubbermaid by accessing NewellRubbermaid’s website at www.newellrubbermaid.com by clicking on the “Investor Relations” link and then clicking on the “SEC Filings” link or bycontacting Newell Rubbermaid Investor Relations at [email protected] or by calling 1-800-424-1941. Shareholders may also readand copy any reports, statements and other information filed by Newell Rubbermaid or Jarden with the SEC, at the SEC public reference room at 100 F Street,N.E., Washington D.C. 20549. Please call the SEC at 1-800-SEC-0330 or visit the SEC’s website for further information on its public reference room.
Participants in the Merger Solicitation
Newell Rubbermaid, Jarden and certain of their respective directors, executive officers and other persons may be considered participants in the solicitation ofproxies from the respective shareholders of Newell Rubbermaid and Jarden in respect of the proposed combination contemplated by the Joint ProxyStatement/Prospectus. Information regarding Newell Rubbermaid’s directors and executive officers is available in Newell Rubbermaid’s Form 10-K filed withthe SEC on March 2, 2015, its proxy statement filed with the SEC on April 1, 2015 in connection with its 2015 annual meeting of stockholders and its Forms8-K filed with the SEC on February 12, 2015, May 19, 2015, October 9, 2015, November 16, 2015, December 14, 2015 and December 29, 2015. Informationregarding Jarden’s directors and executive officers is available in Jarden’s Form 10-K filed with the SEC on March 2, 2015, its proxy statement filed with theSEC on April 20, 2015 in connection with its 2015 annual meeting of stockholders and its Forms 8-K filed with the SEC on January 5, 2015, June 9, 2015,December 17, 2015 and January 7, 2016. Other information regarding persons who may be considered participants in the proxy solicitation and a descriptionof their direct and indirect interests, by security holdings or otherwise, are contained in the Joint Proxy Statement/Prospectus and other relevant materialsfiled with the SEC.
Non-Solicitation
This communication is not intended to and does not constitute an offer to sell or the solicitation of an offer to subscribe for or buy or an invitation topurchase or subscribe for any securities or the solicitation of any vote or approval in any jurisdiction pursuant to the pending Jarden acquisition or otherwise,nor shall there be any sale, issuance or transfer of securities in any jurisdiction in contravention of applicable law. No offer of securities shall be made exceptby means of a prospectus meeting the requirements of Section 10 of the Securities Act of 1933, as amended.