Climate Change 2018 - Conagra Brands Inc
65
Conagra Brands Inc - Climate Change 2018 C0. Introduction C0.1 (C0.1) Give a general description and introduction to your organization. Conagra Brands, Inc. (NYSE: CAG), headquartered in Chicago, is one of North America's leading branded food companies. Guided by an entrepreneurial spirit, Conagra Brands combines a rich heritage of making great food with a sharpened focus on innovation. The company's portfolio is evolving to satisfy people's changing food preferences. Conagra Brands iconic brands, such as Marie Callender's®, Reddi-wip®, Hunt's®, Healthy Choice®, Slim Jim® and Orville Redenbacher's®, as well as emerging brands, including Alexia®, Blake's® and Frontera®, offer choices for every occasion. At Conagra Brands, corporate social responsibility is a natural extension of our purpose and operating principles. We have identified four strategic focus areas that reflect and articulate our values as a responsible corporate citizen: Good Food, Stronger Communities, Better Planet and Responsible Sourcing. Within each of these areas, we focus on issues that are most material to our business and stakeholders and most meaningful to our role in the industry, the marketplace and our environment. Within the Better Planet focus, our commitment to protecting the environment is deeply rooted in our company values and comes alive through collaboration, imagination and having strong external awareness. We recognize that the company’s long-term success is measured far beyond financial metrics and includes social and environmental performance. Conagra Brands set environmental performance goals for the first time in 2008. In 2013, the company announced a new sustainability vision for 2020 with focus areas remaining largely the same, but with updated, measurable objectives for the next several years. We’re working along two business strategies: first, striving to eliminate waste of all kinds – energy, water, and materials – to improve efficiency in our operations; second, ensuring we have long-term access to the resources required to make our products through sustainable sourcing programs. We are actively working to achieve these goals by 2020: reduce greenhouse gas emissions by 20% per pound of product produced and reduce water use by 20% per pound of product produced. We also are committed to continuing our zero waste-to- landfill journey while directing materials to the highest and best use. We work to lead the industry in packaging for sustainable systems, with continuous improvement of design and understanding the role packaging plays in preventing food waste. Our Responsible Sourcing pillar includes promotion of sustainable agriculture practices with our contracted farmers; considering environmental, social and economic impacts across our supply chain; and participating in certified sustainable sourcing programs where material to our business. C0.2 (C0.2) State the start and end date of the year for which you are reporting data. Start date End date Indicate if you are providing emissions data for past reporting years Select the number of past reporting years you will be providing emissions data for Row 1 June 1 2016 May 31 2017 No <Not Applicable> Row 2 <Not Applicable> <Not Applicable> <Not Applicable> <Not Applicable> Row 3 <Not Applicable> <Not Applicable> <Not Applicable> <Not Applicable> Row 4 <Not Applicable> <Not Applicable> <Not Applicable> <Not Applicable> C0.3 CDP Page of 64 1
-
Upload
khangminh22 -
Category
Documents
-
view
3 -
download
0
Transcript of Climate Change 2018 - Conagra Brands Inc
Conagra Brands Inc - Climate Change 2018
C0. Introduction
C0.1
(C0.1) Give a general description and introduction to your organization.
Conagra Brands, Inc. (NYSE: CAG), headquartered in Chicago, is one of North America's leading branded food companies. Guidedby an entrepreneurial spirit,
Conagra Brands combines a rich heritage of making great food with a sharpened focus on innovation. The company's portfolio isevolving to satisfy people's changing food preferences. Conagra Brands iconic brands, such as Marie Callender's®, Reddi-wip®,Hunt's®, Healthy Choice®, Slim Jim® and Orville Redenbacher's®, as well as emerging brands, including Alexia®, Blake's® andFrontera®, offer choices for every occasion. At Conagra Brands, corporate social responsibility is a natural extension of our purposeand operating principles. We have identified four strategic focus areas that reflect and articulate our values as a responsiblecorporate citizen: Good Food, Stronger Communities, Better Planet and Responsible Sourcing. Within each of these areas, we focuson issues that are most material to our business and stakeholders and most meaningful to our role in the industry, the marketplaceand our environment. Within the Better Planet focus, our commitment to protecting the environment is deeply rooted in our companyvalues and comes alive through collaboration, imagination and having strong external awareness. We recognize that the company’slong-term success is measured far beyond financial metrics and includes social and environmental performance. Conagra Brands setenvironmental performance goals for the first time in 2008. In 2013, the company announced a new sustainability vision for 2020 withfocus areas remaining largely the same, but with updated, measurable objectives for the next several years. We’re working along twobusiness strategies: first, striving to eliminate waste of all kinds – energy, water, and materials – to improve efficiency in ouroperations; second, ensuring we have long-term access to the resources required to make our products through sustainable sourcingprograms. We are actively working to achieve these goals by 2020: reduce greenhouse gas emissions by 20% per pound of productproduced and reduce water use by 20% per pound of product produced. We also are committed to continuing our zero waste-to-landfill journey while directing materials to the highest and best use. We work to lead the industry in packaging for sustainablesystems, with continuous improvement of design and understanding the role packaging plays in preventing food waste. OurResponsible Sourcing pillar includes promotion of sustainable agriculture practices with our contracted farmers; consideringenvironmental, social and economic impacts across our supply chain; and participating in certified sustainable sourcing programswhere material to our business.
C0.2
(C0.2) State the start and end date of the year for which you are reporting data.
Start date End date Indicate if you are providing emissions data for pastreporting years
Select the number of past reporting years you will be providingemissions data for
Row1
June 1 2016 May 312017
No <Not Applicable>
Row2
<NotApplicable>
<NotApplicable>
<Not Applicable> <Not Applicable>
Row3
<NotApplicable>
<NotApplicable>
<Not Applicable> <Not Applicable>
Row4
<NotApplicable>
<NotApplicable>
<Not Applicable> <Not Applicable>
C0.3
CDP Page of 641
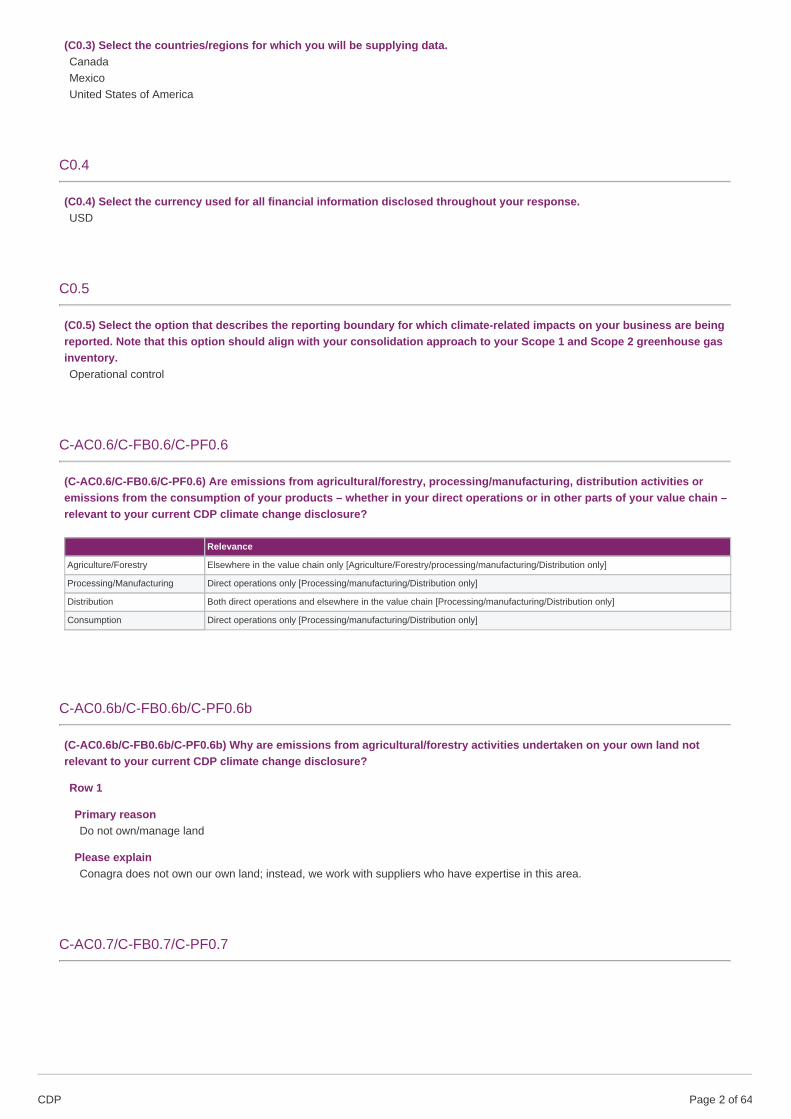
(C0.3) Select the countries/regions for which you will be supplying data.CanadaMexicoUnited States of America
C0.4
(C0.4) Select the currency used for all financial information disclosed throughout your response.USD
C0.5
(C0.5) Select the option that describes the reporting boundary for which climate-related impacts on your business are beingreported. Note that this option should align with your consolidation approach to your Scope 1 and Scope 2 greenhouse gasinventory.Operational control
C-AC0.6/C-FB0.6/C-PF0.6
(C-AC0.6/C-FB0.6/C-PF0.6) Are emissions from agricultural/forestry, processing/manufacturing, distribution activities oremissions from the consumption of your products – whether in your direct operations or in other parts of your value chain –relevant to your current CDP climate change disclosure?
Relevance
Agriculture/Forestry Elsewhere in the value chain only [Agriculture/Forestry/processing/manufacturing/Distribution only]
Processing/Manufacturing Direct operations only [Processing/manufacturing/Distribution only]
Distribution Both direct operations and elsewhere in the value chain [Processing/manufacturing/Distribution only]
Consumption Direct operations only [Processing/manufacturing/Distribution only]
C-AC0.6b/C-FB0.6b/C-PF0.6b
(C-AC0.6b/C-FB0.6b/C-PF0.6b) Why are emissions from agricultural/forestry activities undertaken on your own land notrelevant to your current CDP climate change disclosure?
Row 1
Primary reasonDo not own/manage land
Please explainConagra does not own our own land; instead, we work with suppliers who have expertise in this area.
C-AC0.7/C-FB0.7/C-PF0.7
CDP Page of 642
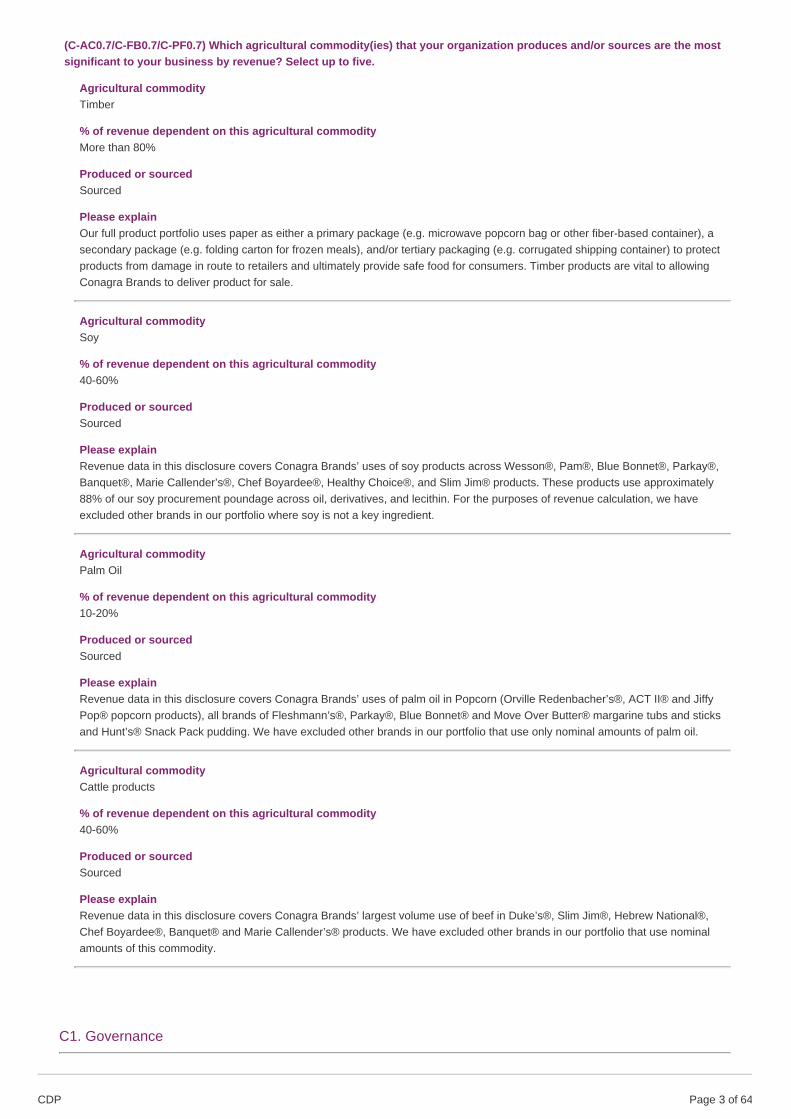
(C-AC0.7/C-FB0.7/C-PF0.7) Which agricultural commodity(ies) that your organization produces and/or sources are the mostsignificant to your business by revenue? Select up to five.
Agricultural commodityTimber
% of revenue dependent on this agricultural commodityMore than 80%
Produced or sourcedSourced
Please explainOur full product portfolio uses paper as either a primary package (e.g. microwave popcorn bag or other fiber-based container), asecondary package (e.g. folding carton for frozen meals), and/or tertiary packaging (e.g. corrugated shipping container) to protectproducts from damage in route to retailers and ultimately provide safe food for consumers. Timber products are vital to allowingConagra Brands to deliver product for sale.
Agricultural commoditySoy
% of revenue dependent on this agricultural commodity40-60%
Produced or sourcedSourced
Please explainRevenue data in this disclosure covers Conagra Brands’ uses of soy products across Wesson®, Pam®, Blue Bonnet®, Parkay®,Banquet®, Marie Callender’s®, Chef Boyardee®, Healthy Choice®, and Slim Jim® products. These products use approximately88% of our soy procurement poundage across oil, derivatives, and lecithin. For the purposes of revenue calculation, we haveexcluded other brands in our portfolio where soy is not a key ingredient.
Agricultural commodityPalm Oil
% of revenue dependent on this agricultural commodity10-20%
Produced or sourcedSourced
Please explainRevenue data in this disclosure covers Conagra Brands’ uses of palm oil in Popcorn (Orville Redenbacher’s®, ACT II® and JiffyPop® popcorn products), all brands of Fleshmann’s®, Parkay®, Blue Bonnet® and Move Over Butter® margarine tubs and sticksand Hunt’s® Snack Pack pudding. We have excluded other brands in our portfolio that use only nominal amounts of palm oil.
Agricultural commodityCattle products
% of revenue dependent on this agricultural commodity40-60%
Produced or sourcedSourced
Please explainRevenue data in this disclosure covers Conagra Brands’ largest volume use of beef in Duke’s®, Slim Jim®, Hebrew National®,Chef Boyardee®, Banquet® and Marie Callender’s® products. We have excluded other brands in our portfolio that use nominalamounts of this commodity.
C1. Governance
CDP Page of 643

C1.1
(C1.1) Is there board-level oversight of climate-related issues within your organization?Yes
C1.1a
(C1.1a) Identify the position(s) of the individual(s) on the board with responsibility for climate-related issues.
Position ofindividual(s)
Please explain
Board/Executiveboard
Conagra Brands’ 2017 materiality assessment noted climate change, water scarcity and deforestation as material issues to be managed as partof our CSR and sustainability governance. As a science-based company, we recognize that these environmental topics are related and need tobe managed holistically. Our Board of Directors maintains a Nominating, Governance & Public Affairs (N/G/PA) Committee that meets at leastthree times a year. All members are independent directors and are appointed by the Board. It is the responsibility of the Committee to review andrecommend to the Board corporate governance principles and guidelines for the Company, as well as to advise management on internal andexternal factors and relationships affecting our reputation, including those related to corporate citizenship and public policy issues. These includeclimate change, water scarcity and deforestation topics. The Chair of the N/G/PA Committee reports to the full Board on an annual basis.
C1.1b
CDP Page of 644

(C1.1b) Provide further details on the board’s oversight of climate-related issues.
Frequencywithwhichclimate-relatedissues areascheduledagendaitem
Governancemechanismsinto whichclimate-related issuesare integrated
Please explain
Scheduled– somemeetings
Reviewing andguidingstrategyReviewing andguiding majorplans of actionReviewing andguiding riskmanagementpoliciesReviewing andguiding annualbudgetsReviewing andguidingbusiness plansSettingperformanceobjectivesMonitoringimplementationandperformance ofobjectivesOverseeingmajor capitalexpenditures,acquisitionsanddivestituresMonitoring andoverseeingprogressagainst goalsand targets foraddressingclimate-relatedissuesOther, pleasespecify (Seeexplanation)
Conagra Brands’ 2017 materiality assessment noted climate change, water scarcity and deforestation as material issues to bemanaged as part of our CSR and sustainability governance. As a science-based company, we recognize that these environmentaltopics are related and need to be managed holistically. Our Board of Directors maintains a Nominating, Governance & Public Affairs(N/G/PA) Committee which regularly meets with management to review internal and external factors and relationships affecting thecompany’s reputation, including social and environmental issues. All members of the Committee are independent Board members.The Chair of the N/G/PA Committee reports to the full Board on its activities. Corporate Social Responsibility (CSR) updates are an in-person annual Board agenda item, with the VP of CSR and sustainability or appropriate representative responsible for updating theBoard annually and as-needed during other meetings. The Board addresses the following items in its capacity as a governing body, allof which influence Conagra Brands’ CSR directly or indirectly: reviewing and guiding strategy; reviewing and guiding plans of action;reviewing and guiding risk management policies; reviewing and guiding annual budgets; reviewing and guiding business plans; settingperformance objectives; monitoring implementation and performance objectives; overseeing major capitalexpenditures/acquisitions/divestitures; monitoring and overseeing corporate sustainability strategy (including climate change, waterand deforestation topics) and related progress against public goals; reviewing innovation strategy; and approving some employeeincentives. During Board meetings, board members are able to provide feedback and comments on these governance mechanismsand their relationship to managing CSR/sustainability, and climate change, water and deforestation risks as a subset of that whererelevant.
C1.2
CDP Page of 645

(C1.2) Below board-level, provide the highest-level management position(s) or committee(s) with responsibility for climate-related issues.
Name of the position(s) and/or committee(s) Responsibility Frequencyofreportingto theboard onclimate-relatedissues
Chief Operating Officer (COO)Responsible for making important decisions regarding issues identified through a materiality assessment, the Chief Supply ChainOfficer (along with the CCO and Executive VP, and Chief Human Resources Officer) serves as the executive sponsors of theCorporate Social Responsibility (CSR) Steering Committee, which reports up to the Board of Directors. The VP of CSR andsustainability leads the CSR Steering Committee and reports to the Board’s Nominating, Governance and Public Affairs Committee.The CSR Steering Committee meets quarterly and oversees decisions regarding all climate, water, and forests policies, goals, targetsand risks. Subcommittees including Responsible Sourcing, Community, Better Planet, and Good Food meet on an as-needed basis.The Committee’s quarterly meeting schedule is aligned with Conagra Brands’ financial reporting cycle, allowing strategic considerationof sustainability and social responsibility topics with business strategy and investor relations
Both assessingand managingclimate-relatedrisks andopportunities
Morefrequentlythanquarterly
C1.2a
(C1.2a) Describe where in the organizational structure this/these position(s) and/or committees lie, what their associatedresponsibilities are, and how climate-related issues are monitored.
Our Board of Directors maintains a Nominating, Governance & Public Affairs Committee that meets at least three times a year. Allmembers of the Committee are independent directors and are appointed by the Board. Description of its Position in the CorporateStructure/Responsibilities One of the responsibilities of the Nominating, Governance & Public Affairs Committee is to periodicallymeet with management to review and advise on internal and external factors and relationships affecting the Company’s image andreputation (i.e., economic and government factors, investor relations, sustainable development considerations – including climatechange – and community affairs). At least annually, the Committee will review the Company’s policies and programs related tocorporate citizenship, social responsibility and public policy issues significant to the Company, such as sustainability, environmentalresponsibility, philanthropic and political activities and contributions. Additional Citizenship/Climate Change Governance andMonitoring at Conagra Brands Day-to-day responsibility for Conagra Brands’ climate change program is managed by corporateEnvironment, Health and Safety, Engineering, Operations, and Research and Development. Individuals from these functions areresponsible for tracking performance metrics and reporting results to management, developing both capital and non-capital reductionstrategies and process improvements, and working with our manufacturing locations to implement GHG reduction strategies.
C1.3
(C1.3) Do you provide incentives for the management of climate-related issues, including the attainment of targets?Yes
C1.3a
(C1.3a) Provide further details on the incentives provided for the management of climate-related issues.
Who is entitled to benefit from these incentives?Environment/Sustainability manager
Types of incentivesMonetary reward
Activity incentivizedEmissions reduction target
CommentAll employees are required to set 3 annual performance goals: one each impacting financial, strategic and operational excellence at
CDP Page of 646
the company. Each goal has measurable metrics tied to the individual’s specific role within a function at Conagra Brands. Forindividuals having significant direct or indirect impact on GHG emissions, annual performance evaluation includes consideration ofprogress towards year-over-year business GHG emissions reduction targets as part of a holistic evaluation of progress on 3 setannual goals. This performance rating affects merit salary increase, bonus, and equity compensation awards.
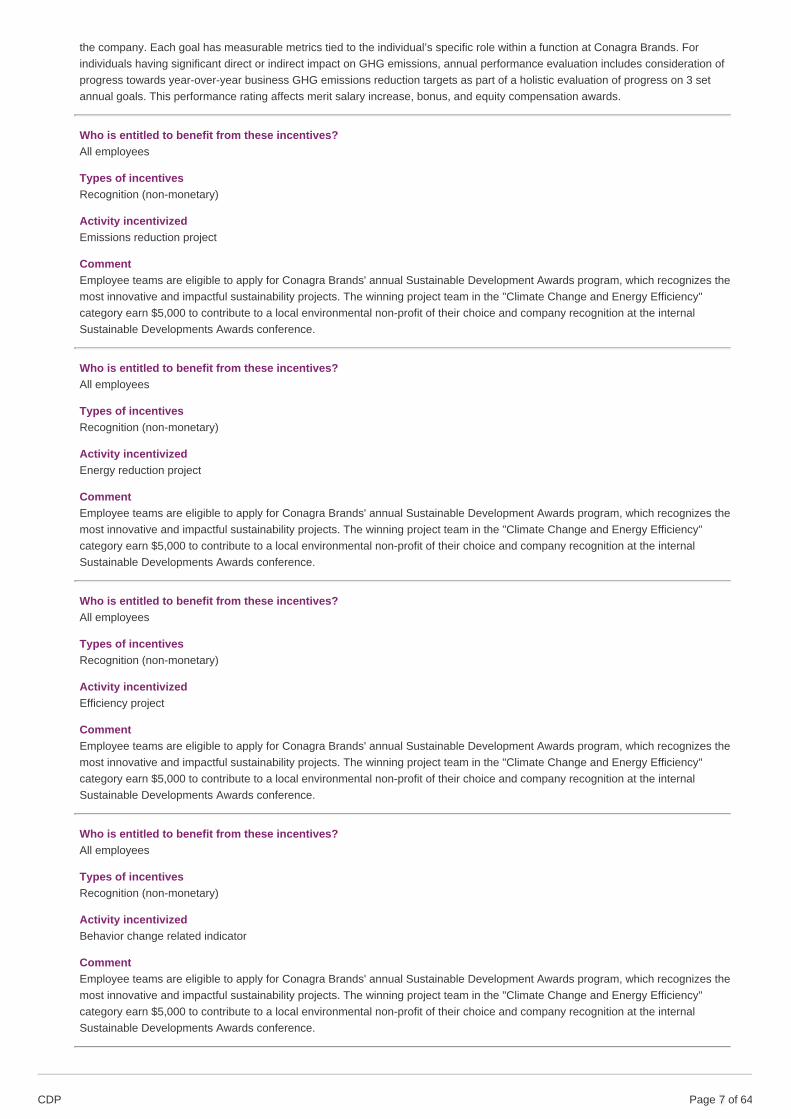
Who is entitled to benefit from these incentives?All employees
Types of incentivesRecognition (non-monetary)
Activity incentivizedEmissions reduction project
CommentEmployee teams are eligible to apply for Conagra Brands' annual Sustainable Development Awards program, which recognizes themost innovative and impactful sustainability projects. The winning project team in the "Climate Change and Energy Efficiency"category earn $5,000 to contribute to a local environmental non-profit of their choice and company recognition at the internalSustainable Developments Awards conference.
Who is entitled to benefit from these incentives?All employees
Types of incentivesRecognition (non-monetary)
Activity incentivizedEnergy reduction project
CommentEmployee teams are eligible to apply for Conagra Brands' annual Sustainable Development Awards program, which recognizes themost innovative and impactful sustainability projects. The winning project team in the "Climate Change and Energy Efficiency"category earn $5,000 to contribute to a local environmental non-profit of their choice and company recognition at the internalSustainable Developments Awards conference.
Who is entitled to benefit from these incentives?All employees
Types of incentivesRecognition (non-monetary)
Activity incentivizedEfficiency project
CommentEmployee teams are eligible to apply for Conagra Brands' annual Sustainable Development Awards program, which recognizes themost innovative and impactful sustainability projects. The winning project team in the "Climate Change and Energy Efficiency"category earn $5,000 to contribute to a local environmental non-profit of their choice and company recognition at the internalSustainable Developments Awards conference.
Who is entitled to benefit from these incentives?All employees
Types of incentivesRecognition (non-monetary)
Activity incentivizedBehavior change related indicator
CommentEmployee teams are eligible to apply for Conagra Brands' annual Sustainable Development Awards program, which recognizes themost innovative and impactful sustainability projects. The winning project team in the "Climate Change and Energy Efficiency"category earn $5,000 to contribute to a local environmental non-profit of their choice and company recognition at the internalSustainable Developments Awards conference.
CDP Page of 647

C2. Risks and opportunities
C2.1
(C2.1) Describe what your organization considers to be short-, medium- and long-term horizons.
From (years) To (years) Comment
Short-term 0 3 Capital plans are developed on a three-year rolling basis
Medium-term 3 5 Capital plans are developed on a three-year rolling basis
Long-term 5 10 Capital plans are developed on a three-year rolling basis
C2.2
(C2.2) Select the option that best describes how your organization's processes for identifying, assessing, and managingclimate-related issues are integrated into your overall risk management.Integrated into multi-disciplinary company-wide risk identification, assessment, and management processes
C2.2a
(C2.2a) Select the options that best describe your organization's frequency and time horizon for identifying and assessingclimate-related risks.
Frequencyofmonitoring
How far intothe futureare risksconsidered?
Comment
Row1
Annually 3 to 6 years The primary tools leveraged by Conagra Brands to identify, assess and respond to climate-related risks include 1) WRI AqueductWater Risk Atlas – Food & Beverage weighting scheme 2) a Supplier Excellence Program sustainability assessment 3) in-houserisk-mapping and 4) international media resources. Recognizing that water scarcity and extreme weather are consequences ofclimate change, Conagra Brands’ sustainability team reviews the Aqueduct Water Risk data and overlays production and currentwater withdrawal data along with internal knowledge to identify and monitor water use at high-risk sites. The Aqueductassessment also includes over 1,500 manufacturing locations for our ingredient and packaging materials to understand riskthroughout supply chain. Quarterly, suppliers respond to Conagra Brands’ 10-question Supplier Excellence sustainabilityassessment and are awarded points based on how they address transparency, sustainable practices, policies and goals aroundSD topics.
C2.2b
(C2.2b) Provide further details on your organization’s process(es) for identifying and assessing climate-related risks.
During fiscal year 2015, we completed a robust materiality assessment process to identify, assess, and prioritize the environmental,social and governance issues relevant to the food industry, our business, and stakeholders. In 2017, we refreshed our materialityanalysis to reflect current business strategy and stakeholder dialogues. The materiality assessment process asks stakeholders forinput based on several factors including financial impact to the business. For example, we need reliable access to ingredients at thequantity and price we expect to operate with continuity. Climate change, water or changes in weather patterns can causeinterruptions which could affect the cost of our ingredients. This refresh process uncovered additional opportunities to focus on theimportance of socially and environmentally responsible sourcing, resulting in a new strategic pillar for Conagra Brands. Today, ourmateriality matrix identifies 21 topics across four strategic pillars: Better Planet, Good Food, Responsible Sourcing and StrongerCommunities.
CDP Page of 648

C2.2c
CDP Page of 649

(C2.2c) Which of the following risk types are considered in your organization's climate-related risk assessments?
Relevance&inclusion
Please explain
Currentregulation
Relevant,alwaysincluded
The World Climate Initiative (WCI or Cap and Trade) regulations has impact on our financial results and planning strategies for ouroperations. To further demonstrate our commitment to complying with environmental laws and regulations and to protecting naturalresources, we have also created and educated employees on five environmental and sustainability policies: Environmental, Compliance,Climate Change, Water Stewardship and Resource Conservation. Through the implementation of a robust Environmental ManagementSystem, we proactively manage environmental issues and share best practices among our facilities around the world. Furthermore,compliance is routinely assessed through internal environmental audits.
Emergingregulation
Relevant,alwaysincluded
We monitor regulation proposed changes as they occur and adapt as required. For example, the proposed expansion of WCI intoOntario has been part of business planning since it was proposed.
Technology Relevant,sometimesincluded
We monitor ongoing changes in technology and evaluate whether adoption of the technology would reduce climate impact as well asimprove financial results. For example, in the past several years, we have investigated and implemented lighting upgrades throughoutour network.
Legal Relevant,alwaysincluded
The World Climate Initiative (WCI or Cap and Trade) regulations has impact on our financial results and planning strategies for ouroperations. To further demonstrate our commitment to complying with environmental laws and regulations and to protecting naturalresources, we have also created and educated employees on five environmental and sustainability policies: Environmental, Compliance,Climate Change, Water Stewardship and Resource Conservation. Through the implementation of a robust Environmental ManagementSystem, we proactively manage environmental issues and share best practices among our facilities around the world. Furthermore,compliance is routinely assessed through internal environmental audits.
Market Relevant,alwaysincluded
Our 2017 materiality assessment identified climate change as a critical issue, which drives ongoing incorporation of climate change risksinto market strategy across our procurement, risk management, environmental, health and safety, operations, and R&D teams. Climatechange mitigation impacts various ways we perform in the marketplace: through our public citizenship goals, ingredient and materialsprocurement strategies, R&D driving product development, and enterprise risk management.
Reputation Relevant,alwaysincluded
Our materiality matrix, published annually in our Citizenship Report, identifies climate change as a critical issue, and includes ourcommitment to decrease GHG emissions per pound of product by 20% by 2020 (2008 baseline). We have significant report contentdedicated to outlining climate change risks, management strategies and progress. Our Citizenship Report is distributed to our Board ofDirectors, investors, media outlets, and promoted to consumers via social media and our website. This report content consistently guidesdialogues about Conagra Brands’ reputation with other external stakeholder groups across the public and private sector.
Acutephysical
Relevant,alwaysincluded
According to the United Nations, water is the primary medium through which we will feel the effects of climate change – specifically, lesspredictable water availability and increased incidences of flooding (UN Water). Water risk is the primary metric through which ConagraBrands measures acute physical risk from climate change. For the past seven years, we’ve mapped each of our facilities against areasof watershed stress. Since fiscal year 2014, we’ve utilized the World Resources Institute’s Aqueduct Water Risk Atlas, which consideredtwelve key indicators of water risk to create global overall water risk maps. Risk indicators include: overall physical risk (quantity &quality), baseline water stress, inter-annual variability, seasonal variability, flood occurrence, drought severity, upstream storage,groundwater stress, return flow ratio, upstream protected land, regulatory & reputation, media coverage, access to water and threatenedamphibians.
Chronicphysical
Relevant,alwaysincluded
Our climate change risk-mapping tools identify and monitor chronic physical impacts of climate change such as drought. The primarytools leveraged by Conagra Brands to identify, assess and respond to climate-related risks include 1) WRI Aqueduct Water Risk Atlas –Food & Beverage weighting scheme 2) a Supplier Excellence Program sustainability assessment 3) in-house risk-mapping and 4)international media resources. Recognizing that water scarcity and extreme weather are consequences of climate change, ConagraBrands’ sustainability team reviews the Aqueduct Water Risk data and overlays production and current water withdrawal data along withinternal company knowledge to identify and monitor water use at high-risk sites. The Aqueduct assessment also includes over 1,500manufacturing locations for our ingredient and packaging materials to understand water risk throughout our supply chain. As risks areidentified, we work closely with suppliers towards resolution. Agriculture specifically is highly dependent on specific climate conditions —such as temperature and precipitation — determining the viability and yield of crops. Ag-based suppliers are a focus area for our supplierassessments and dialogues.
Upstream Relevant,sometimesincluded
Conagra Brands assesses key suppliers quarterly on climate change risk-related performance and disclosure as part of our SupplierExcellence Program. The program comprises approximately 100 suppliers covering ~80% of our spend on ingredients and packaging.We rate suppliers within our Supplier Excellence program based on a review of annual sustainability reports and related documentsprovided to us by the supplier. There are 4 levels of sustainability based on our indicators: • No focus on sustainability • Minimal focus onsustainability • Moderate focus on sustainability • Aligned with sector leaders by following best practices, voluntary industry standards,and engaging in credible collaborations to further sustainability • Mature program & sector leaders by including developing best practicesthat others model, leading voluntary industry standards, and leading credible collaborations to further sustainability. Conagra Brands hassustainability metrics in our Supplier Excellence Program against which suppliers are scored. These metrics include public supplierresponse to CDP water, forestry and investor questionnaires; GRI-compliant reporting; and policy/commitments adequately addressingsustainability risks specific to the supplier’s industry, including climate change.
Downstream Relevant,sometimesincluded
We track, report, and work to reduce downstream emissions associated with transportation through increased use of lower-emissionsforms of transit (e.g. rail) and encouraging our trucking suppliers to increase fleet fuel efficiency. Our reported transportation data includethose that Conagra Brands influences directly. This primarily includes transportation used to move finished products to customers’distribution centers, though there are some exceptions when we manage the transportation of raw ingredients. Currently all of ourtransportation is contracted, and the emissions of those vehicles are categorized as Scope 3 GHG emissions in accordance with theWorld Resources Institute and the World Business Council for Sustainable Development Greenhouse Gas Protocol. This primarilyincludes transportation used to move finished products to customers’ distribution centers, though there are some exceptions when wemanage the transportation of raw ingredients. We have reduced transportation GHG emissions and publish updates in our annualCitizenship Report.
CDP Page of 6410

C2.2d
(C2.2d) Describe your process(es) for managing climate-related risks and opportunities.
During fiscal year 2015, we completed a robust materiality assessment process to identify, assess, and prioritize the environmental,social and governance issues relevant to the food industry, our business, and stakeholders. In 2017, we refreshed our materialityanalysis to reflect current business strategy and stakeholder dialogues. This refresh process uncovered additional opportunities tofocus on the importance of socially and environmentally responsible sourcing, resulting in a new strategic pillar for Conagra Brands.Today, our materiality matrix identifies 21 topics across four strategic pillars: Better Planet, Good Food, Responsible Sourcing andStronger Communities. Risks and opportunities are quantified by our sustainability and risk management teams using bestinformation available, applying a variety of assumptions to establish the range of risk based on different scenarios. The goal of the riskmanagement structure is to embed risk management as part of the management culture throughout the organization. ConagraBrands' climate-related risk management process has five steps: 1. Identify: Uncover, track and spotlight key risk exposures in theenterprise portfolio (e.g. extreme weather, drought) 2. Quantify: Use risk scoring analysis to calculate probability, time to impact andseverity 3. Manage: Assign accountability 4. Mitigate: Applying strategies to eliminate or reduce the possibility or severity of riskexposure 5. Monitor: Continuous review of progress against action plans to mitigate risks The sustainability opportunities we facehave impacts across all functions of the company. To shape our evolving Citizenship strategy, we have a newly appointed cross-functional team of key leaders and subject matter experts in key functional areas to serve as our Citizenship Steering Committee.Guided by our refreshed materiality assessment, the Citizenship Steering Committee is reviewing Conagra Brands’ overallsustainability strategy, goal setting, programming and reporting priorities at a company level. Opportunities tied to managing climatechange risk include improving energy and transportation efficiency, and encouraging sustainable product and process innovation thatcan reduce operating costs, improve climate resiliency, and limit the potential impact of greenhouse regulations. In 2014-2015, wereplaced a boiler at our Oakdale, CA facility to meet state regulation around reduced nitrous oxide levels. In 2015-2016, this boilerwas re-tubed to be more efficient, which led to a reduction in facility greenhouse gas emissions.
C2.3
(C2.3) Have you identified any inherent climate-related risks with the potential to have a substantive financial or strategicimpact on your business?Yes
C2.3a
(C2.3a) Provide details of risks identified with the potential to have a substantive financial or strategic impact on yourbusiness.
IdentifierRisk 1
Where in the value chain does the risk driver occur?Direct operations
Risk typeTransition risk
Primary climate-related risk driverPolicy and legal: Enhanced emissions-reporting obligations
Type of financial impact driverPolicy and legal: Increased operating costs (e.g., higher compliance costs, increased insurance premiums)
Company- specific descriptionThe US EPA’s Greenhouse Gas Mandatory Reporting Rule affects three Conagra Brands facilities, increasing administrative workassociated with annual reporting. Furthermore, one facility in California is subject to the greenhouse gas reporting and verificationrequirements under the California Global Warming Solutions Act. This reporting obligation both increases administrative workassociated with annual reporting and adds contractual expense associated with verification services.
Time horizonShort-term
CDP Page of 6411
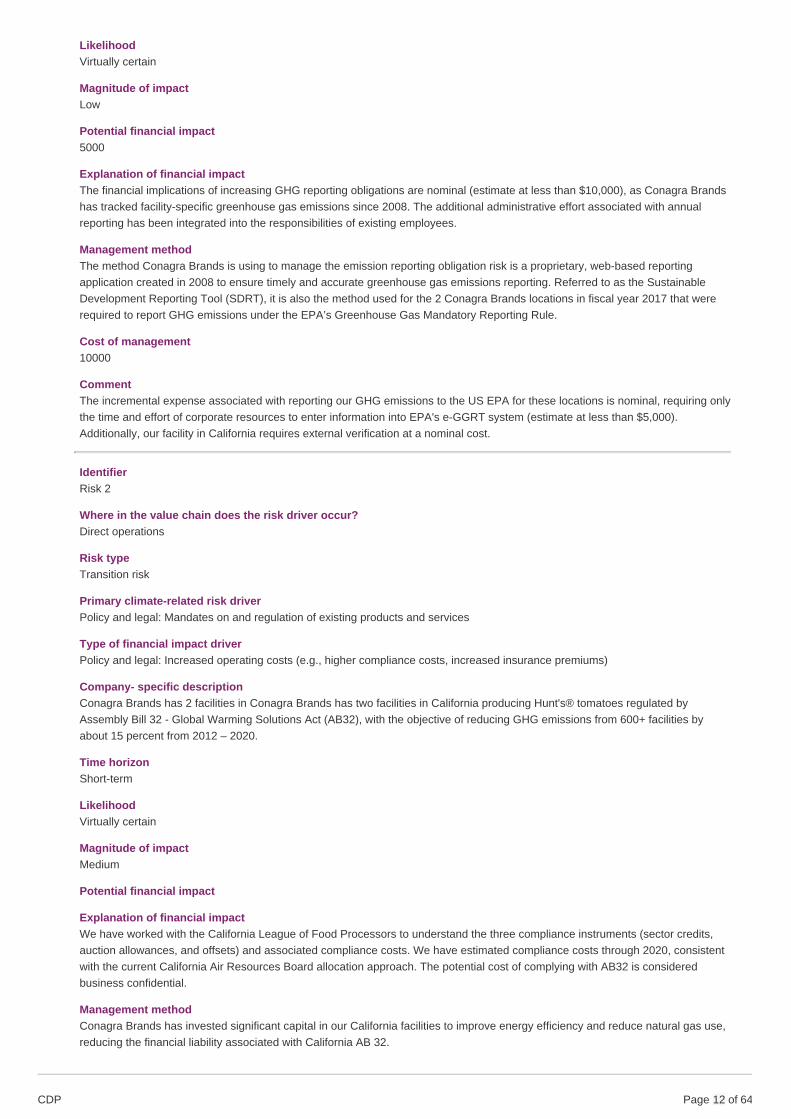
LikelihoodVirtually certain
Magnitude of impactLow
Potential financial impact5000
Explanation of financial impactThe financial implications of increasing GHG reporting obligations are nominal (estimate at less than $10,000), as Conagra Brandshas tracked facility-specific greenhouse gas emissions since 2008. The additional administrative effort associated with annualreporting has been integrated into the responsibilities of existing employees.
Management methodThe method Conagra Brands is using to manage the emission reporting obligation risk is a proprietary, web-based reportingapplication created in 2008 to ensure timely and accurate greenhouse gas emissions reporting. Referred to as the SustainableDevelopment Reporting Tool (SDRT), it is also the method used for the 2 Conagra Brands locations in fiscal year 2017 that wererequired to report GHG emissions under the EPA’s Greenhouse Gas Mandatory Reporting Rule.
Cost of management10000
CommentThe incremental expense associated with reporting our GHG emissions to the US EPA for these locations is nominal, requiring onlythe time and effort of corporate resources to enter information into EPA's e-GGRT system (estimate at less than $5,000).Additionally, our facility in California requires external verification at a nominal cost.
IdentifierRisk 2
Where in the value chain does the risk driver occur?Direct operations
Risk typeTransition risk
Primary climate-related risk driverPolicy and legal: Mandates on and regulation of existing products and services
Type of financial impact driverPolicy and legal: Increased operating costs (e.g., higher compliance costs, increased insurance premiums)
Company- specific descriptionConagra Brands has 2 facilities in Conagra Brands has two facilities in California producing Hunt's® tomatoes regulated byAssembly Bill 32 - Global Warming Solutions Act (AB32), with the objective of reducing GHG emissions from 600+ facilities byabout 15 percent from 2012 – 2020.
Time horizonShort-term
LikelihoodVirtually certain
Magnitude of impactMedium
Potential financial impact
Explanation of financial impactWe have worked with the California League of Food Processors to understand the three compliance instruments (sector credits,auction allowances, and offsets) and associated compliance costs. We have estimated compliance costs through 2020, consistentwith the current California Air Resources Board allocation approach. The potential cost of complying with AB32 is consideredbusiness confidential.
Management methodConagra Brands has invested significant capital in our California facilities to improve energy efficiency and reduce natural gas use,reducing the financial liability associated with California AB 32.
CDP Page of 6412

Cost of management
CommentIncremental expenses include cap-and-trade costs associated with the purchase of allowances, as well as management time.
IdentifierRisk 3
Where in the value chain does the risk driver occur?Supply chain
Risk typePhysical risk
Primary climate-related risk driverChronic: Rising mean temperatures
Type of financial impact driverReduced revenue from decreased production capacity (e.g., transport difficulties, supply chain interruptions)
Company- specific descriptionChanges in mean temperature may affect growing seasons for the agricultural crops we purchase as ingredients. Conagra Brandsmitigates GHGs and climate change risk associated with agriculture by encouraging reduced tillage, responsible use andapplication of nutrients, fertilizers and pesticides among our tomato and popcorn growers.
Time horizonMedium-term
LikelihoodMore likely than not
Magnitude of impactMedium
Potential financial impact
Explanation of financial impactThe potential financial implications of changes in mean temperature resides primarily within our agricultural supply chain. ConagraBrands has not modeled the potential financial implications of this risk due to the uncertainty of affected geographies and respectivetimeframe of impact, and the dynamic nature of our sourcing strategy (for example, many ingredients may be sourced from multiplemarkets).
Management methodTo mitigate these risks, Conagra Brands’ sustainability and procurement team has developed a sourcing strategy. This includes aworking materiality matrix of key ingredients and agricultural commodities identified as critical, strategic or important to sourcesustainably to help mitigate climate change and its impacts (water scarcity, mean temperature changes, precipitation changes, etc.)As part of our ingredient strategy, Conagra Brands’ R&D identifies sustainably advantaged ingredients to design in to our products –including ingredients that can be grown in various climates, are pest resilient, drought tolerant, and otherwise well-positioned tomaintain yields in a climate constrained world. This ingredient strategy also include a sustainability “watch list” of ingredients thatare less likely to thrive at current yields at current geographies given projected temperature and water availability changes, or otherclimate change-induced shifts in availability. As part of our business continuity planning, Conagra Brands has analyzed our supplyrisk to develop strategic partnerships with suppliers, minimize sole-sourced ingredients, and identify alternate suppliers andcontract manufacturers to minimize production disruptions in the instance of an unexpected disruption in supply.
Cost of management
CommentManaging season-to-season variations in crop harvest is something we've managed for decades, and represents no incrementalexpense to our business. Other risk management activities primarily incur only added staff time.
IdentifierRisk 4
Where in the value chain does the risk driver occur?Supply chain
Risk typePhysical risk
CDP Page of 6413

Primary climate-related risk driverChronic: Changes in precipitation patterns and extreme variability in weather patterns
Type of financial impact driverReduced revenue from decreased production capacity (e.g., transport difficulties, supply chain interruptions)
Company- specific descriptionConagra Brands’ Marshall, Mo., facility reduced reliance on local water suppliers by eliminating unnecessary potable water use toclean wastewater screeners in an onsite wastewater treatment plant. By installing a centrifugal pump along with required piping, theplant utilized greywater to clean the screeners. This low-capital solution maintained cleaning quality while saving 5.4 million gallonsof water annually.
Time horizonUnknown
LikelihoodAbout as likely as not
Magnitude of impactMedium
Potential financial impact
Explanation of financial impactThe potential financial implications of changes in mean precipitation resides primarily within our agricultural supply chain. ConagraBrands has not modeled the potential financial implications of this risk due to the uncertainty of affected geographies and respectivetimeframe of impact, and the dynamic nature of our sourcing strategy (for example, many ingredients may be sourced from multiplemarkets). The potential financial impact varies widely based on agricultural commodity purchased and quantity.
Management methodFor crops where Conagra Brands has direct relationships with farmers, we encourage implementation of sustainable agriculturepractices that conserve water, such as drip irrigation (tomatoes) and irrigation systems that only allow water to be ran during thelowest evaporation time to minimize water loss (popcorn). Best practices such as these help to reduce the likelihood and magnitudeof the risk. To mitigate these risks, Conagra Brands’ sustainability and procurement team has developed a sourcing strategy. Thisincludes a working materiality matrix of key ingredients and agricultural commodities identified as critical, strategic or important tosource sustainably to help mitigate climate change and its impacts (water scarcity, mean temperature changes, precipitationchanges, etc.) As part of our ingredient strategy, Conagra Brands’ R&D identifies sustainably advantaged ingredients to design in toour products – including ingredients that can be grown in various climates, are pest resilient, drought tolerant, and otherwise well-positioned to maintain yields in a climate constrained world. This ingredient strategy also include a sustainability “watch list” ofingredients that are less likely to thrive at current yields at current geographies given projected temperature and water availabilitychanges, or other climate change-induced shifts in availability.
Cost of management
CommentManaging season-to-season variations in crop harvest is something we've managed for decades, and represents no incrementalexpense to our business. Other risk management activities primarily incur only added staff time. Working with our grower partnersis fundamental to our business relationship and we have not specifically isolated the costs associated with sustainable agricultureprograms.
C2.4
(C2.4) Have you identified any climate-related opportunities with the potential to have a substantive financial or strategicimpact on your business?Yes
C2.4a
(C2.4a) Provide details of opportunities identified with the potential to have a substantive financial or strategic impact onyour business.
Identifier
CDP Page of 6414

Opp1
Where in the value chain does the opportunity occur?Direct operations
Opportunity typeResource efficiency
Primary climate-related opportunity driverMove to more efficient buildings
Type of financial impact driverIncreased value of fixed assets (e.g., highly rated energy-efficient buildings)
Company- specific descriptionEnergy efficiency incentives can bring projects that fall out-of-scope within current internal return-on-investment thresholds,enabling implementation of projects that without such, would not have been completed.
Time horizonShort-term
LikelihoodVirtually certain
Magnitude of impactLow
Potential financial impact316500
Explanation of financial impact2017 operational sustainability projects nominated as part of Conagra Brands’ Sustainable Development Awards program receivedover $316,500 in government, utility or other incentives (e.g. manufacturer) that may be influenced indirectly by government policiesor regularly incentives.
Strategy to realize opportunityConagra Brands evaluates available incentives, and seeks to match incentives with energy efficiency projects that also provideother business benefits. Projects resulted from this process include capital upgrades, such replacing the centralized chiller at ourMaple Grove, Minn. facility to leverage cold outside air. These actions have increased the likelihood and magnitude of theopportunity; we expect to continue these actions for as long as incentives are able to help reduce capital costs.
Cost to realize opportunity
Comment2017 operational sustainability projects that received incentives generated various equipment costs to implement, and projectpayback times vary.
IdentifierOpp2
Where in the value chain does the opportunity occur?Direct operations
Opportunity typeProducts and services
Primary climate-related opportunity driverDevelopment of new products or services through R&D and innovation
Type of financial impact driverBetter competitive position to reflect shifting consumer preferences, resulting in increased revenues
Company- specific descriptionConagra Brands participates in Grocery Manufacturer Association's (GMA) voluntary standard, SmartLabel™. This programprovides our consumers access to additional details about our products.
Time horizonShort-term
Likelihood
CDP Page of 6415

Likely
Magnitude of impactLow
Potential financial impact
Explanation of financial impactConagra Brands believes the transparency of the SmartLabel™ program will translate into brand loyalty as consumers will be ableto ensure their money is spent on products that align with their own values, including reducing their carbon footprint. While theremay be a future monetary benefit, Conagra Brands has not put a value to it.
Strategy to realize opportunityConagra Brands' Research and Development data team leads the SmartLabel™ initiative, and coordinates with subject matterexperts to ensure relevant data allowed within the standard is collected and included within each product's launch of SmartLabel™.The SmartLabel™ team works closely with the sustainability team to ensure any climate-related impacts are included in the "OtherInformation" drop down
Cost to realize opportunity
CommentCosts to realize this opportunity are minimal. Realizing this opportunity primarily requires staff time to develop appropriate content.
IdentifierOpp3
Where in the value chain does the opportunity occur?Direct operations
Opportunity typeProducts and services
Primary climate-related opportunity driverOther
Type of financial impact driverBetter competitive position to reflect shifting consumer preferences, resulting in increased revenues
Company- specific descriptionConsumers are growing increasingly aware of the environmental issues – including climate change – associated with the productsthey buy. This sentiment may extend to the food that they purchase, influencing purchasing decisions regarding our products.
Time horizonShort-term
LikelihoodAbout as likely as not
Magnitude of impactLow
Potential financial impact
Explanation of financial impactThe financial benefits of changing consumer preferences for sustainability vary by brand within our portfolio. While research hasshown that many millennials are willing to pay more for environmental product attributes, for other consumers, studies indicateprice and convenience are stronger purchase preference drivers than environmental issues such as climate change.
Strategy to realize opportunityTo capitalize on this opportunity, our R&D team designs in sustainable product attributes for brands where research shows that ourtarget consumer prefers products that support general environmental, climate change or water scarcity mitigation. These attributesmay be a processing advantage (e.g. Hunt's® steam peeled tomatoes), local sourcing (dairy for Swiss Miss® cocoa products), orpackaging innovation (the use of How 2 Recycle label on select products).
Cost to realize opportunity
CommentCosts to realize this opportunity are minimal. Realizing this opportunity primarily requires staff time to develop appropriate content.
CDP Page of 6416
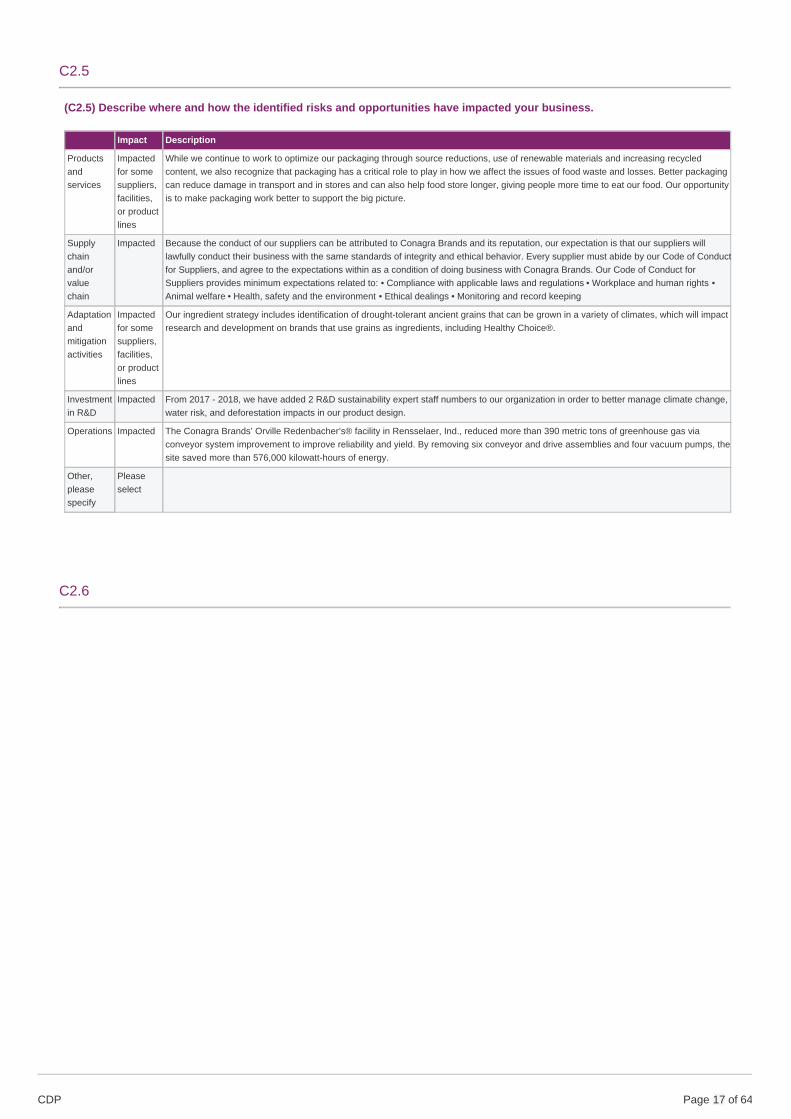
C2.5
(C2.5) Describe where and how the identified risks and opportunities have impacted your business.
Impact Description
Productsandservices
Impactedfor somesuppliers,facilities,or productlines
While we continue to work to optimize our packaging through source reductions, use of renewable materials and increasing recycledcontent, we also recognize that packaging has a critical role to play in how we affect the issues of food waste and losses. Better packagingcan reduce damage in transport and in stores and can also help food store longer, giving people more time to eat our food. Our opportunityis to make packaging work better to support the big picture.
Supplychainand/orvaluechain
Impacted Because the conduct of our suppliers can be attributed to Conagra Brands and its reputation, our expectation is that our suppliers willlawfully conduct their business with the same standards of integrity and ethical behavior. Every supplier must abide by our Code of Conductfor Suppliers, and agree to the expectations within as a condition of doing business with Conagra Brands. Our Code of Conduct forSuppliers provides minimum expectations related to: • Compliance with applicable laws and regulations • Workplace and human rights •Animal welfare • Health, safety and the environment • Ethical dealings • Monitoring and record keeping
Adaptationandmitigationactivities
Impactedfor somesuppliers,facilities,or productlines
Our ingredient strategy includes identification of drought-tolerant ancient grains that can be grown in a variety of climates, which will impactresearch and development on brands that use grains as ingredients, including Healthy Choice®.
Investmentin R&D
Impacted From 2017 - 2018, we have added 2 R&D sustainability expert staff numbers to our organization in order to better manage climate change,water risk, and deforestation impacts in our product design.
Operations Impacted The Conagra Brands’ Orville Redenbacher’s® facility in Rensselaer, Ind., reduced more than 390 metric tons of greenhouse gas viaconveyor system improvement to improve reliability and yield. By removing six conveyor and drive assemblies and four vacuum pumps, thesite saved more than 576,000 kilowatt-hours of energy.
Other,pleasespecify
Pleaseselect
C2.6
CDP Page of 6417
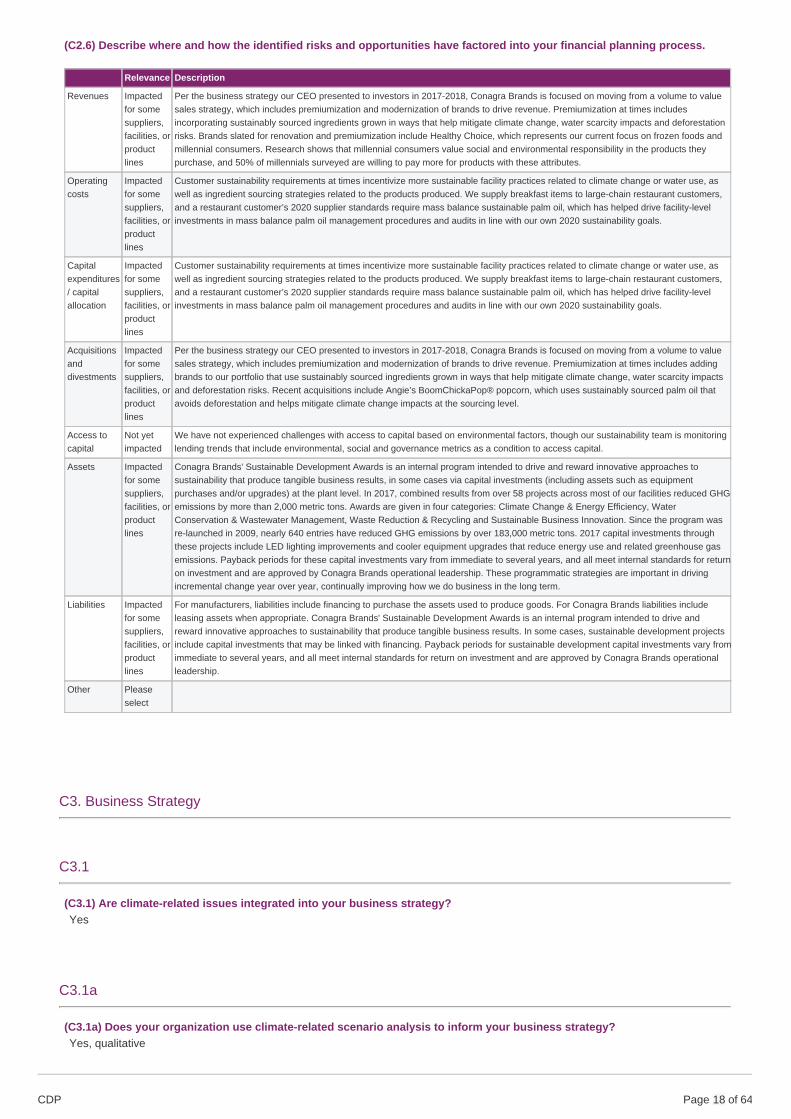
(C2.6) Describe where and how the identified risks and opportunities have factored into your financial planning process.
Relevance Description
Revenues Impactedfor somesuppliers,facilities, orproductlines
Per the business strategy our CEO presented to investors in 2017-2018, Conagra Brands is focused on moving from a volume to valuesales strategy, which includes premiumization and modernization of brands to drive revenue. Premiumization at times includesincorporating sustainably sourced ingredients grown in ways that help mitigate climate change, water scarcity impacts and deforestationrisks. Brands slated for renovation and premiumization include Healthy Choice, which represents our current focus on frozen foods andmillennial consumers. Research shows that millennial consumers value social and environmental responsibility in the products theypurchase, and 50% of millennials surveyed are willing to pay more for products with these attributes.
Operatingcosts
Impactedfor somesuppliers,facilities, orproductlines
Customer sustainability requirements at times incentivize more sustainable facility practices related to climate change or water use, aswell as ingredient sourcing strategies related to the products produced. We supply breakfast items to large-chain restaurant customers,and a restaurant customer’s 2020 supplier standards require mass balance sustainable palm oil, which has helped drive facility-levelinvestments in mass balance palm oil management procedures and audits in line with our own 2020 sustainability goals.
Capitalexpenditures/ capitalallocation
Impactedfor somesuppliers,facilities, orproductlines
Customer sustainability requirements at times incentivize more sustainable facility practices related to climate change or water use, aswell as ingredient sourcing strategies related to the products produced. We supply breakfast items to large-chain restaurant customers,and a restaurant customer’s 2020 supplier standards require mass balance sustainable palm oil, which has helped drive facility-levelinvestments in mass balance palm oil management procedures and audits in line with our own 2020 sustainability goals.
Acquisitionsanddivestments
Impactedfor somesuppliers,facilities, orproductlines
Per the business strategy our CEO presented to investors in 2017-2018, Conagra Brands is focused on moving from a volume to valuesales strategy, which includes premiumization and modernization of brands to drive revenue. Premiumization at times includes addingbrands to our portfolio that use sustainably sourced ingredients grown in ways that help mitigate climate change, water scarcity impactsand deforestation risks. Recent acquisitions include Angie’s BoomChickaPop® popcorn, which uses sustainably sourced palm oil thatavoids deforestation and helps mitigate climate change impacts at the sourcing level.
Access tocapital
Not yetimpacted
We have not experienced challenges with access to capital based on environmental factors, though our sustainability team is monitoringlending trends that include environmental, social and governance metrics as a condition to access capital.
Assets Impactedfor somesuppliers,facilities, orproductlines
Conagra Brands' Sustainable Development Awards is an internal program intended to drive and reward innovative approaches tosustainability that produce tangible business results, in some cases via capital investments (including assets such as equipmentpurchases and/or upgrades) at the plant level. In 2017, combined results from over 58 projects across most of our facilities reduced GHGemissions by more than 2,000 metric tons. Awards are given in four categories: Climate Change & Energy Efficiency, WaterConservation & Wastewater Management, Waste Reduction & Recycling and Sustainable Business Innovation. Since the program wasre-launched in 2009, nearly 640 entries have reduced GHG emissions by over 183,000 metric tons. 2017 capital investments throughthese projects include LED lighting improvements and cooler equipment upgrades that reduce energy use and related greenhouse gasemissions. Payback periods for these capital investments vary from immediate to several years, and all meet internal standards for returnon investment and are approved by Conagra Brands operational leadership. These programmatic strategies are important in drivingincremental change year over year, continually improving how we do business in the long term.
Liabilities Impactedfor somesuppliers,facilities, orproductlines
For manufacturers, liabilities include financing to purchase the assets used to produce goods. For Conagra Brands liabilities includeleasing assets when appropriate. Conagra Brands' Sustainable Development Awards is an internal program intended to drive andreward innovative approaches to sustainability that produce tangible business results. In some cases, sustainable development projectsinclude capital investments that may be linked with financing. Payback periods for sustainable development capital investments vary fromimmediate to several years, and all meet internal standards for return on investment and are approved by Conagra Brands operationalleadership.
Other Pleaseselect
C3. Business Strategy
C3.1
(C3.1) Are climate-related issues integrated into your business strategy?Yes
C3.1a
(C3.1a) Does your organization use climate-related scenario analysis to inform your business strategy?Yes, qualitative
CDP Page of 6418

C-AC3.1b/C-CE3.1b/C-CH3.1b/C-CO3.1b/C-EU3.1b/C-FB3.1b/C-MM3.1b/C-OG3.1b/C-PF3.1b/C-ST3.1b/C-TO3.1b/C-TS3.1b)
(C-AC3.1b/C-CE3.1b/C-CH3.1b/C-CO3.1b/C-EU3.1b/C-FB3.1b/C-MM3.1b/C-OG3.1b/C-PF3.1b/C-ST3.1b/C-TO3.1b/C-TS3.1b)Indicate whether your organization has developed a low-carbon transition plan to support the long-term business strategy.No, we do not have a low-carbon transition plan
C3.1c
(C3.1c) Explain how climate-related issues are integrated into your business objectives and strategy.
Managing and mitigating regulatory, physical, and reputational climate change risks are at the foundation of several goals withinConagra Brands’ 2020 sustainability vision: reducing greenhouse gas emissions and water use; packaging sustainability; and supplychain engagement, including sustainable agriculture. Strategies to achieve these goals result in reduced greenhouse gas emissions –both in our own operations and through our supply chain – while delivering innovation that improves Conagra Brands' resilience toclimate change by adapting to a changing physical and regulatory environment. Our 2020 goal to reduce our greenhouse gasemissions by 20 percent per pound of production influences operational business decisions, and operational projects that include aGHG reduction benefit can receive priority. Our primary objective is to find business improvement opportunities that simultaneouslyimprove environmental and economic performance. Conagra Brands annually implements multiple energy efficiency projects,including streamlined processes and improved manufacturing technologies that lower the environmental impact of production. Amaintenance improvement project at our Hunt’s® facility replaced steam traps to improve manufacturing performance, and alsosaved more than 10,000 decatherms of natural gas, resulting in 545 fewer tons of greenhouse gas emissions. A commitment toclimate change mitigation also drives a substantial business decision around employee involvement. In the early 1990s, ConagraBrands created its Sustainable Development Awards program, which continues to be the cornerstone for engaging employees,recognizing innovations in sustainable production and business practices. This internal awards program calls on employees to submitprojects with imaginative approaches to sustainability such as conserving water, reducing waste, and improving energy efficiency.Awards are given in four categories: Climate Change & Energy Efficiency, Water Conservation & Wastewater Management, WasteReduction & Recycling and Sustainable Business Innovation. This year’s awards conference brought together representatives fromalmost all of our facilities to meet with one another, share best practices and celebrate sustainability improvements. Within our supplychain, our strategies include improving transportation efficiency through pallet optimization or fleet upgrades and improvingpackaging sustainability by reducing packaging density. These programmatic strategies are important in driving incremental changeyear over year, continually improving how we do business in the long term.
C3.1d
(C3.1d) Provide details of your organization’s use of climate-related scenario analysis.
Climate-relatedscenarios
Details
Other,pleasespecify (Inhouserisk-mappingtool)
In addition to the annual WRI Aqueduct water risk analysis we conduct on Conagra Brands’ manufacturing facilities, Conagra Brands employs acustom in-house risk mapping tool that monitors environmental items including extreme weather (hurricanes, snow, tornados and storms) and droughtconditions impacting our supply chain. Each one of our supplier locations in the US is electronically mapped and can be cross-referenced with the latestpublished US government data on drought conditions (National Drought Mitigation Center) and in the US and around the world for extreme weatherevents (National Oceanic and Atmospheric Association & World Meteorological Organization). Our risk management team conducts an analysis oneach supplier location in this database once a year, and communicates threats to our R&D and procurement teams to influence product design andmanufacturing decisions. The risk management team also tracks weather-related transportation disruptions that impact our business in real time, and in2017 this tool helped us track and assess transportation impacts of hurricanes Irma and Harvey in the US Southeast.
C4. Targets and performance
CDP Page of 6419

C4.1
(C4.1) Did you have an emissions target that was active in the reporting year?Intensity target
C4.1b
(C4.1b) Provide details of your emissions intensity target(s) and progress made against those target(s).
Target reference numberInt 1
ScopeScope 1 +2 (market-based)
% emissions in Scope100
% reduction from baseline year20
MetricMetric tons CO2e per unit of production
Base year2008
Start year2008
Normalized baseline year emissions covered by target (metric tons CO2e)0.26
Target year2020
Is this a science-based target?No, but we anticipate setting one in the next 2 years
% achieved (emissions)2.26
Target statusUnderway
Please explainThis is the same target that was reported in last year’s CDP response; however, we have changed the methodology from location-based and are now using market-based emissions. In the previous response, Conagra Brands reported that we had achieved7.15% of the goal; we achieved 2.26% of the goal in 2017. This decrease in progress is primarily due to decreases in productionand emissions, as well as the change in methodology. Conagra Brands continues to work towards the reduction goal.
% change anticipated in absolute Scope 1+2 emissions30.45
% change anticipated in absolute Scope 3 emissions0
C4.2
(C4.2) Provide details of other key climate-related targets not already reported in question C4.1/a/b.
CDP Page of 6420

C4.3
(C4.3) Did you have emissions reduction initiatives that were active within the reporting year? Note that this can includethose in the planning and/or implementation phases.Yes
C4.3a
(C4.3a) Identify the total number of projects at each stage of development, and for those in the implementation stages, theestimated CO2e savings.
Number of projects Total estimated annual CO2e savings in metric tonnes CO2e (only for rows marked *)
Under investigation 0 0
To be implemented* 0 0
Implementation commenced* 0 0
Implemented* 19 5553
Not to be implemented 0 0
C4.3b
(C4.3b) Provide details on the initiatives implemented in the reporting year in the table below.
Activity typeEnergy efficiency: Processes
Description of activityHeat recovery
Estimated annual CO2e savings (metric tonnes CO2e)127
ScopeScope 1
Voluntary/MandatoryVoluntary
Annual monetary savings (unit currency – as specified in CC0.4)20067
Investment required (unit currency – as specified in CC0.4)25000
Payback period1-3 years
Estimated lifetime of the initiative6-10 years
CommentIn 2017, Conagra Brands implemented 19 projects to improve energy efficiency and help lower CO2e emissions. These 19 projectsrange from lighting, process optimization, refrigeration, compressed air, heat recovery, cooling technology and maintenanceprograms.
Activity typeEnergy efficiency: Processes
Description of activity
CDP Page of 6421

Cooling technology
Estimated annual CO2e savings (metric tonnes CO2e)39
ScopeScope 2 (location-based)Scope 2 (market-based)
Voluntary/MandatoryVoluntary
Annual monetary savings (unit currency – as specified in CC0.4)241415
Investment required (unit currency – as specified in CC0.4)369486
Payback period1-3 years
Estimated lifetime of the initiative6-10 years
CommentIn 2017, Conagra Brands implemented 19 projects to improve energy efficiency and help lower CO2e emissions. These 19 projectsrange from lighting, process optimization, refrigeration, compressed air, heat recovery, cooling technology and maintenanceprograms.
Activity typeEnergy efficiency: Building fabric
Description of activityMaintenance program
Estimated annual CO2e savings (metric tonnes CO2e)1380
ScopeScope 2 (location-based)Scope 2 (market-based)
Voluntary/MandatoryVoluntary
Annual monetary savings (unit currency – as specified in CC0.4)187060
Investment required (unit currency – as specified in CC0.4)20000
Payback period<1 year
Estimated lifetime of the initiative6-10 years
CommentIn 2017, Conagra Brands implemented 19 projects to improve energy efficiency and help lower CO2e emissions. These 19 projectsrange from lighting, process optimization, refrigeration, compressed air, heat recovery, cooling technology and maintenanceprograms.
Activity typeEnergy efficiency: Processes
Description of activityCompressed air
Estimated annual CO2e savings (metric tonnes CO2e)
CDP Page of 6422

157
ScopeScope 2 (location-based)Scope 2 (market-based)
Voluntary/MandatoryVoluntary
Annual monetary savings (unit currency – as specified in CC0.4)29597
Investment required (unit currency – as specified in CC0.4)148022
Payback period4 - 10 years
Estimated lifetime of the initiative6-10 years
CommentIn 2017, Conagra Brands implemented 19 projects to improve energy efficiency and help lower CO2e emissions. These 19 projectsrange from lighting, process optimization, refrigeration, compressed air, heat recovery, cooling technology and maintenanceprograms.
Activity typeEnergy efficiency: Processes
Description of activityRefrigeration
Estimated annual CO2e savings (metric tonnes CO2e)0.28
ScopeScope 2 (location-based)Scope 2 (market-based)
Voluntary/MandatoryVoluntary
Annual monetary savings (unit currency – as specified in CC0.4)2246
Investment required (unit currency – as specified in CC0.4)12000
Payback period4 - 10 years
Estimated lifetime of the initiative6-10 years
CommentIn 2017, Conagra Brands implemented 19 projects to improve energy efficiency and help lower CO2e emissions. These 19 projectsrange from lighting, process optimization, refrigeration, compressed air, heat recovery, cooling technology and maintenanceprograms.
Activity typeEnergy efficiency: Building services
Description of activityLighting
Estimated annual CO2e savings (metric tonnes CO2e)2798
Scope
CDP Page of 6423

Scope 2 (location-based)Scope 2 (market-based)
Voluntary/MandatoryVoluntary
Annual monetary savings (unit currency – as specified in CC0.4)325989
Investment required (unit currency – as specified in CC0.4)1009233
Payback period4 - 10 years
Estimated lifetime of the initiative6-10 years
CommentIn 2017, Conagra Brands implemented 19 projects to improve energy efficiency and help lower CO2e emissions. These 19 projectsrange from lighting, process optimization, refrigeration, compressed air, heat recovery, cooling technology and maintenanceprograms.
Activity typeEnergy efficiency: Processes
Description of activityProcess optimization
Estimated annual CO2e savings (metric tonnes CO2e)1048
ScopeScope 2 (location-based)Scope 2 (market-based)
Voluntary/MandatoryVoluntary
Annual monetary savings (unit currency – as specified in CC0.4)286389
Investment required (unit currency – as specified in CC0.4)993131
Payback period4 - 10 years
Estimated lifetime of the initiative6-10 years
CommentIn 2017, Conagra Brands implemented 19 projects to improve energy efficiency and help lower CO2e emissions. These 19 projectsrange from lighting, process optimization, refrigeration, compressed air, heat recovery, cooling technology and maintenanceprograms.
C4.3c
CDP Page of 6424

(C4.3c) What methods do you use to drive investment in emissions reduction activities?
Method Comment
Employeeengagement
Many of Conagra Brands' manufacturing facilities have active Green Teams that engage employees in our journey towards our 2020greenhouse gas reduction target and other sustainability goals. We'e also integrated sustainability into the Conagra Brands PerformanceSystem (CPS), the company's continuous improvement program to eliminate losses of any kind, including energy. The program guidesfocused improvement, maintenance, and lean manufacturing efforts to increase line efficiency.
Internalincentives/recognitionprograms
Conagra Brands' Sustainable Development Awards is an internal program intended to drive and reward innovative approaches tosustainability that produce tangible business results. This year, combined results from over 58 entries reduced GHG emissions by more than2,000 metric tons. Since the program was re-launched in 2009, nearly 640 entries have reduced GHG emissions by over 183,000 metrictons.
Internalincentives/recognitionprograms
Conagra Brands' Supply Chain Leadership (EHS, Operations, Engineering, and Continuous Improvement), Plant Managers, and many oftheir direct reports are accountable to achieving year-over-year GHG reductions as part of their annual performance evaluation, whichdirectly impacts merit salary increase, bonus, and equity compensation awards.
C4.5
(C4.5) Do you classify any of your existing goods and/or services as low-carbon products or do they enable a third party toavoid GHG emissions?No
C5. Emissions methodology
C5.1
CDP Page of 6425

(C5.1) Provide your base year and base year emissions (Scopes 1 and 2).
Scope 1
Base year startMay 28 2007
Base year endMay 27 2008
Base year emissions (metric tons CO2e)406323.4
CommentThe base year emissions were recalculated to remove data related to our Lamb Weston divestiture.
Scope 2 (location-based)
Base year startMay 28 2007
Base year endMay 27 2008
Base year emissions (metric tons CO2e)474485.2
CommentThe base year emissions were recalculated to remove data related to our Lamb Weston divestiture.
Scope 2 (market-based)
Base year startMay 28 2007
Base year endMay 27 2008
Base year emissions (metric tons CO2e)474485.2
CommentThe base year emissions were recalculated to remove data related to our Lamb Weston divestiture.
C5.2
(C5.2) Select the name of the standard, protocol, or methodology you have used to collect activity data and calculate Scope1 and Scope 2 emissions.The Climate Registry: General Reporting ProtocolThe Greenhouse Gas Protocol: A Corporate Accounting and Reporting Standard (Revised Edition)US EPA Climate Leaders: Indirect Emissions from Purchases/ Sales of Electricity and SteamUS EPA Mandatory Greenhouse Gas Reporting Rule
C6. Emissions data
C6.1
CDP Page of 6426

(C6.1) What were your organization’s gross global Scope 1 emissions in metric tons CO2e?
Row 1
Gross global Scope 1 emissions (metric tons CO2e)347020
End-year of reporting period<Not Applicable>
Comment
C6.2
(C6.2) Describe your organization’s approach to reporting Scope 2 emissions.
Row 1
Scope 2, location-basedWe are reporting a Scope 2, location-based figure
Scope 2, market-basedWe are reporting a Scope 2, market-based figure
Comment
C6.3
(C6.3) What were your organization’s gross global Scope 2 emissions in metric tons CO2e?
Row 1
Scope 2, location-based379704
Scope 2, market-based (if applicable)363383
End-year of reporting period<Not Applicable>
Comment
C6.4
(C6.4) Are there any sources (e.g. facilities, specific GHGs, activities, geographies, etc.) of Scope 1 and Scope 2 emissionsthat are within your selected reporting boundary which are not included in your disclosure?Yes
C6.4a
CDP Page of 6427

(C6.4a) Provide details of the sources of Scope 1 and Scope 2 emissions that are within your selected reporting boundarywhich are not included in your disclosure.
SourceConagra Brands' Blake's Facility in Concord, NH
Relevance of Scope 1 emissions from this sourceEmissions are not relevant
Relevance of location-based Scope 2 emissions from this sourceEmissions are not relevant
Relevance of market-based Scope 2 emissions from this source (if applicable)Emissions are not relevant
Explain why the source is excludedConagra Brands has not yet integrated our Concord, NH facility into our sustainability reporting due to its size and structure. Thisfacility represents less than 0.2% of our total production, resulting in emissions that will not substantially change our carbonfootprint.
C6.5
(C6.5) Account for your organization’s Scope 3 emissions, disclosing and explaining any exclusions.
Purchased goods and services
Evaluation statusRelevant, not yet calculated
Metric tonnes CO2e
Emissions calculation methodology
Percentage of emissions calculated using data obtained from suppliers or value chain partners
ExplanationConagra Brands has not quantified the greenhouse gas emissions associated with the extraction, production, and transportation ofpurchased goods and services
Capital goods
Evaluation statusRelevant, not yet calculated
Metric tonnes CO2e
Emissions calculation methodology
Percentage of emissions calculated using data obtained from suppliers or value chain partners
ExplanationConagra Brands' requires use of a variety of capital goods to make our products. Conagra Brands has not evaluated whether thegreenhouse gas emissions associated with the extraction, production, and transportation of purchased or acquired capital goods isa relevant Scope 3 emissions source.
Fuel-and-energy-related activities (not included in Scope 1 or 2)
Evaluation statusRelevant, not yet calculated
Metric tonnes CO2e
Emissions calculation methodology
Percentage of emissions calculated using data obtained from suppliers or value chain partners
ExplanationConagra Brands has not quantified the greenhouse gas emissions associated with the fuel and energy related activities notincluded within Scope 1 or 2.
CDP Page of 6428

Upstream transportation and distribution
Evaluation statusRelevant, calculated
Metric tonnes CO2e314960
Emissions calculation methodologyConagra Brands calculates GHG emissions resulting from contracted transportation, including diesel trucks, intermodal, and rail.Our transportation reporting boundary includes finished product transport, as well as some raw product transport where ConagraBrands is responsible for contracting transportation. Primary data used includes mode of transportation, mileage, and volume ofproduct transported. greenhouse gas emissions are calculated using the EPA's Climate Leaders Greenhouse Gas InventoryProtocol Core Module Guidance Optional Emissions from Commuting, Business Travel, and Product Transport, May 2008(available online at: http://www.epa.gov/climateleadership/documents/resources/commute_travel_product.pdf). The methodologyand emission factors used have been verified by a third-party (see attached verification statement).
Percentage of emissions calculated using data obtained from suppliers or value chain partners100
ExplanationFiscal year 2017 is the ninth year that Conagra Brands quantified the greenhouse gas emissions associated with the transportationand distribution of finished products sold between our operations and warehouses and our customers' locations or distributioncenters. Reported emissions include those resulting from transportation managed and paid by Conagra Brands and not thoseassociated with transportation managed by customers. Conagra Brands has not quantified the greenhouse gas emissionsassociated with the transportation and distribution of purchased raw ingredients and packaging materials between our tier 1suppliers and our own operations during fiscal year 2017. Since Conagra Brands does not directly contract for transportation at thisstage of the value chain, primary data is difficult to obtain.
Waste generated in operations
Evaluation statusNot relevant, calculated
Metric tonnes CO2e15575
Emissions calculation methodologyConagra Brands calculates greenhouse gas emissions associated with sending waste to landfill and avoided greenhouse gasemissions associated with various waste diversion and reduction strategies using the United states Environmental ProtectionAgency’s Waste Reduction Model (WARM) Tool version 14, created to help organizations track and voluntarily report greenhousegas emissions. Conagra Brands categorizes solid waste generated from our facilities into the following WARM Tool categories andapplies the respective GHG emissions factors or avoided GHG emissions factor: aluminum (-9.11 metric tons CO2e per tonrecycled), corrugated cardboard (-3.12 metric tons CO2e per ton recycled), food oil/grease (-0.06 metric tons CO2e per tondiverted), food scraps (10% loss rate, -0.43 metric tons CO2e per ton composted and -0.06 metric tons CO2e per ton of materialanaerobically digested), landfill (0.35 metric tons CO2e per ton landfilled), mixed metals (-4.34 metric tons CO2e per ton recycled),mixed paper (-3.53 metric tons CO2e per ton recycled), mixed plastics (-1.02 metric tons CO2e per ton recycled), mixed recyclables(-2.82 metric tons CO2e per ton recycled), waste to energy (-0.07 metric tons CO2e per ton), wastewater sludge (-0.06 metric tonsCO2e per ton diverted), and wood (-2.46 metric tons CO2e per ton diverted). Additional information regarding the EPA's WARMmodel is available online at: https://www.epa.gov/warm.
Percentage of emissions calculated using data obtained from suppliers or value chain partners100
ExplanationFiscal year 2017 marked the sixth year that Conagra Brands quantified the greenhouse gas emissions associated with disposal andtreatment of waste generated in our operations. Calculated emissions are less than 3 percent of Conagra Brands Scope 1 and 2emissions.
CDP Page of 6429

Business travel
Evaluation statusNot relevant, explanation provided
Metric tonnes CO2e
Emissions calculation methodologyConagra Brands has previously calculated business travel GHG emissions using actual rental car miles driven and air miles flownunder corporate contracts centrally managed by a third-party travel agency. Greenhouse gas emissions were calculated using theEPA's Climate Leaders Greenhouse Gas Inventory Protocol Core Module Guidance Optional Emissions from Commuting,Business Travel, and Product Transport, May 2008.
Percentage of emissions calculated using data obtained from suppliers or value chain partners
ExplanationFiscal year 2012 was the last year that Conagra Brands quantified the greenhouse gas emissions associated with transportation ofemployees for business related travel. Each year emissions were less than 2.4 percent of Conagra Brands Scope 1 and 2emissions excluding Lamb Weston.
Employee commuting
Evaluation statusNot relevant, explanation provided
Metric tonnes CO2e
Emissions calculation methodology
Percentage of emissions calculated using data obtained from suppliers or value chain partners
ExplanationTypically for manufacturing-based companies, the greenhouse gas emissions associated with employees commuting betweenhome and worksites is not a relevant emissions source.
Upstream leased assets
Evaluation statusNot relevant, explanation provided
Metric tonnes CO2e
Emissions calculation methodology
Percentage of emissions calculated using data obtained from suppliers or value chain partners
ExplanationConagra Brands did not operate any notable leased assets that were not reported as part of our Scope 1 and 2 greenhouse gasemissions; therefore, the greenhouse gas emissions associated with the operation of upstream leased assets was not a relevantScope 3 emissions source during fiscal year 2017.
Downstream transportation and distribution
Evaluation statusRelevant, not yet calculated
Metric tonnes CO2e
Emissions calculation methodology
Percentage of emissions calculated using data obtained from suppliers or value chain partners
ExplanationConagra Brands has not quantified transportation and distribution of products sold by the reporting company between ouroperations and the end consumer. Since this transportation is paid and managed by our end consumer, primary data is difficult toobtain.
CDP Page of 6430
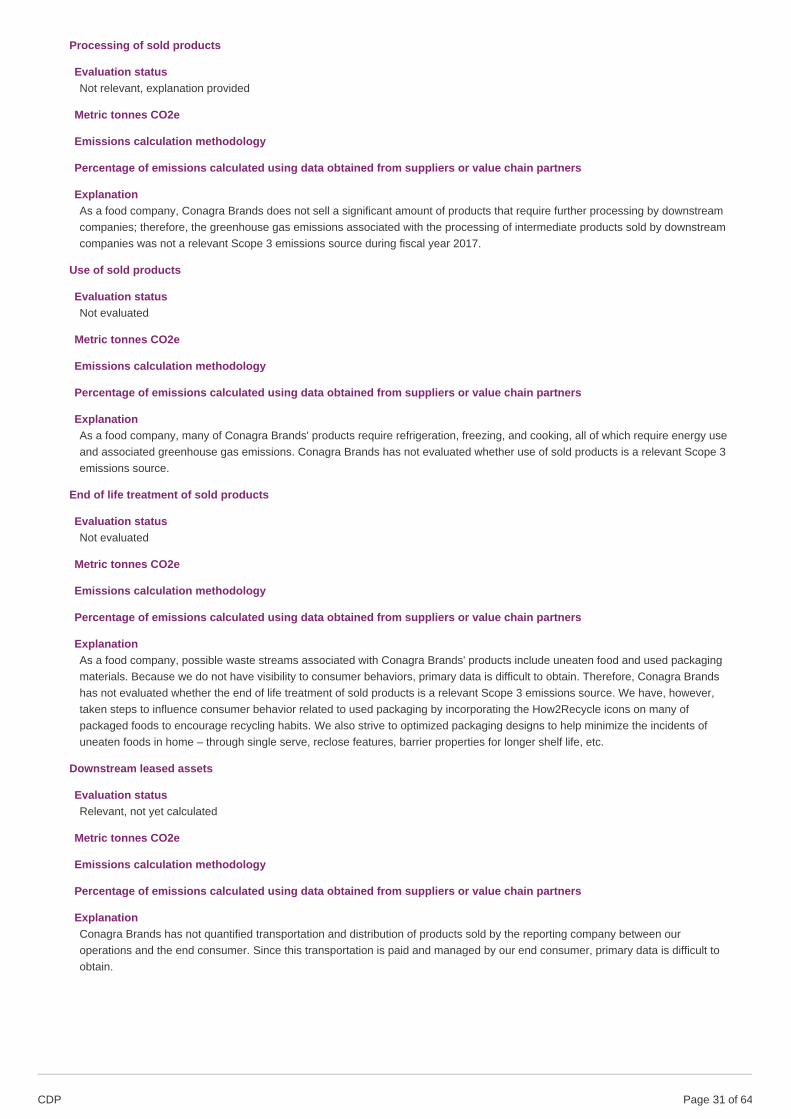
Processing of sold products
Evaluation statusNot relevant, explanation provided
Metric tonnes CO2e
Emissions calculation methodology
Percentage of emissions calculated using data obtained from suppliers or value chain partners
ExplanationAs a food company, Conagra Brands does not sell a significant amount of products that require further processing by downstreamcompanies; therefore, the greenhouse gas emissions associated with the processing of intermediate products sold by downstreamcompanies was not a relevant Scope 3 emissions source during fiscal year 2017.
Use of sold products
Evaluation statusNot evaluated
Metric tonnes CO2e
Emissions calculation methodology
Percentage of emissions calculated using data obtained from suppliers or value chain partners
ExplanationAs a food company, many of Conagra Brands' products require refrigeration, freezing, and cooking, all of which require energy useand associated greenhouse gas emissions. Conagra Brands has not evaluated whether use of sold products is a relevant Scope 3emissions source.
End of life treatment of sold products
Evaluation statusNot evaluated
Metric tonnes CO2e
Emissions calculation methodology
Percentage of emissions calculated using data obtained from suppliers or value chain partners
ExplanationAs a food company, possible waste streams associated with Conagra Brands' products include uneaten food and used packagingmaterials. Because we do not have visibility to consumer behaviors, primary data is difficult to obtain. Therefore, Conagra Brandshas not evaluated whether the end of life treatment of sold products is a relevant Scope 3 emissions source. We have, however,taken steps to influence consumer behavior related to used packaging by incorporating the How2Recycle icons on many ofpackaged foods to encourage recycling habits. We also strive to optimized packaging designs to help minimize the incidents ofuneaten foods in home – through single serve, reclose features, barrier properties for longer shelf life, etc.
Downstream leased assets
Evaluation statusRelevant, not yet calculated
Metric tonnes CO2e
Emissions calculation methodology
Percentage of emissions calculated using data obtained from suppliers or value chain partners
ExplanationConagra Brands has not quantified transportation and distribution of products sold by the reporting company between ouroperations and the end consumer. Since this transportation is paid and managed by our end consumer, primary data is difficult toobtain.
CDP Page of 6431

Franchises
Evaluation statusNot relevant, explanation provided
Metric tonnes CO2e
Emissions calculation methodology
Percentage of emissions calculated using data obtained from suppliers or value chain partners
ExplanationConagra Brands is not involved in any franchise operations; therefore, the greenhouse gas emissions associated with the operationof franchises was not a relevant Scope 3 emissions source during fiscal year 2017.
Investments
Evaluation statusRelevant, not yet calculated
Metric tonnes CO2e
Emissions calculation methodology
Percentage of emissions calculated using data obtained from suppliers or value chain partners
ExplanationConagra Brands has investments in several joint ventures.
Other (upstream)
Evaluation status
Metric tonnes CO2e
Emissions calculation methodology
Percentage of emissions calculated using data obtained from suppliers or value chain partners
Explanation
Other (downstream)
Evaluation status
Metric tonnes CO2e
Emissions calculation methodology
Percentage of emissions calculated using data obtained from suppliers or value chain partners
Explanation
C-AC6.6/C-FB6.6/C-PF6.6
(C-AC6.6/C-FB6.6/C-PF6.6) Can you breakdown your Scope 3 emissions by relevant business activity areas?No
C-AC6.6b/C-FB6.6b/C-PF6.6b
CDP Page of 6432

(C-AC6.6b/C-FB6.6b/C-PF6.6b) Why can you not report your Scope 3 emissions by business activity area?
Row 1
Primary reasonWe are planning to include in the next two years
Please explainConagra Brands does not own or operate any agriculture facilities, though we source agricultural ingredients for our products. Weplan to review Scope 3 emissions as part of future GHG reduction goal setting efforts, which may include agriculture emissions ifthey are deemed material to setting a science-based GHG goal.
C6.7
(C6.7) Are carbon dioxide emissions from biologically sequestered carbon relevant to your organization?No
C-AC6.8/C-FB6.8/C-PF6.8
(C-AC6.8/C-FB6.8/C-PF6.8) Is biogenic carbon pertaining to your direct operations relevant to your current CDP climatechange disclosure?Yes
C-AC6.8a/C-FB6.8a/C-PF6.8a
(C-AC6.8a/C-FB6.8a/C-PF6.8a) Account for biogenic carbon data pertaining to your direct operations and identify anyexclusions.
CO2 emissions from biofuel combustion (processing/manufacturing machinery)
Emissions (metric tons CO2)7.06
MethodologyDefault emissions factors
Please explainConagra Brands utilizes the Climate Registry emissions factors to calculate biogas-related emissions. Scope 1- Biogas to BoilerIrapuato = 2.2714 Scope 1- Biogas to Flare Irapuato = 4.7888
CO2 emissions from biofuel combustion (other)
Emissions (metric tons CO2)
MethodologyPlease select
Please explain
C-AC6.9/C-FB6.9/C-PF6.9
CDP Page of 6433

(C-AC6.9/C-FB6.9/C-PF6.9) Do you collect or calculate greenhouse gas emissions for each commodity reported assignificant to your business in C-AC0.7/FB0.7/PF0.7?
Agricultural commoditiesTimber
Do you collect or calculate GHG emissions for this commodity?No, not currently but intend to collect or calculate this data within the next two years
Please explainWe plan to review Conagra Brands Scope 3 emissions as part of future GHG reduction goal setting efforts, which may includecalculating emissions on this commodity to the extent it is material to setting a science-based GHG goal.
Agricultural commoditiesSoy
Do you collect or calculate GHG emissions for this commodity?No, not currently but intend to collect or calculate this data within the next two years
Please explainWe plan to review Conagra Brands Scope 3 emissions as part of future GHG reduction goal setting efforts, which may includecalculating emissions on this commodity to the extent it is material to setting a science-based GHG goal.
Agricultural commoditiesPalm Oil
Do you collect or calculate GHG emissions for this commodity?No, not currently but intend to collect or calculate this data within the next two years
Please explainWe plan to review Conagra Brands Scope 3 emissions as part of future GHG reduction goal setting efforts, which may includecalculating emissions on this commodity to the extent it is material to setting a science-based GHG goal.
Agricultural commoditiesCattle products
Do you collect or calculate GHG emissions for this commodity?No, not currently but intend to collect or calculate this data within the next two years
Please explainWe plan to review Conagra Brands Scope 3 emissions as part of future GHG reduction goal setting efforts, which may includecalculating emissions on this commodity to the extent it is material to setting a science-based GHG goal.
C6.10
CDP Page of 6434
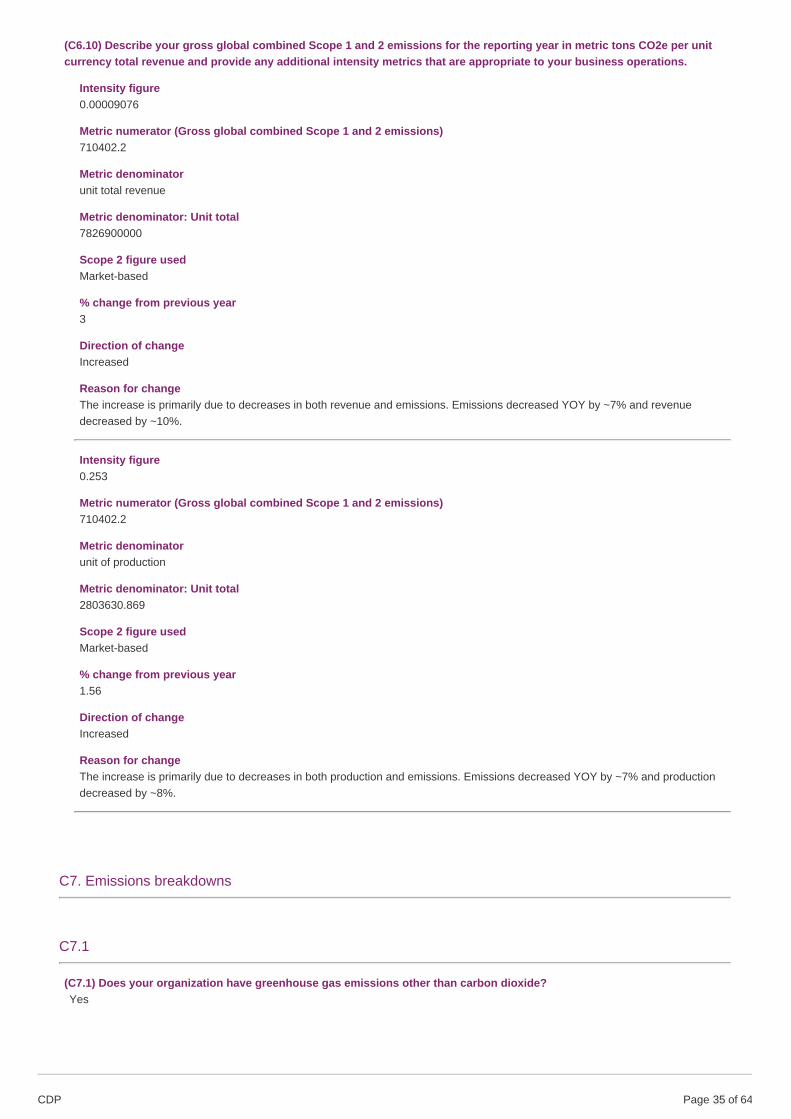
(C6.10) Describe your gross global combined Scope 1 and 2 emissions for the reporting year in metric tons CO2e per unitcurrency total revenue and provide any additional intensity metrics that are appropriate to your business operations.
Intensity figure0.00009076
Metric numerator (Gross global combined Scope 1 and 2 emissions)710402.2
Metric denominatorunit total revenue
Metric denominator: Unit total7826900000
Scope 2 figure usedMarket-based
% change from previous year3
Direction of changeIncreased
Reason for changeThe increase is primarily due to decreases in both revenue and emissions. Emissions decreased YOY by ~7% and revenuedecreased by ~10%.
Intensity figure0.253
Metric numerator (Gross global combined Scope 1 and 2 emissions)710402.2
Metric denominatorunit of production
Metric denominator: Unit total2803630.869
Scope 2 figure usedMarket-based
% change from previous year1.56
Direction of changeIncreased
Reason for changeThe increase is primarily due to decreases in both production and emissions. Emissions decreased YOY by ~7% and productiondecreased by ~8%.
C7. Emissions breakdowns
C7.1
(C7.1) Does your organization have greenhouse gas emissions other than carbon dioxide?Yes
CDP Page of 6435

C7.1a
(C7.1a) Break down your total gross global Scope 1 emissions by greenhouse gas type and provide the source of each usedgreenhouse warming potential (GWP).
Greenhouse gas Scope 1 emissions (metric tons of CO2e) GWP Reference
CO2 331235 IPCC Fourth Assessment Report (AR4 - 100 year)
CH4 149.67 IPCC Fourth Assessment Report (AR4 - 100 year)
N2O 14577.15 IPCC Fourth Assessment Report (AR4 - 100 year)
HFCs 1057.71 IPCC Fourth Assessment Report (AR4 - 100 year)
C7.2
(C7.2) Break down your total gross global Scope 1 emissions by country/region.
Country/Region Scope 1 emissions (metric tons CO2e)
United States of America 328792
Canada 11193
Mexico 7034
C7.3
(C7.3) Indicate which gross global Scope 1 emissions breakdowns you are able to provide.By business divisionBy facility
C7.3a
(C7.3a) Break down your total gross global Scope 1 emissions by business division.
Business division Scope 1 emissions (metric ton CO2e)
Frozen 85052
International 18228
Corporate Offices 7681
Food Service 20059
Frozen 85052
Grocery 175062
International 18228
Snacks 40937
C7.3b
CDP Page of 6436

(C7.3b) Break down your total gross global Scope 1 emissions by business facility.
Facility Scope 1 emissions (metric tons CO2e) Latitude Longitude
ARCHBOLD OH 11202 41.52144 -84.307172
BOISBRIAND QC 1523 45.612634 -73.838373
BROOKSTON IN 182 40.602814 -86.867234
COUNCIL BLUFFS IA 6583 41.261944 -95.860833
DICKSON TN 872 36.077005 -87.38779
DRESDEN ON 9670 42.589561 -82.183314
FRESNO CA 1601 36.737798 -119.787125
HAMBURG IA 154 40.604446 -95.657771
HUMBOLDT TN 2887 35.819792 -88.915895
INDIANAPOLIS IN TBS 24589 39.86947 -86.234079
INDIANAPOLIS IN FROZEN PIES 3290 39.86947 -86.234079
IRAPUATO MX 7034 20.678665 -101.354496
KENT WA 5349 47.380933 -122.234843
LAKEVIEW IA 27 42.31165 -95.053324
LINCOLN NE 2434 40.813616 -96.702596
LOUISVILLE KY 11824 38.218491 -85.75812
MACON MO 11868 39.742256 -92.472686
MAPLE GROVE MN 2068 45.072464 -93.455788
MARSHALL MO 9062 39.123078 -93.19687
MEMPHIS TN 19064 35.149534 -90.04898
MENOMONIE WI 13346 44.875518 -91.919342
MILTON PA 31950 41.01203 -76.847741
NEWPORT TN 19692 35.967041 -83.187658
OAKDALE CA 69650 37.766595 -120.847154
OMAHA NE (6 CAG DR) 1622 41.256537 -95.934503
OMAHA NE (9 CAG DR) 42 41.256537 -95.934503
QUINCY MI 8073 41.944215 -84.883852
RENSSELAER IN 420 40.936704 -87.150856
RUSSELLVILLE AR 20714 35.278417 -93.133786
ST. LOUIS MO 599 38.637338 -90.307709
STREATOR IL 841 41.120867 -88.835352
SYLVESTER GA 2971 31.530735 -83.835454
TRENTON MO 19693 40.078902 -93.616607
TROY OH 8291 40.039498 -84.203277
WATERLOO IA 11816 42.492786 -92.342578
7200 World Communications Drive 9
OMAHA NE (11 CAG DR) 42 41.256537 -95.934503
OMAHA NE (5 CAG DR) 36 41.256537 -95.934503
OMAHA NE (1 CAG DR) 43 41.256537 -95.934503
Service Center (7350 World Com Dr) 11
Corp Fleet 1456
Corp Jet 4419
C-AC7.4/C-FB7.4/C-PF7.4
(C-AC7.4/C-FB7.4/C-PF7.4) Do you include emissions pertaining to your business activity(ies) in your direct operations aspart of your global gross Scope 1 figure?Yes
CDP Page of 6437

C-AC7.4b/C-FB7.4b/C-PF7.4b
(C-AC7.4b/C-FB7.4b/C-PF7.4b) Report the Scope 1 emissions pertaining to your business activity(ies) and explain anyexclusions. If applicable, disaggregate your agricultural/forestry by GHG emissions category.
ActivityProcessing/Manufacturing
Emissions category<Not Applicable>
Emissions (metric tons CO2e)347020
MethodologyDefault emissions factor
Please explain
C7.5
(C7.5) Break down your total gross global Scope 2 emissions by country/region.
Country/Region Scope 2, location-based (metric tonsCO2e)
Scope 2, market-based (metric tonsCO2e)
Purchased and consumedelectricity, heat, steam orcooling (MWh)
Purchased and consumed low-carbon electricity, heat,steam or cooling accounted in market-based approach(MWh)
United States ofAmerica
374144 357823 630586 13999
Canada 266 266 12481 0
Mexico 5293 5293 9626 0
C7.6
(C7.6) Indicate which gross global Scope 2 emissions breakdowns you are able to provide.By business divisionBy facility
C7.6a
(C7.6a) Break down your total gross global Scope 2 emissions by business division.
Business division Scope 2, location-based emissions (metric tons CO2e) Scope 2, market-based emissions (metric tons CO2e)
Corporate Offices 15553 15553
Food Service 29317 29788
Frozen 174103 174103
Grocery 84462 81615
International 5559 5559
Snacks 70709 56764
CDP Page of 6438
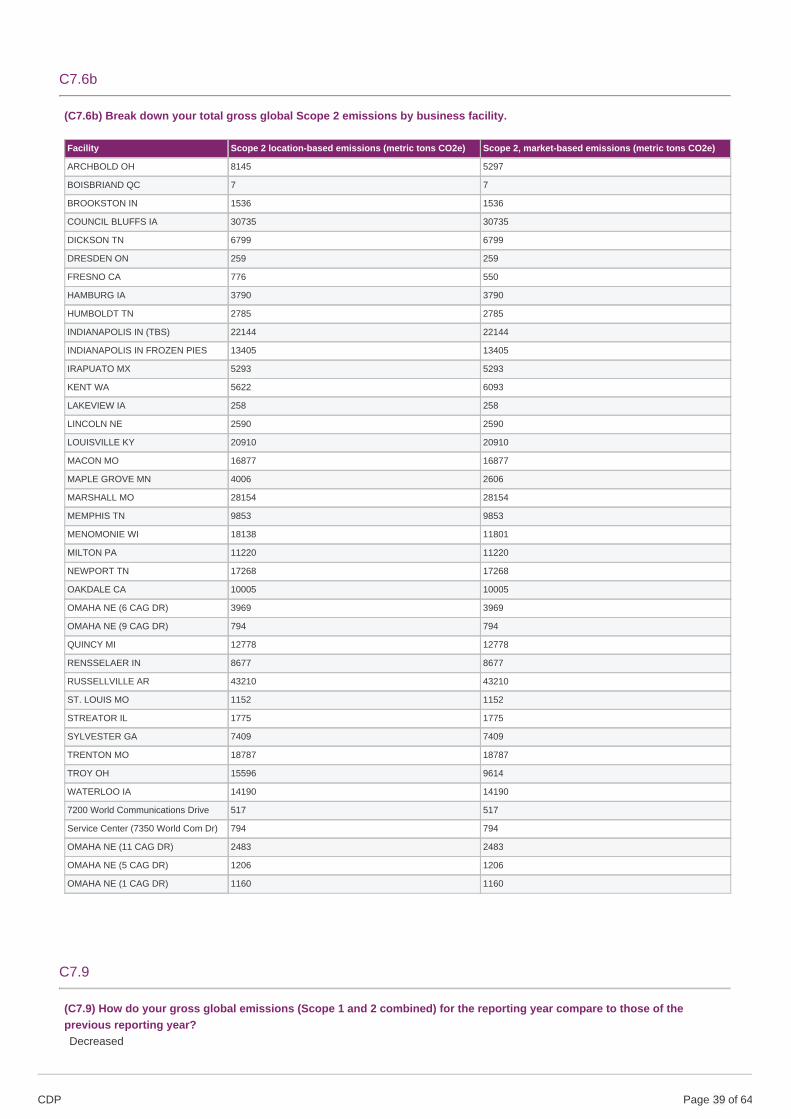
C7.6b
(C7.6b) Break down your total gross global Scope 2 emissions by business facility.
Facility Scope 2 location-based emissions (metric tons CO2e) Scope 2, market-based emissions (metric tons CO2e)
ARCHBOLD OH 8145 5297
BOISBRIAND QC 7 7
BROOKSTON IN 1536 1536
COUNCIL BLUFFS IA 30735 30735
DICKSON TN 6799 6799
DRESDEN ON 259 259
FRESNO CA 776 550
HAMBURG IA 3790 3790
HUMBOLDT TN 2785 2785
INDIANAPOLIS IN (TBS) 22144 22144
INDIANAPOLIS IN FROZEN PIES 13405 13405
IRAPUATO MX 5293 5293
KENT WA 5622 6093
LAKEVIEW IA 258 258
LINCOLN NE 2590 2590
LOUISVILLE KY 20910 20910
MACON MO 16877 16877
MAPLE GROVE MN 4006 2606
MARSHALL MO 28154 28154
MEMPHIS TN 9853 9853
MENOMONIE WI 18138 11801
MILTON PA 11220 11220
NEWPORT TN 17268 17268
OAKDALE CA 10005 10005
OMAHA NE (6 CAG DR) 3969 3969
OMAHA NE (9 CAG DR) 794 794
QUINCY MI 12778 12778
RENSSELAER IN 8677 8677
RUSSELLVILLE AR 43210 43210
ST. LOUIS MO 1152 1152
STREATOR IL 1775 1775
SYLVESTER GA 7409 7409
TRENTON MO 18787 18787
TROY OH 15596 9614
WATERLOO IA 14190 14190
7200 World Communications Drive 517 517
Service Center (7350 World Com Dr) 794 794
OMAHA NE (11 CAG DR) 2483 2483
OMAHA NE (5 CAG DR) 1206 1206
OMAHA NE (1 CAG DR) 1160 1160
C7.9
(C7.9) How do your gross global emissions (Scope 1 and 2 combined) for the reporting year compare to those of theprevious reporting year?Decreased
CDP Page of 6439

C7.9a
(C7.9a) Identify the reasons for any change in your gross global emissions (Scope 1 and 2 combined) and for each of themspecify how your emissions compare to the previous year.
Change inemissions(metrictonsCO2e)
Directionof change
Emissionsvalue(percentage)
Please explain calculation
Change inrenewableenergyconsumption
8832 Decreased 1.2 Starting in the second half of FY2017 Conagra Brands purchased renewable electricity for our Troy andArchbold locations. The total purchased renewable electricity in FY12 was 13999 MWh which we calculatedat a 0 emissions factor. This renewable energy resulted in a decrease of approximately 8832 MTCO2e. Wecalculated the 1.2% decrease through the following equation: 8832/749499*100= 1.2% Note: FY2016 scope1 and 2 emissions were recalculated to adjust for our divestment of Lamb Weston.
Otheremissionsreductionactivities
5556 Decreased 0.7 In FY2017, Conagra Brands implemented a number of sustainability projects as part of our SustainabilityDevelopment Awards Program. Of all the projects implemented, 19 projects were found to improve energyefficiency and help lower CO2e emissions. These 19 projects range from lighting, process optimization,refrigeration, compressed air, heat recovery, cooling technology and maintenance programs. Conagracalculated these carbon savings to be 5556 MTCO2e. We calculated the 0.7% decrease through thefollowing equation: 5556/749499*100= 0.7% Note: FY2016 scope 1 and 2 emissions were recalculated toadjust for our divestment of Lamb Weston.
Divestment 0 No change 0 The Lamb Weston divestment that occurred in FY2017 resulted in a baseline adjustment in accordance withthe WRI Corporate GHG Accounting Standard and therefore did not influence any change in ConagraBrands’ absolute GHG emissions.
Acquisitions <NotApplicable>
Mergers <NotApplicable>
Change inoutput
30585 Decreased 4.1 Emissions reductions due to changes in output are estimated and may also be impacted by other efficiencyefforts and updates to emissions factors. Conagra Brands’ business strategy over the past 3 years has beenis grounded in a shift from volume to value. As our CEO has communicated to the investment community,this shift includes strategies that reduce high-volume, low-price market penetration in favor of targeted,higher-value offerings. This shift has been correlated with reduced facility energy use and related absolutegreenhouse gas emissions. The change in output decreases were approximately 30585 MTCO2e. Wecalculated the 4.1% decrease through the following equation: 30585/749499*100= 4.1%
Change inmethodology
<NotApplicable>
Change inboundary
<NotApplicable>
Change inphysicaloperatingconditions
<NotApplicable>
Unidentified <NotApplicable>
Other <NotApplicable>
C7.9b
(C7.9b) Are your emissions performance calculations in C7.9 and C7.9a based on a location-based Scope 2 emissions figureor a market-based Scope 2 emissions figure?Market-based
C8. Energy
CDP Page of 6440
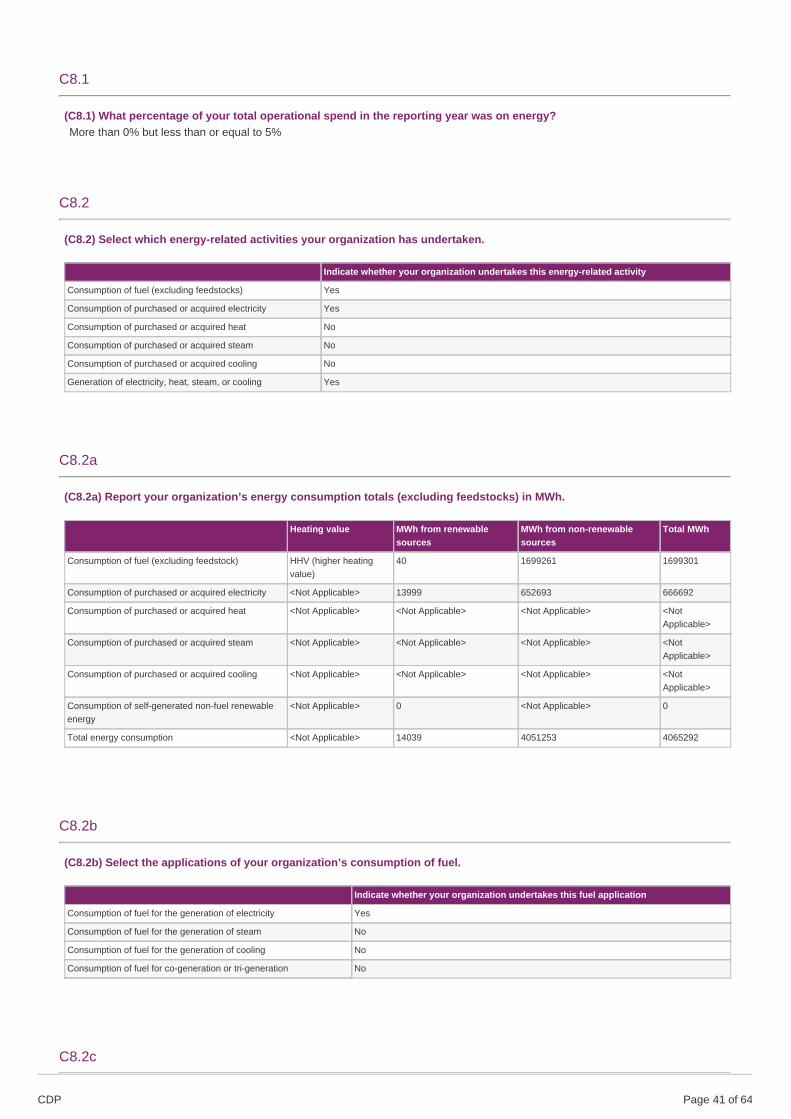
C8.1
(C8.1) What percentage of your total operational spend in the reporting year was on energy?More than 0% but less than or equal to 5%
C8.2
(C8.2) Select which energy-related activities your organization has undertaken.
Indicate whether your organization undertakes this energy-related activity
Consumption of fuel (excluding feedstocks) Yes
Consumption of purchased or acquired electricity Yes
Consumption of purchased or acquired heat No
Consumption of purchased or acquired steam No
Consumption of purchased or acquired cooling No
Generation of electricity, heat, steam, or cooling Yes
C8.2a
(C8.2a) Report your organization’s energy consumption totals (excluding feedstocks) in MWh.
Heating value MWh from renewablesources
MWh from non-renewablesources
Total MWh
Consumption of fuel (excluding feedstock) HHV (higher heatingvalue)
40 1699261 1699301
Consumption of purchased or acquired electricity <Not Applicable> 13999 652693 666692
Consumption of purchased or acquired heat <Not Applicable> <Not Applicable> <Not Applicable> <NotApplicable>
Consumption of purchased or acquired steam <Not Applicable> <Not Applicable> <Not Applicable> <NotApplicable>
Consumption of purchased or acquired cooling <Not Applicable> <Not Applicable> <Not Applicable> <NotApplicable>
Consumption of self-generated non-fuel renewableenergy
<Not Applicable> 0 <Not Applicable> 0
Total energy consumption <Not Applicable> 14039 4051253 4065292
C8.2b
(C8.2b) Select the applications of your organization’s consumption of fuel.
Indicate whether your organization undertakes this fuel application
Consumption of fuel for the generation of electricity Yes
Consumption of fuel for the generation of steam No
Consumption of fuel for the generation of cooling No
Consumption of fuel for co-generation or tri-generation No
C8.2c
CDP Page of 6441

(C8.2c) State how much fuel in MWh your organization has consumed (excluding feedstocks) by fuel type.
Fuels (excluding feedstocks)Diesel
Heating valueHHV (higher heating value)
Total fuel MWh consumed by the organization1599
MWh fuel consumed for the self-generation of electricity0
MWh fuel consumed for self-generation of heat0
MWh fuel consumed for self-generation of steam<Not Applicable>
MWh fuel consumed for self-generation of cooling<Not Applicable>
MWh fuel consumed for self- cogeneration or self-trigeneration<Not Applicable>
Fuels (excluding feedstocks)Propane Gas
Heating valueHHV (higher heating value)
Total fuel MWh consumed by the organization2097
MWh fuel consumed for the self-generation of electricity0
MWh fuel consumed for self-generation of heat0
MWh fuel consumed for self-generation of steam<Not Applicable>
MWh fuel consumed for self-generation of cooling<Not Applicable>
MWh fuel consumed for self- cogeneration or self-trigeneration<Not Applicable>
Fuels (excluding feedstocks)Natural Gas
Heating valueHHV (higher heating value)
Total fuel MWh consumed by the organization1671639
MWh fuel consumed for the self-generation of electricity0
MWh fuel consumed for self-generation of heat0
MWh fuel consumed for self-generation of steam<Not Applicable>
MWh fuel consumed for self-generation of cooling<Not Applicable>
CDP Page of 6442

MWh fuel consumed for self- cogeneration or self-trigeneration<Not Applicable>
Fuels (excluding feedstocks)Jet Kerosene
Heating valueHHV (higher heating value)
Total fuel MWh consumed by the organization17870
MWh fuel consumed for the self-generation of electricity0
MWh fuel consumed for self-generation of heat0
MWh fuel consumed for self-generation of steam<Not Applicable>
MWh fuel consumed for self-generation of cooling<Not Applicable>
MWh fuel consumed for self- cogeneration or self-trigeneration<Not Applicable>
Fuels (excluding feedstocks)Motor Gasoline
Heating valueHHV (higher heating value)
Total fuel MWh consumed by the organization6056
MWh fuel consumed for the self-generation of electricity0
MWh fuel consumed for self-generation of heat0
MWh fuel consumed for self-generation of steam<Not Applicable>
MWh fuel consumed for self-generation of cooling<Not Applicable>
MWh fuel consumed for self- cogeneration or self-trigeneration<Not Applicable>
Fuels (excluding feedstocks)Biogas
Heating valueHHV (higher heating value)
Total fuel MWh consumed by the organization40
MWh fuel consumed for the self-generation of electricity0
MWh fuel consumed for self-generation of heat0
MWh fuel consumed for self-generation of steam<Not Applicable>
CDP Page of 6443
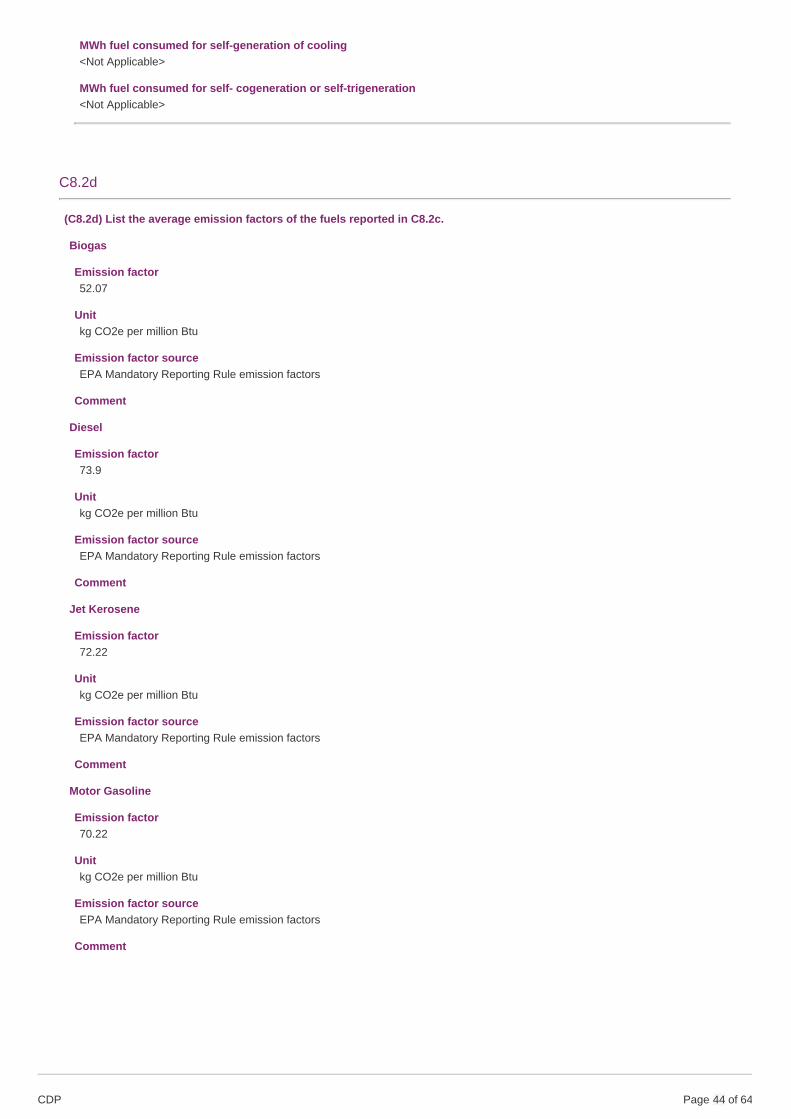
MWh fuel consumed for self-generation of cooling<Not Applicable>
MWh fuel consumed for self- cogeneration or self-trigeneration<Not Applicable>
C8.2d
(C8.2d) List the average emission factors of the fuels reported in C8.2c.
Biogas
Emission factor52.07
Unitkg CO2e per million Btu
Emission factor sourceEPA Mandatory Reporting Rule emission factors
Comment
Diesel
Emission factor73.9
Unitkg CO2e per million Btu
Emission factor sourceEPA Mandatory Reporting Rule emission factors
Comment
Jet Kerosene
Emission factor72.22
Unitkg CO2e per million Btu
Emission factor sourceEPA Mandatory Reporting Rule emission factors
Comment
Motor Gasoline
Emission factor70.22
Unitkg CO2e per million Btu
Emission factor sourceEPA Mandatory Reporting Rule emission factors
Comment
CDP Page of 6444
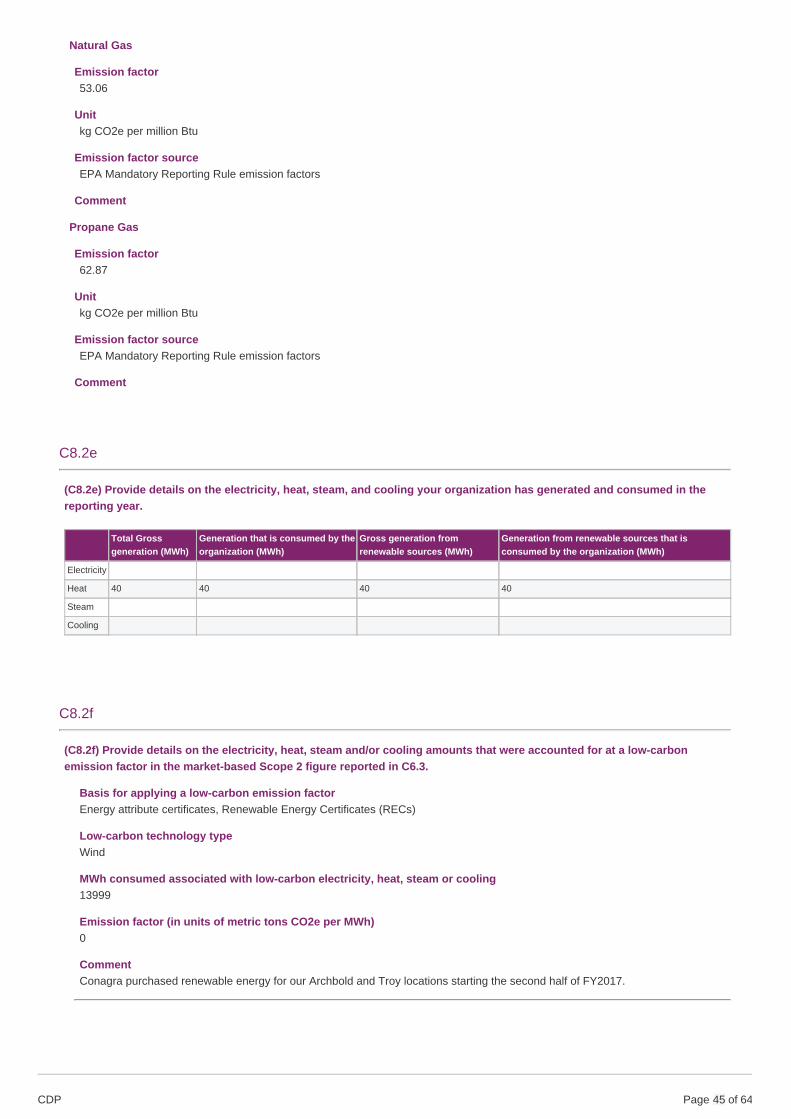
Natural Gas
Emission factor53.06
Unitkg CO2e per million Btu
Emission factor sourceEPA Mandatory Reporting Rule emission factors
Comment
Propane Gas
Emission factor62.87
Unitkg CO2e per million Btu
Emission factor sourceEPA Mandatory Reporting Rule emission factors
Comment
C8.2e
(C8.2e) Provide details on the electricity, heat, steam, and cooling your organization has generated and consumed in thereporting year.
Total Grossgeneration (MWh)
Generation that is consumed by theorganization (MWh)
Gross generation fromrenewable sources (MWh)
Generation from renewable sources that isconsumed by the organization (MWh)
Electricity
Heat 40 40 40 40
Steam
Cooling
C8.2f
(C8.2f) Provide details on the electricity, heat, steam and/or cooling amounts that were accounted for at a low-carbonemission factor in the market-based Scope 2 figure reported in C6.3.
Basis for applying a low-carbon emission factorEnergy attribute certificates, Renewable Energy Certificates (RECs)
Low-carbon technology typeWind
MWh consumed associated with low-carbon electricity, heat, steam or cooling13999
Emission factor (in units of metric tons CO2e per MWh)0
CommentConagra purchased renewable energy for our Archbold and Troy locations starting the second half of FY2017.
CDP Page of 6445

C9. Additional metrics
C9.1
(C9.1) Provide any additional climate-related metrics relevant to your business.
C10. Verification
C10.1
(C10.1) Indicate the verification/assurance status that applies to your reported emissions.
Verification/assurance status
Scope 1 Third-party verification or assurance process in place
Scope 2 (location-based or market-based) Third-party verification or assurance process in place
Scope 3 Third-party verification or assurance process in place
C10.1a
CDP Page of 6446

(C10.1a) Provide further details of the verification/assurance undertaken for your Scope 1 and/or Scope 2 emissions andattach the relevant statements.
ScopeScope 2 market-based
Verification or assurance cycle in placeAnnual process
Status in the current reporting yearComplete
Type of verification or assuranceLimited assurance
Attach the statement10017-017178.00 ConAgra Verification Statement FY2017.pdf
Page/ section referenceAll
Relevant standardISO14064-3
Proportion of reported emissions verified (%)100
ScopeScope 1
Verification or assurance cycle in placeAnnual process
Status in the current reporting yearComplete
Type of verification or assuranceLimited assurance
Attach the statement10017-017178.00 ConAgra Verification Statement FY2017.pdf
Page/ section referenceAll
Relevant standardISO14064-3
Proportion of reported emissions verified (%)9910017-017178.00 ConAgra Verification Statement FY2017.pdf
C10.1b
CDP Page of 6447

(C10.1b) Provide further details of the verification/assurance undertaken for your Scope 3 emissions and attach the relevantstatements.
ScopeScope 3- at least one applicable category
Verification or assurance cycle in placeAnnual process
Status in the current reporting yearComplete
Attach the statement10017-017178.00 ConAgra Verification Statement FY2017.pdf
Page/section referenceAll
Relevant standardISO14064-3
C10.2
(C10.2) Do you verify any climate-related information reported in your CDP disclosure other than the emissions figuresreported in C6.1, C6.3, and C6.5?Yes
C10.2a
(C10.2a) Which data points within your CDP disclosure have been verified, and which verification standards were used?
Disclosure moduleverification relates to
Data verified Verificationstandard
Please explain
C5. Emissionsperformance
Other, please specify(Production data)
ISO 14064-3
Production data is included in the verification process, providing basis for calculating GHG emissionsper pound and reporting progress towards our 2020 GHG reduction goal
C11. Carbon pricing
C11.1
(C11.1) Are any of your operations or activities regulated by a carbon pricing system (i.e. ETS, Cap & Trade or Carbon Tax)?Yes
C11.1a
(C11.1a) Select the carbon pricing regulation(s) which impacts your operations.California CaT
C11.1b
CDP Page of 6448

(C11.1b) Complete the following table for each of the emissions trading systems in which you participate.
California CaT
% of Scope 1 emissions covered by the ETS20
Period start dateJanuary 1 2017
Period end dateDecember 31 2017
Allowances allocated41115
Allowances purchased0
Verified emissions in metric tons CO2e69650
Details of ownershipFacilities we own and operate
Comment
C11.1d
(C11.1d) What is your strategy for complying with the systems in which you participate or anticipate participating?
In fiscal year 2017, only one facility was subject to cap-and-trade coverage. The emissions reported above have been electronicallyreported to the US EPA and the California Air Resources Board and Conagra Brands’ internal sustainability reporting database, whichis verified as part of our annual third-party assurance process to GRI standards. Conagra Brands strategy for complying withCalifornia's Greenhouse Gas Cap and Trade Program is compliance-driven. We purchased 44,000 metric tons of allowances in thefirst California Cap and Trade Program Greenhouse Gas Allowance Auction, held in November 2012. This purchase was sufficient tocover the requirements of the facilities we own and operate through Compliance Period 1 (CP1), which covered total 2013 and 2014emissions. The program is set up to require surrender of a small percentage of emissions each year (30%), and at the end of a CP anentity must have a balance that allows surrender of all owed. The CPs are broken as follows: CP1 – 2013 and 2014; CP2 – 2015,2016, 2017; CP3 – 2018, 2019, 2020. In November 2015, Conagra Brands surrendered the balance of 2013 emissions, as well asthe total of 2014 emissions. In November 2016, Conagra Brands surrendered 30% of total 2015 emissions, or 32,368 allowances.The California Air Resources Board has recently granted additional assistance through Compliance Period 2, and is evaluatingassistance for Compliance Period 3. Conagra Brands regularly monitors greenhouse gas emissions of the facility we own and operatein California to evaluate the need to participate in allowance auctions, and investigate offset opportunities to cover the gap betweenfacility emissions and allowance allocated. We are evaluating participation in the next auction, which is November 2018, and wehave recently engaged a third-party expert to assist in developing our future strategy with respect to our cap-and-trade program.
C11.2
(C11.2) Has your organization originated or purchased any project-based carbon credits within the reporting period?No
C11.3
(C11.3) Does your organization use an internal price on carbon?No, and we do not currently anticipate doing so in the next two years
CDP Page of 6449

C12. Engagement
C12.1
(C12.1) Do you engage with your value chain on climate-related issues?Yes, our suppliersYes, our customers
C12.1a
(C12.1a) Provide details of your climate-related supplier engagement strategy.
Type of engagementInformation collection (understanding supplier behavior)
Details of engagementOther, please specify (Featured in supplier awards scheme)
% of suppliers by number1
% total procurement spend (direct and indirect)80
% Scope 3 emissions as reported in C6.50
Rationale for the coverage of your engagementThe Supplier Excellence program includes approximately 100 of our largest and most strategic suppliers, and covers approximately80% of our procurement spend. Focusing our supplier management efforts and water, climate and deforestation risk on thissupplier subset provides the greatest impact and most efficient use of internal management resources.
Impact of engagement, including measures of successOn a quarterly basis, suppliers are asked to respond to Conagra Brands’ Supplier Excellence Assessment. Assessments arescored by a cross-functional team and suppliers are awarded points for their responses to 10 questions addressing transparency,sustainability policies and goals related to climate change, water and deforestation, as well as other topics material to ConagraBrands. The annual sustainability assessment is supplemented by quarterly performance discussions and risk analyses, and wework in partnership with our suppliers to address any issues or gaps. The scoring system that we have in place allows us toquantitatively measure supplier progress over time, with our measure of success being a progressive increase in the number ofsuppliers with scores of 3 or 4 on a 4-point sustainability scale.. The top-scoring suppliers in our Supplier Excellence sustainabilityassessment are eligible for an annual Supplier Excellence Sustainability award.
Comment
C12.1b
CDP Page of 6450

(C12.1b) Give details of your climate-related engagement strategy with your customers.
Type of engagementEducation/information sharing
Details of engagementShare information about your products and relevant certification schemes (i.e. Energy STAR)
Size of engagement30
% Scope 3 emissions as reported in C6.51
Please explain the rationale for selecting this group of customers and scope of engagementThe size of our customer engagement is an estimate reflecting the percentage of Conagra Brands’ retail and foodservice volumeincluded in annual environmental questionnaires that our sustainability team completes for customers. This customer engagementestimate includes 3 Fortune 500 corporations with significant market impact. We have estimated the impact of these engagedcustomers on our Scope 3 emissions based on our limited tracking of procurement-based GHG emissions, which are currentlylimited to some elements of transportation (e.g. transport of finished goods to warehouse). We engage with our customers in twoways: 1. Education. Conagra Brands actively collaborates with key customers and provides resources, consultation, advice andreporting as needed. For example, Conagra Brands representatives engage with a large retail customer and a global QSR foodservice customer to help further customer sustainability goals around supply chain greenhouse gas emissions reduction, reducedwater use, and sustainable sourcing (including management of deforestation risks) by sharing our best practices and advising onthe feasibility of expanding sustainable practices throughout the value chain. 2. Information-sharing. Conagra Brands routinelycompletes scorecards and information requests in support of customer supply chain sustainability programs.
Impact of engagement, including measures of successConagra Brands helped a QSR customer test supply chain feasibility of an enhanced sustainable sourcing goal that would impactsupply chain GHG emissions, water use and deforestation impacts, resulting in an informed analysis of costs and benefits that iscurrently being considered as part of next-generation public sustainability commitments.
C-AC12.2/C-FB12.2/C-PF12.2
(C-AC12.2/C-FB12.2/C-PF12.2) Do you encourage your suppliers to undertake any agricultural or forest managementpractices with climate change mitigation and/or adaptation benefits?Yes
C-AC12.2a/C-FB12.2a/C-PF12.2a
(C-AC12.2a/C-FB12.2a/C-PF12.2a) Specify which agricultural or forest management practices with climate change mitigationand/or adaptation benefits you encourage your suppliers to undertake and describe your role in the implementation of eachpractice.
Management practice reference numberMP1
Management practiceAfforestation
Description of management practiceConagra Brands sources palm oil from RSPO-certified suppliers complying with relevant RSPO ecosystem managementstandards, and from suppliers adhering to WWF’s Palm Oil Buyers’ Scorecard requirements, which include: implementation of theRSPO New Plantings Procedure, excluding cultivation on peat soils and clearance of high carbon stock areas; restoration of anyplantations on peat at the end of the current rotation; ceasing use of pesticides that are categorized as World Health OrganizationClass 1A or 1B, or that are listed by the Stockholm or Rotterdam Conventions, and paraquat; and prohibits sourcing of Fresh FruitBunches (FFB) from designated or protected areas such as national parks. We use our RSPO membership and supplier dialoguesthrough our procurement team to continuously monitor any suppliers for ecosystem impacts outside of WWF or RSPO guidelines.Outside of palm oil, all suppliers are bound by the Conagra Brands Supplier Code of Conduct which contains minimum standardsfor doing business with us. This Code of Conduct requires ongoing, documented compliance with all environmental regulations,and also requires our direct suppliers to ensure compliance with their sub-contractors and suppliers.
CDP Page of 6451

Your role in the implementationProcurement
Explanation of how you encourage implementationConagra Brands has a public commitment to source 100% certified sustainable palm oil. Palm oil suppliers who do not meet thesestandards are not eligible to do business with Conagra Brands. For all suppliers, Conagra Brands maintains active "top-to-top"relationships with strategic suppliers, representing substantial proportion of our spend. Typically twice annually during meetingsbetween senior leadership from each company, sustainability strategy and goals are shared, providing the opportunity to explorecollaborative solutions. Conagra Brands also directly engages with contracted tomato and popcorn growers to discuss integration ofsustainable agriculture practices. It is also common practice to include sustainability parameters in direct bidding of contracts and inevaluation of potential new suppliers, adding those considerations into the decision-making process.
Climate change related benefitEmissions reductions (mitigation)Increase carbon sink (mitigation)Reduced demand for fertilizers (adaptation)Reduced demand for pesticides (adaptation)
Comment
Management practice reference numberMP2
Management practiceAgroforestry
Description of management practiceConagra Brands sources palm oil from RSPO-certified suppliers complying with relevant RSPO ecosystem managementstandards, and from suppliers adhering to WWF’s Palm Oil Buyers’ Scorecard requirements, which include: implementation of theRSPO New Plantings Procedure, excluding cultivation on peat soils and clearance of high carbon stock areas; restoration of anyplantations on peat at the end of the current rotation; ceasing use of pesticides that are categorized as World Health OrganizationClass 1A or 1B, or that are listed by the Stockholm or Rotterdam Conventions, and paraquat; and prohibits sourcing of Fresh FruitBunches (FFB) from designated or protected areas such as national parks. We use our RSPO membership and supplier dialoguesthrough our procurement team to continuously monitor any suppliers for ecosystem impacts outside of WWF or RSPO guidelines.Outside of palm oil, all suppliers are bound by the Conagra Brands Supplier Code of Conduct which contains minimum standardsfor doing business with us. This Code of Conduct requires ongoing, documented compliance with all environmental regulations,and also requires our direct suppliers to ensure compliance with their sub-contractors and suppliers.
Your role in the implementationProcurement
Explanation of how you encourage implementationConagra Brands has a public commitment to source 100% certified sustainable palm oil. Palm oil suppliers who do not meet thesestandards are not eligible to do business with Conagra Brands. For all suppliers, Conagra Brands maintains active "top-to-top"relationships with strategic suppliers, representing substantial proportion of our spend. Typically twice annually during meetingsbetween senior leadership from each company, sustainability strategy and goals are shared, providing the opportunity to explorecollaborative solutions. Conagra Brands also directly engages with contracted tomato and popcorn growers to discuss integration ofsustainable agriculture practices. It is also common practice to include sustainability parameters in direct bidding of contracts and inevaluation of potential new suppliers, adding those considerations into the decision-making process.
Climate change related benefitEmissions reductions (mitigation)Increase carbon sink (mitigation)Reduced demand for fertilizers (adaptation)Reduced demand for pesticides (adaptation)
Comment
Management practice reference numberMP3
Management practiceBiodiversity considerations
Description of management practiceConagra Brands sources palm oil from RSPO-certified suppliers complying with relevant RSPO ecosystem management
CDP Page of 6452
standards, and from suppliers adhering to WWF’s Palm Oil Buyers’ Scorecard requirements, which include: implementation of theRSPO New Plantings Procedure, excluding cultivation on peat soils and clearance of high carbon stock areas; restoration of anyplantations on peat at the end of the current rotation; ceasing use of pesticides that are categorized as World Health OrganizationClass 1A or 1B, or that are listed by the Stockholm or Rotterdam Conventions, and paraquat; and prohibits sourcing of Fresh FruitBunches (FFB) from designated or protected areas such as national parks. We use our RSPO membership and supplier dialoguesthrough our procurement team to continuously monitor any suppliers for ecosystem impacts outside of WWF or RSPO guidelines.Outside of palm oil, all suppliers are bound by the Conagra Brands Supplier Code of Conduct which contains minimum standardsfor doing business with us. This Code of Conduct requires ongoing, documented compliance with all environmental regulations,and also requires our direct suppliers to ensure compliance with their sub-contractors and suppliers.
Your role in the implementationProcurement
Explanation of how you encourage implementationConagra Brands has a public commitment to source 100% certified sustainable palm oil. Palm oil suppliers who do not meet thesestandards are not eligible to do business with Conagra Brands. For all suppliers, Conagra Brands maintains active "top-to-top"relationships with strategic suppliers, representing substantial proportion of our spend. Typically twice annually during meetingsbetween senior leadership from each company, sustainability strategy and goals are shared, providing the opportunity to explorecollaborative solutions. Conagra Brands also directly engages with contracted tomato and popcorn growers to discuss integration ofsustainable agriculture practices. It is also common practice to include sustainability parameters in direct bidding of contracts and inevaluation of potential new suppliers, adding those considerations into the decision-making process.
Climate change related benefitEmissions reductions (mitigation)Increase carbon sink (mitigation)Reduced demand for fertilizers (adaptation)Reduced demand for pesticides (adaptation)
Comment
Management practice reference numberMP4
Management practiceFertilizer management
Description of management practiceConagra Brands sources palm oil from RSPO-certified suppliers complying with relevant RSPO ecosystem managementstandards, and from suppliers adhering to WWF’s Palm Oil Buyers’ Scorecard requirements, which include: implementation of theRSPO New Plantings Procedure, excluding cultivation on peat soils and clearance of high carbon stock areas; restoration of anyplantations on peat at the end of the current rotation; ceasing use of pesticides that are categorized as World Health OrganizationClass 1A or 1B, or that are listed by the Stockholm or Rotterdam Conventions, and paraquat; and prohibits sourcing of Fresh FruitBunches (FFB) from designated or protected areas such as national parks. We use our RSPO membership and supplier dialoguesthrough our procurement team to continuously monitor any suppliers for ecosystem impacts outside of WWF or RSPO guidelines.Outside of palm oil, all suppliers are bound by the Conagra Brands Supplier Code of Conduct which contains minimum standardsfor doing business with us. This Code of Conduct requires ongoing, documented compliance with all environmental regulations,and also requires our direct suppliers to ensure compliance with their sub-contractors and suppliers.
Your role in the implementationProcurement
Explanation of how you encourage implementationConagra Brands has a public commitment to source 100% certified sustainable palm oil. Palm oil suppliers who do not meet thesestandards are not eligible to do business with Conagra Brands. For all suppliers, Conagra Brands maintains active "top-to-top"relationships with strategic suppliers, representing substantial proportion of our spend. Typically twice annually during meetingsbetween senior leadership from each company, sustainability strategy and goals are shared, providing the opportunity to explorecollaborative solutions. Conagra Brands also directly engages with contracted tomato and popcorn growers to discuss integration ofsustainable agriculture practices. It is also common practice to include sustainability parameters in direct bidding of contracts and inevaluation of potential new suppliers, adding those considerations into the decision-making process.
Climate change related benefitEmissions reductions (mitigation)Increase carbon sink (mitigation)Reduced demand for fertilizers (adaptation)Reduced demand for pesticides (adaptation)
CDP Page of 6453
Comment
Management practice reference numberMP5
Management practiceGovernmental or institutional policies and programs
Description of management practiceConagra Brands sources palm oil from RSPO-certified suppliers complying with relevant RSPO ecosystem managementstandards, and from suppliers adhering to WWF’s Palm Oil Buyers’ Scorecard requirements, which include: implementation of theRSPO New Plantings Procedure, excluding cultivation on peat soils and clearance of high carbon stock areas; restoration of anyplantations on peat at the end of the current rotation; ceasing use of pesticides that are categorized as World Health OrganizationClass 1A or 1B, or that are listed by the Stockholm or Rotterdam Conventions, and paraquat; and prohibits sourcing of Fresh FruitBunches (FFB) from designated or protected areas such as national parks. We use our RSPO membership and supplier dialoguesthrough our procurement team to continuously monitor any suppliers for ecosystem impacts outside of WWF or RSPO guidelines.Outside of palm oil, all suppliers are bound by the Conagra Brands Supplier Code of Conduct which contains minimum standardsfor doing business with us. This Code of Conduct requires ongoing, documented compliance with all environmental regulations,and also requires our direct suppliers to ensure compliance with their sub-contractors and suppliers.
Your role in the implementationProcurement
Explanation of how you encourage implementationConagra Brands has a public commitment to source 100% certified sustainable palm oil. Palm oil suppliers who do not meet thesestandards are not eligible to do business with Conagra Brands. For all suppliers, Conagra Brands maintains active "top-to-top"relationships with strategic suppliers, representing substantial proportion of our spend. Typically twice annually during meetingsbetween senior leadership from each company, sustainability strategy and goals are shared, providing the opportunity to explorecollaborative solutions. Conagra Brands also directly engages with contracted tomato and popcorn growers to discuss integration ofsustainable agriculture practices. It is also common practice to include sustainability parameters in direct bidding of contracts and inevaluation of potential new suppliers, adding those considerations into the decision-making process.
Climate change related benefitEmissions reductions (mitigation)Increase carbon sink (mitigation)Reduced demand for fertilizers (adaptation)Reduced demand for pesticides (adaptation)
Comment
Management practice reference numberMP6
Management practiceLow tillage and residue management
Description of management practiceConagra Brands sources palm oil from RSPO-certified suppliers complying with relevant RSPO ecosystem managementstandards, and from suppliers adhering to WWF’s Palm Oil Buyers’ Scorecard requirements, which include: implementation of theRSPO New Plantings Procedure, excluding cultivation on peat soils and clearance of high carbon stock areas; restoration of anyplantations on peat at the end of the current rotation; ceasing use of pesticides that are categorized as World Health OrganizationClass 1A or 1B, or that are listed by the Stockholm or Rotterdam Conventions, and paraquat; and prohibits sourcing of Fresh FruitBunches (FFB) from designated or protected areas such as national parks. We use our RSPO membership and supplier dialoguesthrough our procurement team to continuously monitor any suppliers for ecosystem impacts outside of WWF or RSPO guidelines.Outside of palm oil, all suppliers are bound by the Conagra Brands Supplier Code of Conduct which contains minimum standardsfor doing business with us. This Code of Conduct requires ongoing, documented compliance with all environmental regulations,and also requires our direct suppliers to ensure compliance with their sub-contractors and suppliers.
Your role in the implementationProcurement
Explanation of how you encourage implementationConagra Brands has a public commitment to source 100% certified sustainable palm oil. Palm oil suppliers who do not meet thesestandards are not eligible to do business with Conagra Brands. For all suppliers, Conagra Brands maintains active "top-to-top"relationships with strategic suppliers, representing substantial proportion of our spend. Typically twice annually during meetingsbetween senior leadership from each company, sustainability strategy and goals are shared, providing the opportunity to explore
CDP Page of 6454
collaborative solutions. Conagra Brands also directly engages with contracted tomato and popcorn growers to discuss integration ofsustainable agriculture practices. It is also common practice to include sustainability parameters in direct bidding of contracts and inevaluation of potential new suppliers, adding those considerations into the decision-making process.
Climate change related benefitEmissions reductions (mitigation)Increase carbon sink (mitigation)Reduced demand for fertilizers (adaptation)Reduced demand for pesticides (adaptation)
Comment
Management practice reference numberMP7
Management practicePractices to increase wood production and forest productivity
Description of management practiceConagra Brands sources palm oil from RSPO-certified suppliers complying with relevant RSPO ecosystem managementstandards, and from suppliers adhering to WWF’s Palm Oil Buyers’ Scorecard requirements, which include: implementation of theRSPO New Plantings Procedure, excluding cultivation on peat soils and clearance of high carbon stock areas; restoration of anyplantations on peat at the end of the current rotation; ceasing use of pesticides that are categorized as World Health OrganizationClass 1A or 1B, or that are listed by the Stockholm or Rotterdam Conventions, and paraquat; and prohibits sourcing of Fresh FruitBunches (FFB) from designated or protected areas such as national parks. We use our RSPO membership and supplier dialoguesthrough our procurement team to continuously monitor any suppliers for ecosystem impacts outside of WWF or RSPO guidelines.Outside of palm oil, all suppliers are bound by the Conagra Brands Supplier Code of Conduct which contains minimum standardsfor doing business with us. This Code of Conduct requires ongoing, documented compliance with all environmental regulations,and also requires our direct suppliers to ensure compliance with their sub-contractors and suppliers.
Your role in the implementationProcurement
Explanation of how you encourage implementationConagra Brands has a public commitment to source 100% certified sustainable palm oil. Palm oil suppliers who do not meet thesestandards are not eligible to do business with Conagra Brands. For all suppliers, Conagra Brands maintains active "top-to-top"relationships with strategic suppliers, representing substantial proportion of our spend. Typically twice annually during meetingsbetween senior leadership from each company, sustainability strategy and goals are shared, providing the opportunity to explorecollaborative solutions. Conagra Brands also directly engages with contracted tomato and popcorn growers to discuss integration ofsustainable agriculture practices. It is also common practice to include sustainability parameters in direct bidding of contracts and inevaluation of potential new suppliers, adding those considerations into the decision-making process.
Climate change related benefitEmissions reductions (mitigation)Increase carbon sink (mitigation)Reduced demand for fertilizers (adaptation)Reduced demand for pesticides (adaptation)
Comment
Management practice reference numberMP8
Management practicePest, disease and weed management practices
Description of management practiceConagra Brands sources palm oil from RSPO-certified suppliers complying with relevant RSPO ecosystem managementstandards, and from suppliers adhering to WWF’s Palm Oil Buyers’ Scorecard requirements, which include: implementation of theRSPO New Plantings Procedure, excluding cultivation on peat soils and clearance of high carbon stock areas; restoration of anyplantations on peat at the end of the current rotation; ceasing use of pesticides that are categorized as World Health OrganizationClass 1A or 1B, or that are listed by the Stockholm or Rotterdam Conventions, and paraquat; and prohibits sourcing of Fresh FruitBunches (FFB) from designated or protected areas such as national parks. We use our RSPO membership and supplier dialoguesthrough our procurement team to continuously monitor any suppliers for ecosystem impacts outside of WWF or RSPO guidelines.Outside of palm oil, all suppliers are bound by the Conagra Brands Supplier Code of Conduct which contains minimum standardsfor doing business with us. This Code of Conduct requires ongoing, documented compliance with all environmental regulations,
CDP Page of 6455
and also requires our direct suppliers to ensure compliance with their sub-contractors and suppliers.
Your role in the implementationProcurement
Explanation of how you encourage implementationConagra Brands has a public commitment to source 100% certified sustainable palm oil. Palm oil suppliers who do not meet thesestandards are not eligible to do business with Conagra Brands. For all suppliers, Conagra Brands maintains active "top-to-top"relationships with strategic suppliers, representing substantial proportion of our spend. Typically twice annually during meetingsbetween senior leadership from each company, sustainability strategy and goals are shared, providing the opportunity to explorecollaborative solutions. Conagra Brands also directly engages with contracted tomato and popcorn growers to discuss integration ofsustainable agriculture practices. It is also common practice to include sustainability parameters in direct bidding of contracts and inevaluation of potential new suppliers, adding those considerations into the decision-making process.
Climate change related benefitEmissions reductions (mitigation)Increase carbon sink (mitigation)Reduced demand for fertilizers (adaptation)Reduced demand for pesticides (adaptation)
Comment
Management practice reference numberMP9
Management practiceRestoration of degraded lands and cultivated organic soils
Description of management practiceConagra Brands sources palm oil from RSPO-certified suppliers complying with relevant RSPO ecosystem managementstandards, and from suppliers adhering to WWF’s Palm Oil Buyers’ Scorecard requirements, which include: implementation of theRSPO New Plantings Procedure, excluding cultivation on peat soils and clearance of high carbon stock areas; restoration of anyplantations on peat at the end of the current rotation; ceasing use of pesticides that are categorized as World Health OrganizationClass 1A or 1B, or that are listed by the Stockholm or Rotterdam Conventions, and paraquat; and prohibits sourcing of Fresh FruitBunches (FFB) from designated or protected areas such as national parks. We use our RSPO membership and supplier dialoguesthrough our procurement team to continuously monitor any suppliers for ecosystem impacts outside of WWF or RSPO guidelines.Outside of palm oil, all suppliers are bound by the Conagra Brands Supplier Code of Conduct which contains minimum standardsfor doing business with us. This Code of Conduct requires ongoing, documented compliance with all environmental regulations,and also requires our direct suppliers to ensure compliance with their sub-contractors and suppliers.
Your role in the implementationProcurement
Explanation of how you encourage implementationConagra Brands has a public commitment to source 100% certified sustainable palm oil. Palm oil suppliers who do not meet thesestandards are not eligible to do business with Conagra Brands. For all suppliers, Conagra Brands maintains active "top-to-top"relationships with strategic suppliers, representing substantial proportion of our spend. Typically twice annually during meetingsbetween senior leadership from each company, sustainability strategy and goals are shared, providing the opportunity to explorecollaborative solutions. Conagra Brands also directly engages with contracted tomato and popcorn growers to discuss integration ofsustainable agriculture practices. It is also common practice to include sustainability parameters in direct bidding of contracts and inevaluation of potential new suppliers, adding those considerations into the decision-making process.
Climate change related benefitEmissions reductions (mitigation)Increase carbon sink (mitigation)Reduced demand for fertilizers (adaptation)Reduced demand for pesticides (adaptation)
Comment
C-AC12.2b/C-FB12.2b/C-PF12.2b
CDP Page of 6456

(C-AC12.2b/C-FB12.2b/C-PF12.2b) Do you collect information from your suppliers about the outcomes of any implementedagricultural/forest management practices you have encouraged?Yes
C12.3
(C12.3) Do you engage in activities that could either directly or indirectly influence public policy on climate-related issuesthrough any of the following?Direct engagement with policy makersTrade associations
C12.3a
(C12.3a) On what issues have you been engaging directly with policy makers?
Focus of legislation Corporateposition
Details of engagement Proposedlegislativesolution
Other, please specify(Sustainable packagingand food waste)
Support Conagra Brands has leadership roles in several organizations focused on issues that indirectly affectindustry strategy and innovation related to Scope 3 GHG emissions. These include packaging (AMERIPEN)and food waste management (Food Waste Reduction Alliance).
Varies basedonorganization,see below.
C12.3b
(C12.3b) Are you on the board of any trade associations or do you provide funding beyond membership?Yes
C12.3c
CDP Page of 6457
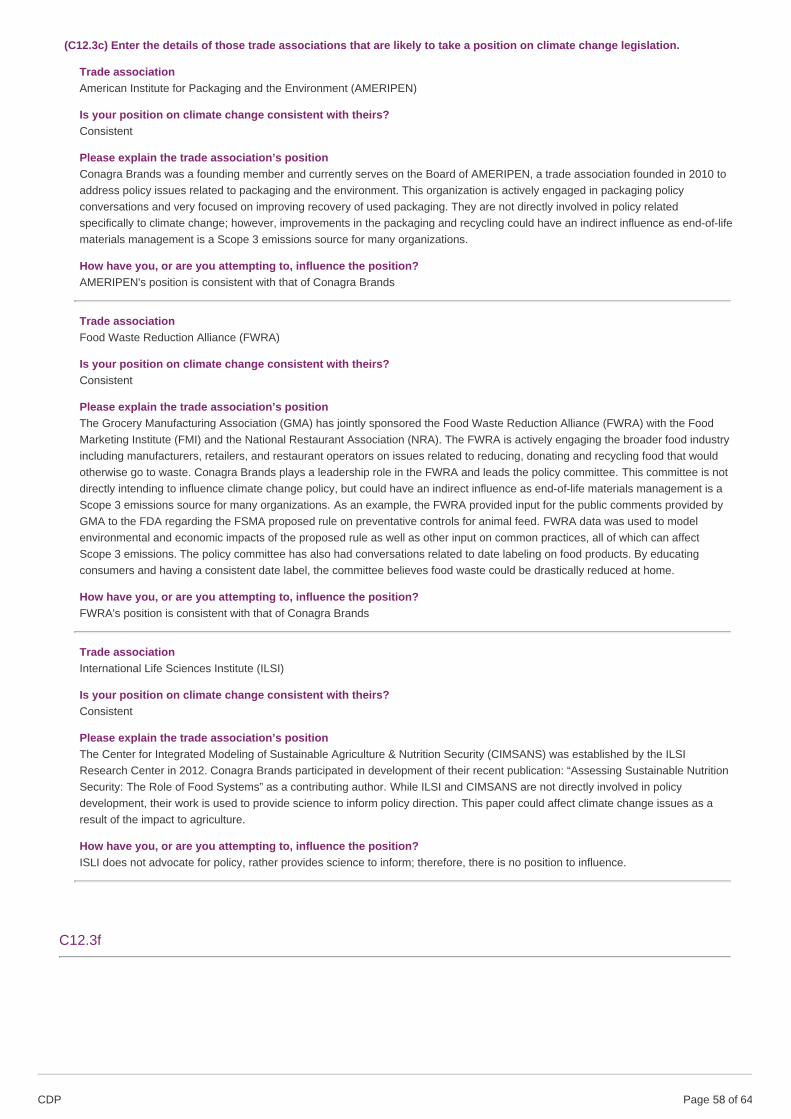
(C12.3c) Enter the details of those trade associations that are likely to take a position on climate change legislation.
Trade associationAmerican Institute for Packaging and the Environment (AMERIPEN)
Is your position on climate change consistent with theirs?Consistent
Please explain the trade association’s positionConagra Brands was a founding member and currently serves on the Board of AMERIPEN, a trade association founded in 2010 toaddress policy issues related to packaging and the environment. This organization is actively engaged in packaging policyconversations and very focused on improving recovery of used packaging. They are not directly involved in policy relatedspecifically to climate change; however, improvements in the packaging and recycling could have an indirect influence as end-of-lifematerials management is a Scope 3 emissions source for many organizations.
How have you, or are you attempting to, influence the position?AMERIPEN's position is consistent with that of Conagra Brands
Trade associationFood Waste Reduction Alliance (FWRA)
Is your position on climate change consistent with theirs?Consistent
Please explain the trade association’s positionThe Grocery Manufacturing Association (GMA) has jointly sponsored the Food Waste Reduction Alliance (FWRA) with the FoodMarketing Institute (FMI) and the National Restaurant Association (NRA). The FWRA is actively engaging the broader food industryincluding manufacturers, retailers, and restaurant operators on issues related to reducing, donating and recycling food that wouldotherwise go to waste. Conagra Brands plays a leadership role in the FWRA and leads the policy committee. This committee is notdirectly intending to influence climate change policy, but could have an indirect influence as end-of-life materials management is aScope 3 emissions source for many organizations. As an example, the FWRA provided input for the public comments provided byGMA to the FDA regarding the FSMA proposed rule on preventative controls for animal feed. FWRA data was used to modelenvironmental and economic impacts of the proposed rule as well as other input on common practices, all of which can affectScope 3 emissions. The policy committee has also had conversations related to date labeling on food products. By educatingconsumers and having a consistent date label, the committee believes food waste could be drastically reduced at home.
How have you, or are you attempting to, influence the position?FWRA's position is consistent with that of Conagra Brands
Trade associationInternational Life Sciences Institute (ILSI)
Is your position on climate change consistent with theirs?Consistent
Please explain the trade association’s positionThe Center for Integrated Modeling of Sustainable Agriculture & Nutrition Security (CIMSANS) was established by the ILSIResearch Center in 2012. Conagra Brands participated in development of their recent publication: “Assessing Sustainable NutritionSecurity: The Role of Food Systems” as a contributing author. While ILSI and CIMSANS are not directly involved in policydevelopment, their work is used to provide science to inform policy direction. This paper could affect climate change issues as aresult of the impact to agriculture.
How have you, or are you attempting to, influence the position?ISLI does not advocate for policy, rather provides science to inform; therefore, there is no position to influence.
C12.3f
CDP Page of 6458

(C12.3f) What processes do you have in place to ensure that all of your direct and indirect activities that influence policy areconsistent with your overall climate change strategy?
To ensure that Conagra Brands direct and indirect activities that influence policy are consistent with our overall climate changestrategy, the same individual (vice president who has responsibility for sustainability) actively participates in each of theseorganizations. This continuity ensures consistent messaging and provides line-of-sight to potential synergies across theseorganizations.
C12.4
(C12.4) Have you published information about your organization’s response to climate change and GHG emissionsperformance for this reporting year in places other than in your CDP response? If so, please attach the publication(s).
PublicationIn voluntary sustainability report
StatusComplete
Attach the document2017_ConagraBrands_CitizenshipReport_FINAL-2.pdf
Content elementsGovernanceStrategyRisks & opportunitiesEmissions figuresEmission targetsOther metrics
C13. Other land management impacts
C-AC13.2/C-FB13.2/C-PF13.2
(C-AC13.2/C-FB13.2/C-PF13.2) Do you know if any of the management practices mentioned in C-AC12.2a/C-FB12.2a/C-PF12.2a that were implemented by your suppliers have other impacts besides climate change mitigation/adaptation?Yes
C-AC13.2a/C-FB13.2a/C-PF13.2a
(C-AC13.2a/C-FB13.2a/C-PF13.2a) Provide details of those management practices implemented by your suppliers that haveother impacts besides climate change mitigation/adaptation.
Management practice reference numberMP1
Overall effectPositive
Which of the following has been impacted?BiodiversitySoilWater
Description of impacts
CDP Page of 6459

Afforestation
Have any response to these impacts been implemented?No
Description of the response(s)Our Malaysian palm oil supplier conducts remote forest cover monitoring programs and screening of indirect supplier groups. Thissupplier also supports landscape projects. Currently 30% of this supplier’s palm oil volume is verified deforestation-free.
Management practice reference numberMP2
Overall effectPositive
Which of the following has been impacted?BiodiversitySoilWaterYieldOther, please specify (Community investment)
Description of impactsAgroforestry
Have any response to these impacts been implemented?No
Description of the response(s)As a supplement to local agroforestry industry development, one of our major palm oil suppliers invests in local charity initiativesthat supplements community well-bring outside of creation of sustainable agroforestry jobs.
Management practice reference numberMP3
Overall effectPositive
Which of the following has been impacted?Biodiversity
Description of impactsBiodiversity considerations
Have any response to these impacts been implemented?No
Description of the response(s)Our Malaysian palm oil supplier conducts regular roadshows in communities such as Terengganu, Malaysia. The objective of theroadshows is to provide step-by-step support and share best management practices on existing plantations and build relationshipsbetween growers and millers
Management practice reference numberMP4
Overall effectPositive
Which of the following has been impacted?SoilWaterYield
Description of impactsFertilizer management
Have any response to these impacts been implemented?No
CDP Page of 6460

Description of the response(s)Our Malaysian palm oil supplier conducts regular roadshows in communities such as Terengganu, Malaysia. The objective of theroadshows is to provide step-by-step support and share best management practices on existing plantations and build relationshipsbetween growers and millers.
Management practice reference numberMP5
Overall effectPositive
Which of the following has been impacted?Other, please specify (Community investment)
Description of impactsGovernmental or institutional policies and programs
Have any response to these impacts been implemented?No
Description of the response(s)Our Malaysian palm oil supplier invests in local charity initiatives.
Management practice reference numberMP6
Overall effectPositive
Which of the following has been impacted?BiodiversitySoilWater
Description of impactsLow tillage and residue management
Have any response to these impacts been implemented?No
Description of the response(s)Our Malaysian palm oil supplier conducts regular roadshows in communities such as Terengganu, Malaysia. The objective of theroadshows is to provide step-by-step support and share best management practices on existing plantations and build relationshipsbetween growers and millers.
Management practice reference numberMP7
Overall effectPositive
Which of the following has been impacted?BiodiversitySoil
Description of impactsPractices to increase wood production and forest productivity
Have any response to these impacts been implemented?No
Description of the response(s)Our Malaysian palm oil supplier conducts regular roadshows in communities such as Terengganu, Malaysia. The objective of theroadshows is to provide step-by-step support and share best management practices on existing plantations and build relationshipsbetween growers and millers.
Management practice reference number
CDP Page of 6461

MP8
Overall effectPositive
Which of the following has been impacted?BiodiversitySoilYield
Description of impactsPest, disease and weed management practices
Have any response to these impacts been implemented?No
Description of the response(s)Our Malaysian palm oil supplier conducts regular roadshows in communities such as Terengganu, Malaysia. The objective of theroadshows is to provide step-by-step support and share best management practices on existing plantations and build relationshipsbetween growers and millers
Management practice reference numberMP9
Overall effectPositive
Which of the following has been impacted?BiodiversitySoilWaterYield
Description of impactsRestoration of degradation lands and cultivated organic soils
Have any response to these impacts been implemented?No
Description of the response(s)Our Malaysian palm oil supplier conducts regular roadshows in communities such as Terengganu, Malaysia. The objective of theroadshows is to provide step-by-step support and share best management practices on existing plantations and build relationshipsbetween growers and millers.
C14. Signoff
C-FI
(C-FI) Use this field to provide any additional information or context that you feel is relevant to your organization's response.Please note that this field is optional and is not scored.060117 Climate Change Policy.pdf
C14.1
(C14.1) Provide details for the person that has signed off (approved) your CDP climate change response.
Job title Corresponding job category
Row 1 Executive Vice-President & Chief Supply Chain Officer Chief Operating Officer (COO)
CDP Page of 6462

SC. Supply chain module
SC0.0
(SC0.0) If you would like to do so, please provide a separate introduction to this module.
SC0.1
(SC0.1) What is your company’s annual revenue for the stated reporting period?
Annual Revenue
Row 1
SC0.2
(SC0.2) Do you have an ISIN for your company that you would be willing to share with CDP?No
SC1.1
(SC1.1) Allocate your emissions to your customers listed below according to the goods or services you have sold them inthis reporting period.
SC1.2
(SC1.2) Where published information has been used in completing SC1.1, please provide a reference(s).
SC1.3
(SC1.3) What are the challenges in allocating emissions to different customers, and what would help you to overcome thesechallenges?
Allocation challenges Please explain what would help you overcome these challenges
SC1.4
(SC1.4) Do you plan to develop your capabilities to allocate emissions to your customers in the future?No
CDP Page of 6463

SC1.4b
(SC1.4b) Explain why you do not plan to develop capabilities to allocate emissions to your customers.
SC2.1
(SC2.1) Please propose any mutually beneficial climate-related projects you could collaborate on with specific CDP SupplyChain members.
SC2.2
(SC2.2) Have requests or initiatives by CDP Supply Chain members prompted your organization to take organizational-levelemissions reduction initiatives?No
SC3.1
(SC3.1) Do you want to enroll in the 2018-2019 CDP Action Exchange initiative?No
SC3.2
(SC3.2) Is your company a participating supplier in CDP’s 2017-2018 Action Exchange initiative?No
SC4.1
(SC4.1) Are you providing product level data for your organization’s goods or services, if so, what functionality will you beusing?No, I am not providing data
SC4.2d
(SC4.2d) Have any of the initiatives described in SC4.2c been driven by requesting CDP Supply Chain members?No
Submit your response
In which language are you submitting your response?English
CDP Page of 6464

Please confirm how your response should be handled by CDP
Public or Non-Public Submission I am submitting to Are you ready to submit the additional Supply Chain Questions?
I am submitting my response Public InvestorsCustomers
Yes, submit Supply Chain Questions now
Please confirm belowI have read and accept the applicable Terms