An Autosegmental-Metrical Investigation of Intonation in People with Parkinson's Disease
THE NEUROSCIENCES AND MUSIC II I—DISORDERS AND PLASTICITY
Evidence for Plasticity in White-MatterTracts of Patients with Chronic Broca’s
Aphasia Undergoing IntenseIntonation-based Speech Therapy
Gottfried Schlaug, Sarah Marchina, and Andrea Norton
Music, Stroke Recovery, and Neuroimaging Laboratory, Department of Neurology,Beth Israel Deaconess Medical Center and Harvard Medical School,
Boston, Massachusetts, USA
Recovery from aphasia can be achieved through recruitment of either perilesional brainregions in the affected hemisphere or homologous language regions in the nonlesionalhemisphere. For patients with large left-hemisphere lesions, recovery through the righthemisphere may be the only possible path. The right-hemisphere regions most likelyto play a role in this recovery process are the superior temporal lobe (important forauditory feedback control), premotor regions/posterior inferior frontal gyrus (importantfor planning and sequencing of motor actions and for auditory-motor mapping), and theprimary motor cortex (important for execution of vocal motor actions). These regionsare connected reciprocally via a major fiber tract called the arcuate fasciculus (AF),however, this tract is not as well developed in the right hemisphere as it is in thedominant left. We tested whether an intonation-based speech therapy (i.e., melodicintonation therapy [MIT]), which is typically administered in an intense fashion with75–80 daily therapy sessions, would lead to changes in white-matter tracts, particularlythe AF. Using diffusion tensor imaging (DTI), we found a significant increase in thenumber of AF fibers and AF volume comparing post- with pretreatment assessmentsin six patients that could not be attributed to scan-to-scan variability. This suggeststhat intense, long-term MIT leads to remodeling of the right AF and may provide anexplanation for the sustained therapy effects that were seen in these six patients.
Key words: melodic intonation therapy; speech therapy; plasticity; diffusion tensorimaging; aphasia
Introduction
Aphasia is a condition characterized by ei-ther partial or total loss of the ability to com-municate verbally. Aphasic disorders are clas-sified according to fluency of verbal output aseither fluent or nonfluent aphasia. Nonfluentaphasia most commonly results from a lesionin the left frontal lobe involving the left pos-terior inferior frontal region known as Broca’s
Address for correspondence: Gottfried Schlaug, M.D., Ph.D.,Department of Neurology, Beth Israel Deaconess MedicalCenter and Harvard Medical School, 330 Brookline Avenue,Boston, MA 02215. Voice: +617-632-8917; fax: [email protected]; www.musicianbrain.com
area.1 Patients who are nonfluent usually havethe ability to comprehend the speech of others,but are unable to produce words themselves.Fluent aphasia generally results from a lesioninvolving the posterior superior temporal lobeknown as Wernicke’s area. While these patients’verbal output can be relatively fluent, they mayhave a prominent comprehension deficit andtheir jargon-like and/or nonsensical speech isoften incomprehensible. The posterior superiortemporal region (Wernicke’s area) and the pos-terior inferior frontal region (Broca’s area) aswell as the adjacent premotor cortex are con-nected via a prominent fiber bundle called thearcuate fasciculus (AF).2 A disruption of just
The Neurosciences and Music III—Disorders and Plasticity: Ann. N.Y. Acad. Sci. 1169: 385–394 (2009).doi: 10.1111/j.1749-6632.2009.04587.x c© 2009 New York Academy of Sciences.
385
386 Annals of the New York Academy of Sciences
this fiber bundle results in a characteristic apha-sic disorder known as conduction aphasia. Pa-tients with conduction aphasia are fluent andhave relatively good comprehension, althoughtheir ability to repeat words and phrases issignificantly impaired.1 If a stroke affects theAF fiber bundle and its anterior target regions,then the clinical presentation is usually that ofa nonfluent or dysfluent Broca’s aphasia with agreater or lesser degree of impairment to repeti-tion, but relatively intact comprehension. Mostpatients with aphasia undergo speech ther-apy in the subacute to chronic phase, but theoutcome in moderate to severely nonfluent pa-tients with large left-hemisphere lesions is oftendismal, even with intensive speech therapy. Al-though the efficacy of speech therapy in gen-eral has been shown in several meta-analyses,these analyses have also revealed that therapiesmight only lead to a measurable effect if theintervention is both intense and long-term.3
Functional imaging methods, such aspositron emission tomography and functionalmagnetic resonance imaging (fMRI), have beenused to reveal the functional neural correlates oflanguage recovery, mostly using one assessmenteither at the presumed end of natural recoveryor at the end of an experimental study. Thegeneral consensus across all of these studies isthat there are two routes to recovery. In patientswith small lesions, there tends to be more ac-tivation of left-hemisphere peri-lesional cortexand variable right-hemisphere activation eitherduring the recovery process or after recovery. Inpatients with large left-hemisphere lesions in-volving most, if not all of the language-capableregions in the left fronto-temporal lobes, theretends to be more activation of homologousright-hemisphere language regions.4–11 Inter-estingly, relatively few studies have examinedthe neural correlates of an aphasia treat-ment by contrasting pre- and posttherapyassessments.10–15
Structural correlates of language recoveryhave not yet been examined. Voxel-based mor-phometry methods may be sensitive enough todetect changes in gray-matter densities or gray-
matter volume, but more meaningful methodsmight be those capable of detecting changes inconnectivity between regions that must func-tion in concert in order to restore any degree oflanguage function after a stroke. In the presentstudy, we aimed to use diffusion tensor imaging(DTI) to examine possible connectivity changesin chronic aphasic patients undergoing inten-sive therapy. DTI is a magnetic resonance imag-ing (MRI) technique that provides informationabout the diffusion of water molecules (Brown-ian motion) in the brain. The diffusivity of wa-ter molecules provides information about thebrain’s microstructure: in regions with high dif-fusion that has directionality, nerve fibers arelikely to go in a similar direction. There hasbeen increasing interest in the DTI techniquenot only because it allows us to study normalwhite-matter anatomy and structural connec-tivity,16,17 but also because it allows us to studypotential remodeling of white-matter tracts instroke patients who are undergoing intense re-habilitation. The method allows filtering offibers that pass through desired regions of in-terest (ROIs). The resulting isolated tracts aredepicted in a probabilistic map reflecting thelikelihood of a structural connection betweenselected regions of the brain.18
The one intervention that specifically seeksto engage homologous right-hemisphere lan-guage regions, and appears effective at do-ing so when it is done intensively over a longperiod of time, is melodic intonation therapy(MIT).19,20 This method was developed in re-sponse to the observation that severely aphasicpatients can often produce well-articulated, lin-guistically accurate words while singing, but notduring speech.21–25 MIT is a hierarchicallystructured treatment that uses intoned (sung)patterns to exaggerate the normal melodiccontent of speech by translating prosodicspeech patterns (spoken phrases) into melod-ically intoned patterns using just two pitches.11
MIT contains two unique elements that set itapart from other, nonintonation-based thera-pies: (1) the melodic intonation (singing) withits inherent continuous voicing, and (2) the
Schlaug et al.: White-Matter Plasticity in Chronic Broca’s Aphasia 387
rhythmic tapping of each syllable (using the pa-tient’s left hand) while phrases are intoned andrepeated. Another important characteristic ofMIT is that, unlike many therapies adminis-tered in the chronic phase that involve one totwo short sessions per week, MIT engages pa-tients in intensive treatment totaling 1.5 h/day,5 days/week, until the patient has mastered allthree levels of MIT, usually after 75–80 or moresessions.
Considering that MIT is applied in a very in-tense fashion, we aimed to examine whether theintensity of this intonation-based speech ther-apy in chronic nonfluent aphasic patients withrelatively large left-hemisphere lesions wouldnot only lead to functional changes in the brainas reported previously,11 but would also changebrain structure. It is possible that the sustainedtherapy effects may actually be due to struc-tural changes in a language network, whetherit be one that already exists or one that mustbe established during the course of treatmentin order for the therapy to successfully restoresome degree of fluency. The critical structurethat facilitates both speech production and itsfeedforward and feedback control system isthe AF. This structure connects the posteriorpart of the temporal lobe and inferior pari-etal region with the inferior frontal region ofthe brain and is considered to be part of alarger structure, the superior longitudinal fasci-culus. In the dominant hemisphere, this path-way is thought to connect Wernicke’s area withBroca’s area and is usually more developedthan its homolog structure in the nondomi-nant right hemisphere. We sought to determinewhether or not the AF in the undamaged righthemisphere would show structural changes asa result of intensive, long-term treatment withMIT.
Material and Methods
Patients
We selected six right-handed patients froma larger group of patients who had partici-
pated either in our MIT pilot studies or inour ongoing randomized clinical trial exam-ining the behavioral and neural correlates oftwo speech therapies in nonfluent aphasic pa-tients. These six patients were selected becausethey had moderate to severe nonfluent aphasiawith relatively preserved comprehension andwere at least 1 year since their first (and only)left-hemisphere stroke. In addition, they hadundergone high-resolution MRI studies thathad included DTI acquisitions both before andafter therapy. In addition, several of these pa-tients had two separate DTI studies done beforetherapy, which allowed us to examine possiblescan-to-scan variability in DTI-derived mea-sures and relate that variability to therapy-induced changes in DTI-derived measures. Be-havioral assessments, which were done severaltimes before therapy, after 75 therapy sessions,and again 1 month later, included the numberof correct information units (CIUs)/min pro-duced during spontaneous speech, picture de-scriptions, and descriptions of common proce-dures. Secondary outcome measures includedcorrectly named items on standard picture-naming tests, as well as syllables per phrase.11
Imaging Assessments
Structural MRI with DTI was performedusing a 3-tesla General Electric scanner.Anatomic images were acquired using a T1-weighted, three-dimensional, magnetization-prepared, rapid-acquisition, gradient-echo(MPRAGE) with a voxel resolution of 0.93 ×0.93 × 1.5 mm. DTI was performed us-ing a diffusion-weighted, single-shot, spin-echo,echo-planar imaging sequence (TE1 = 86.9 ms,TR = 10,000 ms, FOV = 240 mm, ma-trix size = 128 × 128 voxels, slice thick-ness = 5.0 mm, no skip, NEX = 1). Twenty-five noncollinear directions with a b-value of1000 s/mm2 and one direction with a b-value of0 s/mm2 were acquired. Fractional anisotropy(FA) values, a measure of the degree of direc-tional preference of water diffusion, were cal-culated within each brain voxel.

388 Annals of the New York Academy of Sciences
Data Analysis
Tractography was applied to the DTI datato reconstruct white-matter tracts by succes-sively following the path of preferred directionof water diffusion when FA is higher than aselected threshold.26–28 By means of MedIN-RIA software version 1.5.3 (http://www-sop.inria.fr/asclepios/software/MedINRIA),29 di-ffusion tensors were calculated from all voxelswithin the brain, and fiber tracts were calcu-lated by connecting adjacent voxels with simi-lar principal eigenvectors, using a threshold FAvalue of 0.2 and a smoothness factor (a param-eter ranging from 0 to 1 corresponding to thestraightness of each fiber) of 0.2 for continuousfiber reconstruction.30 Only fibers with lengths>10 mm were included. These parameters aresimilar to those used by others who applied afiber assignment by continuous tracking algo-rithm.31,32 ROIs were drawn in each brain onsagittal slices (with visual control of the regionin the other two orthogonal planes) by a sin-gle coder, who was blind to the status of theparticipants. We identified the AF accordingto published DTI atlases.33,34 We drew ROIsin the white matter underlying the posteriormiddle temporal gyrus (pMTG), which con-tains the largest posterior branch of the AF,and the posterior inferior frontal gyrus (pIFG)to constrain fiber tracts. Fibers were recon-structed using voxels in the pMTG as seed re-gions and voxels in the pIFG ROIs as the targetregion.
In addition to the AF fiber tract, we also iden-tified and traced the corticospinal tract (CST) inorder to relate AF fibers at each timepoint to aninternal control fiber bundle to minimize pos-sible whole-brain differences in diffusivity fromtimepoint to timepoint. There was no reason toexpect that the CST in the nonaffected hemi-sphere would change in this group of chronicstroke patients (who did not undergo occupa-tional therapy during the time that they wereenrolled in our study). The CST was deter-mined by drawing ROIs in the posterior limbof the internal capsule (PLIC), the brain stem at
a pontine level, and the white matter underly-ing the precentral gyrus in each hemisphere onthe color-coded FA images. The analysis wasstarted by drawing an ROI in the PLIC, whichis known to include the CST from anatomic35
and MRI studies.36–38 The next ROI was drawnat a pontine level using a slice on which thesuperior cerebellar peduncle was visible, corre-sponding to z = −26 of a spatially normalizedbrain in Talairach and Tournoux space.39 Weadded a logical AND-function so that only fiberspassing through both ROIs were considered forfurther analysis. The third ROI was drawn inthe precentral gyrus, including its underlyingwhite matter at a level that corresponded toz = 64 mm of a spatially normalized brain. Alogical AND-function was also added for thisROI so that only fibers that started in the pre-central gyrus and passed through the PLIC andthe pons were designated as the CST. After ap-plying tractography, the identified fiber bun-dles were compared for tract fiber number andvolume.
Results
The AF was successfully identified in theright hemisphere of all six aphasic patients,but could not be identified to its full extentin the left hemisphere because each of the sixpatients’ strokes had destroyed the majority ofthe tract. Therefore, our analysis is restricted topost- versus pretreatment comparisons of right-hemisphere tracts.
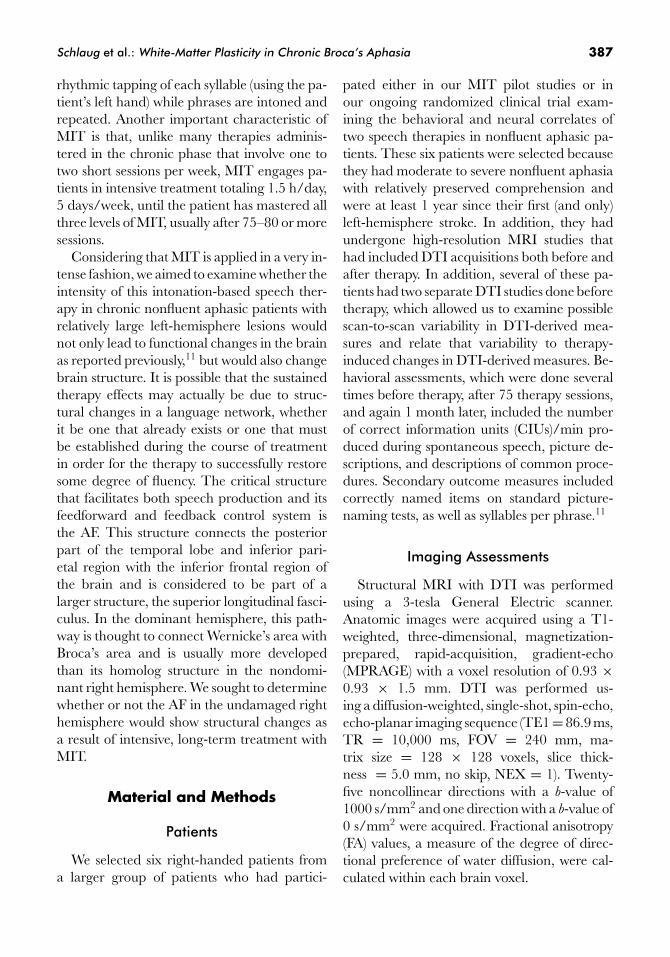
All six patients showed a significant increasein the absolute number of fibers in the rightAF comparing post- versus pretreatment DTIstudies (paired t-test, P = 0.04). One patient(Fig. 1) showed not only an increase in the ab-solute fibers of the AF, but also an increasein the fiber length after therapy. The two pre-treatment DTI studies did not show any sig-nificant difference in the overall AF tract orin the total number of fibers. In order to nor-malize the pre- and the posttreatment mea-surement, we calculated a ratio between the
Schlaug et al.: White-Matter Plasticity in Chronic Broca’s Aphasia 389
Figure 1. Absolute and relative fiber number of the right arcuate fasciculus (AF) before(gray bars) and after therapy (black bars) in all six participants.
fibers in the AF and the CST. Similar to theabsolute differences seen in the post- veruspreassessments, we also found a significant dif-ference (paired t-test, P = 0.02) in the relativefiber numbers when the AF fibers were nor-malized with the fibers in the pyramidal tract(Fig. 2).
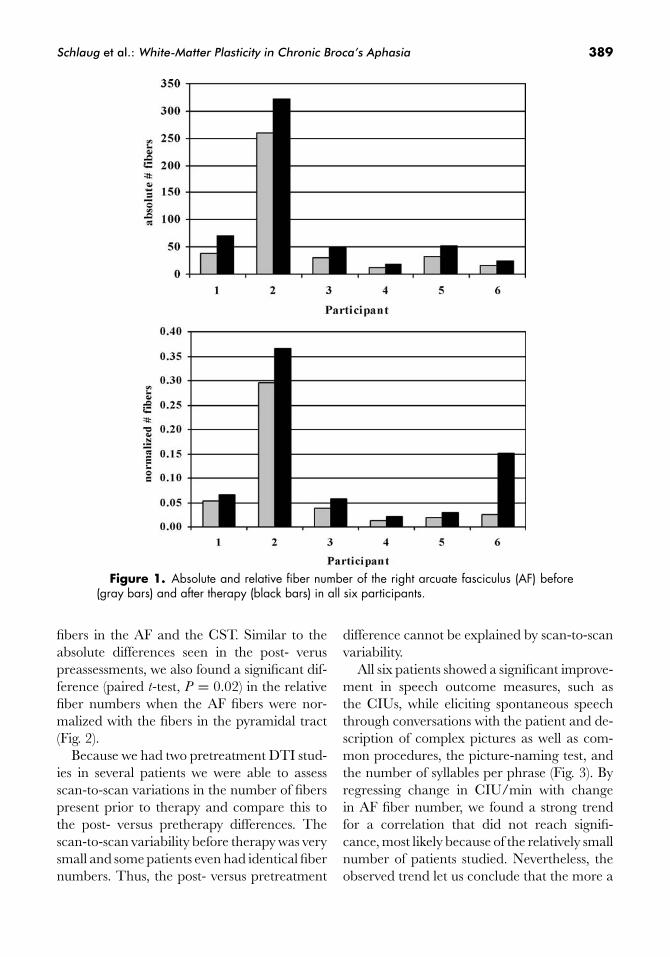
Because we had two pretreatment DTI stud-ies in several patients we were able to assessscan-to-scan variations in the number of fiberspresent prior to therapy and compare this tothe post- versus pretherapy differences. Thescan-to-scan variability before therapy was verysmall and some patients even had identical fibernumbers. Thus, the post- versus pretreatment
difference cannot be explained by scan-to-scanvariability.
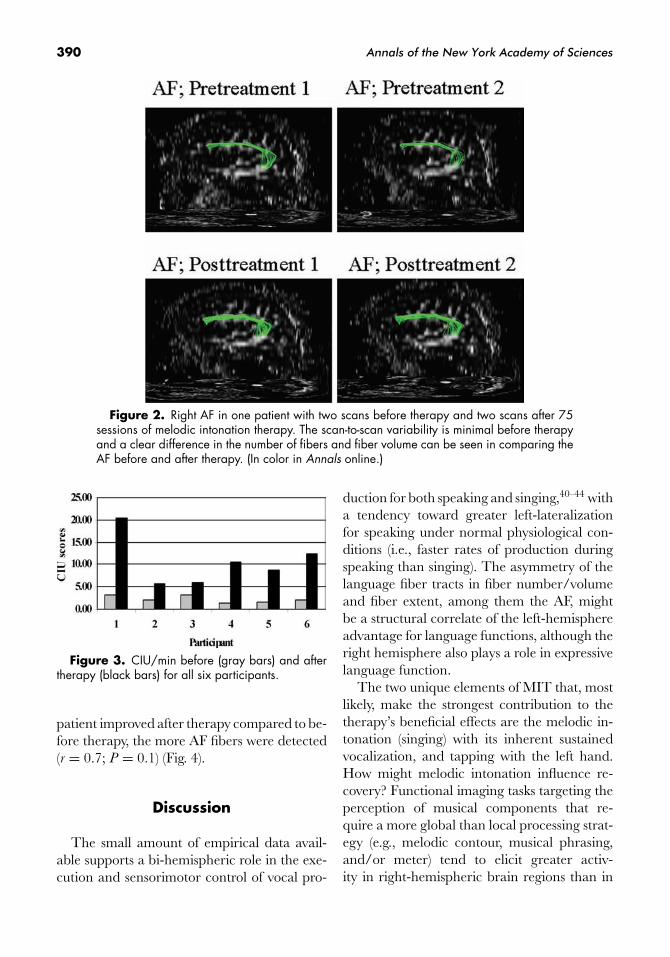
All six patients showed a significant improve-ment in speech outcome measures, such asthe CIUs, while eliciting spontaneous speechthrough conversations with the patient and de-scription of complex pictures as well as com-mon procedures, the picture-naming test, andthe number of syllables per phrase (Fig. 3). Byregressing change in CIU/min with changein AF fiber number, we found a strong trendfor a correlation that did not reach signifi-cance, most likely because of the relatively smallnumber of patients studied. Nevertheless, theobserved trend let us conclude that the more a
390 Annals of the New York Academy of Sciences
Figure 2. Right AF in one patient with two scans before therapy and two scans after 75sessions of melodic intonation therapy. The scan-to-scan variability is minimal before therapyand a clear difference in the number of fibers and fiber volume can be seen in comparing theAF before and after therapy. (In color in Annals online.)
Figure 3. CIU/min before (gray bars) and aftertherapy (black bars) for all six participants.
patient improved after therapy compared to be-fore therapy, the more AF fibers were detected(r = 0.7; P = 0.1) (Fig. 4).
Discussion
The small amount of empirical data avail-able supports a bi-hemispheric role in the exe-cution and sensorimotor control of vocal pro-
duction for both speaking and singing,40–44 witha tendency toward greater left-lateralizationfor speaking under normal physiological con-ditions (i.e., faster rates of production duringspeaking than singing). The asymmetry of thelanguage fiber tracts in fiber number/volumeand fiber extent, among them the AF, mightbe a structural correlate of the left-hemisphereadvantage for language functions, although theright hemisphere also plays a role in expressivelanguage function.
The two unique elements of MIT that, mostlikely, make the strongest contribution to thetherapy’s beneficial effects are the melodic in-tonation (singing) with its inherent sustainedvocalization, and tapping with the left hand.How might melodic intonation influence re-covery? Functional imaging tasks targeting theperception of musical components that re-quire a more global than local processing strat-egy (e.g., melodic contour, musical phrasing,and/or meter) tend to elicit greater activ-ity in right-hemispheric brain regions than in

Schlaug et al.: White-Matter Plasticity in Chronic Broca’s Aphasia 391
Figure 4. Correlation between absolute change in CIU/min and absolute change innumber of AF fibers.
left-hemispheric regions. It has been shownthat tasks that emphasize spectral informa-tion over temporal information have shownmore right- than left-hemispheric activation.45
Similarly, patients with right-hemisphere le-sions have greater difficulty with global process-ing (e.g., melody and contour processing) thanthose with left-hemisphere lesions.46,47 Thus,it is possible that the melodic element of MITengages the right hemisphere, particularly theright temporal lobe, more than therapies thatdo not make use of pitch or melody. Further-more, using melody and emphasizing prosodicfeatures will lead to a general reduction in thevocalization rate as syllables are lengthened and“chunked” into larger structures.
The effects of tapping the left hand shouldbe considered in the same context. Once theright temporal lobe is specifically engaged bythe melodic intonation and melodic contour,it is conceivable that the role of the left hand-tapping could be the activation and priming ofa right-hemispheric sensorimotor network forarticulation. Since concurrent speech and handuse occurs in daily life, and gestures are fre-quently used during speech, hand movements,possibly in synchrony with articulatory move-ments, may have a facilitating effect on speechproduction, but the precise role of this facilita-tion is unknown. We hypothesize that tapping
the left hand may engage a right-hemisphericsensorimotor network that coordinates not onlyhand movements but orofacial and articula-tory movements as well. There is some evi-dence in the literature that such superordinatecenters exist in the premotor cortex and shareneural substrates for hand and orofacial move-ments.48–50 Furthermore, behavioral,51 neuro-physiological,48,49 and fMRI studies52–54 haveshown that motor and linguistic cortical rep-resentations of objects are closely linked, andthat the premotor cortex may belong to an in-tegrative network coordinating motor and lin-guistic expression. An additional or alterna-tive explanation is that the left hand tappingmay serve the same function as a pacemaker ormetronome has in rehabilitation of other mo-tor activities, and in so doing, may facilitatespeech production through rhythmic anticipa-tion, rhythmic entrainment, or auditory-motorcoupling.54–56
The structural changes that we have detectedin the AF must be seen in the context of whatMIT actually does and the potential benefitthat a patient may derive from the therapy. It isvery clear that for the therapy to work well, thetemporal lobe must strengthen its connectionswith the frontal lobe in order to provide fastfeedback mechanisms for vocal articulation andfor auditory-motor coupling54–56 to take place
392 Annals of the New York Academy of Sciences
in the right hemisphere. Mapping sounds tovocal motor actions is more of a left-hemispherefunction, but that function is typically destroyedas part of the stroke that causes Broca’s aphasia.Furthermore, the inferior frontal lobe needs toconnect quickly with the premotor and motorregions in order to plan, prepare, and executevocal actions. This feedforward system may beunder corrective and/or adaptive control of thesensory feedback system in order to improve theauditory-motor mapping.54–56
In this context, it would make sense that thetract that provides the connections betweenthese major regions undergoes remodeling aspart of the long-term therapy, in particular, ifthe therapy specifically engages the brain com-ponents that are part of this tract. Moreover,since the right AF is known to have slightlyless volume and appears to be slightly shorterthan it is on the left, it is also not surprisingthat the major change that seems to be oc-curring is in fiber number/volume, and pos-sibly fiber length as we have seen in some ofour patients. The components that underliethis structural change are not clear. Becauseour analysis suggests that there are more fibers,and we know that there is also more volumein this tract, it is possible that the myeliniza-tion of axons increases and that there is eitheradditional axon growth or axon collaterals arebeing formed.57 Furthermore, it is also possiblethat there are other physical changes to mem-branes that make fibers more traceable. Exper-imental studies in monkeys have shown thatremodeling of fiber tracts, such as the forma-tion of axon collateral, can happen after a focalstroke.57 The establishment of axon collateralsin the affected hemisphere may actually changethe cytoarchitecture in these regions, which, inturn, has direct effects on the diffusion of watermolecules: the lower the alignment in the archi-tecture, the lower the directionality in diffusion(and vice versa), consequently affecting fiberreconstruction.
It is clear that this change is not due to nor-mal fluctuations in the measured parameters,since the variability between two DTI scans
and their derived measures prior to therapywas very small, and the magnitude of changeseen in the post- versus pretherapy compar-isons was way beyond the level of scan-to-scanvariability. It is possible that the remodelingof the AF might be triggered by the need forstronger, more effective connections betweenspeech-relevant brain regions in the right hemi-sphere. This remodeling could involve changesnot only in myelination, but also in the ax-ons themselves, possibly through the formationof axon collaterals, which could account forthe increased number of fibers detected aftertherapy.
Acknowledgments
This work was supported in part bygrants from the National Institute ofHealth (NS045049, DC008796), the GrammyFoundation, and the Mattina R. ProctorFoundation.
Conflicts of Interest
The authors declare no conflicts of interest.
References
1. Kertesz, A., Lesk, D. & P. McCabe. 1977. Isotopelocalization of infarcts in aphasia. Arch. Neurol. 100:1–18.
2. Glasser, M.F. & J.K. Rilling. 2008. DTI tractographyof the human brain’s language pathway. Cereb. Cortex
18: 2471–2482.3. Robey, R.R. 1994. The efficacy of treatment for
aphasic persons: a metanalysis. Brain Lang. 47: 582–608.
4. Weiller, C., C. Isensee, M. Rijntjes, et al. 1995. Re-covery from Wernicke’s aphasia: a positron emis-sion tomographic study. Ann. Neurol. 37: 723–732.
5. Heiss, W.D., J. Kessler, A. Thiel, et al. 1999. Differ-ential capacity of left and right hemispheric areas forcompensation of poststroke aphasia. Ann. Neurol. 45:430–438.
6. Cappa, S. & G. Vallar. 1992. The role of left and righthemispheres in recovery from aphasia. Aphasiology 6:356–372.
Schlaug et al.: White-Matter Plasticity in Chronic Broca’s Aphasia 393
7. Rosen, H.J., S.E. Petersen, M.R. Linenweber, et al.2000. Neural correlates of recovery from aphasia af-ter damage to left inferior frontal cortex. Neurology 55:1883–1894.
8. Winhuisen, L., A. Thiel, B. Schumacher, et al. 2005.Role of the contralateral inferior frontal gyrus in re-covery of language function in poststroke aphasia: acombined repetitive transcranial magnetic stimula-tion and positron emission tomography study. Stroke
36: 1759–1763.9. Heiss, W. D. & A. Thiel. 2006. A proposed regional
hierarchy in recovery of post-stroke aphasia. Brain
Lang. 98: 118–123.10. Saur, D., R. Lange, A. Baumgaertner, et al. 2006.
Dynamics of language reorganization after stroke.Brain 129: 1371–1384.
11. Schlaug, G., S. Marchina & A. Norton. 2008. Fromsinging to speaking: why singing may lead to recov-ery of expressive language function in patients withBroca’s aphasia. Music Percept. 25: 315–323.
12. Cornelissen, K., M. Laine, A. Tarkiainen, et al. 2003.Adult brain plasticity elicited by anomia treatment.J. Cogn. Neurosci. 15: 444–461.
13. Musso, M., C. Weiller, S. Kiebel, et al. 1999.Training-induced brain plasticity in aphasia. Brain
122: 1781–1790.14. Small, S.L., D.K. Flores & D.C. Noll. 1998. Different
neural circuits subserve reading before and after ther-apy for acquired dyslexia. Brain Lang. 62: 298–308.
15. Thompson, C.K. & L.P. Shapiro. 2005. Treatingagrammatic aphasia within a linguistic framework:treatment of underlying forms. Aphasiology 19: 10–11.
16. Basser, P.J., J. Mattiello & D. LeBihan. 1994. MRdiffusion tensor spectroscopy and imaging. Biophys. J.
66: 259–267.17. Mori, S. & Zhang, J. 2006. Principles of diffusion ten-
sor imaging and its applications to basic neuroscienceresearch. Neuron 51: 527–539.
18. Jones, D.K. 2008. Studying connections in the livinghuman brain with diffusion MRI. Cortex 44: 936–952.
19. Albert, M.L., R.W. Sparks & N.A. Helm. 1973.Melodic intonation therapy for aphasia. Arch. Neurol.
29: 130–131.20. Sparks, R., N. Helm & M. Albert. 1974. Aphasia re-
habilitation resulting from melodic intonation ther-apy. Cortex 10: 303–316.
21. Gerstman, H.L. 1964. A case of aphasia. J. Speech
Hear. Disord. 29: 89–91.22. Geschwind, N. 1971. Current concepts: aphasia. New
Engl. J. Med. 284: 654–656.23. Hebert, S., A. Racette, L. Gagnon & I. Peretz.
2003. Revisiting the dissociation between singing andspeaking in expressive aphasia. Brain 126: 1–13.
24. Keith, R.L. & A.E. Aronson. 1975. Singing as therapyfor apraxia of speech and aphasia: report of a case.Brain Lang. 2: 483–488.
25. Kinsella, G., M.R. Prior & G. Murray. 1988. Singingability after right and left sided brain damage: a re-search note. Cortex 24: 165–169.
26. Basser, P.J., S. Pajevic, C. Pierpaoli, et al. 2000. Invivo fiber tractography using DT-MRI data. Magn.
Reson. Med. 44: 625–632.27. Mori, S., B.J. Crain, V.P. Chacko & P.C. van Zijl.
1999. Three-dimensional tracking of axonal projec-tions in the brain by magnetic resonance imaging.Ann. Neurol. 45: 265–269.
28. Jones, D.K., M.A. Horsfield & A. Simmons.1999. Optimal strategies for measuring diffusion inanisotropic systems by magnetic resonance imaging.Magn. Reson. Med. 42: 515–525.
29. Fillard, P., N. Toussaint & X. Pennec. 2006. Med-
INRIA: DT-MRI Processing and Visualization Software.Guest Paper at the Similar Tensor Workshop, LasPalmas, Spain.
30. Thomas, B., M. Eyssen, R. Peeters, et al. 2005. Quan-titative diffusion tensor imaging in cerebral palsy dueto periventricular white matter injury. Brain 128:2562–2577.
31. Schaechter, J.D., K.L. Perdue & R. Wang. 2008.Structural damage to the corticospinal tract corre-lates with bilateral sensorimotor cortex reorganiza-tion in stroke patients. NeuroImage 39: 1370–1382.
32. Weinstein, D.M., G.L. Kindlmann & E.C. Lundberg.1999. Tensorlines: advection-diffusion based propa-gation through diffusion tensor fields. In Proceedings of
IEEE Visualization 1999: 249–254.33. Lawes, I.N., T.R. Barrick, V. Murugam, et al. 2008.
Atlas-based segmentation of white matter tracts ofthe human brain using diffusion tensor tractographyand comparison with classical dissection. NeuroImage
39: 62–79.34. Wakana, S., H. Jiang, L.M. Nage-Poetscher, et al.
2004. Fiber tract-based atlas of human white matteranatomy. Radiology 230: 77–87.
35. Kretschmann, H.J. 1988. Localisation of the corti-cospinal fibres in the internal capsule in man. J. Anat.
160: 219–225.36. Holodny, A.I., D.M. Gor, R. Watts, et al. 2005.
Diffusion-tensor MR tractography of somatotopic or-ganization of corticospinal tracts in the internal cap-sule: initial anatomic results in contradistinction toprior reports. Radiology 234: 649–653.
37. Kim, Y.H., D.S. Kim, J.H. Hong, et al. 2008. Corti-cospinal tract location in internal capsule of humanbrain: diffusion tensor tractography and functionalMRI study. Neuroreport 19: 817–820.
38. Zarei, M., H. Johansen-Berg, M. Jenkinson, et al.2007. Two-dimensional population map of cortical
394 Annals of the New York Academy of Sciences
connections in the human internal capsule. J. Magn.
Reson. Imaging 25: 48–54.39. Talairach, J. & P. Tournoux. 1988. Co-Planar Stereotaxic
Atlas of the Human Brain. Thieme. New York, Stuttgart.40. Bohland, J.W. & F.H. Guenther. 2006. An fMRI in-
vestigation of syllable sequence production. NeuroIm-
age 32: 821–841.41. Brown, S., M.J. Martinez, D.A. Hodges, et al. 2004.
The song system of the human brain. Brain Res. Cogn.
Brain Res. 20: 363–75.42. Guenther, F.H., M. Hampson & D. Johnson. 1998.
A theoretical investigation of reference frames forthe planning of speech movements. Psychol. Rev. 105:611–633.
43. Jeffries, K.J., J.B. Fritz & A.R. Braun. 2003. Wordsin melody: an H215O PET study of brain activa-tion during singing and speaking. Neuroreport 14: 749–745.
44. Ozdemir, E., A. Norton & G. Schlaug. 2006. Sharedand distinct neural correlates of singing and speaking.NeuroImage 33: 628–635.
45. Zatorre, R.J. & P. Belin. 2001. Spectral and temporalprocessing in human auditory cortex. Cereb. Cortex 11:946–953.
46. Peretz, I. 1990. Processing of local and global mu-sical information by unilateral brain-damaged pa-tients. Brain 113: 1185–1205.
47. Schuppert, M., T.F. Munte, B.M. Wieringa &E. Altenmuller. 2000. Receptive amusia: evidencefor cross-hemispheric neural networks underly-ing music processing strategies. Brain 123: 546–559.
48. Meister, I.G., B. Boroojerdi, H. Foltys, et al. 2003.
Motor cortex hand area and speech: implicationsfor the development of language. Neuropsychologia 41:401–406.
49. Tokimura, H., Y. Tokimura, A. Oliviero, et al. 1996.Speech-induced changes in corticospinal excitability.Ann. Neurol. 40: 628–634.
50. Uozumi, T., A. Tamagawa, T. Hashimoto & S. Tsuji.2004. Motor hand representation in cortical area 44.Neurology 62: 757–761.
51. Gentilucci, M., F. Benuzzi, L. Bertolani, et al. 2000.Language and motor control. Exp. Brain Res. 133:468–490.
52. Aziz-Zadeh, L., S.M. Wilson, G. Rizzolatti & M. Ia-coboni. 2006. Congruent embodied representationsfor visually presented actions and linguistic phrasesdescribing actions. Curr. Biol. 16: 1818–1823.
53. Koelsch, S., T. Fritz, K. Schulze, et al. 2005. Adultsand children processing music: an fMRI study. Neu-
roImage 25: 1068–1076.54. Lahav, A., E. Saltzman & G. Schlaug. 2007. Ac-
tion representation of sound: audiomotor recognitionnetwork while listening to newly-acquired actions. J.
Neurosci. 27: 308–314.55. Bangert, M. & E. Altenmuller. 2003. Mapping per-
ception to activation in piano practice: a longitudinalDC-EEG study. BMC Neurosci. 4: 26.
56. Bangert, M., T. Peschel, G. Schlaug, et al. 2006.Shared networks for auditory and motor processingin professional pianists: evidence from fMRI conjuc-tion. NeuroImage 30: 917–926.
57. Dancause, N., S. Barbay, S.B. Frost, et al. 2005. Ex-tensive cortical rewiring after brain injury. J. Neurosci.
25: 10167–10179.
Copyright © 2022 FDOKUMEN