Word Production and Executive Control in Bilingual Aphasia
266
UNIVERSITY OF READING Word Production and Executive Control in Bilingual Aphasia Thesis submitted for the degree of Doctor of Philosophy School of Psychology and Clinical Language Sciences Abhijeet Patra September 2017
-
Upload
khangminh22 -
Category
Documents
-
view
2 -
download
0
Transcript of Word Production and Executive Control in Bilingual Aphasia

UNIVERSITY OF READING
Word Production and Executive Control in Bilingual Aphasia
Thesis submitted for the degree of Doctor of Philosophy
School of Psychology and Clinical Language Sciences
Abhijeet Patra
September 2017

ii
DECLARATION OF ORIGINAL AUTHORSHIP
I confirm that this is my own work and the use of all material from other sources has been
properly and fully acknowledged.
Abhijeet Patra
iii
Acknowledgement
My dream of pursuing PhD would not have been possible without the support of Felix Trust.
With great appreciation, I thank Felix Trust and University of Reading for giving me the
opportunity to pursue this wonderful academic journey. I am also grateful to all my
participants, especially individuals with aphasia who gave their valuable time and effort for
this project. I thank Suporno da and my friends for helping me to recruit participants in India
and UK.
I give many thanks to my primary supervisor Dr Arpita Bose who has spent countless
hours supervising me, teaching me how to write scientifically, present my findings to general
audience. I would also like to thank my co-supervisor Prof Theo Marinis for providing his
valuable guidance and be there whenever I needed him. To my faculty, from Centre of
Behavioural and Cognitive Sciences, Allahabad, India (Specifically Prof Bhoomika R. Kar
and Prof. Narayanan Srinivasan) – you believed in my potential and strength. Thank you.
From personal front, I thank my parents, Harekrishna and Kabita Patra and my
beloved brother, Pabitra who always encouraged me to pursue my dream, without their
support this journey would not have been possible. My words will never be enough to express
how lucky I am to have parents and brother like you.
Finally, I am grateful to my best buddy and wife, Doyel, who provided me with all the
support and strength I needed during this period. You are amazing love! I also extend my
appreciation to my father-in-law (Ratan Roychowdhury), mother-in-law (Kshama
Roychowdhury) and all other relatives for their encouragement and believe in me.

iv
Table of Contents
Abstract .......................................................................................................................... 1
Chapter 1. General Introduction .................................................................................... 3
1.1 Introduction .............................................................................................................. 4
1.1.1 Phase I (Healthy bilinguals versus monolinguals) ....................................... 6
1.1.1.1 Differences in word production mechanisms. ............................................ 7
1.1.1.2 Experimental findings on linguistic measures. ........................................... 8
1.1.1.3 Experimental findings on executive control measures. ............................ 10
1.1.1.4 Motivation for choosing the linguistic tasks. ............................................ 11
1.1.2 Phase II (bilinguals with aphasia versus bilingual healthy adults) ................. 14
1.1.2.1 Experimental findings on linguistic measures. ......................................... 15
1.1.2.2 Experimental findings on executive control measures. ............................ 16
1.1.2.3 Motivation for choosing the linguistic tasks. ............................................ 19
1.1.3 Methodological Consideration ........................................................................ 21
1.1.3.1 Implications for aphasia. ........................................................................... 23
1.1.4 Linguistic Differences between Bengali and English and the Implications .... 25
Chapter 2. Verbal Fluency and Executive Control in Healthy Monolingual and
Bilingual Speakers ................................................................................................................... 31
2.1 Abstract .................................................................................................................. 32
2.2 Introduction ............................................................................................................ 34
2.3 The Current Investigation, Research Questions and Predictions ........................... 42
2.4 Methods.................................................................................................................. 44
2.4.1 Participants ...................................................................................................... 44
2.4.2 Background and Executive Control Measures ................................................ 46
2.4.2.1 Bilingualism measures. ............................................................................. 46
2.4.2.2 Vocabulary tests. ...................................................................................... 47
2.4.2.3 Inhibitory control (Stroop task). ............................................................... 47
2.4.2.4 Mental-set shifting (colour-shape switch task). ........................................ 48

v
2.4.2.5 Working memory (backward digit span). ................................................. 50
2.4.3 Verbal Fluency Measures ................................................................................ 50
2.4.3.1 Trials and procedures................................................................................ 50
2.4.3.2 Data coding and analysis. ......................................................................... 51
2.4.3.2.1 Total number of correct responses (CR). ....................................................... 51
2.4.3.2.2 Fluency difference score (FDS). .................................................................... 51
2.4.3.2.3 Time-course analysis variables. ..................................................................... 51
2.4.3.2.3.1 1st-RT. ..................................................................................................... 52
2.4.3.2.3.2 Sub-RT. ................................................................................................... 52
2.4.3.2.3.3 Initiation parameter. ................................................................................ 53
2.4.3.2.3.4 Slope. ....................................................................................................... 53
2.4.3.2.4 Qualitative analysis. ....................................................................................... 53
2.4.3.2.4.1 Mean cluster size. .................................................................................... 54
2.4.3.2.4.2 Number of switches. ................................................................................ 54
2.4.3.2.4.2 Within-cluster pauses. ............................................................................. 54
2.5 Statistical Analysis ................................................................................................. 55
2.6 Results .................................................................................................................... 56
2.6.1 Background and Executive Control Measures ........................................... 56
2.6.2 Group Differences in Verbal Fluency Performance ........................................ 61
2.6.4 Verbal Fluency Performance and Executive Control Measures ..................... 65
2.7 Discussion .............................................................................................................. 67
Chapter 3. Semantic Context Effects and Executive Control in Healthy Monolingual
and Bilingual Speakers ............................................................................................................ 72
3.1 Abstract .................................................................................................................. 73
3.2 Introduction ............................................................................................................ 75
3.2.1 Central Findings: Blocked-Cyclic Naming ..................................................... 77
3.2.2 Executive Control and Blocked-Cyclic Naming ............................................. 79
3.3 The Current Investigation, Research Questions and Predictions ........................... 83
3.4 Methods.................................................................................................................. 84

vi
3.4.1 Participants ...................................................................................................... 84
3.4.2 Blocked-Cyclic Picture Naming Task ............................................................. 84
3.4.2.1 Materials. .................................................................................................. 84
3.4.2.2 Design. ...................................................................................................... 85
3.4.2.3 Procedures. ............................................................................................... 86
3.4.2.4 Scoring. ..................................................................................................... 86
3.5 Statistical Analysis ................................................................................................. 86
3.6 Results .................................................................................................................... 87
3.6.1 Group Differences in Blocked-Cyclic Naming Performance ......................... 90
3.6.2 Blocked-Cyclic Naming Performance and Executive Control Measures ....... 91
3.7 Discussion .............................................................................................................. 93
Chapter 4. Verbal Fluency in Bilingual Aphasia: Linguistic and Executive Control
Contribution ............................................................................................................................. 98
4.1 Abstract .................................................................................................................. 99
4.2 Introduction .......................................................................................................... 101
4.3 The Current Investigation, Research Questions and Predictions ......................... 104
4.4 Method ................................................................................................................. 106
4.4.1 Participants .................................................................................................... 106
4.4.2 Language Background and Executive Control Measures ............................. 107
4.4.2.1 Bilingualism measures. ........................................................................... 107
4.4.2.2 Western Aphasia Battery-Revised (WAB-R). ........................................ 113
4.4.2.3 Croft’s test battery. ................................................................................. 116
4.4.2.3.1 Spoken word-to-picture matching................................................................ 117
4.4.2.3.2 Picture naming. ............................................................................................ 117
4.4.2.3.3 Repetition. .................................................................................................... 119
4.4.2.3.4 Reading aloud. ............................................................................................. 125
4.4.2.4 Inhibitory control (Stroop tests). ............................................................ 125
4.4.2.5 Shifting between task-sets (Trail Making Test). .................................... 126

vii
4.4.2.6 Working memory (Digit span test). ........................................................ 126
4.4.3 Verbal Fluency Measures .............................................................................. 128
4.4.3.1 Trials and procedure. .............................................................................. 128
4.4.3.2 Data coding and analysis. ....................................................................... 128
4.5 Statistical Analysis ............................................................................................... 128
4.6 Results .................................................................................................................. 129
4.6.1 Group Differences in Verbal Fluency Performance ...................................... 129
4.6.2 Verbal Fluency Performance at Individual Level ......................................... 135
4.6.2 Verbal Fluency Performance and Executive Control Measures ................... 135
4.7 Discussion ............................................................................................................ 139
Chapter 5. Cognate Production and Executive Control in Bilingual Aphasia ........... 148
5.1 Abstract ................................................................................................................ 149
5.2 Introduction .......................................................................................................... 151
5.2.1 Cognate Effects ............................................................................................. 152
5.2.2 Cognate Effects and Executive Control ........................................................ 156
5.3 The Current Investigation, Research Questions and Predictions ......................... 158
5.4 Method ................................................................................................................. 159
5.4.1 Participants .................................................................................................... 159
5.4.2 Cognate Picture Naming ............................................................................... 159
5.4.2.1 Stimuli. ................................................................................................... 159
5.4.2.2 Procedure. ............................................................................................... 162
5.4.2.3 Scoring. ................................................................................................... 162
5.5 Statistical Analysis ............................................................................................... 163
5.5.1 Group Analysis .............................................................................................. 163
5.5.2 Within-Group Analysis ................................................................................. 163
5.5.3 Error Analysis ............................................................................................... 163
5.5.4 Individual Level Analysis ............................................................................. 164

viii
5.5.5 Item-Wise Analysis ....................................................................................... 164
5.5.6 Correlational Analysis ................................................................................... 164
5.6 Results .................................................................................................................. 165
5.6.1 Cognate Effects at the Group Level .............................................................. 176
5.6.2 Cognate Effects at the Within-Group Level .................................................. 176
5.6.3 Cognate Effects on Naming Error ................................................................. 177
5.6.4 Individual Level Analysis ............................................................................. 177
5.6.5 Item-wise Analysis ........................................................................................ 178
5.6.6 Cognate Variables and Executive Control Measures .................................... 178
5.7 Discussion ............................................................................................................ 179
Chapter 6: General Discussion................................................................................... 184
6.1 General Discussion .............................................................................................. 185
6.1.1 Review and Contribution from the Experimental Chapters .......................... 188
6.1.2 Study Limitations and Future Directions ...................................................... 196
6.1.2.1 Participants groups and characteristics. .................................................. 196
6.1.2.2 Experimental tasks .................................................................................. 199
6.1.2.3 Executive control tasks. .......................................................................... 200
6.1.3 Conclusion ..................................................................................................... 201
Appendices ............................................................................................................... 2022
Appendix 2.1. Example of an Information Sheet and Consent Form ...................... 2033
Appendix 2.2. Language Background Questionnaire .............................................. 2055
Appendix 2.3. Stroop Ratio Calculation Example ................................................... 2177
Appendix 2.4. Subcategory Classification for the Semantic and Letter Fluency ... 2188
Appendix 2.5. Raw Data of Each Individual on the Demographic Variables and
Objective Language Tests .................................................................................................... 2233
Appendix 2.6. Raw Data of Each Individual on the Subjective Language Measures
.............................................................................................................................................. 2255
Appendix 2.7. Raw Data of Each Individual on the Executive Control Measures . 2266

ix
Appendix 2.8. Correlation Between Executive Control and Vocabulary Measures
.............................................................................................................................................. 2277
Appendix 4.1 Example of Information Sheet and Consent Form ............................ 2288
Appendix 4.2 Raw Data of Each BWA and BHA on the Executive Control Measures
.............................................................................................................................................. 2300
References ................................................................................................................ 2311

x
List of Figures
Chapter 1
Figure 1.1 Revised hierarchical model ...................................................................................... 7
Figure 1.2 Schematic representation of the monolingual (left panel) and bilingual (right
panel) system. . .......................................................................................................................... 8
Figure 2.1 Time course of correct responses over twelve 5-sec bins. ..................................... 37
Figure 2.2 Time course of correct responses over twelve 5-sec bins. ..................................... 52
Figure 2.3 Comparison of mean number of correct responses (CR) between the groups by
fluency condition (semantic and letter). ................................................................................... 63
Figure 2.4 Comparison of mean proportion fluency difference scores (FDS) between the
groups. ...................................................................................................................................... 64
Figure 2.5 Comparison of mean cluster size between the groups by fluency condition
(semantic and letter). ................................................................................................................ 64
Figure 2.6 Comparison of mean between cluster pauses (BCP) between the groups by fluency
condition (semantic and letter)................................................................................................. 64
Figure 2.7 Comparison of number of correct responses (CR) produced as a function of 5-sec
time intervals in the semantic (top panel) and letter fluency (bottom panel) conditions
between the groups. . ............................................................................................................... 65
Figure 2.8 Correlation plots for the significant correlations between the Stroop ratio and slope
of verbal fluency (top panel) .................................................................................................... 66
Figure 3.1 Example of a semantically homogeneous set and heterogeneous set ..................... 76
Figure 3.2. Schematic representation of a blocked-cyclic naming design with five items per
category across five presentation cycles.. ................................................................................ 77
Figure 3.3 Blocked cyclic naming design with five items per category. ................................. 85
Figure 3.4 Mean RT by context (homogeneous and heterogeneous) for each group (bilingual
and monolingual) for each presentation cycle.. ....................................................................... 90
Figure 3.5 Mean RT by context (homogeneous and heterogeneous) for each group (bilingual
and monolingual) averaged across all the presentation cycles (left panel) and excluding cycle
1 (right panel). .......................................................................................................................... 90
Figure 4.1 All the three-way and two-way significant interactions are presented................. 134
Figure 4.2 Comparison of number of correct responses (CR) produced as a function of 5-sec
time intervals in the semantic and letter fluency conditions between the groups for English
(left panel) and Bengali (right panel). .................................................................................... 134
Figure 4.3 Correlation plots for the significant correlations between the Stroop ratio and
verbal fluency parameters for the two groups.. ...................................................................... 138
Figure 5.1 Schematic representation of the cognate word production (left panel) and non-
cognate word production (right panel). .................................................................................. 152

xi
Figure 5.2 Cognate effects regarding accuracy (%, left panel) and RT (msec, right panel) for
the BWA and BHA group. ..................................................................................................... 174
Figure 5.3 Cognate effects regarding accuracy (%, left panel) and RT (msec, right panel) for
each BWA individual. ............................................................................................................ 174
Figure 5.4 Correlation plots for the significant correlations amongst the executive control
measures and cognate effects in accuracy (English) for the two groups. ............................. 175
Figure 5.5 Correlation plots for the significant correlations amongst the executive control
measures and proportion difference score in accuracy for the two groups............................ 175

xii
Lists of Tables
Chapter 1
Table1.1 Inventory of Bengali Consonants .............................................................................. 27
Table1.2 Inventory of Bengali Vowels ..................................................................................... 27
Table1.3 Summary of the Experimental Chapters with the Research Questions and
Methodology ............................................................................................................................ 29
Table2.1 Contribution of Verbal Fluency Variables to the Linguistic and Executive Control
Components.............................................................................................................................. 36
Table2.2 Mean (M), Minimum (Min) and Maximum (Max) values, Standard Deviations (SD),
and Statistical Results of the Demographic Variables and Raven’s SPM-plus. ...................... 46
Table2.3 Mean (M), Minimum (Min) and Maximum (Max) values, Standard Deviations (SD),
and Statistical Results of Bilinguals’ Subjective Language Profile......................................... 58
Table2.4 Mean (M), Minimum (Min) and Maximum (Max) values, Standard Deviations (SD),
and Statistical Results of Receptive vocabulary and Executive Control Measures. ................ 59
Table2.5 Means (M), Standard Deviations (SD) and the Statistical Results of the Dependent
Variables by Group (Bilingual and Monolingual) and Conditions (averaged across trials).. 60
Table2.6 Best Fitting Multilevel Model Functions for the Time Course of Correct Responses
in Verbal Fluency Task. ........................................................................................................... 61
Table 2.7 Correlation Coefficients amongst the Executive Control Measures and the Verbal
Fluency Variables. ................................................................................................................... 61
Table2.8 Results of Current Study in the Context of Verbal Fluency Variables and to their
Linguistic and Executive Control Components........................................................................ 68
Table3.1 Means (M), Standard Deviations (SD) and the Statistical Results of the Dependent
Variables (Hom for Homogeneous and Het for Heterogeneous) for all cycles ....................... 88
Table3.2 Means (M), Standard Deviations (SD) and the Statistical Results of the Dependent
Variables (Hom for Homogeneous and Het for Heterogeneous) excluding cycle1. ................ 89
Table3.3 Means (M), Standard Deviations (SD) and the Statistical Results of the Dependent
Variables for Cycle 1 only. ...................................................................................................... 89
Table3.4 Correlation Coefficients amongst the Executive Control Measures and the Blocked
Cyclic Naming Variables ......................................................................................................... 92
Table4.1 Demographic Profiles of each BWA, Mean and Standard Deviations of BWA and
BHA Groups and the Statistical Results Comparing the Groups. ......................................... 109
Table4.2 Demographic Profiles of each BHA. ...................................................................... 110
Table4.3 Self-reported Language Background Questionnaire Scores of each BWA, Means
and Standard Deviations of BWA and BHA Groups and the Statistical Results Comparing the
Groups.................................................................................................................................... 111

xiii
Table4.4 Self-reported Language Background Questionnaire Scores of each BHA, Means and
Standard Deviations………………………………………………………………………………….112
Table4.5 Western Aphasia Battery Test Scores in Bengali and English of each BWA. ....... 114
Table4.6 Connected speech elicited through the Picnic Picture description for Each BWA in
the Bengali and English version of Western Aphasia Battery. Dots indicate pauses. ........... 115
Table4.7 Test Scores (%) in Naming and Repetition subtests of Croft’s Test Battery in Each
Language and Averaged across Languages for Each BWA and the Statistical Results of
Between Task Effects.............................................................................................................. 120
Table4.8 Accuracy (Raw score and %) in Language Background Test Scores of BWA using
Croft’s Test Battery. ............................................................................................................... 121
Table4.9 Classification of Naming Responses of BWA with Examples from English. .......... 122
Table4.10 Accuracy and Error Classifications of BWA in Bengali (B) and English (E) in
Croft’s Naming Task. ............................................................................................................. 123
Table4.11 Accuracy and Error Classifications of BWA in Bengali (B) and English (E) in
Croft’s Repetition Task. ......................................................................................................... 124
Table4.12 Mean Values (M), Standard Deviations (SD) and the Statistical Results of the
Executive Control Measures by Group. ................................................................................. 127
Table4.13 Mean Values (M), Standard Deviations (SD) and the Statistical Results of the
Executive Control Measures for each BWA. .......................................................................... 127
Table4.14 Means (M), Standard Deviations (SD) and the Statistical Results of the Dependent
Variables by Group (BWA: Bilingual with aphasia; BHA: Bilingual Healthy Adults),
Conditions (averaged across trials), and Language (Bengali and English) ......................... 133
Table4.15 Raw score of each BWA in semantic and letter fluency condition for the verbal
fluency variables .................................................................................................................... 135
Table4.16 Correlation Coefficients between the Executive Control Measures and the Verbal
Fluency Variables for Each Group. ....................................................................................... 137
Table4.17 Results of the Current Study in the Context of the Verbal Fluency Variables and
their Linguistic and Executive Control Components. ............................................................ 140
Table5.1 Stimuli List (Cognates and Non-Cognates) and their Syllable Lengths (SL),
Familiarity Ratings (FR) in English and Bengali (in IPA Format). ...................................... 161
Table5.2 Stimuli Characteristics for Cognates (Cog) and Non-cognates (Non-cog) in Bengali
(B) and English (E) and the Statistical Results of the Dependent Variables. ........................ 162
Table5.3 Each Participant’s Performance (Accuracy1 and RT) in Cognate (Cog) and Non-
cognate (Non-cog) Picture Naming Tasks across Languages. .............................................. 166
Table5.4 Mean values (M), Standard Deviations (SD) of Conditions (Cognate, Non-cognate)
across Languages (Bengali, English) and Groups (BWA, BHA) and the Statistical Results of
the Dependent Variables. ....................................................................................................... 167

xiv
Table5.5 Mean values (M), Standard Deviations (SD) of Conditions (Cognate, Non-cognate)
across Languages (Bengali, English) for Each Group and the Statistical Results of the
Dependent Variables. ............................................................................................................. 168
Table5.6 Raw score and Percentage of Errors based on the Error Classifications for Cognate
(C) and Non-cognate (NC) Picture Names in Bengali and English for both BWA and BHA
Groups.................................................................................................................................... 169
Table5.7 Accuracy and RT of Cognate (Cog) and Non-cognate (Non-cog) Picture Names in
Bengali (B) and English (E) for Bilingual Healthy Adults (BHA) and each Bilinguals with
Aphasia (BWA) and the Statistical Results of the Dependent Variables. .............................. 170
Table5.8 Summary of Cognate Effects at Group and Individual level (BWA), Aphasia
Severity, Naming Accuracy (%) and Self-rated Language Proficiency (Pre-and-Post Stroke)
in Both Bengali (B) and English (E). ..................................................................................... 171
Table5.9 Item-wise Analysis (Accuracy) for Cognate and Non-cognate Picture Names in
BWA and BHA Groups and the Statistical Results of the Dependent Variables. .................. 172
Table5.10 Correlation Coefficients amongst the Executive Control Measures and the
Cognate Variables by Groups and Language (Bengali, English). ........................................ 173
Table6.1 Summary of all Experimental Chapters with their Research Questions,
Methodology, and Results. ..................................................................................................... 186

1
Abstract
Word production is an essential feature of successful communication where semantic information
(meaning) of a word is activated first, and this representation then activates the corresponding
phonological form followed by the articulation of the target word. However, the production of words
becomes effortful and impaired following neurological impairments (e.g., aphasia). The nature of
word production impairments in aphasia is poorly understood and inadequately treated. In healthy
monolingual speakers, word production involves selection of target word from competing lexical
items within the target language. The situation becomes complicated for bilinguals with two sets of
lexical systems leading to enhanced lexical competition. Research has shown different executive
control processes are involved while resolving lexical competition. There is currently not a consensus
in the literature as to whether this lexical competition is resolved in the same way by monolingual and
bilingual speakers. Moreover, research on the nature of word production deficits in bilinguals with
aphasia (BWA) and their relationship to executive control mechanism is not established in the
literature, especially in Indian languages. In this project, we investigate the relationship between word
production and executive control in a systematic and stepwise exploration in two phases (Phase I in
UK and Phase II in India) by using different participant groups, wide range of linguistic measures,
and separate executive control measures.
Participants in Phase I were 25 healthy Bengali-English bilinguals and English monolinguals
who were matched on age, gender, years of education, non-verbal intelligence, and vocabulary.
Participants completed two linguistic experimental tasks (verbal fluency in Chapter 2 and blocked-
cyclic naming in Chapter 3) in English and three executive control tasks (inhibitory control: Stroop
task, mental-set shifting: colour-shape switch task, working memory: backward digit span test).
Results revealed bilinguals performed at par with the monolinguals in some linguistic measures
(semantic fluency and heterogenous context in blocked-cyclic naming) and outperformed
monolinguals in certain linguistic measures (e.g. letter fluency and homogenous context in blocked-
cyclic naming). Therefore, bilingual disadvantage in the linguistic domain can be negated if
vocabulary is controlled for. Also, bilingual advantage in the non-linguistic domain can be extended
to the linguistic domain if the linguistic tasks were made more challenging by increasing the executive
control demands.
Bilingual Participants in Phase II were eight Bengali-English BWA and eight Bengali-English
bilingual healthy adults (BHA) who were matched on age, gender, years of education, and measures
of bilingualism. Participants completed two linguistic tasks (verbal fluency in Chapter 4 and picture
naming involving cognates and non-cognates in Chapter 5) in both languages and same executive
control tasks as in Phase I, except for mental-set shifting (Trail Making Test). As expected, we found
evidence of linguistic and executive control impairments at the group level for BWA individuals.
Similar to the monolingual group in Phase I, we found BWA had more difficulty in the linguistic

2
measures (e.g. fluency difference score, number of switches, between-cluster pause) where executive
control demands were higher. However, the underlying executive control deficits in the linguistic
tasks may not be visible with the usual analysis techniques. Therefore, we argued in favor of
including a more fine-grained analysis of linguistic tasks. In terms of cross-linguistic impairment
following a stroke, our results showed similar impairment in both the languages and the post-stroke
language ability (e.g. better performance in Bengali) mirrored their pre-stroke language ability
(Bengali dominant). Findings from the linguistic tasks revealed that despite showing deficits in
lexical access, BWA still mirrored the BHA in terms of the underlying language processing
mechanism which is required to perform in the linguistic tasks.
In summary, performance differences on the linguistic measures were mediated by various
factors such as the participant groups, nature of the task, language proficiency, and executive control
abilities. We emphasise the importance of characterising the BWA participants in terms of their
linguistic impairments in both languages, bilingualism related variables, separate linguistic and
executive control measures and involved analysis approaches. We provide a foundation for future
research on understanding the interplay of linguistic and executive control processes during word
production in healthy bilinguals as well as in BWA population.

3
Chapter 1. General Introduction
4
1.1 Introduction
Producing words accurately, in isolation and sentences, is an essential feature of successful and
fluent communication in everyday life which enables speakers to map conceptual
representations onto words and to refer to objects in the outside world. Knowing the names of
objects (as well as of abstract entities) and being able to retrieve these names, therefore, is a
central aspect of successful verbal communication. However, when illness or injury interferes
with verbal communication, the impact can be severe, affecting our social and work life, and
our emotional well-being. A universal difficulty for People with Aphasia (PWA) is the failure
to produce intended words, which severely limit the success of their verbal communication.
The nature of word production impairments in aphasia is poorly understood and inadequately
treated.
The effortless production of words is achieved through a complex interplay of several
processes, including the retrieval of semantic information (meaning), phonological information
(word sounds) and articulation (moving lips, jaw and tongue to make the chosen sequence of
sound). Even in monolinguals, naming is a competitive process. Importantly, a speaker must
select the target word from several other competing lexical items, e.g., if the target is dog, items
such as cat and horse might also be activated and compete for selection. Research indicates
that of a set of higher order cognitive skills known as executive control mechanisms are crucial
for successful retrieval of words, and resolution of the competition. Studies have suggested that
executive control mechanism, primarily inhibitory control helps to resolve this lexical
competition (Crowther & Martin, 2014; Shao, Roelofs, Martin, & Meyer, 2015). However, the
situation gets more complicated for bilinguals, i.e., speaker of two languages. Bilinguals not
only have to resolve the lexical competition from their target language but also must prevent
the interference from the non-target language.

5
There is currently not a consensus in the literature as to whether this lexical competition
is resolved in the same way by monolingual and bilingual speakers. Moreover, research on the
nature of word production deficits in bilingual aphasia and their relationship to executive
control mechanism is not well-established in the literature.
This PhD research sets out to investigate some of the outstanding issues in the
bilingual word production literature in the context of aphasia and healthy participants.
Specifically, the project aims to understand the relationship between word production and
executive control in a systematic and stepwise exploration in two phases (Phase I and Phase
II). We approach these research aims by using: (1) different participant groups (healthy
monolingual versus bilingual; neurologically impaired bilingual aphasia versus bilingual
healthy control); (2) a wide range of linguistic measures such as tasks which tap into both
linguistic and executive control aspects (verbal fluency), paradigms where lexical activation
can be increased or decreased (blocked-cyclic naming task), or changing stimuli
characteristics that can manipulate lexical activation (picture naming involving cognates and
non-cognates); and (3) separate executive control measures such as inhibitory control (Stroop
test), mental-set shifting (colour-shape switch and Trail Making Test), and working memory
(backward digit span).
In Phase I (Chapters 2 and 3), we aim to inform the debate on performance
differences between healthy monolingual and bilingual speakers on linguistic and executive
control processes. We determined differences between healthy monolingual and bilingual
speakers on word production by using task and experimental manipulations that can tap both
into the linguistic and executive control abilities. We also determined if different bilingualism
related variables (vocabulary, proficiency, dominance etc.) and executive control
performances could explain differences between the groups. We compared healthy Bengali-

6
English bilinguals and English monolinguals residing in Berkshire, the UK on verbal fluency
and blocked-cyclic naming tasks.
In Phase II (Chapters 4 and 5), we investigate the relationship between word
production and executive control processes in bilingual aphasia with an aim of identifying
and describing how the two languages break down, how the impairments are manifested and
whether linguistic and executive control processes mediate these manifestations. In addition,
we compared cross-linguistic performance between the languages and determined if
bilingualism variables, executive control and/or profile of linguistic deficits can explain the
performance pattern between the groups. We compared Bengali-English bilinguals with
aphasia (BWA) and Bengali-English bilingual healthy adults (BHA) residing in West Bengal,
India on verbal fluency and picture naming (cognate and non-cognate) tasks. Participants
across all the studies also performed the same set of executive control tasks (except for
mental-set shifting).
On the next section, first we will briefly provide motivations and rationale for the
experiments in Phase I and Phase II . Second, we will provide an introduction to the Bengali
language followed by the linguistic differences between Bengali and English and the
implications for the present project. At the end, we will provide a summary table for all the
experimental chapters with its specific research questions, and methods.
1.1.1 Phase I (healthy bilinguals versus monolinguals)
In Phase I, we aim to examine the relative contribution of linguistic and executive control
processes during word production in healthy bilinguals and monolinguals by using a
linguistic task (verbal fluency) and a linguistic paradigm (blocked-cyclic naming) where
executive control demands are varied, from low (e.g. semantic fluency condition in verbal
fluency task, heterogenous context in blocked-cyclic naming paradigm) to high (e.g. letter
fluency in verbal fluency task, homogenous context in blocked-cyclic naming paradigm). We

7
also aim to investigate whether the performance differences in the linguistic measures
between the two groups can be explained by the differences in their executive control
abilities. In the following section, first we will introduce the differences in the language
production system between healthy bilingual and monolingual speakers, followed by a
literature review on the present debate to the differences between these two groups on various
linguistic and executive control tasks, and how the present study will aim to address these
debates. At the end, we will provide the methodological challenges to consider while
studying bilingual population and how the present study will address these challenges.
1.1.1.1 Differences in word production mechanisms. Bilingual speakers’ word
production mechanism differs from monolingual speakers’ due to having a single conceptual
representation linked to two different lexical items belonging to two different languages
(Kroll & Stuart, 1994). Figure 1.1 shows the revised hierarchical model given by Kroll and
Stuart, where a single concept is linked to two different languages. Hence, monolinguals face
only within language competition, whereas bilinguals must resolve both within and between
language competitions during the lexical selection of the target word (Lee & Williams, 2001).
Figure 1.1 Revised hierarchical model (Kroll and Stuart, 1994) where single concept is linked to two different
languages (L1 and L2). Thickness of the line indicates the strength of the relationship.
To simplify the concept of different lexical competition in monolingual and bilingual
populations, let’s take an example from Costa’s model (Costa, 2005). Figure 1.2 shows the
schematic representation of monolingual and bilingual lexical representations. Seeing a
picture of ‘deer’, conceptual representations of the target item (deer) and other related

8
concepts (elephant, antler, etc.) get activated. However, in bilinguals, lexical selection
mechanism has to deal with the activation of lexical items belonging to two different
languages in addition to the activation of the lexical items within a language.
Figure 1.2 Schematic representation of the monolingual (left panel) and bilingual (right panel) system. Circles
and squares represent lexical nodes of language in use (English) and language not in use (Bengali in IPA)
respectively. Thickness of the circles indicates level of activation of the lexical nodes (Adapted from Costa,
2005).
1.1.1.2 Experimental findings on linguistic measures. In the literature, studies have
shown bilingual disadvantages in language processing using a variety of psycholinguistics
tasks (e.g. picture naming, verbal fluency, etc.) and across groups of bilinguals who vary in
their languages, age and bilingual status (Bialystok, Craik & Luk, 2008; Gollan et al., 2005;
Gollan, Montoya & Werner, 2002; Rogers, Lister, Febo, Besing, & Abrams, 2006). For
example, bilinguals have been shown to be slower in picture naming tasks (Roberts, Garcia,
Desrochers & Hernandez, 2002; Gollan et al., 2005), produced fewer number of correct
responses in verbal fluency tasks (Rosselli et al., 2000; Gollan et al., 2002; Portocarrero et al.,
2007), come across more tip-of-the tongue phenomenon (Gollan & Acenas, 2004), perform
poorer in word identification through noise task (Rogers et al., 2006), as well as in lexical
decision tasks (Ransdell & Fischler, 1987). Bialystok, Craik, and Luk (2008) compared
younger and older monolinguals and bilinguals on an English vocabulary test (PPVT-III),

9
Boston naming test, and two tests of verbal fluency (semantic and letter). They found
bilinguals to obtain lower scores compared to monolinguals across all the age groups.
There are various explanations for bilingual disadvantage in the language processing.
According to the weaker link hypothesis, bilinguals use each of their languages less
frequently as compared to the monolinguals resulting in weaker link between the connections
crucial for rapid speech production (Michael & Gollan, 2005). This hypothesis follows the
connectionist model which assumes there are networks between the words and concepts in
each language and rapid production of speech depends on the strength of these networks
(Dijkstra, 2005). Alternatively, sensorymotor account (Hernandez & Lee, 2007) suggests age
of acquisition as one of the key factor for developing vocabulary in each language and the
delay in second language acquisition hampers the language processing abilities in that
language for bilinguals.
The other viewpoints are based on the assumption that bilinguals’ both languages are
active during language production and comprehension and the language co-activation is a
consistent phenomenon (Costa & Caramazza, 1999; Guo & Peng, 2006; Wu & Thiery, 2010).
According to the inhibitory control model (Green, 1998), bilinguals solve the lexical
competition by inhibiting the active, non-target language competitors. However, bilinguals
face greater lexical competition than monolinguals, and the slower picture naming
performances in bilinguals (Gollan, Montoya, Fennema-Notestine, & Morris, 2005) as
compared to monolinguals can be attributed to this increased lexical competition (Green,
1998). Consequently, bilinguals have to inhibit one language while speaking another
language and this exercise of inhibition reflects bilingual’s superiority in non-linguistic
executive control tasks over monolinguals (Bialystok, 2009). Therefore, bilinguals face
greater lexical competition compared to monolinguals during language production but show
improved executive control in the non-verbal domain.

10
1.1.1.3 Experimental findings on executive control measures. In contrast to the
disadvantages of being bilingual in the verbal domain, effect of bilingualism on executive
control mechanism is more hotly debated. Researchers have shown advantages (Bialystok et
al., 2008; Prior & MacWhinney, 2010) as well as no differences across various executive
control tasks (Kousaie & Philips, 2012; Paap & Greenberg, 2013; Paap et al., 2017). Specific
of what entails within the executive control processes is still debated in the literature
(Harnishfeger, 1995; Miyake et al., 2000; Nigg, 2000), however, for the present study we
emphasise on the three most frequently hypothesised components of executive control
(Miyake et al., 2000) in the literature–inhibitory control, mental set-shifting and working
memory–to explore the executive control processes underlying language production in
bilinguals. Miyake et al.´s framework allow us to compare our results to the existing literature
as well as testing different components of executive control with specific tasks.
Bilingual research exploring inhibitory control has used tasks such as the Simon task,
the Flanker task, and the Stroop test. Although many studies have reported bilingual
advantage on inhibitory control for these tasks (e.g., Bialystok et al., 2004; Emmorey, Luk,
Pyers, & Bialystok, 2008; Bialystok et al., 2008), no difference or similar performance
between monolingual and bilinguals has also been noted (e.g., Gathercole et al., 2014;
Kousaie & Philips, 2012; Paap & Greenberg, 2013; Paap & Sawi, 2014). Similarly, on mental
set shifting measured using task switching paradigm have reported divergent findings ranging
from advantage for bilinguals (Prior & Gollan, 2011; Prior & MacWhinney, 2010) to no
differences between the two groups (Paap & Greenberg, 2013; Paap & Sawi, 2014; Paap et
al., 2017; Prior & Gollan, 2013). For example, Prior and MacWhinney (2010) tested 45
English young monolinguals (M = 18.7 years, SD = .9) and 47 young bilinguals (M = 19.5,
SD =1.5) on a colour-shape non-verbal switch test. This test measures the response time
difference (switch cost) between repeat (colour to colour or shape to shape) and switch

11
(colour to shape or shape to colour) trials. They found that bilinguals had a smaller switch
cost than monolinguals, suggesting a bilingual advantage in mental set shifting. However,
Paap and his colleagues (Paap & Greenberg, 2013; Paap & Sawi, 2014; Paap et al., 2017) did
not find any switch cost difference between bilinguals and monolinguals using the same
colour-shape switch test.
Similarly, literature on working memory (WM) and bilingualism remains equivocal,
with results ranging from no working memory differences between bilinguals and
monolinguals (Bialystok et al., 2008; Lu et al., 2010) to disadvantage for bilinguals
(Fernandes, Craik, Bialystok, & Kreuger, 2007) or advantage for bilinguals (Bialystok et al.,
2004; Blom, Küntay, Messer, Verhagen, & Leseman, 2014; Morales, Calvo, & Bialystok,
2013).
Although the dominant view in the literature is that bilinguals have an “advantage” of
executive control, as could be seen from the ongoing review, it is still unresolved whether
bilinguals would show specific advantages on certain domains of executive control. In a
review article by Paap, Johnson, & Sawi (2014), there are various confounds which may be
the reason of bilingual advantages in executive control measures. Some of them are the
immigration status of the bilinguals, cultural differences, small sample size, inappropriate
statistical analysis, and measures of executive control abilities.
We chose three executive control tasks to test the domains of inhibition, shifting
between mental sets, and working memory. Specifically, we use the Stroop task to measure
the selective inhibition (Stroop, 1935), backward digit span test to measure the working
memory, and colour-shape switch task to measure the shifting ability (Prior & MacWhinney,
2010).
1.1.1.4 Motivation for choosing the linguistic tasks. As can be seen from the
literature review above, bilinguals and monolingual speakers have shown to demonstrate

12
differences in performance on both language production and executive control processes. On
one hand, bilinguals show a disadvantage on language production tasks (e.g., slower reaction
time, a higher number of errors on picture naming task), whilst on the other hand, they
demonstrate an “advantage” on executive control tasks, especially in the non-verbal domain
(e.g., lower interference on conflict resolution task). Evidence from these two lines of
research has come from using separate measures of language production and executive
control mechanisms; linguistic tasks tapping into language production, and non-linguistic
tasks tapping into executive control processes. With the exception of a handful of studies, the
role of executive control during language production amongst bilinguals and monolinguals
has not been explored (e.g. Bialystok et al., 2008; Friesen et al., 2015). A better approach to
inform the debate on – disadvantage or advantage – amongst language and executive control
processes for bilingual and monolingual speakers would be to use tasks (e.g. verbal fluency
task) or paradigms (e.g. blocked-cyclic picture naming paradigm) that simultaneously draw
upon both these processes.
In a typical verbal fluency test, speakers are asked to generate words belonging to a
certain semantic category in the semantic fluency condition (e.g., animals) or beginning with
a specific letter in the letter fluency condition (e.g. letter F). The linguistic and executive
contribution for semantic and letter condition are different. The simplicity and nature of the
verbal fluency tasks make it an important measure to understand the relationship between
word production and executive control.
In this research, we harness the power of this simple test to determine the interaction
of linguistic and executive control processes using a broad range of measures (quantitative,
time-course, and qualitative) by comparing healthy bilingual and monolingual speakers in
Chapter 2. In addition, we complement our verbal fluency data with specific measures of
13
executive control functioning to establish the relationship amongst specific performance
parameter on verbal fluency and executive mechanisms.
In a typical blocked-cyclic experiment, there are two types of context – homogeneous
context (semantically related) and heterogeneous context (semantically unrelated). In
homogenous context, participants name pictures from the same semantic category (e.g. duck,
fish, horse, mouse, cat). Similarly, in the heterogeneous trials, participants name pictures
from semantically unrelated categories (e.g. duck, beard, vest, pear, lock). RT and accuracy
are observed to be longer and poorer in the homogeneous context as compared to the
heterogeneous context due to increased semantic interference at the lexical selection level
(Belke, Meyer, & Damian, 2005). As previously mentioned, executive control, especially
inhibitory control helps to resolve this interference (Crowther & Martin, 2014). Keeping the
two differences in mind, that is differences in lexical competitions, and differences in
executive control abilities among monolinguals and bilinguals, the question arises how
executive control and lexical context interacts in monolingual and bilingual populations in a
blocked-cyclic picture naming paradigm?
Now, three conditions can arise:
Condition 1: Compared to monolinguals, bilingual’s executive control advantage
outweighs the bilingual’s increased lexical competition (disadvantage). Therefore, bilinguals
will have lesser semantic context effect than monolinguals.
Condition 2: Compared to monolinguals, bilingual’s increased lexical competition
(disadvantage) outweighs the bilingual’s executive control advantage. Therefore, bilinguals
will have greater semantic context effect than monolinguals.
Condition 3: Bilingual’s increased lexical competition (disadvantage) and the
executive control advantage are of similar magnitude. Therefore, both groups will have
comparable semantic context effects.

14
To summarise, the differences in blocked-cyclic picture naming task between
bilinguals and monolinguals can be attributed to the interaction between the executive control
and lexical competition during word production. Therefore, in this research, we aim to
investigate the relationship between word production and executive control in bilingual
speakers by taking blocked-cyclic picture naming as an experimental paradigm in Chapter 3.
We will provide the detailed literature review specific to this task (verbal fluency) and
paradigm (blocked-cyclic picture naming) in Chapter 2 and 3, respectively.
1.1.2 Phase II (bilinguals with aphasia versus bilingual healthy adults)
Bilingual aphasia is defined as an impairment in one or both languages of a bilingual
individuals following a stroke. The study of bilingual aphasia provides an opportunity to
examine the break down of two languages following a brain damage. However, in contrast to
research on linguistic and executive control processes in healthy bilinguals, studies
investigating linguistic manifestation of a breakdown in the two languages in bilinguals with
aphasia (BWA) are limited (see Kiran & Gray, 2018 for a review). Therefore, in Phase II, we
aim to identify and describe the nature and extent of language breakdown following a brain
stroke in bilingual individuals. While Phase I was conducted in Berkshire, UK, Phase II was
conducted in West Bengal, India. Further we aim to investigate if bilingualism related
variables (pre- and post-stroke) and executive control profile of individuals can explain the
linguistic manifestation of a breakdown in the two languages in BWA.
According to data from World Population Prospects: the 2015 Revision (United
Nations, 2015), there is a substantial increase in the ageing population. It has been projected
that by 2030 there will be 56 percent growth rate of people older than 60 years and by 2050
there will be in total 2.1 billion people aged above 60 years in the world. As aphasia is more
prevalent in older population compared to younger (Ellis & Urban, 2016) and very little is
known about the linguistic and executive control impairment in bilinguals with aphasia, this

15
becomes a significant and timely area to investigate. In addition, there are very few studies in
healthy as well as aphasia population in Indian languages and as suggested by Bak (2015)
“India offers an enormous potential for bilingual research” (pp. 332). The present project
provides the opportunity to examine the effect of bilingualism and neurological status on
linguistic and executive control processes in Indian languages which is currently lacking in
the literature. In the following section, we will review the findings pertinent to this project
involving BWA on various linguistic and executive control tasks.
1.1.2.1 Experimental findings on linguistic measures. There are limited studies
which have examined lexical access and word retrieval in BWA (Faroqi-Shah, Sampson,
Pranger, & Baughman, 2016; Gray & Kiran, 2013; Kiran, Balachandran, & Lucas, 2014;
Roberts & Deslauriers, 1999). BWA has shown difficulties in picture naming (Kiran,
Balachandran, & Lucas, 2014; Roberts & Deslauriers, 1999), verbal fluency (Kiran et al.,
2014; Faroqi-Shah, Sampson, Pranger, & Baughman, 2016), and lexical decision (Green et
al., 2010; Verreyt et al., 2013) tasks.
Kiran et al. (2014) tested 10 Spanish-English BWA and 12 bilingual healthy adults
(BHA) on two picture naming tasks: Boston Naming Test (BNT) and Bilingual Picture
Naming Task (BPNT); and on a semantic fluency task (animals, food, and clothing). On the
two picture naming tasks, BWA produced significantly fewer correct responses compared to
BHA. BWA did not show any cross-linguistic difference. However, BHA group performed
significantly better in their dominant language. On the semantic fluency task, BWA produced
fewer correct responses, smaller cluster sizes, and fewer numbers of switches compared to
BHA. In terms of correct responses and cluster size, BHA group performed significantly
better in their most currently used language (English). However, there were no cross-
linguistic differences in any of the measures mentioned above for BWA. On individual
analysis, the majority of the patients performed better in their most proficient and currently

16
used language (Spanish). The author concluded that the differences in both the groups arise
from the lexical retrieval deficits in BWA and can be linked to their language proficiency in
the two languages. Although BHA outperformed BWA on the naming and verbal fluency
task, both groups made similar types of errors on naming tasks (e.g. circumlocutions) in both
languages and used similar clustering strategies in the verbal fluency task. Overall, the results
indicate that despite showing deficits in lexical access, BWA still mirrors the BHA in terms
of the underlying language processing mechanism which is required to perform in the naming
and verbal fluency task.
Gray and Kiran (2013) examined the pattern of lexical and semantic deficits between
the two languages in 19 Spanish-English bilingual adults with aphasia by using standardized
measure of diagnostic testing in Spanish and English. The researchers found pre-stroke
language ability to be a significant predictor of post-stroke language ability. They also found
two distinct patterns of impairment, one group showed similar impairment in both languages
whereas the other group showed differential pattern of impairment in Spanish and English.
Overall, the result showed evidence for both parallel and differential impairment following a
brain stroke in a large sample of patients.
In addition to the experimental tasks, various assessment tools also have been
developed in various languages to better understand the language impairment in BWA, such
as Aachen Aphasia Test (Huber, Poeck, Weniger, & Willmes, 1983), Western Aphasia
Battery (Kertesz, 1982), Boston Diagnostic Aphasia Examination (Goodglass, Kaplan, &
Barresi, 2000), Bilingual Aphasia Test (Paradis, 1989), etc. These assessment tests allow
cross-linguistic comparisons of language impairment across various domains
(comprehension, production, reading, writing, etc).
1.1.2.2 Experimental findings on executive control measures. In contrast to the
studies involving healthy bilinguals, there are only a handful of studies that have investigated

17
the executive control abilities in BWA. The situation gets complicated when we need to work
with persons with aphasia (PWA), because of short attention span, difficulty in
comprehension, fatigue and other physical factors. Despite the challenges in implementing
sophisticated task, executive control deficits in PWA has been documented across different
experimental tasks, such as tasks that require resolution of response conflict (Dash & Kar,
2014; Gray & Kiran, 2015; Kuzmina & Weekes, 2017), inhibition of dominant responses
(Faroqi-Shah et al., 2016; Green et al., 2010; Kuzmina & Weekes, 2017), switching between
tasks sets or rules (Chiou & Kennedy, 2009), and working memory (Salis, Kelly, & Code,
2015).
Gray and Kiran (2015) examined ten Spanish-English BWA and 30 age-matched
Spanish-English BHA on two tasks tapping into resistance to distractor interference - a non-
linguistic flanker task and a linguistic task. They found BWA were impaired only on the
linguistic task (as evidenced by individual analysis) but not on the non-linguistic flanker task
indicative of domain specific executive control impairment.
In another study, Green et al (2010) examined two BWA (French-English and
Spanish-English), 12 BHA, and 14 MHA on a lexical decision task, verbal Stroop task, and
non-linguistic flanker task. Compared to monolinguals, healthy bilinguals performed better
on the verbal Stroop task (smaller interference effect), poorer on the lexical decision task
(greater interference effect), and similarly on the flanker task. However, results were different
for each BWA. Compared to BHA, Patient 1 performed poorly on the lexical decision task
and Stroop task, but performed similarly on the flanker task. Compared to BHA, Patient 2
performed poorly on all the three measures. The results indicate the complexity of
interpreting the executive control abilities in BWA individuals. In the above study, Patient 1
showed domain specific executive control deficit whereas Patient 2 exhibited domain general
executive control deficit.

18
Kuzmina and Weekes (2017) tested a group of fluent monolingual PWA and non-
fluent monolingual PWA on a non-verbal flanker task, verbal Stroop task, and a domain
general Auditory Control and Rule Finding task (Russian version of Birmingham Cognitive
Screen, Humphreys, Bickerton, Samson, & Riddoch, 2012). They found impaired
performance for all the PWA compared to healthy controls on the verbal Stroop, but no
impairment on the verbal flanker task. Both the fluent and non-fluent groups recruited non-
verbal executive control during language comprehension and verbal executive control during
picture naming. Further, non-fluent group showed greater deficit in the verbal Stroop
suggestive of greater deficits in the inhibitory control for the non-fluent group as compared to
the fluent group.
Faroqi-Shah et al. (2016) compared monolingual PWA and BWA groups with
monolingual heathy adults and BHA on a verbal Stroop task and found both PWA produced
more errors compared to healthy adults across all trial types. However, Scott and Wilshire
(2010) did not find any difference on accuracy between a monolingual PWA speaker and
healthy adults group on the same Stroop task but the response times were significantly slower
in the conflict condition for the PWA compared to the healthy. PWA also has been shown to
perform poorer where they have to shift between tasks or rules (Chiou & Kennedy, 2009).
Chiou and Kennedy (2009) compared a group of monolingual PWA and healthy adults on a
Go/No-Go task and found PWA group were less accurate and slower compared to healthy
adults while switching from one rule to another. Salis, Kelly and Code (2015) in a
comprehensive review on working memory assessment in aphasia have argued in favour of a
close link between working memory and aphasia. Working memory impairments have also
been seen irrespective of the severity of aphasia in tasks even where the verbal demand is low
(Martin & Gupta, 2004; Martin & Ayala, 2004).

19
The outcomes of the above studies are contradictory, and this inconsistent finding
highlight the complex interplay between executive control and language processing in
bilinguals, especially in bilinguals with aphasia. Further research to assess the executive
control abilities in BWA is warranted because it has the potential to provide crucial insights
into how linguistic and executive control mechanisms operate in the brain. Therefore, present
study aimed to assess the executive control abilities of BWA by using three extensively tested
measures of executive control (Miyake et al., 2000) – inhibitory control (Stroop test), task
switching (Trail Making Test), and working memory (Backward digit span).
1.1.2.3 Motivation for choosing the linguistic tasks. The simplicity and nature of
the verbal fluency tasks make it an important measure to understand the relationship between
word production and executive control not only for healthy speakers but also in the aphasia
population (Please refer to section 1.1.1.4 for detail). It is well established that aphasia
speakers produce fewer number of correct responses than healthy adults and the productivity
reduces as a function of time (e.g., Adams, Reich, and Flowers, 1989; Arroyo-Anlló, Lorber,
Rigaleau and Gil, 2011; Baldo, Schwartz, Wilkins, and Dronkers, 2010; Bose, Wood, &
Kiran, 2017; Helm-Estabrooks, 2002; Kiran, Balachandran, and Lucas, 2014; Roberts and Le
Dorze, 1994; Sarno, Postman, Cho, and Norman, 2005). However, there are only a few
studies which have investigated both the linguistic (i.e. number of correct words, initiation,
cluster size and within-cluster pauses) and executive control (slope, response latency, number
of switches, and between-cluster pauses) contribution of this task to understand the
performance differences between BWA and healthy adults (e.g. Kiran et al., 2014). Similar to
Chapter 2, we aim to understand the relationship between linguistic and executive control
processes in BWA by using verbal fluency task (semantic and letter) with a broad range of
variables (quantitative, time-course, and qualitative).

20
Another linguistic manipulation which has been used in the literature to understand
the lexical activation/competition process in bilingual individuals during word production is
the use of cognate and non-cognate words. Cognates are words that share the same meaning,
and similar phonology across the two languages (e.g., /bʌtən/ in English and /bɔtʌm/ in
Bengali) compared to non-cognate words that share only the meaning but not the phonology
(e.g., /haʊs/ in English and /bʌri/ in Bengali). Majority of the studies have shown cognate
facilitation that is better performance in the cognate words compared to non-cognates in both
healthy and BWA (Costa, Caramazza, & Sebastian-Galles, 2000; Hoshino & Kroll, 2008;
Roberts & Deslauriers, 1999). However, other studies have shown cognate inhibition as well
as no difference between cognate and non-cognates in healthy as well as BWA (Broersma,
Carter, & Acheson, 2016; Filippi, Karaminis, & Thomas, 2014; Tiwari & Krishnan 2015).
Cognate facilitation effect can be supported by the language non-selective hypothesis
(Abutalebi & Green, 2007) which assumes the facilitation effects to arise from the shared
phonological segments in both languages resulting in higher activation for the cognate words,
whereas the non-cognate words receive activation only from the target language. No
difference between cognates and non-cognates or cognate inhibition can be supported by the
inhibitory control model of lexical access. According to the inhibitory control model (Green,
1998), the cross-language competition leads to the inhibition of the non-target word and the
inhibition is required more for the cognate words as compared to non-cognates resulting in
interference for the cognate words (Declerck & Philipp, 2015). Further, studies have shown
executive control components, especially inhibitory control and working memory modulates
the cross-language activation in healthy bilinguals during cognate production (Linck,
Hoshino, & Kroll., 2008) but it is unclear which executive control components modulates the
cross-language activation in BWA. Present project aims to examine the relationship between

21
executive control and cross-linguistic activation/competition by including cognate and non-
cognate words in a picture naming task.
We will provide the detailed literature review specific to these tasks task (verbal
fluency and cognate/non-cognate picture naming) in Chapter 4 and 5, respectively
1.1.3 Methodological Consideration
Marian (2008) has outlined various methodological factors while considering research
involving bilinguals. In the following section, we will discuss those methodological factors
and their impact on the performance of bilinguals on both linguistic and executive control
measures.
A probable reason for differences in linguistic performance in healthy as well BWA
literature can be attributed to the combination of languages that the bilingual group speaks.
Neighbour languages in a language family tree, share origin, vocabulary, phonological
qualities, and orthographic features. There are different language families such as Central
American, Dravidian, Sino-Tibetan, Austro-Asian etc., therefore, bilinguals who speak two
similar languages, for example, English and German (both from Germanic language tree)
may show different performance in a study of spoken or written language processing as
compared to speakers of two languages that belong to different branches of the language
family, such as English and Bengali (English comes from Germanic language tree whereas
Bengali comes from Indo-Aryan language tree; Marian, 2008).
Recent studies which have investigated the relationship between linguistic and
executive control mechanism have often ignored the importance of including a homogeneous
group of bilinguals in terms of the first and second language they speak. For example, Luo,
Luk, and Bialystok (2010) compared monolinguals and bilinguals on a verbal fluency test.
However, their bilingual participants have only English language in common, and the other
language was a mixed of different languages (e.g., 9 French speakers, 7 Cantonese, 4 Hebrew

22
etc.). Similarly, bilinguals tested by Friesen, Luo, Luk, and Bialystok (2015), spoke English
as one language and another language. Paap and Shawi (2014) tested 54 bilinguals who in
addition to English were fluent speakers of Spanish, Vietnamese, French, Cantonese, Hindi
and others. However, including a homogenous group of bilinguals will decrease the within-
group variability amongst bilingual participants. The present study included a homogenous
group of bilinguals with respect to their language combination, i.e., all the bilingual
participants were speakers of English and Bengali in their day to day life.
Factors such as vocabulary knowledge may also influence performance in the
linguistic and executive control tasks. Bialystok et al. (2008) have shown that bilinguals with
lower vocabulary score do not demonstrate the advantage in the linguistic tasks involving
greater executive control demands, but bilinguals with matched vocabulary score to
monolinguals performed significantly better in the linguistic tasks with greater executive
control demands (e.g. letter fluency). Thus, the bilingual advantage in linguistic tasks may
not show if not controlled for vocabulary knowledge.
Age of second language acquisition and language proficiency have shown to
influence the performance of bilinguals in linguistic as well as executive control measures. In
the literature, based on the age of acquisition, bilinguals have been mostly classified into two
groups namely, early bilinguals and late bilinguals. Early bilinguals are bilinguals who
acquired both their languages since early childhood and late bilinguals are who learned their
second language at a later stage of their life. Previous studies have shown better performance
in both linguistic and executive control measures for early bilinguals as compared to late
bilinguals (Bialystok, Craik, Klein, Viswanathan, 2004; Bialystok et al., 2008; Pelham &
Abrams, 2014). Based on proficiency, bilinguals are classified into high-proficient and low-
proficient bilinguals. Studies have shown performance difference between these two groups

23
on both linguistic and executive control measures (Bialystok et al., 2008; Perani et al., 2003;
Rosselli et al., 2002; Singh & Mishra, 2014).
In addition to the age of second language acquisition and proficiency, number of years of
education is another crucial factor while selecting bilingual participants during
psycholinguistic experiments. Ratcliff et al. (1998) have found that years of education have a
significant effect on the performance in linguistic tasks. Participants with higher education
performed better in linguistic and executive control measures than the participants with a
lesser number of years of education. In addition to that, Marian has argued that
psycholinguistic studies with bilinguals may also need to account for differences in language
dominance, current usage of language, language switching habits, and IQ scores. Therefore,
we have taken all these factors into account while characterising and selecting our bilingual
participants.
1.1.3.1 Implications for aphasia. When it comes to studies involving BWA, most of
the studies are single case studies (Detry, Pillion, & de Partz, 2005; Kambanaros, 2016; Kiran
& Iakupova, 2011; Kohnert, 2004; Kurland & Falcon, 2011; Scott & Wilshire, 2010; Tiwari
& Krishnan, 2015; Verreyt, De Letter, Hemelsoet, Santens, & Duyck, 2013) and involve
speakers with Germanic languages, especially English (Beveridge & Bak, 2011). Beveridge
and Bak (2011) published a comprehensive review article on the bias and diversity of aphasia
research in terms of languages spoken by participants. Beveridge and Bak reviewed 1184
unique articles on aphasia from four journals published in between 2000-2009 inclusive.
They found only 65 studies with speakers who spoke more than one language and out of 65
studies, only 18 were cross-linguistic comparison studies.
At present cross-linguistic studies involving aphasia patients are very limited. In
addition, Beveridge and Bak found strong research bias towards Germanic and Romance
languages (96.29% of all the articles) in aphasia research. The most under represented

24
languages in the aphasia research were Arabic, Hindi, Bengali, Portuguese, and Russian. In
summary, Beveridge and Bak suggested that the research on aphasia can make a significant
contribution to the debate on language universals versus language variation, “however, in
order to do so it needs to make cross-linguistic studies of aphasia one of its research
priorities” (p. 1465). According to the 2001 Census of India, 255 million speakers in India
speak more than one language in their day-to-day life and according to World Atlas of
Language Structures (Haspelmath, Dryer, Gil, & Comrie, 2005), there are approximately
180.5 million native Bengali speakers (6th most spoken language) in the world (Ethnologue:
Languages of the World, 2005). Yet, as can be seen from the review article by Beveridge and
Bak, there is only one study with Bengali aphasia speakers. The present project address this
research bias in aphasia by conducting a cross-linguistic comparison to understand the
language breakdown in a group of speakers who spoke Bengali, a language of Indo-Aryan
family.
In addition to the research bias and smaller sample size in studies involving BWA,
there are various complexities to consider while studying BWA population. Studies have
shown that patients with different pre-stroke language profile can present with similar post-
stroke language impairment profile and patients with similar pre-stroke language profile can
present with different post-stroke language profile (Gray & Kiran, 2013). As discussed
earlier, age of acquisition, language proficiency, language dominance, language usage
pattern, number of years of education are important factors that influence the language
processing in healthy bilinguals. Therefore, while studying aphasia, these factors also need to
be taken into account in addition to the site and size of lesion that are specific to aphasia
(Fabbro, 2001; Lorenzen & Murray, 2008). Kiran and Gray (2018) noted that “it is important
to understand bilingual aphasia in the context of relative impairment and relative recovery in
determining whether both/all the clients’ languages were similarly affected and consider pre-

25
morbid proficiency when determining parallel patterns of impairment post-stroke” (pp. 381).
To address the methodological issues involving BWA individuals, we have made a detail
language profile in each language for each of our BWA participants by using demographic
questionnaire (age, gender, site and extent of lesion, occupational history, literacy), language
background questionnaire (acquisition history, language proficiency, usage, dominance),
WAB in Bengali and English, and Croft’s tests (naming, picture-to-word matching, reading,
and writing) in Bengali and English.
In the following section, we will provide an introduction to Bengali, the differences
with English at various linguistic levels, and the implications for the present study.
1.1.4 Linguistic Differences between Bengali and English and the Implications
Bengali (also known as Bangla) is the national language of Bangladesh (144 million
speakers, 98% of total population, Bangladesh Census, 2001) and official language of the
three states of India – West Bengal, Tripura and Assam (80 million speakers, 8.3% of total
population, India Census, 2001). There are more than 224 million Bengali speakers in the
world (speak Bengali as their first or second language in their day to day life) and is currently
ranked as sixth most spoken language in the world (Comrie, 2005). Bengali is a member of
Indo-European language family and many of its words are descendent of Sanskrit (Dil, 1991).
However, despite the large number of Bengali speakers there are very few studies involving
Bengali speakers, especially in aphasia (see Beveridge & Bak, 2011, for a review). Therefore,
understanding the nature of language deficits, development of proper assessment tools, and
therapeutic intervention is currently lacking.
In this PhD thesis, we have recruited healthy Bengali-English bilinguals as well as
Bengali-English bilinguals with aphasia to provide an understanding to the nature of language
abilities and deficits in Bengali-English bilingual speakers with aphasia. In the following
section, we will provide the social and demographic picture of Bengali immigrants in
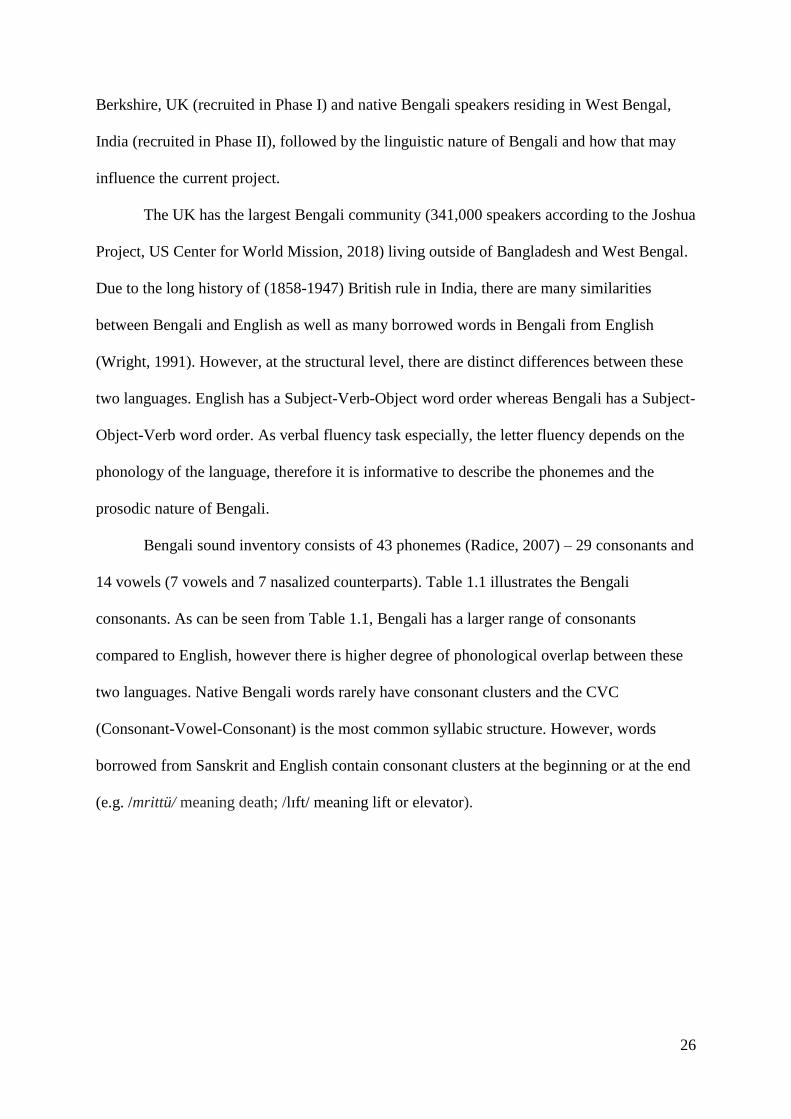
26
Berkshire, UK (recruited in Phase I) and native Bengali speakers residing in West Bengal,
India (recruited in Phase II), followed by the linguistic nature of Bengali and how that may
influence the current project.
The UK has the largest Bengali community (341,000 speakers according to the Joshua
Project, US Center for World Mission, 2018) living outside of Bangladesh and West Bengal.
Due to the long history of (1858-1947) British rule in India, there are many similarities
between Bengali and English as well as many borrowed words in Bengali from English
(Wright, 1991). However, at the structural level, there are distinct differences between these
two languages. English has a Subject-Verb-Object word order whereas Bengali has a Subject-
Object-Verb word order. As verbal fluency task especially, the letter fluency depends on the
phonology of the language, therefore it is informative to describe the phonemes and the
prosodic nature of Bengali.
Bengali sound inventory consists of 43 phonemes (Radice, 2007) – 29 consonants and
14 vowels (7 vowels and 7 nasalized counterparts). Table 1.1 illustrates the Bengali
consonants. As can be seen from Table 1.1, Bengali has a larger range of consonants
compared to English, however there is higher degree of phonological overlap between these
two languages. Native Bengali words rarely have consonant clusters and the CVC
(Consonant-Vowel-Consonant) is the most common syllabic structure. However, words
borrowed from Sanskrit and English contain consonant clusters at the beginning or at the end
(e.g. /mrittü/ meaning death; /lɪft/ meaning lift or elevator).

27
Table1.1
Inventory of Bengali Consonants
Labial Dental/Alveolar
Alveolar
Retroflex Palatoalveolar Velar Glottal
Nasal ম
mɔ
ঞ ~ ণ ~ ন
nɔ
ঙ
ŋɔ
Plosive
Voiceless প
pɔ
ত
tɔ
ট
ʈɔ
চ
tʃɔ
ক
kɔ
Aspirated ফ
pʰɔ
থ
tʰɔ
ঠ
ʈʰɔ
ছ
tʃʰɔ
খ
kʰɔ
Voiced ব
bɔ
দ
dɔ
ড
ɖɔ
জ ~ য
dʒɔ~dzɔ
গ
ɡɔ
Aspirated ভ
bʱɔ
ধ
dʱɔ
ঢ
ɖʱɔ
ঝ
dʒʱɔ
ঘ
ɡʱɔ
Fricative শ ~ স
sɔ
শ ~ ষ ~ স
ʃɔ
হ
hɔ
Liquid ল
lɔ
Rhotic র
rɔ
ড ~ ঢ
ɽɔ
Table1.2
Inventory of Bengali Vowels
Front Central Back
Close ই~ঈ
i
উ~ঊ
u
Close-mid এ
e
ও
ʊ~o
Near open এযা/অযা
æ or ɛ
অ
ɔ
Open আ
a
Table 1.2 outlines the vowels in Bengali and it is important to note that /o/ is the
inherent vowel in Bengali in contrast to /ə/ in English. This has an influence on the current
project as letter fluency description will be realized slightly different for English phonemes as

28
opposed to Bengali phonemes, i.e. phoneme /p/ will be realized in English as [pə] but as [po]
in Bengali. In terms of prosody, stress is usually placed on the initial syllable in Bengali.
Intonation does not impact Bengali words in general, but at the sentence level, intonation
plays an important role. Bengali words have a rising tone in simple declarative sentences
except for the last word which is marked with low tone. This alternating high and low tones
creates a musical intonational pattern to the typical Bengali sentence. Another major
distinction between Bengali and English is the script that is the Bengali script has a one-to-
one correspondence between the phonemes and the letters.
In terms of gender, there is no gender specification for Bengali nouns and verbs.
Bengali nouns are inflected for case and numbers. The case marking for each noun depends
on the animacy of the noun. Another distinctive feature of Bengali nouns is that during
counting, Bengali nouns must be accompanied by appropriate measure word. The measure
word must be in between the numeral and the noun word. In Bengali, measuring nouns
without measure words are considered ungrammatical. In summary, the similarities and
differences between Bengali and English language and the lack of studies in this language
group especially in the aphasia population make this project a timely investigation.
Finally, using these various approaches, the research investigated the relationship
between word production and executive control through four systematic experiments reported
in Chapter 2 to 5. Table 1.3 presents a summary of all the experimental Chapters with its
specific research questions and the methodology.
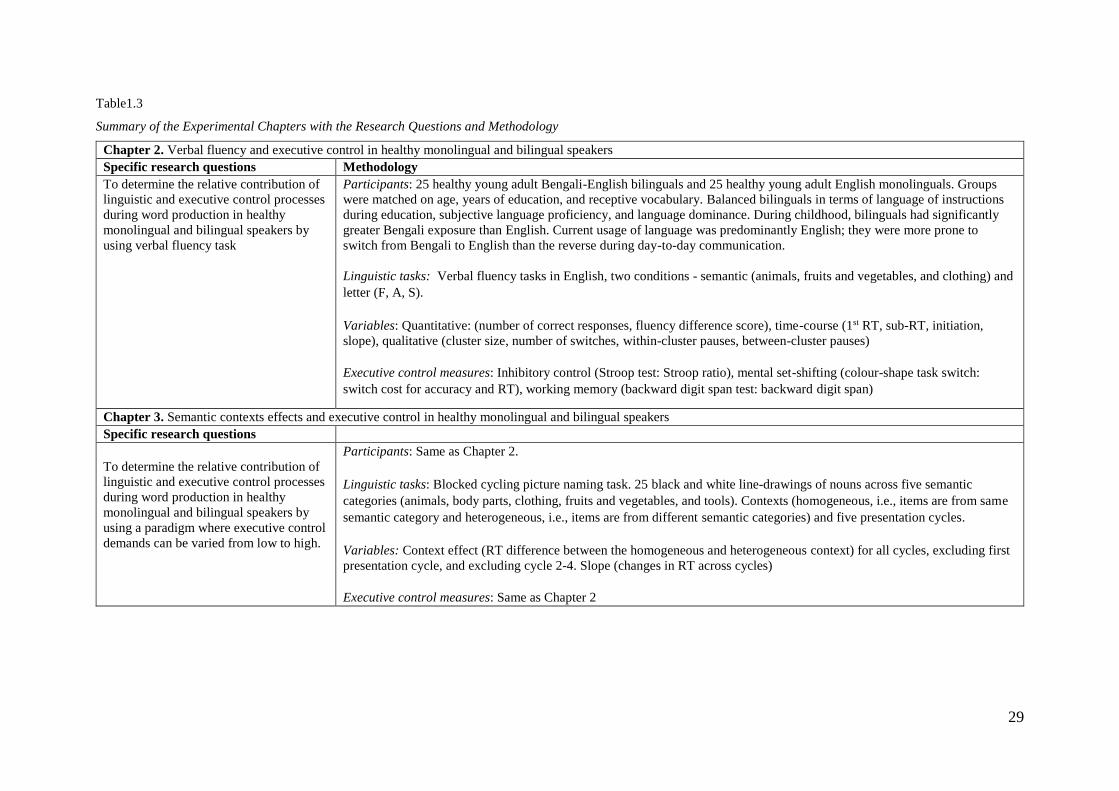
29
Table1.3
Summary of the Experimental Chapters with the Research Questions and Methodology
Chapter 2. Verbal fluency and executive control in healthy monolingual and bilingual speakers
Specific research questions Methodology
To determine the relative contribution of
linguistic and executive control processes
during word production in healthy
monolingual and bilingual speakers by
using verbal fluency task
Participants: 25 healthy young adult Bengali-English bilinguals and 25 healthy young adult English monolinguals. Groups
were matched on age, years of education, and receptive vocabulary. Balanced bilinguals in terms of language of instructions
during education, subjective language proficiency, and language dominance. During childhood, bilinguals had significantly
greater Bengali exposure than English. Current usage of language was predominantly English; they were more prone to
switch from Bengali to English than the reverse during day-to-day communication.
Linguistic tasks: Verbal fluency tasks in English, two conditions - semantic (animals, fruits and vegetables, and clothing) and
letter (F, A, S).
Variables: Quantitative: (number of correct responses, fluency difference score), time-course (1st RT, sub-RT, initiation,
slope), qualitative (cluster size, number of switches, within-cluster pauses, between-cluster pauses)
Executive control measures: Inhibitory control (Stroop test: Stroop ratio), mental set-shifting (colour-shape task switch:
switch cost for accuracy and RT), working memory (backward digit span test: backward digit span)
Chapter 3. Semantic contexts effects and executive control in healthy monolingual and bilingual speakers
Specific research questions
To determine the relative contribution of
linguistic and executive control processes
during word production in healthy
monolingual and bilingual speakers by
using a paradigm where executive control
demands can be varied from low to high.
Participants: Same as Chapter 2.
Linguistic tasks: Blocked cycling picture naming task. 25 black and white line-drawings of nouns across five semantic
categories (animals, body parts, clothing, fruits and vegetables, and tools). Contexts (homogeneous, i.e., items are from same
semantic category and heterogeneous, i.e., items are from different semantic categories) and five presentation cycles.
Variables: Context effect (RT difference between the homogeneous and heterogeneous context) for all cycles, excluding first
presentation cycle, and excluding cycle 2-4. Slope (changes in RT across cycles)
Executive control measures: Same as Chapter 2

30
Chapter 4. Verbal fluency and executive control in bilingual aphasia (BWA) and bilingual healthy adults (BHA).
Specific research questions Methodology
To determine the relative contribution of
linguistic and executive control processes
during word production in bilinguals with
aphasia and bilingual healthy adults by using
verbal fluency task
Participants: Eight Bengali-English BWA and eight Bengali-English BHA. All BWA speakers sustained a single left
hemisphere CVA and had mild to moderate non-fluent type aphasia in both languages and were matched with BHA on
age, sex, and years of education, language acquisition history, language of instruction during education, self-rated
language proficiency, language usage and language dominance.
Linguistic tasks: Verbal fluency tasks in both languages, two conditions - semantic (animals, fruits and vegetables) and
letter (F, A, S in English; P, K, M in Bengali)
Variables: Same as in Chapter 2.
Executive control measures: Inhibitory control (Stroop test: Stroop ratio), mental set-shifting (Trail Making Test: RT
difference between trial B and A that is TMT B-A), working memory (backward digit span test: backward digit span)
Chapter 5. Cognate production and executive control in bilinguals with aphasia (BWA) and bilingual healthy adults (BHA).
Specific research questions Methodology
To examine the cross-linguistic
interference/activation using a picture naming
task with cognates and non-cognates in BWA
and BHA. In addition, we also aimed to
investigate whether the differential
cognate/non-cognate naming abilities were
influenced by their executive control.
Participants: Same as in Chapter 4
Linguistic tasks: Picture naming tasks in both languages. Black-and-white line drawings of 38 cognates and 38 non-
cognates nouns matched for syllable length and subjective familiarity across word types and languages.
Variables: Accuracy and RT for cognate and non-cognate pictures.
Executive control measures: Same as Chapter 4.

31
Chapter 2. Verbal Fluency and Executive Control in Healthy Monolingual and
Bilingual Speakers

32
2.1 Abstract
Background. Research has shown that bilinguals can perform similarly, better or poorly on
verbal fluency task compared to monolinguals. These mixed results have been mainly
attributed to the differences in vocabulary between the two groups. Although it is widely
accepted that bilinguals have better non-verbal executive control, research is limited in
exploring the relationship of executive control, vocabulary measures and verbal fluency to
explain the mixed findings in the literature.
Aims. The overarching aim of this study was to determine the contribution of linguistic and
executive control processes to word retrieval in bilingual and monolingual participants.
Methods & Procedure. Verbal fluency data for semantic (animals, fruits and vegetables,
and clothing) and letter fluency (F, A, S) were collected from 25 Bengali-English bilinguals
and 25 English monolinguals in English. The two groups were matched for age, English
receptive vocabulary tests scores, years of education, non-verbal intelligence, and sex.
Traditional analysis (e.g., number of correct responses) along with involved analysis
techniques – such as fluency difference scores (FDS) between semantic and letter fluency
conditions, time course analysis (1st RT, sub-RT, initiation, and slope), and qualitative
analysis (e.g. clustering, switching, within-cluster pause and between-cluster pause) were
performed. Participants also completed three executive control measures tapping into
inhibitory control processes (Stroop task: Stroop ratio), mental-set shifting (colour-shape
switch task: switch cost for accuracy and RT) and working memory (backward digit span
test: backward digit span).
Outcomes & Results. Bilinguals and monolinguals showed differences in both linguistic and
executive control domains. Specifically, differences were observed where executive control
demands were higher such as number of correct responses (CR) in the letter fluency, FDS,
mean response latency, slope, cluster size for letter fluency and BCP for letter fluency. On the

33
separate executive control measures, compared to the monolinguals, bilinguals showed
significantly better inhibition and mental shifting skills but a comparable working memory.
The verbal fluency slope correlated significantly with the inhibitory control measure for the
bilinguals but not for the monolinguals.
Conclusions & Implications. Bilinguals, when matched for vocabulary, performed similarly
to monolinguals in semantic fluency where the demand of linguistic processes were higher
but performed better in the difficult letter fluency where executive control demands were
higher. Findings from the correlational analysis suggest that superior executive control
abilities of bilinguals helped them to perform better than monolinguals only where the task
difficulty is higher (i.e. letter fluency slope). Findings also highlight the importance of using
separate measures of executive control abilities to explore the bilingual advantage and
disadvantages reported in the literature.

34
2.2 Introduction
The verbal fluency task requires speakers to produce as many unique words as possible
within a limited amount of time, usually 60 seconds, according to a given criterion (e.g.,
semantic or category; letter or phonemic). Successful performance requires the use of specific
cognitive strategies, such as initiation, inhibition, monitoring, set-shifting to perform
systematic search and retrieve words within the mental lexicon. The integrity of both
linguistic and executive control abilities is essential for productive performance. However,
respective contribution of linguistic and executive components for semantic and letter fluency
condition is differential; higher demands are placed on executive control mechanisms in letter
fluency; while a larger role is placed on linguistic abilities in the semantic fluency (Delis,
Kaplan, & Kramer, 2001). This feature has made it an appealing task to explore differences in
linguistic and executive processes between monolinguals and bilinguals.
Verbal fluency research comparing bilingual and monolingual performance have
shown mixed results (Bialystok et al., 2008; Lu et al., 2010; Paap et al., 2017; Sandoval,
Gollan, Ferreira, & Salmon, 2010). In semantic fluency, monolinguals generate more number
of correct responses than bilinguals (Gollan et al., 2002; Rosselli et al., 2000; Sandoval et al.,
2010). However, this bilingual disadvantage disappeared when the groups were matched on
receptive vocabulary (Bialystok et al., 2008; Luo et al., 2010). For letter fluency, findings
have been wide ranging from lesser to equivalent to greater number of correct responses by
bilinguals (Bialystok et al., 2008; Kormi-Nouri, Moradi, Moradi, Akbari-Zardkhaneh, &
Zahedian, 2012; Rosselli et al., 2000; Luo et al., 2010; Paap et al., 2017; Sandoval et al.,
2010). Luo et al. (2010) found that their vocabulary matched bilinguals outperform
monolinguals on letter fluency condition, proposing that it is suggestive of better executive
control in bilinguals. Although the approach to inform the debate of bilingual
advantage/disadvantage in executive and linguistic processes using verbal fluency task is

35
promising, the number of empirical research has been limited, and there is a dire need for
replication. Paap et al. (2017) suggested that “relatively better performance by a group on
letter fluency compared to category fluency cannot be taken as evidence that the group has
superior executive functions. Rather such a claim must be backed up by independent and
direct test of EF ability” (p.108). Moreover, research that has attempted to link direct measure
of executive control to verbal fluency performance (at least in monolinguals) did not find that
executive control had a stronger effect on performance in the letter than in the category
fluency task (Shao et al., 2014). Thus, it remains an open question to determine whether
bilinguals and monolinguals perform differentially in semantic and letter fluency task and
whether their performance differences are mediated by specific aspects of executive control
abilities.
In this research, using both semantic and letter fluency as well as independent
measures of executive control we investigate the interaction of linguistic and executive
control processes for bilingual and monolingual speakers. Moving beyond the number of
correct responses, we used a wide range of methods to characterize verbal fluency
performance, such as time-course analysis, and clustering and switching analysis (Luo et al.,
2010; Troyer, Moscovitch, & Winocur, 1997). These measures were chosen as they better
reflect the contribution of linguistic and the executive components of the fluency
performance. Table 2.1 provides description of these variables and the components of verbal
fluency they are assumed to be indexing. To our knowledge, no study has systemically
compared healthy bilinguals and monolinguals on this full range of measures. Moreover, to
establish, if bilinguals are indeed better in letter fluency due to superior executive control, we
included independent measures of executive processes (i.e., inhibition, shifting, and memory)
to compare performance differences between bilinguals and monolinguals, and their
relationship to verbal fluency performance.

36
Table2.1
Contribution of Verbal Fluency Variables to the Linguistic and Executive Control Components
Parameters Definition Significance Linguistic
process
Executive
control
processes
Quantitative
1. Number of
correct
responses
Number of responses produced in one minute excluding any errors (e.g.
cross-linguistic, words from different category for semantic fluency and
different letters for letter fluency, repetition, non-word etc).
Measures word retrieval abilities. √ √
2. Fluency
difference
score
Differences in the number of correct responses between semantic and letter
fluency conditions as a proportion of correct responses in the semantic
fluency condition.
Measures the ability to maintain the
performance in the difficult condition.
√
Time course
1. 1st RT Time duration from the beginning of the trial to the onset of first response. Preparation time to initiate the
response.
√
2. Sub-RT Average of time intervals from the onset of first response to the onset of
each subsequent response.
Measures the word retrieval latency. √
3. Initiation Starting point of the logarithmic function that is the value of 𝑦 when 𝑡 = 1
or 𝐼𝑛(𝑡) = 0 (e.g. initiation parameter for the above mentioned
logarithmic function is 𝑦 = 4.31 – 1.312 𝐼𝑛(1) = 4.31 – 0 = 4.31).
Measures the initial linguistic resources
or vocabulary available to perform the
task.
√
4. Slope Shape of the curve (e.g. slope value for the logarithmic function 𝑦 = 4.31 – 1.312 𝐼𝑛(1) is -1.312).
Measures the word retrieval speed
across the time duration of the task.
√
Qualitative
1. Cluster size Number of successive words produced within a semantic subcategory (e.g.
African animals, Pets, etc.) or number of successive words which fulfil
certain criteria (e.g. begin with first two letters, rhyme words, etc.) in the
letter fluency condition.
Strategy to perform efficiently by
searching the available linguistic
resources in the present subcategory.
√
2. Number of
switches
Number of transitions between two clusters, one cluster to a single word,
one single word to another cluster, or between two single words.
Strategy to perform efficiently by
switching into a newer subcategory
when the search process is exhausted
for the present subcategory.
√
3. Within-cluster
pauses
Mean time differences between each successive word within the same
cluster
Time to access new words within a
cluster.
√
4. Between-
cluster pauses
Mean time difference between the onset time of the last word of a cluster
and first word of the consecutive cluster.
Time to switch between clusters. √

37
As verbal fluency tasks place a premium on rapid search and retrieval, temporal
measures of the performance (i.e., time interval required to produce each word as a function
of its position in the sequence) provide insights into the linguistic and executive control
strategies (e.g., Crowe, 1998; Tröster et al., 1998). Techniques such as time-course analysis
have provided ways to assess the role of linguistic knowledge and executive control in verbal
fluency performance (Luo et al., 2010; Sandoval et al., 2010). In time-course analysis, the
number of words generated over the 60 second time interval is grouped into 5-second time
bins; with declining pattern presented by plotting the number of words produced against time.
Figure 2.1 Time course of correct responses over twelve 5-sec bins.
Figure 2.1 allows generating various parameters that tap into the linguistic and
executive processes involved in the retrieval of words: First response time (1st-RT),
subsequent response time (sub-RT); initiation parameter; and slope (See Table 2.1). Luo et al.
(2010) compared semantic and letter fluency performance for a group of young monolinguals
vs. two groups of young bilinguals (high-vocabulary who were matched with monolinguals;
low-vocabulary bilinguals). Their results revealed that in the letter fluency condition, high-
vocabulary bilinguals generated more number of correct responses and demonstrated a longer
Sub-RT and a flatter slope than the monolinguals.

38
Similar results have been obtained by Friesen et al (2015). Friesen et al (2015) tested
four groups of participants – two groups of 7-year old and 10-year old monolingual and
bilingual children, one group of younger monolingual and bilingual adults, and one group of
older monolingual and bilingual adults – on a verbal fluency test. All monolinguals were
native English speakers and bilinguals spoke English and another language fluently. Friesen
et al found no main effect of age but the main effect of language group and a marginal age by
language group interaction. There were no differences between bilinguals and monolinguals
on the semantic fluency condition, but bilinguals produced more number of correct responses
(CR) on the letter fluency condition suggestive of executive control advantage for bilinguals
on the difficult letter fluency condition.
In contrast, studies have also shown that bilinguals produced longer sub-RT along
with fewer number of correct responses compared to monolinguals in the letter fluency
condition (Sandoval et al., 2010). These authors argued that the bilingual disadvantage results
from the cross-linguistic interference which slows down their word retrieval process, as
denoted by longer sub-RT. As vocabulary-matched bilinguals produced more number of
correct responses compared to monolingual, it is unlikely that retrieval slowing hypothesis
can explain the bilingual advantage (Friesen et al., 2015; Luo et al., 2010). Instead,
bilingual’s better performance in the letter fluency in conjunction with the longer sub-RT
have been argued to be result of bilingual’s superior executive control abilities. This has been
proposed to be a by-product of constant cross-linguistic interference faced by bilinguals.
Fluency difference score (FDS) has been suggested to capture the role of executive
control in fluency task (Friesen et al., 2015). FDS is the differences in the number of correct
responses between semantic and letter fluency conditions as a proportion of correct responses
in the semantic fluency condition. Therefore, individuals who can maintain better

39
performance in the difficult letter fluency condition would show smaller FDS score;
indicative of better executive control abilities (Friesen et al., 2015).
The production of words during verbal fluency performance are not evenly distributed
over time, but tend to be produced in “spurts”, or temporal clusters, with a short time interval
between words in a cluster and a longer pause between clusters (Gruenewald & Lockhead,
1980; Troyer et al., 1997). On semantic fluency tasks, the words that comprise these temporal
clusters tend to be semantically related (e.g., first name farm animals, then switch to pets,
then to birds); on letter fluency tasks, the words tend to be phonologically related (e.g., words
that start with same first two letters, then switch to words that rhyme, then to words that has
same ending). Clustering is the strategic process that helps to generate words within a
subcategory and utilizes the speaker’s ability to access words within subcategories. A
breakdown in the lexical system or difficulty to access the lexical system could lead to the
reduction in cluster size (Troyer, Moscovitch, Winocur, Alexander, & Stuss, 1998).
Switching is the ability to shift efficiently to a new subcategory when a subcategory is
exhausted; reduced switching has been linked to executive control difficulty (Troyer et al.,
1997; Tröster et al., 1998). Research has shown that both clustering and switching abilities
contribute to the total number of correct responses; however, in category fluency, clustering
accounts for more of the variance for number of correct; whilst in letter fluency, switching
accounts for more of the variance for number of correct. Thus, clustering and switching
analysis provides another well-established mean to further inform the linguistic and executive
debate for bilinguals vs. monolinguals.
It has been proposed that bilinguals’ both languages are active during language tasks,
and they need a control mechanism that suppresses the interference from the other language
while performing a task in the target language (for review, see Kroll et al., 2012).
Researchers have claimed that bilinguals can resolve the interference from the non-target
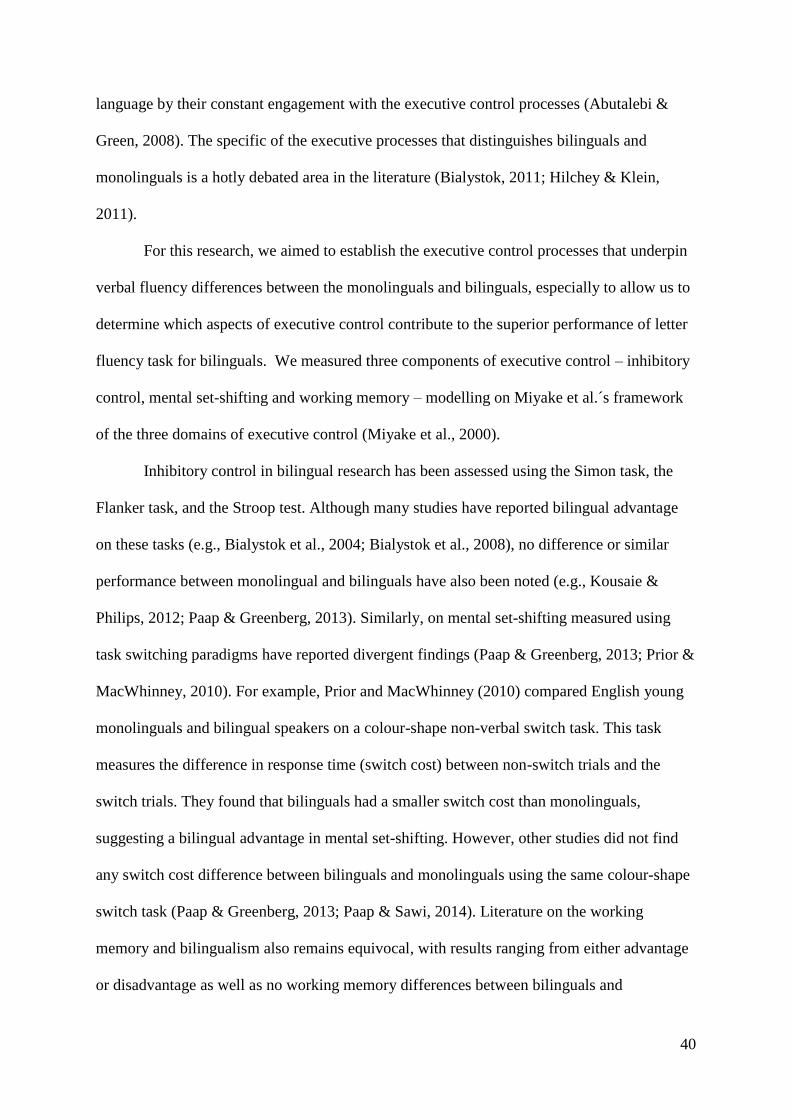
40
language by their constant engagement with the executive control processes (Abutalebi &
Green, 2008). The specific of the executive processes that distinguishes bilinguals and
monolinguals is a hotly debated area in the literature (Bialystok, 2011; Hilchey & Klein,
2011).
For this research, we aimed to establish the executive control processes that underpin
verbal fluency differences between the monolinguals and bilinguals, especially to allow us to
determine which aspects of executive control contribute to the superior performance of letter
fluency task for bilinguals. We measured three components of executive control – inhibitory
control, mental set-shifting and working memory – modelling on Miyake et al.´s framework
of the three domains of executive control (Miyake et al., 2000).
Inhibitory control in bilingual research has been assessed using the Simon task, the
Flanker task, and the Stroop test. Although many studies have reported bilingual advantage
on these tasks (e.g., Bialystok et al., 2004; Bialystok et al., 2008), no difference or similar
performance between monolingual and bilinguals have also been noted (e.g., Kousaie &
Philips, 2012; Paap & Greenberg, 2013). Similarly, on mental set-shifting measured using
task switching paradigms have reported divergent findings (Paap & Greenberg, 2013; Prior &
MacWhinney, 2010). For example, Prior and MacWhinney (2010) compared English young
monolinguals and bilingual speakers on a colour-shape non-verbal switch task. This task
measures the difference in response time (switch cost) between non-switch trials and the
switch trials. They found that bilinguals had a smaller switch cost than monolinguals,
suggesting a bilingual advantage in mental set-shifting. However, other studies did not find
any switch cost difference between bilinguals and monolinguals using the same colour-shape
switch task (Paap & Greenberg, 2013; Paap & Sawi, 2014). Literature on the working
memory and bilingualism also remains equivocal, with results ranging from either advantage
or disadvantage as well as no working memory differences between bilinguals and

41
monolinguals (Bialystok et al., 2004; Bialystok et al., 2008; Blom et al., 2014; Fernandes et
al., 2007; Luo et al., 2010).
Since verbal fluency performance rely both on linguistic and executive control, it is
imperative to explore which component of executive control mediates verbal fluency
performance (see Paap et al., 2017). No research has reported the relationship of executive
control measures to the bilingual vs. monolingual performance difference on verbal fluency.
There exists only one study with healthy monolingual adults that investigated the verbal
fluency performance with measures of executive control (Shao et al., 2014). Shao et al. had
assessed older Dutch speakers on both semantic and letter fluency conditions and related their
performance with the measures of executive control (i.e., shifting between mental-sets,
operation span; inhibitory control, stop-signal task). Results revealed that only shifting ability
predicted the number of correct responses in both fluency conditions. Shao et al. noted that
“there was no evidence that executive control had a stronger effect on performance in the
letter than in the category fluency task” (p.8). The authors cautioned that the inhibitory
control task (i.e., stop-signal task) used in their study may not have represented the inhibitory
control required for the verbal fluency task. The stop-signal task measures how fast an
individual can stop a planned response, whereas, in verbal fluency, participants need to
suppress the activation of competitor lexical items (selective inhibition) to come up with the
target word. For this research, we use the Stroop task to measure the selective inhibition
(Stroop, 1935), the colour-shape switch task to measure the shifting ability (Prior &
MacWhinney, 2010), and the backward digit span test to measure the working memory
(Wechsler, 1997).
There remain other important considerations in bilingual experimental research.
Recent literature has emphasized the need of including homogeneous bilinguals, as unable to
control the different language combinations results in wide range of performance that could

42
be attributed to typological and structural differences amongst the languages (Marian, 2008).
Language proficiency of bilinguals has shown to be a significant contributor for verbal
fluency performance (Bialystok et al., 2008; Gollan et al., 2002; Luo et al., 2010). When
bilinguals were matched with monolinguals in terms of language proficiency, they either
outperform (Luo et al., 2010) or perform at par with the monolinguals (Bialystok et al., 2008;
Paap et al., 2017). In contrast, low proficient bilinguals perform poorly (Gollan et al., 2002)
compared to the monolinguals. Therefore, including a homogenous group of bilinguals in
terms of language combination and proficiency would decrease the within-group variability
amongst participants and findings could be attributed to the processes that are tested.
2.3 The Current Investigation, Research Questions and Predictions
We compared the differences in verbal fluency performance in two groups of young healthy
participants; 25 English monolinguals and 25 Bengali-English bilinguals. The groups were
matched on receptive vocabulary, years of education, age and non-verbal intelligence. We
collected semantic (animals, fruits, vegetables) and letter (F, A, S) fluency data for 60 s in
English. We provided detailed characterization of our bilingual participants on relevant
variables for bilingualism: language history and acquisition patterns, usage patterns,
proficiency and dominance, switching habits, immigration history, and occupational status.
Our bilingual participants formed a relatively homogenous group of balanced bilinguals in
terms of language of instruction during education, self-rated language proficiency and
language dominance. All bilingual participants were born in Bengali speaking region in India
and acquired Bengali as their first language. However, they used English more in their day to
day life and switched more from Bengali to English as they were living in the UK at the time
of this research.
We quantified the verbal fluency performance in terms of quantitative (number of
correct responses, fluency proportion difference score); time-course (1st-RT; Sub-RT;

43
initiation; slope); and qualitative (cluster size; number of switches). Executive control
processes were measured using the Stroop (measured selective inhibition), the colour-shape
switch task (measured shifting between mental sets) and the backward digital span (measured
working memory) tasks.
The overarching aim of this study was to determine the contribution of linguistic and
executive control processes to word retrieval in bilingual and monolingual participants. To
address this overall aim, we used verbal fluency task and specific research questions and
predictions were the following:
1. To determine differences in verbal fluency performance (quantitative, time course, and
qualitative analysis) between bilingual and monolingual participants.
As the groups were matched on vocabulary, we predict bilinguals to perform similarly to
monolinguals on semantic fluency condition but potentially more number of words in
letter fluency condition. In similar vein, we do not expect differences in cluster size. If
bilinguals were to show superior executive control, then compared to monolinguals we
would expect bilinguals to demonstrate; smaller FDS; more number of switches, and
shorter between-cluster pauses; and in the time-course analysis, longer Sub-RT and flatter
slope in letter fluency.
2. To determine measures of executive control (inhibitory control, mental set shifting, and
working memory) that mediate verbal fluency performance difference between the
groups.
We expect that if bilinguals are to show advantage in letter fluency condition, then
executive control measures would have a stronger correlation with performance measures
that related to the executive control abilities (i.e., FDS, slope, number of switches, and
between-cluster pauses).

44
2.4 Methods
2.4.1 Participants
Twenty-five Bengali-English bilingual healthy adults (M = 32.84, SD = 4.78) and 25 English
monolingual healthy adults (M = 30.4, SD = 8.2) residing in the town of Reading, and Slough
of Berkshire county, United Kingdom participated in this study. A screening questionnaire
was used to gather information about their handedness, auditory and visual ability, and
history of any neurological illness. All the participants reported themselves to be right-
handed, normal or corrected to normal vision, no history of hearing impairment and no
history of any neurological illness. Monolingual participants were recruited from the
university student population (received course credit for participation) and local community
(Reading, Berkshire, UK). Bilingual participants were recruited from the local Bengali
community (e.g., Bengali Cultural Society of Reading, Berkshire, UK).
A background questionnaire was used to collect information about the demographic
details (age, gender, years of education, current occupation status, and immigration history)
of all the participants. The participants in both groups had a wide range of occupations.
Monolingual participants were university student (14), engineer (3), manager (2), accountant
(1), businessman (1), technician (1), administration (1), maintenance (1), and support worker
(1). Bilingual participants were home maker (7), engineer (6), university student (5),
businessman (2), accountant (1), doctor (1), clerk (1), lecturer (1), and sales (1). Bilinguals
were immigrants who have lived in the Berkshire county (Reading, Slough) of the UK,
ranging from 1 year to 15 years (M = 7.48, SD = 3.58). Bilingual participants spoke Bengali
and English fluently; had minimal or no knowledge of any other language. Bilinguals were
biliterate, that is, they were able to read and write in both languages. In a 7-point self-
reported rating scale (where 1 is no or minimum knowledge and 7 is native like ability),
reading and writing ability of bilinguals were similar in both languages (Reading: Bengali, M

45
= 6.7, SD = .6; English, M = 6.7, SD = .5; Writing: Bengali, M = 6, SD = .5; English, M = 6.4,
SD = .6). Participation in this study was voluntary and participants provided written consent
(see Appendix 2.1 for an example of information sheet and consent form) prior to
participation. All the procedures in this study were approved by the University of Reading
Research Ethics Committee (Ethical approval code: 2014/060/AB).
Demographic details (age, gender, and years of education) and scores for nonverbal
IQ from Raven’s standard progressive matrices plus version (SPM Plus, Raven, 2008) are
presented in Table 2.2. Appendix 2.5 provides raw score of each individual for all the
background measures (age, gender, years of education, IQ, years of immigration, occupation)
and the objective language tests (OPT, BPVS-III). Independent sample t-tests were
performed where data was normally distributed and Mann-Whitney U tests were performed
where data was not normally distributed. The groups did not differ significantly on age,
gender, years of education and non-verbal IQ.
46
Table2.2
Mean (M), Minimum (Min) and Maximum (Max) values, Standard Deviations (SD), and Statistical Results of
the Demographic Variables and Raven’s SPM-plus.
Measures
Bilingual (N =25) Monolingual (N = 25) Statistical results
M Min-Max SD M Min-Max SD
Age (years) 32.8 27-45 4.8 30.4 22-45 8.2 t(48) = 1.3, p = .21
Years of
education
18.1 16-20 1.6 17.1 15-20 1.2 U1= 311.5, p = .98
Raven’s IQ2 43.5 38-51 3.8 43 33-54 5.4 U2 = 275.5, p = .47
Gender N N
Female 11 12 𝜒2 (1) = .08, 𝑝 = .78
Male 14 13
1 – Mann-Whitney U test; 2 - Raven’s Standard Progressive Matrices Intelligence Quotients (Raven, 2008), maximum score
possible 60, greater score indicates higher non-verbal intelligence; * p≤.05.
2.4.2 Background and Executive Control Measures
In this section, we will discuss the language background measures and the executive control
measures. First, we will describe the subjective measures used for characterising our bilingual
participants followed by the objective vocabulary tests. At the end, we will discuss the three
executive control measures.
2.4.2.1 Bilingualism measures. Bilinguals were assessed using various measures to
document their characteristics of bilingualism. We adapted and modified the questionnaire
developed by Muñoz, Marquardt & Copeland (1999). This questionnaire (see Appendix 2.2)
assessed language acquisition history, instruction of language during education, self-rated
language proficiency across speaking, comprehension, reading and writing, and current
language usage pattern. Language dominance was measured using the language dominance
questionnaire (Dunn & Fox Tree, 2009), and language switching habits in both of their
languages were assessed using language switching questionnaire (Rodriguez-Fornells,
Krämer, Lorenzo-Seva, Festman, & Münte, 2012).

47
2.4.2.2 Vocabulary tests. To assess participants’ receptive vocabulary, all
participants were assessed on two standardised tests: Oxford Placement Test (Oxford
University Press and Cambridge ESOL, 2001) and the British Picture Vocabulary Scale III
(Dunn & Dunn, 2009).
2.4.2.3 Inhibitory control (Stroop task). The Stroop task (Stroop, 1935) is one of
the most widely used and best-known procedures to study response interference and selective
inhibition (Bialystok et al., 2008). In the classic Stroop task, participants are shown a patch of
colour in one condition (neutral) and they identify the colour. In another condition
(incongruent), colour words are written in a contrasting print colour (e.g., ‘red’) and
participants are asked to say the name of the print colour (response would be ‘green’).
Participants produce more errors and have longer latencies in the incongruent condition as
compared to the neutral condition. The difference in accuracy and latency between the
incongruent condition and the neutral condition is referred to as Stroop effect (for review, see
MacLeod, 1991).
In present study, the stimulus consisted of six basic colours/colour word names: red,
green, blue, yellow, orange, and purple. In the neutral condition, participants named the
colour of differently coloured rectangles. A series of 50 coloured rectangles, each in one of
the six colours were presented in a random order such that two successive trials never had the
same colour. In the incongruent condition, participants had to name the font colour of the
colour words as quickly and accurately as possible. A series of 50 colour words were shown
one at a time on the screen in a random order, each of which was presented in a colour other
than the word’s name (e.g., ‘red’ in ‘green’ colour). Both conditions were completed during a
single session with the neutral condition first followed by the incongruent condition. All
responses were recorded with a digital voice recorder. The onset of each stimulus was

48
accompanied by a beep, which allowed latency measurement. The latency for each naming
response was measured from the onset of the beep to the onset of the naming.
The interference effect or the Stroop difference was scored by subtracting the reaction
time in the neutral condition from the incongruent condition (Scott & Wilshire, 2010). A
lower Stroop difference indicated better inhibitory control. However, calculating the Stroop
difference in this way sometimes yield similar results even when the interference effects are
not similar. For example, a reaction time of 800 msec in the incongruent condition minus a
reaction time of 400 msec in the neutral condition will give a Stroop interference effect of
400 msec (Example 1 in Appendix 2.3). Again, a reaction time of 1200 msec in the
incongruent condition minus a reaction time of 800 msec in the neutral condition will also
give a Stroop interference effect of 400 msec (Example 2 in Appendix 2.3). However, the
difference score does not take overall slowness into account which is a crucial factor while
assessing Stroop interference (Green et al., 2010). Therefore, we measured Stroop ratio as our
dependent variable to measure the interference effect in relation to the participant’s
performance in both neutral and incongruent condition. However, we do provide the mean
and sd for all both conditions (i.e., neutral and incongruent). Stroop ratio was calculated by
dividing the Stroop difference with the overall mean latency. The ratio was then converted to
a percentage score. Stroop ratio in example 1 and 2 is 66.67 and 40, respectively (see
Appendix 2.2 for a worked-out example). A lower Stroop ratio indicated better inhibitory
control.
2.4.2.4 Mental-set shifting (colour-shape switch task). In a colour-shape switch
task, participants had to switch between colour judgement and shape judgements trials (Prior
& MacWhinney, 2010). We adapted Prior and MacWhinney’s (2010) colour-shape switch
task. Target stimuli consisted of filled red triangle, red circle, green triangle and green circle.
Participants had to judge the colour or shape of the stimuli based on a cue. There were two

49
types of cues: colour cue (colour gradient) and shape cue (row of small black shapes). If the
cue was a colour cue, participants had to judge the colour of the stimulus (red or green) and if
the cue was a shape cue, participants had to judge the shape of the stimulus (circle or
triangle). Cue was followed by the target stimulus which appeared at the centre of the screen
while the cue remained on the screen above the target stimulus.
The task was presented via E-Prime (Psychology Software Tools, Pittsburgh, PA).
Each trial started with a fixation cross for 500ms after which the cue appeared on the screen
for 250ms, 2.8° above the fixation cross followed by a blank screen for about 300ms. The
targets were red or green circles (2.8°*2.8°) and red or green triangles (2.3°*2.3°). The cue
and target remained on the screen until response or for a maximum duration of 2000ms. This
was followed by a blank screen for about 1000ms before the onset of the next trial.
Participants were required to press the key on a computer corresponding to red/green colour
or triangle/circle shape.
In this task, half of the trials were switch trials and half were non-switch trials. In the
switch trial, a colour stimulus preceded the shape stimulus (colour to shape switch) or a shape
preceded the colour stimulus (shape to colour switch). In the non-switch trial, a colour
stimulus always preceded another colour stimulus (colour to colour) and a shape stimulus
always preceded another shape stimulus (shape to shape). There were 20 practice trials
followed by 3 blocks of 48 experimental trials each. There were total 72 switch trials and 72
non-switch trials. Reaction time and accuracy were measured for switch trials and non-switch
trials, separately. We derived two dependent variables – switch cost for reaction time (SCRT)
and switch cost for accuracy (SCACC).
𝑆𝐶𝑅𝑇 = 𝑅𝑇𝑆𝑊𝐼𝑇𝐶𝐻 𝑇𝑅𝐼𝐴𝐿 − 𝑅𝑇𝑁𝑂𝑁−𝑆𝑊𝐼𝑇𝐶𝐻 𝑇𝑅𝐼𝐴𝐿
𝑆𝐶𝐴𝑐𝑐𝑢𝑟𝑎𝑐𝑦 = %𝐴𝑐𝑐𝑢𝑟𝑎𝑐𝑦𝑁𝑂𝑁−𝑆𝑊𝐼𝑇𝐶𝐻 𝑇𝑅𝐼𝐴𝐿 − %𝐴𝑐𝑐𝑢𝑟𝑎𝑐𝑦𝑆𝑊𝐼𝑇𝐶𝐻 𝑇𝑅𝐼𝐴𝐿

50
Smaller switch cost meant participants had smaller difference (i.e., equivalent
performance) between the easier (non-switch trial) and the difficult condition (switch trial).
This would suggest efficient shifting ability (Prior & MacWhinney, 2010).
2.4.2.5 Working memory (backward digit span). We used the subtest from the
Wechsler Memory Scale (WMS 3, Wechsler, 1997) to measure the backward recall of digit
sequences. This is thought to reflect working memory performance (Wilde, Strauss, &
Tulsky, 2004). Participants were verbally presented an increasingly longer series of digits, 2
to 9, and then were asked to repeat the sequence of the digits in reverse order. The rate of
presentations was one digit per second. The test terminated failing two consecutive trials at
any one span size or when the maximum trial size was reached. Backward digit score was the
total number of lists reported correctly in the backward digit span test.
2.4.3 Verbal Fluency Measures
2.4.3.1 Trials and procedures. All the participants completed two verbal fluency
conditions − semantic and letter – in English. They were asked to produce as many words as
possible in 60 s. In semantic fluency condition, participants produced words in three
categories− animal, fruits and vegetables, and clothing items. In letter fluency condition,
participants were asked to produce words that start with letters F, A, and S. The restrictions
for the letter conditions were to produce unique words that are not proper names or not
numbers (e.g., Singapore, seven), and to not produce variants of the same words (e.g., shop,
shopper, shopping). The orders of the fluency conditions were randomized across
participants; however, the trials were blocked by condition. Each participant was tested
individually. After providing the instruction, the participant started a trial only when the
tester said “start”. This ensured that there was a definitive starting point for each trail.
Responses were recorded with a digital voice recorder and later analysed for the following
variables.

51
2.4.3.2 Data coding and analysis. All responses (including repetition and errors)
were transcribed verbatim. Each correct response was time-stamped using PRAAT (Boersma
& David, 2015). The time-stamping enables to index the onset of a response from the onset of
the trail (i.e., “start”). That is, it is the time that has elapsed from the beginning of the trial
until the onset of the response, which allowed us to calculate the variables in time-course
analysis. We measured the following variables for each trial:
2.4.3.2.1 Total number of correct responses (CR). CR was calculated after excluding
the errors. In semantic fluency, errors were repetition of same words, words that were not
from the target category (e.g., cat as a response for clothing category), or cross-linguistic
intrusions. In letter fluency, CR was calculated after excluding repetition of same words,
words that began with a different letter (e.g., pig as a response for letter F), proper nouns
(e.g., France as a response to letter F), same word but with different endings (e.g. fast, faster,
fastest were counted as single CR), and cross-linguistic intrusions.
2.4.3.2.2 Fluency difference score (FDS). The FDS was calculated first by
subtracting the mean of letter fluency score (CR letter fluency) from the mean semantic fluency
score (CR semantic fluency) and then dividing the difference by the mean semantic fluency score
(CR semantic fluency) for each participant.
FDS = (CR semantic fluency - CR letter fluency) / CR semantic fluency
2.4.3.2.3 Time-course analysis variables. Four variables were analysed following
Luo et al.’s (2010) recommendation: 1st RT; Sub-RT; initiation parameter; and slope. Based
on the time tag, CRs were grouped into 5-sec bins over each 60-sec trial, resulting in 12 bins.
The group means of CR in each of the twelve bins were calculated for each semantic and
letter fluency trial. The means of CRs for each trial were plotted using a line graph (x
variable, bins; y-variable, mean CR). This graph was then fitted with logarithmic function.
An example of a logarithmic function (see Figure 2.2) is 𝑦 = 4.31– 1.312 𝐼𝑛(𝑡) , where 𝑦

52
is the estimated value of the function at different points of time(𝑡). Two central measures
derived from this plot were: initiation parameter and slope.
Figure 2.2 Time course of correct responses over twelve 5-sec bins. Best-fit line is logarithmic functions.
2.4.3.2.3.1 1st-RT. The 1st-RT is the time interval from the beginning of the trial to the
onset of first response. The first response usually takes longer than the subsequent responses
and this delay in first response has been linked to the task preparation (Rohrer, Wixted,
Salmon, & Butters, 1995).
2.4.3.2.3.2 Sub-RT. Subsequent-RT (Sub-RT) is the average value of the time
intervals from the onset of first response to the onset of each subsequent response. Thus, Sub-
RT provides a good estimate for mean retrieval latency and represents the time point at which
half of the total responses have been generated (Sandoval et al., 2010) . A longer mean Sub-
RT indicates that performance extends later into the time course, but interpretation of this
variable depends on the total number of correct (Luo et al., 2010). If one group produces
more correct responses than another group and has longer mean Sub-RT, then the
interpretation is that the group has superior control (and equivalent or better vocabulary) and
could continue generating responses longer. If one group produces fewer or equivalent
correct responses but has longer mean Sub-RT, then the interpretation is that the control is

53
more effortful as it took longer to generate the same or a fewer number of items. In contrast, a
shorter mean Sub-RT would indicate a faster declining rate of retrieval because a large
proportion of the responses were produced early during the trial.
2.4.3.2.3.3 Initiation parameter. This parameter is the starting point of the logarithmic
function that is the value of 𝑦 when 𝑡 = 1 or 𝐼𝑛(𝑡) = 0 (e.g., initiation parameter for the
above mentioned logarithmic function is 𝑦 = 4.31 – 1.312 𝐼𝑛(1) = 4.31 – 0 = 4.31).
Initial parameter indicates the initial linguistic resources/breath of lexical items available for
the initial burst when the trail begins and is largely determined by vocabulary knowledge.
2.4.3.2.3.4 Slope. Slope of the plot is determined by the shape of the curve and refers
to the rate of retrieval output as a function of the change in time over 60-sec. Slope for the
above example would be 1.31. It reflects how the linguistic resources are monitored and used
over time and is largely determined by executive control. Flatter slope indicates that
participants were able to maintain their performance across the response period despite
greater lexical interference (e.g. avoiding repetition, searching for words from the already
exhausted vocabulary source) towards the end of the trial, reflecting better executive control.
2.4.3.2.4 Qualitative analysis. We closely followed the methods used by Troyer et
al.’s (1997) to perform our clustering and switching analysis. Repetitions were included for
clustering and switching analysis. Semantic fluency clustering was defined as successively
produced words that shared a semantic subcategory. Letter fluency clustering was defined as
successively generated words which fulfil any one of the following criteria (Troyer et al.,
1997): words that begin with the same first two letters (stop and stone); words that differ only
by a vowel sound regardless of the actual spelling (son and sun); words that are rhyme (stool
and school); or words that are homonyms (sheep and ship). Appendix 2.3 provides the
details of the subcategories. Two variables were generated subsequent to clustering the
responses:
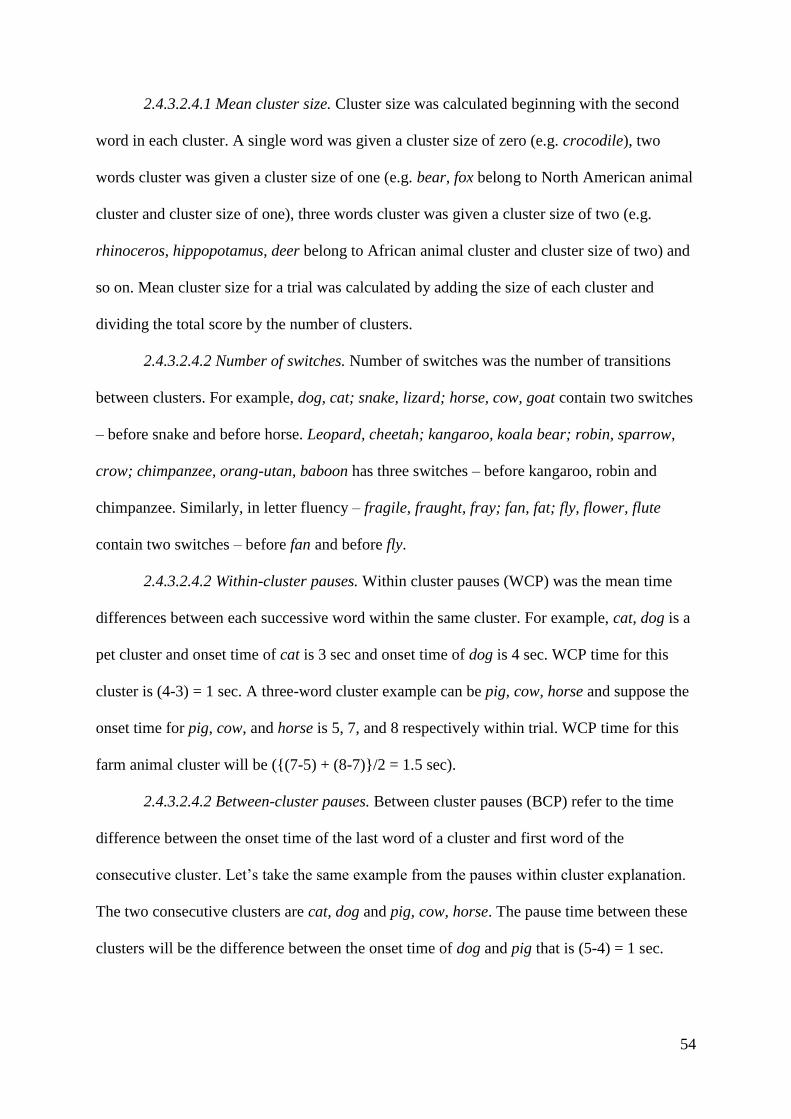
54
2.4.3.2.4.1 Mean cluster size. Cluster size was calculated beginning with the second
word in each cluster. A single word was given a cluster size of zero (e.g. crocodile), two
words cluster was given a cluster size of one (e.g. bear, fox belong to North American animal
cluster and cluster size of one), three words cluster was given a cluster size of two (e.g.
rhinoceros, hippopotamus, deer belong to African animal cluster and cluster size of two) and
so on. Mean cluster size for a trial was calculated by adding the size of each cluster and
dividing the total score by the number of clusters.
2.4.3.2.4.2 Number of switches. Number of switches was the number of transitions
between clusters. For example, dog, cat; snake, lizard; horse, cow, goat contain two switches
– before snake and before horse. Leopard, cheetah; kangaroo, koala bear; robin, sparrow,
crow; chimpanzee, orang-utan, baboon has three switches – before kangaroo, robin and
chimpanzee. Similarly, in letter fluency – fragile, fraught, fray; fan, fat; fly, flower, flute
contain two switches – before fan and before fly.
2.4.3.2.4.2 Within-cluster pauses. Within cluster pauses (WCP) was the mean time
differences between each successive word within the same cluster. For example, cat, dog is a
pet cluster and onset time of cat is 3 sec and onset time of dog is 4 sec. WCP time for this
cluster is (4-3) = 1 sec. A three-word cluster example can be pig, cow, horse and suppose the
onset time for pig, cow, and horse is 5, 7, and 8 respectively within trial. WCP time for this
farm animal cluster will be ({(7-5) + (8-7)}/2 = 1.5 sec).
2.4.3.2.4.2 Between-cluster pauses. Between cluster pauses (BCP) refer to the time
difference between the onset time of the last word of a cluster and first word of the
consecutive cluster. Let’s take the same example from the pauses within cluster explanation.
The two consecutive clusters are cat, dog and pig, cow, horse. The pause time between these
clusters will be the difference between the onset time of dog and pig that is (5-4) = 1 sec.

55
2.5 Statistical Analysis
Normality checks were performed for all the variables using Shapiro-Wilk test. For the
normally distributed data set, we performed parametric statistical tests and for the data set
which was not normally distributed, we performed non-parametric statistical tests. The
vocabulary measures and working memory span were not normally distributed. Therefore,
Mann-Whitney U test was performed for all the above-mentioned variables. For Stroop ratio
and switch cost accuracy, independent sample t-tests were performed.
In verbal fluency, all the variables were normally distributed. All the variables were
measured for each trial for the two fluency conditions for each participant. To arrive at the
mean scores for each variable, the three trials were averaged in each condition; for semantic
fluency animals, fruits and vegetables, and clothing were averaged; for letter fluency F, A,
and S trials were averaged. A two-way ANOVA repeated measure was used on the following
variables: number of CR, 1st-RT, Sub-RT, cluster size and number of switches. In the design,
Group (Monolingual; Bilingual) was treated as a between-subject factor, and Condition
(Semantic; Letter) was treated as within-subject factor. An independent sample t-test was
used on the FDS with Group as the between-subject factor. Two separate independent
sample t-tests were conducted for initiation parameter and slope for semantic and letter
fluency conditions with Group as the between-subject factor. Tukey’s post hoc tests were
applied for significant interaction effects at p≤ 0.05. To examine the relationship between the
executive control measures and verbal fluency variables, Pearson’s correlations were
performed separately for each group for the Stroop ratio and verbal fluency variables.
Spearman’s correlations were performed separately for each group between the other two
executive variables (switch cost (RT) and backward digit span) with the verbal fluency
variables.

56
2.6 Results
The mean and standard deviation values and the results of the statistical tests for the
bilingual’s subjective language profile in Bengali and English are presented in Table 2.3. The
mean and standard deviation values and the results of the statistical tests for the objective
vocabulary tests and executive control measures are presented in Table 2.4. The mean and
standard deviation values for the verbal fluency variables for Groups (Monolingual and
Bilinguals) and Conditions (Semantic and Letter) averaged across participants are presented
in Table 2.5 (standard deviation reflects between-subject variation). The results of the
statistical tests are provided in Table 2.5 as well. Findings from the correlation analyses
between the executive control measures and verbal fluency variables for each group are
presented in Table 2.7. Findings for Group differences are presented first; followed by the
findings on the relationship of executive control measures and verbal fluency variables.
2.6.1 Background and Executive Control Measures
Table 2.3 presents the results on various measures of bilingualism. There was no significant
difference amongst bilinguals’ Bengali and English on the language of instruction during
education, subjective language proficiency ratings (speaking, comprehension, reading, and
writing abilities) and language dominance; indicating a balanced bilingualism on these
domains. However, during childhood, bilinguals had significantly greater Bengali exposure
during acquisition (M = 14.3, SD = 2.6) than English (M = 2.5, SD = 2.3). Current usage of
language was predominantly English; they were more prone to switch from Bengali to
English than the reverse during day-to-day communication. As our bilinguals were staying in
an English-speaking country, it was expected that they would use English more than Bengali.
The two groups did not differ on the receptive vocabulary measures (see Table 2.4).
As could be seen in Table 2.4, the two groups differed significantly only on the Stroop ratio,
Stroop incongruent trial and the switch cost accuracy. Compared to monolinguals, bilinguals

57
demonstrated lesser Stroop ratio indicative of better inhibitory control and a smaller switch
cost accuracy suggestive of superior shifting ability. However, bilinguals were overall slower
in the incongruent trial of the Stroop test compared to monolinguals. Raw score for each
individual on the subjective language background measures and executive control measures
are provided in Appendix 2.6 and Appendix 2.7, respectively.

58
Table2.3
Mean (M), Minimum (Min) and Maximum (Max) values, Standard Deviations (SD), and Statistical Results of
Bilinguals’ Subjective Language Profile.
Measures
Bengali English Statistical results
M Min-
Max
SD M Min-
Max
SD
Language acquisition history7 14.31 9-17 2.6 2.51 0-9 2.3 t(24) = 14.9, p<
.001***
Language of instruction7 5.32 1-8 1.9 5.92 2-9 2.4 t(24) = -.6, p = .53
Self-rated language proficiency7
Speaking 6.33 5.5-7.5 .7 6.43 6-7 .6 t(24) = -.1, p = .91
Comprehension 6.73 6-7 .4 6.63 6-7 .5 t(24) = .7, p = .50
Reading 6.73 5-7 .6 6.73 6-7 .5 t(24) = -.3, p = .80
Writing 63 4-7 .9 6.43 6-7 .6 t(24) = -1.6, p = .13
Language use7 124 8-16 1.9 20.64 15-22 2 t(24)= -14.2,p< .001***
Language dominance8 175 11-20 3.2 18.25 12-24 3.6 t(24) = -.9, p = .37
Language switching habit9 8.76 7-10 1.1 7.76 4-12 2.1 t(24) = -2.3, p = .03* 1 – maximum possible score was 16, greater score in one language means greater immersion into that language during
childhood; 2 – maximum possible score was 9, greater score in one language means greater number of years of education in
that language; 3 – on a scale of zero to seven (0 = no proficiency, 7 = native like proficiency), greater score in language
means greater proficiency in that language; 4 – maximum possible score was 25, greater score in one language means greater
use of that language in daily life; 5 – maximum possible score was 31, dominant language is the language which obtains a
greater score than the other language; 6 – maximum score possible was 12, greater score in one language means greater
switch from that language to the other language; 7 – adapted from Muñoz, Marquardt & Copeland (1999); 8 – adapted from
Dunn & Fox Tree, 2009; 9 – adapted from Rodriguez-Fornells et al., 2012. *** p≤.001, * p≤.05.

59
Table2.4
Mean (M), Minimum (Min) and Maximum (Max) values, Standard Deviations (SD), and Statistical Results of
Receptive vocabulary and Executive Control Measures.
Measures
Bilingual (N =25) Monolingual (N = 25) Statistical
results
M Min-Max SD M Min-Max SD
OPT1 53.1 43-58 3.4 54.1 48-58 3.4 U6 = 251.5,
p = .23
BPVS III2 157.8 144-164 4.8 159.8 149-164 4.6 U6 = 269.5,
p = .40
Stroop task3
Stroop ratio 23.5 5-39 8.5 30.7 18-47 10.2 t(48) = -2.9,
p = .005**
Stroop
incongruent
835.7 560-
1141.2
163.7 694.1 553.3-
1141
143.9 U6 = 136,
p < .001***
Stroop
congruent
666.1 411.5-
934.4
146.2 597 424-938.1 183.3 U6 = 225.5,
p = .09
Stroop
difference
169.7 48.8-317.9 64.3 194.9 103.7-
357.9
63 t(48) = -1.4,
p =.17
Colour-shape
switch task4
Switch cost
RT (ms)
266.4 48.1-511.7 154.1 235.8 48.7-530.5 97.3 U6 = 289.5,
p = .65
Switch cost
accuracy
.02 6.9-16.9 3.3 2.8 -7.4-15.2 4.7 t(48) = -2.4,
p = .02*
Digit span
test5
Backward
digit span
6.1 4-7 1 5.6 4-7 0.9 U6 = 226, p = .08
1 – Oxford Quick Placement Test (Oxford University Press and Cambridge ESOL, 2001), maximum possible score was 60,
higher score indicates higher receptive vocabulary; 2 – British Picture Vocabulary Scale, Third Edition (Dunn & Dunn,
2009), maximum possible score was 164, higher score indicates higher receptive vocabulary; 3 – Stroop task; 4 – adapted
from Prior and MacWhinney, 2010; 5 – Digit span test (Wechsler, 1997); 6 - Mann-Whitney U test; *** p≤.001, ** p≤.01, *
p≤.05.

60
Table2.5
Means (M), Standard Deviations (SD) and the Statistical Results of the Dependent Variables by Group (Bilingual and
Monolingual) and Conditions (averaged across trials)
Bilingual (N = 25) Monolingual (N =
25)
Total
Statistical results (Group, Condition)
Measures M SD M SD M SD Group Condition Group*Condition
CR1 18.8 3 18.7 3 18.7 3 F(1,48)=.01,
p=.91, 𝜂𝑝 2= .001
F(1,48)=70.2,
p<.001***,
𝜂𝑝 2= .59
F(1,48)=16.3,
p<.001***,
𝜂𝑝 2= .25
Semantic 19.8 3.3 21.5 3.3 20.6 3.4
Letter 17.8 3.5 15.8 3.5 16.8 3.5
FDS2 .10 .12 .25 .16 .17 .16 t(48)=-3.9, p<.001***, d = 1.1
First RT 1.2 .5 1.2 .5 1.2 .5 F(1,48)=.01,
p=.92, 𝜂𝑝 2= .001
F(1,48)=.18,
p=.67, 𝜂𝑝 2= .004
F(1,48)=.34,
p=.56, 𝜂𝑝 2= .007 Semantic 1.3 .6 1.2 .7 1.2 .6
Letter 1.2 .8 1.2 .7 1.2 .7
Sub-RT 23.9 1.5 22.5 1.5 23.3 1.3 F(1,48)=11.4,
p=.001***,𝜂𝑝 2=
.19
F(1,48)=83.8,
p<.001***,𝜂𝑝 2=
.64
F(1,48)=2.4,p=.13
, 𝜂𝑝 2= .05 Semantic 21.5 2.4 20.9 2.3 21.2 2.4
Letter 26.2 1.5 24.1 1.9 25.2 1.9
Initiation
Semantic
3.9 .6 4.3 .9 4.1 .8 t(48)=-1.91, p=.06, d = .54
Initiation
Letter
2.4 .5 2.5 .6 2.5 .5 t(48)=-.46, p=.64, d = .13
Slope
Semantic
-1.2 .3 -1.3 .5 -1.3 .3 t(48)=-.81, p=.42, d = .22
Slope
Letter
-.5 .2 -.7 .2 -.6 .2 t(48)=-2.7, p=.008**, d = .76
Cluster size .60 .2 .57 .2 .59 .1 F(1,48)=.4,
p=.54, 𝜂𝑝 2=
.008
F(1,48)=62.1,
p<.001***,𝜂𝑝 2=
.56
F(1,48)=8.1,p=.00
7**, η𝑝 2= .14 Semantic .70 .3 .80 .3 .75 .2
Letter .49 .2 .34 .2 .42 .2
Number of
switches
11.7 2.4 12.2 2.1 11.9 2.1 F(1,48)=.7,
p=.41, η𝑝 2=
.01
F(1,48)=2.9,
p=.09, 𝜂𝑝 2= .06
F(1,48)=1.2,p=.27
, η𝑝 2= .02
Semantic 11.9 2.7 12.8 2.1 12.3 2.2
Letter 11.6 3.1 11.6 2.7 11.6 2.7
WCP3 1.9 .5 1.7 .5 1.8 .4 F(1,48)=1.5,
p=.22, η𝑝 2=
.03
F(1,48)=17.1,p<.
001***, η𝑝 2= .26
F(1,48)=1.4,p=.23
, η𝑝 2= .03 Semantic 1.5 .5 1.5 .5 1.5 .4
Letter 2.4 .9 1.9 1.2 2.2 1
BCP4 4 .9 4.1 .9 4 .8 F(1,48)=.2,
p=.65,𝜂𝑝 2=.01
F(1,48)=1.6,
p=.21, 𝜂𝑝 2= .03
F(1,48)=6.8,p=.01
**, 𝜂𝑝 2= .12 Semantic 4.1 1.3 3.7 1.1 3.9 1.2
Letter 3.9 1.2 4.5 1.1 4.2 1
1 – number of correct responses, 2 – Fluency Difference Score, 3 – Within-Cluster Pauses, 4 – Between-Cluster Pauses, *** p≤.001, **p≤.01,
* p≤.05, Condition (Semantic, Letter)

61
Table2.6
Best Fitting Multilevel Model Functions for the Time Course of Correct Responses in Verbal Fluency Task.
Measure Bilingual (N = 25) Monolingual (N = 25)
Semantic fluency 𝑦 = 3.72 − 1.17ln (𝑡) 𝑦 = 4.28 − 1.33ln (𝑡)
Letter fluency 𝑦 = 2.44 − .58ln (𝑡) 𝑦 = 2.50 − .70ln (𝑡)
Note: logarithmic function estimates are obtained from multilevel modelling with all observations.
Table 2.7
Correlation Coefficients amongst the Executive Control Measures and the Verbal Fluency Variables.
Executive
control
measures
Fluency variables
CR FDS 1st
RT
Sub-
RT
Initiati
on
Slope Cluster
size
Number
of
switches
WCP BCP
Bilinguals (N = 25)
Stroop
ratio
rs1 -.10 .30 .21 .05 .33 .40* .01 -.13 .22 .08
p-
value
.62 .14 .30 .81 .10 .04 .96 .52 .15 .36
Switch
cost
(RT)
rs2 -.36 .29 .26 .12 .02 .33 -.08 -.29 .18 .12
p-
value
.08 .15 .21 .56 .93 .11 .72 .16 .40 .57
Digit span
backward
rs2 .23 .21 .22 .27 .18 .03 .02 .16 .17 .14
p-
value
.28 .32 .28 .20 .39 .87 .94 .44 .42 .50
Monolinguals (N = 25)
Stroop
ratio
rs1 -.08 -.14 -.21 -.16 .16 .20 -.39 .16 -.13 .01
p-
value
.69 .51 .30 .44 .43 .33 .06 .45 .54 .97
Switch
cost
(RT)
rs2 .01 -.30 -.05 -.01 -.01 .16 .13 -.19 .17 .11
p-
value
.99 .14 .80 .98 .98 .44 .54 .38 .41 .59
Digit span
backward
rs2 -.03 -.03 -.09 .21 -.09 -.22 -.01 .03 -.20 .11
p-
value
.87 .89 .67 .31 .68 .28 .97 .89 .35 .59
1 - Pearson’s correlation coefficient; 2 – Spearman’s rho; * p≤.05.
2.6.2 Group Differences in Verbal Fluency Performance
Differences between the monolinguals and bilinguals were observed either as a main
effect of Group, or an interaction of Group X Condition for CR, FDS, Sub-RT, slope for letter
fluency, cluster size, and BCP. There were no group differences in 1st-RT, initiation

62
parameters for either semantic or letter fluency, slope for semantic fluency, number of
switches, and WCP.
The CR showed a main effect of Condition (Semantic: M = 20.6, SD = 3.4; Letter: M
= 16.8, SD = 3.5) and a significant interaction of Group X Condition (see Figure 2.3). Post-
hoc analysis of the interaction revealed that there was no significant difference between the
groups for semantic condition (p>.05). However, bilinguals produced significantly more
number of CR in the letter fluency compared to monolinguals, t(48) = 1.98, p = .05, d = .53.
For FDS, bilinguals showed significantly smaller FDS (Bilingual: M =.12, SD = .15;
Monolingual: M= .26, SD = .16; see Figure 2.4).
Sub-RT showed a significant main effect of Group, with bilingual demonstrating
longer Sub-RT (Bilingual: M = 23.9, SD = 1.5; Monolingual: M = 22.7, SD = 1.5). Cluster
size showed a main effect of Condition (Semantic: M = .7, SD = .2; Letter: M = .4, SD =.2)
and an interaction of Group X Condition (see Figure 2.5). Post-hoc analyses were performed
to compare the performance of the two groups within each fluency type. There was no
significant difference for the cluster size between the bilinguals and monolinguals on the
semantic fluency condition, t(48) = -1.4, p = .17, d = .39 but bilinguals produced significantly
larger cluster than the monolinguals on the letter fluency condition, t(48) = 2.3, p = .02, d =
.66.
Initiation parameter and slope were analysed as a function of the group after each time
course was fitted to multilevel models. The estimated function for each fluency condition and
groups are presented in Table 2.6. Figure 2.7 represents the time course of the correct
responses by the group for the semantic fluency condition and letter fluency condition. In the
semantic fluency, there was no significant group difference in the initiation parameter, t(48) =
-1.9, p = .06, d = .54, or the slope, t(48) = -.81, p = .42, d = .22. In the letter fluency, there
was no significant group difference for the initiation parameter, t(48) = -.46, p = .64, d = .13.

63
However, bilingual group had significantly flatter slope than the monolingual in the letter
fluency condition, t(48) = -2.7, p = .008, d = .76. The results suggest bilinguals were better
able to maintain their linguistic resources throughout the 1-minute of the verbal fluency task,
especially in the difficult letter fluency condition.
BCP showed an interaction of Group X Condition (see Figure 2.6). Post-hoc analyses
were performed to compare the performance of the two groups within each fluency type.
There was no significant difference for the BCP between the bilinguals and monolinguals on
the semantic fluency condition, t(48) = 1.2, p = .22, d = .35, but bilinguals took significantly
lesser time than the monolinguals to switch between one cluster to another on the letter
fluency condition, t(48) = -2.3, p = .02, d = .66. In addition, WCP showed only a main effect
of Condition. All the participants took less time to access words within a cluster in the
semantic fluency compared to the letter fluency condition (Semantic: M = 1.5, SD = .4;
Letter: M = 2.2, SD = 1).
Figure 2.3 Comparison of mean number of correct responses (CR) between the groups by fluency condition
(semantic and letter). Error bars represent standard error of the mean. * p≤.05
19.817.4
21.5
15.4
0
5
10
15
20
25
Semantic Letter
Mea
n n
um
ber
of
CR
Fluency condition
Group Differences for CR
Bilingual
Monolingual

64
Figure 2.4 Comparison of mean proportion fluency difference scores (FDS) between the groups. Error bars
represent standard error of the mean. * p≤.05
Figure 2.5 Comparison of mean cluster size between the groups by fluency condition (semantic and letter). Error
bars represent standard error of the mean. * p≤.05
Figure 2.6 Comparison of mean between cluster pauses (BCP) between the groups by fluency condition
(semantic and letter). Error bars represent standard error of the mean. * p≤.05.
0.12
0.26
-0.1
0
0.1
0.2
0.3
0.4
0.5
Bilingual Monolingual
Mea
n f
luen
cy d
iffe
rence
sco
re
Group
Group Differences for FDS
0.720.46
0.8
0.34
0
0.2
0.4
0.6
0.8
1
Semantic Letter
Mea
n c
lust
er s
ize
Fluency condition
Group Differences for Cluster Size
Bilingual
Monolingual
44
3.7
4.7
0
1
2
3
4
5
6
7
Semantic Letter
Mea
n b
etw
een c
lust
er p
ause
s
(mse
c)
Fluency condition
Group Differences for BCP
Bilingual
Monolingual
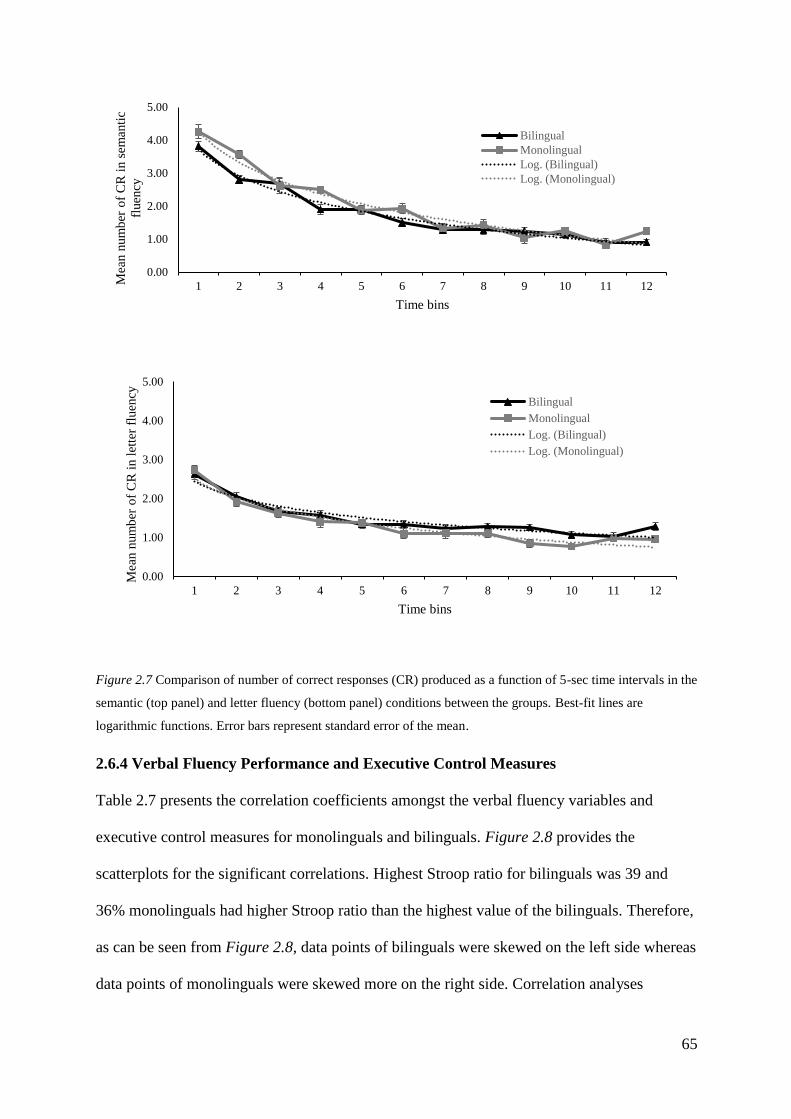
65
Figure 2.7 Comparison of number of correct responses (CR) produced as a function of 5-sec time intervals in the
semantic (top panel) and letter fluency (bottom panel) conditions between the groups. Best-fit lines are
logarithmic functions. Error bars represent standard error of the mean.
2.6.4 Verbal Fluency Performance and Executive Control Measures
Table 2.7 presents the correlation coefficients amongst the verbal fluency variables and
executive control measures for monolinguals and bilinguals. Figure 2.8 provides the
scatterplots for the significant correlations. Highest Stroop ratio for bilinguals was 39 and
36% monolinguals had higher Stroop ratio than the highest value of the bilinguals. Therefore,
as can be seen from Figure 2.8, data points of bilinguals were skewed on the left side whereas
data points of monolinguals were skewed more on the right side. Correlation analyses
0.00
1.00
2.00
3.00
4.00
5.00
1 2 3 4 5 6 7 8 9 10 11 12Mea
n n
um
ber
of
CR
in s
eman
tic
fluen
cy
Time bins
Bilingual
Monolingual
Log. (Bilingual)
Log. (Monolingual)
0.00
1.00
2.00
3.00
4.00
5.00
1 2 3 4 5 6 7 8 9 10 11 12
Mea
n n
um
ber
of
CR
in l
ette
r fl
uen
cy
Time bins
Bilingual
Monolingual
Log. (Bilingual)
Log. (Monolingual)

66
revealed bilinguals showed significant positive correlations between Stroop and slope, r (23)
= .40, p = .04 (see Figure 2.8). Bilinguals with lesser Stroop ratio illustrated a flatter slope
indicating that the bilinguals with better inhibitory control could maintain their linguistic
resources throughout the 1-minute of the verbal fluency task. Monolinguals did not show any
significant correlation between any of the executive control measures and verbal fluency
components.
Figure 2.8 Correlation plots for the significant correlations between the Stroop ratio and slope of verbal fluency
for the groups.
0
0.2
0.4
0.6
0.8
1
1.2
1.4
1.6
15 20 25 30 35 40 45 50
Slo
pe
Stroop ratio
Bilingual
Monolingual
Linear (Bilingual)
Linear (Monolingual)

67
2.7 Discussion
The overarching aim of this study was to determine the contribution of linguistic and
executive control processes to word retrieval in bilingual and monolingual participants. To
meet the overall aim, the present study determined the group differences in verbal fluency
performance between vocabulary-matched monolinguals and bilinguals and identified the
executive control measures that mediate the performance difference between them. We used a
large group of relatively homogeneous Bengali-English bilinguals who were matched for age,
years of education, non-verbal IQ, and vocabulary with the monolinguals. We used a wide
range of variables − CR, FDS, 1st-RT, Sub-RT, initiation, slope, clustering and switching,
within-cluster pauses, and between-cluster pauses – that are thought to differentially
contribute to the linguistic and executive components of verbal fluency task. In addition, we
measured executive control in the domains of inhibition, switching and working memory, and
linked the performance on the verbal fluency to the executive measures.
To summarize the main findings, compared to monolinguals, bilinguals showed
differences in both linguistic and executive control domains as identified and indicated on
Table 2.8. Specifically, differences were observed in CR for letter fluency, FDS, Sub-RT,
slope for letter fluency, cluster size, and BCP for letter fluency. Despite lack of overall group
difference on CR, bilinguals outperformed the monolinguals on letter fluency. Bilinguals and
monolinguals were comparable on semantic fluency. Vocabulary matched bilinguals
performing better than monolinguals on letter fluency corroborate research by other groups
(Friesen et al., 2015; Luo et al., 2010). Both the studies found better performance for
bilinguals on the letter fluency condition and had argued in favour of superior executive
control for bilinguals as compared to monolinguals.

68
Table2.8
Results of Current Study in the Context of Verbal Fluency Variables and to their Linguistic and Executive
Control Components.
Parameters Processes Bilingual (B) vs Monolingual (M)
Linguistic Executive Findings Correlation with
Executive Control
Quantitative
1. Number of correct
responses
√ √ Yes
B > M (Letter)
No
2. Fluency difference score
√ Yes
B < M
No
Time course
1. 1st RT
√ No
B = M
No
2. Sub-RT
√ Yes
B > M
No
3. Initiation
√ No
B = M
No
4. Slope
√ Yes
B < M (Letter)
Yes
(+) with Stroop
Ratio for B
Qualitative
1. Cluster size
√ Yes
B > M (Letter)
No
2. Number of switches
√ No
B = M
No
3. Within-cluster pauses
√ No
B = M
No
4. Between-cluster pauses
√ Yes
B < M (Letter)
No
Yes – significant findings, NO – not significant findings
Building on the evidence that bilinguals’ might be having an advantage in executive
control that is helping their performance in letter fluency task comes from two findings: One,
bilinguals demonstrated significantly smaller FDS than monolinguals, which is claimed to
reflect superior executive control. Second, longer Sub-RT with more number of CR in the
letter fluency, a flatter slope and shorter BCP on letter fluency task may be attributed to
superior executive control. As discussed in the introduction, longer Sub-RT can be either due
to smaller vocabulary or superior executive control abilities of bilinguals compared to
monolinguals (Luo et al., 2010). Since our groups were matched on vocabulary and we do not
find any significant difference between the two groups on initiation parameter (which is a
measure of initial linguistic resources), it is likely that bilinguals performance would be

69
indicative of superior executive control (Luo et al., 2010). Luo et al (2010) have postulated
that the superior executive control would result in a slower decline in retrieval speed or longer
Sub-RT for bilinguals in combination with a higher number of CR and flatter slope than
monolinguals. Overall, equivalent performance on the vocabulary test, longer Sub-RT, flatter
slope and better performance on the letter fluency condition (higher CR and smaller FDS) for
bilinguals compared to monolinguals suggest a bilingual advantage in verbal fluency task
when there is a higher demand for controlled executive processing skills such as in the letter
fluency.
On the qualitative measures, we expected bilinguals to produce smaller cluster size
which utilizes the language processing mechanism and more number of switches which
requires efficient executive control mechanism. However, we found that bilinguals produced
bigger cluster size in letter fluency condition which can be due to a strategy to bolster their
performance in letter fluency. Previous studies have found positive correlations between
cluster size and number of correct responses (Bose et al., 2017). The lack of difference in
switching is surprising as we expected bilingual participants to produce more number of
switches compared to monolinguals as better executive control abilities have been linked with
better switching abilities. Bilinguals took lesser time to switch between clusters in the letter
fluency condition compared to the monolinguals. Previous studies have associated longer
BCP with poorer executive control abilities (Raboutet et al., 2010; Rosen et al., 2005) and
reduced productivity in the verbal fluency task (Bose et al., 2017). Therefore, shorter BCP for
bilinguals compared to monolinguals reflect bilingual’s superior executive control abilities
and corroborates with previous studies. In addition, both groups also performed similarly on
the non-verbal switching task (colour-shape switch task) which requires switching from one
mental set to another. No difference between the groups on colour-shape switch task is

70
consistent with the findings obtained by Paap and his colleagues (Paap & Greenberg, 2013;
Paap & Sawi, 2014; Paap et al., 2017).
Results of correlation analyses further supports the idea that executive control
advantage in bilinguals helping them to perform better in verbal fluency measures where task
demand is higher. Variables that related to inhibitory control correlated with verbal fluency
measure (slope) which taps into the executive component of the task (see Table 2.8). This
correlation was found only for the bilinguals. Researchers have long contended the role of
executive control ability in various verbal fluency parameters such as slope (Luo et al., 2010).
However, this is the first study to relate specific measures of executive control with a broad
range of measures of verbal fluency. Similar to Shao et al.’s (2014) study, we did not find any
correlation between inhibitory control measures and the number of correct responses for both
the monolingual and bilingual groups. These results support the claim made in the earlier
section that executive control advantage of bilinguals helps them to outperform monolinguals
in verbal fluency tasks, especially where task demands are higher. However, we must
acknowledge that two of our executive control tests were verbal in nature and that might be a
possible reason for getting significant correlations with the verbal fluency measures. To rule
out the collinearity issue, we performed correlation between the executive control measures
and the vocabulary measures. We did not find any significant correlations between the
executive control measures and vocabulary measures (See Appendix 2.8). Future studies
should consider taking a more challenging and different types of executive control measures
(non-verbal) to investigate the role of executive control components in verbal fluency
performance.
Though we have found clear differences between the two groups, on linguistic and
executive control parameters, we must recognize the demographic and social differences that
may have contributed to this performance difference. Both groups were different in terms of

71
their occupational status, 56% of the monolingual participants of the present study were
university student whereas majority of the bilingual participants consisted of homemakers
(28%) and engineers (24%). Therefore, superior performance in the executive control
measures could be attributed to the higher percentage of high skilled bilingual immigrants
(engineers) in the present study. Poorer performance of the monolingual groups could also be
ascribed to the low motivation of the participants, higher percentage of monolingual
participants were university student (56%) who took part in the experiment for course credit
whereas bilingual participants were self-motivated to take part in this study. Future studies
should consider these social and demographic factors to better account for the performance
differences between these two groups.
In summary, bilinguals when matched for vocabulary performed similarly to
monolinguals in semantic fluency where demand of linguistic processes are higher and better
compared to monolinguals in the difficult letter fluency where demands of executive control
processes are higher. For bilinguals, executive control processes correlated with the verbal
fluency measure where effortful controlled processing is required. These findings may not be
visualised if only number of correct responses were taken as an indicator of verbal fluency
performance. A range of verbal fluency variables are necessary to understand the differences
in verbal fluency performances between bilingual and monolingual speakers. Present study
also provides empirical support to the understanding in role of executive control in verbal
fluency performance. Findings from the correlational analysis suggest that superior executive
control abilities helped bilinguals to perform better than the monolinguals only where the task
difficulty is high. Therefore, as recommended by Paap et al (2017), separate measures of
verbal and executive control abilities are necessary to explain bilingual advantages and
disadvantages in various measures.

72
Chapter 3. Semantic Context Effects and Executive Control in Healthy Monolingual and
Bilingual Speakers

73
3.1 Abstract
Background. Given lexical selection happens through a competitive process during word
production; the important question that arises is how monolingual and bilingual speakers resolve
the lexical competitions in contexts where competition is increased. The blocked-cyclic picture
naming is a well-established paradigm that has been used to explore lexical competition during
word production. In this paradigm, objects are presented in a close succession either from same
semantic categories (homogeneous, e.g. elephant, lion, deer, and hippopotamus) or different
(heterogeneous, e.g. pear, shoes, lips, and deer). Naming gets slower and more error-prone in the
homogeneous context as compared to heterogeneous context. This has been linked to the
heightened activation of the competitors in the homogeneous set. In healthy monolingual
speakers, executive control mechanisms especially inhibitory control helps to resolve this
competition. However, it is yet not known whether bilingual speakers who often show better
executive control but also faces greater lexical competition compared to monolinguals, will
outperform monolinguals or not on a task where lexical competition is enhanced.
Aims. The overarching aim of this study was to determine the differences in linguistic and
executive control contribution in word production between bilingual and monolingual
participants by using a task where semantic activation and lexical competition can be
manipulated. Specific aims were to investigate performance differences (context effect: RT
difference between homogeneous and heterogeneous context; slope: changes in RT across
cycles) in blocked-cyclic picture naming task between vocabulary-matched Bengali-English
bilinguals and English monolinguals and if these differences can be explained by the differences
in their executive control abilities.
Methods & Procedure. Blocked-cyclic picture naming task in English was administered on 25
Bengali-English bilinguals and 25 English monolinguals. Pictures were presented individually
on a computer and accuracy, and naming latencies were analysed. The stimuli set included 25
monosyllabic nouns (5 semantic category × 5 words in each category). Five homogeneous and

74
five heterogeneous sets of five items each were created and presented in an alternating order.
There were five cycles of presentation with each item presented once in each cycle. Dependent
variables were: Context effect for all cycles, excluding the first cycle, and excluding cycle 2 to 5;
Slope. Participants also completed the same executive control tests as described in Chapter 2.
Outcomes & Results. Both groups showed significant semantic context effect. However,
compared to the monolinguals, bilinguals showed significantly lesser semantic context effect.
Bilinguals also showed significant semantic facilitation on the first cycle. There were no
significant correlations between any of the executive control measures and blocked-cyclic
naming variables.
Conclusions & Implications. Similar to Chapter 2, bilinguals perform better than monolinguals
even in a linguistic task where task difficulty is higher (homogeneous condition) and used better
strategy to show semantic facilitation even in an alternating blocked-cyclic naming design.
Overall, the present study supports the claim that executive control helps to reduce the semantic
interference where lexical competition is heightened.

75
3.2 Introduction
Selection of the appropriate target word during conversation is an essential feature of successful
communication in everyday life. To produce a word successfully, a speaker must select the
target word from several other competing semantically related items (e.g. if the target is dog,
items such as cat and horse will also compete for selection; see Caramazza, 1997, Dell,
Schwartz, Martin, Saffran, & Gagnon, 1997, Levelt, Roelofs, & Meyer,1999). Studies have
suggested that executive control mechanism especially inhibitory control helps to resolve this
lexical competition (Crowther & Martin, 2014; Shao et al., 2015). However, there is currently no
consensus in the literature as to whether this lexical competition is resolved in the same way by
monolingual and bilingual speakers, as previous research has shown that these two populations
differ in their use of executive control and resolution of lexical competition (see Chapter 2 for
more detailed discussion on the differences between bilingual and monolingual executive
control). For example, whereas bilingual speakers face both within- and between-language
competition, monolingual speakers only have to resolve within language competition (Lee &
Williams, 2001). On the other hand, executive control abilities especially inhibitory control has
been shown to be stronger in bilinguals as compared to monolinguals (e.g. Bilaystok, 2009, Prior
& MacWhinney, 2010; however, for exception see Paap & Greenberg, 2013; Paap & Sawi,
2014; Paap et al., 2017). The concept of increased lexical competition and stronger inhibitory
control in bilinguals compared to monolinguals drives the research question of the present study.
In this study, we investigated the relationship between increased lexical competition and
executive control processes for bilingual and monolingual speakers using blocked-cyclic picture
naming paradigm.
Blocked-cyclic picture naming paradigm is a simple, yet a powerful picture naming
paradigm used to investigate the changes in semantic activation and lexical competition in
healthy as well as neurologically impaired populations (e.g. Belke, Meyer, & Damian, 2005;
Damian, Vigliocco, & Levelt, 2001; Schnur, Schwartz, Brecher, & Hodgson, 2006; Scott &

76
Wilshire, 2010). Blocked-cyclic naming also make use of same item sets in homogeneous and
heterogeneous context, therefore, controls for lexical variables which often confounds studies
involving word production. For the present study, we will focus on the findings related to the
healthy population. In a typical semantically blocked-cyclic naming task, subjects are asked to
name pictures from semantically homogeneous set (Figure 3.1) that is all the items are from
same semantic category or name pictures from a heterogeneous set (Figure 3.1) that is items are
from different semantic category.
When homogeneous items are named in close succession, selection of the target becomes
more difficult as the homogeneous items also compete for selection (Belke et al., 2005). Naming
gets slower and more error prone in the homogeneous context as compared to heterogeneous
context which is also called semantic context effect or semantic blocking effect. This has been
linked to the heightened activation of the competitors in the homogeneous set (Belke et al.,
2005; Schnur et al., 2006). Studies have shown that executive control mechanism especially
inhibitory control and working memory helps to resolve this lexical competition (Belke,
Humphreys, Watson, Meyer, & Telling, 2008; Crowther & Martin, 2014; Shao et al., 2015).
Therefore, blocked cycling naming is ideally suited to investigate the central question of
this thesis that is the interaction of word production and executive control, and this paradigm has
not been exploited in bilingual population. In the below section, we will briefly review the
central findings related to the blocked cyclic naming in healthy adults and how it is related to the
executive control mechanism.
Figure 3.1 Example of a semantically homogeneous set (left panel; elephant, lion, deer, and hippopotamus all
are from the same semantic category) and heterogeneous set (right panel; pear, shoes, lips, and deer all are
from different semantic category)

77
3.2.1 Central Findings: Blocked-Cyclic Naming
In a standard blocked-cyclic naming design (Figure 3.2), items are presented in a cyclic fashion
within a block (homogeneous or heterogeneous). The semantic context effect generally emerges
from cycle two onwards and does not increase thereafter (Belke et al., 2005, See Belke &
Steilow, 2013 for a review). Further, studies have shown either semantic facilitation (better
performance in the homogeneous context compared to heterogeneous context) or no context
effect in cycle 1 depending on the order of presentation (Belke et al., 2005; Damian and Als,
2005; Abdel Rahman & Melinger, 2007).
Figure 3.2. Schematic representation of a blocked-cyclic naming design with five items per category across five
presentation cycles. Hom I represents first set of homogeneous contexts and Het I represents first set of
heterogeneous contexts. Lists are presented in an alternated order. Adapted from Belke (2017).
Belke et al. (2005) investigated the semantic context effect and it’s build up across cycles
in a blocked cyclic-naming design with healthy undergraduate English monolingual students.
Their blocked-cyclic naming design consisted of 32-line drawings, including four items from
each of the four semantic categories (animals, tools, vehicle, and furniture) and 16 filler items
and there were eight presentation cycles. List of homogeneous and heterogeneous set of items
were presented in an alternate fashion (homogeneous-heterogeneous-homogeneous-

78
heterogeneous). They found significant main effect of context that is items from the
homogeneous sets were named slower compared to the items from the heterogeneous sets. There
was a significant interaction of context and cycle when all presentation cycles were included;
however, the interaction disappeared when cycle 1 was excluded from the analysis. They
concluded that semantic interference increases in the homogeneous context and it is non-
cumulative in nature.
Damian and Als (2005) have showed that the semantic context effect persists even when
items were not named in close successive order. They tested groups of English monolingual
participants (24 participants for Experiment 1, 8 participants for experiment 2, 10 participants
for experiment 3, and 32 participants for experiment 4) on four blocked-cyclic naming
experiments. On experiment 1, they found semantic context effect remains even when there is a
gap of 12 second (filler trials) between consecutive trials. Results from experiment 2 revealed
that filler trials consisting of items from different semantic categories also did not reduce the
semantic context effect. On experiment 3, they found semantic context effect remains even when
the distinction between homogeneous and heterogeneous experimental block is not present.
Findings from experiment 4 showed that when filler trials were alternated between homogeneous
and heterogeneous trials, semantic context effect persists. Overall the findings suggest that
semantic context effect is long-lasting.
In another study done by Abdel Rahman and Malinger (2007) on 34 German
monolingual speakers, they found semantic facilitation rather than interference on the first
presentation cycle. Naming was slower on the heterogeneous condition compared to the
homogeneous condition on the first presentation cycle but semantic context effect was present
for the rest of the cycles. The context list was presented in a blocked manner (homogeneous-
homogeneous-homogeneous-homogeneous-heterogeneous-heterogeneous-heterogeneous-
heterogeneous).

79
Facilitation effect on the first presentation cycle have been said to be strategic nature
(Damiand & Als, 2005; Oppenheim, Dell, & Schwartz, 2010; Belke, 2017). Belke (2017) in a
review article investigated the strategic facilitation effect in the first cycle by reviewing 18
blocked-cyclic naming experiments. The author found that a minor change in the experimental
design lead to the presence or absence of semantic facilitation effect on the first presentation
cycle. Seven out of 10 blocked-cyclic naming experiments where context lists were presented in
a blocked manner (homo-homo-homo-homo-hetero-hetero-hetero-hetero) have shown semantic
facilitation. However, when context lists were presented in an alternating order (homo-het-
homo-het-homo-het-homo-het), semantic facilitation effect disappears. The reason behind
semantic facilitation when context lists were presented in a blocked manner is said to be
strategically driven. Participants may prepare themselves in the blocked design due to the
manner of the design and therefore use their executive control to facilitate the processing of
semantic items in the homogeneous context.
Based on the review article from Belke (2017), we expect our monolingual speakers not
to show any semantic facilitation on the first presentation cycle as present study uses an alternate
blocked-cyclic naming design. However, if executive control helps to facilitate the processing of
the semantic items on the first presentation cycle in the homogeneous context, bilingual speakers
may show semantic facilitation even in alternating design. However, at present there is no study
which has investigated the performance difference between monolingual and bilingual speakers
on the first presentation cycle of a blocked-cyclic naming design. In this present study, we have
addressed this gap in the literature.
3.2.2 Executive Control and Blocked-Cyclic Naming
In healthy speakers, the semantic interference observed in the blocked-cyclic naming task has
been found to be related with the executive control mechanisms especially working memory and
inhibitory control (Belke, 2008; Crowther & Martin, 2014; Shao et al., 2015). Belke (2008)
tested 20 undergraduate native German monolingual speakers on a blocked-cyclic naming task

80
by manipulating the working memory load. The blocked-cyclic naming task alternated between
five semantic homogeneous and five semantic heterogeneous set with five presentation cycles.
The working memory task was a digit retention task where participants had to remember a string
of digit and had to compare it with a target string stating whether they are same or different.
Context (homogeneous, heterogeneous), cycle (five), and working memory load (with and
without) were varied within participants. Belke found significant effect of context that is items
were named slower in the homogeneous compared to the heterogeneous context; the context
effect was larger when the working memory load was present. Working memory load renders
the efficiency of the executive control mechanism and allowed the bottom up effect (context
manipulation) to emerge stronger.
Crowther and Martin (2014) tested 41 younger participants (mean age: 25.6 years, range:
18 years to 43 years) and 42 older participants (mean age: 62.9, range: 45years to 80 years) who
were English monolingual on a blocked-cyclic naming task and three executive control tasks
(word span, verbal Stroop, and recent negatives) to find out the relationship between the
performance on blocked-cycling naming task and executive control measures. The blocked
cyclic naming task had 16 homogeneous and 16 heterogeneous sets divided into two halves
(each half contained 8 sets of each context) and had four presentation cycles. Dependent
variables were context effect (reaction time difference between homogeneous and heterogeneous
contexts), trial slope (slope across trials averaging across cycles), cycle slope (slope across
cycles averaging across trials), and block slope (slope averaged across trials and task halves).
Trial slope, cycle slope, and block slopes were calculated for each context separately. On the
word span task (Baddeley & Hitch, 1974), participants were asked to repeat a list of words from
a set of 10 words after the experimenter and the testing was interrupted where the participants
failed to recall more than 50 % of the list in correct order. Word span task was used to measure
the working memory capacity of the participants. On the Stroop task (Stroop, 1935), participants
had to name the ink of the colour word by ignoring its name and the dependent variable (Stroop

81
effect) was the reaction time difference for the incongruent trials and congruent trials (where the
ink colour and the word’s name was same).
On the recent negatives task (Monsell, 1978), participants listened to a list of three words
followed by a probe word. Participants had to respond with a button press whether the probe
word was there in the list of three words they heard. There were 48 positive trials (probe word
present in the list) and 48 negative trials (probe word absent in the list). Negative trials were
further divided into recent negatives and non-recent negatives. On the recent negatives, probe
word was present in the immediately preceding list and on the non-recent negatives, probe word
was not present in the present or immediately preceding list. Dependent measure was the
difference in reaction time for recent negative and non-recent negative trials. Both the Stroop
and recent negative tasks were used as a measure of inhibitory control, however, Stroop effect
was an indicator of response-distractor inhibition whereas recent negatives task was used as an
indicator of proactive interference.
Their findings from the blocked-cyclic naming task replicated the common findings from
the literature that is significant effect of context, semantic facilitation in the first presentation
cycle and no cumulative semantic interference after cycle 2. Crowther and Martin did correlation
analysis between the executive control measures and the slopes (trial slope, cycle slope, block
slope) for each context (homogeneous and heterogeneous). They found significant correlations
amongst some the executive control measures and slopes. Better working memory performance
was related to lesser semantic interference across trials for each context and better inhibitory
control as measured by Stroop effect was related to lesser semantic interference across cycles in
the homogeneous context. Better proactive interference as measured by recent negatives was
related to greater semantic facilitation across cycles in the heterogeneous context. These results
provide further evidence of the involvement of executive control in reducing the semantic
interference during blocked cycling naming task.

82
Shao, Roelofs, Martin and Meyer (2015) tested 25 Dutch monolingual participants (mean
age: 21.2 years, range: 18 years to 27 years) on several tasks such as blocked-cyclic naming task,
Stroop task, and stop-signal task. Blocked cycling naming task had four homogeneous and four
heterogeneous sets with each set having four items from one of the four semantic categories
(animals, furniture, tools, and body parts). There were four presentation cycles and the
dependent variables were context effect (reaction time difference between homogeneous and
heterogeneous contexts) and slopes of the slowest delta segments. Delta plots were calculated by
measuring the RT difference between homogeneous and heterogeneous context as a function of
RT. At first RTs for each condition were rank-ordered and divided into quintiles or 20% bins.
Then, the size of the interference or the magnitudes of RT differences (delta) were plotted for
each quintile. Stroop task was the same as described in the previous paragraph. On the stop-
signal task, participants were shown images of squares and circles in a random order and had to
respond by pressing I key for circle and Z for square. There were two conditions: go-trials and
stop-trials. Stop-trials were indicated by a tone and participants had to withhold their response
on the stop-trials. The stop signal delay (SSD) was initially set for 250 msec following the
fixation cross and for each successful inhibition the SSD was increased for 50 msec, SSD was
decreased for 50 msec if the participants failed to inhibit their response. Dependent variable was
the stop signal RT (SSRT) calculated as the time difference between the SSD averaged across all
trials and the mean RT of the go-trials.
Shao et al found significant effect of context but no interaction of context by cycle on the
blocked-cyclic naming task. Semantic context effects were correlated with the slopes of the
slowest delta segment indicating participants with poorer inhibitory control abilities (steeper
delta slope) had larger semantic interference. However, they did not find any significant
correlation between the semantic context effects and any of the two executive control measures.
They concluded that Stroop task did not represent the selective inhibition as widely believed.

83
In summary, based on the existing literature, it appears that at least in monolingual
speakers executive control abilities especially inhibitory control and working memory play
important role in reducing the semantic interference in the blocked-cyclic naming task.
Executive control abilities particularly inhibitory control has been shown to be stronger in
bilinguals as compared to monolinguals (e.g. Bilaystok, 2009, Prior & MacWhinney, 2010;
however, for exception see Paap & Greenberg, 2013; Paap & Sawi, 2014, Paap et al., 2017).
However, at present there is no study which has compared the performance difference in a
blocked-cycling naming task between bilinguals and monolinguals and how it is related to
differences in executive control abilities between the two groups.
3.3 The Current Investigation, Research Questions and Predictions
The overarching aim of this study was to determine the differences in linguistic and executive
control contribution in word production between bilingual and monolingual participants by using
a task where semantic activation and lexical competition can be manipulated. We compared the
differences in blocked-cyclic naming performance of 25 young healthy English monolinguals
and 25 healthy Bengali-English bilinguals. The two groups were matched on other background
measures as explained in Chapter 2. We measured executive control processes using the same
tasks as used in Chapter 2, such as Stroop (measured selective inhibition), the colour-shape
switch task (measured shifting between mental sets) and the backward digital span (measured
working memory) tasks. The specific research aims, and predictions were the following:
1. To determine differences in blocked cyclic naming performance between bilingual and
monolingual participants.
We expect bilinguals to show lesser semantic context effect compared to monolinguals as
studies have shown better inhibitory control abilities leads to lesser semantic
interference. As argued on the previous section based on Belke’s (2017) review study, on
the first presentation cycle, we expect monolinguals to not show any semantic facilitation
as the blocked cyclic task in the present study is alternating in design. However, based on

84
the results from Chapter 2, we expect bilinguals to use better strategy and show semantic
facilitation on the first presentation cycle.
2. To determine which measures of executive control (inhibitory control, mental set
shifting, and working memory) mediate blocked-cyclic naming performance difference
between the two groups.
Based on previous findings (Belke, 2008; Crowther & Martin, 2014), we expect
monolinguals with better inhibitory control and working memory abilities to face lesser
semantic inference. This is the first study to relate the executive control abilities with the
parameters from the blocked-cyclic naming design for the bilingual speakers. Therefore,
we do not have any previous findings to formulate our hypothesis. However, based on
Chapter 2 results, we expect inhibitory control to correlate with the semantic context
effects for bilingual speakers.
3.4 Methods
3.4.1 Participants
Participants, background measures and executive control measures were same as described in
Chapter 2.
3.4.2 Blocked-Cyclic Picture Naming Task
3.4.2.1 Materials. The materials consisted of 25 black-and-white line-drawings,
including five pictures each from five semantic categories (animals, body parts, clothing, fruits
and vegetables, and tools). The images were selected from various sources, such as Philadelphia
Naming Test database (PNT; Roach, Schwartz, Martin, Grewal, & Brecher., 1996), International
Picture Naming Project database (IPNP; Szekely et al, 2004), Bank Of Standardized Stimuli
database (BOSS; Brodeur, Dionne-Dostie, Montreuil, & Lepage, 2010), picture database given
by Snodgrass and Vanderwart (1980), and internet resources. The average log word-form
frequency in the CELEX database was 1.38/million (SD = 0.50), and the average age of
acquisition was 4.60 years (SD = 1.18; Kuperman, Stadthagen-Gonzalez, & Brysbaert, 2012).

85
All picture names were monosyllabic except two picture names (banana had three syllables and
onion had two syllables). The objects from the semantic categories were combined to create five
homogeneous sets (see Figure 3.3) and five heterogeneous sets (see Figure 3.3).
Heterogeneous set contained one item each from each semantic category and were
semantically unrelated. The picture names in a set were also unrelated in terms of phonological
structure that is each word in a set had different initial phoneme and there were no Bengali-
English cognates.
Heterogeneous sets (Het)
Het 1
Het 2
Het 3
Het 4
Het 5
Ho
mo
gen
eou
s se
ts (
Ho
m)
Hom 1
(Animals)
Duck /hɑs/
Fish /matʃh/
Horse /ghoɽa/
Mouse /indur/
Cat /biɽal/
Hom 2
(Body
parts)
Beard /daɽi/
Palm /hat/
Lip /ʈhoʈ/
Heel /goɽali/
Ear /kan/
Hom 3
(Clothing)
Vest /gendʒi/
Hat /ʈupi/
Sock /modʒa/
Shirt /dʒama/ Glove/dɔstana/
Hom 4
(Fruits and
vegetables)
Pear/naʃpati/
Banana /kɔla/
Corn /bhutta/
Grapes /aŋur/
Onion /pɛadʒ/
Hom 5
(Tools)
Lock /tala/
Nail /pɛrek/
Broom /dʒharu/
Key /tʃabi/
Saw /kɔrat/
Figure 3.3 Blocked cyclic naming design with five items per category. Horizontal row signifies the homogeneous
set and the vertical column signifies the heterogeneous set. The IPA in the brackets represents the Bengali names of
the stimulus.
3.4.2.2 Design. Context (homogeneous and heterogeneous) and presentation cycles (five
levels) were varied within subjects. From the five sets of semantically homogeneous and five
heterogeneous items, ten lists of trials were created, each including five presentation cycles (25
trials). Each presentation cycles had five successive trials where each item was shown once. The

86
last item of a cycle was never the same as the first of the next cycle to avoid any repetition. The
task was divided into two blocks with each test block consisted of 125 trials, including either
two homogeneous and three heterogeneous sets or three homogeneous and two heterogeneous
sets. Homogeneous and heterogeneous sets were presented in an alternating order within and
between blocks (See Figure 3.2).
3.4.2.3 Procedures. Picture naming responses were elicited in English. Participants were
familiarized with the pictures along with their names at the beginning of the test to avoid any
errors due to unfamiliar items and/or use of different names for the same item. Following the
familiarization, participants were shown the picture stimuli in one at a time in a computer screen
using E-Prime software. Each trial started with a fixation cross for 250ms followed by a 100ms
blank screen followed by the target stimuli with a beep sound for 2000ms. A blank screen
appeared following the target stimuli for 500ms before beginning of a new trial. Participants
were asked to respond verbally using a bare noun (e.g. banana) and no feedback was given.
Responses were voice recorded using a digital voice recorder and transcribed.
3.4.2.4 Scoring. RTs for the correct naming responses were calculated. The onset of each
response was labelled manually to obtain greater accuracy and the reaction time was measured
from the onset of the beep to the onset of the naming response using PRAAT (Boersma &
David, 2015).
3.5 Statistical Analysis
Data from 2.6% of the experimental trials (combined monolinguals and bilinguals) were
excluded due to incorrect response or being an outlier (±2.5*SD). RTs for each participant for
each cycle and in each context were calculated. For each group, the blocking effect and slopes
were calculated twice separately, one including all the presentation cycles and another after
exclusion of cycle 1. Context effect was the difference in mean RT of heterogeneous context
from the homogeneous context. Slope was calculated by taking the blocking effect across cycles.

87
Reaction time for the correct responses were submitted to an analysis of variance
(ANOVA) including the Context (homogeneous, heterogeneous) and Presentation Cycles (five)
as within-participants factors whereas Group (bilingual, monolingual) was the between-
participants factor. Another similar ANOVA was performed excluding the cycle 1 to look at the
cumulative semantic interference. Further, to find out if there was any facilitation in cycle 1,
another ANOVA was conducted where Context was within-participants factor and Group was
between-participants factor. Tukey’s post hoc tests were applied for significant interaction
effects at p≤ 0.05. To examine the relationship between the executive control measures and
blocked-cyclic naming variables (context effect for all cycles, context effect excluding cycle 1,
slope for all cycles, and slope excluding cycle 1), Pearson’s correlations (between Stroop ratio
and blocked-cyclic naming variables) and Spearman’s correlations (between the other two
executive control variables and blocked-cyclic naming variables) were performed separately for
each group.
3.6 Results
The mean and standard deviation values for the blocked cyclic naming variables for Groups
(Monolingual and Bilinguals) and Context (Homogeneous and Heterogeneous) across all the
five cycles averaged across participants are presented in Table 3.1 (standard deviation reflects
between-subject variation). The results of the statistical tests are provided in Table 3.1 as well.
Table 3.2 provides the results of the statistics test when cycle 1 was excluded from the analysis
and Table 3.3 provides the results of the statistics test only for cycle 1. Findings from the
correlation analyses between the executive control measures and semantic blocking variables for
each group are presented in Table 3.4. Findings for Group differences are presented first;
followed by the findings on the relationship of executive control measures and semantic
blocking variables.

88
Table3.1
Means (M), Standard Deviations (SD) and the Statistical Results of the Dependent Variables (Hom for
Homogeneous and Het for Heterogeneous) for RT (msec) for all cycles
Measure
s
Bilingual
(N = 25)
Monolingual
(N = 25)
Statistical results
M SD M SD
629.8 86.5 595.9 86.5 Group F(1,48)=1.9, p=.17, 𝜂𝑝 2=
.04
Hom1 637.5 87.5 614.9 87.5 Context F(1,48)=71.6, p<.001***,
𝜂𝑝 2= .60
Cycle1 673.2 77.5 656.4 129 Cycle F(4,192)=83, p<.001***,
𝜂𝑝 2= .63
Cycle2 630.5 87.1 612.8 96.8 Group X Context F(1,48)=13.1, p=.001***,
𝜂𝑝 2= .21
Cycle3 627.9 84.6 600.4 73.7 Group X Cycle F(4,192)=.23, p=.92, 𝜂𝑝 2=
.005
Cycle4 629.5 90.2 602.1 85.1 Context X Cycle F(4,192)=21.6, p<.001***,
𝜂𝑝 2= .31
Cycle5 626.4 97.7 603 88.5 Group X Context
X Cycle
F(4,192)=.69, p=.60, 𝜂𝑝 2=
.01
Het1 622.2 87.5 576.8 87.5
Cycle1 698.6 67.3 651 122
Cycle2 604.2 70.4 563.2 88.9
Cycle3 604.1 86 558.9 91
Cycle4 598.1 90.3 557.3 90.7
Cycle5 605.9 98.7 553.6 89.2
1 – Averaged across all cycles; * p≤.05, **p≤.01, ***p≤.001

89
Table3.2
Means (M), Standard Deviations (SD) and the Statistical Results of the Dependent Variables (Hom for
Homogeneous and Het for Heterogeneous) for RT (msec) excluding cycle1.
Measur
es
Bilingual
(N = 25)
Monolingual
(N = 25)
Statistical results
M SD M SD
Total 615.8 85.1 581.4 85.1 Group F(1,48)=2,p=.16,𝜂𝑝 2=
.04
Homo1 628.6 85.2 604.6 85.2 Context F(1,48)=120.1,
p<.001***,𝜂𝑝 2= .71
Cycle2 630.5 87.1 612.8 96.8 Cycle F(3,144)=.5,p =.65,𝜂𝑝 2=
.01
Cycle3 627.9 84.6 600.4 73.7 Group X Context F(1,48)=10.1,p=.003**,
𝜂𝑝 2= .17
Cycle4 629.5 90.2 602.1 85.1 Group X Cycle F(3,144)=.54,p=.65,𝜂𝑝 2=
.01
Cycle5 626.4 97.7 603 88.5 Context X Cycle F(3,144)=.33,p=.80,𝜂𝑝 2=
.007
Het1 603.1 86.5 558.2 86.5 Group X Context X
Cycle
F(3,144)=.57,p=.64,𝜂𝑝 2=
.01
Cycle2 604.2 70.4 563.2 88.9
Cycle3 604.1 86 558.9 91
Cycle4 598.1 90.3 557.3 90.7
Cycle5 605.9 98.7 553.6 89.2
1 – Averaged across cycles 2-5; * p≤.05, **p≤.01
Table3.3
Means (M), Standard Deviations (SD) and the Statistical Results of the Dependent Variables for Cycle 1 only.
Measures Bilingual
(N = 25)
Monolingual
(N = 25)
Total (N =
50)
Statistical results
M SD M SD M SD Group Context Group X Context
Homogeneous 673.2 77.5 656.4 129 664.8 106 F(1,48) =
1.3, p=.27,
𝜂𝑝 2= .03
F(1,48) =4,
p=.05*,
𝜂𝑝 2= .08
F(1,48) = 9.5,
p=.003**, 𝜂𝑝 2=
.17
Heterogeneous 698.6 67.3 651 122 674.8 100

90
Figure 3.4 Mean RT by context (homogeneous and heterogeneous) for each group (bilingual and monolingual) for
each presentation cycle. The error bar represents standard error of the means.
Figure 3.5 Mean RT by context (homogeneous and heterogeneous) for each group (bilingual and monolingual)
averaged across all the presentation cycles (left panel) and excluding cycle 1 (right panel). The error bar represents
standard error of the means. ** p≤.01, *** p≤.001
3.6.1 Group Differences in Blocked-Cyclic Naming Performance
Figure 3.4 shows the RT in each context across the five presentation cycles. The ANOVA
revealed no Group differences that is overall bilinguals (M = 629.8, SD = 86.5) took similar time
to name pictures compared to monolinguals (M = 595.9, SD = 86.5, p = .17). There was main
500
550
600
650
700
750
800
1 2 3 4 5
RT
(m
sec)
Presentation Cycle
Semantic blocking effect across cycles
Bilingual_homogeneous Bilingual_heterogeneous
Monolingual_homogeneous Monolingual_heterogeneous
500
550
600
650
700
750
800
Bilingual Monolingual
RT
(m
sec)
Group X Context (all cycles)
Homogeneous Heterogeneous
500
550
600
650
700
750
800
Bilingual Monolingual
RT
(m
sec)
Group X Context (excluding cycle 1)
Homogeneous Heterogeneous
91
effect of Context and Cycle, items were named slower in the homogeneous context (M = 626.2,
SD = 87.7) compared to the heterogeneous context (M = 599.5, SD = 87.4). Two-way
interactions were observed for the Group-by-Context and Context-by-Cycle. Paired-wise
comparison on Group X Context revealed significant effect of Context for both groups (p = .001
for bilinguals and p < .001 for monolinguals) but monolinguals (Mean difference = 38.1 msec,
effect size = .6) showed significantly greater blocking effect compared to bilinguals (Mean
difference = 15.3 msec, effect size = .2; see Figure 3.5).
As Figure 3.4 shows there was no blocking effect on Cycle 1, the blocking effect
emerges from Cycle 2 and remained stable thereafter. Therefore, when Cycle 1 was excluded
from the analysis, main effect of Cycle and Context X Cycle interaction were no longer
observed, only main effect of Context (Homogeneous, M = 616.6, SD = 60.2; Heterogeneous, M
= 580.7, SD = 61.1) and Group X Context interactions were present. Paired-wise comparison on
Group X Context revealed significant effect of Context for both groups but monolinguals (Mean
difference = 46.3 msec, effect size = .7) showed significantly greater blocking effect compared
to bilinguals (Mean difference = 25.5 msec, effect size = .4; see Figure 3.5).
In terms of facilitation on presentation cycle 1 (see Table 3.3), there was no main effect
of Group that is overall both groups took similar time on cycle 1. However, there was a
significant effect of Context and Group X Context interaction was present. Facilitation was
observed for the homogeneous context (M = 664.8, SD = 106) as compared to the heterogeneous
context (M = 674.8, SD = 100). Paired-wise comparison revealed bilinguals showed significant
facilitation of homogeneous context over heterogeneous context (Mean difference = - 25.4 msec,
p = .001) whereas monolinguals did not show any facilitation (Mean difference = 5.4 msec, p =
.45).
3.6.2 Blocked-Cyclic Naming Performance and Executive Control Measures
Table 3.4 presents the correlation coefficients amongst the blocked-cyclic naming variables and
executive control measures for monolinguals and bilinguals. Correlation analyses did not reveal

92
any significant relationship between the executive control variables and blocked-cyclic naming
variables for both groups.
Table3.4
Correlation Coefficients amongst the Executive Control Measures and the Blocked Cyclic Naming Variables
Executive control
measures
Semantic blocking variables
Context effect
(all cycles)
Context effect
(excluding cycle1)
Slope
(all cycles)
Slope
(excluding cycle1)
Bilingual (N =25)
Stroop ratio rs1 -.08 -.08 -.05 .05
p .69 .69 .79 .80
Switch cost (RT) rs2 -.02 -.08 -.30 -.01
p .93 .68 .15 .95
Digit span backward rs2 .19 .08 .15 .05
p .35 .69 .49 .82
Monolingual (N =25)
Stroop ratio rs1 .25 .23 -.14 -.06
p .21 .26 .51 .75
Switch cost (RT) rs2 -.03 .04 -.12 -.28
p .88 .83 .58 .18
Digit span backward rs2 -.17 -.09 .27 .17
p .43 .64 .19 .42
1 - Pearson’s correlation coefficient; 2 - Spearman’s correlation coefficient * p≤.05

93
3.7 Discussion
The overarching aim of this study was to determine the contribution of linguistic and
executive control processes to word retrieval in bilingual and monolingual participants in a
linguistic paradigm where executive control demands were varied from low to high. We had
a large group of homogeneous Bengali-English bilinguals who were matched for age,
education, non-verbal IQ, and gender with the monolinguals. We measured the semantic
context effect, semantic facilitation effect on the first presentation cycle, and slope across
cycles in the blocked cycling naming task. In addition, present study investigated the
executive control abilities in the domains of inhibition, switching and working memory, and
linked the performance on the blocked cyclic naming task to the executive measures.
Overall items were named slower in the homogeneous context compared to the
heterogeneous context and the semantic context effect emerged from cycle two onwards and
did not increase thereafter. Differences between the monolinguals and bilinguals were
observed in terms of semantic context effect and semantic facilitation effect. Bilinguals
showed significantly lesser semantic context effect that is lesser semantic interference
compared to monolinguals; bilinguals showed semantic facilitation effect on the first
presentation cycle whereas monolinguals did not show any semantic facilitation.
Greater semantic interference in the homogeneous context compared to the
heterogeneous context and relatively stable semantic interference after cycle 2 corroborates
with the research by other groups (Belke et al., 2005; See Belke & Steilow, 2013 for a
review). These findings support the claim that semantic interference in the blocked cyclic
naming is non-cumulative (Belke et al., 2005; Damian & Als, 2005; Abdel Rahman &
Melinger, 2007).
This is the first study to report vocabulary-matched bilinguals performing better than
monolinguals that is lesser semantic interference for bilinguals. This is a novel finding and

94
can be linked to the studies which have suggested the role of executive control in reducing
the semantic interference in blocked-cyclic naming task (Belke, 2008; Crowther & Martin,
2014; Shao et al., 2015). Further, building on the evidence that bilinguals’ might have an
advantage in executive control that is helping their performance in blocked-cyclic naming
task comes from two findings: One, bilinguals demonstrated significantly lesser semantic
context effect than monolinguals, which can be linked to superior executive control (as can
be seen from Chapter 1 executive control findings). Previous studies have shown participants
with better working memory and inhibitory control abilities have lesser semantic context
effects (Belke, 2008; Crowther & Martin, 2014; Shao et al., 2015); Second, semantic
facilitation on the first presentation cycle shown by bilinguals may be attributed to strategic
facilitation or better executive control abilities (Belke, 2017). Belke (2017) reviewed studies
with monolingual participants on two types of blocked cyclic naming tasks, namely
alternating and blocked design. Studies with blocked design that is when homogeneous and
heterogeneous sets are presented in blocks, participants develop awareness of the semantic
category and use strategy to perform better in the homogeneous context compared to the
heterogeneous context on the first presentation cycle.
Another possible reason of semantic facilitation on first presentation cycle as
specified by Belke (2017) is the use of executive control abilities to bias the selection of
items in the homogeneous context. However, in the alternating design participants did not
show any semantic facilitation. All the studies reviewed by Belke were of monolingual
participants. In this study which has an alternating design, monolinguals did not show any
semantic facilitation. This finding is in line with the previous studies reviewed by Belke.
However, bilingual participants of the present study behaved similar to the monolinguals on
the blocked design that is even on the alternating design bilingual participants could bias the
selection of items in the homogeneous context on the first presentation cycle. This is a novel

95
finding in the literature and supports our results found in Chapter 2 where bilinguals used
better strategy (bigger cluster size, more number of switches, and smaller BCP) to outperform
the monolinguals in the difficult letter fluency condition.
Results of correlation analyses did not reveal any significant relationship between the
executive control variables and blocked-cyclic naming variables for any of the two groups.
This finding is not entirely consistent with previous studies (Crowther & Martin, 2014; Shao
et al., 2015). Crowther and Martin (2014) found better inhibitory control as measured by
Stroop effect was related to lesser semantic interference across cycles in the homogeneous
context. However, we did not correlate our executive control measures with each context of
the blocked-cyclic naming task. Future studies involving bilingual speakers might consider
correlating Stroop effect with each context of the blocked-cyclic naming task to further
understand the relationship between inhibitory control and semantic interference in blocked-
cyclic picture naming. Shao et al (2015) found better inhibitory control abilities were related
to smaller semantic interference. Shao et al found that semantic context effects were
correlated with the slopes of the slowest delta segment indicating participants with poorer
inhibitory control abilities had larger semantic interference. We did not perform the delta
analysis for this present study. Future studies should consider investigating the differences in
delta segment between bilinguals and monolinguals to ascertain whether the performance
differences between the two groups is mediated by their inhibitory control differences in
terms of delta segment.
Previous studies have shown better working memory leads to smaller semantic
interference (Belke, 2008; Crowther & Martin, 2014). However, we did not find any
correlation with the working memory and task switching measure. To measure the working
memory, digit retention task was used in Belke’s study whereas word span task was used in
Crowther and Martin’s study. We measured backward digit span test as a measure of working

96
memory where both of our groups performed almost at a ceiling level giving less spread to
the data. Therefore, one of the reasons for not getting any relationship with working memory
can be linked to the difficulty level of the task. Future studies should look into different types
of working memory measures to explore the relationship between working memory and
semantic context effect.
This is the first study to look into the relationship between mental set-shifting and
semantic context effect and it is not surprising to see any relationship between these two. Our
mental set-shifting task was non-verbal whereas other two executive control measures were
verbal in nature. It can be assumed that blocked cyclic naming task does not require one to
switch from one mental set to another; therefore, participants may not utilize their mental set-
shifting ability to perform in this task. However, future studies should investigate mental-set
shifting tasks where verbal domain is involved.
No significant correlation between the executive control measures and blocked-cyclic
naming measures for bilinguals could be attributed to the nature of bilingualism in the present
study. All the bilinguals were homogeneous and highly proficient and there was not much
spread in neither the blocked cyclic naming task nor the inhibitory control task. Another
reason of no significant correlations can be ascribed to the factor that bilinguals in this study
had better inhibitory control to begin with compared to monolinguals; hence, the simple
nature of the task may not have stretched bilinguals enough to utilize their inhibitory control
abilities. Future studies should examine how the individual differences in the executive
control abilities amongst bilinguals are linked with performance in the blocked-cyclic naming
task.
This is the first study to compare bilinguals and monolinguals on a blocked-cyclic
naming task where semantic interference is heightened. Similar to Chapter 2, we found clear
evidence of bilingual advantage even in a linguistic task where task difficulty is higher

97
(homogeneous condition). We also found bilinguals to use better strategy on the first
presentation cycle even in an alternating blocked-cyclic naming design. Overall, present
study provided evidence for bilingual advantage in a linguistic task where executive control
demands were higher. Future studies should explore the relationship between semantic
interference and executive control across different types of population (e.g. bilinguals with
different levels of proficiency, bilinguals with neurogenic disorder), broad range of executive
control measures, different blocked-cyclic naming paradigm (alternate vs. blocked) etc.

98
Chapter 4. Verbal Fluency in Bilingual Aphasia: Linguistic and Executive Control
Contribution

99
4.1 Abstract
Background. Executive control differences and its relationship with word production
abilities between healthy monolingual and bilingual speakers’ remains a hotly debated area in
the literature. However, it is still not clear whether bilinguals with aphasia (BWA) would
show a similar relationship between executive control and word production abilities as
demonstrated by healthy bilinguals. From healthy bilingual literature (Chapter 2), we found
clear differences between monolingual and bilinguals in verbal fluency task and some of
these differences were mediated by the executive control abilities. In this present study, we
aim to establish further the relationship between word production and executive control
abilities in BWA using verbal fluency task and separate executive control measures.
Aims. To determine the contribution of linguistic and executive control processes to word
retrieval in bilinguals with aphasia (BWA) and bilingual healthy adults (BHA) by using
verbal fluency task.
Methods & Procedure. Verbal fluency data for semantic (animals, fruits and vegetables)
and letter fluency (F, A, S; P, K, M) were collected from eight non-fluent Bengali-English
BWA and eight Bengali-English BHA in Bengali and English. The groups were matched for
age, sex, years of education, and other bilingualism measures, such as language acquisition
history, the language of instruction during education, self-rated language proficiency,
language usage, and language dominance. Traditional analysis (e.g., number of correct
responses) along with involved analysis techniques – such as fluency difference scores (FDS)
between semantic and letter fluency conditions, time course analysis, and qualitative analysis
(e.g. clustering, switching, within-cluster pause and between-cluster pause) were performed.
Participants also performed three executive control tests tapping into inhibitory control
processes (Stroop ratio), mental-set shifting (TMT difference) and working memory
(backward digit span).

100
Outcomes & Results. Both groups performed better in the semantic fluency compared to the
letter fluency. BWA performed poorer compared to BHA on both linguistic (number of
correct responses, initiation parameter) and executive control (FDS, slope, number of
switches, between-cluster pauses) components of the verbal fluency task. However, both
groups performed similarly on measures (response latency, cluster size, within-cluster
pauses) where executive control demands were relatively smaller. There were no cross-
linguistic differences for BWA. However, BHA group performed better in their dominant
language (Bengali) on the semantic fluency and in their non-dominant language (English) on
the letter fluency. Compared to the BHA, BWA showed significantly poorer inhibition and
mental shifting skills but a comparable working memory. Correlation analysis between the
executive control and verbal fluency measures revealed significant correlations only for the
BWA group, specifically for inhibitory control and mental set-shifting abilities. BWA with
better inhibitory control and mental set-shifting abilities produced more number of correct
responses, took less time to come up with the first response, had more linguistic resources to
begin with and switched more number of occasions.
Conclusions & Implications. In conclusion, we found BWA had difficulty in the
executive control component of the verbal fluency task in addition to their linguistic deficits
which is further supported by the findings from separate executive control and correlation
analysis. Further, present study confirms that inhibitory control and mental shifting abilities
played a key role in the verbal fluency performance differences between BWA and BHA.
From the clinical perspective, this research highlights the importance of using a full range of
verbal fluency and executive control measure to tap into the linguistic as well as executive
control abilities of BWA. This type of evidence is currently lacking in the literature.

101
4.2 Introduction
Research has shown that the impairment in executive control may influence the word
production abilities in people with aphasia (PWA) (Kuzmina & Weekes, 2017; Murray, 2012;
Villard & Kiran, 2016). However, studies investigating the relationship between the word
production and executive control processes are mostly limited to monolingual PWA and very
little is known about bilinguals with aphasia (BWA). It is important to investigate whether
BWA would show similar relationship between executive control and word production
abilities as shown by healthy bilinguals. In Chapter 2, we found clear differences between
monolingual and bilinguals in verbal fluency task and some of these differences were
mediated by the executive control abilities. In this present study, we aim to further establish
the relationship between word production and executive control abilities in BWA using
verbal fluency task and executive control measures. Studies involving BWA provide valuable
information not only to the researchers but also will help clinicians to develop appropriate
assessment and treatment protocol for BWA which is lacking at present moment.
It is well established that PWA produce fewer exemplars in a verbal fluency task than
HA and the productivity reduces as a function of time (e.g., Adams et al., 1989; Arroyo-Anlló
et al., 2011; Baldo et al., 2010; Bose et al., 2017; Helm-Estabrooks, 2002; Kiran et al., 2014;
Roberts & Le Dorze, 1994; Sarno et al., 2005). Depending on the type of aphasia, PWA
could show dissociation in semantic and letter fluency. For example, Baldo et al (2010) tested
two participants, one with Wernicke’s aphasia (based on WAB) and another with mild
Broca’s aphasia (based on clinical symptom, WAB: Conduction aphasia), on a semantic
(fruits, animals, and supermarket items) and letter fluency (F, A, S) task. Results revealed
double dissociation. Participant with Wernicke’s aphasia showed reduced cluster size on the
semantic fluency but normal cluster size on the letter fluency, whilst the participant with

102
Broca’s aphasia demonstrated unimpaired cluster size on the semantic fluency but reduced
cluster size on the letter fluency.
Most studies involving PWA used a limited number of variables in describing verbal
fluency performance (Bose et al., 2017; Faroqi-Shah et al., 2016; Kiran et al., 2014). Bose et
al. (2017) demonstrated that on a semantic fluency task, compared to monolingual healthy
adults, monolingual PWA produced significantly fewer words, smaller cluster size, longer
within- and between-cluster pauses, and number of switches were significantly correlated
with a decrease in between-cluster pauses. Bose et al. concluded that poorer performance of
PWA arose primarily from the lexical retrieval deficit but speculated that executive control
deficits may also contribute to the performance deficits. However, Bose et al.’s study did not
include full range of assessment (fluency difference score and time-course analysis were not
included), letter fluency condition and separate executive control measures to confirm the
role of executive control in lexical retrieval deficit.
Similarly, Kiran et al (2014) tested 10 Spanish-English BWA and 12 bilingual healthy
adults (BHA) on a semantic fluency (animals, food, and clothing) task. BWA produced fewer
correct responses, smaller cluster sizes, and fewer numbers of switches compared to BHA. In
terms of correct responses and cluster size, BHA group performed significantly better in their
most currently used language (English). However, there were no cross-linguistic differences
in any of the above-mentioned measures for BWA. Case series analysis found that most of
the patients performed better in their most proficient and currently used language (Spanish).
The author concluded that the differences in both the groups arise from the lexical retrieval
deficits in BWA and can be linked to their language proficiency in the two languages.
Except for Faroqi-Shah et al. (2016), no research has linked verbal fluency
performance with executive control measures in PWA. Faroqi-Shah et al tested three groups
of PWA: 18 English monolingual PWA, 10 English dominant BWA (non-dominant language

103
included Russian, French, Hungarian, and Spanish), and 10 Tamil dominant BWA (non-
dominant language was English) on a semantic fluency task (animals), and a verbal Stroop
task. Dependent variable for the semantic fluency task was number of correct responses and
for the Stroop test, Stroop difference and Conflict ratio were measured. Stroop difference was
the difference in accuracy/RT between incongruent and congruent trials. Conflict ratio was
calculated as the accuracy/RT difference between incongruent and congruent divided by the
congruent trials. On semantic fluency task, PWA produced significantly fewer correct
responses compared to healthy adults. On Stroop test, PWA performed significantly poorer as
compared to healthy adults. There were no significant correlations between any of the Stroop
measures and number of correct responses on the semantic fluency task for any group.
These studies have emphasized the greater role of linguistic processes in verbal
fluency performance difference between PWA and healthy adults; however, these studies
suffer from not including letter fluency condition which is thought to be more dependent on
the executive control abilities (Delis et al., 2001). Importantly, they do not include a more
involved method of verbal fluency (see Chapter 2, Table 2.1) which is crucial for a
comprehensive understanding of the interaction of executive control and linguistic processes
in the verbal fluency task. As seen in Chapter 2 and other healthy literature, executive control
especially better inhibitory control leads to superior performance in verbal fluency task. In
addition, better performance in letter fluency compared to semantic fluency cannot be taken
as a sole indicator of superior executive control abilities; however, such claims need to be
backed up by separate and independent executive control measures (Paap et al., 2017). As far
our knowledge, Faroqi-Shah et al.’s study is the only study which has correlated the
performance in the verbal fluency with separate executive control measures in PWA;
however, they measured only number of correct responses for the semantic fluency task and
inhibitory control for the executive control measure.

104
In the present study, we aim to fulfill these gaps in the literature by including both
semantic and letter fluency tasks and a full range of verbal fluency measures (see Chapter 2,
Table 2.1) where both the linguistic and executive control processes can be tested. In
addition, separate measures of executive control (inhibitory control, mental-set shifting, and
working memory) were administered to find out the relationship between the word
production and executive control in BWA.
Present study also aims to add to the literature of executive control abilities in aphasia
by comparing BWA with BHA on three extensively tested measures of executive control
(Miyake et al., 2000) – inhibitory control (Stroop test), task switching (Trail Making Test),
and working memory (backward digit span test).
4.3 The Current Investigation, Research Questions and Predictions
In this research, we compared the differences in verbal fluency performance between 8
Bengali-English non-fluent BWA and 8 BHA to understand the relative contribution of
linguistic and executive control processes during word production in BWA. The two groups
were matched on age, sex, years of education, and pre-stroke language abilities (acquisition
history, language of instruction during education, self-rated language proficiency, language
usage, and dominance). We collected semantic (Bengali and English: animals, fruits and
vegetables) and letter (English: F, A, S; Bengali: P, K, M) fluency data for 60 s in English
and Bengali. We provided detailed characterization of our participants on relevant variables
for bilingualism: language history and acquisition patterns, usage patterns, proficiency and
dominance. In addition, we characterized our BWA on type, severity of aphasia as well as
their post-stroke linguistic profile (naming, repetition, word-to-picture matching, and reading
aloud) in both languages.
We quantified the verbal fluency performance in terms of quantitative (number of
correct responses, fluency proportion difference score), time course (1st-RT, Sub-RT,

105
initiation, slope), and qualitative (cluster size, number of switches, within-cluster pauses,
between-cluster pauses) measures (See Table 1 for a complete description of these variables).
We analyzed the verbal fluency data both at the group level as well as at the individual level.
Individual level analyses were carried out only for the selected variables: number of correct
responses (CR), fluency proportion difference score (FDS), cluster size, and number of
switches. We tested executive control processes using the same executive control measures as
described in Chapter 2, except for the mental-set shifting. The colour-shape switch task used
for the mental-set shifting in healthy adults was too difficult for the BWA. Hence, we decide
to replace this task with Trail Making Test (Reitan, 1986) which is widely used test in PWA
(I. Sánchez-Cubillo et al., 2009). The overarching research aim of this study was to determine
the relative contribution of linguistic and executive control processes during word production
in BWA and BHA population by using verbal fluency task. Following were the specific
research aims and predictions:
1. To determine the differences (between group: BWA and BHA, between languages:
English and Bengali) in verbal fluency performance (quantitative, time-course, and
qualitative analysis).
We expect BWA group to produce fewer number of correct responses in both
semantic and letter fluency as compared to BHA. A larger FDS would be obtained for
BWA compared to BHA if they demonstrate poorer executive control abilities in
addition to their linguistic deficits. Similarly, if BWA group have executive control
difficulties, then in the time course analysis, we expect BWA have shorter Sub-RT
and steeper slope compared to BHA. Similar to Bose et al.’s (2017) study, we expect
BWA to have smaller cluster size, produced fewer number of switches and having
longer within- and between-cluster pause compared to BHA, indicative of poorer
lexical and executive control abilities. At individual level, we expect BWA to perform

106
better in semantic fluency condition as compared to letter fluency condition,
especially for the cluster size (Baldo et al., 2010). On cross-linguistic comparison,
similar to Kiran et al.’s (2014) study, at group level, we expect BHA to perform
significantly better in their most currently used language and no cross-linguistic
differences for the BWA. At the individual level, we expect BWA to perform better in
their most currently used and proficient language especially on number of correct
responses and cluster size.
2. To determine whether the differential verbal fluency performance was influenced by
the differences in the executive control abilities for BWA and BHA.
We expect executive control measures to correlate significantly with the verbal
fluency measures for both BWA and BHA. However, we expect BWA to have
stronger correlation between executive control and verbal fluency measures compared
to BHA. This prediction is an extrapolation from the observation that low proficient
bilinguals engage with their executive control mechanism while performing task in
their less proficient language (Hernandez & Meschyan, 2006). Following on the
similar argument, BWA would need to recruit their executive control processes to
compensate for their linguistic difficulties while performing in the verbal fluency task.
However, high proficient BHA may or may not need their executive control processes
to perform in this task.
4.4 Method
4.4.1 Participants
Eight Bengali-English BWA (M = 47.75 years, SD = 11.9) and eight Bengali-English BHA
(M = 43.13 years, SD =15.30) participated in this study. BWA were recruited via contacts
with certified speech-language therapists from Kolkata, India and control speakers were
recruited via researcher’s personal contacts.

107
All BWA speakers sustained a single left hemisphere CVA resulting in aphasia at
least six months prior to participation. Medical and neurological reports were reviewed to
establish medical history. All the participants were right handed (pre-stroke for BWA) and
had at least twelve years of education (BWA: M = 16.63 years, SD = 2.33; BHA: M = 16.88
years, SD = 1.88). There was no history of other neurological conditions, alcohol or drug
abuse, neuropsychiatric conditions or dementia. All BWA were matched with BHA on age,
sex, and years of education (all ps >.05, see Table 4.1). The demographic and neurological
details of BWA are summarized in Table 4.1. The demographic details of BHA are
summarized in Table 4.2. Participation in this study was voluntary and participants provided
written consent prior to participation (See Appendix 4.1 for an example of information sheet
and consent form). All the procedures in this study were approved by the University of
Reading Research Ethics Committee (Ethical approval code: 2014/060/AB).
4.4.2 Language Background and Executive Control Measures
In this section, we will discuss the background measures and the findings of those measures.
First, we will describe the subjective measures used for characterising our bilingual
participants followed by the test batteries to characterise the severity and type of aphasia in
both languages, and the extent of language impairment at the single word level in both
languages. At the end, we will discuss the executive control measures and the findings.
4.4.2.1 Bilingualism measures. All the speakers completed the same subjective
language background questionnaires (language acquisition history, language of instruction,
self-rated language proficiency, language usage, and language dominance) as described in
Chapter 2. BWA speakers completed twice to separately report pre-stroke and post-stroke
language abilities, with the support from caregiver or family members, as needed. BWA were
matched (pre-stroke) with BHA on language acquisition history, language of instruction
during education, self-rated language proficiency, language usage and language dominance

108
(all ps >.05, see Table 4.3). All participants were sequential bilinguals, that is, they had
acquired Bengali before English (age of onset for English is 5 years or more). English was
the language of instruction during higher education for all the participants.
On a scale of zero to seven (0 = no proficiency, 7 = native like proficiency), all the
participants completed self-rated proficiency questionnaires (BWA reported post-stroke
proficiency scores as well). Proficiency scores were averaged across speaking,
comprehension, reading and writing domains. All speakers reported proficiency level of 5 or
more in Bengali (except BWA3, pre= 2.8, post= 2.5) and in English (except BWA2 pre= 3.8,
post= 2.2; BWA8 pre= 4.2, post= 2.7). All the participants reported Bengali as their most
used language except BWA3 and BWA6 who used English comparatively more than Bengali
both pre-and -post stroke. This could be attributed to their pre-morbid professional
occupations. BWA3 was marketing and management personnel in a multinational company,
whereas BWA6 was a software engineer. Reflecting the proficiency score, as a group BWA
participants were Bengali dominant (M Bengali dominance M pre= 25.4, SD = 5.4; M post= 24.8, SD
= 7.2; M English dominance M pre= 16.6, SD = 4.9; M post= 14.8, SD = 5.9). The exceptions were
BWA3 and BWA7 who were English dominants, while BWA6 showed equal dominance in
both languages. Language background scores obtained from the language background
questionnaire of BWA and BHA groups are summarized in Table 4.3 and Table 4.4
respectively.

109
Table4.1
Demographic Profiles of each BWA, Mean and Standard Deviations of BWA and BHA Groups and the Statistical Results Comparing the Groups.
Variables BWA1 BWA2 BWA3 BWA4 BWA5 BWA6 BWA7 BWA8 BWA (N = 8) BHA (N = 8) Statistical
results M SD M SD
Age
50 58 50 54 35 35 34 66 47.4 12.9 44.9 16.5 t(14)=.67,
p=.51
Sex
Male Female Male Male Female Male Male Male Female
(2)
Male (6) Female
(2)
Male
(6)
χ2 (1) = 0, p= 1
Years of
education
18 12 17 18 20 16 16 16 16.6 2.5 16.8 1.8 t(14)=-.23,
p=.82
Highest
degree
Postgradu
ate
High
school
Graduate Graduate Postgraduate Graduate Graduate Graduate
Time post
onset
(months)
17 58 19 12 27 40 22 27 27.8 14.8 - -
Pre-stroke
occupatio
n
Accounta
nt
Homema
ker
Marketing General
manager
PhD student
Software
Engineer
Marketing Clerk
Aphasia type2
Bengali Broca’s Broca’s CNT3 Transcortical
motor
Broca’s CNT3 Broca’s Broca’s
English Broca’s CNT3 Broca’s Transcortical
motor
Broca’s Broca’s Broca’s CNT3
Severity3
Bengali
Moderate Moderate CNT3 Mild Mild CNT3 Mild Moderat
e
English
Moderate CNT3 Moderate Mild Moderate Severe Mild CNT3
Note: 1- Middle Cerebral Artery, 2- Type and severity of aphasia were classified based on WAB-R (Kertesz, 2006) in English and the adapted version in Bengali (Keshree, Kumar, Basu, Chakrabarty, & Kishore,
2013); 3- Could Not be Tested due to unavailability.

110
Table 4.2
Demographic Profiles of each BHA.
Variables BHA1 BHA2 BHA3 BHA4 BHA5 BHA6 BHA7 BHA8
Age
29 66 52 27 31 58 51 31
Sex
Female Male Female Male Male Male Male Male
Years of
education
19 16 15 15 19 15 17 19
Highest degree Postgraduate Graduate Graduate Graduate Postgraduate Graduate Postgraduate Postgraduate
Occupation PhD student Businessman Homemaker Marketing
Software Engineer
School Teacher
School Teacher Software
Engineer
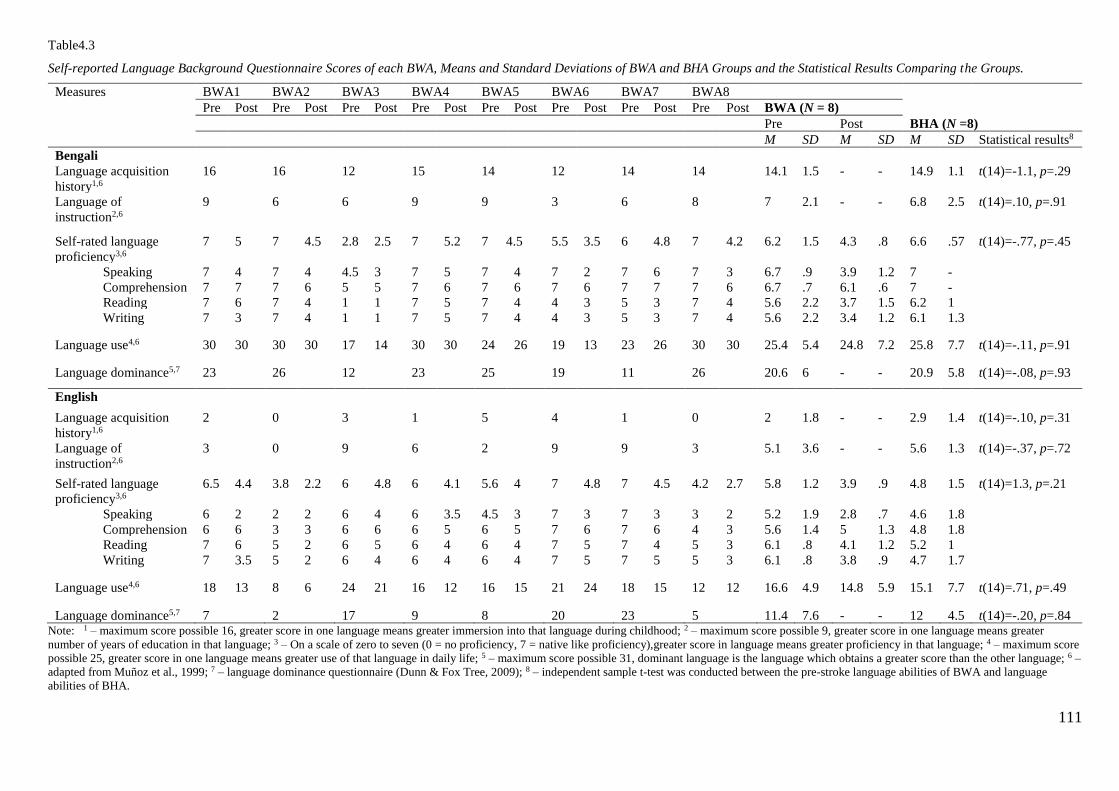
111
Table4.3
Self-reported Language Background Questionnaire Scores of each BWA, Means and Standard Deviations of BWA and BHA Groups and the Statistical Results Comparing the Groups.
Measures BWA1 BWA2 BWA3 BWA4 BWA5 BWA6 BWA7 BWA8
Pre Post Pre Post Pre Post Pre Post Pre Post Pre Post Pre Post Pre Post BWA (N = 8)
Pre Post BHA (N =8)
M SD M SD M SD Statistical results8
Bengali
Language acquisition
history1,6
16 16 12 15 14 12 14 14 14.1 1.5 - - 14.9 1.1 t(14)=-1.1, p=.29
Language of
instruction2,6
9 6 6 9 9 3 6 8 7 2.1 - - 6.8 2.5 t(14)=.10, p=.91
Self-rated language
proficiency3,6
7 5 7 4.5 2.8 2.5 7 5.2 7 4.5 5.5 3.5 6 4.8 7 4.2 6.2 1.5 4.3 .8 6.6 .57 t(14)=-.77, p=.45
Speaking 7 4 7 4 4.5 3 7 5 7 4 7 2 7 6 7 3 6.7 .9 3.9 1.2 7 -
Comprehension 7 7 7 6 5 5 7 6 7 6 7 6 7 7 7 6 6.7 .7 6.1 .6 7 -
Reading 7 6 7 4 1 1 7 5 7 4 4 3 5 3 7 4 5.6 2.2 3.7 1.5 6.2 1
Writing 7 3 7 4 1 1 7 5 7 4 4 3 5 3 7 4 5.6 2.2 3.4 1.2 6.1 1.3
Language use4,6 30 30 30 30 17 14 30 30 24 26 19 13 23 26 30 30 25.4 5.4 24.8 7.2 25.8 7.7 t(14)=-.11, p=.91
Language dominance5,7 23 26 12 23 25 19 11 26 20.6 6 - - 20.9 5.8 t(14)=-.08, p=.93
English
Language acquisition
history1,6
2 0 3 1 5
4 1 0 2 1.8 - - 2.9 1.4 t(14)=-.10, p=.31
Language of
instruction2,6
3 0 9 6 2 9 9 3 5.1 3.6 - - 5.6 1.3 t(14)=-.37, p=.72
Self-rated language
proficiency3,6
6.5 4.4 3.8 2.2 6 4.8 6 4.1 5.6 4 7 4.8 7 4.5 4.2 2.7 5.8 1.2 3.9 .9 4.8 1.5 t(14)=1.3, p=.21
Speaking 6 2 2 2 6 4 6 3.5 4.5 3 7 3 7 3 3 2 5.2 1.9 2.8 .7 4.6 1.8
Comprehension 6 6 3 3 6 6 6 5 6 5 7 6 7 6 4 3 5.6 1.4 5 1.3 4.8 1.8
Reading 7 6 5 2 6 5 6 4 6 4 7 5 7 4 5 3 6.1 .8 4.1 1.2 5.2 1
Writing 7 3.5 5 2 6 4 6 4 6 4 7 5 7 5 5 3 6.1 .8 3.8 .9 4.7 1.7
Language use4,6 18 13 8 6 24 21 16 12 16 15 21 24 18 15 12 12 16.6 4.9 14.8 5.9 15.1 7.7 t(14)=.71, p=.49
Language dominance5,7 7 2 17 9 8 20 23 5 11.4 7.6 - - 12 4.5 t(14)=-.20, p=.84 Note: 1 – maximum score possible 16, greater score in one language means greater immersion into that language during childhood; 2 – maximum score possible 9, greater score in one language means greater
number of years of education in that language; 3 – On a scale of zero to seven (0 = no proficiency, 7 = native like proficiency),greater score in language means greater proficiency in that language; 4 – maximum score
possible 25, greater score in one language means greater use of that language in daily life; 5 – maximum score possible 31, dominant language is the language which obtains a greater score than the other language; 6 –
adapted from Muñoz et al., 1999; 7 – language dominance questionnaire (Dunn & Fox Tree, 2009); 8 – independent sample t-test was conducted between the pre-stroke language abilities of BWA and language
abilities of BHA.

112
Table4.4
Self-reported Language Background Questionnaire Scores of each BHA, Means and Standard Deviations.
Measures BHA1 BHA2 BHA3 BHA4 BHA5 BHA6 BHA7 BHA8 M SD
Bengali
Language acquisition
history1,6
14 17 15 14 14 15 14 16 14.9 1.1
Language of
instruction2,6
3 8 7 3 9 8 9 8 6.8 2.5
Self-rated language
proficiency3,6
5.7 7 7 5.7 6.7 7 6.5 7 6.6 .57
Speaking 7 7 7 7 7 7 7 7 7 -
Comprehension 7 7 7 7 7 7 7 7 7 -
Reading 5 7 7 5 7 7 5 7 6.2 1
Writing 4 7 7 4 6 7 7 7 6.1 1.3
Language use4,6 8 30 30 22 28 30 30 28 25.8 7.7
Language dominance5,7 11 24 24 12 24 24 24 24 20.9 5.8
English
Language acquisition
history1,6
6 2 2 4 3 2 2 2 2.9 1.4
Language of
instruction2,6
7 5 6 7 6 3 6 5 5.6 1.3
Self-rated language
proficiency3,6
7 3.5 3.2 6.2 5.7 3.5 3.7 6 4.8 1.5
Speaking 7 3 3 6 6 3 3 6 4.6 1.8
Comprehension 7 4 3 7 6 3 3 6 4.8 1.8
Reading 7 4 4 6 5 5 5 6 5.2 1
Writing 7 3 3 6 6 3 4 6 4.7 1.7
Language use4,6 16 18 16 18 8 16 13 16 15.1 7.7
Language dominance5,7 18 8 8 20 11 10 10 11 12 4.5 Note: 1 – maximum score possible 16, greater score in one language means greater immersion into that language during childhood; 2 – maximum score possible 9, greater score in one language means greater
number of years of education in that language; 3 – On a scale of zero to seven (0 = no proficiency, 7 = native like proficiency),greater score in language means greater proficiency in that language; 4 – maximum score
possible 25, greater score in one language means greater use of that language in daily life; 5 – maximum score possible 31, dominant language is the language which obtains a greater score than the other language; 6 –
adapted from Muñoz et al., 1999; 7 – language dominance questionnaire (Dunn & Fox Tree, 2009);

113
4.4.2.2 Western Aphasia Battery-Revised (WAB-R). We administered WAB-R in
English (Kertesz, 2006) and its adapted version in Bengali (Keshree, Kumar, Basu, Chakrabarty,
& Kishore, 2013) to assess the type and severity of aphasia in both languages. WAB-R assesses
four language areas: spoken language, auditory comprehension, repetition and naming.
Participant BWA3 and BWA6 was not available for the Bengali version of the test and BWA2
and BWA8 was not available for the English version of the test. Severity of language deficits
(Aphasia Quotient; AQ) and aphasia type were determined based on the performance on these
subtests. Details of participants’ performance on the individual subtests are provided in Table 4.5
and Table 4.6 provides the picnic picture description. All BWA showed good auditory
comprehension but demonstrated variable level of difficulty in spoken language production,
naming, and repetition (see Table 4.5). Based on the test results, BWA presented with non-fluent
aphasia with mild to moderate severity in both languages, except BWA6 who had severe aphasia
in English and was not available for testing in Bengali. Therefore, BWA group were relatively
homogenous in terms type of aphasia (all non-fluent) in both languages.

114
Table4.5
Western Aphasia Battery Test Scores in Bengali (Keshri et al., 2013) and English (Kertesz, 2006) of each BWA.
Participant
s
Spontaneous
Speech (SS)3
Auditory Verbal Comprehension
(AVC)
Repetition
Naming
Ap
has
ia Q
uo
tien
t (A
Q)1
7
Aphasia
severity18
Aphasia
Type
Info
rmat
ion
Co
nte
nt1
Flu
ency
2
Sco
re3
Yes
/No
qu
esti
on
s4
Au
dit
ory
word
Rec
og
nit
ion
5
Seq
uen
tial
com
man
ds6
To
tal7
Sco
re8
Rep
etit
ion
9
Sco
re10
Ob
ject
nam
ing
11
Flu
ency
12
Sen
ten
ce
com
ple
tio
n13
Res
po
nsi
ve
spee
ch14
To
tal1
5
Sco
re16
Bengali
BWA1 7 4 11 60 60 80 200 10 64 6.4 42 10 9 8 69 6.9 68.6 Moderate Broca’s
BWA2 8 4 12 60 60 80 200 10 65 6.5 54 7 6 8 75 7.5 75 Moderate Broca’s
BWA3 CNT19
BWA4 8 5 13 60 60 80 200 10 100 10 57 12 9 10 88 8.8 83.6 Mild Transcortical Motor
BWA5 8 4 12 60 60 80 200 10 78 7.8 57 10 9 10 86 8.6 76.8 Mild Broca’s
BWA6 CNT19
BWA7 8 4 12 60 60 80 200 10 78 7.8 57 12 9 10 88 8.8 77.2 Mild Broca’s
BWA8 7 4 11 60 60 80 200 10 65 6.5 45 8 8 8 69 6.9 68.6 Moderate Broca’s
English
BWA1 7 4 11 54 60 80 194 9.7 49 4.9 38 16 8 4 66 6.6 64.4 Moderate Broca’s
BWA2 CNT19
BWA3 9 4 13 60 60 80 200 10 77 7.7 42 11 8 4 65 6.5 74.4 Moderate Broca’s
BWA4 8 4 12 60 60 80 200 10 90 9 54 16 9 10 89 8.9 79.8 Mild Transcortical Motor
BWA5 8 4 12 60 60 80 200 10 76 7.6 48 11 8 8 75 7.5 74.2 Moderate Broca’s
BWA6 4 2 6 54 56 66 176 8.8 30 3 45 5 6 6 62 6.2 48 Severe Broca’s
BWA7 8 4 12 60 60 80 200 10 76 7.6 57 13 8 8 86 8.6 76.4 Mild Broca’s
BWA8 CNT19
Note: 1- maximum possible score 10; 2- maximum possible score 10; 3-sum of information content and fluency score; 4- maximum possible score 60; 5- maximum possible score 60, 6 – maximum
possible score 80; 7- sum of yes/no question, auditory word recognition and sequential commands; 8- total score divided by 20; 9- maximum possible score 100; 10- repetition score divided by 10; 11-
maximum possible score 60; 12 – maximum possible score 20; 13- maximum possible score 10; 14- maximum possible score 10; 15- sum of all the naming subtests scores; 16- total divided by 10; 17- AQ
was calculated by using the following formula {AQ= (SS score+ AVC score+ Repetition score+ Naming score)*2}; 18- Severity rating scale= Mild (76 and above), Moderate (51-75), Severe (26-50),
Very severe (0-25); 19- Could Not be Tested due to unavailability.
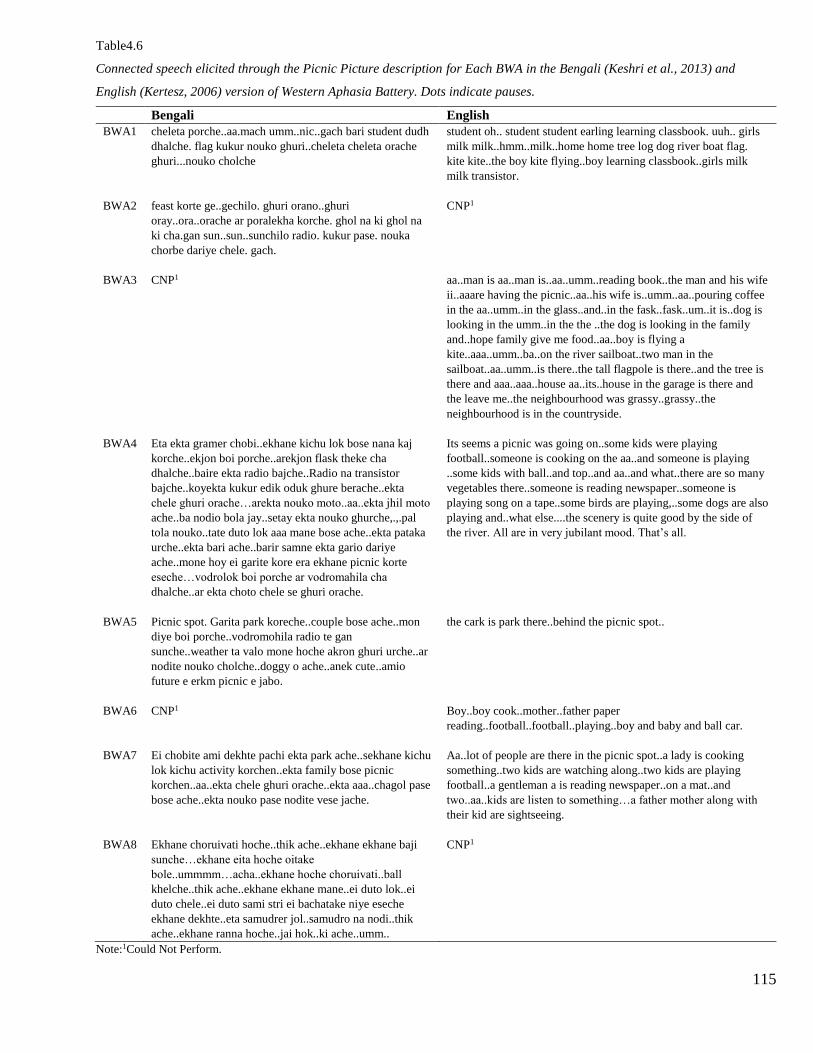
115
Table4.6
Connected speech elicited through the Picnic Picture description for Each BWA in the Bengali (Keshri et al., 2013) and
English (Kertesz, 2006) version of Western Aphasia Battery. Dots indicate pauses.
Bengali English
BWA1 cheleta porche..aa.mach umm..nic..gach bari student dudh
dhalche. flag kukur nouko ghuri..cheleta cheleta orache
ghuri...nouko cholche
student oh.. student student earling learning classbook. uuh.. girls
milk milk..hmm..milk..home home tree log dog river boat flag.
kite kite..the boy kite flying..boy learning classbook..girls milk
milk transistor.
BWA2 feast korte ge..gechilo. ghuri orano..ghuri
oray..ora..orache ar poralekha korche. ghol na ki ghol na
ki cha.gan sun..sun..sunchilo radio. kukur pase. nouka
chorbe dariye chele. gach.
CNP1
BWA3 CNP1 aa..man is aa..man is..aa..umm..reading book..the man and his wife
ii..aaare having the picnic..aa..his wife is..umm..aa..pouring coffee
in the aa..umm..in the glass..and..in the fask..fask..um..it is..dog is
looking in the umm..in the the ..the dog is looking in the family
and..hope family give me food..aa..boy is flying a
kite..aaa..umm..ba..on the river sailboat..two man in the
sailboat..aa..umm..is there..the tall flagpole is there..and the tree is
there and aaa..aaa..house aa..its..house in the garage is there and
the leave me..the neighbourhood was grassy..grassy..the
neighbourhood is in the countryside.
BWA4 Eta ekta gramer chobi..ekhane kichu lok bose nana kaj
korche..ekjon boi porche..arekjon flask theke cha
dhalche..baire ekta radio bajche..Radio na transistor
bajche..koyekta kukur edik oduk ghure berache..ekta
chele ghuri orache…arekta nouko moto..aa..ekta jhil moto
ache..ba nodio bola jay..setay ekta nouko ghurche,.,.pal
tola nouko..tate duto lok aaa mane bose ache..ekta pataka
urche..ekta bari ache..barir samne ekta gario dariye
ache..mone hoy ei garite kore era ekhane picnic korte
eseche…vodrolok boi porche ar vodromahila cha
dhalche..ar ekta choto chele se ghuri orache.
Its seems a picnic was going on..some kids were playing
football..someone is cooking on the aa..and someone is playing
..some kids with ball..and top..and aa..and what..there are so many
vegetables there..someone is reading newspaper..someone is
playing song on a tape..some birds are playing,..some dogs are also
playing and..what else....the scenery is quite good by the side of
the river. All are in very jubilant mood. That’s all.
BWA5
Picnic spot. Garita park koreche..couple bose ache..mon
diye boi porche..vodromohila radio te gan
sunche..weather ta valo mone hoche akron ghuri urche..ar
nodite nouko cholche..doggy o ache..anek cute..amio
future e erkm picnic e jabo.
the cark is park there..behind the picnic spot..
BWA6
CNP1 Boy..boy cook..mother..father paper
reading..football..football..playing..boy and baby and ball car.
BWA7 Ei chobite ami dekhte pachi ekta park ache..sekhane kichu
lok kichu activity korchen..ekta family bose picnic
korchen..aa..ekta chele ghuri orache..ekta aaa..chagol pase
bose ache..ekta nouko pase nodite vese jache.
Aa..lot of people are there in the picnic spot..a lady is cooking
something..two kids are watching along..two kids are playing
football..a gentleman a is reading newspaper..on a mat..and
two..aa..kids are listen to something…a father mother along with
their kid are sightseeing.
BWA8 Ekhane choruivati hoche..thik ache..ekhane ekhane baji
sunche…ekhane eita hoche oitake
bole..ummmm…acha..ekhane hoche choruivati..ball
khelche..thik ache..ekhane ekhane mane..ei duto lok..ei
duto chele..ei duto sami stri ei bachatake niye eseche
ekhane dekhte..eta samudrer jol..samudro na nodi..thik
ache..ekhane ranna hoche..jai hok..ki ache..umm..
CNP1
Note:1Could Not Perform.

116
4.4.2.3 Croft’s test battery. As there is no comprehensive psycholinguistic test like
Psycholinguistic Assessments of Language Processing in Aphasia (PALPA; Kay, Lesser &
Coltheart, 1992) which is culturally and linguistically appropriate in Bengali, we chose to
administer the test battery developed by Croft, Marshall, Pring, and Hardwick (2015). Croft
developed a test battery to measure language production and comprehension of spoken nouns at
a single word level in each language. The test battery included picture naming, spoken word-to-
picture matching, word repetition, and reading aloud tasks. Each task included 30 items; same
items were used for the naming and repetition task which allows comparing performance across
items. Spoken word-to-picture matching and reading aloud had same items for similar reason.
Croft had tested 6 Bengali-English BWA and 15 BHA (Croft et al., 2015). We chose to use the
Croft’s test for the following reason:
1. Although, the test was developed involving Sylheti (dialect of Bengali) speakers from
Bangladesh living in UK, words that were not cognates in Sylheti and Bengali were
excluded during the development. Further, to validate the cultural and linguistic
relevance for the present study, we administered the Croft’s test on our 8 BHA. Our BHA
performed at the ceiling in both languages. Therefore, the test can be considered
culturally and linguistically appropriate for the Bengali speakers living in India.
2. Croft’s test uses same line drawings to elicit the target items across the languages which
allows for testing cross-linguistic differences.
3. Word pairs across the two languages were matched for mean naming response latencies
and there were no cognates across languages, which were important consideration (see
Chapter 5). Stimuli were also matched for frequency within each task (14 high frequency
words and 16 low frequency words).

117
Table 4.8 represents the results for all the participants in Bengali and English. Participants were
tested on both English and Bengali on different day and the order of stimuli set was randomized
between languages. Instructions were given in written format as well as verbally in the
corresponding language.
4.4.2.3.1 Spoken word-to-picture matching. In this task, participants were given an A4
page where along with the target picture, four distractors were present. Stimuli were black and
white line drawings. This task mirrored the spoken word-to-picture matching subtest of PALPA
(Kay et al., 1992) where the distractors were of following four types: close semantic distractor
(e.g. target ‘leaf’, distractor ‘flower’), distant semantic distractor (e.g. target ‘leaf’, distractor
‘nut’), visually related distractor (e.g. target ‘leaf’, distractor ‘feather’) and unrelated distractor
(e.g. target ‘leaf’, distractor ‘bird’). Participants were asked to listen to the spoken noun said by
the experimenter and point to the target picture. Participant’s responses were recorded. All the
BWA speakers performed at the ceiling level, showing no difficulty in single word
comprehension suggestive of intact semantic system at least at a single word level. Results of
this task are also consistent with the auditory verbal comprehension subtest scores of WAB.
4.4.2.3.2 Picture naming. Items were English nouns and their translation equivalents in
Bengali (neck, /gɔlɑ/; rabbit, /khɔrgos/; road, /rɑstɑ/; teeth, /dɑnt/; tiger, /bɑgh/; swan, /hɑs/;
umbrella, /tʃhɑta/; onion, /peyaj/; foot, /pa/; monkey, /bɑdɔr/; watch, /ghori/; pineapple, /ɑnɑrɔs/;
owl, /pætʃɑ/; hair, /tʃul/; butterfly, /prɔdʒɑpɔti/; grapes, /ɑngur/; house, /bɑri/; goat, /tshɑgol/;
spoon, /tʃɑmɔtʃ/; camel, /uːt/; prawn, /tʃingri/; lock, /tala/; ship, /dʒahadʒ/; dog, /kukur/; letter,
/tʃithi/; frog, /bæng/; key, /tʃabi/; sun, /surdʒo/; nose, /nak/; boy, /tshele/). They were depicted by
black and white line drawings and were presented one at a time on a 17” laptop screen until the
participants responded or for a maximum time of 4 seconds. Their responses were recorded using

118
a digital voice recorder. Phonetic and orthographic transcriptions of all the responses were
performed. Other than occasional encouragements, no corrective feedbacks were provided during
the testing.
Responses were coded as the first complete non-fragmented response within 4-sec after
the stimuli presentation (Roach et al., 1996). The classification and coding used for correct
responses and errors are presented in Table 4.9. Naming responses and error types for all BWA
are presented in Table 4.10. To compare the BWA performance in relation to the BHA, separate
independent sample t-test was conducted for Bengali and English. As expected, BWA (Bengali,
M = 23.1, SD = 7.2; English, M = 21.1, SD = 8.9) showed significantly poorer naming abilities
compared to BHA (Bengali, M = 30, SD = 0; English, M = 30, SD = 0) on both languages.
Cross linguistic differences in the naming scores between Bengali and English were
contrasted for each BWA using chi-square test. Only BWA2 and BWA6 performed significantly
better in their most used language. That is, BWA2 better naming in Bengali, whilst BWA6 better
naming in English. In terms of errors, both target language errors as well as cross-linguistic
errors were observed for BWA. Semantic errors and no responses were the most common type of
target language error, which are a characteristic feature of Broca’s and non-fluent aphasia.
Semantic errors in naming can either be due to semantic deficits (Howard & Orchard-Lisle,
1984) or post-semantic deficits (Caramazza & Hills, 1990). However, all BWA participants have
showed good auditory verbal comprehension in the WAB test and intact word-to-picture
matching on the Croft’s word-to-picture matching task. Therefore, we can rule out the semantic
deficit hypothesis. Semantic error produced by BWA may be attributed to the deficit in
activating the representation within the phonological output lexicon or due to difficulty in
transmission from semantic to phonological output lexicon.

119
In terms of cross-linguistic errors, out of a total of 68 cross linguistic errors, 61 (90%) of
them were translational equivalents. Except BWA4, BWA5 and BWA7, all the other participants
made cross-linguistic errors by switching into their most used language. BWA1, BWA2, and
BWA6 named items in Bengali (most used) while performing the task in English, whereas
BWA3 and BWA8 did the opposite. Overall, the naming test results corroborated with the self-
rated language history questionnaire that is BWA made fewer cross-linguistic errors in their most
used language.
4.4.2.3.3 Repetition. Participants were asked to repeat the word as said by the
experimenter. Responses were recorded using a voice recorder. Responses were marked as
correct and incorrect. Incorrect responses were classified according to the error type as with
naming responses. To compare the BWA performance in relation to the BHA, similar to naming
task, separate independent sample t-test was conducted for Bengali and English. As expected,
BWA showed significantly poorer repetition abilities compared to BHA on Bengali (BWA: M =
25.9, SD = 4.3; BHA: M = 30, SD = 0, p = .03) and a marginal significant effect on English
(BWA: M = 27.1, SD = 4.3; BHA: M = 30, SD = 0, p = .06). Repetition scores in Bengali and
English were contrasted for each BWA using chi-square test to assess cross-linguistic difference.
All participants performed similarly in both languages except BWA2 who could not repeat the
words in English. Overall, BWA showed relatively preserved and comparable repetition skills
(Mean accuracy Bengali: 86.3 %, SD accuracy Bengali: 14.1%; Mean accuracy English: 90.5%, SD
accuracy English: 10.8%) in both languages.
As the stimuli were same for the naming and repetition tasks, we also compared the test
scores between these two tasks within language as well as averaged across language for BWA to
find out between task effects. BWA performed significantly better in single word repetition as

120
compared to naming when the test scores were averaged across languages (See Table 4.7)
suggestive of difficulty in the phonological output lexicon pathway. In terms of errors (Table
4.11), only target language errors were observed. Formal errors were the most common type of
error in this task for BWA. There were no cross-linguistic errors in repetition which may indicate
that lexical interference from the non-target language does not affect at the post-semantic level
once the meaning of the word is successfully processed at the post-lexical level.
Table4.7
Test Scores (%) in Naming and Repetition subtests of Croft’s Test Battery in Each Language and Averaged across
Languages for Each BWA and the Statistical Results of Between Task Effects.
Participants
Naming in
Bengali
Repetition
in Bengali
Naming in
English
Repetition
in English
Naming
average
Repetition
average
BWA1 93.3 70 73.3 73.3 83.3 71.65
BWA2 76.7 90 6.7 CNP1 41.7 90
BWA3 50 73.3 86.7 86.7 68.35 80
BWA4 96.7 100 96.7 93.3 96.7 96.65
BWA5 96.7 90 80 100 88.35 95
BWA6 33.3 66.7 76.7 80 55 73.35
BWA7 96.7 100 96.7 100 96.7 100
BWA8 73.3 100 50 100 61.65 100
Mean 77.1 86.3 70.9 90.5 74.0 88.3
SD 24.1 14.2 29.9 10.8 20.4 11.7
Statistical
results2
t(7) = -1.4, p = .06
t(6) = -1.4, p = .11
t(7) = -2.1, p = .04*
1 – Could Not Perform, 2 – Paired sample t-test (one tailed), * p≤.05

121
Table4.8
Accuracy (Raw score and %) in Language Background Test Scores of BWA using Croft’s Test Battery.
BWA1 BWA2 BWA3 BWA4 BWA5 BWA6 BWA7 BWA8 BWA (N = 8) BHA (N=8)
M SD M SD Statistical
Analysis4 Croft’s test battery1
Naming2
Bengali 28(93.3%) 23(76.7%) 15(50%) 29(96.7%) 29(96.7%) 10(33.3%) 29(96.7%) 22(73.3%) 23.1(77%) 7.2(24.1%) 30(100%) - t(7)=2.7,
p=.03*
English 22(73.3%) 2(6.7%) 26(86.7%) 29(96.7%) 24(80%) 23(76.7%) 29(96.7%) 15(50%) 21.1(70%) 8.9(29.8%) 30(100%) - t(7)=2.7,
p=.03*
Difference3 p=.39 p<.001*** p=.08 p=1 p=.49 p=02* p=1 p=.24 p=.63 p=1
Repetition2
Bengali 21(70%) 27(90%) 22(73.3%) 30(100%) 27(90%) 20(66.7%) 30(100%) 30(100%) 25.9(86.3%) 4.3(14.1%) 30(100%) - t(7)=2.7,
p=.03*
English 22(73.3%) CNP 26(86.7%) 28(93.3%) 30(100%) 24(80%) 30(100%) 30(100%) 27.1(90.5%) 3.2(10.8%) 30(100%) - t(6)=2.3,
p=.06
Difference3 p=.88 - p=.56 p=.79 p=.69 p=.54 p=1 p=1 p=.15 p=1
Word to picture matching2
Bengali 30(100%) 30 (100%) 30(100%) 30(100%) 30(100%) 30(100%) 30(100%) 30(100%) 30(100%) - 30(100%) - p=1
English 30(100%) 30(100%) 30(100%) 30(100%) 30(100%) 30(100%) 30(100%) 30(100%) 30(100%) - 30(100%) - p=1
Difference3 p=1 p=1 p=1 p=1 p=1 p=1 p=1 p=1 p=1 p=1
Reading Aloud2
Bengali 23(76.7%) 16(53.3%) CNP 29(96.7%) 28(93.3%) 12(40%) 24(80%) 30(100%) 23.1(87.1%) 6.8(21.9%) 30(100%) - t(6)=2.6,
p=.04*
English 19(63.3%) CNP 27(90%) 29(96.7%) 29(96.7%) 24(80%) 30(100%) CNP 26.3(87.8%) 4.2(13.9%) 30(100%) - t(5)=2.1,
p=.08
Difference3 p=.53 - - p=1 p=.89 p=.04* p=.41 - p=.18 p=1
1 – Croft’s test battery (Croft et al., 2015). 2 – Maximum score possible is 30. 3 – Chi-square test was conducted to compare the cross-linguistic differences for each BWA. 4 – Independent
sample t-test was conducted to compare the differences at the group level. * p≤.05

122
Table4.9
Classification of Naming Responses of BWA with Examples from English.
Response type Code Definition Examples
of target
Examples of
response
Correct 1 Phonologically accurate description of the target (plural
forms are acceptable)
Dog Dog
Correct with
variations
10 Correct following hesitations or fragments Prawn aa..prawn
Target language errors
Semantic 22 Semantically related to the target Rabbit Tortoise
Formal 23 Response that begin or end with the same phoneme as
the target, or have at least 50% overlap.
Dog
Dot
Mixed 26 Response both semantically and phonologically related
to the target word
Lock Latch
Non-word 24 Non-lexical error, i.e., form that does not exist in the
dictionary of the language.
Frog /bufo/
No response 20 No response, omissions, or participants saying they
cannot name
Neck Do not know
Unrelated 25 Real word but semantically or phonologically not
related to the target word
Tortoise Book
Descriptive 21 Describing the function or other attributes of the target Letter Writing
Cross-linguistic errors
Semantic 61 Response word in the non-target language that is
semantically related to the target
Dog /gɔru/1 (cow)
Formal 62 Response word in the non-target language that begin or
end with the same phoneme as the target, or have at
least 50% overlap
Goat /gol/1
(Round)
Translation
equivalent
60 Translation equivalent of the target word Hair /tʃul/1 (Hair)
Unrelated 63 Real word in the non-target language but semantically
or phonologically not related to the target word
Neck /katʃ/1
(glass)
1 – Cross-linguistic errors are coded in IPA format and the translation equivalents are given in bracket.

123
Table4.10
Accuracy (Raw score, N=30 and %) and Error Classifications of BWA in Bengali (B) and English (E) in Croft’s Naming Task.
Response type BWA1 BWA2 BWA3 BWA4 BWA5 BWA6 BWA7 BWA8
B E B E B E B E B E B E B E B E
Correct 27 21 22 2 12 23 29 26 29 23 10 23 26 26 22 15
Correct with
variations
1 1 1 - 3 3 - 3 - 1 - - 3 3 - -
Total correct
(%)
28
(93.3)
22
(73.3)
23
(76.7)
2
(6.7)
15
(50)
26
(86.7)
29
(96.7)
29
(96.7)
29
(96.7)
24
(80)
10
(33.3)
23
(76.7)
29
(96.7)
29
(96.7)
22
(73.3)
15
(50)
Error types in target language
Semantic 2 2 2 - - 1 1 1 1 - - 3 - 1 4 2
Formal - - 1 - 3 3 - - - - 1 - - - - -
Mixed - - 1 - - - - - - 1 - - - - - -
Non-word - - - - - - - - - 1 - - - - - -
No response - 2 - 2 3 - - - - 2 3 4 - - 4 2
Unrelated - - 1 - - - - - - - - - - - - 2
Descriptive - - - - - - - - - 1 - - - - - -
Total errors in target language (%) 2
(6)
4
(13)
5
(17)
2
(6)
6
(20)
4
(13)
1
(3)
1
(3)
1
(3)
5
(17)
4
(13)
7
(23)
0
-
1
(3)
8
(27)
6
(20)
Cross-linguistic error types
Semantic - - - 3 - - - - - - 1 - - - - 1
Formal - - - - - - - - - - - - - - - -
Translational equivalents - 4 1 22 9 - - - - 1 15 - 1 - - 8
Unrelated - - 1 1 - - - - - - - - - - - -
Total cross-linguistic errors (%) 0
-
4
(13)
2
(6)
26
(86.7)
9
(30)
0
-
0
-
0
-
0
-
1
(1)
16
(53)
0
-
1
(3)
0
-
0
-
9
(30)

124
Table4.11
Accuracy (Raw score, N=30 and %) and Error Classifications of BWA in Bengali (B) and English (E) in Croft’s Repetition Task.
Response type BWA1 BWA2 BWA3 BWA4 BWA5 BWA6 BWA7 BWA8
B E B E B E B E B E B E B E B E
Correct 20 20 27 CNP 21 22 30 28 27 30 19 24 30 30 30 30
Correct with
variations
1 2 - 1 4 - - - - 1 - 3 3 - -
Total correct
(%)
21
(93.3)
22
(73.3)
27
(90)
22
(73.3)
26
(86.7)
30
(100)
28
(93.3)
27
(90)
30
(100)
20
(66.7)
24
(80)
30
(100)
30
(100)
30
(100)
30
(100)
Error types in target language
Semantic - - - - - - - - - 1 - - - - -
Formal 9 8 2 8 2 - 1 3 - 6 4 - - - -
Mixed - - - - - - - - - - - - - - -
Non-word - - - - - - - - - - - - - - -
No response - - - - - - 1 - - 3 2 - - - -
Unrelated - - 1 - 2 - - - - - - - - - -
Descriptive - - - - - - - - - - - - - - -
Total errors in target language (%) 9
(30)
8
(26.6)
3
(10)
8
(26.7)
4
(13.3)
0
2
(6.7)
3
(10)
0
10
(33.3)
6
(20)
0
0
0
0
Cross-linguistic error types
Semantic - - - - - - - - - - - - - - -
Formal - - - - - - - - - - - - - - -
Substitution - - - - - - - - - - - - - - -
Unrelated - - - - - - - - - - - - - - -
Total cross-linguistic errors (%) 0
0
0
0
0
0
0
0
0
0
0
0
0
0
0

125
4.4.2.3.4 Reading aloud. Participants were shown one written word at a time on a
computer screen and were asked to name them. Responses were recorded using a voice
recorder. Responses were marked as correct and incorrect. Incorrect responses were classified
according to the error type as with naming responses. BWA showed significantly poorer
reading aloud abilities compared to BHA on Bengali (BWA: M = 23.1, SD = 6.8; BHA: M =
30, SD = 0; p = .04) and a marginal significant effect on English (BWA: M = 26.3, SD = 4.2;
BHA: M = 30, SD = 0; p = .08). Cross linguistic differences in the reading aloud scores
between Bengali and English were contrasted for each BWA using chi-square test. BWA2
and BWA8 could not perform the task in Bengali and BWA3 could not perform the task in
English due to poor pre-stroke reading abilities in Bengali and English, respectively. BWA6
performed significantly better in English (24 correct out of 38) as compared to Bengali (12
correct out of 38) which can again be attributed to the differences in pre-stroke reading
abilities between Bengali (self-rated 4 out of 7) and English (self-rated 7 out of 7). Overall,
BWA showed a relatively better (compared to naming) and comparable reading abilities in
Bengali (accuracy = 87.1%) and English (accuracy = 87.8%).
In summary, from the Croft’s test battery, following picture emerges: as a group
BWA had difficulties in picture naming with semantic errors in the target language and
translation equivalent cross-linguistic errors, relatively preserved repetition with formal errors
but no cross-linguistic errors, intact spoken word comprehension and relatively preserved
reading aloud abilities. Therefore, we can assume that our BWA showed intact semantic
system with deficit either in phonological output lexicon or in lexical access (accessing the
phonological word form from the semantic system).
4.4.2.4 Inhibitory control (Stroop tests). Inhibitory control was assessed using the
verbal colour-word Stroop test with the same procedure and stimuli sets as used in Chapter 2
(Please see Chapter 2 method section for detailed description).

126
4.4.2.5 Shifting between task-sets (Trail Making Test). The Trail Making Test
(TMT) from the Halstead-Reitan Test Battery (Reitan, 1986) is one of the most widely used
neuropsychological tests to assess mental set shifting (I. Sánchez-Cubillo et al., 2009). The
test consists of two parts, A and B. On part A, participants are asked to connect 25 circled
numbers (e.g. 1, 2, 3, 4, etc.) distributed on a paper using a pen/pencil. On part B, participants
need to connect the circles but alternating between circled numbers and letters (e.g. 1, A, 2,
B, 3, C, etc.). All the participants completed both parts of the test. We measured the total time
in second for both parts of the test, therefore, achieving two scores, TMT-A and TMT-B. The
dependent variable was the difference score (B -A) which has been said to be the best
indicator of task switching ability of the TMT test and correlates significantly with the switch
cost generated from the Wisconsin cars sorting test (I. Sánchez-Cubillo et al., 2009).
4.4.2.6 Working memory (Digit span test). Working memory was assessed by
administering the backward digit span test (Wechsler, 1999). The description of the test and
procedure was same as described in Chapter 2.
Independent samples t-test was used separately on the Stroop ratio and Stroop
difference measures and non-parametric version of independent samples t-test (Mann-
Whitney U test) was used separately (as the data was not normally distributed) on TMT
difference and backward digit span measures between the groups. As could be seen in Table
4.12, the two groups differed significantly only on the Stroop ratio, Stroop difference and the
TMT difference score. Compared to BWA, BHA demonstrated lesser Stroop ratio indicative
of better inhibitory control and a smaller TMT difference suggesting superior shifting ability.
We did not find any difference on the working memory measure between the two groups
which may be due to the difficulty level of the task and/ or the severity level of the aphasia of
our BWA group.

127
At the individual level, as can be seen in Table 4.13, BWA2 and BWA8 were most
affected on all the three executive control measures. BWA5 and BWA7 showed smaller
Stroop ratio compared to others which indicates relatively preserved inhibitory control
abilities. BWA4 and BWA7 had smaller TMT difference compared to others suggestive of
better mental-set shifting abilities. On working memory measure, BWA6 and BWA7
performed better compared to others whereas BWA2, BWA3, and BWA8 performed poorer
compared to others. Raw data for each BWA and BHA for all the executive control variables
(Stroop incongruent, Stroop congruent, Stroop difference, Stroop ratio, TMT-A, TMT-B,
backward digit span) are provided on Appendix 4.2.
Table4.12
Mean Values (M), Standard Deviations (SD) and the Statistical Results of the Executive Control Measures by
Group.
Measures
BWA (N =8) BHA (N = 8)
M Min-Max SD M Min-Max SD
Stroop ratio 48.7 4-85 30.2 23.5 2-35 11.2 t (8.9) = 2.2, p =
.05*
TMT difference 193.1 32.6-759 245.8 31.8 10.9-61.2 20.7 U1 = 13, p =
.005**
Backward digit span 3.9 3-5 .8 4.5 3-7 1.6 U1 = 27, p = .64
*p<.05, **p<.01; 1Mann-Whitney U test
Table4.13
Mean Values (M), Standard Deviations (SD) and the Statistical Results of the Executive Control Measures for
each BWA.
BWA
Stroop ratio TMT difference Backward digit span
BWA1 36 66 4
BWA2 76 316 3
BWA3 57 82 3
BWA4 33 32.6 4
BWA5 4 123 4
BWA6 80 129 5
BWA7 19 37.1 5
BWA8 85 759 3
Mean 48.7 193.1 3.9
SD 30.2 245.8 .8
BHA
M 23.5 31.8 4.5
SD 11.2 20.7 1.6

128
4.4.3 Verbal Fluency Measures
4.4.3.1 Trials and procedure. All the participants completed two verbal fluency
conditions − semantic and letter – in both languages. They were asked to produce as many
words as possible in 60 s. In semantic fluency condition, participants produced words in two
categories− animals, and fruits and vegetables. In letter fluency condition, participants were
asked to produce words that start with letters F, A, and S for the English language and letter
P, K, and M for the Bengali. The instruction for the Bengali letter fluency task was different
from the English letter fluency task (as described in Chapter 2) due to the phonology of
Bengali language. In the Bengali letter fluency task, participants were asked to name words
that starts with the sound (e.g. /p/) rather than the letter (e.g. P). Please refer to Chapter 2 for
a detailed description and procedure of the verbal fluency task.
4.4.3.2 Data coding and analysis. We followed the same procedure for data coding
and analysis as described in Chapter 2 and generated the following variables: number of CR,
FDS, 1st-RT, sub-RT, cluster size, number of switches, within-cluster pause and between-
cluster pause.
4.5 Statistical Analysis
All the variables were measured for each trial for the two fluency conditions for each
participant in each language. To arrive at the mean scores for each variable in each language,
two trials were averaged for semantic fluency and three trials were averaged for letter fluency
condition. A two-way ANOVA repeated measure was used on the following variables:
number of CR, FDS, 1st-RT, sub-RT, cluster size, number of switches, within-cluster pause,
and between-cluster pause. In the design, Group (BWA, BHA) was treated as a between-
subject factor, Language (Bengali, English) and Condition (Semantic, Letter; except for FDS)
was treated as within-subject factor. Two separate two-way ANOVAs were conducted for
initiation parameter and slope of semantic and letter fluency conditions with Group being the

129
between-subject factor and Language as within subject factor. Since, we performed multiple
comparisons; we set our significance value at p≤ 0.01, instead of p≤ 0.05. Tukey’s post hoc
tests were applied for significant interaction effects at p≤ 0.01. To facilitate individual level
data analysis, raw scores of each BWA individuals were reported for the number of CR, FDS,
cluster size and number of switches in each language and in each fluency condition (except
for FDS).
To examine the relationship between the executive control measures and verbal
fluency variables, Spearman’s correlations were performed separately for each group.
4.6 Results
The mean and standard deviation values for the verbal fluency variables for Groups (BWA
and BHA), Language (Bengali and English) and Condition (Semantic and Letter) averaged
across participants are presented in Table 4.14 (standard deviation reflects between-subject
variation). The results of the statistical tests are also provided in Table 4.14. Raw scores for
each BWA in each condition are presented in Table 4.15. Findings from the correlation
analyses between the executive control measures and verbal fluency variables for each group
are presented in Table 4.16. Findings for Group differences are presented first; followed by
the individual level performance. Findings on the relationship of executive control measures
and verbal fluency variables are presented at the end.
4.6.1 Group Differences in Verbal Fluency Performance
Differences between the BWA and BHA in terms of main effect of Group or an interaction of
Group X Condition were observed for CR, FDS, initiation, slope, switches and between-
cluster pauses. There were no group differences in 1st-RT, sub-RT, cluster size, and within-
cluster pauses. Figure 4.1 depicts the significant group differences. There was no main effect
of Language or interactions with any other factors, except for the FDS where a Group X
Language interaction was observed.

130
The CR showed a main effect of Group (BWA: M =6.3, SD = 3.2; BHA: M = 15.4,
SD = 3.2) and Condition (Semantic: M = 13.4, SD = 2.9; Letter: M = 8.3, SD = 2.2) and a
significant three-way interaction of Group X Language X Condition with a large effect size
of 0.72 (see Figure 4.1a). Post-hoc analysis of the interaction revealed that there were no
significant cross-linguistic differences either for semantic (Bengali: M = 8.9, SD = 4; English:
M = 8.1, SD = 5.2; p = .60) or letter (Bengali: M = 3.9, SD = 2.8; English: M = 4.2, SD = 3.9;
p = .79) for the BWA group. However, BHA performed significantly better in Bengali
compared to English in semantic fluency (Bengali: M = 20.8, SD = 4; English: M = 15.7, SD
= 5.2; p = .005). As expected, BWA showed significant word retrieval difficulties compared
to BHA in both languages and in both fluency conditions. BHA performed better in Bengali
compared to English in the semantic fluency which is reflective of their language acquisition
history, self-rated language proficiency, current language usage pattern, and language
dominance.
For FDS, there was a main effect of Group (BWA: M = .59, SD = .19; BHA: M = .26,
SD = .24) and a significant two-way interaction of Group X Language with a large effect size
of .60 (see Figure 4.1b). Post-hoc analysis of the interaction revealed no significant cross-
linguistic difference for the BWA group (Bengali: M = .56, SD = .19; English: M = .62, SD =
.34; p = .59) but BHA had significantly smaller FDS score in English compared to Bengali
(Bengali: M = .46, SD = .19; English: M = .06, SD = .34; p = .004). Smaller FDS score for
BHA compared to BWA suggestive of superior linguistic and executive control abilities for
BHA. Again, smaller FDS score for BHA in English suggestive of recruitment of stronger
executive control processing in English to overcome the cross-linguistic competition faced
from their dominant language (Bengali). Another possible reason for smaller FDS score in
English compared to Bengali can be attributed to the nature of the letter fluency task where
BHA performed better in English compared to Bengali. All of our BHA participants were

131
highly educated (except BHA2) and had English as their writing medium. As letter fluency is
a very artificial task and depends on the phonology of the language, better education in
English maybe another reason for smaller FDS in English.
Figure 4.2 presents the time course analysis for groups across two fluency conditions.
There were significant main effects of Group on both initiation and slope for both conditions.
BHA had significantly larger initiation parameter and steeper slope compared to BWA in
both conditions, suggestive of reduced linguistic resources and slower lexical access for
BWA compared to BHA. Flatter slope in conjunction with longer sub-RT and more number
of CR usually indicates better executive control abilities in healthy adults, however, in this
case BWA produced fewer number of CR and there was no difference between the groups on
sub-RT. Therefore, we cannot assume flatter slope for BWA indicative of better executive
control.
As expected, there was a main effect of Condition for the cluster size that is both
groups had bigger cluster size in semantic fluency compared to the letter fluency condition.
However, there were no main effects of Group or any interaction of Group X Condition. Both
groups performed similarly on cluster size which suggests both groups used similar search
strategy to access the mental lexicon.
Number of switches evidenced a significant main effect of Group (BWA: M = 4, SD =
2.2; BHA: M = 9, SD = 1.8), Conditions (Semantic: M = 7.4, SD = 2.3; Letter: M = 5.6, SD =
2.2), and a significant two-way interaction of Language X Condition with a large effect size
of 0.65, and three-way interaction of Group X Language X Condition with a large effect size
of .70 (see Figure 4.1c). Post-hoc analysis of the three-way interaction revealed that there
was no significant cross-linguistic difference either for semantic (Bengali: M = 4.9, SD = 2.3;
English: M = 4.8, SD = 2.9; p = 1) or letter condition (Bengali: M = 3.3, SD = 2.3; English: M
= 3, SD = 3.2; p = .76) for BWA group. However, BHA switched significantly more number
132
of times in English compared to Bengali (Bengali: M = 6.7, SD = 1.8; English: M = 9.5, SD =
2.4; p = .01) in letter fluency. This could mean that the BHA group has used switching as a
successful strategy to produce newer exemplars especially in their non-dominant language
where there is greater cross-linguistic interference.
For within-cluster pauses, there were no main effects of Group or Language or
Condition and neither any significant interaction between these variables. For between-
cluster pauses, there was only a main effect of Group (BWA: M = 9.2, SD = 4; BHA: M =
4.5, SD = .64), BWA showed significantly longer between-cluster pauses compared to BHA.
Longer between-cluster pause with reduced switching abilities for BWA indicates a difficulty
in executive control component (in addition to the difficulty in lexical access) of the verbal
fluency task (Rosen et al., 2005; Raboutet et al., 2010).

133
Table4.14
Means (M), Standard Deviations (SD) and the Statistical Results of the Dependent Variables by Group (BWA: Bilingual with aphasia; BHA: Bilingual Healthy Adults), Conditions (averaged
across trials), and Language (Bengali and English)
Measures BWA (N = 8) BHA (N = 8) Statistical analysis (Group, Language, Condition)
B E Total B E Total
M SD M SD M SD M SD M SD M SD Group (G) Lang (L) Cond (C) G*L G*C C*L G*L*C
CR1 6.4 3.1 6.1 3.7 6.3 3.1 16.0 3 14.9 4.4 15.4 1.2 F(1,14)=32.
2,p<.001**
*,η𝑝 2= .70
F(1,14)=.73,
p=.41,η𝑝 2=.05
F(1,14)=35.5,
p=.009**,
η𝑝 2= .72
F(1,14)=.2
7,
p=.61,η𝑝 2 =
.02
F(1,14)=.65,
p=.43,
η𝑝 2= .04
F(1,14)=27.1,
p<.001***,
η𝑝 2= .66
F(1,14)=15.5,
p<.001***,
η𝑝 2= .53
Semantic 8.9 4 8.1 4.8 8.5 3.9 20.8 4 15.8 5.6 18.3 4.3 Letter 3.9 2.7 4.2 3.4 4.1 2.9 11.1 3 14 4.4 12.5 3.2
FDS2 .56 .24 .62 .26 .59 .19 .46 .14 .06 .40 .26 .24 F(1,14)=8.9,p=.01**,
η𝑝 2= .39
F(1,14)=4.2, p=.06, η𝑝 2 = .23 F(1,14)=8, p=.01**,η𝑝
2 = .36
1st RT 5.2 5.5 4.6 4.7 4.9 3.9 1.2 .7 1.5 .6 1.3 .4 F(1,14)=6.54,p=.02,
η𝑝 2= .32
F(1,14)=.01, p=.92,
η𝑝 2= .001
F(1,14)=.07, p=.79,
η𝑝 2= .005
F(1,14)=.14, p=.72,
η𝑝 2 = .01
F(1,14)=.01, p=.94,
η𝑝 2= .001
F(1,14)=1.3, p=.28,
η𝑝 2= .08
F(1,14)=2.1, p=.17,
η𝑝 2= .13
Semantic 3.4 2.4 5.9 8 4.7 4.4 1.2 .7 1.2 .5 1.2 .3
Letter 6.9 11 3.3 2 5.1 5.8 1.1 .9 1.8 .8 1.4 .5
Sub-RT 20.4 6.5 18.5 7.3 19.5 4.6 22 2.3 23 1.5 22.5 1.7 F(1,14)=3.2
, p=.10,
η𝑝 2= .18
F(1,14)=.21,
p=.65,η𝑝 2=
.01
F(1,14)=4.1,
p=.06,η𝑝 2=
.22
F(1,14)=.28,
p=.60,η𝑝 2= .02
F(1,14)=.88,
p=.36,η𝑝 2= .06
F(1,14)=.62,
p=.44,η𝑝 2=
.04
F(1,14)=2,
p=.17,
η𝑝 2= .13
Semantic 21.2 7.6 16.4 7.6 18.8 5.8 20 3.2 21 3.5 20.6 2.8 Letter 19.6 8.2 20.7 9.7 20.2 5.2 25 2.6 24 3.5 24.5 2.4
Semantic
Initiation
1.5 .62 1.5 1.1 1.5 .79 3.9 .89 3 1 3.5 .55 F(1,14)=33.
8,p<.001**
*,η𝑝 2= .71
F(1,14)=1.7, p=.21,η𝑝 2 = .11
F(1,14)=1.7, p=.21,η𝑝 2 = .14
Letter Initiation 1.1 .58 .77 .66 .93 .56 1.9 .27 2.1 .46 2 .33 F(1,14)=21.
1,p<.001**
*,η𝑝 2= .60
F(1,14)=.06, p=.81,η𝑝 2= .004 F(1,14)=7.2, p=.02,η𝑝
2= .34
Semantic slope -.44 .25 -.52 .46 -.48 .32 -1.3 .46 -1 .42 -1.2 .25 F(1,14)=23.
6,p<.001**
*,η𝑝 2 = .63
F(1,14)=.50, p=.49,η𝑝 2= .03 F(1,14)=1.6, p=.22,η𝑝
2= .10
Letter slope -.37 .20 -.25 .23 -.31 .18 -.56 .19 -.58 .18 -.57 .15 F(1,14)=9.5
1,p=.008**,
η𝑝 2= .40
F(1,14)=.66, p=.43,η𝑝 2= .04 F(1,14)=1.5, p=.24,η𝑝
2= .10
Cluster size .49 .30 .50 .23 .50 .20 .74 .20 .56 .12 .65 .14 F(1,14)=3.1, p=.10,
η𝑝 2= .18
F(1,14)=1.5, p=.23,
η𝑝 2= .10
F(1,14)=18.7, p<.001***,
η𝑝 2= .57
F(1,14)=1.7, p=.21,
η𝑝 2= .11
F(1,14)=2.3, p=.15,
η𝑝 2= .14
F(1,14)=2, p=.18,
η𝑝 2= .12
F(1,14)=.08, p=.79,
η𝑝 2= .005
Semantic .83 .53 .76 .48 .79 .45 .93 .24 .65 .23 .79 .21
Letter .16 .22 .24 .21 .20 .12 .55 .28 .47 .21 .51 .17
Switches 4.1 2.1 3.9 2.6 4 2.2 8.7 1.4 9.3 2.5 9 1.8 F(1,14)=24.9, p<.001***,
η𝑝 2= .64
F(1,14)=.27,
p=.61,η𝑝 2=
.02
F(1,14)=9.7, p=.008**,
η𝑝 2= .41
F(1,14)=.61,
p=.45,η𝑝 2=
.04
F(1,14)=.01, p=.97,
η𝑝 2= .000
F(1,14)=10.6,p=.006**,
η𝑝 2= .43
F(1,14)=13.4,p=.003*
*,η𝑝 2= .49
Semantic 4.9 2.3 4.8 2.9 4.9 2.4 10.6 1.7 9.1 3.3 9.9 2.3
Letter 3.3 2.3 3 3.2 3.2 2.5 6.7 1.8 9.5 2.4 8.1 1.7
WCP3 3 1.8 3 1.8 3 1.3 3.1 1.1 3.6 2.1 3.4 1.6 F(1,14)=.23,
p=.64,η𝑝 2= .02
F(1,14)=.34,
p=.57,η𝑝 2=
.02
F(1,14)=2,
p=.17,η𝑝 2=
.13
F(1,14)=.27,
p=.61,η𝑝 2=
.02
F(1,14)=6.5,
p=.02,η𝑝 2= .32
F(1,14)=3.9, p=.07,
η𝑝 2= .22
F(1,14)=3.6,p=.08,
η𝑝 2= .21
Semantic 3.8 1.4 3 .8 3.4 .65 1.7 .54 2.3 .90 2 .51
Letter 2.2 3.1 3.1 3.2 2.6 2.6 4.4 2.2 5 3.6 4.7 2.8
BCP4 8.1 2.5 10.3 5.8 9.2 4 4.3 .78 4.7 .97 4.5 .64 F(1,14)=10.9,
p=.005**,
η𝑝 2= .44
F(1,14)=2.8,
p=.79,
η𝑝 2= .17
F(1,14)=.08,
p=.79,
η𝑝 2= .005
F(1,14)=1.6,
p=.22,
η𝑝 2= .10
F(1,14)=.14,
p=.71,
η𝑝 2= .01
F(1,14)=.16,
p=.69,
η𝑝 2= .01
F(1,14)=.33,
p=.58,
η𝑝 2= .02
Semantic 8.2 5.6 10.3 7.8 9.3 6.4 3.4 .49 4.6 1.4 4.1 .75 Letter 7.9 4 10.4 9 9.1 5.2 5.3 1.5 4.7 1.1 5 .99
1 – number of correct responses, 2 – Fluency Difference Score, 3 – Within-Cluster Pauses, 4 – Between-Cluster Pauses, ** p≤.01, * p≤.05, Condition (Semantic, Letter), **p<.01, ***p<.001

134
Figure 4.1 All the three-way and two-way significant interactions are presented. Error bars represent standard error of the means. BWA: Bilingual with aphasia: BHA: Bilingual Healthy
Adults. * p≤.01
Figure 4.2 Comparison of number of correct responses (CR) produced as a function of 5-sec time intervals in the semantic and letter fluency conditions between the groups for English (left
panel) and Bengali (right panel). Error bars represent standard error of the means. BWA: Bilingual with aphasia: BHA: Bilingual Healthy Adults.
0
5
10
15
20
25
Semantic Letter Semantic Letter
BWA BHA
Mea
n n
um
ber
of
CR
a. GroupXLanguageXCondition
Bengali English-0.2
-0.1
0
0.1
0.2
0.3
0.4
0.5
0.6
0.7
0.8
BWA BHAMea
n f
luen
cy d
iffe
rence
sco
re
b. GroupXLanguage
Bengali English
0
2
4
6
8
10
12
Semantic Letter Semantic Letter
BWA BHA
Mea
n n
um
ber
of
swit
ches
c. GroupXLanguageXCondition
Bengali English
0.00
0.50
1.00
1.50
2.00
2.50
3.00
3.50
4.00
4.50
5.00
1 2 3 4 5 6 7 8 9 10 11 12
Mea
n n
um
ber
of
CR
Time bins
a. English
semantic_BWA
letter_BWA
semantic_BHA
letter_BHA
0.00
0.50
1.00
1.50
2.00
2.50
3.00
3.50
4.00
4.50
5.00
1 2 3 4 5 6 7 8 9 10 11 12
Mea
n n
um
ber
of
CR
Time bins
b. Bengali
semantic_BWA
letter_BWA
Semantic_BHA
letter_BHA
*
*
*
*
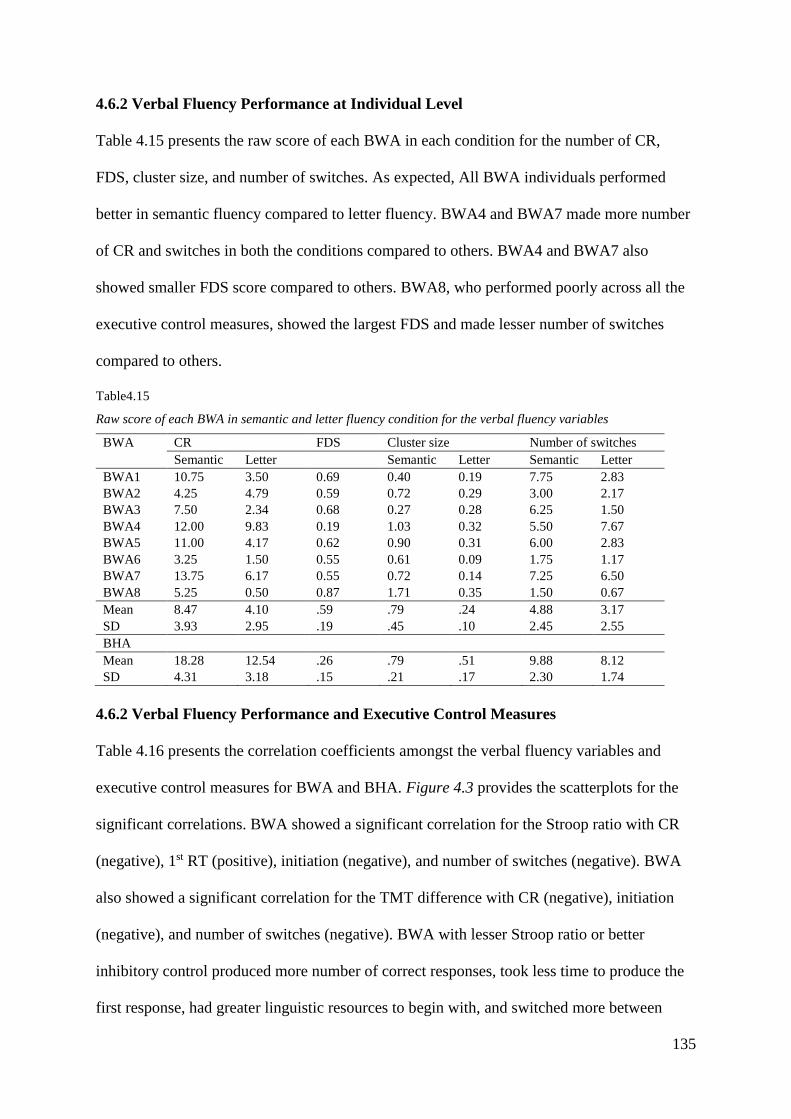
135
4.6.2 Verbal Fluency Performance at Individual Level
Table 4.15 presents the raw score of each BWA in each condition for the number of CR,
FDS, cluster size, and number of switches. As expected, All BWA individuals performed
better in semantic fluency compared to letter fluency. BWA4 and BWA7 made more number
of CR and switches in both the conditions compared to others. BWA4 and BWA7 also
showed smaller FDS score compared to others. BWA8, who performed poorly across all the
executive control measures, showed the largest FDS and made lesser number of switches
compared to others.
Table4.15
Raw score of each BWA in semantic and letter fluency condition for the verbal fluency variables
BWA CR FDS Cluster size Number of switches
Semantic Letter Semantic Letter Semantic Letter
BWA1 10.75 3.50 0.69 0.40 0.19 7.75 2.83
BWA2 4.25 4.79 0.59 0.72 0.29 3.00 2.17
BWA3 7.50 2.34 0.68 0.27 0.28 6.25 1.50
BWA4 12.00 9.83 0.19 1.03 0.32 5.50 7.67
BWA5 11.00 4.17 0.62 0.90 0.31 6.00 2.83
BWA6 3.25 1.50 0.55 0.61 0.09 1.75 1.17
BWA7 13.75 6.17 0.55 0.72 0.14 7.25 6.50
BWA8 5.25 0.50 0.87 1.71 0.35 1.50 0.67
Mean 8.47 4.10 .59 .79 .24 4.88 3.17
SD 3.93 2.95 .19 .45 .10 2.45 2.55
BHA
Mean 18.28 12.54 .26 .79 .51 9.88 8.12
SD 4.31 3.18 .15 .21 .17 2.30 1.74
4.6.2 Verbal Fluency Performance and Executive Control Measures
Table 4.16 presents the correlation coefficients amongst the verbal fluency variables and
executive control measures for BWA and BHA. Figure 4.3 provides the scatterplots for the
significant correlations. BWA showed a significant correlation for the Stroop ratio with CR
(negative), 1st RT (positive), initiation (negative), and number of switches (negative). BWA
also showed a significant correlation for the TMT difference with CR (negative), initiation
(negative), and number of switches (negative). BWA with lesser Stroop ratio or better
inhibitory control produced more number of correct responses, took less time to produce the
first response, had greater linguistic resources to begin with, and switched more between

136
clusters. BWA with lesser TMT difference or better mental shifting ability produced more
number of correct responses, had greater linguistic resources to begin with, and switched
more between clusters. For the BHA group, we did not find any significant correlation
between any executive control measures and verbal fluency measures. Significant
correlations between executive control measures and verbal fluency measures only for BWA
can be attributed to greater executive control demands faced by BWA compared to BHA
while performing the verbal fluency tasks.

137
Table4.16
Correlation Coefficients between the Executive Control Measures and the Verbal Fluency Variables for Each Group.
Executive control
measures
Fluency variables
CR FDS 1st RT Sub-RT Initiation Slope Cluster
size
Number of
switches
Within-cluster
pauses
Between-
cluster pauses
BWA (N = 8)
Stroop ratio rs1 -.88* .35 .95** -.52 -.90* .76 .02 -.86* -.71 .55
p-value .004 .40 <.001 .18 .002 .03 .95 .007 .05 .16
TMT diff rs1 -.86* .50 .74 -.69 -.81* .71 .24 -.93** -.69 .59
p-value .007 .24 .04 .06 .01 .05 .57 .001 .06 .12
BHA (N = 8)
Stroop ratio rs1 -.37 .58 .46 -.25 -.34 -.02 .48 -.71 .67 .71
p-value .41 .13 .25 .55 .41 .96 .23 .05 .07 .05
TMT diff rs1 -.45 .55 .14 -.45 -.21 -.26 .31 -.74 .52 .62
p-value .26 .16 .74 .26 .61 .53 .46 .04 .18 .10
1 – Spearman’s correlation. * Significance assumes at p≤.01, **Significance assumes at p≤.001. BWA: Bilingual with aphasia: BHA: Bilingual Healthy Adults.

138
Figure 4.3 Correlation plots for the significant correlations between the a) Stroop ratio and verbal fluency parameters: number of CR (top left panel), mean 1st RT (top right panel),
mean initiation (middle left panel), number of switches (middle right panel), and b) TMT difference and verbal fluency parameters: number of CR (bottom left), mean initiation
(bottom middle), number of switches (bottom right panel) for the two groups. However, the significant correlation for BWA between TMT difference and other three verbal fluency
variables (Mean number of CR, Initiation, and mean number of switches) diminished (Mean number of CR: rs = -.85, p =.01; Mean initiation: rs = -.71, p = .07; Mean number of
switches: rs = -.89, p = .007) when we excluded the data of BWA8 (TMT difference: 759). BWA: Bilingual with aphasia: BHA: Bilingual Healthy Adults.
0
2
4
6
8
0 20 40 60 80 100
Mea
n I
nit
iati
on
Stroop ratio
0
5
10
15
20
0 20 40 60 80 100Mea
n n
um
ber
of
CR
Stroop ratio
BWA
BHA
Linear (BWA)
Linear (BHA)
0
2
4
6
8
10
12
14
0 20 40 60 80 100
Mea
n 1
st R
T
Stroop ratio
0
2
4
6
8
10
12
14
16
0 20 40 60 80 100
Mea
n n
um
ber
of
swit
ches
Stroop ratio
0
5
10
15
20
0 200 400 600 800
Mea
n n
um
ber
of
CR
TMT difference
0
2
4
6
8
0 200 400 600 800
Mea
n I
nit
iati
on
TMT difference
02468
10121416
0 200 400 600 800
Mea
n n
um
ber
of
swit
ches
TMT difference
139
4.7 Discussion
Present study aimed to investigate the contribution of word production and executive control
processes during word production in BWA and BHA adults. We used a group of non-fluent
Bengali-English BWA who were matched for the demographic and bilingualism related
variables with the BHA. For the verbal fluency task, we used a wide range of variables − CR,
FDS, 1st-RT, Sub-RT, initiation, slope, clustering and switching, within-cluster pause and
between-cluster pauses – that are thought to differentially contribute to the linguistic and
executive components of verbal fluency task. In addition, we measured executive control in
the domains of inhibition, switching and working memory, and linked the performance on the
verbal fluency to the executive measures. To summarise the main findings, compared to
BHA, BWA showed differences in both linguistic and executive control domains as
identified on Table 4.17.

140
Table4.17
Results of the Current Study in the Context of the Verbal Fluency Variables and their Linguistic and Executive
Control Components.
Parameters Processes Bilingual Aphasia (BWA) vs.
Bilingual Healthy (BHA)
Linguistic Executive Findings Correlation with
Executive Control
Quantitative
1. Number of correct responses √ √ Yes
BWA < BHA
Yes (negative) with
Stroop ratio and TMT
difference for BWA
2. Fluency difference score √ Yes
BWA > BHA
No
Time course
1. 1st RT
√ No
BWA = BHA
Yes
(positive) with Stroop
ratio for BWA
2. Sub-RT
√ No
BWA = BHA
No
3. Initiation
√ Yes
BWA < BHA
Yes
(negative) with Stroop
ratio and TMT
difference for BWA
4. Slope
√ Yes
BWA > BHA
No
Qualitative
5. Cluster size
√ No
BWA = BHA
No
6. Number of switches
√ Yes
BWA < BHA
Yes
(negative) with Stroop
ratio and TMT
difference for BWA
7. Within-cluster pauses
√ No
BWA = BHA
No
8. Between-cluster pauses
√ Yes
BWA > BHA
No
Yes – significant findings, NO – not significant findings
On the verbal fluency tasks, BWA produced fewer number of CR (linguistic and
executive control), had larger FDS score (executive control), longer initiation parameter
(linguistic), flatter slope (executive control), switched fewer times (executive control) and
took longer time to switch between clusters (executive control). Both groups showed similar
clustering score (linguistic) and took similar time to access new words once a subcategory
has been accessed as indicated by within-pause cluster (linguistic). On the separate executive
control measures, BWA showed difficulty in inhibitory control and task switching measure
but comparable working memory. On the correlation analysis, only BWA showed significant

141
correlation between the executive control measures (inhibitory control and mental shifting
abilities) and verbal fluency measures (number of CR, 1st-RT, initiation, and number of
switches). Overall, the BWA group showed specific differences with respect to word retrieval
and executive control components of the verbal fluency tasks which is again supported by the
findings from the separate executive control measures and correlations.
Compared to BHA, BWA retrieved and generated fewer correct words irrespective of
the fluency condition which corroborates with the aphasia literature which has shown PWA
have difficulty in lexical retrieval and production (Bose et al., 2017; Baldo et al., 2010, Kiran
et al., 2014, Roberts & Le Dorze, 1994). Both BWA and BHA performed better in the
semantic fluency compared to letter fluency in terms of number of CR, cluster size, and
number of switches. BWA showed no cross-linguistic difference which is consistent with the
findings in the aphasia literature involving verbal fluency tasks (Kiran et al., 2014). Though
BWA were Bengali dominant as a group but the comparable performance in the verbal
fluency task across languages is consistent with the performance in Croft’s materials, where
we did not find any language difference. One possible reason for no cross-linguistic
differences in BWA can be attributed to the comparable aphasia severity in both the
languages. However, BHA group performed better in Bengali compared to English on the
semantic fluency task and reverse was found on the letter fluency task. BHA group were
overall Bengali dominant and used Bengali more in their day-to-day life, therefore better
performance in Bengali for the semantic fluency task is consistent with the literature which
assumes current language usage as one of the important factor in verbal fluency performance
(Kiran et al., 2014). A possible reason for generating more number of correct responses in
letter fluency and smaller FDS score in English can be attributed to the nature of the letter
fluency task where BHA performed better in English compared to Bengali. All of our BHA
participants were highly educated (except BHA2) and had English as their writing medium.

142
As letter fluency depends on the phonology of the language, better writing proficiency in
English may have aided the productivity in the English version of the task which can be
another reason for smaller FDS in English. However, present study did not have any sensitive
measure of writing proficiency which could confirm the relationship between writing
proficiency in a particular language and performance in the letter fluency. Future studies may
consider investigating the role of writing efficiency and how that can influence the
productivity in letter fluency in a particular language.
On the qualitative measures, compared to BHA, BWA had similar cluster size and
within-cluster pause but fewer number of switches and longer between-cluster pauses.
Previous studies have shown reduced cluster size and longer within-cluster pauses in PWA
compared to heathy participants indicating limited lexical resources and/or difficulty in
accessing the lexical store and generalized slowing in terms of processing speed (Bose et al.,
2017; Baldo et al., 2010; Kiran et al., 2014). In Bose et al.’s study, PWA group consisted of
monolingual speakers with a mixture of 11 fluent, 17 non-fluent, and six mixed aphasia.
Participants in the Baldo et al.’s study were two native English speakers with moderate
severity of aphasia (one fluent and another non-fluent) and the non-fluent PWA showed
normal cluster score on the semantic fluency task but impaired reduced cluster score on the
letter fluency task. Participants in the Kiran et al.’s study, were 10 Spanish-English BWA
who were not defined in terms of type and severity of aphasia. However, all the participants
showed difficulty in single word comprehension on both languages (English: 47.96%;
Spanish: 69.26%).
No difference in cluster size and within-cluster pause and difficulty in switching
between one cluster to another can be attributed to the type of aphasia in our BWA group. In
the present study, all BWA were of non-fluent type in both languages. Difficulty in switching
with relatively preserved ability to access the mental lexicon is a marker of focal frontal lobe

143
lesions (Troyer et al., 1998). Therefore, non-fluent BWA may not show difficulty in
accessing words within a cluster, and once a cluster was accessed, the retrieval of words
within the cluster was not affected. However, BWA showed difficulty in switching between
one cluster to another in both semantic and letter fluency tasks which corroborates with the
previous literature involving PWA (Bose et al., 2017; Kiran et al, 2014). Both Bose et al.’s
and Kiran et al.’s study found reduced number of switches in the semantic fluency task for
PWA compared to healthy adults. Present study supports the previous findings but at the
same time extends the literature to show that the difficulty in switching from one cluster to
another evidenced not only for the semantic fluency condition but also on the letter fluency
condition. Further BWA in the present study took longer time to switch from one cluster to
another which is again supportive of Bose et al.’s finding who found reduced number of
switches to correlate with longer between-cluster pauses. Reduced number of switches in
conjunction with longer between-cluster pauses for BWA in the present study indicative of
difficulty with the executive control component of the task (Rosen et al., 2005).
On the time-course analysis, BWA had significantly smaller initiation parameter and
flatter slope compared to BHA (see Figure 4.2). Our findings corroborate with the
observation by Rohrer et al. (1995). According to Rohrer et al. (1995), impaired performance
in the verbal fluency tasks but intact semantic comprehension (as established by spoken-to-
picture word matching in Croft’s material) can be attributed to mainly two reasons, one is the
breakdown in the semantic structure that is loss in the association between the lexical items
within the semantic store, and second is the difficulty in accessing the semantic store.
On the individual analysis, BWA4 and BWA7 performed relatively well on both the
semantic and letter fluency conditions compared to others. Both these patients had mild
aphasia on both languages and performed almost at the ceiling level on the Croft’s picture
naming task (BWA4: 96.7% both languages; BWA7: 96.7% both languages), repetition

144
(BWA4: Bengali - 100%, English - 93.3%; BWA7: 100% both languages task) and reading
aloud task (BWA4: 96.7% both languages; BWA7: Bengali - 80%, English - 100%). BWA4
and BWA7 also had relatively preserved executive control abilities as evidenced by their
performance on the Stroop task, TMT test, and backward digit span test. Therefore,
individuals’ findings from the verbal fluency performance is consistent with the performance
on all the other background and executive control measures which again signifies the
importance of including extensive background and executive control measures.
Therefore, in the present study, intact semantic comprehension on the background
language task, limited lexical resources available at the beginning of the verbal fluency task,
similar clustering strategy and intact retrieval of words within a cluster with impaired
switching and longer between-cluster pauses for the BWA possibly indicates impaired lexical
access and/or loss of association between the lexical items in the semantic store and greater
impairment in the executive control components of the verbal fluency task.
Finally, the correlation analyses revealed the association between executive control
measures and verbal fluency measures. BWA with lesser Stroop ratio or better inhibitory
control and lesser TMT difference or better mental shifting abilities produced more number
of correct responses, took less time to produce the first response, had greater linguistic
resources available at the beginning of the task, and switched more between clusters.
Significant correlations between executive control measures and verbal fluency measures
only for BWA can be attributed to greater demands (linguistic as well as executive control)
faced by BWA compared to BHA while performing the verbal fluency tasks. Switching
between clusters has been linked with executive control aspect of the verbal fluency tasks
(Bose et al., 2017) and to be a strong predictor for total CR (e.g., Troyer et al. 1997). Present
study confirms the relationship of executive control, especially for the inhibitory control and
mental shifting abilities with the switching component of the verbal fluency task. However,

145
Faroqi-Shah et al. (2016) did not find any relationship between Stroop conflict ratio and
number of correct responses for their PWA which may be due to the nature of fluency task
they administered. Faroqi-Shah et al. measured number of CR only for the semantic fluency
but not for the letter fluency. As previously discussed, executive control demands are higher
in the letter fluency condition, and PWA may not require their executive control abilities to
perform in the semantic fluency condition. Therefore, significant correlations between Stroop
ratio and verbal fluency measures for the present study signify the role of executive control
abilities during word production in BWA population.
Difficulty in the executive control components of the verbal fluency task for the BWA
was further supported by the results obtained from the separate executive control measures.
As expected, compared to BHA, BWA showed significantly larger Stroop ratio or difficulty
in the inhibitory control component of the Stroop test. The findings are consistent with
previous studies on aphasia and inhibitory control (Faroqi-Shah et al., 2016). On the task
switching measure, BWA showed larger TMT difference compared to BHA indicative of
difficulty in switching between mental sets. Previous studies have shown PWA to have
difficulty in task switching compared to healthy adults (Helm-Estabrooks, 2002; Chiou &
Kennedy, 2006). In terms of working memory, previous studies have shown working
memory deficits in monolingual PWA involving backward digit span task (Laures-Gore,
Marshall, & Verner, 2010; Ween, Alexander, D'esposito, & Roberts, 1996). However, we did
not find any group difference on the working memory measure which is not surprising as
previous studies have shown BWA to perform within normal limits in working memory
measures (Penn, Frankel, Watermeyer, & Russel, 2010). Penn, Frankel, Watermeyer, and
Russel (2010) tested two BWA on three working memory measures: Self ordered pointing
test, complex figures, and Wisconsin card sorting test. Penn et al (2010) found intact working
memory function for those two BWA individuals compared to healthy adults. In this study,

146
we have included only one measure for each executive control domain which renders the
convergent validity of the present findings. Therefore, future studies should look into the
performance of BWA on a broad range of executive control measures.
In terms of individual level analysis, not all the BWA showed executive control
impairments on all the domains. BWA4 and BWA7 had relatively preserved executive
control abilities across the three domains (inhibitory control, mental-set shifting, and working
memory). BWA5 showed preserved inhibitory control abilities but was affected on the
mental-set shifting abilities. These results signify the importance of including a broad range
of executive control measures and also the importance of looking at individual level data
while analyzing data involving BWA.
This study is the first study to our knowledge involving BWA where verbal fluency
performance was assessed using a broad range of measures (quantitative, qualitative, and
time-course) on both semantic and letter fluency conditions. We found BWA to be affected
across the three measures (quantitative, qualitative, and time-course) especially where
executive control demands were higher (FDS, number of switches) compared to BHA and
more on the letter fluency (higher executive control demands) compared to semantic fluency.
Previous studies have looked into the performance of PWA in verbal fluency, but all those
studies had limitations such as some of the studies (Bose et al., 2017; Kiran et al., 2014) have
only used semantic fluency and not letter fluency, others (Faroqi-Shah et al., 2016) have
taken only number of CR as a dependent variable. However, as seen from the present study,
inclusion of letter fluency and a full range of verbal fluency measures are necessary to
understand the effect of executive control deficit in verbal fluency performance. Therefore,
future studies should include both the fluency conditions as well as a full range of verbal
fluency measures to better inform the debate on relative contribution of linguistic and
executive control abilities in verbal fluency tasks.

147
In conclusion, the observation of larger FDS, lower switching scores, and longer
between-cluster pauses give us the evidence that BWA had difficulty in the executive control
component of the verbal fluency task in addition to their linguistic deficits which is further
supported by the findings from separate executive control and correlation analysis. Further,
previous studies have speculated the role of executive control in verbal fluency measures, but
present study uses separate experimental measures of executive control to confirm that
inhibitory control and mental shifting abilities plays a key role in the verbal fluency
performance difference between BWA and BHA. From the clinical perspective, this research
highlights the importance of using a full range of verbal fluency and executive control
measure to tap into the linguistic as well as executive control abilities of BWA. This type of
evidence is currently lacking in the literature.

148
Chapter 5. Cognate Production and Executive Control in Bilingual Aphasia

149
5.1 Abstract
Background. Studies have compared performance differences between cognate (same
meaning and similar phonology across the two languages) and non-cognate (share only the
meaning but not the phonology) words using picture naming task to investigate the influence
of linguistic variation in bilinguals, especially in bilinguals with aphasia (BWA). Studies
have shown mixed results ranging from cognate facilitation to cognate interference to no
difference between cognates and non-cognates. Language proficiency and executive control
components modulate the cross-language activation in BHA during cognate production, but it
is still not clear which executive control components modulates the cross-language activation
in BWA.
Aims. To investigate the cross-linguistic interference/activation using a picture naming task
with cognates and non-cognates in BWA and BHA. To investigate whether the differential
cognate/non-cognate naming abilities were influenced by their executive control abilities.
Methods & Procedure. Picture naming task in Bengali and English was administered on
seven non-fluent Bengali-English BWA and 8 Bengali-English BHA. Characteristics of the
participants are described in Chapter 4. Images were nouns and consisted of black-and-white
line drawings of 38 cognates (e.g., /bʌtən/ in English and /bɔtʌm/ in Bengali) and 38 non-
cognates (e.g., /haʊs/ in English and /bʌri/ in Bengali) matched for syllable length and
subjective familiarity. Dependent variables were differences in naming accuracy and RT
between cognate words and non-cognate words. Participants also completed the same
executive control tests described in Chapter 4.
Outcomes & Results. Both groups showed significant cognate facilitation in both languages
at group level for both accuracy and RT. Error and individual analysis of BWA showed
difficulty in cognate words production for balanced BWA. Correlation analysis revealed both

150
BWA and BHA with better inhibitory control and mental-set shifting abilities showed lesser
cognate facilitation.
Conclusions & Implications. We found evidence of cognate facilitation as well as cognate
interference for BWA. Results support the claim of greater cross-linguistic competition faced
by cognates during picture naming task, especially for unbalanced BWA. Findings from the
present study are discussed regarding its clinical implications and future directions.

151
5.2 Introduction
One of the most debated topics in the bilingual literature is whether bilinguals have an
integrated lexicon or two separated lexicons, one for each language and if there is activation
from both languages even when only a single language is pertinent that time. There is
behavioural evidence from bilingual healthy adult (BHA) as well as bilinguals with aphasia
(BWA) to show that even when bilinguals are speaking in one language, both languages are
activated which is also called language-nonselective lexical access (Abutalebi & Green,
2007; Green, 1998). To support the language-nonselective hypothesis, researchers have
considered the production of cognates in both BHA and BWA population. Studies have
shown that bilinguals are faster and more accurate while naming cognate words that share the
same meaning and similar phonology across the two languages (e.g., /bʌtən/ in English and
/bɔtʌm/ in Bengali) compared to non-cognate words that share only the meaning but not the
phonology (e.g., /haʊs/ in English and /bʌri/ in Bengali; see, e.g. Costa et al., 2000; Roberts
& Deslauriers, 1999; Lalor & Kirsner, 2001). The cognate facilitation effect which is
assumed to arise from the shared phonological segments in both languages resulting in higher
activation for the cognates, whereas the non-cognate words receive activation only from the
target language (see Figure 5.1).
While the cognate facilitation provides evidence for the language-nonselective lexical
access, the findings remain equivocal. Studies have shown cognate inhibition as well as no
difference between cognate and non-cognates (Broersma et al., 2016; Kurland & Falcon,
2011; Tiwari & Krishnan 2015) supporting the inhibitory control model of lexical access.
According to the inhibitory control model (Green, 1998), the cross-language competition
leads to the inhibition of the non-target word and the inhibition is more for the cognates as
compared to non-cognates resulting in cognate inhibition (Declerck & Philipp, 2015).
Further, studies have shown executive control components, especially inhibitory control and

152
working memory modulates the cross-language activation in BHA during cognate production
(Linck et al., 2008) but it is still not clear which executive control components modulates the
cross-language activation in BWA.
Therefore, the present study examines the effect of cognateness in BWA and BHA
and aims to explore the relationship between executive control and the cross-language
activation/competition in BWA and BHA using a picture naming task. In the following
section, we will review the findings from the BWA literature on cognate production followed
by the relationship between cognate production and executive control in BWA.
5.2.1 Cognate Effects
Studies have shown cognate facilitation (Detry et al., 2005; Kohnert, 2004; Lalor &
Kirsner, 2001; Roberts & Deslauriers, 1999), cognate inhibition (Broersma et al., 2016;
Kurland & Falcon, 2011; Tiwari & Krishnan 2015) and no difference between cognates and
non-cognates (Verreyt et al., 2013) in terms of accuracy and RT for both BWA and BHA in a
range of tasks – picture naming, picture to word verification, word reading, lexical decision,
and translation tasks.
Figure 5.1 Schematic representation of the cognate word production (left panel) and non-cognate word
production (right panel). Words are written in IPA format for both English and Bengali. Thickness of the
circles and rectangle indicates level of activation of the lexical nodes (Adapted from Costa, 2005).

153
Detry, Pillon, and de Partz (2005) tested a 40-year old non-fluent French-English
BWA on a picture naming task (production) and a picture-to-word verification task
(comprehension). Stimuli were the same set of items (30 cognates and 30 non-cognates
matched for number of phonemes and word frequency) for both languages and both tasks.
Detry et al. (2005) found poorer picture naming abilities in English (L2) compared to French
(L1), but cognate facilitations were observed in both languages and for both tasks. Detry et al.
concluded that cognate words are better preserved following a brain damage compared to
non-cognates but they did not make any comment on the relationship between the language
proficiency and cognate facilitation.
Kohnert (2004) tested a 62-year old non-fluent Spanish-English BWA on two
consecutive treatment designs – cognitive intervention and cognate intervention – to
investigate the generalization within and across cognitive-linguistic domains. For the
cognitive intervention, treatment focus was to improve non-verbal skills such as
categorization, attention, visual perception. The treatment was carried on for two months.
Following the cognitive treatment, Kohnert found improvements in cognition as well as in
linguistic domains. Improvement in the language abilities following cognitive treatment
reflected the generalization from non-linguistic to linguistic domain. Cognate based treatment
was focused at the linguistic-semantic level involving cognate and non-cognate nouns. Before
therapy, Kohnert found cognate facilitation only in Spanish, and after treatment, cross-
linguistic generalisation happened only for cognates. Kohnert suggested that the
interconnections between two languages and linguistic and cognitive domains can be used to
develop successful intervention techniques.
Lalor and Kirsner (2001) tested a 63-year old multilingual aphasia individual who
before the stroke was fluent in English, Italian, and Arabic. Bilingual Aphasia Test (BAT,
Paradis, Hummel, & Libben, 1989) results revealed both English and Italian were impaired

154
on the receptive language tasks whereas on the expressive language tasks Italian was more
impaired. The experimental tasks were word naming, and lexical decision task involving
cognate and non-cognate words. The participant performed the task in English and Italian. On
the word naming task, there was a main effect of language that is the participant performed
better in English as compared to Italian which was consistent with the findings from the
BAT. Low-frequency Italian cognates with high-frequency translations were recognised
faster as compared to low-frequency Italian cognates with low-frequency translation.
However, this pattern was not observed in English and for non-cognate words. On the lexical
decision task, English words were processed faster as compared to Italian words. The
participant made a higher number of errors on the non-cognate words as compared to
cognates in both languages. Lalor and Kirsner’s study provided support for the language-
nonselective lexical access by showing facilitation for cognate words.
In another study, Roberts and Deslauriers (1999) administered a confrontation naming
task on an English-French group of 15 BWA (10 non-fluent and five fluent) and 15 BHA. All
the participants were self-reported balanced bilinguals. Stimuli for the task were colour
photographs of 25 cognates and 25 non-cognate nouns in each language, matched for syllable
length and subjective familiarity. Roberts and Deslauriers tested naming accuracy and error
patterns for both the cognate and non-cognate conditions. For accuracy, cognate facilitation
was observed only in French (L2), but not in English (L1). Error analysis revealed semantic
and cross-linguistic errors were more prevalent while naming non-cognates, whereas no
response and descriptive errors were more common while naming cognates.
In a study involving bilingual healthy adults, Broersma, Carter, and Acheson (2016)
tested English-dominant, Welsh-dominant and balanced BHA on a picture naming task with
36 cognates and 36 non-cognate nouns. Broersma et al. (2016) found the language dominance
modulated evidence of both facilitation and inhibition for cognates. English-dominant group

155
showed cognate inhibition in their nondominant language (Welsh), and no difference between
cognates and non-cognates in their dominant language (English), whereas Welsh-dominant
and balanced group showed cognate facilitation in both languages. The findings of cognate
inhibition were attributed to the greater cross-linguistic competition in the nondominant
language faced by English-dominant group while naming cognates compared to non-
cognates. The author supported the models of lexical selection that advocates the role of
inhibitory control during lexical selection and suggested that cross-linguistic competition can
be observed even in highly proficient bilinguals.
Kurland and Falcon (2011) found cognate interference when they tested a 60-year old
severely non-fluent Spanish-English BWA on a picture naming task (16 cognates and 16 non-
cognates) following an intensive semantic naming treatment. They found improved naming
accuracy for non-cognates compared to cognates following the treatment suggestive of
increased interference for cognate stimuli compared to non-cognates.
Tiwari and Krishnan (2015) tested a self-reported balanced (pre-morbid) Kannada-
Malayalam BWA on a picture naming task (28 cognates and 30 non-cognates) and found
selective naming difficulty for cognates in their less dominant language (Malayalam). The
authors suggested that the cognate inhibition in L2 arises due to the greater inhibition faced
by the cognate words in their non-dominant language.
Verreyt, De Letter, Hemelsoet, Santens, and Duyck (2013) have reported no
differences between the cognate and non-cognate naming conditions. Verreyt et al. (2013)
tested a 78-year old non-fluent French-Dutch BWA (greater impairment in Dutch compared
to French) individual on three lexical decision (LD) tasks: generalised LD, L1 (French)
selective LD and L2 (French) selective LD task. In the generalised LD task, the participant
had to respond whether the stimuli are words or not irrespective of language (L1 or L2). In
the selective task, participants had to respond whether the stimuli are words or not in that

156
particular language (in French for the L1 selective task and Dutch for the L2 selective task).
Stimuli were 30 French-Dutch cognates, 30 Dutch non-cognates, 30 French non-cognates and
90 non-words. The authors found cognate facilitation on the generalised task but no cognate
advantage on the L1 selective task and cognate interference on the L2 selective task. Verreyt
et al. attributed this no cognate facilitation effect to greater cross-linguistic competition when
the task demand is higher.
In summary, studies on cognate effects have reported mixed results ranging from
facilitation to interference to no difference. Most of the studies on BWA are single case
studies and often they have not included an extensive measure of language background
neither separate executive control measures. In this present study, we address these
methodological challenges by including a range of language background measures and a
group of seven Bengali-English BWA and eight BHA to investigate the cognate effects using
a picture naming task.
5.2.2 Cognate Effects and Executive Control
Previous studies have argued about the role of executive control, especially inhibitory control
in cognate production in BWA (Verreyt et al., 2013) and BHA (Acheson, Ganushchak,
Christoffels, & Hagoort, 2012; Linck et al., 2008). In an ERP study, Acheson et al. (2012)
tested 24 German-Dutch BHA on a mixed picture naming task involving 24 cognates and 24
non-cognate items. The mixed picture naming consisted of two conditions: blocked and
mixed. In the blocked naming condition, participants were asked to respond once in German
(L1) and once in Dutch (L2). Mixed condition had switch and non-switch trials. In the switch
trial, participants had to alternate between L1 and L2 (L1-L2 or L2-L1) whereas in the non-
switch trials two consecutive trials were of the same language (L1-L1 or L2-L2). They found
cognate facilitation in RT but increased response conflict or increased error related negativity
(ERN) for the cognates compared to non-cognates. Acheson et al. concluded that even though

157
production of cognates took less time compared to non-cognates, cognates faced greater
response conflict due to increased feature overlap.
As previously mentioned Verreyt et al. (2013) tested a French-Dutch BWA on a
cognate picture naming task and found cognate facilitation only on the easier lexical decision
task. In addition, Verreyt et al. also administered a flanker task to investigate the executive
control ability of the BWA participant. The participant made significantly greater error on the
incongruent trials compared to the congruent trials (congruency effect) and this congruency
effect was significantly greater compared to 19 balanced healthy Dutch-French bilinguals.
The researchers linked the executive control deficit to the cognate pattern shown by the
patient. However, they did not correlate executive control measure with the cognate effect
because of single case design.
Linck et al. (2008) tested two groups of BHA, 34 Spanish-English and 26 Japanese-
English on a cognate picture naming task in their L2 (English) and two executive control
tasks, working memory (operation span) and inhibitory control (Simon task). They found
better inhibitory control abilities (smaller Simon effect) resulted in lesser cross-language
activation or lesser cognate facilitation but did not find any relationship with the working
memory measure. However, at present, there is no study which has linked the role of
executive control in cognate production in BWA population. The present study aims to
examine the relationship between executive control and cross-language activation using a full
range of executive control measures and a picture naming task involving cognates and non-
cognates.

158
5.3 The Current Investigation, Research Questions and Predictions
The overarching aim of this study was to investigate the cross-linguistic
interference/activation using a picture naming task with cognates and non-cognates in BWA
and BHA. Further, to investigate whether the differential cognate/non-cognate naming
abilities were influenced by their executive control abilities. In this research, we compared
the differences (accuracy, RT) in picture naming performance between cognates and non-
cognates in seven Bengali-English non-fluent BWA and eight BHA. We also performed error
analysis, individual level analysis and item-wise analysis to better inform the cognate effect
in BWA. We provided a detailed characterisation of our participants in Chapter 4. We tested
executive control processes using the same executive control measures that we used in
Chapter 4. Therefore, the present study had the following executive control measures: Stroop
test (measured selective inhibition), Trail Making Test (TMT, measured shifting between
mental sets) and the backward digit span test (measured working memory). Following were
the research aims and predictions:
1. To determine the differences (between group: BWA and BHA, between languages:
English and Bengali) in naming performance (accuracy and RT) between cognate and
non-cognate picture nouns.
Based on the previous studies, we expect both groups to show either cognate
facilitation (Detry et al., 2005; Kohnert, 2004; Roberts & Deslauriers, 1999) or
cognate interference/no difference (Broersma et al., 2016; Tiwari & Krishnan, 2015;
verreyt et al., 2013) in accuracy and RT in both languages at the group level. Cognate
facilitation would provide support for the language selective hypothesis whereas
cognate interference/no difference would provide evidence for the inhibitory control
model of lexical access as described earlier. Again, we expect greater cognate

159
facilitation (Roberts & Deslauriers, 1999) or cognate interference in the nondominant
language (Broersma et al., 2016; Tiwari & Krishnan, 2015).
2. To determine whether differential cognate abilities are influenced by differences in
their executive control abilities.
We expect executive control measures, especially inhibitory control (Stroop ratio) to
correlate significantly with the cognate naming abilities for both BWA and BHA
(Linck et al., 2008). Similar to chapter 4, we expect BWA to have a stronger
correlation between inhibitory control and cognate naming abilities compared to
BHA. BWA would need to recruit their executive control processes to compensate for
their linguistic difficulties while performing in the picture naming task especially in
the nondominant language (Hernandez & Meschyan, 2006).
5.4 Method
5.4.1 Participants
All participants in Chapter 4, except BWA3, participated in this study. Participation was
voluntary, and participants provided written consent before participation. The University of
Reading Research Ethics Committee approved all the procedures in this study.
5.4.2 Cognate Picture Naming
All the participants performed a picture naming task. Details of the stimuli, procedure and
scoring are provided in the following sections:
5.4.2.1 Stimuli. Stimuli were nouns consisted of black-and-white line drawings of 38
cognates (e.g., /bʌtən/ in English and /bɔtʌm/ in Bengali) and 38 non-cognates (e.g., /haʊs/ in
English and /bʌri/ in Bengali). Images were taken from various picture databases, such as
Philadelphia Naming Test database (PNT; Roach et al., 1996), International Picture Naming
Project database (IPNP; Szekely et al, 2004), Bank Of Standardized Stimuli database (BOSS;

160
Brodeur et al, 2010), picture database given by Snodgrass and Vanderwart (1980), and
internet resources.
Both subjective and objective methods were used to determine the cognate status of
the stimuli. Initially, 46 cognate nouns and 46 non-cognate nouns were chosen. In the
subjective method, the experimenter classified the picture names as cognates or non-cognates
based on minimum phonemic feature overlap of at least 70% across languages (Mackay,
1971). Another independent judge (psycholinguistic and aphasia researcher) was asked to
classify the words into cognates and non-cognates. Both the experimenter and the
independent judge were native speakers of Bengali and were highly proficient in English. A
final stimuli list (See Table 5.1 for the complete list of stimuli and their characteristics)
consisted of 38 cognates and 38 non-cognates where both the experimenter and the
independent judge agreed whether words were cognates or not.
The objective method was based on the phonemic similarity approach given by
Mackay (1971). Cognate words were selected based on minimum phonemic feature overlap
of at least 70% across language. The words were matched for syllable length across word
types and languages (See Table 5.1). Familiarity ratings for each word in each language were
obtained by giving a 7-point scale (1 – not familiar, 7 – most familiar) from 7 Bengali-
English BHA recruited from India. Familiarity ratings were used as frequency measures were
not available for Bengali words. Participants were asked to give a rating to each word from 1
to 7. Following this method, we derived mean familiar ratings for cognate and non-cognate
words in each language. The statistical results revealed no significant differences regarding
familiarity ratings between cognates and non-cognates (See Table 5.2).

161
Table5.1
Stimuli List (Cognates and Non-Cognates) and their Syllable Lengths (SL), Familiarity Ratings (FR) in English
and Bengali (in IPA Format).
S/N Cognate Non-cognate
English Bengali English Bengali
Stimuli SL FR Stimuli SL FR Stimuli SL FR Stimuli SL FR
1 apple 2 7.0 apel 2 7.0 potato 3 7.0 alu 1 7.0
2 pencil 2 6.1 penʃil 2 6.4 magnet 2 5.4 tʃumbɔk 2 6.3
3 cup 1 6.4 kap 1 6.6 tea 1 6.7 tʃa 1 7.0
4 bottle 2 5.9 botol 2 5.4 house 1 7.0 ɡʱɔr 1 7.0
5 tomato 3 6.4 ʈɔmɛʈo 3 6.7 onion 3 7.0 pɛdʒ 2 7.0
6 cycle 2 7.0 saikel 2 7.0 ship 1 5.9 dʒɑhadʒ 2 6.4
7 plug 1 5.1 plag 1 5.4 tap 1 4.7 kɔl 1 5.9
8 zebra 2 6.3 dʒebra 2 5.9 lion 1 5.9 sinɡʱɔ 2 6.3
9 giraffe 2 6.4 dʒiraf 2 5.9 peacock 2 5.6 mɔyur 2 6.3
10 police 2 7.0 puliʃ 2 7.0 bone 1 5.9 haɽ 1 6.4
11 kettle 2 5.3 keʈli 2 6.1 teacher 2 7.0 ʃikʰɔk 2 6.7
12 box 1 5.0 bakʃɔ 2 5.4 paper 2 6.6 kagɔdʒ 2 6.6
13 torch 1 7.0 ʈɔrtʃ 1 7.0 moon 1 7.0 tʃand 1 6.9
14 doctor 2 6.4 daktar 2 7.0 medicine 3 7.0 oʃuɖʱ 2 7.0
15 button 2 5.7 botam 2 6.0 needle 2 5.4 ʃutʃ 1 5.7
16 rickshaw 2 6.4 rikʃa 2 6.6 tail 1 5.9 ledʒ 1 5.9
17 bus 1 7.0 baʃ 1 7.0 foot 1 6.7 pa 1 7.0
18 battery 3 7.0 bɛʈari 3 7.0 lip 1 7.0 ʈʰoʈ 1 7.0
19 drum 1 6.6 ɖram 1 6.7 ladder 2 5.6 siɽi 2 6.0
20 guitar 2 6.9 giʈar 2 6.7 bell 1 5.9 ɡʱɔnʈa 2 6.4
21 sofa 2 6.4 sofa 2 6.3 pillow 2 6.7 baliʃ 2 6.7
22 bat 1 6.0 bɛʈ 2 6.3 cap 1 6.3 ʈupi 2 7.0
23 ball 1 6.3 bɔl 1 6.3 medal 2 5.6 pɔdɔk 2 5.0
24 glass 1 6.7 glas 1 7.0 duck 1 6.6 has 1 6.4
25 calendar 3 7.0 kɛlenɖar 3 7.0 letter 2 6.7 tʃiʈʰi 2 7.0
26 bag 1 6.4 bɛg 1 6.6 basket 2 5.4 dʒʱuɽi 2 6.3
27 train 1 5.7 rel 1 5.4 bricks 1 5.3 iʈ 1 6.7
28 pin 1 5.3 pin 1 4.9 umbrella 3 6.4 tʃʰata 2 7.0
29 cake 1 6.3 kek 1 6.6 window 2 5.9 dʒanala 3 6.7
30 chair 1 6.6 tʃɛar 1 6.7 curtain 2 5.3 pɔrda 2 6.6
31 bench 1 6.7 bentʃ 1 7.0 tree 1 7.0 gatʃʰ 1 7.0
32 table 2 7.0 ʈebil 2 7.0 camel 2 6.4 uːnʈ 1 5.7
33 pant 1 7.0 pɛnʈ 1 7.0 shirt 1 6.7 dʒama 2 6.4
34 biscuit 2 6.7 biskiʈ 1 6.6 sweet 1 6.9 miʃʈi 2 6.0
35 icecream 2 6.7 aiskrim 2 6.9 banana 3 7.0 kɔla 2 7.0
36 belt 1 7.0 belʈ 1 7.0 shoe 1 7.0 dʒuto 2 6.6
37 cheetah 2 6.6 tʃita 2 6.4 fish 1 7.0 matʃʰ 1 7.0
38 balloon 2 6.7 belun 2 7.0 roof 1 5.3 tʃʰad 1 6.6
M 1.6 6.4 1.6 6.5 1.6 6.5 1.6 6.3
SD .6 .6 .6 .6 .5 .5 .7 .7

162
Table5.2
Stimuli Characteristics for Cognates (Cog) and Non-cognates (Non-cog) in Bengali (B) and English (E) and the
Statistical Results of the Dependent Variables.
Variables Syllable length Subjective familiarity ratings
M
SD
Range
Statistical results1
M
SD
Range
Statistical results1
cog vs.
non-cog
B.Cog vs.
E.Cog
B.non-
cog vs.
E.non-
cog
cog
vs.
non-
cog
B.Cog
vs.
E.Cog
B.non-cog
vs. E.non-
cog
Cog 1.6 .6 1-3 t(74)=.30,
p=.76
t(74)=.18,
p=.86
t(74)=0,
p=1
6.4 .5 5-7 t(74)=
.42,
p=.67
t(74)=
.51,
p=.61
t(66.3)=1.9,
p=.06 B 1.6 .6 1-3 6.5 .6 5-7
E 1.6 .6 1-3 6.4 .6 5-7
Non-cog 1.6 .5 1-3 6.4 .5 5-7
B 1.6 .7 1-2 6.3 .7 4-7
E 1.6 .5 1-3 6.5 .5 5-7
1 – Paired sample t-tests were performed for between language comparisons.
5.4.2.2 Procedure. Participants completed the task both in English and Bengali on
different days. Participants were familiarised with the pictures at the beginning of the test to
avoid errors due to unfamiliarity. Following the familiarisation, participants were shown the
picture stimuli in random order one at a time on a computer screen using E-Prime software.
Each trial started with a fixation cross for 250ms followed by a 100ms blank screen followed
by the target stimuli with a beep sound for 4000ms. A blank screen appeared following the
target stimuli for 2000ms before the beginning of a new trial. Participants were asked to
respond verbally, and there were no feedbacks except occasional encouragement. Responses
were voice recorded and transcribed.
5.4.2.3 Scoring. We calculated the accuracy and RT of naming responses across word
types and languages. The onset of each response was labelled manually using PRAAT to
obtain greater accuracy and the RT was measured from the beginning of the beep to the onset
of the naming response (Boersma & David, 2015). We also measured proportion difference
score for naming for both accuracy (cognate - non-cognate/cognate) and RT (non-cognate -

163
cognate/cognate). Scoring criteria for the errors were same as utilised for the Croft’s picture
stimuli described in Chapter 4.
5.5 Statistical Analysis
For the RT analysis, data from 3.2% of the experimental trials (combined BWA and BHA)
were excluded due to incorrect response or being an outlier (±2.5*SD). Familiarisation of all
the test items before the testing resulted in very low error rate. All the variables were
measured for each condition (cognate and non-cognate) for each participant in each language.
We performed the following analysis which can be classified broadly into six subcategories:
5.5.1 Group Analysis
Two separate two-way ANOVA repeated measure was used, one for accuracy and another for
RT, where Group (BWA, BHA) was treated as a between-subject factor, Language (Bengali,
English) and Condition (cognate, non-cognate) were considered as within-subject factors.
Tukey’s post hoc tests were applied for significant interaction effects at p≤ 0.05.
5.5.2 Within-Group Analysis
Within-group analysis was performed to provide further insight into the group analysis of
BWA. For each group, two separate two-way ANOVA repeated measure was used, one for
accuracy and another for RT, where Language (Bengali, English) and Condition (cognate,
non-cognate) were treated as within-subject factors. Tukey’s post hoc tests were applied for
significant interaction effects at p≤ 0.05.
5.5.3 Error Analysis
Total numbers of errors were calculated separately for BWA and BHA group in each
language and each condition following the same error classification as described in Chapter
4.

164
5.5.4 Individual Level Analysis
To better understand the performance in cognate production, separate analysis at the
individual level was performed for all BWA. Cognate advantage regarding accuracy and RT
in each language was analysed for each BWA using chi-square goodness of fit test for the
accuracy and Student’s independent sample t-test for RT. Further to support the findings from
BWA, individual level differences were compared with the BHA group using revised
standardised difference test (RSDT; Crawford, Garthwaite, & Porter, 2010). RSDT assessed
whether the difference between a BWA individual’s standardised scores on two tasks
(cognate and non-cognate) is significantly different from the differences observed in the BHA
sample.
5.5.5 Item-Wise Analysis
We also did an item-wise analysis (Roberts & Deslauriers, 1999) to further validate the
cognate facilitation effect across items for both BWA and BHA groups. However, for this
analysis, we had six participants in each group as BWA2 could not complete the task in
English whereas BHA2 and BHA4 were not available to complete the task in Bengali. We
calculated accuracy for each word (cognates and non-cognates) across participants for the
following conditions: correct in both languages, Bengali correct, and English correct. The
maximum score possible for each condition was the number of participants in each group (6).
Therefore, three one-way ANOVA was conducted separately (alpha level set at .05/3 = .02)
for the three conditions to find out the cognate advantage in both BWA and BHA groups.
5.5.6 Correlational Analysis
Finally, to examine the relationship between the executive control measures and cognate
variables, Spearman’s correlations were performed separately for each group between the
cognate difference (accuracy and RT), proportion difference score (accuracy and RT), and
two executive control measures (Stroop ratio, and TMT difference) where both groups

165
performed significantly different. Based on the study by Linck et al. (2008), we correlated the
executive control measures with cognate difference score rather than the naming score in
each condition as our aim of the study was to see whether differential cognate naming
abilities were influenced by differences in the executive control abilities.
5.6 Results
The raw scores (accuracy, RT, and proportion difference score) for each individual in each
condition and each language, are presented in Table 5.3. The mean and standard deviation
values for the cognate variables for Groups (BWA and BHA), Language (Bengali and
English) and Condition (cognate and non-cognate) averaged across participants are presented
in Table 5.4 (SD reflects between-subject variation). The results of the statistical tests are
provided in Table 5.4 as well. The results of the statistical tests along with the means for the
within group analysis are presented in table 5.5. Findings from the error analysis are
presented in Table 5.6. The results of the statistical findings for each BWA are shown in table
5.7.
Table 5.8 summarises the cognate effects at Group level and individual level along
with the RSDT analysis, aphasia severity, Croft’s naming test accuracy, and self-rated
language proficiency (pre-and-post stroke). Item-wise analysis and the correlation analyses
between the executive control measures and cognate measures are presented in Table 5.9 and
Table 5.10, respectively.
Findings for Group differences are presented first; followed by the findings from the
within group analysis, error analysis, individual level analysis and item-wise analysis. The
relationship between the executive control measures and cognate measures are presented at
the end.

166
Table5.3
Each Participant’s Performance (Accuracy1 and RT) in Cognate (Cog) and Non-cognate (Non-cog) Picture Naming Tasks across Languages.
Participants Bengali English
Accuracy1 RT (msec) Accuracy1 RT (msec)
Cog Non-cog Proportion
difference
score
Cog Non-cog Proportion
difference
score
Cog Non-cog Proportion
difference
score
Cog Non-cog Proportion
difference
score
BWA
BWA1 28 (73.6) 27 (71) .03 816.4 1019.7 .25 28(73.7) 24(63.1) .14 1416.3 1403.3 -.01
BWA2 25 (65.8) 27 (71) -.08 1662.9 2270.2 .36 CNP2 CNP2 CNP2 CNP2 CNP2 CNP2
BWA4 33 (86.8) 32 (84.2) .03 846.1 932.3 .10 35 (92.1) 37 (97.4) -.05 801.2 898 .12
BWA5 34 (89.5) 30 (78.9) .12 1885.9 2106.4 .12 29 (76.3) 29 (76.3) 0 1948.4 2552.7 .31
BWA6 29 (76.3) 15 (39.5) .48 1679.5 2127.7 .27 29 (76.3) 25 (65.8) .14 1609.3 1711.9 .06
BWA7 34 (89.5) 26 (68.4) .23 1286.9 1206.2 -.06 34 (89.5) 34 (89.5) 0 1098.5 1228.4 .12
BWA8 19 (50) 21 (55.3) -.10 1277.9 1259.9 -.01 22 (57.9) 8 (21) .64 1256.4 1743.93 .39
M 28.9(76) 25.4(67) .10 1350.8 1560.3 .15 29.5(78) 26.2(69) .14 1355.1 1589.7 .17
SD 5.5(14) 5.7(15) .20 416.6 581.1 .16 4.7(12) 10.2(27) .20 400.7 567.4 .14
BHA
BHA1 37 (97.4) 30 (78.9) .19 945.9 892 -.06 37 (97.4) 37 (97.4) 0 781.9 858.2 .09
BHA2 NAT4 NAT4 NAT4 NAT4 33 (86.8) 35 (92.1) -.06 754.7 984.2 .30
BHA3 36 (94.7) 31(81.6) .14 1076.8 1002.9 -.07 33 (86.8) 27 (71) .18 883.8 1102.7 .25
BHA4 NAT4 NAT4 .07 NAT4 NAT4 .07 38 (100) 36 (94.7) .05 788.8 784 -.01
BHA5 37 (97.4) 34 (89.5) .08 805.7 981.1 .22 36 (94.7) 34 (89.5) .05 571 675 .18
BHA6 28 (73.7) 28 (73.6) 0 951.9 1221.4 .28 29 (76.3) 28 (73.6) .03 1122.6 1271 .13
BHA7 31 (81.6) 32 (84.2) -.03 865.4 828.2 -.04 30 (78.9) 32 (84.2) -.07 1150.8 1239.2 .08
BHA8 37 (97.4) 36 (94.7) .03 1019.6 1138.8 .12 36 (94.7) 36 (94.7) 0 1070.3 1139.1 .06
M 34.3(90) 31.8(84) .07 944.2 1010.7 .07 34(90) 33.1(87) .02 890.5 1006.7 .14
SD 3.9(10) 2.9(7) .07 98.7 147.7 .13 3.3(9) 3.8(10) .10 205.9 218 .10 1 – Accuracy indicating raw score and percentage in the bracket, calculated out of 38 items in each condition. 2 – Could not perform due to poor language ability. 3 – RT data may not be reliable due to fewer accurate
trials. 4 – Not available for testing.

167
Table5.4
Mean values (M), Standard Deviations (SD) of Conditions (Cognate, Non-cognate) across Languages (Bengali, English) and Groups (BWA, BHA) and the Statistical Results
of the Dependent Variables.
Measures BWA (N = 7) BHA (N = 8) Statistical analysis (Group, Language, Condition)
Bengali English Total Bengali English Total
M SD M SD M SD M SD M SD M SD Group
(G)
Lang
(L)
Cond
(C)
G*L G*C L*C G*L*C
Accuracy1
Condition 27 4 27 5 27 4 33 4 33 5 33 4 F(1,13)
=6.9,
p=.02*,
η𝑝 2=
.35
F(1,13)
=
.52,
p=.48,
η𝑝 2=
.04
F(1,13)
=12.7,
p=.003
**,η𝑝 2=
.50
F(1,13)
=
.02,
p=.90,
η𝑝 2=
.001
F(1,13)
=1.4,
p=.26,
η𝑝 2=
.09
F(1,13)
=
.27,
p=.61,
η𝑝 2=
.02
F(1,13)
=
.21,
p=.65,
η𝑝 2= .02
Cognate 29 5 29 4 29 4 34 3 34 3 34 4
Non-
cognate
25 6 26 9 26 5 32 2 33 4 32 5
RT (msec)
Condition 145
5
339 147
2
332 146
3
308 977 339 948 332 963 302 F(1,13)
=9.9,
p=.008
**,
η𝑝 2=
.43
F(1,13)
=
.01,
p=.93,
η𝑝 2=
.001
F(1,13)
=25.7,
p<.001
** η𝑝 2=
.67
F(1,13)
=
.11,
p=.74,
η𝑝 2=
.008
F(1,13)
=4.5,
p=.06,
η𝑝 2=
.26
F(1,13)
=
.30,
p=.59,
η𝑝 2=
.02
F(1,13)
=
.03,
p=.86,
η𝑝 2=
.002
Cognate 135
1
417 135
5
366 153
3
263 944 83 890 206 917 263
Non-
cognate
156
0
581 159
0
518 157
5
357 101
1
125 100
7
218 100
9
357
1 – Accuracy is indicating the raw score, calculated out of 38 items in each condition. ** p≤.01, * p≤.05

168
Table5.5
Mean values (M), Standard Deviations (SD) of Conditions (Cognate, Non-cognate) across Languages (Bengali,
English) for Each Group and the Statistical Results of the Dependent Variables.
Measures Bengali English Total Language Condition Language X
Condition M SD M SD M SD
BWA (N = 7)
Acc1
Condition 27 5 28 7 27 4 F(1,6)=.22,
p=.65, η𝑝 2= .04
F(1,6)=7.5,
p=.03*,η𝑝 2=
.56
F(1,6)=.01,
p=.97, η𝑝 2=
.001 Cog 29 5 29 4 29 4
Non-cog 25 6 26 9 26 5
RT
Condition 1456 524 1472 464 1464 127 F(1,6)=.02,
p=.90, η𝑝 2=
.003
F(1,6)=13.7,
p=.01**,η𝑝 2=
.70
F(1,6)=.03,
p=.86, η𝑝 2=
.006 Cog 1351 417 1355 366 1353 269
Non-cog 1560 581 1590 517 1575 464
BHA (N = 8)
Acc1
Condition 33 3 33 3 33 3 F(1,7)=.33,
p=.58,η𝑝 2= .04
F(1,7)=4.7,
p=.07,η𝑝 2=
.40
F(1,7)=2.7,
p=.14,η𝑝 2=
.28 Cog 34 3 34 3 34 3
Non-cog 32 2 33 4 32 3
RT
Condition 977 203 949 88 963 125 F(1,7)=.18,
p=.69, η𝑝 2= .03
F(1,7)=13.7,
p=.008**,η𝑝 2
= .66
F(1,7)=.90,
p=.37, η𝑝 2=
.11 Cog 944 83 890 206 917 124
Non-cog 1011 125 1007 218 1009 135
1 – Accuracy is indicating the raw score, calculated out of 38 items in each condition. ** p≤.01, * p≤.05

169
Table5.6
Raw score and Percentage of Errors based on the Error Classifications for Cognate (C) and Non-cognate (NC) Picture Names in Bengali and English for both BWA and
BHA Groups
Error type BWA (N =6) BHA (N =6)
Bengali English Total Bengali English Total
C NC C NC C NC C NC C NC C NC
Target language error
Semantic 18 (41%) 12 (29%) 11 (24%) 12 (24%) 29 (33%) 24 (26%) 11 (55%) 6 (27%) 14 (52%) 14 (50%) 25 (53%) 20 (40%)
Formal 6 (14%) 4 (9.5%) 6 (13%) 4 (8%) 12 (13%) 8 (8.5%) 0 0 0 0 0 0
Mixed 1 (2%) 0 0 0 1 (1%) 0 0 0 0 1 (3.6%) 0 1 (2%)
Non-word 0 1 (2%) 1 (2%) 1 (2%) 1 (1%) 2 (2.1%) 0 0 0 0 0 0
No response 18 (41%) 21 (50%) 27 (59%) 32 (64%) 45 (50%) 53 (58%) 8 (40%) 14 (64%) 11 (41%) 13(46.4%) 19 (40%) 27 (54%)
Unrelated 0 4 (9.5%) 1 (2%) 1 (2%) 1 (1%) 5 (5.4%) 1 (5%) 2 (9%) 2 (7%) 0 3 (7%) 2 (4%)
Descriptive 1 (2%) 0 0 0 1 (1%) 0 0 0 0 0 0 0
Total 44(100%) 42 (100%) 46(100%) 50 (100%) 90(100%) 92 (100%) 20(100%) 22 (100%) 27(100%) 28(100%) 47(100%) 50(100%)
Cross-linguistic error
Semantic 6 (86%) 2 (6%) 1 (20%) 2 (9%) 7 (58%) 4 (7%) 2 (100%) 1(6.7%) 0 0 2 (100%) 1 (5%)
Formal 0 1 (2.5%) 0 0 0 1 (2%) 0 0
Translational
equivalents
1 (14%) 31 (89%) 2 (40%) 19 (91%) 3 (25%) 50 (89%) 0 14(93.3%) 0 6 (100%) 0 20 (95%)
unrelated 0 1 (2.5%) 2 (40%) 0 2 (17%) 1 (2%) 0 0 0 0 0 0
Total 7 (100%) 35(100%) 5 (100%) 21(100%) 12(100%) 56(100%) 2 (100%) 15 (100%) 0 6 (100%) 2 (100%) 21(100%)

170
Table5.7
Accuracy and RT of Cognate (Cog) and Non-cognate (Non-cog) Picture Names in Bengali (B) and English (E) for
Bilingual Healthy Adults (BHA) and each Bilinguals with Aphasia (BWA) and the Statistical Results of the Dependent
Variables.
Particip
ants
Accuracy1 Reaction Time (msec)
Cog Non-cog Findings3 RSDT4 Cog Non-cog Findings3 RSDT4
BHA2
E 34(3) 33(4) 890 (206) 1007(218)
B 34(3) 32(2) 944 (83) 1011(125)
BWA
BWA1
E 28 24 χ2 (1) = .31, 𝑝 = .58 t(7)=.66, p=.53 1416.
3
1403.3 t(50)=.10,
p=.92
t(7)=1.6,
p=.16
B 28 27 χ2 (1) = .02, 𝑝 = .89 t(7)=.13, p=.90 816.4 1019.7 t(38.1)=
-1.6, p=.12
t(7)=-1.2,
p=.26
BWA2
E CNP5 CNP4
B 25 27 χ2 (1) = .07, 𝑝 = .78 t(7)=.74, p=.48 1662.
9
2270.2 t(43.2)=-
2.3,
p=.02*
t(7)=-1.1,
p=.29
BWA4
E 35 37 χ2 (1) = .05, 𝑝 = .81 t(7)=.82, p=.43 801.2
3
892.8 t(70)=-1.9,
p=.06
t(7)=.19,
p=.85
B 33 32 χ2 (1) = .02, 𝑝 = .90 t(7)=.42, p=.69 846.0
6
932.3 t(63)=-1.5,
p=.14
t(7)=.42,
p=.68
BWA5
E 29 29 χ2 (1) = 0, 𝑝 = 1 t(7)=.50, p=.63 1948.
4
2552.7 t(43.4)=-
2.4,
p=.02*
t(7)=3.8,
p=.006**
B 34 30 χ2 (1) = .25, 𝑝 = .62 t(7)=.67, p=.52 1885.
9
2106.4 t(62)=-1.2,
p=.22
t(7)=1.9,
p=.09
BWA6
E 29 25 χ2 (1) = .30, 𝑝 = .59 t(7)=.70, p=.50 1657.
8
1711.9 t(52)=-.77,
p=.44
t(7)=1.1,
p=.34
B 29 15 χ2 (1) = 4.4, 𝑝 = .03* t(7)=4.7,
p=.002**
1519.
1
2127.7 t(17.5)=-
1.1, p=.29
t(7)=1.5,
p=.16
BWA7
E 34 34 χ2 (1) = 0, 𝑝 = 1 t(7)=.27, p=.79 1098.
5
1228.4 t(66)=-1.7,
p=.08
t(7)=.01,
p=.98
B 34 26 χ2 (1) = 1.1, 𝑝 = .30 t(7)=2.2, p=.06 1286.
97
1206.2 t(58)=.60,
p=.55
t(7)=1.9,
p=.09
BWA8
E 22 8 χ2 (1) = 6.5, 𝑝 = .01* t(7)=3.2,
p=.01*
1256.
45
1743.9 t(7.8)=-
1.6, p=.14
t(7)=3.2,
p=.01**
B 19 21 χ2 (1) = .1, 𝑝 = .75 t(7)=.09, p=.93 1277.
94
1259.9 t(38)=.08,
p=.93
t(7)=1.2,
p=.28 1 – Accuracy indicating raw score, calculated out of 38 items in each condition, 2 – Means and SD of BHA group, 3 – Chi-square goodness of fit test
for the accuracy and Student’s independent sample t-test for RT comparing cognates vs. non-cognates, 4 – Revised Standardised Difference Test
(Crawford, Garthwaite, & Porter, 2010) to compare cognate advantage of each BWA with BHA group mean, 5 – Could Not Perform, ** p≤.01, *
p≤.05

171
Table5.8
Summary of Cognate Effects at Group (BWA, N =8 and BHA, N =7) and Individual level (BWA), Aphasia Severity, Naming Accuracy (%) and Self-rated Language Proficiency (Pre-
and-Post Stroke) in Both Bengali (B) and English (E).
Accuracy1 RT1
Group B E B E
BWA Yes Yes Yes Yes
BHA No No Yes Yes
RSDT Analysis2 Aphasia severity3 Naming accuracy4 Proficiency (Pre-
stroke)5
Proficiency (Post-
stroke)5 Accuracy RT
B E B E B E B E B E B E
BWA1 No No No No Moderate Moderate 93.3 73.3 7 6.5 5 4.4
BWA2 No CNP6 No CNP6 Moderate CNP6 76.7 6.7 7 3.8 4.5 2.2
BWA4 No No No No Mild Mild 96.7 96.7 7 6 5.2 4.1
BWA5 No No No Yes Mild Moderate 96.7 80 7 5.6 4.5 4
BWA6 Yes No No No CNP6 Severe 33.3 76.7 5.5 7 3.5 4.8
BWA7 No No No No Mild Mild 96.7 96.7 6 7 4.5 3
BWA8 Yes Yes No Yes Moderate CNP6 73.3 50 7 4.2 4.2 2.7 1 – Yes indicates cognate advantage and No indicates cognate vs non-cognate difference is not significantly different.2 – Revised Standardised Difference test (Crawford, Garthwaite, & Porter, 2010) to
compare cognate advantage of each BWA with BHA group mean. 3 – Aphasia severity rating obtained from Western Aphasia Battery in English (Kertesz, 2006) and its adapted Bengali version (Keshri
& Kumar, 2012). 4 – naming subtest from Croft’s test battery (Croft, 2008), a higher score indicates better performance. 5 – On a scale of zero to seven (0 = no proficiency, 7 = native like proficiency),
greater score means greater proficiency in that language. 6 – Could not perform due to poor language ability in that language.

172
Table5.9
Item-wise Analysis (Accuracy) for Cognate and Non-cognate Picture Names in BWA and BHA Groups and the
Statistical Results of the Dependent Variables.
Variables BWA (N=6) BHA (N=6) Statistical analysis
Cognate1 Noncognate1 Cognate1 Noncognate1 BWA BHA
Both languages
correct
F(1,75)= 7.8,
p=.007*,η𝑝 2=
.09
F(1,75)= 6.53,
p=.01*,η𝑝 2= .08
M 4 3.1 5 4.2
SD 1.4 1.5 1.2 1.6
Range 0-6 0-6 1- 6 0-6
Bengali correct
F(1,75)= 3.7,
p=.06, η𝑝 2= .05
F(1,75)= 3,
p=.09, η𝑝 2= .04
M 4.7 3.9 5.4 4.9
SD 1.5 1.6 0.9 1.4
Range 0-6 0-6 2-6 1-6
English correct
F(1,75)= 4.8,
p=.03, η𝑝 2= .06
F(1,75)= 4.2, p=
.04, η𝑝 2= .05
M 4.7 4.1 5.3 4.8
SD 1.1 1.1 1 1.2
Range 3-6 2-6 2-6 1-6 1 – accuracy for each word (cognates and non-cognates) across participants. Correct score gets one score for each participant.
The maximum score possible for each condition (cognate and non-cognate) was the number of participants in each group (6).
Separate scores were calculated for each variable, and separate statistical tests were performed. * p≤.02.

173
Table5.10
Correlation Coefficients amongst the Executive Control Measures and the Cognate Variables by Groups and Language (Bengali, English).
Executive control measures Cognate picture naming measures
Accuracy difference 1 RT difference1 (msec) Proportion difference
score.accuracy
Proportion difference score.RT
Bengali English Bengali English Bengali English Bengali English
BWA (N =7)
Stroop ratio rs2 -.38 .82 .18 -.07 -.39 .77 .29 .07
p .40 .02* .70 .88 .38 .04* .53 .88
TMT difference rs2 -.42 .76 .39 .57 -.39 .72 .36 .50
p .35 .05* .38 .18 .38 .07 .43 .25
BHA (N =8)
Stroop ratio rs2 .43 .65 .15 .56 .43 .74 .15 .57
p .29 .08 .72 .14 .29 .04* .72 .14
TMT difference rs2 .44 .81 .25 .40 .44 .87 .25 .40
p .27 .01* .55 .32 .27 .005* .55 .32 1 – Accuracy and RT difference were measured by subtracting cognate accuracy and RT from non-cognate accuracy and RT, 2 – Spearman’s correlation coefficients, * p≤.05

174
Figure 5.2 Cognate effects regarding accuracy (%, left panel) and RT (msec, right panel) for the BWA and BHA group. Error bars represent standard error of the means. * p≤.05
Figure 5.3 Cognate effects regarding accuracy (%, left panel) and RT (msec, right panel) for each BWA individual. * p≤.05.
0102030405060708090
100
BWA BHA
Acc
ura
cy (
%)
Group
Cognate Effects (Accuracy)
Bengali.cognate Bengali.non-cognateEnglish.cognate English.non-cognate
**
0
500
1000
1500
2000
2500
3000
BWA BHA
RT
(m
sec)
Group
Cognate Effects (RT)
Bengali.cognate Bengali.non-cognateEnglish.cognate English.non-cognate
* *
**
0
20
40
60
80
100
BWA1 BWA2 BWA4 BWA5 BWA6 BWA7 BWA8
Acc
ura
cy (
%)
Participants
Cognate Effects (Accuracy)
Bengali.cognate Bengali.non-cognate
English.cognate English.non-cognate
*
*
0
500
1000
1500
2000
2500
3000
BWA1 BWA2 BWA4 BWA5 BWA6 BWA7 BWA8
RT
(m
sec)
Participants
Cognate Effects (RT)
Bengali.cognate Bengali.non-cognate
English.cognate English.non-cognate
*
**

175
Figure 5.4 Correlation plots for the significant correlations amongst the executive control measures (left panel:
Stroop ratio; right panel: TMT difference) and cognate effects in accuracy (English) for the two groups.
However, the significant correlation for BWA between TMT difference and cognate effects in accuracy was no
longer significant (p = .15) when we excluded the data of BWA8 (TMT difference: 759, cognate effects in
accuracy: 14).
Figure 5.5 Correlation plots for the significant correlations amongst the executive control measures (left panel:
Stroop ratio; right panel: TMT difference) and proportion difference score in accuracy (English) for the two
groups.
-10
-6
-2
2
6
10
14
18
0 200 400 600 800
Co
gnat
e ef
fect
s in
acc
ura
cy
TMT difference-10
-6
-2
2
6
10
14
18
0 20 40 60 80 100
Co
gnat
e ef
fect
s in
acc
ura
cy
Stroop ratio BWA
BHA
Linear(BWA)Linear(BHA)
-1-0.8-0.6-0.4-0.2
00.20.40.60.8
1
0 200 400 600 800
Pro
po
rtio
n d
iffe
rence
sco
re i
n a
ccura
cy
TMT difference-1-0.8-0.6-0.4-0.2
00.20.40.60.8
1
0 20 40 60 80 100
Pro
po
rtio
n d
iffe
rence
sco
re
in a
ccura
cy
Stroop ratio
BWA
BHA
Linear(BWA)Linear(BHA)

176
5.6.1 Cognate Effects at the Group Level
As expected, differences between the BWA and BHA regarding the main effect of Group
were observed for both accuracy and RT (see Table 5.4). On accuracy, BWA group made
significantly fewer correct responses compared to BHA (BWA: M =27, SD = 5; BHA: M =
33, SD = 5) and the BWA group (M = 1421, SD = 338) were significantly slower than BHA
group (M = 983, SD = 338).
Regarding cognate facilitation, we also found the main effect of Condition for both
accuracy and RT. Cognates were produced more accurately (cognates: M = 31.7, SD = 4.4;
non-cognates: M = 28.9, SD = 5.6) and faster (cognates: M = 1132, SD = 293.9; non-cognates:
M = 1272.5, SD = 386.2) compared to non-cognates suggestive of cognate facilitation for both
BWA and BHA. However, we did not find any main effect of language or any two-and three-
way interactions either for accuracy or RT.
5.6.2 Cognate Effects at the Within-Group Level
Cognate effects at the within-group level for both BWA and BHA regarding accuracy and RT
are presented in Table 5.5. For the BWA group, there was a main effect of Condition for both
accuracy and RT (see Figure 5.2), that is cognates were produced more accurately with large
effect size of 0.7 (cognates: M = 29, SD = 4; non-cognates: M = 26, SD = 5) and faster with
large effect size of 0.8 (cognates: M = 1353, SD = 269; non-cognates: M = 1575, SD = 464)
compared to non-cognates. There was no main effect of language or any two-way interactions
for both accuracy and RT.
For the BHA group, there was a main effect of Condition, only for RT (see Figure
5.2). There were no significant differences between cognate naming accuracy and non-
cognate naming accuracy (cognates: M = 34, SD = 3; non-cognates: M = 32, SD = 3; p = .58),
however cognates were produced faster compared to non-cognates with large effect size of

177
0.8 (cognates: M = 917, SD = 124; non-cognates: M = 1009, SD = 135). There was no main
effect of language or any two-way interactions for both accuracy and RT.
5.6.3 Cognate Effects on Naming Error
Error classifications at the group level are presented in Table 5.6. Overall, semantic, no
response, and cross-linguistic errors most frequently occurred error types. For BWA, no
response errors were more common than semantic errors in both cognate (50% no response
and 33% semantic) and non-cognate condition (58% no response and 26% semantic). For
BHA, semantic errors were more common than no response errors in the cognate condition
(53% semantic and 40% no response), and no response errors were more common than
semantic errors in the non-cognate condition (40% semantic and 54% no response). In terms
of cross-linguistic errors, translational equivalents errors were the most common type of error
for both groups and were more common in the non-cognate condition compared to the
cognate condition (BWA: 89% in the non-cognate condition and 25% in the cognate
condition; BHA: 95% in the non-cognate condition and no errors in the cognate condition).
In summary, BHA group produced word closer to the target word (semantic errors)
while naming cognates suggestive of cognate facilitation. However, BWA group produced
more number of no responses while naming cognates which implies BWA group faced greater
interference from the cognate words which is just opposite to the BHA group.
5.6.4 Individual Level Analysis
On individual level analysis (see Table 5.7), not all the BWA showed cognate facilitation.
Four out of seven BWA showed cognate facilitation either in accuracy or RT only in their
nondominant language except BWA2 who showed cognate facilitation in dominant language
(Bengali) for RT (see Figure 5.3). BWA5 showed cognate facilitation in L2 (English) for RT
(cognate = 1948.4 msec, non-cognate = 2552.7 msec), BWA6 showed cognate facilitation in

178
L2 (Bengali) for accuracy (cognate = 29, non-cognate = 15), and BWA8 showed cognate
facilitation in L2 (English) for accuracy (cognate = 22, non-cognate = 8).
Further, to determine whether the cognate advantage of each BWA is significantly
different from BHA group, we performed RSDT analysis (Crawford et al., 2010) for each
BWA. Findings are consistent with the individual level analysis (except BWA2) that is the
difference in naming between cognates and non-cognates showed by BWA5, BWA6, and
BWA8 were significantly different from the differences observed in BHA group. Overall,
balanced BWA (except BWA5) did not show cognate facilitation; only the unbalanced BWA
showed cognate facilitation which was significantly different from the BHA group (see Table
5.8).
5.6.5 Item-wise Analysis
On item-wise analysis (see Table 5.9), cognate pictures were more often correctly named in
both languages than the non-cognate pictures. There was a significant effect of cognateness
(accuracy) only for ‘both languages correct’ for both BWA, F (1, 75) = 7.8, p=.007 with a
moderate effect size of 0.3 and BHA, F (1, 75) = 6.53, p=.01 with a small effect size of 0.2.
5.6.6 Cognate Variables and Executive Control Measures
Table 5.10 presents the correlation coefficients amongst the cognate variables and executive
control measures for BWA and BHA. Figure 5.4 and Figure 5.5 provides the scatter plots for
the significant correlations. Correlation analyses revealed better executive control correlated
with lesser cognate facilitation and lesser proportion difference score for both groups
Significant positive correlations were observed for both the executive control
measures (Stroop ratio and TMT difference) and cognate facilitation regarding accuracy in
English (see Figure 5.4). Participants (BWA) with smaller Stroop ratio and lesser TMT
difference (BWA and BHA) illustrated lesser cognate facilitation in their nondominant
language (English) indicating that the participants with better inhibitory control and task

179
switching ability could restrict the cross-linguistic activation (i.e., less cognate facilitation).
However, the significant correlation between TMT difference and cognate facilitation for
BWA went away (p =.15) when we excluded the data from BWA8 (TMT difference: 759,
accuracy difference: 14). Therefore, the significant correlations between TMT difference and
cognate facilitation in English should be treated cautiously.
For proportion difference score, significant positive correlations were observed with
Stroop ratio for BWA and significant positive correlations were observed with TMT
difference for BHA (see Figure 5.5). However, the significant results were observed only for
accuracy in English similar to cognate difference score. Participants with smaller Stroop ratio
(BWA) and lesser TMT difference (BHA) illustrated lesser proportion difference score in
their nondominant language (English) indicating that the BWA participants with better
inhibitory control and BHA participants with better task switching ability could restrict the
cross-linguistic activation (i.e., less cognate facilitation).
5.7 Discussion
The present study investigated the group differences in naming of cognate and non-cognate
nouns in two languages of BWA and BHA and explored the executive control measures that
mediate the performance difference between them. Overall, we found cognates were named
faster and more accurately compared to non-cognates on both languages. BWA were slower
and more error-prone as compared to BHA on both cognate and non-cognates. BWA showed
cognate facilitation in both accuracy and RT, whereas BHA group showed cognate facilitation
only for RT. Error patterns revealed BHA group performed better while naming cognates
compared to non-cognates. However, BWA who had more difficulty in cognates produced
more number of no response errors. On the individual analysis, only unbalanced BWA
showed cognate facilitation in their non-dominant language. Item-wise analysis revealed
cognate advantage on both languages with a greater effect size for BWA compared to BHA.

180
On the correlation analysis, both groups showed significant correlations between executive
control measures (Stroop ratio and TMT difference) and accuracy regarding cognate effects
and proportion difference score in their nondominant language (English).
Compared to BHA, BWA were less accurate and took more time to respond to the
picture naming task irrespective of the word status (cognate and non-cognate). Both groups
showed cognate facilitation which corroborates with the literature (Detry et al., 2005; Lalor &
Kirsner, 2001; Roberts & Deslauriers, 1999). Cognate facilitation observed at the group level
for both BWA and BHA supports the language non-selective hypothesis that even when
bilinguals are speaking in one language; both languages are activated (Abutalebi & Green,
2007; Green, 1998). Regarding performance differences between languages, BWA showed no
cross-linguistic difference which is consistent with the findings in the aphasia literature
involving picture naming tasks (Detry et al., 2005; Roberts & Deslauriers, 1999). Comparable
cross-linguistic performance in the picture naming task involving cognate and non-cognates is
also consistent with the findings observed in Chapter 4 where BWA as a group did not show
any cross-linguistic difference on the verbal fluency task as well as on Croft’s materials.
However, cognate facilitation for both BHA and BWA in our study is in contrast with
studies where cognate facilitations were not observed (Boersma et al., 2016; Kurland &
Falcon, 2011; Tiwari & Krishnan, 2015; Verreyt et al., 2013). Boersma et al. (2016) tested
English-dominant, Welsh-dominant and balanced BHA on a picture naming task. They found
cognate interference for the English-dominant group in their non-dominant language and
cognate facilitation for the Welsh-dominant and balanced BHA in both languages. BHA
participants in the present study were balanced bilinguals. Therefore, findings from the
healthy adults of our study are in line with Boersma et al.’s study. Future research should look
into the different type of bilinguals regarding language combinations and proficiency to find
out the role of cognates in word production.
181
Kurland and Falcon (2011) found cognate interference when they tested a severe non-
fluent BWA on a picture naming task following an intensive semantic naming treatment.
They showed improved naming accuracy for non-cognates compared to cognates. Similarly,
Tiwari and Krisnan (2015) tested a self-reported balanced BWA on a picture naming task and
found naming difficulty in cognates. Verreyt et al. (2013) tested a non-fluent BWA on a
selective and generalised picture naming task. They did not observe cognate facilitation on the
selective picture naming where the task demand was higher compared to the generalised
naming task. These three studies tested only single participant. Therefore, we cannot
generalise their findings to our BWA group findings.
Individual analysis of BWA aimed to shed further light on whether individual patients
would show cognate interference or no cognate facilitation. Our individual level analysis
indeed supported the findings observed from the previously mentioned studies. Three out of 7
BWA did not show cognate facilitation, especially who were balanced BWA based on the
severity of aphasia in both languages and self-rated language proficiency (pre- and post-
stroke). Error analysis of BWA further provided valuable insight into the debate of cognate
facilitation vs no cognate facilitation. Error analysis revealed cognate interference for BWA,
but BHA showed cognate facilitation. Cognate interference for BWA are in agreement with
the notion that cognate words compared to non-cognates, face greater response conflict due to
larger feature overlap (Acheson et al., 2012). No cognate facilitation for BWA in our study
supports the findings of Verreyt et al. (2013) who attributed no cognate facilitation to greater
cross-linguistic competition when the task demand was higher. However, for healthy balanced
BHA, Broersma et al. (2016) found cognate facilitation. They attributed this facilitation to the
ability of balanced bilinguals to take advantage of the larger feature overlap at the
phonological level as the cross-linguistic competition is lesser compared to non-balanced

182
bilinguals. Therefore, findings from the error analysis involving the healthy adults of our
study are in line with Boersma et al.’s study.
Hence, the present study has provided evidence for cognate advantage as well as no
difference between cognates and non-cognates in BWA. The present study also signifies the
importance of including more number of patients, individual level analysis, and extensive
language background measures. Future studies may look into the cognate effects (facilitation
or not) involving different types of aphasia population regarding type (fluent vs non-fluent),
severity, nature of bilingualism (balanced vs unbalanced).
Correlation analysis from the present study provide further evidence of greater
competition faced by cognate words compared to non-cognates and the role of executive
control to resolve this competition. Both groups from the present study showed significant
correlations between the executive control components and picture naming variables.
Participants with better inhibitory control and mental-set shifting abilities showed lesser
cognate facilitation in their non-dominant language. This is the first study to investigate the
relationship between executive control abilities and cross-linguistic interference faced during
cognate word production in a group study involving BWA.
Verreyt et al. (2013) tested a French-Dutch BWA on a cognate picture naming task
(generalized and selective) and a flanker task. Verreyt et al. linked the poorer performance in
the flanker task with the cognate facilitation. Linck et al. (2008) tested healthy bilinguals and
found better inhibitory control in terms of smaller Simon effect leads to smaller cognate
facilitation. Present study confirms the role of executive control abilities in cognate word
production in both BWA and BHA population and extends the literature by including a range
of executive control measures. In addition to inhibitory control, we found mental-set shifting
abilities also mediate the performance difference between cognate word production and non-
cognate words production. Future studies should include different types of executive control

183
measures to further establish the role of executive control abilities during cognate word
production.
Overall, we found evidence of both cognate facilitation and interference for BWA
population in a picture naming task. Language proficiency and executive control abilities
modulated the cognate effects. Findings from the present study support the language non-
selective hypothesis and inhibitory control model of lexical access. The present study has
provided evidence of both cognate facilitation and interference, therefore therapy treatment
plan focusing only on cognate words should take into consideration of other factors such as
language proficiency, severity of aphasia, and executive control abilities of BWA.

184
Chapter 6: General Discussion
185
6.1 General Discussion
The overarching goal of this research project was to examine the contribution of linguistic and
executive control processes to word production in healthy monolinguals and bilinguals
(healthy and aphasia). This was explored in two phases: Phase I (Chapters 2 and 3) and II
(Chapters 4 and 5). The Phase I explored the differences between young healthy monolingual
and bilingual speakers residing in UK. These two groups of participants were matched on age,
years of education, and receptive vocabulary measures. All the participants performed two
linguistic experiments (verbal fluency, Chapter 2 and blocked-cyclic picture naming, Chapter
3) in English and three measures of executive control tasks (Stroop test, colour-shape switch
task, and backward digit span test). Bilingual participants were characterized in both
languages for the bilingualism related variables (acquisition history, language of instruction
during education, proficiency, usage, dominance, and language switching habits).
Phase II explored the word production impairments in both languages of bilinguals
with aphasia (BWA) and compared the differences with age-, gender-, education- and
language background- matched bilingual healthy adults (BHA). All BWA participants were
characterized comprehensively in both languages for the following variables: language
impairments (severity and type of aphasia); word production impairments across various
modalities (word-to-picture matching, naming, repetition, and reading); pre-and post-stroke
bilingualism characteristics (acquisition history, language of instruction during education,
proficiency, usage, and dominance). Both groups performed two linguistic experiments
(verbal fluency in Chapter 4, and picture naming involving cognates and non-cognates in
Chapter 5) in both languages and completed three executive control tasks (Stroop test, Trail
Making Test, and backward digit span test). Table 6.1 below summarises the main findings
from the four experimental studies.

186
Table6.1
Summary of all Experimental Chapters with their Research Questions, Methodology, and Results.
Chapter 2. Verbal fluency and executive control in healthy monolingual and bilingual speakers
Specific research questions Methods Results
To determine the relative contribution
of linguistic and executive control
processes during word production in
healthy monolingual and bilingual
speakers by using verbal fluency task.
Participants: 25 healthy young adult Bengali-
English bilinguals and 25 healthy young adult
English monolinguals. Groups were matched on age,
years of education, and receptive vocabulary.
Linguistic tasks: Verbal fluency tasks (semantic and
letter) in English
Variables: Quantitative: (number of correct
responses, fluency difference score), Time-course
(1st RT, sub-RT, initiation, slope), Qualitative
(cluster size, number of switches, within-cluster
pauses, between-cluster pauses)
Executive control measures: Inhibitory control
(Stroop test: Stroop ratio), Mental-set shifting
(colour-shape task switch: switch cost for accuracy
and RT), and working memory (backward digit span
test: backward digit span)
Linguistic tasks:
• Bilinguals outperformed monolinguals on measures where executive
control demands were higher such as number of correct responses in letter
fluency, fluency difference score, sub-RT, slope in letter fluency, cluster
size in letter fluency, and BCP in letter fluency.
• On the correlation analysis, bilinguals showed significant correlations
between inhibitory control (Stroop ratio) and verbal fluency slope.
Executive control measures: Bilinguals showed superior inhibitory control
(smaller Stroop ratio) compared to monolinguals. There was no difference on
switch cost RT between the two groups, but bilinguals performed significantly
better compared to monolinguals in terms of switch cost accuracy. Both groups
performed similarly on the working memory measure (backward digit span).
Chapter 3. Semantic contexts effects and executive control in healthy monolingual and bilingual speakers
Specific research questions Methods Results
To determine the relative contribution
of linguistic and executive control
processes during word production in
healthy monolingual and bilingual
speakers by using a paradigm where
executive control demands can be
varied from low to high.
Participants: Same as Chapter 2
Linguistic tasks: Blocked-cycling picture naming in
English
Variables: Context effect (RT difference between
the homogeneous and heterogeneous context) for all
cycles, excluding first presentation cycle, and
excluding cycle 2-4. Slope (changes in RT across
cycles)
Executive control measures: Same as Chapter 2
Linguistic tasks:
• Bilinguals showed lesser semantic context effect compared to
monolinguals
• On the first presentation cycle bilinguals showed semantic facilitation
• On the correlation analysis, we did not find any significant correlation
between any of the executive control measures with any of the blocked-
cyclic naming variables.

187
Chapter 4. Verbal fluency and executive control in bilingual aphasia (BWA) and bilingual healthy adults (BHA)
Specific research questions Methods Results
To determine the relative contribution
of linguistic and executive control
processes during word production in
bilinguals with aphasia and bilingual
healthy adults by using verbal fluency
task.
Participants: Eight Bengali-English BWA and eight
Bengali-English BHA. Both groups were matched
on age, sex, years of education and other
bilingualism related variables. All BWA speakers
sustained a single left hemisphere CVA and had
mild to moderate non-fluent type aphasia in both
languages.
Linguistic tasks: Verbal fluency tasks (semantic and
letter) in both languages.
Variables: Same as in Chapter 2.
Executive control measures: Inhibitory control
(Stroop test: Stroop ratio), mental set-shifting (Trail
Making Test: RT difference between trial B and A),
and working memory (backward digit span test:
backward digit span)
Linguistic tasks:
• Overall, BHA performed better compared to BWA group on both linguistic
(number of correct responses, 1st –RT, and initiation) and executive control
components of the task (fluency difference score, slope, number of
switches, and between-cluster pauses)
• BWA showed no cross-linguistic differences. BHA performed better in
their dominant language (Bengali) on the semantic fluency but on letter
fluency they performed better in English which was the medium of
instruction during education.
• Correlation analysis revealed significant relationship between executive
control and verbal fluency measures for BWA. BWA with better inhibitory
control and mental-set shifting abilities made more number of correct
responses, were faster to initiate the first response, had more linguistic
resources to begin with, and made more number of switches in the verbal
fluency tasks.
Executive control measures: BWA showed poorer inhibitory control (larger
Stroop ratio) and mental-set shifting (larger TMT difference) abilities compared
to BHA. However, both groups performed similarly on the working memory
measure (backward digit span)
Chapter 5. Cognate production and executive control in bilinguals with aphasia (BWA) and bilingual healthy adults (BHA)
Specific research questions Methods Results
To examine the cross-linguistic
interference/activation using a picture
naming task with cognates and non-
cognates in BWA and BHA. In
addition, we also aimed to investigate
whether the differential cognate/non-
cognate naming abilities were
influenced by their executive control.
Participants: Same as Chapter 4
Linguistic tasks: Picture naming tasks in both
languages (cognates and non-cognates) in both
languages.
Variables: Accuracy and RT for cognate and non-
cognate pictures
Executive control measures: Same as Chapter 4
• Both groups showed cognate facilitation at group level in terms of accuracy
and RT. However, individual analysis and error analysis revealed no
cognate advantage for balanced BWA.
• Correlation analysis revealed inhibitory control and mental-set shifting
abilities correlated significantly for both the groups with the accuracy
difference between cognate and non-cognate pictures. Better inhibitory
control and mental-set shifting abilities lead to lesser cognate facilitation in
both groups.

188
In the following section, we will discuss the summary and contribution of these
studies in terms of theoretical and clinical understanding of bilingual populations. The chapter
ends with the limitations of the current project and suggested future directions.
6.1.1 Review and Contribution from the Experimental Chapters
Previous studies have shown bilingual disadvantage in various linguistic tasks such as picture
naming (Roberts et al., 2002; Gollan et al., 2005), verbal fluency (Rosselli et al, 2000), lexical
decision tasks (Ransdell & Fischler, 1987), word identification through noise task (Rogers et
al., 2006), etc. There are various explanations in the literature to account for the bilingual
disadvantage in the linguistic domain. According to the weaker link hypothesis, the reason for
bilingual disadvantage in the linguistic domain is the lesser usage of each language of a
bilingual speaker resulting in weaker link between the two languages (Michael & Gollan,
2005). Sensorymotor account (Hernandez & Lee, 2007) attribute the bilingual disadvantage to
the delay in age of acquisition of the second language.
As can been seen from Figure 1.2 (Chapter 1), bilinguals face greater lexical
competition compared to monolinguals as both languages are active during language
processing (Costa & Caramazza, 1999) and the poorer performance in the linguistic domain
can be attributed to this increased lexical competition (Inhibitory control model, Green,
1998). Consequently, bilinguals have to inhibit one language while speaking another
language and this exercise of inhibition reflects bilingual’s superiority in non-linguistic
executive control tasks over monolinguals (Bialystok, 2009). For Phase I, we formulated our
hypothesis from these theoretical accounts (weaker link hypothesis, inhibitory control model)
described earlier. Bilingual participants from Phase I were matched in vocabulary with the
monolingual group. Further, bilingual participants in Phase I used English in their day-to-day
life more often than Bengali. We predicted that controlling for these factors (vocabulary and
usage), bilingual would be able to perform at par with the monolinguals if bilinguals can

189
resolve their increased cros-linguistic competition with the help of their executive control
mechanisms. Further bilingual’s advantage in the non-linguistic domain is relatively well
establised (Bilaystok, 2009). Therefore, it might be possible to extend the bilingual’s
superiority in the non-linguistic domain to the linguistic domain if both language vocabulary
and usage can be controlled for and the chosen linguistic task require higher executive control
processing. To test this hypothesis, in Phase I, we chose a task (verbal fluency) and a
paradigm (blocked-cyclic naming) where executive control demands can be manipulated
(e.g., greater executive demand in letter fluency). As expected, in both the linguistic tasks,
bilinguals outperform the monolinguals where executive control demands were higher (e.g.,
greater number of CR in the letter fluency, smaller FDS score, lesser blocking effect in
blocked-cyclic naming, etc.), and bilinguals performed at par with the monolinguals where
executive control demands were comparatively lesser (e.g., no difference in CR for the
semantic fluency). In addition, correlation analysis from the present study further supported
the statement above (significant positive correlations between Stroop ratio and verbal fluency
slope for bilinguals).
Therefore, bilingual disadvantage in the linguistic domain could be negated if
vocabulary and language usage are controlled for. Also, bilingual advantage in the non-
linguistic domain can be extended to the linguistic domain if the linguistic tasks were made
more challenging by increasing the executive control demands. In Phase I, we provided
evidence for bilingual advantage in the linguistic domain and the relationship between
linguistic and executive control mechanism during word production. Our findings support the
theoretical models which explain bilingual disadvantage in linguistic domain (Michael &
Gollan, 2005) and advantage in the non-verbal executive control domain (Bialystok, 2009;
Green, 1998). However, to explain our findings there is a need of an integrative model which
would take contribution of executive control mechanisms in linguistic domain into

190
consideration. Future studies may consider exploring the relationship between linguistic and
executive control mechanism at various linguistic levels (lexical level, phonological level,
etc.) and coming up with a theoretical model which could explain the bilingual advantage in
the linguistic domain by taking executive control mechanisms into consideration.
In Phase II, we aimed to extend our understanding of the relationship between the
linguistic and executive control mechanisms from healthy bilinguals to bilinguals with
aphasia. In contrast to research on linguistic and executive control processes in healthy
bilinguals, studies investigating linguistic manifestation of a breakdown in the two languages
in BWA are limited (see Kiran & Gray, 2018 for a review). We described the nature and
extent of language breakdown following a stroke in bilingual individuals. We also
investigated whether bilingualism related variables (pre- and post-stroke) and executive
control profile of individuals could explain the linguistic manifestation of a breakdown in the
two languages in BWA.
As expected, we found evidence of linguistic and executive control impairments at the
group level for BWA individuals. Similar to the monolingual group in Phase I, we found
BWA had more difficulty in the linguistic tasks where executive control demands were higher
(e.g., larger FDS, fewer number of switches, longer BCP). However, the underlying executive
control deficits in the linguistic tasks may not be visible with the usual analysis techniques
(e.g., number of CR). Therefore, we argued in favour of including a more fine-grained
analysis of linguistic tasks. In terms of cross-linguistic impairment, our results showed similar
impairment in both the languages and the post-stroke language ability (e.g. better
performance in Bengali) mirrored their pre-stroke language ability (Bengali dominant). In
both (verbal fluency and cognate/non-cognate picture naming) the linguistic tasks, we found
strong evidence of executive control involvement that is BWA who performed poorly in the
executive control measures also performed poorly in the linguistic tasks.

191
Findings from the linguistic tasks revealed that despite showing deficits in lexical
access, BWA still mirrored the BHA in terms of the underlying language processing
mechanism which is required to perform in the linguistic tasks. For example, BWA showed
similar clustering strategy as BHA while generating items in the verbal fluency task. Like
BHA, BWA showed cognate facilitation at the group levels.
Executive control impairment was evident across the inhibitory control and task
switching domain, however not all the BWA individuals showed executive control
impairment across the two measures. Individuals with more severe aphasia showed poorer
executive control abilities, as expected. However, we did not have site of lesion information
to support our claim for the relationship between extent of lesion/or severity and the
executive control impairments. Future studies may consider investigating the relationship
between the extent of lesion/or severity and executive control impairment.
In the following section, we provide summary of results from each experimental
chapter and the implications.
In Chapter 2, verbal fluency task investigated the relative contribution of linguistic
and executive control processes during word production using a wide range of variables
(quantitative, time-course, and qualitative), a relatively homogeneous group of bilinguals
(i.e., all were Bengali-English, equally proficient and dominant in both languages), and
separate measures of executive control. Previous studies comparing healthy monolinguals and
bilinguals on verbal fluency tasks have shown mixed results ranging from bilingual advantage
(Bialystok et al., 2008; Luo et al., 2010) to disadvantage (Gollan et al., 2002; Paap et al.,
2017) to no differences (Paap et al., 2017). Nevertheless, all these studies have relied only on
the number of correct responses as a dependent variable (except Luo et al., 2010). For
example, Paap et al (2017) did not find any difference between bilinguals and monolinguals
on the difficult letter fluency condition. The results were inconsistent with the notion of

192
bilingual’s enhanced executive control abilities help them to outperform monolinguals on the
more demanding letter fluency condition. Paap et al. also refuted the claim that compared to
semantic fluency, letter fluency requires greater executive control functioning and suggested
to support this claim by independent and direct tests of executive control abilities. Similarly,
Whiteside et al. (2016) in an exploratory factor analysis study have argued that the
contributions of linguistic processes are greater in verbal fluency compared to executive
control processes. They found number of correct responses in the verbal fluency loaded onto
the language factor only and not the executive control factor. The Chapter 2 addressed these
irregularities in the literature by including a wide range of variables and separate measures of
executive control abilities. We found that vocabulary matched healthy bilinguals performed
similarly to monolinguals in semantic fluency, which are thought to have higher linguistic
demands. However, bilinguals outperformed the monolinguals in the difficult letter fluency
task which are assumed to have higher executive control demands. Differences between the
two groups were observed only on the variables where executive control demands were
higher such as, number of CR in the letter fluency, fluency difference score, slope, cluster
size, and BCP in the letter fluency. Independent executive control measures (Stroop ratio)
correlated only for the variable (slope) that tapped into executive control component of the
verbal fluency task.
Importantly, traditional analysis approaches (e.g. number of correct responses) would
not have revealed this pattern of results. Both Paap et al. and Whiteside et al.’s study argued
against the fact that letter fluency condition requires greater executive control demands,
however their claim was made based on only number of correct responses as a variable.
When a broad range of variables and separate executive control measures were included, we
found evidence of executive control involvement in the letter fluency condition. Present study
found differences between bilingual and monolingual groups mainly where the executive

193
control demands were higher. We found bilinguals are not at a disadvantage on linguistics
measures if matched for vocabulary. Present study highlights that to explain advantage,
disadvantage, and no differences between bilinguals and monolinguals, it is necessary to use a
range of verbal fluency variables and independent executive control measures.
In Chapter 3, we tested both the same monolingual and bilingual healthy adult groups
on blocked-cyclic picture naming task to test how increasing or decreasing lexical
competition affects their picture naming abilities. To the best of our knowledge, this is the
first study to investigate the lexical competitions in bilinguals compared to monolinguals
using experimental paradigm of blocked-cyclic naming. This manipulation allowed testing
how bilinguals manage their two lexical systems and how their executive control mechanisms
resolve this competition. We have argued in Chapter 1 (pp. 15-16) that three possible
conditions that can arise while comparing bilinguals and monolinguals on the blocked-cyclic
naming task:
Condition 1: Compared to monolinguals, bilingual’s executive control advantage
outweighs the bilingual’s increased lexical competition (disadvantage). Therefore, bilinguals
will have lesser semantic context effect than monolinguals.
Condition 2: Compared to monolinguals, bilingual’s increased lexical competition
(disadvantage) outweighs the bilingual’s executive control advantage. Therefore, bilinguals
will have greater semantic context effect than monolinguals.
Condition 3: Bilingual’s increased lexical competition (disadvantage) and the
executive control advantage are of similar magnitude. Therefore, both groups will have
comparable semantic context effects.
We found bilinguals had lesser semantic interference (i.e., lesser semantic context
effect) compared to monolinguals and only bilinguals showed semantic facilitation in the first
cycle. Lesser semantic context effect for bilinguals supports the claim that bilinguals’ better

194
executive control helped them to overcome their disadvantage of having increased lexical
competition (within-language and between-language competition). Absence of semantic
facilitation in the first cycle for monolinguals is consistent with the literature when
homogeneous and heterogeneous sets were presented in alternative manner as in the present
study (see Belke, 2017 for a review). Belke (2017) observed that semantic facilitation in
monolinguals were reported in studies where stimuli sets were presented in a blocked fashion
and participants could use their executive control to bias their responses. However, semantic
facilitation for bilinguals even when sets were presented in an alternated manner can be
attributed to the superior executive control in bilinguals which helped them to bias their
responses.
Overall, both studies from Phase I found evidence of bilingual advantage in linguistic
domain where executive control demands were higher, and on separate executive control
measures, especially on inhibitory control. We also showed that inhibitory control measure
was correlated with certain variables of the linguistic measures (slope of verbal fluency),
especially where task demands were higher.
Phase II explored the linguistic breakdown in BWA and compared the differences
with BHA using verbal fluency and picture naming task involving cognates and non-cognates
words. The results of Phase II make significant contribution to the bilingual aphasia literature.
We present very well characterized bilingual aphasia participants on their background
language abilities (see Section 4.4.2, Chapter 4), relatively homogenous group of non-fluent
aphasia, cross-linguistic comparison, individual and group level analysis and research in a
language combination (i.e., Bengali-English) where only handful of studies exist (see
Beveridge & Bak, 2011). We also explained the linguistic impairments of BWA in terms of
their executive control abilities by administering separate measures of executive control tasks.

195
In the verbal fluency task, we found that BWA had difficulty in both the linguistic and
executive control component of the verbal fluency task; however, the impairment was greater
where executive control demands were higher. Correlation analysis provided further support
to the role of executive control abilities in verbal fluency performance. Independent executive
control measures were correlated with the verbal fluency measures where task demands were
higher, especially for BWA. Similar to Chapter 2, this research highlights the importance of
using a full range of verbal fluency measures to tap into the linguistic as well as executive
control abilities of BWA. This is also the first study to address how the executive control
abilities mediated the verbal fluency performance differences between BWA and BHA. This
type of evidence is currently lacking in the literature.
In Chapter 5, we found cognate facilitation for both BWA and bilingual healthy adults
(BHA) at the group level. BWA performed similarly in both languages despite showing
differences in their pre-morbid language abilities. At the individual level analysis of BWA,
we found inhibitory effect for cognates especially for balanced BWA and individuals with
better inhibitory control abilities showed lesser cognate facilitation. Previous studies have
shown both cognate facilitation (Detry et al., 2005; Roberts & Deslauriers, 1999; Kohnert,
2004) and inhibition (Broersma et al., 2016; Kurland & Falcon, 2011; Tiwari & Krishnan,
2015) in bilinguals (healthy and aphasia). Most of the studies involving BWA were of
individual case studies and had participants mostly from Germanic (English) and Romance
(Spanish, Italian, French) language families (except Tiwari & Krishnan, 2015 who tested two
Dravidian languages). Previous studies have argued the role of executive control abilities in
cognate production but there are no studies involving BWA which have linked the role of
executive control in cognate word production. This is the first study to investigate the lexical
activation/competition process in two different language combinations that is Bengali (Indo-
Aryan) and English (Germanic) and to link the lexical activation/competition processes with

196
separate executive control measures. These findings highlight the importance of including
detailed language background measures, individual and group level analysis and separate
executive control measures before focusing therapeutic treatment on shared structure of
language (cognates).
Overall, both studies from Phase II provide evidence of linguistic impairments in
BWA in both their languages and these impairments were manifested by their executive
control impairments. The present study emphasises the importance of characterising the
BWA participants in terms of their linguistic impairments in both languages, bilingualism
related variables, separate linguistic and executive control measures and involved analysis
approaches.
6.1.2 Study Limitations and Future Directions
6.1.2.1 Participants groups and characteristics. In Phase I, bilingual participants
were highly proficient in both languages and high skilled immigrants which can be a reason
of bilingual advantage in executive control measures (Paap et al., 2015). However, previous
studies have shown advantageous effect of bilingualism irrespective of the immigration status
(Alladi et al., 2013). In addition, we matched both the groups on non-verbal intelligence
measure and number of years of education. Bilingual healthy adults from Phase II who were
non-immigrant bilinguals residing in India also showed evidence of executive control
involvement while performing linguistic tasks. Taken all these factors into account, we do not
expect immigration status of our bilinguals (Phase I) was a confounding factor for the
bilingual advantage. Another variable that would have better characterized the bilingual
participants in our project was the nature of code-switching (mixing of languages) in day-to-
day life. Recent studies have shown that bilinguals with different code-switching habits
showed different executive control abilities (Hofweber, Marinis, Treffers-Daller, 2016).
Though we reported the language switching habits of our bilingual participants in Phase I, but

197
we did not consider their code-switching abilities and how that can be related to the
performance differences in the linguistic and executive control domains. Future studies might
consider examining the different aspects of bilingual experience such code-switching to
inform the debate on bilingual “advantage” in executive control.
Both the groups in Phase I performed almost at the ceiling level in the objective
vocabulary tasks (BPVS III and OPT). Based on the tests results from these vocabulary
measures, we should be careful to claim that both groups were matched on vocabulary. Future
studies may consider taking a more challenging vocabulary task to describe the vocabulary
knowledge of the experimental groups. Another limitation of the present project was that both
the vocabulary tasks were receptive in nature and the experimental tasks were expressive.
Therefore, future studies should take expressive vocabulary tasks into consideration while
characterizing and matching the bilingual population with the monolingual group.
Due to cultural differences, we did not compare bilinguals from Phase II with the
monolinguals and bilinguals from Phase I. The debate on monolinguals vs bilinguals could be
extended by testing BWA vs. monolinguals with aphasia (MWA). In Phase II, we could not
compare our results with MWA as bilingualism is the norm in a country like India (Bak &
Alladi, 2014). Future studies should consider investigating the bilingualism debate from the
clinical perspective by comparing BWA vs MWA across various linguistic and executive
control domains.
In Phase I, we tested 25 participants in each group. Paap, Johnson, and Sawi (2015)
argued that small sample size (n < 30) could be a confounding factor for studies showing
bilingual advantage. We acknowledge that it was difficult to recruit relatively homogeneous
bilinguals from England who were matched on the languages they speak (all bilingual
participants were Bengali-English speakers), proficiency, age, education, non-verbal
intelligence, gender and other bilingualism related factors. Future studies should aim to

198
replicate the present findings with large sample size to provide further support for the
findings reported in the present project. Similarly, in Phase II, we recruited eight BWA
participants, therefore caution must be taken while interpreting and generalizing the findings
from the present study. One possibility for future studies would be to replicate the present
findings with a large sample of BWA population to provide further support to our findings.
However, the project involved an extensive background test battery along with several
experimental tasks and executive control measures. Our focus was to recruit BWA
participants who would be as homogeneous as possible in terms of aphasia type and severity,
language combinations, educational background, and background language profile.
Therefore, recruitment of relatively homogeneous group of BWA participants provided an
advantage in terms of robustness of the findings.
As mentioned in Chapter 1, according to Beveridge and Bak, research on aphasia can
only make a significant contribution to the debate on language universals vs language
variation if we consider testing participants from different language families. Present study
made an effort to address this issue. Future studies might consider providing further insight
into the debate on language universals vs language variation by including participants from
other Indian language families, such as Dravidian language family (Tamil, Kannada) or other
languages from the same Indo-Aryan family (Hindi, Assamese, Punjabi).
In Phase II, our findings were based on relatively homogeneous group of aphasia
participants that is all of them were non-fluent aphasia with mild to moderate level of severity
in both languages. Therefore, we cannot generalize our findings to participants with different
type and severity of aphasia. Systematic investigation of other types and severity of aphasia
would provide would provide further insight into the effect of bilingualism and neurological
status on linguistic and executive control processes. For example, we found verbal fluency to
be an effective measure when full range of variables were considered for understanding the

199
linguistic and executive control impairments in non-fluent aphasia. Future studies with
different types of neurological population would provide diagnostic validity of the task to
other populations.
We could not get the exact details about the neurological profile of our BWA
participants (medical scan reports for the site and extent of lesion) and therefore could not
relate our findings with the nature and site of lesion. Though this was not the aim of our
project, but future studies may consider investigating the effect of lesion status (site and
extent) on linguistic and executive control measures.
6.1.2.2 Experimental tasks. We had three experimental tasks (verbal fluency,
blocked-cyclic picture naming, and picture naming task involving cognates and non-cognates)
to investigate the interaction of linguistic and executive control processes in bilingual
(healthy and aphasia) speakers. All these tasks were simple yet powerful tasks to investigate
the research question of the present study, but they were at the level of single word
production. In Phase I, we found evidence of bilingual advantage in linguistic tasks at the
single word level where executive control processes were involved. Future studies should
consider moving beyond single word production to connected speech and more naturalistic
linguistic paradigms, such as analyzing various aspects of conversational speech (code-
switching), and narratives. A possible extension of the present study would be to look at the
performance differences in a linguistic task at the sentence level between bilinguals and
monolinguals and whether these differences between the two groups can be explained by their
executive control abilities. The results will provide further understanding of the bilingual
language processing in more naturalistic context. In Phase II, we found evidence of linguistic
impairments in both languages at the single word level. Investigation of the cross-linguistic
impairments at the sentence level would provide further insight to the effect of neurological
impairment (aphasia) on linguistic processing in bilinguals. Further, we found evidence of

200
executive control involvements in linguistic impairments at the single word level. Based on
these results, we highlighted the importance of assessing executive control abilities in BWA
population. Involvement of executive control abilities at the sentence level would provide
further support to this claim and will provide valuable information for designing appropriate
assessment and treatment protocols.
6.1.2.3 Executive control tasks. Present research included only one task of executive
control for each domain (inhibition: Stroop test, mental-set shifting: colour-shape switch task
in Phase I and TMT in Phase II, and working memory: backward digit span), restricting the
convergent validity for the present findings. Shao et al (2014) found mental-set shifting
abilities (operation span task) to correlate with the number of correct responses in both
semantic and letter fluency condition for healthy speakers. However, we did not find any
relationship between the number of correct responses and any of the executive control
measures for the healthy participants. Therefore, including a broad range of executive control
measures in future would provide greater insights into the relationship between linguistic and
executive control processes in healthy bilinguals as well as in BWA.
Nigg (2000) reported four different types of inhibitory control mechanism, such as
interference control (Stroop task, Flanker task), cognitive interference (negative priming),
behavioural inhibition (go/no-go task), and oculomotor inhibition (anti-saccade tasks). We
tested the inhibitory control abilities of our participants by administering verbal Stroop test
which measured the interference control or the ability to suppress the interference from the
non-target stimuli. We chose the Stroop test which was more closely linked to the type of
executive control abilities required in our experimental linguistic measures. However, future
studies might consider exploring the involvement of different types of inhibitory control
mechanism to explain the differences in performances in these populations. All of our
executive control tasks (except colour-shape switch task) were verbal in nature which might

201
be a reason of significant correlation with the different variables of experimental linguistic
measures. However, we did not any significant correlation between the executive control
measures and the objective vocabulary measures. Future studies should consider investigating
the role of non-linguistic executive control tasks to inform the linguistic and executive control
processing in bilinguals. Conducting such studies will provide valuable information regarding
executive control impairments in BWA in the linguistic and non-linguistic domains.
6.1.3 Conclusion
This research systematically investigated the relationship between linguistic and executive
control measures in bilingual population using different type of linguistic tasks, broad range
of variables, different participant groups, different analysis approaches, and separate
executive control tasks. Results of this study provide critical understanding of the nature of
linguistic and executive control processing in bilingual population (healthy and aphasia).
First, the findings confirmed the relationship between linguistic and executive control
measures. Second, we highlighted the importance of using simple yet powerful linguistic
tasks with broad range of variables, detailed characterisation of bilingual participants, detailed
characterisation of aphasia in both languages, and using separate executive control measures
to explain the differences in linguistic and executive control abilities in healthy bilinguals as
well as in BWA. Third, in terms of linguistic factors, language proficiency, usage, and
instruction of educations showed greater impact on the performance differences between
groups. In terms of executive control factors, inhibitory control showed greater impact on the
performance differences between groups.
This project has improved our understanding of the language processing and
impairments in an Indian language (Bengali) which is underreported in the literature
(Beveridge & Bak, 2011) despite having a large number of speakers in this world (180.5
million speakers, Ethnologue: Languages of the World, 2005).

202
Appendices

203
Appendix 2.1. Example of an Information Sheet and Consent Form
Supervisor:
Dr Arpita Bose
Email: [email protected]
Phone: +44 (0)118 378 6105
PhD Student:
Abhijeet Patra
Tel: +44-118-378-6573
Email: [email protected]
INFORMATION SHEET
Title: Word production in bilingual speakers: effect of linguistic context and cognitive
control
This research is investigating how word production is affected by linguistic context (For
example, if we see pictures that all belong to the same category e.g. animals - cat, dog, tiger
etc., it might be harder to name them than naming pictures from different category) and
cognitive control (a mechanism which controls the operation of various processes like
memory, thinking etc) in monolingual and bilingual speakers. This research will inform us
what helps people to produce words more correctly. This information will help us to
understand the mechanism of word production in monolingual and bilingual speakers.
We will be glad to involve you in this research as a participant. This research will use a
simple language assessment of naming pictures, reading words or repeating words presented
on a laptop screen. The testing may take 2-3 one-hour sessions to complete and will be
scheduled on different days depending on your availability. We will ensure that frequent
breaks are provided during testing to avoid fatigue and frustration, and if needed a session can
be stopped and resumed on a later date.
Participant’s data will be kept confidential and securely stored, with only a number attached
to each participant, and therefore it will not be possible to link any set of data with any
individual. All information collected for the project will be destroyed after five years in
accordance with the University’s procedures.
Your participation in this experiment is completely voluntary. You may withdraw at any time
without giving any reason. This application has been reviewed by the University Research
Ethics Committee and has been given a favourable ethical opinion for conduct.
Thank you for your help.
Faculty of Life Sciences
School of Psychology and Clinical Language
Sciences
Department of Clinical Language Sciences
University of Reading
Psychology Building
Earley Gate
Reading RG6 6AL

204
Consent Form
I, ……………………………………… agree to take part in this study. It is about how
monolingual and bilingual speakers name pictures and what helps them to name pictures
easily. It is being carried out by Mr. Abhijeet Patra and Dr. Arpita Bose at The University of
Reading.
• I have seen and read a copy of the Participant’s Information Sheet
• I was able to ask questions about the study. They have been answered.
• I understand that personal information is confidential and only a number will identify my
data.
• I understand that the whole study will take 2-3 one-hour sessions to complete.
• I know the information will be stored in secure locked cabinets.
• I know the information will be kept for five years.
• I understand that taking part in this study is voluntary.
• I can withdraw at any time without having to give an explanation.
• I am happy to participate.
Signature ------------------------------------------------------------
Name (in capitals) -------------------------------------------------------------
Date ---------------------------------------------

205
Appendix 2.2. Language Background Questionnaire
a. Language Acquisition History
SCALE:
1. Spoke mostly Bengali
2. Spoke both English and Bengali in a single context
3. Spoke mostly English
LANGUAGE ACQUISITION
AS A CHILD:
What language did you speak at home? 1 2 3
What language was spoken mostly by others at home? 1 2 3
What other language did you speak at home? 1 2 3
What was your father’s native language? 1 2 3
What other language did he speak? 1 2 3
What language did he speak to you most often? 1 2 3
What language did you speak with him? 1 2 3
What other language did your mother speak at home? 1 2 3
What was your mother’s native language? 1 2 3
What other language did she speak? 1 2 3

206
What language did she speak to you most often? 1 2 3
What language did you speak to her most often? 1 2 3
What language did you speak with your siblings? 1 2 3
Did anyone else take care of you? YES NO
What was his/her native language? 1 2 3
What language did he/she speak to you most often? 1 2 3
What other language did your he/she speak at home? 1 2 3
What language did you speak with the relatives you saw most often? 1 2 3
What language did you speak most with friends? 1 2 3
Which language did you prefer to speak? 1 2 3
Did you take Bengali classes? YES NO
If so, which grades?
How many years?

207
b. Educational History
How many years of education did you have?
LESS THAN 6 6 TO 9 9 TO 12 SOME COLLEGE COLLEGE
What was the language:
IN ELEMENTARY? 1 2 3
IN HIGH SCHOOL? 1 2 3
IN COLLEGE? 1 2 3
What language did the other students speak:
IN ELEMENTARY 1 2 3
IN HIGH SCHOOL 1 2 3
IN COLLEGE 1 2 3
Which language did you prefer to speak:
IN ELEMENTARY 1 2 3
IN HIGH SCHOOL 1 2 3
IN COLLEGE 1 2 3
Were you taught in any other languages? YES NO
If so, which languages
At what age did you first learn English?
How did you learn English?

208
c. Language Proficiency Rating
Please rate your language proficiency ability based on the following scale (1 = nonfluent, 7 =
native fluency)
L1_________________
Nonfluent Native
fluency
Speaking in casual conversation 1 2 3 4 5 6 7
Listening in casual conversation 1 2 3 4 5 6 7
Speaking in formal situation 1 2 3 4 5 6 7
Listening in formal situation 1 2 3 4 5 6 7
Reading 1 2 3 4 5 6 7
Writing 1 2 3 4 5 6 7
L2_________________
Nonfluent Native
fluency
Speaking in casual conversation 1 2 3 4 5 6 7
Listening in casual conversation 1 2 3 4 5 6 7
Speaking in formal situation 1 2 3 4 5 6 7
Listening in formal situation 1 2 3 4 5 6 7
Reading 1 2 3 4 5 6 7
Writing 1 2 3 4 5 6 7

209
d. Language Use
Describe the language(s) you use in conversations with the following people and in the
following contexts. Circle the number that best represents your language use with the
individuals or in the context indicated.
SCALE:
1 Speak mostly your first language (BENGALI)
2 Speak both ENGLISH and your first language (BENGALI)
3 Speak mostly ENGLISH
LANGUAGE USE—PEOPLE
spouse 1 2 3
children:
________________ 1 2 3
________________ 1 2 3
________________ 1 2 3
________________ 1 2 3
________________ 1 2 3
________________ 1 2 3
grandchildren:
_________________ 1 2 3
_________________ 1 2 3
brothers/sisters:
________________ 1 2 3
________________ 1 2 3
________________ 1 2 3
________________ 1 2 3

210
________________ 1 2 3
________________ 1 2 4
other relatives:
________________ 1 2 3
________________ 1 2 3
________________ 1 2 3
________________ 1 2 3
friends:
________________ 1 2 3
________________ 1 2 3
________________ 1 2 3
________________ 1 2 3
co-workers
________________ 1 2 3
________________ 1 2 3
________________ 1 2 3
________________ 1 2 3
LANGUAGE USE-- SITUATIONS
at home 1 2 3
at work 1 2 3
grocery store 1 2 3
bank 1 2 3
church/ synagogue 1 2 3

211
clubs 1 2 3
shopping 1 2 3
reading for pleasure 1 2 3
writing for pleasure 1 2 3
reading for work/school 1 2 3
writing for work/school 1 2 3
watching television 1 2 3
when listening to the radio 1 2 3
other
________________ 1 2 3
________________ 1 2 3
________________ 1 2 3
LANGUAGE USE—CONTENT
expressing emotion 1 2 3
discussing the news 1 2 3
discussing the past 1 2 3
discussing work 1 2 3

212
discussing family 1 2 3
discussing hobbies 1 2 3
discussing coursework 1 2 3
other
________________ 1 2 3
________________ 1 2 3
________________ 1 2 3
Which language, if any, would you are most comfortable using? Why?
How has your language use patterns changed in the last five years?
What language do you hear most frequently?

213
e. Bilingual Language Dominance Questionnaire
Please answer the following questions to the best of your knowledge.
1. At which age did you first learn these languages (please tick the correct one):
Language 0-5
years
6-9
years
10-15
years
16
years
and
above
Bengali
English
2. At which age did you feel comfortable speaking these languages:
Language 0-5
years
6-9
years
10-15
years
16
years
and
above
Bengali
English
3. Which language do you predominantly use at home?
Bengali ____
English ____
Both ______
4. When doing maths in your head which language do you calculate the numbers in?
Bengali ___
English ___
Both ____
5. If you have a foreign accent, which language (s) is it in?
________________________________
6. If you had to choose which language to use for the rest of your life, which language
would it be?
_________________________________
7. How many years of schooling did you have in:

214
Bengali ______
English ______
8. Do you feel that you have lost any fluency in a particular language?
If yes, which one ___________________
9. What country/ region do you currently live in?
___________________________________

215
f. Language Switching Questionnaire
Please answer the following questions to the best of your knowledge.
1. I do not remember or I cannot recall some Bengali words when I am speaking in Bengali
(please tick as appropriate)
__ never, __ very infrequently, __ occasionally, __ frequently, __ always
2. I do not remember or I cannot recall some English words when I am speaking in English
(please tick as appropriate)
__ never, __ very infrequently, __ occasionally, __ frequently, __ always
3. I tend to switch between languages during a conversation (please tick as appropriate)
__ never, __ very infrequently, __ occasionally, __ frequently, __ always
4. When I cannot recall a word in Bengali, I tend to immediately produce it in English
(please tick as appropriate)
__ never, __ very infrequently, __ occasionally, __ frequently, __ always
5. When I cannot recall a word in English, I tend to immediately produce it in Bengali
(please tick as appropriate)
__ never, __ very infrequently, __ occasionally, __ frequently, __ always
6. I do not recall when I switch between languages during a conversation or when I mix the
two languages; I often realize it only if I am informed of the switch by another person
(please tick as appropriate)
__ never, __ very infrequently, __ occasionally, __ frequently, __ always
7. When I switch languages, I do it consciously (please tick as appropriate)
__ never, __ very infrequently, __ occasionally, __ frequently, __ always
8. It is difficult for me to control the language switch I introduce during a conversation
(please tick as appropriate)
__ never, __ very infrequently, __ occasionally, __ frequently, __ always
9. Without intending to, I sometimes produce the Bengali word faster when I am speaking in
English (please tick as appropriate)
__ never, __ very infrequently, __ occasionally, __ frequently, __ always
10. Without intending to, I sometimes produce the Bengali word faster when I am speaking
in English (please tick as appropriate)
__ never, __ very infrequently, __ occasionally, __ frequently, __ always
11. There are situations in which I always switch between the two languages (please tick as
appropriate)
__ never, __ very infrequently, __ occasionally, __ frequently, __ always

216
12. There are certain topics or issues for which I normally switch between the two languages
(please tick as appropriate)
__ never, __ very infrequently, __ occasionally, __ frequently, __ always

217
Appendix 2.3. Stroop Ratio Calculation Example
Neutral
(RT in msec)
Incongruent
(RT in
msec)
Overall
mean
latency
(Incongruent +
Neutral) ÷ 2
Stroop ratio in
percentage
(Stroop
difference ÷
Overall mean
latency) ×
100
Example
1
400 800 (800+400)
÷2 = 600
(400÷600) ×
100
= 66.67
Example
2
800 1200 (1200+800)
÷2 = 1000
(400 ÷ 1000)
× 100 = 40

218
Appendix 2.4. Subcategory Classification for the Semantic and Letter Fluency
1. Semantic Fluency
a. Animal
Africa: aardvark, antelope, buffalo, camel, chameleon, cheetah, chimpanzee, cobra, eland,
elephant, gazelle, giraffe, gnu, gorilla, hippopotamus, hyena, impala, jackal, lemur, leopard,
lion, manatee, mongoose, monkey, ostrich, panther, rhinoceros, tiger, wildebeest, warthog,
zebra
Australia: emu, kangaroo, kiwi, opossum, platypus, Tasmanian devil, wallaby, wombat, koala
bear
Arctic/ Far North: auk, caribou, musk ox, penguin, polar bear, reindeer, seal
Farm: chicken, cow, donkey, ferret, goat, horse, mule, pig, sheep, turkey
North America: badger, bear, beaver, bobcat, caribou, chipmunk, cougar, deer, elk, fox,
moose, mountain lion, puma, rabbit, raccoon, skunk, squirrel, wolf
Aquatic animal: alligator, auk, beaver, crocodile, dolphin, fish, frog, lobster, manatee,
muskrat, newt, octopus, otter, oyster, penguin, platypus, salamander, sea lion, seal, shark,
toad, turtle, whale
Marine fish: gold fish, lion fish, clown fish
Beasts of Burden: camel, donkey, horse, llama, ox, bull, alpaca, cow
Fur: beaver, chinchilla, fox, mink, rabbit
Pets: budgie, canary, cat, dog, gerbil, golden retrieval, guinea pig, hamster, parrot, rabbit
Arboreal: panda, sloth, bear, red panda, monkey, koala bear

219
Bird: budgie, condor, eagle, finch, kiwi, macaw, parrot, parakeet, pelican, penguin, robin,
toucan, woodpecker, hawk
Big cats: cheetah, cougar, jaguar, leopard, lion, snow leopard, tiger
Anthropoids: spider
Flightless birds: ostrich, emu, kiwi, penguin
Aquatic birds: duck, goose, swan
Small birds: sparrow, pigeons,
Big birds: flamingo, ostrich, vulture, peacock
Bovine: bison, buffalo, cow, musk ox, yak, bull
Canine: coyote, dog, fox, hyena, jackal, wolf
Deer: antelope, caribou, eland, elk, gazelle, gnu, impala, moose, reindeer, wildebeest
Feline: bobcat, cat, cheetah, cougar, jaguar, leopard, lion, lynx, mountain lion, ocelot,
panther, puma, tiger
Fish: bass, guppy, salmon, trout, barracuda
Insect: ant, beetle, cockroach, flea, fly, praying mantis, termite
Insectivores: aardvark, anteater, hedgehog, mole, shrew
Mollusc: slug, snail,
Primate: ape, baboon, chimpanzee, gibbon, gorilla, human, lemur, marmoset, monkey, orang-
utan, shrew
Rabbit: Coney, hare, pika, rabbit

220
Reptile/ Amphibian: alligator, chameleon, crocodile, frog, gecko, iguana, lizard, newt,
salamander, snake, toad, tortoise, turtle
Rodent: beaver, chinchilla, chipmunk, gerbil, gopher, ground hog, guinea pig, hedgehog,
marmot, mole, mouse, muskrat, porcupine, rat, squirrel, woodchuck
Young animals: kitten, cubs
Weasel: badger, ferret, marten, mink, mongoose, otter, polecat, skunk, meerkat
Xenarthral: anteaters, armadillo, sloths
Occurs together: cat, mouse; snake, mongoose; horse, elephant; tiger, bear;
Winged mammals: Bat
Extinct animals: Dinosaur
b. Fruits and Vegetables
Tree fruits: apple, pear, apricot, peach, plum, nectarine, damson, cherry
Tropical: banana, pineapple, mango, kiwi, guava, pears, watermelon, jackfruit, star fruit,
ladies finger, coconut, papaya, apple, custard apple, passion fruit, Sharon fruit, grape fruit,
Root & tuberous vegetables: carrot, radish, turnip, potato, sweet potato, parsnip, swede,
beetroot,
Gourds & squashes: squash, cucumber, pumpkin, butternut squash, courgettes, marrow,
cushaw squash, gherkin, zucchini
Berries: strawberry, raspberry, blueberry, blackberry, rowanberry, gooseberry, lychee
Fifteen+ seeds: jackfruit, pomegranate, dragon fruit,
One seeded: date, cherries, grapes, avocado,

221
Two to ten seeds: mangosteen
Leafy & salad vegetables: spinach, cauliflower, broccoli, red cabbage, Brussel sprout,
cilantro, cucumber, celery, parsley, mint, coriander, lettuce, asparagus, kale, rocket, tomato
Fungi: mushroom, prune
Bulb & stem vegetables: onion, garlic, ginger, spring onions, leek, artichoke,
Fruits eaten as vegetables: brinjal, tomato, eggplant, zucchini, ladies finger
Vegetables in pods: beans, runner beans, string beans, peas, lentils, sweet corn, broad beans,
French beans, legumes, pitipua, kidney beans,
Citrus: lemon, orange, lime, tangerine, clementine, satsuma, amlaki
Chilli peppers: chillies, red pepper, green pepper, yellow pepper, bell pepper,
Dry fruits: dates, cashew, raisins, grapefruit,
Commonly occurred together: onion, potato, brinjal, cauliflower
c. Clothing
Winter wear: jacket, coat, sweater, thermal, shawl, muffler, sweater, blazer, cardigans,
pullover,
Summer wear: t-shirt, tops, tanks,
Clothing wore on the upper body: shirt, tops, t-shirt,
Clothing wore on the lower body: trouser, pant, shorts, slacks, jeans, skirts,
Underwear: bra, boxers, underwear, lingerie, trunk, vest, blouse,
Headgear: cap, hat, toupee, headscarf

222
Dresses: gown, sari, burqa, kimono, wrapper, lehenga, dresses
Footwear: sandal, shoes, socks, flipflops, trainers
Commonly associated: glove, mitten, hat, cap, tuke
Traditional wear: shawl, saree, dhoti, salwar, Punjabi, quilt, kimono, dishdash
Accessories: belt, towel, handkerchief,
Neckwear: bow tie, scarf, tie,
Formal wear: shirt, pant, tie, coat, suit
2. Letter fluency
a. Words that begin with the same first two letter (church/change)
b. Differ only by their vowel sounds (fit/fat)
c. Words that rhyme (stand/sand)
d. Homonyms (some/sum)

223
Appendix 2.5. Raw Data of Each Individual on the Demographic Variables and
Objective Language Tests
Bilinguals
(B)
Age/Sex Years of
education
Occupation Immigration
(years)
IQ OPT BPVS-
III
B1 45/M 18 Lecturer 5 50 55 164
B2 28/M 20 Student 2 41 52 144
B3 29/M 19 Student 4 45 54 157
B4 28/F 16 Homemaker 6 47 52 152
B5 31/F 17 Homemaker 7 43 49 159
B6 28/F 16 Accountant 8 44 58 164
B7 29/M 16 Engineer 9 50 57 161
B8 35/M 16 Engineer 3 45 53 160
B9 38/M 17 Business 8 41 55 161
B10 38/F 17 Homemaker 8 44 57 163
B11 38/M 17 Sales 6 51 50 161
B12 38/F 19 Homemaker 8 40 51 153
B13 27/M 16 Student 10 38 57 156
B14 38/M 16 Engineer 11 40 52 157
B15 27/M 17 Engineer 12 44 55 160
B16 34/M 20 Doctor 13 45 49 161
B17 40/M 19 Homemaker 15 41 51 154
B18 37/M 18 Clerk 1 42 52 155
B19 29/M 17 Business 12 51 51 159
B20 30/M 17 Engineer 4 44 52 162
B21 31/F 17 Housemaker 3 40 54 163
B22 31/F 16 Housemaker 7 42 57 160
B23 30/F 16 Engineer 9 39 53 161
B24 31/F 17 Student 10 40 43 150
B25 31/F 18 Student 6 41 57 161

224
Age/Sex Years of
education
Occupation Immigration
(years)
IQ OPT BPVS-
III
Monolinguals (M)
M1 44/F 20 Student N/A 40 57 164
M2 23/M 18 Student N/A 38 55 162
M3 23/M 17 Student N/A 39 54 165
M4 27/F 17 Student N/A 54 57 159
M5 32/M 18 Accountant N/A 47 58 161
M6 24/F 17 Student N/A 33 55 167
M7 23/M 17 Student N/A 42 48 166
M8 27/F 17 Engineer N/A 35 58 160
M9 23/M 18 Student N/A 43 57 161
M10 26/F 18 Student N/A 44 57 167
M11 28/F 18 Engineer N/A 49 55 149
M12 22/M 17 Student N/A 42 58 158
M13 32/M 18 Engineer N/A 50 56 165
M14 22/M 17 Student N/A 40 52 157
M15 22/F 17 Student N/A 41 51 154
M16 32/M 18 Business N/A 43 48 160
M17 30/F 18 Student N/A 38 49 157
M18 22/M 17 Student N/A 50 55 164
M19 27/F 17 Student N/A 44 48 157
M20 38/M 15 Lab manager N/A 48 49 154
M21 38/F 17 Technician N/A 54 54 157
M22 45/F 16 Administrator N/A 42 54 157
M23 40/M 15 Property
maintenance
N/A
41 55 154
M24 45/M 15 Sales N/A 40 57 161
M25 45/F 15 Support
worker
N/A
38 56 160

225
Appendix 2.6. Raw Data of Each Individual on the Subjective Language Measures
Bilinguals (B)
Bengali B1 B2 B3 B4 B5 B6 B7 B8 B9 B10 B11 B12 B13 B14 B15 B16 B17 B18 B19 B20 B21 B22 B23 B24 B25
Language acquisition 15 17 17 9 16 15 9 17 12 14 14 12 14 17 15 15 17 14 17 10 10 15 17 15 15
Language of instruction 3 8 1 6 9 6 3 6 5 4 6 8 3 6 5 5 6 6 8 2 6 5 6 6 5
Speaking 5.5 7 6 6 7 6 6 7 6 6.5 6 7 7 7 6 7 6 7 7 5 5 7 7 6 6
Comprehension 6 7 7 6 7 6 6.5 7 7 6.5 7 7 7 7 7 7 7 7 7 6 6 7 7 7 7
Reading 6 7 7 7 7 6 7 7 7 7 7 7 5 7 7 7 7 7 7 7 5 6 7 7 6
Writing 4 7 6 7 7 4 6 7 6 6 6 5 5 7 6 6 6 7 7 6 4 6 7 6 6
Usage 8 16 12 10 11 8 11 13 12 13 11 14 8 14 12 12 13 12 14 13 14 12 14 12 12
Dominance 11 20 11 18 20 11 16 20 14 20 20 20 11 17 17 17 20 20 20 17 15 17 20 17 17
Switching habits 9 9 7 9 9 9 10 8 11 9 9 9 9 5 9 9 8 8 8 10 9 9 8 8 9
English B1 B2 B3 B4 B5 B6 B7 B8 B9 B10 B11 B12 B13 B14 B15 B16 B17 B18 B19 B20 B21 B22 B23 B24 B25
Language acquisition 9 0 3 8 2 4 3 0 3 3 3 3 10 0 3 3 0 3 0 0 0 3 0 3 3
Language of instruction 7 2 9 9 3 9 9 4 5 9 4 2 7 6 6 6 4 4 2 9 9 6 4 6 6
Speaking 7 6 7 7 6 7 6.5 6.5 7 7 6 5 7 7 6 7 6 6.5 5 5.5 6 7 6.5 6 6
Comprehension 7 6 7 7 6 7 7 6.5 7 7 6 5 7 7 7 7 7 6.5 6 6 7 7 6.5 7 7
Reading 7 6 7 7 6 7 7 7 7 7 7 6 7 7 7 7 7 6 6 7 6 7 6 7 7
Writing 7 6 7 7 6 7 6 7 7 7 7 5 7 7 6 6 6 6 6 6 6 6 6 6 6
Usage 42 15 22 22 21 24 20 22 21 22 18 21 16 20 20 20 22 21 20 24 20 21 21 20 21
Dominance 24 12 19 22 12 24 21 10 20 21 16 17 24 21 18 18 17 16 16 19 18 18 16 18 18
Switching habits 4 12 5 8 9 4 8 9 11 6 6 8 4 5 8 8 9 9 10 9 9 8 9 8 7

226
Appendix 2.7. Raw Data of Each Individual on the Executive Control Measures
Bilinguals (B)
Executive
control
tests
B1 B2 B3 B4 B5 B6 B7 B8 B9 B10 B11 B12 B13 B14 B15 B16 B17 B18 B19 B20 B21 B22 B23 B24 B25
Stroop
congruent
629 412 668 628 811 742 481 612 870 642 830 700 618 934 534 657 903 903 562 543 443 595 520 670 744
Stroop
incongruen
t
795 616 810 795 104
2
106
0
675 683 919 773 1007 845 864 1066 777 897 1141 1141 671 723 560 733 675 750 874
Stroop
difference
166 205 142 167 231 318 193 70 49 131 177 146 246 132 243 240 238 238 109 180 117 138 155 80 130
Stroop ratio 23 39 19 23 25 35 33 10 5 18 19 18 33 13 37 30 23 23 18 28 23 21 25 12 16
Switch cost
(accuracy)
-2.8 4.1 2.8 0 1.4 -2.7 1.4 0 -1.5 2.7 1.2 -2.8 1.8 -1.4 -6.9 -1.3 -2.7 6.9 3.1 2.8 -6.9 2.8 0 -2.8 1.4
Switch cost
(RT)
238 314 103 197 137 488 89 110 177 48 302 52 469 301 229 655 177 198 154 272 319 512 259 90 162
Digit span
backward
5 7 7 6 6 7 5 7 6 4 5 6 7 6 6 6 6 4 4 7 7 6 6 7 7
Monolingual (M)
M
1
M
2
M
3
M
4
M5 M6 M7 M
8
M
9
M1
0
M11 M12 M13 M14 M15 M16 M17 M18 M19 M20 M21 M22 M23 M24 M25
Stroop
congruent
458 441 457 453 581 451 529 428 495 496 583 424 425 934 903 469 448 629 460 761 745 725 759 934 938
Stroop
incongruen
t
722 563 722 676 758 577 793 650 617 600 750 643 642 1066 1141 745 581 795 670 553 587 606 604 576 712
Stroop
difference
264 123 265 223 177 127 264 222 121 104 167 218 217 131 238 276 133 166 210 207 158 119 155 358 226
Stroop ratio 45 24 45 40 26 24 40 41 21 18 25 40 41 13 23 45 26 23 37 32 24 18 23 47 27
Switch cost
(accuracy)
4.2 1.4 2.8 -7.4 2.8 -4.1 15.
2
0 0 -1.4 2.8 4.1 11.1 -1.4 -2.8 5.5 6.9 -2.8 3.2 5.5 5.6 3.2 4.5 4.8 5.2
Switch cost
(RT)
113 151 227 221 116 380 428 116 94 243 345 49 366 301 177 373 177 238 270 268 269 253 249 227 241
Digit span
backward
6 7 4 6 7 6 5 4 7 6 7 6 5 6 6 4 5 5 6 5 6 5 5 5 5

227
Appendix 2.8. Correlation Between Executive Control and Vocabulary Measures
Executive control
measures
Vocabulary measures
OPT BPVS-II
Stroop ratio rs1 .16 .20
p .26 .16
N 50 50
Switch cost (RT) rs1 -.18 .12
p .21 .41
N 50 50
Digit span backward rs1 .12 -.13
p .39 .36
N 50 50
1– Spearman’s rho

228
Appendix 4.1 Example of Information Sheet and Consent Form
Supervisor:
Dr Arpita Bose
Email: [email protected]
Phone: +44 (0)118 378 6105
PhD Student:
Abhijeet Patra
Email: [email protected]
Information Sheet
Title: Word production in bilingual speakers: effect of linguistic context and cognitive
control
• This study looks at how people with neurological conditions produce the names of
pictures, read and repeat words, and what helps them to produce words.
• You will perform simple language tasks, like naming pictures, repeating and reading
words.
• You will be asked to tell me the names of pictures or read written words or repeat words
shown on the computer screen.
• It might take up to 4-5 sessions of about an hour each. The sessions will be conducted on
at a time of your ease.
• You can take a break when you need one.
• You will be compensated with £25 (2500INR) upon completion of the study for your
time.
• The information you give will be private and stored safely. We don’t use your name. A
number will be put on your form. For future research we will use only this number. All
the documents will be destroyed after 5 years.
• You can decide if you want to do this. You may stop at any time. You don’t have to
give a reason. You can ask questions about this study at any time.
• This application has been reviewed by the University Research Ethics Committee and
has been given a favourable ethical opinion for conduct.
• The researchers have been checked to confirm that they do not have any criminal
record
Thank you for your help.
Abhijeet Patra, PhD student (3rd year)
Faculty of Life Sciences
School of Psychology and Clinical Language
Sciences
Department of Clinical Language Sciences
University of Reading
Psychology Building
Earley Gate
Reading RG6 6AL
United Kingdom

229
Consent Form
I, ……………………………………… agree to take part in this study. It is about how
bilingual speakers name pictures and what helps them to name pictures easily. It is being
carried out by Mr. Abhijeet Patra and Dr. Arpita Bose at The University of Reading, Reading,
United Kingdom.
• I have seen and read a copy of the Participant’s Information Sheet
• I was able to ask questions about the study. They have been answered.
• I understand that personal information is confidential and only a number will identify my
data.
• I understand that the whole study will take 4-5 one-hour sessions to complete.
• I know the information will be stored in secure locked cabinets.
• I know the information will be kept for five years.
• I understand that taking part in this study is voluntary.
• I can withdraw at any time without having to give an explanation.
• I am happy to participate.
Signature ------------------------------------------------------------
Name (in capitals) -------------------------------------------------------------
Date ---------------------------------------------

230
Appendix 4.2 Raw Data of Each BWA and BHA on the Executive Control Measures
Executive control
parameters
BWA
BWA1 BWA2 BWA3 BWA4 BWA5 BWA6 BWA7 BWA8
Stroop incongruent
(msec)
3688.05 7390 2929.86 1293.01 1724.68 6148.39 1266.58 4000
Stroop congruent
(msec)
2555.22 3321.23 1633.75 925.63 1659 2636.69 1014.77 1608.66
Stroop difference
(msec)
4068.77 4068.77 1296.11 363.38 65.78 3511.70 251.81 2391.34
Stroop ratio 36.29 75.97 56.80 33.12 3.88 79.95 18.90 85.27
TMT-A 37 45 86 56.53 69 70 21.9 134
TMT-B 103 361 168 89.16 192 199 59.03 893
TMT difference 66 316 82 32.63 123 129 37.13 759
Backward digit span 4 3 3 4 4 5 5 3
BHA
BHA1 BHA2 BHA3 BHA4 BHA5 BHA6 BHA7 BHA8
Stroop incongruent
(msec)
720 1232 933.49 658.74 774.52 1444.42 830.86 560.4
Stroop congruent
(msec)
617.97 896.54 654.53 508.33 538.54 1118.3 676.48 545
Stroop difference
(msec)
102.03 335.46 278.96 150.41 235.98 326.12 154.38 15.4
Stroop ratio 15.25 31.52 35.13 25.78 35.94 25.45 20.48 2.79
TMT-A 22.02 33.2 39.8 30.8 28.9 50.8 32.8 21.04
TMT-B 38.2 50.8 93.5 60 90.1 103 43.7 34.15
TMT difference 16.18 17.6 53.7 29.2 61.2 52.2 10.9 13.11
Backward digit span 7 4 3 4 4 3 4 7

231
References
Abdel Rahman, R., & Melinger, A. (2007). When bees hamper the production of honey:
lexical interference from associates in speech production. Journal of Experimental
Psychology: Learning, Memory, and Cognition, 33(3), 604.
http://dx.doi.org/10.1037/0278-7393.33.3.604
Abutalebi, J., & Green, D. (2007). Bilingual language production: The neurocognition of
language representation and control. Journal of neurolinguistics, 20(3), 242-275.
https://doi.org/10.1016/j.jneuroling.2006.10.003
Abutalebi, J., & Green, D. W. (2008). Control mechanisms in bilingual language production:
Neural evidence from language switching studies. Language and cognitive
processes, 23(4), 557-582. http://dx.doi.org/10.1080/01690960801920602
Acheson, D. J., Ganushchak, L. Y., Christoffels, I. K., & Hagoort, P. (2012). Conflict
monitoring in speech production: physiological evidence from bilingual picture
naming. Brain and language, 123(2), 131-136.
https://doi.org/10.1016/j.bandl.2012.08.008
Adams, M. L., Reich, A. R., & Flowers, C. R. (1989). Verbal fluency characteristics of
normal and aphasic speakers. Journal of Speech and hearing Research, 32(4), 871.
https://doi.org/10.1044/jshr.3204.871
Arroyo-Anlló, E. M., Lorber, M., Rigaleau, F., & Gil, R. (2012). Verbal fluency in
Alzheimer's disease and Aphasia. Dementia, 11(1), 5-18.
https://doi.org/10.1177/1471301211416609
Baddeley, A. D., & Hitch, G. (1974). Working memory. Psychology of learning and
motivation, 8, 47-89. https://doi.org/10.1016/S0079-7421(08)60452-1

232
Bak, T. H. (2015). Beyond a simple" yes" and" no". Cortex; a journal devoted to the study of
the nervous system and behavior, 73, 332-333. doi: 10.1016/j.cortex.2015.08.003
Bak, T. H., & Alladi, S. (2014). Can being bilingual affect the onset of dementia?. Future
Neurology, 9(2), 101-103. https://doi.org/10.2217/fnl.14.8
Baldo, J. V., Schwartz, S., Wilkins, D. P., & Dronkers, N. F. (2010). Double dissociation of
letter and category fluency following left frontal and temporal lobe
lesions. Aphasiology, 24(12), 1593-1604.
https://doi/abs/10.1080/02687038.2010.489260
Belke, E. (2008). Effects of working memory load on lexical-semantic encoding in language
production. Psychonomic Bulletin & Review, 15(2), 357-363.
https://doi.org/10.3758/PBR.15.2.357
Belke, E. (2013). Long-lasting inhibitory semantic context effects on object naming are
necessarily conceptually mediated: Implications for models of lexical-semantic
encoding. Journal of Memory and Language, 69(3), 228-256.
https://doi.org/10.1016/j.jml.2013.05.008
Belke, E. (2017). The Role of Task-Specific Response Strategies in Blocked-Cyclic
Naming. Frontiers in psychology, 7. https://doi.org/10.3389/fpsyg.2016.01955
Belke, E., & Stielow, A. (2013). Cumulative and non-cumulative semantic interference in
object naming: Evidence from blocked and continuous manipulations of semantic
context. The Quarterly Journal of Experimental Psychology, 66(11), 2135-2160.
http://dx.doi.org/10.1080/17470218.2013.775318
Belke, E., Humphreys, G. W., Watson, D. G., Meyer, A. S., & Telling, A. L. (2008). Top-
down effects of semantic knowledge in visual search are modulated by cognitive but
233
not perceptual load. Attention, perception, & psychophysics, 70(8), 1444-1458.
https://doi.org/10.3758/PP.70.8.1444
Belke, E., Meyer, A. S., & Damian, M. F. (2005). Refractory effects in picture naming as
assessed in a semantic blocking paradigm. The Quarterly Journal of Experimental
Psychology, 58(4), 667-692. http://dx.doi.org/10.1080/02724980443000142
Beveridge, M. E., & Bak, T. H. (2011). The languages of aphasia research: Bias and
diversity. Aphasiology, 25(12), 1451-1468.
http://dx.doi.org/10.1080/02687038.2011.624165
Bialystok, E. (2009). Bilingualism: The good, the bad, and the indifferent. Bilingualism:
Language and cognition, 12(1), 3-11. https://doi.org/10.1017/S1366728908003477
Bialystok, E. (2011). Reshaping the mind: The benefits of bilingualism. Canadian Journal of
Experimental Psychology/Revue canadienne de psychologie expérimentale, 65(4),
229. http://dx.doi.org/10.1037/a0025406
Bialystok, E., Craik, F. I., & Luk, G. (2008). Lexical access in bilinguals: Effects of
vocabulary size and executive control. Journal of Neurolinguistics, 21(6), 522-538.
https://doi.org/10.1016/j.jneuroling.2007.07.001
Bialystok, E., Craik, F. I., Klein, R., & Viswanathan, M. (2004). Bilingualism, aging, and
cognitive control: evidence from the Simon task. Psychology and aging, 19(2), 290.
http://dx.doi.org/10.1037/0882-7974.19.2.290
Blom, E., Küntay, A. C., Messer, M., Verhagen, J., & Leseman, P. (2014). The benefits of
being bilingual: Working memory in bilingual Turkish–Dutch children. Journal of
experimental child psychology, 128, 105-119.
https://doi.org/10.1016/j.jecp.2014.06.007

234
Boersma, P., & Weenink, D. (2015). Praat version 5.4. 08. Doing phonetics by computer.
Bose, A., Wood, R., & Kiran, S. (2017). Semantic fluency in aphasia: clustering and
switching in the course of 1 minute. International journal of language &
communication disorders, 52(3), 334-345. https://doi.org/10.1111/1460-6984.12276
Brodeur, M. B., Dionne-Dostie, E., Montreuil, T., & Lepage, M. (2010). The Bank of
Standardized Stimuli (BOSS), a new set of 480 normative photos of objects to be used
as visual stimuli in cognitive research. PloS one, 5(5), e10773.
https://doi.org/10.1371/journal.pone.0010773
Broersma, M., Carter, D., & Acheson, D. J. (2016). Cognate costs in bilingual speech
production: Evidence from language switching. Frontiers in psychology, 7.
https://doi.org/10.3389/fpsyg.2016.01461
Caramazza, A. (1997). How many levels of processing are there in lexical access? Cognitive
neuropsychology, 14(1), 177-208. http://dx.doi.org/10.1080/026432997381664
Caramazza, A., & Hillis, A. E. (1990). Where do semantic errors come from? Cortex, 26(1),
95-122. https://doi.org/10.1016/S0010-9452(13)80077-9
Chiou, H., & Kennedy, M. R. T. (2006). Executive functions and aphasia: Relationships
between metacomprehension and switching behavior. 34 th Annual International
Neuropsychological Society Association, Boston, MA.
Comrie, B. (2005). Numeral bases. In The world atlas of language structures (pp. 530-533).
Oxford Univ. Press.
Costa, A. (2005). Lexical access in bilingual production. Handbook of bilingualism:
Psycholinguistic approaches, 308-325.
235
Costa, A., Caramazza, A., & Sebastian-Galles, N. (2000). The cognate facilitation effect:
implications for models of lexical access. Journal of Experimental Psychology:
Learning, Memory, and Cognition, 26(5), 1283.
http://dx.doi.org/10.1037/0278-7393.26.5.1283
Costa, A., Caramazza, A., & Sebastian-Galles, N. (2000). The cognate facilitation effect:
implications for models of lexical access. Journal of Experimental Psychology:
Learning, Memory, and Cognition, 26(5), 1283.
http://dx.doi.org/10.1037/0278-7393.26.5.1283
Crawford, J. R., Garthwaite, P. H., & Porter, S. (2010). Point and interval estimates of effect
sizes for the case-controls design in neuropsychology: rationale, methods,
implementations, and proposed reporting standards. Cognitive
neuropsychology, 27(3), 245-260. http://dx.doi.org/10.1080/02643294.2010.513967
Croft, S., Marshall, J., Pring, T., & Hardwick, M. (2015). Therapy for naming difficulties in
bilingual aphasia: which language benefits? International Journal of Language &
Communication Disorders, 1-15. doi: 10.3109/13682822.2010.484845
Crowe, S. F. (1998). Decrease in performance on the verbal fluency test as a function of time:
Evaluation in a young healthy sample. Journal of clinical and experimental
neuropsychology, 20(3), 391-401. doi: 10.1076/jcen.20.3.391.810
Crowther, J. E., & Martin, R. C. (2014). Lexical selection in the semantically blocked cyclic
naming task: the role of cognitive control and learning. Frontiers in human
neuroscience, 8. doi: 10.3389/fnhum.2014.00009
Damian, M. F., & Als, L. C. (2005). Long-lasting semantic context effects in the spoken
production of object names. Journal of Experimental Psychology: Learning, Memory,
and Cognition, 31(6), 1372. http://dx.doi.org/10.1037/0278-7393.31.6.1372

236
Damian, M. F., Vigliocco, G., & Levelt, W. J. (2001). Effects of semantic context in the
naming of pictures and words. Cognition, 81(3), B77-B86.
https://doi.org/10.1016/S0010-0277(01)00135-4
Dash, T., & Kar, B. R. (2014). Bilingual language control and general purpose cognitive
control among individuals with bilingual aphasia: Evidence based on negative priming
and flanker tasks. Behavioural neurology, 2014. doi: 10.1155/2014/679706
Declerck, M., & Philipp, A. M. (2015). A review of control processes and their locus in
language switching. Psychonomic bulletin & review, 22(6), 1630-1645.
https://doi.org/10.3758/s13423-015-0836-1
Delis, D. C., Kaplan, E., & Kramer, J. H. (2001). Delis-Kaplan executive function system (D-
KEFS). Psychological Corporation.
Dell, G. S., Schwartz, M. F., Martin, N., Saffran, E. M., & Gagnon, D. A. (1997). Lexical
access in aphasic and nonaphasic speakers. Psychological review, 104(4), 801.
http://dx.doi.org/10.1037/0033-295X.104.4.801
Detry, C., Pillon, A., & de Partz, M. P. (2005). A direct processing route to translate words
from the first to the second language: Evidence from a case of a bilingual
aphasic. Brain and Language, 95(1), 40-41. doi: 10.1016/j.bandl.2005.07.014
Dil, A. (1993). Two Traditions of the Bengali language (No. 82). National Institute of
Historical and Cultural Research.
Dunn, A. L., & Tree, J. E. F. (2009). A quick, gradient bilingual dominance
scale. Bilingualism: Language and Cognition, 12(3), 273-289.
https://doi.org/10.1017/S1366728909990113

237
Dunn, L. M., & Dunn, D. M. (2009). The British picture vocabulary scale. GL Assessment
Limited.
Ellis, C., & Urban, S. (2016). Age and aphasia: a review of presence, type, recovery and
clinical outcomes. Topics in stroke rehabilitation, 23(6), 430-439.
http://dx.doi.org/10.1080/10749357.2016.1150412
Emmorey, K., Luk, G., Pyers, J. E., & Bialystok, E. (2008). The source of enhanced cognitive
control in bilinguals: Evidence from bimodal bilinguals. Psychological
Science, 19(12), 1201-1206. https://doi.org/10.1111/j.1467-9280.2008.02224.x
Fabbro, F. (2001). The bilingual brain: Cerebral representation of languages. Brain and
language, 79(2), 211-222.
Faroqi-Shah, Y., Sampson, M., Pranger, M., & Baughman, S. (2016). Cognitive control, word
retrieval and bilingual aphasia: Is there a relationship? Journal of Neurolinguistics.
https://doi.org/10.1016/j.jneuroling.2016.07.001
Fernandes, M. A., Craik, F., Bialystok, E., & Kreuger, S. (2007). Effects of bilingualism,
aging, and semantic relatedness on memory under divided attention. Canadian
Journal of Experimental Psychology/Revue canadienne de psychologie
expérimentale, 61(2), 128. http://dx.doi.org/10.1037/cjep2007014
Filippi, R., Karaminis, T., & Thomas, M. S. (2014). Language switching in bilingual
production: Empirical data and computational modelling. Bilingualism: Language and
Cognition, 17(2), 294-315. https://doi.org/10.1017/S1366728913000485
Friesen, D. C., Luo, L., Luk, G., & Bialystok, E. (2015). Proficiency and control in verbal
fluency performance across the lifespan for monolinguals and bilinguals. Language,

238
cognition and neuroscience, 30(3), 238-250.
http://dx.doi.org/10.1080/23273798.2014.918630
Gathercole, V. C. M., Thomas, E. M., Kennedy, I., Prys, C., Young, N., Guasch, N. V., ... &
Jones, L. (2014). Does language dominance affect cognitive performance in
bilinguals? Lifespan evidence from preschoolers through older adults on card sorting,
Simon, and metalinguistic tasks. Frontiers in Psychology, 5.
doi:10.3389/fpsyg.2014.00011
Gollan, T. H., Montoya, R. I., & Werner, G. A. (2002). Semantic and letter fluency in
Spanish-English bilinguals. Neuropsychology, 16(4), 562.
http://dx.doi.org/10.1037/0894-4105.16.4.562
Gollan, T. H., Montoya, R. I., Fennema-Notestine, C., & Morris, S. K. (2005). Bilingualism
affects picture naming but not picture classification. Memory & cognition, 33(7),
1220-1234. https://doi.org/10.3758/BF03193224
Goodglass, H., & Barresi, B. (2000). Boston diagnostic aphasia examination: Short form
record booklet. Lippincott Williams & Wilkins.
Gordon, R. G. (2009). Ethnologue: Languages of the World. 2005. Dallas, Texas: SIL
International, Fifteenth Google Scholar.
Gray, T., & Kiran, S. (2013). A theoretical account of lexical and semantic naming deficits in
bilingual aphasia. Journal of Speech, Language, and Hearing Research, 56(4), 1314-
1327. https://dx.doi.org/10.1044/1092-4388(2012/12-0091)
Gray, T., & Kiran, S. (2016). The relationship between language control and cognitive control
in bilingual aphasia. Bilingualism: Language and Cognition, 19(3), 433-452.
https://doi.org/10.1017/S1366728915000061

239
Green, D. W. (1998). Mental control of the bilingual lexico-semantic system. Bilingualism:
Language and cognition, 1(2), 67-81. https://doi.org/10.1017/S1366728998000133
Green, D. W., Grogan, A., Crinion, J., Ali, N., Sutton, C., & Price, C. J. (2010). Language
control and parallel recovery of language in individuals with
aphasia. Aphasiology, 24(2), 188-209. http://dx.doi.org/10.1080/02687030902958316
Gruenewald, P. J., & Lockhead, G. R. (1980). The free recall of category examples. Journal
of Experimental Psychology: Human Learning and Memory, 6(3), 225.
http://dx.doi.org/10.1037/0278-7393.6.3.225
Harnishfeger, K. K. (1995). The development of cognitive inhibition. In F.N. Dempster & C.
J. Brainerd (Eds), Interference and inhibition in cognition (pp 175-204). Academic
Press Limited, London.
Haspelmath, M., Dryer, M. S., Gil, D., & Comrie, B. (2005). The world atlas of language
structures.
Helm-Estabrooks, N. (2002). Cognition and aphasia: A discussion and a study. Journal of
communication disorders, 35(2), 171-186.
https://doi.org/10.1016/S0021-9924(02)00063-1
Hernandez, A. E., & Meschyan, G. (2006). Executive function is necessary to enhance lexical
processing in a less proficient L2: Evidence from fMRI during picture
naming. Bilingualism: Language and cognition, 9(2), 177-188.
https://doi.org/10.1017/S1366728906002525
Hilchey, M. D., & Klein, R. M. (2011). Are there bilingual advantages on nonlinguistic
interference tasks? Implications for the plasticity of executive control

240
processes. Psychonomic bulletin & review, 18(4), 625-658.
https://doi.org/10.3758/s13423-011-0116-7
Hofweber, J., Marinis, T., & Treffers-Daller, J. (2016). Effects of dense code-switching on
executive control. Linguistic approaches to bilingualism, 6(5), 648-668.
doi: 10.1075/lab.15052.hof
Hoshino, N., & Kroll, J. F. (2008). Cognate effects in picture naming: Does cross-language
activation survive a change of script?. Cognition, 106(1), 501-511.
https://doi.org/10.1016/j.cognition.2007.02.001
Howard, D., & Orchard-Lisle, V. (1984). On the origin of semantic errors in naming:
Evidence from the case of a global aphasic. Cognitive Neuropsychology, 1(2), 163-
190. http://dx.doi.org/10.1080/02643298408252021
Huber, W., Poeck, K., Weniger, D., & Willmes, K. (1983). Aachener aphasie test (AAT):
Handanweisung. Verlag für Psychologie Hogrefe.
Humphreys, G. W., Bickerton, W. L., Samson, D., & Riddoch, M. J. (2012). BCoS cognitive
screen. Psychology Press.
Kambanaros, M. (2016). Verb and noun word retrieval in bilingual aphasia: a case study of
language-and modality-specific levels of breakdown. International Journal of
Bilingual Education and Bilingualism, 19(2), 169-184.
http://dx.doi.org/10.1080/13670050.2015.1037717
Kay, J. M., Lesser, R., & Coltheart, M. (1992). PALPA: psycholinguistic assessment of
language performance in aphasia.
Kertesz, A. (2006). Western Aphasia Battery–Revised (WAB-R) Pro-Ed. Austin, TX.

241
Keshree, N. K., Kumar, S., Basu, S., Chakrabarty, M., & Kishore, T. (2013). Adaptation of
The Western Aphasia Battery in Bangla. Psychology of Language and
Communication, 17(2), 189-201. https://doi.org/10.2478/plc-2013-0012
Kiran, S., & Iakupova, R. (2011). Understanding the relationship between language
proficiency, language impairment and rehabilitation: Evidence from a case
study. Clinical linguistics & phonetics, 25(6-7), 565-583.
http://dx.doi.org/10.3109/02699206.2011.566664
Kiran, S., Balachandran, I., & Lucas, J. (2014). The nature of lexical-semantic access in
bilingual aphasia. Behavioural neurology, 2014.
http://dx.doi.org/10.1155/2014/389565
Kiran, S., & Gray, T. (2018). Understanding the nature of bilingual aphasia. Bilingual
Cognition and Language: The state of the science across its subfields, 54, 371-400.
https://doi.org/10.1075/sibil.54.17kir
Kohnert, K. (2004). Cognitive and cognate-based treatments for bilingual aphasia: A case
study. Brain and language, 91(3), 294-302.
https://doi.org/10.1016/j.bandl.2004.04.001
Kormi-Nouri, R., Moradi, A. R., Moradi, S., Akbari-Zardkhaneh, S., & Zahedian, H. (2012).
The effect of bilingualism on letter and category fluency tasks in primary school
children: Advantage or disadvantage? Bilingualism: Language and cognition, 15(2),
351-364. https://doi.org/10.1017/S1366728910000192
Kousaie, S., & Phillips, N. A. (2012). Ageing and bilingualism: Absence of a “bilingual
advantage” in Stroop interference in a nonimmigrant sample. The Quarterly Journal
of Experimental Psychology, 65(2), 356-369.
http://dx.doi.org/10.1080/17470218.2011.604788

242
Kroll, J. F., & Stewart, E. (1994). Category interference in translation and picture naming:
Evidence for asymmetric connections between bilingual memory
representations. Journal of memory and language, 33(2), 149-174.
https://doi.org/10.1006/jmla.1994.1008
Kroll, J. F., Bobb, S. C., & Wodniecka, Z. (2006). Language selectivity is the exception, not
the rule: Arguments against a fixed locus of language selection in bilingual
speech. Bilingualism: Language and Cognition, 9(2), 119-135.
https://doi.org/10.1017/S1366728906002483
Kroll, J. F., Dussias, P. E., Bogulski, C. A., & Valdes Kroff, J. R. (2012). Juggling Two
Languages in One Mind: What Bilinguals Tell Us About Language Processing and its
Consequences for Cognition. Psychology of Learning and Motivation-Advances in
Research and Theory, 56, 229. doi: 10.1016/B978-0-12-394393-4.00007-8
Kuperman, V., Stadthagen-Gonzalez, H., & Brysbaert, M. (2012). Age-of-acquisition ratings
for 30,000 English words. Behavior Research Methods, 44(4), 978-990.
https://doi.org/10.3758/s13428-012-0210-4
Kurland, J., & Falcon, M. (2011). Effects of cognate status and language of therapy during
intensive semantic naming treatment in a case of severe nonfluent bilingual
aphasia. Clinical linguistics & phonetics, 25(6-7), 584-600.
http://dx.doi.org/10.3109/02699206.2011.565398
Kuzmina, E., & Weekes, B. S. (2017). Role of cognitive control in language deficits in
different types of aphasia. Aphasiology, 31(7), 765-792.
http://dx.doi.org/10.1080/02687038.2016.1263383

243
Lalor, E., & Kirsner, K. (2001). The role of cognates in bilingual aphasia: Implications for
assessment and treatment. Aphasiology, 15(10-11), 1047-1056.
http://dx.doi.org/10.1080/02687040143000384
Laures-Gore, J., Marshall, R. M., & Verner, E. (2010). Digit span differences in aphasia and
right brain damage. Aphasiology, 25(1), 43-56.
Lee, M. W., & Williams, J. N. (2001). Lexical access in spoken word production by
bilinguals: Evidence from the semantic competitor priming paradigm. Bilingualism:
Language and Cognition, 4(3), 233-248. https://doi.org/10.1017/S1366728901000426
Levelt, W. J., Roelofs, A., & Meyer, A. S. (1999). A theory of lexical access in speech
production. Behavioral and brain sciences, 22(1), 1-38.
Linck, J. A., Hoshino, N., & Kroll, J. F. (2008). Cross-language lexical processes and
inhibitory control. The mental lexicon, 3(3), 349-374. doi: 10.1075/ml.3.3.06lin
Lorenzen, B., & Murray, L. L. (2008). Bilingual aphasia: A theoretical and clinical
review. American Journal of Speech-Language Pathology, 17(3), 299-317.
https://doi.org/10.1044/1058-0360(2008/026)
Luo, L., Luk, G., & Bialystok, E. (2010). Effect of language proficiency and executive
control on verbal fluency performance in bilinguals. Cognition, 114(1), 29-41.
https://doi.org/10.1016/j.cognition.2009.08.014
MacLeod, C. M. (1991). Half a century of research on the Stroop effect: an integrative
review. Psychological bulletin, 109(2), 163. doi: 10.1037/0033-2909.109.2.163
Marian, V. (2008). Bilingual research methods. In J. Altarriba & R. R. Heredia (Eds.), An
Introduction to Bilingualism: Principles and Processes (pp. 13-38). Mahawah, NJ:
Lawrence Erlbaum.

244
Marian, V., & Spivey, M. (2003). Competing activation in bilingual language processing:
Within-and between-language competition. Bilingualism: Language and
Cognition, 6(2), 97-115. https://doi.org/10.1017/S1366728903001068
Martin, N., & Ayala, J. (2004). Measurements of auditory-verbal STM span in aphasia:
Effects of item, task, and lexical impairment. Brain and language, 89(3), 464-483.
https://doi.org/10.1016/j.bandl.2003.12.004
Martin, N., & Gupta, P. (2004). Exploring the relationship between word processing and
verbal short-term memory: Evidence from associations and dissociations. Cognitive
Neuropsychology, 21(2-4), 213-228. doi: 10.1080/02643290342000447
Mathuranath, P. S., Nestor, P. J., Berrios, G. E., Rakowicz, W., & Hodges, J. R. (2000). A
brief cognitive test battery to differentiate Alzheimer's disease and frontotemporal
dementia. Neurology, 55(11), 1613-1620.
http://dx.doi.org/10.1212/01.wnl.0000434309.85312.19
Miyake, A., Friedman, N. P., Emerson, M. J., Witzki, A. H., Howerter, A., & Wager, T. D.
(2000). The unity and diversity of executive functions and their contributions to
complex “frontal lobe” tasks: A latent variable analysis. Cognitive psychology, 41(1),
49-100. https://doi.org/10.1006/cogp.1999.0734
Monsell, S. (1978). Recency, immediate recognition memory, and reaction time. Cognitive
Psychology, 10(4), 465-501. https://doi.org/10.1016/0010-0285(78)90008-7
Morales, J., Calvo, A., & Bialystok, E. (2013). Working memory development in
monolingual and bilingual children. Journal of experimental child psychology, 114(2),
187-202. https://doi.org/10.1016/j.jecp.2012.09.002

245
Muñoz, M. L., Marquardt, T. P., & Copeland, G. (1999). A comparison of the codeswitching
patterns of aphasic and neurologically normal bilingual speakers of English and
Spanish. Brain and language, 66(2), 249-274. https://doi.org/10.1006/brln.1998.2021
Murray, L. L. (2012). Attention and other cognitive deficits in aphasia: Presence and relation
to language and communication measures. American Journal of Speech-Language
Pathology, 21(2), S51-S64. doi:10.1044/1058-0360(2012/11-0067)
Nigg, J. T. (2000). On inhibition/disinhibition in developmental psychopathology: views from
cognitive and personality psychology and a working inhibition
taxonomy. Psychological bulletin, 126(2), 220.
http://dx.doi.org/10.1037/0033-2909.126.2.220
Oppenheim, G. M., Dell, G. S., & Schwartz, M. F. (2010). The dark side of incremental
learning: A model of cumulative semantic interference during lexical access in speech
production. Cognition, 114(2), 227-252.
https://doi.org/10.1016/j.cognition.2009.09.007
Paap, K. R., & Greenberg, Z. I. (2013). There is no coherent evidence for a bilingual
advantage in executive processing. Cognitive psychology, 66(2), 232-258.
https://doi.org/10.1016/j.cogpsych.2012.12.002
Paap, K. R., & Sawi, O. (2014). Bilingual advantages in executive functioning: problems in
convergent validity, discriminant validity, and the identification of the theoretical
constructs. Frontiers in psychology, 5. doi: 10.3389/fpsyg.2014.00962
Paap, K. R., Johnson, H. A., & Sawi, O. (2014). Are bilingual advantages dependent upon
specific tasks or specific bilingual experiences?. Journal of Cognitive
Psychology, 26(6), 615-639. http://dx.doi.org/10.1080/20445911.2014.944914

246
Paap, K. R., Johnson, H. A., & Sawi, O. (2015). Bilingual advantages in executive
functioning either do not exist or are restricted to very specific and undetermined
circumstances. Cortex, 69, 265-278. https://doi.org/10.1016/j.cortex.2015.04.014
Paap, K. R., Myuz, H. A., Anders, R. T., Bockelman, M. F., Mikulinsky, R., & Sawi, O. M.
(2017). No compelling evidence for a bilingual advantage in switching or that
frequent language switching reduces switch cost. Journal of Cognitive
Psychology, 29(2), 89-112. http://dx.doi.org/10.1080/20445911.2016.1248436
Paradis, M. (1987). Bilingual aphasia test. New Jersey: Lawrence Erlbaum Associates.
Pelham, S. D., & Abrams, L. (2014). Cognitive advantages and disadvantages in early and
late bilinguals. Journal of Experimental Psychology: Learning, Memory, and
Cognition, 40(2), 313. http://dx.doi.org/10.1037/a0035224
Penn, C., Frankel, T., Watermeyer, J., & Russell, N. (2010). Executive function and
conversational strategies in bilingual aphasia. Aphasiology, 24(2), 288-308.
http://dx.doi.org/10.1080/02687030902958399
Perani, D., Abutalebi, J., Paulesu, E., Brambati, S., Scifo, P., Cappa, S. F., & Fazio, F. (2003).
The role of age of acquisition and language usage in early, high‐proficient bilinguals:
An fMRI study during verbal fluency. Human brain mapping, 19(3), 170-182.
doi: 10.1002/hbm.10110
Prior, A., & Gollan, T. H. (2011). Good language-switchers are good task-switchers:
Evidence from Spanish–English and Mandarin–English bilinguals. Journal of the
International Neuropsychological Society, 17(4), 682-691.
https://doi.org/10.1017/S1355617711000580

247
Prior, A., & Gollan, T. H. (2013). The elusive link between language control and executive
control: A case of limited transfer. Journal of Cognitive Psychology, 25(5), 622-645.
http://dx.doi.org/10.1080/20445911.2013.821993
Prior, A., & MacWhinney, B. (2010). A bilingual advantage in task switching. Bilingualism:
Language and cognition, 13(2), 253-262.
https://doi.org/10.1017/S1366728909990526
Raboutet, C., Sauzéon, H., Corsini, M. M., Rodrigues, J., Langevin, S., & N'Kaoua, B.
(2010). Performance on a semantic verbal fluency task across time: Dissociation
between clustering, switching, and categorical exploitation processes. Journal of
Clinical and Experimental Neuropsychology, 32(3), 268-280.
http://dx.doi.org/10.1080/13803390902984464
Radice, W. (2007). Teach Yourself Bengali. Hodder & Stoughton.
Ratcliff, G., Ganguli, M., Chandra, V., Sharma, S., Belle, S., Seaberg, E., & Pandav, R.
(1998). Effects of literacy and education on measures of word fluency. Brain and
Language, 61(1), 115-122. https://doi.org/10.1006/brln.1997.1858
Raven, J. (2008). Ravens Standard Progressive Matrices–Plus Version. London: NCS
Pearson.
Reitan, R. M. (1986). Trail Making Test: Manual for administration and scoring. Reitan
Neuropsychology Laboratory.
Roach, A., Schwartz, M. F., Martin, N., Grewal, R. S., & Brecher, A. (1996). The
Philadelphia naming test: scoring and rationale. Clinical aphasiology, 24, 121-133.
Roberts, P. M. (1998). Clinical research needs and issues in bilingual
aphasia. Aphasiology, 12(2), 119-130. http://dx.doi.org/10.1080/02687039808250467

248
Roberts, P. M., & Deslauriers, L. (1999). Picture naming of cognate and non-cognate nouns
in bilingual aphasia. Journal of Communication Disorders, 32(1), 1-23.
https://doi.org/10.1016/S0021-9924(98)00026-4
Roberts, P., & Dorze, G. L. (1994). Semantic verbal fluency in aphasia: A quantitative and
qualitative study in test-retest conditions. Aphasiology, 8(6), 569-582.
http://dx.doi.org/10.1080/02687039408248682
Rodriguez-Fornells, A., Krämer, U. M., Lorenzo-Seva, U., Festman, J., & Münte, T. F.
(2011). Self-assessment of individual differences in language switching. Frontiers in
Psychology, 2. doi: 10.3389/fpsyg.2011.00388
Roelofs, A. (2003). Shared phonological encoding processes and representations of languages
in bilingual speakers. Language and Cognitive Processes, 18(2), 175-204.
http://dx.doi.org/10.1080/01690960143000515
Rogers, C. L., Lister, J. J., Febo, D. M., Besing, J. M., & Abrams, H. B. (2006). Effects of
bilingualism, noise, and reverberation on speech perception by listeners with normal
hearing. Applied Psycholinguistics, 27(3), 465-485.
https://doi.org/10.1017/S014271640606036X
Rohrer, D., Wixted, J. T., Salmon, D. P., & Butters, N. (1995). Retrieval from semantic
memory and its implications for Alzheimer's disease. Journal of Experimental
Psychology: Learning, Memory, and Cognition, 21(5), 1127.
http://dx.doi.org/10.1037/0278-7393.21.5.1127
Rosen, V. M., Sunderland, T., Levy, J., Harwell, A., McGee, L., Hammond, C., ... &
Lefkowitz, C. (2005). Apolipoprotein E and category fluency: evidence for reduced
semantic access in healthy normal controls at risk for developing Alzheimer's

249
disease. Neuropsychologia, 43(4), 647-658.
https://doi.org/10.1016/j.neuropsychologia.2004.06.022
Rosselli, M., Ardila, A., Araujo, K., Weekes, V. A., Caracciolo, V., Padilla, M., & Ostrosky-
Solí, F. (2000). Verbal fluency and repetition skills in healthy older Spanish-English
bilinguals. Applied neuropsychology, 7(1), 17-24.
http://dx.doi.org/10.1207/S15324826AN0701_3
Salis, C., Kelly, H., & Code, C. (2015). Assessment and treatment of short‐term and working
memory impairments in stroke aphasia: a practical tutorial. International Journal of
Language & Communication Disorders, 50(6), 721-736.
doi: 10.1111/1460-6984.12172
Sanchez-Cubillo, I., Perianez, J. A., Adrover-Roig, D., Rodriguez-Sanchez, J. M., Rios-Lago,
M., Tirapu, J. E. E. A., & Barcelo, F. (2009). Construct validity of the Trail Making
Test: role of task-switching, working memory, inhibition/interference control, and
visuomotor abilities. Journal of the International Neuropsychological Society, 15(3),
438-450. https://doi.org/10.1017/S1355617709090626
Sandoval, T. C., Gollan, T. H., Ferreira, V. S., & Salmon, D. P. (2010). What causes the
bilingual disadvantage in verbal fluency? The dual-task analogy. Bilingualism:
Language and Cognition, 13(2), 231-252.
https://doi.org/10.1017/S1366728909990514
Sarno, M. T., Postman, W. A., Cho, Y. S., & Norman, R. G. (2005). Evolution of phonemic
word fluency performance in post-stroke aphasia. Journal of communication
disorders, 38(2), 83-107. https://doi.org/10.1016/j.jcomdis.2004.05.001

250
Schnur, T. T., Schwartz, M. F., Brecher, A., & Hodgson, C. (2006). Semantic interference
during blocked-cyclic naming: Evidence from aphasia. Journal of Memory and
Language, 54(2), 199-227. https://doi.org/10.1016/j.jml.2005.10.002
Scott, R. M., & Wilshire, C. E. (2010). Lexical competition for production in a case of
nonfluent aphasia: Converging evidence from four different tasks. Cognitive
neuropsychology, 27(6), 505-538. http://dx.doi.org/10.1080/02643294.2011.598853
Shao, Z., Janse, E., Visser, K., & Meyer, A. S. (2014). What do verbal fluency tasks measure?
Predictors of verbal fluency performance in older adults. Frontiers in psychology, 5.
doi: 10.3389/fpsyg.2014.00772
Shao, Z., Roelofs, A., Martin, R. C., & Meyer, A. S. (2015). Selective inhibition and naming
performance in semantic blocking, picture-word interference, and color–word Stroop
tasks. Journal of Experimental Psychology: Learning, Memory, and Cognition, 41(6),
1806. http://dx.doi.org/10.1037/a0039363
Singh, N., & Mishra, R. K. (2014). The modulatory role of second language proficiency on
performance monitoring: evidence from a saccadic countermanding task in high and
low proficient bilinguals. Frontiers in psychology, 5. doi: 10.3389/fpsyg.2014.01481
Snodgrass, J. G., & Vanderwart, M. (1980). A standardized set of 260 pictures: norms for
name agreement, image agreement, familiarity, and visual complexity. Journal of
experimental psychology: Human learning and memory, 6(2), 174.
http://dx.doi.org/10.1037/0278-7393.6.2.174
Stroop, J. R. (1935). Studies of interference in serial verbal reactions. Journal of experimental
psychology, 18(6), 643. http://dx.doi.org/10.1037/0096-3445.121.1.15

251
Szekely, A., Jacobsen, T., D'Amico, S., Devescovi, A., Andonova, E., Herron, D., ... &
Federmeier, K. (2004). A new on-line resource for psycholinguistic studies. Journal of
memory and language, 51(2), 247-250. https://doi.org/10.1016/j.jml.2004.03.002
Test, Q. P. (2001). Oxford: Oxford University Press.
Tiwari, S., & Krishnan, G. (2015). Selective L2 cognate retrieval deficit in a bilingual person
with aphasia: A case report. Speech, Language and Hearing, 18(4), 243-248.
http://dx.doi.org/10.1179/2050572815Y.0000000008
Tröster, A. I., Fields, J. A., Testa, J. A., Paul, R. H., Blanco, C. R., Hames, K. A., ... &
Beatty, W. W. (1998). Cortical and subcortical influences on clustering and switching
in the performance of verbal fluency tasks. Neuropsychologia, 36(4), 295-304.
https://doi.org/10.1016/S0028-3932(97)00153-X
Troyer, A. K., Moscovitch, M., & Winocur, G. (1997). Clustering and switching as two
components of verbal fluency: evidence from younger and older healthy
adults. neuropsychology, 11(1), 138. http://dx.doi.org/10.1037/0894-4105.11.1.138
Troyer, A. K., Moscovitch, M., Winocur, G., Alexander, M. P., & Stuss, D. (1998).
Clustering and switching on verbal fluency: the effects of focal frontal-and temporal-
lobe lesions. Neuropsychologia, 36(6), 499-504.
https://doi.org/10.1016/S0028-3932(97)00152-8
Verreyt, N., De Letter, M., Hemelsoet, D., Santens, P., & Duyck, W. (2013). Cognate effects
and executive control in a patient with differential bilingual aphasia. Applied
Neuropsychology: Adult, 20(3), 221-230.
http://dx.doi.org/10.1080/09084282.2012.753074
Version, E. P. 10 [Computer Software]. 2001. Pittsburgh: Psychology Software Tools.

252
Villard, S., & Kiran, S. (2016). To what extent does attention underlie language in
aphasia? Aphasiology, 1-20. http://dx.doi.org/10.1080/02687038.2016.1242711
Wechsler, D. (1997). WMS-III: Wechsler memory scale administration and scoring manual.
Psychological Corporation.
Ween, J. E., Alexander, M. P., D'esposito, M., & Roberts, M. (1996). Factors predictive of
stroke outcome in a rehabilitation setting. Neurology, 47(2), 388-392.
http://dx.doi.org/10.1212/WNL.47.2.388
Whiteside, D. M., Kealey, T., Semla, M., Luu, H., Rice, L., Basso, M. R., & Roper, B.
(2016). Verbal fluency: Language or executive function measure?. Applied
Neuropsychology: Adult, 23(1), 29-34.
http://dx.doi.org/10.1080/23279095.2015.1004574
Wilde, N. J., Strauss, E., & Tulsky, D. S. (2004). Memory span on the Wechsler
scales. Journal of Clinical and Experimental Neuropsychology, 26(4), 539-549.
http://dx.doi.org/10.1080/13803390490496605
Wright, T. (1991). Language awareness in teacher education programmes for non-native
speakers. Language awareness in the classroom, 62-77.