Event August 2017 Newsletter - Global Volatility Summit
29
Event The ninth annual Global Volatility Summit (“GVS”) is scheduled for Wednesday, March 14 th , 2018 at Pier 60 in New York City. Alongside our featured volatility managers, we are excited to announce the addition of a Quantitative and CTA manager panel, featuring prominent portfolio managers in the space to share their views on the volatility markets and resulting impact on these strategies. 2017 MANAGER PARTICIPANTS Allianz Global Investors Argentière Capital Capstone Investment Advisors BlueMountain Capital Capula Investment Management Dominicé & Co Fort LP Graham Capital Management III Capital Management Ionic Capital Management Man AHL Parallax Investment Advisors Pine River Capital Management R.G. Niederhoffer Capital True Partner 2017 Event Recap The 8th Annual Global Volatility Summit was held on March 15, 2017 at Chelsea Piers in New York City. Presenting to and networking with a well‐attended crowd was an exciting lineup of 15 hedge fund managers, plus industry experts, hedge fund consultants, and institutional investors addressing the use of volatility, hedging, CTA and quantitative strategies within institutional investment portfolios. Dear Investor, The Global Volatility Summit (“GVS”) brings together volatility and tail hedge managers, institutional investors, thought-provoking speakers, and other industry experts to discuss the volatility markets and the roles volatility strategies can play in institutional investment portfolios. The GVS aims to keep investors updated on the volatility markets throughout the year, and educated on innovations within the space. BlueMountain Capital has provided the latest piece in the GVS newsletter series. Cheers, Global Volatility Summit August 2017 Newsletter Questions? Please contact [email protected] Website: www.globalvolatilitysummit.com
-
Upload
khangminh22 -
Category
Documents
-
view
4 -
download
0
Transcript of Event August 2017 Newsletter - Global Volatility Summit

Event
The ninth annual Global Volatility Summit (“GVS”) is scheduled for Wednesday, March 14th, 2018 at Pier 60 in New York City. Alongside our featured volatility managers, we are excited to announce the addition of a Quantitative and CTA manager panel, featuring prominent portfolio managers in the space to share their views on the volatility markets and resulting impact on these strategies. 2017 MANAGER PARTICIPANTS Allianz Global Investors Argentière Capital Capstone Investment Advisors BlueMountain Capital Capula Investment Management Dominicé & Co Fort LP Graham Capital Management III Capital Management Ionic Capital Management Man AHL Parallax Investment Advisors Pine River Capital Management R.G. Niederhoffer Capital True Partner
2017 Event Recap The 8th Annual Global Volatility Summit was held on March 15, 2017 at Chelsea Piers in New York City. Presenting to and networking with a well‐attended crowd was an exciting lineup of 15 hedge fund managers, plus industry experts, hedge fund consultants, and institutional investors addressing the use of volatility, hedging, CTA and quantitative strategies within institutional investment portfolios.
Dear Investor, The Global Volatility Summit (“GVS”) brings together volatility and tail hedge managers, institutional investors, thought-provoking speakers, and other industry experts to discuss the volatility markets and the roles volatility strategies can play in institutional investment portfolios. The GVS aims to keep investors updated on the volatility markets throughout the year, and educated on innovations within the space. BlueMountain Capital has provided the latest piece in the GVS newsletter series. Cheers, Global Volatility Summit
August 2017 Newsletter
Questions? Please contact [email protected]
Website: www.globalvolatilitysummit.com

Equity Research
7 August 2017
Barclays Capital Inc. and/or one of its affiliates does and seeks to do business with
companies covered in its research reports. As a result, investors should be aware that the
firm may have a conflict of interest that could affect the objectivity of this report. Investors
should consider this report as only a single factor in making their investment decision.
PLEASE SEE ANALYST CERTIFICATION(S) AND IMPORTANT DISCLOSURES BEGINNING ON PAGE 23.
Index Volatility Weekly
What will happen if VIX spikes?
The low level of VIX has raised concerns that a fundamentally driven move in VIX
might be exacerbated due to positioning in VIX products. In this note, we show
that while a rude awakening from the prevailing complacency could indeed lead to
significant increase in VIX, some of the positioning-related concerns are misplaced.
We estimate that in a shock scenario 1M VIX futures could spike by 50% in a day.
Using data from 1926 we show that large one-day SPX drops are rare after a period
of complacency (low realized volatility) and a -5% move is an adequate shock
scenario. We estimate that this translates into a move of 14 points for the VIX and
~6 points for the VIX 1M future or -50% return for the SPVXSP index (which is the
benchmark for VIX ETPs).
However, in such a scenario, volume in VIX futures could easily cross $1Bn vega.
Liquidity in VIX futures has increased substantially in terms of both base of the
volume and its tendency to spike during risk-off events. We construct a multi-factor
model for VIX futures volume which predicts it will likely cross a million contracts
($1Bn vega) in a shock scenario.
Flow from managers of Leveraged VIX Exchange Traded Products (LETP flow)
saturates for large VIX moves. We show that the VIX futures demand due to LETP
negative gamma does not increase linearly but eventually saturates for large
positive moves. In our shock scenario we estimate a demand of ~$110Mn vega
which is only 10% of the likely VIX futures volume. On the other hand, for a large
drop in VIX futures, the supply is not bounded and is thus a bigger concern.
Flow due to forced unwind of inverse VIX ETPs if VIX futures increase by ~100%
is not an incremental effect. The impact of the managers of XIV exercising their
option to close the fund or potential margin call for SVXY in this scenario is already
reflected in the LETP flow calculation and is not an additional effect. We
demonstrate that negative LETP gamma is precisely the managers meeting margin
calls by reducing positions.
Short interest in inverse VIX ETPs has increased sharply, which will likely mitigate
the impact of LETP flow. A potential reason is that this roundabout way of going
long volatility is more cost effective due to the positive carry from the negative LETP
gamma. However, this strategy, whose payoff resembles a covered call in VIX
futures, underperforms for extreme moves in VIX futures.
In our opinion, the counterparties of the short-sellers of inverse ETPs are market-
makers whose long gamma is mitigating the impact of LETP manager flow. One
piece of evidence is that the LETP flow as measured by the intra-day autocorrelation
of VIX futures has declined substantially over the past few years.
DERIVATIVES
U.S. Equity Derivatives Strategy
Maneesh S. Deshpande
+1 212 526 2953
BCI, US
Arnab Sen
+1 212 526 5429
BCI, US
Jia Xu
+1 212 526 2388
BCI, US

Barclays | Index Volatility Weekly
7 August 2017 2
VOLATILITY OUTLOOK
Summary
The low level of VIX has raised concerns that a fundamentally driven move in VIX might be
exacerbated due to positioning in VIX products. As the equity market continues to make
new highs amid historically low realized and implied volatilities, investors have begun to fear
that the market has become too complacent. The worry is that an unexpected shock could
lead to sudden down move in equities and an attendant spike in VIX and VIX futures. In this
report we focus on the impact from the leveraged VIX ETPs (which include the inverse VIX
ETPs such as XIV and SVXY and the 2x leveraged ETPs such as TVIX and UVXY). We show
that while a rude awakening from the prevailing complacency could indeed lead to
significant increase in VIX, some of the positioning-related concerns are misplaced.
We estimate that in a shock scenario 1M VIX futures could spike by 50% in a day. Using
data from 1926 we show that large one-day SPX drops are rare after a period of
complacency (low realized volatility) and a -5% move is an adequate shock scenario. We
estimate that this translates into a move of 14 points for the VIX and ~6 points for the VIX
1M future or -50% return for the SPVXSP index (which is the benchmark for VIX ETPs).
However, in such a scenario, volume in VIX futures could easily cross $1Bn vega. Liquidity in
VIX futures has increased substantially in terms of both base of the volume and its tendency
to spike during risk-off events. We construct a multi-factor model for VIX futures volume
which predicts it will likely cross a million contracts ($1Bn vega) in a shock scenario.
Flow from managers of Leveraged VIX Exchange Traded Products (LETP flow) saturates for
large VIX moves. We show that the VIX futures demand due to LETP negative gamma does
not increase linearly but eventually saturates for large positive moves. In our shock scenario
we estimate a demand of ~$110Mn vega which is only 10% of the likely VIX futures volume.
On the other hand, for a large drop in VIX futures, the supply is not bounded and is thus a
bigger concern.
Flow due to forced unwind of inverse VIX ETPs if VIX futures increase by ~100% is not an
incremental effect. The impact of the managers of XIV exercising their option to close the
fund or potential margin call for SVXY in this scenario is already reflected in the LETP flow
calculation and is not an additional effect. We demonstrate that negative LETP gamma is
precisely the managers meeting margin calls by reducing positions.
Short interest in inverse VIX ETPs has increased sharply which will likely mitigate the impact
of LETP flow. A potential reason is that this roundabout way of going long volatility is more
cost effective due to the positive carry from the negative LETP gamma. However, this
strategy, whose payoff resembles a covered call in VIX futures, underperforms for extreme
moves in VIX futures.
In our opinion, the counterparties of the short-sellers of inverse ETPs are market-makers
whose long gamma is mitigating the impact of LETP manager flow. One piece of evidence is
that the LETP flow as measured by the intra-day autocorrelation of VIX futures has declined
substantially over the past few years.
Quantifying a shock scenario
In this section, we quantify the magnitude of a potential “shock scenario” by using history
as a guide. Our goal is to quantify the potential one-day move in SPX and then translate that
into a move in VIX and VIX futures.

Barclays | Index Volatility Weekly
7 August 2017 3
Using all one-day returns for SPX since 1926 as a guide, the potential one-day move can of
course be quite large. SPX has dropped by ~10% several times in one day during the Great
Depression (1929-1933). More recently it dropped by 20% during 1987 and by 5-8%
during the 2008 crises. However, for our purposes the important question is: what is the
expected move when we start with a period of low volatility similar to what we are
experiencing now? In other words, historically, have periods of complacency resulted in
significant negative returns in equities?
Figure 1 plots the negative moves in SPX when the trailing 3M realized volatility was less
than 10% (a total of ~2500 samples). We see that in an overwhelming majority of cases the
one-day returns have been quite low (the bottom quartile is only -0.6%). There have been
only three episodes with moves worse than -3%. Thus the more substantial negative moves
have not occurred suddenly but have been preceded by a period of elevated volatility. Still,
to be conservative, we will assume a shock scenario of 5% for the purpose of this report.
FIGURE 1
SPX moves after a period of complacency
-6%
-5%
-4%
-3%
-2%
-1%
0%
4% 5% 6% 7% 8% 9% 10%
1D SPX Ret
Trailing 3M Realized Volatility
Bottom Quartile
Source: Barclays Research, Bloomberg
The next question is how much will VIX move in such a scenario? As we have discussed in
previous reports, it is more natural to model changes in VIX versus SPX returns. Figure 2
plots the 1D change in VIX as a function of one-day SPX returns. Using all the data since
1990, we see that the relationship is quite linear and we have the rough rule that VIX moves
by one point for a 1% move in SPX.
One key concern is the move in VIX might be larger if the starting value of VIX is low. Hence,
we also show the relationship using only data points where the starting value of VIX is
below 14. The range of SPX returns for this subset of data is of course much smaller.
However, we do see a higher convexity indicating that in the unlikely event of a large move
in SPX starting from a low value of VIX, the potential moves in VIX could be larger than
what is predicted using all data points.

Barclays | Index Volatility Weekly
7 August 2017 4
FIGURE 2
VIX moves are convex relative to SPX returns for low starting
values of VIX
FIGURE 3
The beta of VIX futures moves is half that of VIX and the
convexity is much lower
-5
-4
-3
-2
-1
0
1
2
3
4
5
-4.0% -2.0% 0.0% 2.0% 4.0%
SPX 1D Return
0<VIX<90 0<VIX<14
VIX 1D Move
-5
-4
-3
-2
-1
0
1
2
3
4
5
-4.0% -2.0% 0.0% 2.0% 4.0%
SPX 1D Return
0<VIX<90 0<VIX<14
VIX 1M Future 1D Move
Source: Barclays Research
Note: Data from Jan 1990 to July 2017
Source: Barclays Research
Note: Data from Jan 1992 to July 2017. Constant maturity 1M VIX future
calculated by interpolating the front two calendar VIX futures. VIX futures prior
to Dec 2005 are theoretical values calculated using SPX forward variance swaps.
However, what really matters for VIX ETPs is the move in VIX futures. Almost all of the
relevant VIX ETPs are benchmarked to the SPVXSP index, which holds a portfolio of the
front two VIX futures weighted so that it has exposure to the constant maturity 1M VIX
future. Figure 3 plots the relationship between the moves in the constant maturity 1M VIX
future and SPX returns. VIX futures only started trading since 2005 and before that we
proxy VIX future returns using forward variance swaps. We again see that the relationship is
quite linear using all the data and the beta of the VIX futures is roughly half that of VIX.
Further, the convexity is not as extreme as VIX for low starting values of VIX. Thus, although
the moves in VIX are quite large for sell-offs from a low base in VIX the moves in VIX futures
are not as extreme. This is because the term structure steepens for unexpected moves in
SPX.
We construct a non-linear model of VIX and 1M VIX Future moves as a function SPX returns
and SPX returns squared to capture this effect:
We restrict ourselves to days where the SPX return is negative and the starting value of VIX
is less than 14. We can then use these models to forecast the moves in VIX and VIX futures
for large negative SPX shocks. We emphasize that this amounts to significant extrapolation
of the empirical data.
The results are shown in Figure 4. Thus we see that for a 5% down move in SPX, VIX is
expected to increase by 14 volatility points and the VIX futures by 6 points. In other words,
the SPVXSP index will increase by roughly 50% in our shock scenario since the current
value of 1M VIX futures is approximately 12.

Barclays | Index Volatility Weekly
7 August 2017 5
FIGURE 4
Regression model predicts that VIX futures will increase by ~50% during a shock scenario
0
2
4
6
8
10
12
14
16
-5.0% -4.5% -4.0% -3.5% -3.0% -2.5% -2.0% -1.5% -1.0% -0.5% 0.0%
SPX 1D Return
VIX(VIX<14) 1M VIXFut(VIX<14)
Predicted 1D Move
Source: Barclays Research
Note: Predicted moves calculated by regressing moves in VIX and 1M VIX Future versus SPX 1D return and return
squared for days when starting value of VIX is less than 14 and the SPX return is negative.
Impact of skew
Intuitively, if most of the move in VIX comes because the ATM strike changes as the SPX
moves, one expects that the move in VIX should be higher for higher skew. Thus the
regression model becomes:
The coefficient of the linear term is also called the Skew Stickiness ratio (SSR) (Special
Report: Market Neutral Variance Swap & VIX Futures Strategies, April 28, 2014). This issue
is particularly germane since short dated skew is quite elevated at the current time and is
almost 2x that of its long term historical range.
Figure 5 plots the predicted moves in the 1M VIX Future using this type of model where we
have fixed the skew to be the current value. We see that if we incorporate the effect of skew
and use all the data points the predicted moves are indeed almost 2x that of the simple
return model. However, fitting the same type of model where we restrict ourselves to low
initial values of VIX we see that the effect of skew is not that substantial. The reason for this
is that in the model for very large moves the convexity term is the main contributor and that
does change substantially even when skew is introduced.

Barclays | Index Volatility Weekly
7 August 2017 6
FIGURE 5
Incorporating effect of skew does not materially change the prediction of the model
which only uses low starting values of VIX
0
1
2
3
4
5
6
7
8
-5.0% -4.0% -3.0% -2.0% -1.0% 0.0%
SPX 1D Return
VIX < 14 + Skew VIX < 14 All Data All data + Skew
Predicted 1D 1M VIX Future Move
Source: Barclays Research
Note: Predicted moves calculated by regressing moves 1M VIX Future versus SPX 1D return and return squared for
days using different models. All Data uses all data points, (VIX<14) uses only points when starting value of VIX is less
than 14. Models with Skew regress skew-adjusted SPX 1D return for the linear term. All regressions only use data
points where SPX return is negative.
How will VIX futures volume react if VIX spikes?
In this section, we construct a model for estimating VIX futures volume for large moves in
VIX. This is critical since the impact of potential VIX-related flows during a shock scenario
will be determined not only by their magnitude but also by the overall liquidity in VIX futures
at that time. Our key conclusion is that VIX futures volumes could surpass $1Bn vega (1Mn
contracts) for large moves in VIX.
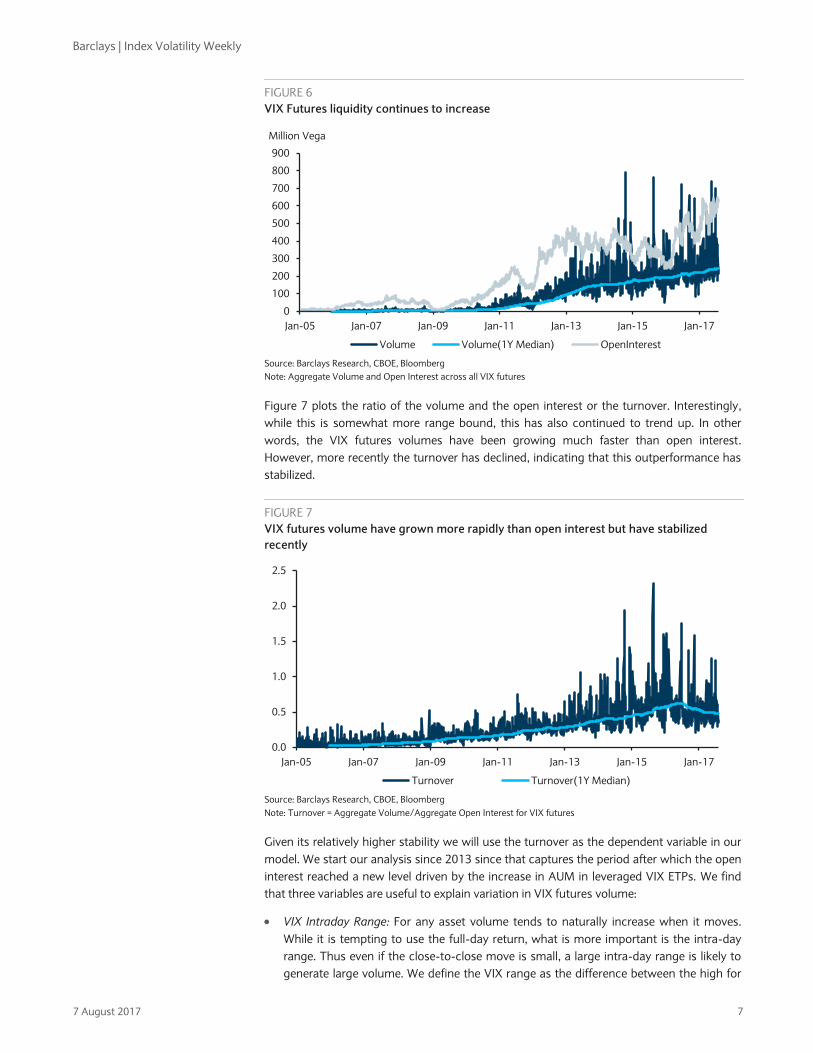
Figure 6 shows the trend in VIX futures liquidity by plotting aggregate open interest and
volume over the last decade and we see that it has increased dramatically over this time
period. Since the futures volume tends to increase when VIX spikes, we also show the one-
year moving median of the volume to capture the “base” volume which continues to trend
up and is now ~$200M vega/day. Importantly, we see that the volume frequently spiked to
~$800M vega over the past few years.
Barclays | Index Volatility Weekly
7 August 2017 7
FIGURE 6
VIX Futures liquidity continues to increase
0
100
200
300
400
500
600
700
800
900
Jan-05 Jan-07 Jan-09 Jan-11 Jan-13 Jan-15 Jan-17
Million Vega
Volume Volume(1Y Median) OpenInterest
Source: Barclays Research, CBOE, Bloomberg
Note: Aggregate Volume and Open Interest across all VIX futures
Figure 7 plots the ratio of the volume and the open interest or the turnover. Interestingly,
while this is somewhat more range bound, this has also continued to trend up. In other
words, the VIX futures volumes have been growing much faster than open interest.
However, more recently the turnover has declined, indicating that this outperformance has
stabilized.
FIGURE 7
VIX futures volume have grown more rapidly than open interest but have stabilized
recently
0.0
0.5
1.0
1.5
2.0
2.5
Jan-05 Jan-07 Jan-09 Jan-11 Jan-13 Jan-15 Jan-17
Turnover Turnover(1Y Median)
Source: Barclays Research, CBOE, Bloomberg
Note: Turnover = Aggregate Volume/Aggregate Open Interest for VIX futures
Given its relatively higher stability we will use the turnover as the dependent variable in our
model. We start our analysis since 2013 since that captures the period after which the open
interest reached a new level driven by the increase in AUM in leveraged VIX ETPs. We find
that three variables are useful to explain variation in VIX futures volume:
VIX Intraday Range: For any asset volume tends to naturally increase when it moves.
While it is tempting to use the full-day return, what is more important is the intra-day
range. Thus even if the close-to-close move is small, a large intra-day range is likely to
generate large volume. We define the VIX range as the difference between the high for

Barclays | Index Volatility Weekly
7 August 2017 8
the day and the minimum of low and previous close normalized by the previous close.
We find that this VIX futures volume has much higher correlation with this metric
relative to a simple close-to-close return. Figure 8 plots the dependence of the VIX
future volume on the range and we see that the dependence appears quite linear.
VIX Level: VIX futures volume also depends on the absolute level of the closing level of
VIX as shown in Figure 9. However, the dependence is quite non-linear: for VIX less than
~13.5 the turnover is almost constant and then starts increasing but at a decreasing
rate. Figure 9 shows a non-linear model which provides a good fit to the data.
Previous Turnover: Finally, as might be expected, there is strong auto-correlation in the
VIX futures volume indicating that large volume episodes cluster. We find that simply
using previous day’s volume captures most of this effect.
FIGURE 8
VIX Futures Turnover linearly increases with VIX intra-day
range
FIGURE 9
Non-linear dependence of Turnover on level of VIX
0.20
0.30
0.40
0.50
0.60
0.70
0.80
0.90
1.00
1.10
1.20
0% 5% 10% 15% 20% 25% 30% 35%
Turnover
VIX Range
0.20
0.30
0.40
0.50
0.60
0.70
0.80
0.90
1.00
1.10
1.20
10 15 20 25
Turnover
VIX
Source: Barclays Research, CBOE, Bloomberg
Note: Turnover = Aggregate Volume/Aggregate Open Interest for VIX futures,
Range = (max(High, Prev Close) – min(Low,Prev Close))/Prev Close. Solid line
represents a linear fit
Source: Barclays Research, CBOE, Bloomberg
Note: = Aggregate Volume/Aggregate Open Interest for VIX futures. Solid line
represents a model of the form f(x) = A + B*max(0, (x-13.5)^0.8 )
We construct a joint regression model which includes these three factors and find that the
t-stats for all three are significant, indicating that all of them provide incremental
explanatory power. The R-square of the joint model is quite robust at ~80%. Figure 10
compares the fitted normalized futures volume with the actual values and we see that this
model does an adequate job in describing the variation in futures volume. Note that the
model is not fully able to capture the spikes, and thus, if anything, it appears to be slightly
conservative.

Barclays | Index Volatility Weekly
7 August 2017 9
FIGURE 10
Three factor model captures the variation in VIX futures volumes over time
-0.5
0.0
0.5
1.0
1.5
2.0
2.5
3.0
Jan-13 Jul-13 Jan-14 Jul-14 Jan-15 Jul-15 Jan-16 Jul-16 Jan-17 Jul-17
Turnover Fitted Turnover Residual
R-squared = 80%
Source: Barclays Research, CBOE, Bloomberg
Note: Fitted Turnover calculated using a regression of Turnover versus VIX Range, non linear function of VIX and
previous days turnover.
Armed with this model we can then forecast the potential volume for large moves in VIX.
Figure 11 assumes a starting value of VIX of 10 and then simulates the volume for different
shocks (we assume that VIX settles at its highs). Our model provides a link between VIX
returns and turnover. We convert the turnover into VIX future volumes using the current
value of the open interest and the VIX index returns into returns of the 1M VIX future using
a beta of 0.5.
FIGURE 11
Our model predicts that VIX futures volume could cross $1Bn vega in a shock scenario
0
200
400
600
800
1,000
1,200
1,400
5% 10% 15% 20% 25% 30% 35% 40% 45% 50%
1M VIX Fut Return
Predicted Volume ( Million Vega)
Source: Barclays Research, CBOE, Bloomberg
Note: Predicted Volume calculated based on a regression model of Turnover versus VIX Range, non linear function of
VIX and previous days turnover.
Thus we see that for a 50% move in the 1M VIX Futures, VIX future volumes are likely to
surpass $1Bn vega (1Mn contracts).

Barclays | Index Volatility Weekly
7 August 2017 10
Understanding LETP manager flow
In this section we analyze the flow generated by managers of leveraged VIX Exchange
Traded Products (LETP flow). We provide a mathematical derivation of the formula for the
flow and analyze its implications for large positive and negative moves in VIX futures.
Theoretical derivation of the LETP flow formula
The key reason for the LETP flow is requirement that these ETPs target a constant daily
leverage. Thus the inverse ETPs (XIV and SVXY) target a return which is negative of the
SPVXSP (the underlying) asset and a 2x leveraged VIX ETP like TVIX and UVXY target
double the return of SPVXSP. We first recap the mathematical derivation of formula for this
flow (Leveraged ETPs: Myths & Reality, November 17, 2009).
In general, suppose we have an m times leveraged ETP with a current AUM of at time at
the close on day . In order to guarantee the m times return over the next day, the ETP
manager needs to hold a position of of the underlying index which we label as the
target hedge, . As we will see below, it is important to distinguish between the target and
actual value of the hedge. We assume at that the manager is correctly hedged and so:
Suppose now the index move by percent between times and . Then:
Thus ETP successfully provided a one day return of . However, now value of the target
hedge is not the same as the actual value of the hedge.
Thus the manager must rebalance the hedge at the close of . Thus the LETP flow in
notional terms is:
Thus notional ETP flow is simply proportional to the return of the underlying asset. Note
that the sign of the flow is always the same as that of the return r. Thus as the VIX futures
move up (down) the manager needs to buy (sell) VIX futures and thus the manager
behaves as if he has negative gamma. Note that this formula is also valid even for inverse
ETPs with a negative m. In fact for both inverse and 2x leveraged ETPs and
thus the flow for both inverse and 2x leveraged ETPs is equal for the same AUM.
However, what we really care about is the number of shares of the asset (which is
equivalent to the number of VIX futures or vega) that need to be traded:
Expressing everything in vega terms:
Where is the AUM expressed in terms of vega (or number of VIX futures).
For small values of , the above formula can be written as:

Barclays | Index Volatility Weekly
7 August 2017 11
Thus for small moves in the underlying the hedge rebalance increases linearly with r. Hence
in our VIX Compass publication, we simply show the flow across all LETPs for a 10% move
in SPVXSP.
However, for large moves the non-linearity plays an important role. Further, a crucial
difference emerges across the different ETPs for positive and negative moves in the
underlying index.
Growth in LETP flow for large increase in VIX futures
Figure 12 plots the hedging demand for SVXY, XIV and TVIX (the demand for UVXY is the
same as TVIX) as a function of (positive) one-day returns of SPVXSP. To facilitate
comparison across products, we calculate the flow for an AUM of $100 vega for each
product.
FIGURE 12
When volatility increases, the demand from inverse VIX ETPs caps out at current AUM
while that for 2x leveraged ETPs continues to increase albeit at a decreasing rate
0
20
40
60
80
100
120
140
160
180
200
0% 50% 100% 150% 200% 250% 300%
TVIX/UVXY Max TVIX/UXY SVXY XIV
VIX ETP vega demand for 100 vega AUM
SPVXSP 1D Return
Source: Barclays Research
We see that for TVIX/UVXY the rate of increase of the flow starts to decline with increasing
SPVXSP return and the maximum flow caps out at for large . This is simply because:
Since this is the value of their current hedge, the 2x leveraged ETPs will at
worse be forced to double their existing hedge for extreme positive moves.
However, for inverse ETPs the situation is more subtle. We see that the flow from SVXY and
TVIX are same until , diverge after that and then flat-line to 100 for .
The primary reason for the flat-line for large moves in VIX is that for the return of
the inverse ETP is and hence its value goes to zero. Crucially even if the
value of inverse ETP is still floored at zero since ETPs are non-recourse instruments.
Investors in these products can only lose their initial investment in these products and the
manager cannot demand additional cash.
Note the above formula correctly predicts that for the flow is . For the inverse
ETP this is of course also the value of the hedge and thus the issuer simply buys back the
entire hedge and closes the fund. Thus, interestingly we see that for both inverse and 2x
leveraged products the maximum demand when VIX futures increase is the current value of
their hedge.
What will happen if the one-day return is higher than 100% ( )? The issuer will
still only buy back the original hedge but now the loss after closing the position is larger

Barclays | Index Volatility Weekly
7 August 2017 12
than the equity in the fund. For an ETN, this extra loss is borne by the issuer (since an ETN is
essentially a bond issued by the issuer). For an ETF the situation is less clear since the
manager is only an investment advisor with the assets of the fund being held in trust. Our
best guess is that the risk is probably borne by the counterparty to the hedge.
This gap risk explains why XIV (which is an ETN) has a clause that the issuer has the option
of closing the fund if its value drops by 80%. Essentially, the remaining 20% value of the
fund provides the issuer with a buffer to unwind the entire hedge. As a result, as shown in
Figure 12, if SPVXSP increases by 80%, while the SXVY manager will buy back
89% of its hedge, the XIV manager will buy back 100% of its hedge.
Forced unwind risk of inverse ETPs is not an incremental risk
There has been quite a lot of discussion among market participants about the risk of a
“forced unwind” of XIV if SPVXSP increases by 80% and the issuer exercises this option.
Similarly, since the initial and maintenance margin for VIX futures is currently 62% and
56%, respectively, there are concerns that SVXY will face a margin call if SPVXSP increases
significantly.
While this is no doubt a risk, this is already captured in negative-gamma-driven flow and is
thus not an additional risk. Indeed, the negative gamma dynamic of LETPs can be
interpreted as the result of the negative ETP managers meeting margin calls (Leveraged
ETPs : Myths & Reality, November 17, 2009). Consider an investor who takes a leveraged
position in an asset. Then the exchange or his prime-broker would require him to post initial
margin to protect itself from the risk of the investor defaulting after a large adverse move in
the underlying. If the asset does move in an adverse direction, the investor is required to
post more cash (maintenance margin). However, the investor always has the option to
reduce his position to be consistent with the value of the existing cash in his account.
Essentially, after an adverse move, his leverage increases and he can bring the leverage in
line with the maintenance margin by reducing his position. This is exactly what the
leveraged ETP managers do. In fact they have no choice but to do this since they cannot
request more money from their end investors. Thus, all LETPs (including SVXY) are meeting
margin calls every day by reducing their exposure.
The accelerated redemption of XIV if VIX futures were to increase by 80% does lead to an
additional effect but that simply accelerates the unwind of the remaining 11% of the AUM.
The buy-back of 89% of the hedge is already included in the negative gamma effect. As a
result, as shown in Figure 12, the flow for XIV and SVYY diverge after .
Unfortunately, a common error we have noticed is that market participants calculate the
flow from the negative gamma effect and then layer on an additional impact of the “forced
unwind” or “margin call” for the inverse ETPs. The above discussion indicates that this
amounts to double counting.
To summarize, for the same AUM, the 2x leveraged ETPs are far more of a concern relative
to the inverse ETPs. The hedging demand from the latter caps out at their value of AUM for
The 2x leveraged ETPs will only buy back half of their hedge when and
for larger moves their hedging demand continues to increase but eventually caps out at the
value of their current hedge.
Large drops in VIX futures pose a much bigger risk
For large negative moves the situation is (partially) reversed as shown in Figure 13. For
small negative moves the situation is exactly the opposite that of small positive moves as
discussed above. However, again we see a remarkable divergence for large negative moves
in SPVXSP.

Barclays | Index Volatility Weekly
7 August 2017 13
FIGURE 13
When volatility declines, the supply from 2x leveraged products is limited to their current
hedge but that for inverse ETPs continues to accelerate
-500
-450
-400
-350
-300
-250
-200
-150
-100
-50
0
-70% -60% -50% -40% -30% -20% -10% 0%
UVXY TVIX SVXY/XIV
VIX ETP vega demand for 100 vega AUM
SPVXSP 1D Return
Source: Barclays Research
For if it is the value of a 2x LETP that goes to zero and the manager will unwind
their entire hedge. This is the maximum supply from 2x LETPs even if TVIX
(which is an ETN) also has the clause that its issuer has the option of unwinding the entire
fund if its value drops by 80% and hence the flow for TVIX drops to 200 once we hit this
point.
The situation for inverse ETPs is quite different. For the supply is already equal to
twice the current vega of the hedge. Moreover, for the supply from the inverse
ETPs keeps on increasing similar to what happens to 2x leveraged products for
However, while the demand the 2x leveraged ETPs is capped at the current value of the
hedge for positive moves, there is no cap in the supply from the inverse product for negative
moves since
In the unlikely event that VIX futures drop by 90% they
would 18x of their current AUM.
While a significant down move in VIX futures is unlikely when the market is in a risk-on
mode and VIX is low, the likelihood of this scenario increases significantly if VIX is already at
elevated levels.
Expected flows in a shock scenario given current AUMs are not large
relative to expected volume
Figure 14 plots the total demand using the current AUMs in the four major LETPs.

Barclays | Index Volatility Weekly
7 August 2017 14
FIGURE 14
While large expected flows are not a significant fraction of expected volumes
-500
-400
-300
-200
-100
0
100
200
300
-250
-200
-150
-100
-50
0
50
100
-60% -40% -20% 0% 20% 40% 60% 80% 100% 120% 140% 160%
UVXY TVIX XIV SVXY Total (RHS)
VIX ETP vega demand using actual AUM
SPVXSP 1D Return
Source: Barclays Research, CBOE, Bloomberg
Thus we see that for our shock scenario of a 50% increase in 1M VIX futures the demand
would be ~$110Mn vega. Even for extremely large positive moves of 160%, the demand
only increases to ~170M vega (or 170k VIX futures). As discussed in the previous section,
we estimate that VIX futures volumes will cross $1Bn vega in such a scenario and thus this
demand will likely be easily absorbed, in our opinion.
Note that the supply for a 50% down move in VIX futures the supply is already at ~$320Mn
and it continues to increase after that point.
Impact of Short Interest in Inverse VIX ETPs
In this section we discuss the impact of the elevated short interest in inverse VIX ETPs that
we first highlighted in a previous publication (Index Volatility Weekly: UPDATE: A new
source of risk: Short Interest in Leveraged VIX ETPs, March 21, 2017).
In general, an investor can use VIX ETPs to get positive or negative exposure to volatility
using four different channels. Figure 15 plots the evolution of these four exposures over
time. We see that since 2009, when VIX ETPs were first launched, each of these channels
have successively become active.
1. Long volatility exposure via investing in Long Volatility ETPs: Investors can go long
volatility by investing directly in a long volatility ETP. These can be un-leveraged and
provide 1x exposure to the underlying index (SPVXSP) or can be leveraged and provide
2x the exposure to the SPVXSP. These were introduced in 2009 and quickly increased to
~$100Mn vega. The AUM reached a new plateau of ~$200Mn in 2012 after the
introduction of the 2x leveraged ETPs. The AUM increased to ~$300Mn in 1Q2016 and
has reverted back to ~$200Mn recently.
2. Short volatility exposure via shorting Long Volatility ETPs: Since ETPs are similar to
ordinary stocks they can also be shorted. In this case the investor shorts the long
volatility ETPs and thereby gets a short volatility exposure. Note that similar to any short
position, the potential loss from this position is (in principle) unlimited. Further, the
investor is subject to margin calls for adverse moves. The vega exposure from this
channel has steadily increased over time. Relative to the long volatility exposure, while it
was quite large during 2011 (almost 2x) it is now slightly smaller.

Barclays | Index Volatility Weekly
7 August 2017 15
3. Short volatility exposure via investing in Inverse Volatility ETPs: Here the investor simply
buys an inverse volatility ETP such as XIV or SVXY. In this case, the potential loss for the
investor is limited to his investment and he does not get a margin call. Thus some risk
management is directly built into these products. However, this benefit comes at a cost
of negative carry induced by the negative gamma dynamic discussed in the previous
section. These were introduced in 4Q2010 and their AUM has steadily increased over
time at now stands at ~$150M.
4. Long volatility exposure via shorting Inverse Volatility ETPs: Here the investor shorts an
inverse ETP and thus gains a long exposure to volatility. While it was quite small it has
grown exponentially over the past two years and in fact it is slightly larger than the AUM
in long volatility ETPs.
FIGURE 15
The four channels for getting volatility exposure using VIX ETPs
-200
-100
0
100
200
300
400
Jan-09 Jan-10 Jan-11 Jan-12 Jan-13 Jan-14 Jan-15 Jan-16 Jan-17
AUM:Long Vol ETPs SI:Long Vol ETPs AUM:Inv ETPs SI:Inv Vol ETPs
Volatility Exposure ($Mn Vega)
Source: Barclays Research, Bloomberg, CBOE
Risk Reward of Shorting inverse VIX ETPs
Shorting inverse VIX ETPs appears to be quite a convoluted way to gain long volatility
exposure relative to simply buying a long volatility ETP. In this section, we try to shed some
light on why the former strategy appears to be becoming more popular.
In Figure 16 compares the risk reward profiles of simply going long the SPVXSP index
versus shorting the inverse VIX ETP (which we label as the SIVIX strategy). We show the 1M
returns of these two strategies as a function of SPVXSP returns.

Barclays | Index Volatility Weekly
7 August 2017 16
FIGURE 16
Comparing risk-reward of buying long volatility ETPs versus shorting inverse ETPs
-100%
-50%
0%
50%
100%
150%
-50% -25% 0% 25% 50% 75% 100% 125% 150%
SPVXSP 1M Ret
SIVIX 1M Ret SPVXSP Ret 1M/(1+SPVXSP Ret 1M) SPVXSP 1M Ret
Source: Barclays Research, Bloomberg
We clearly see that the SIVIX strategy outperforms SPVXSP for small moves in SPVXSP and
then underperforms for both large positive and negative moves in SPVXSP. This can be
understood using the “golden rule” for Leveraged ETPs that we have derived in our previous
publications (Leveraged ETPs : Myths & Reality, November 17, 2009 and Update: Index
Volatility Weekly - Implications of Recent Dynamics of TVIX, February 29, 2012). In general
the price of the mX leveraged ETP after time T can be written as:
Here is the realized volatility of the underlying during this time period. Thus price of the
LETP is path dependent in that it is depends on the final price of the underlying index and its
realized volatility over that time period.
However the dependence on the underlying index is not linear but a convex function. Thus
for large moves in the underlying this factor will always outperform a static leveraged
position. However the return of the LETP is always lower than that implied by the power law
since (“the drag”) is always less than 1. This drag precisely captures the negative gamma
effect discussed in an earlier section above. Note that this equation is exact and remains
valid even if the underlying follows a general stochastic process. If it followed a simple
Black-Scholes model then (“the drag factor”) is a constant but in general it is also a
random quantity.
As we discussed in our previous report, buying a LETP can be viewed as buying a power
option with a convex payoff of
. Since the payoff is convex it resembles an option and
indeed exposure to it would require an investor pay an “option premium” to a market
maker. In our previous publication we showed that in a Black-Scholes world the premium is
exactly equal to . In the drag in the LETP, assuming implied and realized volatility are
equal, the investor pays the premium “as he goes” instead of paying it upfront.
For the SIVIX strategy, ignoring the drag, the return would be:
which we plot also
in Figure 16. As expected the actual return is always higher (since the strategy receives this
premium).

Barclays | Index Volatility Weekly
7 August 2017 17
The power law payoff can be replicated using a strip of options and thus the SIVIX strategy
is equivalent to going to long SPVXSP and shorting a strip of options on SPVXSP (a sort of
covered call strategy).
Of course this still maintains a long volatility exposure and a more neutral approach would
be short SPVXSP. In our previous publications we had suggested that some investors might
be implementing this strategy. However, there are two reasons which argue against this
possibility. Firstly, this strategy can also be done by shorting the 2x LETPs and that short
interest is not as high as that in inverse VIX ETPs ($41Mn and $245Mn respectively). In fact
as shown in Figure 15 the total short interest in long volatility ETPs ($102Mn) is lower than
the short interest in inverse ETPs. Thus a more reasonable interpretation is that investors
are seeking outright long volatility via the SIVIX strategy.
Who are the counterparties of short-sellers of inverse VIX ETPs?
Although it is obvious, it is important to remember that when an investor short-sells a
security in the market some other market participant has to buy it. But who is the
counterparty in this case? There are two possibilities:
She is simply another regular investor who wants to go long an inverse VIX ETP. This
effectively increases the synthetic AUM in the inverse ETP. In this case the net exposure
does not change but the gross increases.
The counterparty is a market-maker. In this case, she has two choices: a) She tenders
these shares to the ETP manager; or b) She holds on to the shares but hedges the
exposure using VIX futures herself. Irrespective of the market maker’s choice the net
exposure declines and the gross exposure remains the same.
Figure 17 illustrates these scenarios. Thus we assume that the ETP Issuer has issued 100
vega of the inverse VIX ETP which are bought by Investor A and Investor B. The Issuer
hedges by selling 100 VIX futures.
FIGURE 17
Scenarios for how a short-seller in an Inverse VIX ETP would affect positioning
Source: Barclays Research
Now suppose a Short Seller wants to short 25 shares. He borrows them from Investor B
who of course retains the economic exposure of this asset. The Short Seller then sells it in
the market and this exposure to the ETP is now -25. Now we consider three scenarios.
Scenario A: The counterparty to the Short Seller is Investor C who simply buys the ETP and
holds it. In this scenario then net flow to VIX futures does not change.
Scenario B: In this case the counterparty is a Market Maker who hedges his long exposure
by buying 25 VIX futures. In this scenario, the net flow to VIX futures has now decreased to
75.
Inverse ETP / VIX
Future ExposureIssuer
Investor
A
Investor
B
Short
Seller
Investor
C
Market
Maker
Net VIX
Future
Initial -100/-100 75/0 25/0 -100
Scenario A -100/-100 75/0 25/0 -25/0 25/0 -100
Scenario B -100/-100 75/0 25/0 -25/0 25/25 -75
Scenario C (Step 1) -100/-100 75/0 25/0 -25/0 25/25 -75
Scenario C (Step 2) -75/-75 75/0 25/0 -25/0 0/0 75

Barclays | Index Volatility Weekly
7 August 2017 18
Scenario C: Here the first step is the same as Scenario B but in the second step the market
maker sells his 25 shares to the issuer. This reduces the overall shares outstanding to 75
and the issuer then reduces his hedge to 75. Thus from the perspective of VIX future
demand this is the same as Scenario B.
Simply looking at the AUM and Short Interest it is not possible to know whether we are in
Scenarios A or B/C and in reality it is a mixture of these two. Note that as far as the
rebalancing that happens as VIX moves, there is no difference between Initial situation and
Scenario A. However in Scenarios B and C the net flow into VIX futures market will decrease.
In the next section we provide some evidence that we might be closer to Scenarios B/C.
Assessing the impact of the LETP flow
In this section we examine whether the flows in VIX ETP managers have actually impacted
VIX future prices.
Figure 18 plots the actual LETP flow (calculated by using the AUMs across all LETPs and
actual move in SPVXSP) on a daily basis. We see that the magnitude of this flow has
increased quite substantially as the AUM in the LETPs has increased. In particular during
the volatility during the Brexit vote in 2016, the flows would have been as high as ~$80Mn
vega. However, as discussed in the section on liquidity (Figure 6), VIX future volumes also
increased dramatically during that time to ~$800M vega. Figure 18 also plots the ratio of
LETP flow with the weighted volume in the front two VIX futures (which are a more relevant
metric for assessing impact). We see that the normalized flow has remained in the 30%-
40% range which was similar to its range during 2012 when both the AUM and volumes
were much lower.
FIGURE 18
The LETP flow has increased substantially in absolute terms but is more range bound
relative to future volume
0%
5%
10%
15%
20%
25%
30%
35%
40%
-80
-60
-40
-20
0
20
40
60
80
100
Jul-10 Jul-11 Jul-12 Jul-13 Jul-14 Jul-15 Jul-16 Jul-17
Vega($Mn)
LETP Flow Normalized LETP Flow(RHS)
Source: Barclays Research, CBOE, Bloomberg
This much flow, especially if concentrated near the close, should have had a meaningful
impact on VIX future prices and should have exacerbated the moves in VIX futures near the
close. One way to quantify this impact is to calculate the auto-correlation between the
move in SPVXSP from the previous close to 3 p.m., and from 3 p.m. to the close at 4:15 p.m.
Of course, VIX futures can move because of moves in S&P futures. Hence we first calculate
the (one year trailing) beta adjusted returns of SPVXSP. To ensure that there is nothing
idiosyncratic about the 3 p.m. point we also calculate the correlations for several different
intra-day times.

Barclays | Index Volatility Weekly
7 August 2017 19
FIGURE 19
Intra-day autocorrelation in VIX futures have declined over time
0%
5%
10%
15%
20%
25%
30%
35%
40%
-20%
-10%
0%
10%
20%
30%
40%
50%
60%
70%
Jul-11 Apr-12 Jan-13 Oct-13 Jul-14 Apr-15 Jan-16 Oct-16 Jul-17
nLETP Flow(RHS) nLETP Net Flow(RHS) 2PM 3PM 4PM
SPVXSP Intra-day 1Y Corr Normalized LETP Flow
Source: Barclays Research, CBOE, Bloomberg
Note: Intra-day correlation calculated by calculating the correlation between moves in SPVXSP from previous day to an
intra-day time (2, 3 and 4 pm) and the beta-adjusted SPVXSP return from that time to the VIX futures close (4:15 pm).
nLETP flow = ratio of flow based on LETP AUMs and weighted front two futures volume. nLETP Net Flow calculated by
first netting the AUM with the Short Interest in LETPs.
The results are shown in Figure 19 and we see several interesting trends:
Broadly the auto-correlations were significantly positive initially during 2012 when the
LETPs were first introduced and the normalized LETP flow was in the ~30% range.
During this time, autocorrelation was highest at 4 p.m., indicating that much of the
trading was being done near the close. However, over time the difference across
different times has become less.
Over the next few years (until 2014), the normalized LETP flow declined mainly because
of increasing liquidity and the autocorrelation declined along with it.
However, beginning in 2015, the normalized LETP flow began to increase driven by the
increase in AUM in LETPs, and although the autocorrelation increased it did not go back
to the 2012 level.
Beginning in 2016, even though the normalized LETP flow has declined the auto-
correlation has declined much more rapidly
One possible explanation is that the net normalized LETP flow (which is calculated by
netting the AUM and Short Interest in LETPs has declined much more significantly due to
the increase in short interest. Thus this analysis provides some evidence that the
counterparties to the short-sellers in inverse ETPs are market-makers whose hedging
activity is mitigating the impact of the flows from the LETP managers.
Summary
Thus in summary:
Based on history, complacency does not necessarily lead to large negative moves in SPX
In the event of a shock scenario, VIX futures volumes will likely cross $1Bn vega
The LETP flow does not increase linearly with VIX future move but saturates for large
moves

Barclays | Index Volatility Weekly
7 August 2017 20
The “forced unwind” scenario for inverse VIX ETPs is already included in the LETP flow
calculation
The flow from market makers who are the counterparties to short sellers of inverse VIX
ETPs will likely counteract the flow from LETP managers
Hence, in summary we don’t expect LETP flow to be a major source of stress in the VIX
futures market.

Barclays | Index Volatility Weekly
7 August 2017 21
Global Volatility Snapshot
FIGURE 20
Price Performance
FIGURE 21
Implied Volatility
80
85
90
95
100
105
110
115
120
125
130
Aug-16 Nov-16 Feb-17 May-17
SPX SX5E NKY HSI
Price Performance
0
5
10
15
20
25
Aug-16 Nov-16 Feb-17 May-17
SPX SX5E NKY HSI
3M IV
Source: Barclays Research, Bloomberg, OptionMetrics
Past performance is not a guarantee of future results.
Source: Barclays Research, Bloomberg, OptionMetrics
FIGURE 22
Implied - Realized Volatility
FIGURE 23
Skew
-15
-10
-5
0
5
10
15
Aug-16 Nov-16 Feb-17 May-17
SPX SX5E NKY HSI
3M IV - RV
0
2
4
6
8
10
12
14
Aug-16 Nov-16 Feb-17 May-17
SPX SX5E NKY HSI
3M 90%-110%
Source: Barclays Research, Bloomberg, OptionMetrics Source: Barclays Research, Bloomberg, OptionMetrics
FIGURE 24
Term Structure
FIGURE 25
Implied Correlation
-2
-1
0
1
2
3
4
5
Aug-16 Nov-16 Feb-17 May-17
SPX SX5E NKY HSI
12M-3M Term Structure
0%
10%
20%
30%
40%
50%
60%
70%
80%
Aug-16 Nov-16 Feb-17 May-17
SPX SX5E NKY HSI
3M Implied Correlation
Source: Barclays Research, Bloomberg, OptionMetrics Source: Barclays Research, Bloomberg, OptionMetrics

Barclays | Index Volatility Weekly
7 August 2017 22
FIGURE 26
Global Index Volatility Snapshot
Ticker Level Δ 1W 2Y %-ile Level Δ 1W 2Y %-ile Level Δ 1W 2Y %-ile Level Δ 1W 2Y %-ile
Americas
SPX 9.7% 0.2% 4% 9.6% 0.2% 35% 3.4% 0.0% 65% 26.7% 2.0% 5%
NDX 14.6% -0.3% 23% 10.2% 0.0% 60% 1.5% 0.0% 22% 37.4% 0.2% 50%
RUY 14.7% 0.5% 4% 8.1% -0.2% 26% 2.7% -0.4% 83% 22.7% 2.6% 7%
EMEA
SX5E 12.9% -0.3% 1% 7.6% -0.5% 17% 2.8% 0.0% 84% 46.1% -0.4% 6%
UKX 9.9% -0.5% 1% 6.8% 0.6% 14% 3.2% 0.0% 78% 22.8% 1.0% 4%
DAX 13.2% -0.1% 6% 7.5% 0.1% 21% 2.1% -0.2% 75% 48.7% 1.6% 15%
SMI 10.7% -0.7% 1% 7.7% 0.4% 51% 2.5% 0.3% 91% 39.2% -7.7% 19%
Asia
NKY 11.5% -0.5% 1% 6.3% -0.6% 63% 3.1% 0.3% 90% 31.7% -1.7% 3%
HSCEI 16.3% 0.9% 12% 2.9% -1.0% 21% 2.3% -0.3% 70% 58.1% 9.4% 6%
HSI 13.2% 0.7% 13% 4.1% -0.2% 27% 2.3% -0.3% 70% 44.6% 9.7% 5%
KOSPI2 11.2% 0.1% 6% 4.8% -0.4% 27% 1.8% -0.4% 30% 0.0% 0.0% 0%
NIFTY 11.4% 0.3% 15% 4.3% 0.9% 32% 2.2% -0.2% 81% - - -
TAMSCI 11.9% 0.7% 6% 4.2% 0.8% 25% 1.7% -1.3% 47% - - -
AS51 11.9% -0.3% 7% 5.4% -0.2% 10% 2.1% -0.1% 58% 24.7% -2.6% 1%
3M Implied Volatility 3M Skew 12M -3M Term Structure 3M Implied Correlation
Source: Barclays Research, Bloomberg, OptionMetrics

Barclays | Index Volatility Weekly
7 August 2017 23
ANALYST(S) CERTIFICATION(S):
I, Maneesh S. Deshpande, hereby certify (1) that the views expressed in this research report accurately reflect my personal views about any or all
of the subject securities or issuers referred to in this research report and (2) no part of my compensation was, is or will be directly or indirectly
related to the specific recommendations or views expressed in this research report.
IMPORTANT DISCLOSURES CONTINUED
Barclays Research is a part of the Investment Bank of Barclays Bank PLC and its affiliates (collectively and each individually, "Barclays").
Availability of Disclosures:
Where any companies are the subject of this research report, for current important disclosures regarding those companies please refer to
https://publicresearch.barclays.com or alternatively send a written request to: Barclays Research Compliance, 745 Seventh Avenue, 13th Floor,
New York, NY 10019 or call +1-212-526-1072.
The analysts responsible for preparing this research report have received compensation based upon various factors including the firm's total
revenues, a portion of which is generated by investment banking activities, the profitability and revenues of the Markets business and the
potential interest of the firm's investing clients in research with respect to the asset class covered by the analyst.
All authors contributing to this research report are Research Analysts unless otherwise indicated.
The publication date at the top of the report reflects the local time where the report was produced and may differ from the release date provided
in GMT.
Analysts regularly conduct site visits to view the material operations of covered companies, but Barclays policy prohibits them from accepting
payment or reimbursement by any covered company of their travel expenses for such visits.
In order to access Barclays Statement regarding Research Dissemination Policies and Procedures, please refer to
https://publicresearch.barcap.com/static/S_ResearchDissemination.html. In order to access Barclays Research Conflict Management Policy
Statement, please refer to: https://publicresearch.barcap.com/static/S_ConflictManagement.html.
The Investment Bank’s Research Department produces various types of research including, but not limited to, fundamental analysis, equity-linked
analysis, quantitative analysis, and trade ideas. Recommendations contained in one type of research product may differ from recommendations
contained in other types of research, whether as a result of differing time horizons, methodologies, or otherwise.
Risk Disclosure(s)
Options are not suitable for all investors. Please note that the trade ideas within this research report do not necessarily relate to, and may directly
conflict with, the fundamental ratings applied to Barclays Equity Research. The risks of options trading should be weighed against the potential
rewards.
Risks:
Call or put purchasing: The risk of purchasing a call/put is that investors will lose the entire premium paid.
Uncovered call writing: The risk of selling an uncovered call is unlimited and may result in losses significantly greater than the premium received.
Uncovered put writing: The risk of selling an uncovered put is significant and may result in losses significantly greater than the premium received.
Call or put vertical spread purchasing (same expiration month for both options): The basic risk of effecting a long spread transaction is limited to
the premium paid when the position is established.
Call or put vertical spread writing/writing calls or puts (usually referred to as uncovered writing, combinations or straddles; same expiration
month for both options): The basic risk of effecting a short spread transaction is limited to the difference between the strike prices less the
amount received in premiums.
Call or put calendar spread purchasing (different expiration months; short must expire prior to the long): The basic risk of effecting a long
calendar spread transaction is limited to the premium paid when the position is established.
Because of the importance of tax considerations to many options transactions, the investor considering options should consult with his/her tax
advisor as to how taxes affect the outcome of contemplated options transactions.
Supporting documents that form the basis of our recommendations are available on request.
The Options Clearing Corporation's report, "Characteristics and Risks of Standardized Options", is available at
http://www.theocc.com/about/publications/character-risks.jsp
Master limited partnerships (MLPs) are pass-through entities structured as publicly listed partnerships. For tax purposes, distributions to MLP
unit holders may be treated as a return of principal. Investors should consult their own tax advisors before investing in MLP units.
Guide to the Barclays Fundamental Equity Research Rating System:
Our coverage analysts use a relative rating system in which they rate stocks as Overweight, Equal Weight or Underweight (see definitions below)
relative to other companies covered by the analyst or a team of analysts that are deemed to be in the same industry (the "industry coverage
universe").
In addition to the stock rating, we provide industry views which rate the outlook for the industry coverage universe as Positive, Neutral or
Negative (see definitions below). A rating system using terms such as buy, hold and sell is not the equivalent of our rating system. Investors
should carefully read the entire research report including the definitions of all ratings and not infer its contents from ratings alone.

Barclays | Index Volatility Weekly
7 August 2017 24
IMPORTANT DISCLOSURES CONTINUED
Stock Rating
Overweight - The stock is expected to outperform the unweighted expected total return of the industry coverage universe over a 12-month
investment horizon.
Equal Weight - The stock is expected to perform in line with the unweighted expected total return of the industry coverage universe over a 12-
month investment horizon.
Underweight - The stock is expected to underperform the unweighted expected total return of the industry coverage universe over a 12-month
investment horizon.
Rating Suspended - The rating and target price have been suspended temporarily due to market events that made coverage impracticable or to
comply with applicable regulations and/or firm policies in certain circumstances including where the Investment Bank of Barclays Bank PLC is
acting in an advisory capacity in a merger or strategic transaction involving the company.
Industry View
Positive - industry coverage universe fundamentals/valuations are improving.
Neutral - industry coverage universe fundamentals/valuations are steady, neither improving nor deteriorating.
Negative - industry coverage universe fundamentals/valuations are deteriorating.
Distribution of Ratings:
Barclays Equity Research has 1724 companies under coverage.
41% have been assigned an Overweight rating which, for purposes of mandatory regulatory disclosures, is classified as a Buy rating; 61% of
companies with this rating are investment banking clients of the Firm; 76% of the issuers with this rating have received financial services from the
Firm.
41% have been assigned an Equal Weight rating which, for purposes of mandatory regulatory disclosures, is classified as a Hold rating; 53% of
companies with this rating are investment banking clients of the Firm; 73% of the issuers with this rating have received financial services from the
Firm.
15% have been assigned an Underweight rating which, for purposes of mandatory regulatory disclosures, is classified as a Sell rating; 37% of
companies with this rating are investment banking clients of the Firm; 60% of the issuers with this rating have received financial services from the
Firm.
Guide to the Barclays Research Price Target:
Each analyst has a single price target on the stocks that they cover. The price target represents that analyst's expectation of where the stock will
trade in the next 12 months. Upside/downside scenarios, where provided, represent potential upside/potential downside to each analyst's price
target over the same 12-month period.
Top Picks:
Barclays Equity Research's "Top Picks" represent the single best alpha-generating investment idea within each industry (as defined by the relevant
"industry coverage universe"), taken from among the Overweight-rated stocks within that industry. Barclays Equity Research publishes "Top
Picks" reports every quarter and analysts may also publish intra-quarter changes to their Top Picks, as necessary. While analysts may highlight
other Overweight-rated stocks in their published research in addition to their Top Pick, there can only be one "Top Pick" for each industry. To view
the current list of Top Picks, go to the Top Picks page on Barclays Live (https://live.barcap.com/go/keyword/TopPicks).
To see a list of companies that comprise a particular industry coverage universe, please go to https://publicresearch.barclays.com.
Explanation of other types of investment recommendations produced by Barclays Equity Research:
Trade ideas, thematic screens or portfolio recommendations contained herein that have been produced by analysts within Equity Research shall
remain open until they are subsequently amended or closed in a future research report.
Disclosure of previous investment recommendations produced by Barclays Equity Research:
Barclays Equity Research may have published other investment recommendations in respect of the same securities/instruments recommended in
this research report during the preceding 12 months. To view previous investment recommendations published by Barclays Equity Research in
the preceding 12 months please refer to https://live.barcap.com/go/research/ResearchInvestmentRecommendations.
Barclays legal entities involved in publishing research:
Barclays Bank PLC (Barclays, UK)
Barclays Capital Inc. (BCI, US)
Barclays Securities Japan Limited (BSJL, Japan)
Barclays Bank PLC, Hong Kong branch (Barclays Bank, Hong Kong)
Barclays Capital Canada Inc. (BCCI, Canada)
Absa Bank Limited (Absa, South Africa)
Barclays Bank Mexico, S.A. (BBMX, Mexico)
Barclays Securities (India) Private Limited (BSIPL, India)
Barclays Bank PLC, India branch (Barclays Bank, India)

Barclays | Index Volatility Weekly
7 August 2017 25
IMPORTANT DISCLOSURES CONTINUED
Barclays Bank PLC, Singapore branch (Barclays Bank, Singapore)

DISCLAIMER:
This publication has been produced by the Investment Bank of Barclays Bank PLC and/or one or more of its affiliates (collectively and each individually,
"Barclays"). It has been distributed by one or more Barclays legal entities that are a part of the Investment Bank as provided below. It is provided to our clients
for information purposes only, and Barclays makes no express or implied warranties, and expressly disclaims all warranties of merchantability or fitness for a
particular purpose or use with respect to any data included in this publication. To the extent that this publication states on the front page that it is intended
for institutional investors and is not subject to all of the independence and disclosure standards applicable to debt research reports prepared for retail
investors under U.S. FINRA Rule 2242, it is an “institutional debt research report” and distribution to retail investors is strictly prohibited. Barclays also
distributes such institutional debt research reports to various issuers, regulatory and academic organisations for informational purposes and not for the
purpose of making investment decisions regarding any debt securities. Any such recipients that do not want to continue receiving Barclays institutional debt
research reports should contact [email protected]. Barclays will not treat unauthorized recipients of this report as its clients and accepts no
liability for use by them of the contents which may not be suitable for their personal use. Prices shown are indicative and Barclays is not offering to buy or sell
or soliciting offers to buy or sell any financial instrument.
Without limiting any of the foregoing and to the extent permitted by law, in no event shall Barclays, nor any affiliate, nor any of their respective officers,
directors, partners, or employees have any liability for (a) any special, punitive, indirect, or consequential damages; or (b) any lost profits, lost revenue, loss of
anticipated savings or loss of opportunity or other financial loss, even if notified of the possibility of such damages, arising from any use of this publication or
its contents.
Other than disclosures relating to Barclays, the information contained in this publication has been obtained from sources that Barclays Research believes to
be reliable, but Barclays does not represent or warrant that it is accurate or complete. Barclays is not responsible for, and makes no warranties whatsoever as
to, the information or opinions contained in any written, electronic, audio or video presentations of third parties that are accessible via a direct hyperlink in
this publication or via a hyperlink to a third-party web site (‘Third-Party Content’). Any such Third-Party Content has not been adopted or endorsed by
Barclays, does not represent the views or opinions of Barclays, and is not incorporated by reference into this publication. Third-Party Content is provided for
information purposes only and Barclays has not independently verified its accuracy or completeness.
The views in this publication are those of the author(s) and are subject to change, and Barclays has no obligation to update its opinions or the information in
this publication. If this publication contains recommendations, those recommendations reflect solely and exclusively those of the authoring analyst(s), and
such opinions were prepared independently of any other interests, including those of Barclays and/or its affiliates. This publication does not constitute
personal investment advice or take into account the individual financial circumstances or objectives of the clients who receive it. The securities discussed
herein may not be suitable for all investors. Barclays recommends that investors independently evaluate each issuer, security or instrument discussed herein
and consult any independent advisors they believe necessary. The value of and income from any investment may fluctuate from day to day as a result of
changes in relevant economic markets (including changes in market liquidity). The information herein is not intended to predict actual results, which may
differ substantially from those reflected. Past performance is not necessarily indicative of future results.
This document is being distributed (1) only by or with the approval of an authorised person (Barclays Bank PLC) or (2) to, and is directed at (a) persons in
the United Kingdom having professional experience in matters relating to investments and who fall within the definition of "investment professionals" in
Article 19(5) of the Financial Services and Markets Act 2000 (Financial Promotion) Order 2005 (the "Order"); or (b) high net worth companies,
unincorporated associations and partnerships and trustees of high value trusts as described in Article 49(2) of the Order; or (c) other persons to whom it
may otherwise lawfully be communicated (all such persons being "Relevant Persons"). Any investment or investment activity to which this communication
relates is only available to and will only be engaged in with Relevant Persons. Any other persons who receive this communication should not rely on or act
upon it. Barclays Bank PLC is authorised by the Prudential Regulation Authority and regulated by the Financial Conduct Authority and the Prudential
Regulation Authority and is a member of the London Stock Exchange.
The Investment Bank of Barclays Bank PLC undertakes U.S. securities business in the name of its wholly owned subsidiary Barclays Capital Inc., a FINRA and
SIPC member. Barclays Capital Inc., a U.S. registered broker/dealer, is distributing this material in the United States and, in connection therewith accepts
responsibility for its contents. Any U.S. person wishing to effect a transaction in any security discussed herein should do so only by contacting a
representative of Barclays Capital Inc. in the U.S. at 745 Seventh Avenue, New York, New York 10019.
Non-U.S. persons should contact and execute transactions through a Barclays Bank PLC branch or affiliate in their home jurisdiction unless local regulations
permit otherwise.
Barclays Bank PLC, Paris Branch (registered in France under Paris RCS number 381 066 281) is regulated by the Autorité des marchés financiers and the
Autorité de contrôle prudentiel. Registered office 34/36 Avenue de Friedland 75008 Paris.
This material is distributed in Canada by Barclays Capital Canada Inc., a registered investment dealer, a Dealer Member of IIROC (www.iiroc.ca), and a
Member of the Canadian Investor Protection Fund (CIPF).
Subject to the conditions of this publication as set out above, the Corporate & Investment Banking Division of Absa Bank Limited, an authorised financial
services provider (Registration No.: 1986/004794/06. Registered Credit Provider Reg No NCRCP7), is distributing this material in South Africa. Absa Bank
Limited is regulated by the South African Reserve Bank. This publication is not, nor is it intended to be, advice as defined and/or contemplated in the (South
African) Financial Advisory and Intermediary Services Act, 37 of 2002, or any other financial, investment, trading, tax, legal, accounting, retirement, actuarial
or other professional advice or service whatsoever. Any South African person or entity wishing to effect a transaction in any security discussed herein should
do so only by contacting a representative of the Corporate & Investment Banking Division of Absa Bank Limited in South Africa, 15 Alice Lane, Sandton,
Johannesburg, Gauteng 2196. Absa Bank Limited is a member of the Barclays group.
All research reports are distributed to institutional investors in Japan by Barclays Securities Japan Limited. Barclays Securities Japan Limited is a joint-stock
company incorporated in Japan with registered office of 6-10-1 Roppongi, Minato-ku, Tokyo 106-6131, Japan. It is a subsidiary of Barclays Bank PLC and a
registered financial instruments firm regulated by the Financial Services Agency of Japan. Registered Number: Kanto Zaimukyokucho (kinsho) No. 143.
Barclays Bank PLC, Hong Kong Branch is distributing this material in Hong Kong as an authorised institution regulated by the Hong Kong Monetary
Authority. Registered Office: 41/F, Cheung Kong Center, 2 Queen's Road Central, Hong Kong.
All Indian securities-related research and other equity research produced by the Investment Bank are distributed in India by Barclays Securities (India) Private
Limited (BSIPL). BSIPL is a company incorporated under the Companies Act, 1956 having CIN U67120MH2006PTC161063. BSIPL is registered and
regulated by the Securities and Exchange Board of India (SEBI) as a Research Analyst: INH000001519; Portfolio Manager INP000002585; Stock
Broker/Trading and Clearing Member: National Stock Exchange of India Limited (NSE) Capital Market INB231292732, NSE Futures & Options

INF231292732, NSE Currency derivatives INE231450334, Bombay Stock Exchange Limited (BSE) Capital Market INB011292738, BSE Futures & Options
INF011292738; Depository Participant (DP) with the National Securities & Depositories Limited (NSDL): DP ID: IN-DP-NSDL-299-2008; Investment Adviser:
INA000000391. The registered office of BSIPL is at 208, Ceejay House, Shivsagar Estate, Dr. A. Besant Road, Worli, Mumbai – 400 018, India. Telephone No:
+91 2267196000. Fax number: +91 22 67196100. Any other reports produced by the Investment Bank are distributed in India by Barclays Bank PLC, India
Branch, an associate of BSIPL in India that is registered with Reserve Bank of India (RBI) as a Banking Company under the provisions of The Banking
Regulation Act, 1949 (Regn No BOM43) and registered with SEBI as Merchant Banker (Regn No INM000002129) and also as Banker to the Issue (Regn No
INBI00000950). Barclays Investments and Loans (India) Limited, registered with RBI as Non Banking Financial Company (Regn No RBI CoR-07-00258), and
Barclays Wealth Trustees (India) Private Limited, registered with Registrar of Companies (CIN U93000MH2008PTC188438), are associates of BSIPL in India
that are not authorised to distribute any reports produced by the Investment Bank.
Barclays Bank PLC Frankfurt Branch distributes this material in Germany under the supervision of Bundesanstalt für Finanzdienstleistungsaufsicht (BaFin).
This material is distributed in Brazil by Banco Barclays S.A.
This material is distributed in Mexico by Barclays Bank Mexico, S.A.
Nothing herein should be considered investment advice as defined in the Israeli Regulation of Investment Advisory, Investment Marketing and Portfolio
Management Law, 1995 (“Advisory Law”). This document is being made to eligible clients (as defined under the Advisory Law) only. Barclays Israeli branch
previously held an investment marketing license with the Israel Securities Authority but it cancelled such license on 30/11/2014 as it solely provides its
services to eligible clients pursuant to available exemptions under the Advisory Law, therefore a license with the Israel Securities Authority is not required.
Accordingly, Barclays does not maintain an insurance coverage pursuant to the Advisory Law.
Barclays Bank PLC in the Dubai International Financial Centre (Registered No. 0060) is regulated by the Dubai Financial Services Authority (DFSA). Principal
place of business in the Dubai International Financial Centre: The Gate Village, Building 4, Level 4, PO Box 506504, Dubai, United Arab Emirates. Barclays
Bank PLC-DIFC Branch, may only undertake the financial services activities that fall within the scope of its existing DFSA licence. Related financial products or
services are only available to Professional Clients, as defined by the Dubai Financial Services Authority.
Barclays Bank PLC in the UAE is regulated by the Central Bank of the UAE and is licensed to conduct business activities as a branch of a commercial bank
incorporated outside the UAE in Dubai (Licence No.: 13/1844/2008, Registered Office: Building No. 6, Burj Dubai Business Hub, Sheikh Zayed Road, Dubai
City) and Abu Dhabi (Licence No.: 13/952/2008, Registered Office: Al Jazira Towers, Hamdan Street, PO Box 2734, Abu Dhabi).
Barclays Bank PLC in the Qatar Financial Centre (Registered No. 00018) is authorised by the Qatar Financial Centre Regulatory Authority (QFCRA). Barclays
Bank PLC-QFC Branch may only undertake the regulated activities that fall within the scope of its existing QFCRA licence. Principal place of business in Qatar:
Qatar Financial Centre, Office 1002, 10th Floor, QFC Tower, Diplomatic Area, West Bay, PO Box 15891, Doha, Qatar. Related financial products or services
are only available to Business Customers as defined by the Qatar Financial Centre Regulatory Authority.
This material is distributed in the UAE (including the Dubai International Financial Centre) and Qatar by Barclays Bank PLC.
This material is not intended for investors who are not Qualified Investors according to the laws of the Russian Federation as it might contain information
about or description of the features of financial instruments not admitted for public offering and/or circulation in the Russian Federation and thus not
eligible for non-Qualified Investors. If you are not a Qualified Investor according to the laws of the Russian Federation, please dispose of any copy of this
material in your possession.
This material is distributed in Singapore by the Singapore branch of Barclays Bank PLC, a bank licensed in Singapore by the Monetary Authority of Singapore.
For matters in connection with this report, recipients in Singapore may contact the Singapore branch of Barclays Bank PLC, whose registered address is 10
Marina Boulevard, #23-01 Marina Bay Financial Centre Tower 2, Singapore 018983.
This material is distributed to persons in Australia by either Barclays Bank plc , Barclays Capital Inc., Barclays Capital Securities Limited or Barclays Capital Asia
Limited. None of Barclays Bank plc, nor any of the other referenced Barclays group entities, hold an Australian financial services licence and instead they
each rely on an exemption from the requirement to hold such a licence. This material is intended to only be distributed to “wholesale clients” as defined by
the Australian Corporations Act 2001.
IRS Circular 230 Prepared Materials Disclaimer: Barclays does not provide tax advice and nothing contained herein should be construed to be tax advice.
Please be advised that any discussion of U.S. tax matters contained herein (including any attachments) (i) is not intended or written to be used, and cannot
be used, by you for the purpose of avoiding U.S. tax-related penalties; and (ii) was written to support the promotion or marketing of the transactions or other
matters addressed herein. Accordingly, you should seek advice based on your particular circumstances from an independent tax advisor.
© Copyright Barclays Bank PLC (2017). All rights reserved. No part of this publication may be reproduced or redistributed in any manner without the prior
written permission of Barclays. Barclays Bank PLC is registered in England No. 1026167. Registered office 1 Churchill Place, London, E14 5HP. Additional
information regarding this publication will be furnished upon request.

BARCRES-63852b76