Evaluation of the Therapeutic Potential of Red Clover Extract ...
250
Middlesex University Research Repository An open access repository of Middlesex University research Lall, Satinder (2017) Evaluation of the therapeutic potential of red clover extract and red grape seed extract on human adult malignant brain tumours in vitro. PhD thesis, Middlesex University. [Thesis] Final accepted version (with author’s formatting) This version is available at: Copyright: Middlesex University Research Repository makes the University’s research available electronically. Copyright and moral rights to this work are retained by the author and/or other copyright owners unless otherwise stated. The work is supplied on the understanding that any use for commercial gain is strictly forbidden. A copy may be downloaded for personal, non-commercial, research or study without prior permission and without charge. Works, including theses and research projects, may not be reproduced in any format or medium, or extensive quotations taken from them, or their content changed in any way, without first obtaining permission in writing from the copyright holder(s). They may not be sold or exploited commercially in any format or medium without the prior written permission of the copyright holder(s). Full bibliographic details must be given when referring to, or quoting from full items including the author’s name, the title of the work, publication details where relevant (place, publisher, date), pag- ination, and for theses or dissertations the awarding institution, the degree type awarded, and the date of the award. If you believe that any material held in the repository infringes copyright law, please contact the Repository Team at Middlesex University via the following email address: [email protected] The item will be removed from the repository while any claim is being investigated. See also repository copyright: re-use policy:
-
Upload
khangminh22 -
Category
Documents
-
view
3 -
download
0
Transcript of Evaluation of the Therapeutic Potential of Red Clover Extract ...

Middlesex University Research RepositoryAn open access repository of
Middlesex University research
http://eprints.mdx.ac.uk
Lall, Satinder (2017) Evaluation of the therapeutic potential of red clover extract and red grapeseed extract on human adult malignant brain tumours in vitro. PhD thesis, Middlesex University.
[Thesis]
Final accepted version (with author’s formatting)
This version is available at: https://eprints.mdx.ac.uk/21543/
Copyright:
Middlesex University Research Repository makes the University’s research available electronically.
Copyright and moral rights to this work are retained by the author and/or other copyright ownersunless otherwise stated. The work is supplied on the understanding that any use for commercial gainis strictly forbidden. A copy may be downloaded for personal, non-commercial, research or studywithout prior permission and without charge.
Works, including theses and research projects, may not be reproduced in any format or medium, orextensive quotations taken from them, or their content changed in any way, without first obtainingpermission in writing from the copyright holder(s). They may not be sold or exploited commercially inany format or medium without the prior written permission of the copyright holder(s).
Full bibliographic details must be given when referring to, or quoting from full items including theauthor’s name, the title of the work, publication details where relevant (place, publisher, date), pag-ination, and for theses or dissertations the awarding institution, the degree type awarded, and thedate of the award.
If you believe that any material held in the repository infringes copyright law, please contact theRepository Team at Middlesex University via the following email address:
The item will be removed from the repository while any claim is being investigated.
See also repository copyright: re-use policy: http://eprints.mdx.ac.uk/policies.html#copy

i | P a g e
Evaluation of the Therapeutic Potential of
Red Clover Extract and Red Grape Seed Extract
on Human Adult Malignant Brain Tumours
In Vitro
A thesis submitted by
Satinder K Lall BSc MSc
In partial fulfilment of the requirements of Middlesex University
for the degree of
DOCTOR OF PHILOSOPHY
Middlesex University
The Burroughs
London
NW4 4BT

For My Nanaji
Harbhajan Singh Panesar
i | P a g e
Abstract
Gliomas are rare intrinsic brain tumours which account for 2% of all cancers.
Glioblastoma multiforme is the most malignant malignant glioma form and
remains incurable. The biological features which preclude successful therapy
include heterogeneity, diffuse invasive patterns and angiogenesis. Despite,
advances in current conventional treatments the median survival time is only
14 months. Hence there is a need to investigate novel therapeutic approaches
which can be included alongside conventional treatment. One such approach
is the use of micronutrients in the management of glioblastoma multiforme.
This study evaluated the affects of two micronutrient extracts, red clover
extract (RCE) and red grape seed extract (RGSE), on human adult malignant
brain tumours in vitro.
Four primary (or short-term) cell cultures derived from human brain tumour
biopsies, an established cell line and normal human brain cells from an
epileptic pateint were used to measure the cell viability, anti-invasive, anti-
angiogenic and pro-apoptotic potentials, following 48-hour treatment with the
IC50s of either micronutrient extract.
Both RCE and RGSE exhibited similar affects on the glioma cell cultures.
They both appeared to reduce cell viability, invasive potential and
angiogenesis potential though did not appear to have any significant affect on
the apoptotic portential of the glioma cultures. For example, incubation with
0.007-1ug/ml RCE caused a significant (p<0.05) reduction of in viability of
glioma cells but did not affect viability of normal astrocytes. Similar results
were obtained for RGSE. These doses also resulted in a significant decrease
in invasion and angiogenesis (p<0.05). Effects varied between cell lines but in
general decreased by 50-60%.
This suggests that both RCE and RGSE do affect the development of glioma
cell cultures in vitro and warrant further study into the pathways in which this
may occur.

ii | P a g e
Acknowledgements
First and foremost, I would like to thank all my family, in particular, my late
Nanaji and my mum and dad, for believing in me, standing by me and
encouraging me even when times were hard.
I’d like to thank the following people for their patience, support, help and
contributions: Manika Choudary and Darshana Yagnik for their friendship,
support and encouragement. Dr Frank Hills for his time and consideration in
helping finalise this thesis. Dr Celia Bell for her continuous support and
positive supervision. I am grateful for the time and effort she has put into my
supervision. Dr Bali Rooprai for giving me the opportunity to partake in this
study and her supervision throughout. Professor Ray Iles for his
encouragement, positive words and help with statistical analysis. Miss Noor
Azela Thani for looking after my cell cultures when I was away and helping
me with population doubling times. Miss Sukveer Purewal and Mr Derek
Davis (Cancer research UK) for allowing me to use the flow cytometer and
helping me with analysis. I especially appreciate the time and patience
Sukhveer provided enthusiastically. Mr Richard Selway and Mr K Askhan and
the Department of Neurosurgy, at King’s College Hospital for providing the
biopsies. Professor Geoff Pilkington for his input into the microenvironmental
studies.
And finally, I would like to thank my husband Mr Jatinder Lall without whose
support, patience, love and trust I couldn’t have gotten this far.
iii | P a g e
Contents
ABSTRACT ...................................................................................... I
ACKNOWLEDGEMENTS .................................................................. II
CONTENTS .................................................................................... III
LIST OF FIGURES ............................................................................ V
LIST OF TABLES ........................................................................... VIII
LIST OF ABBREVIATIONS ................................................................ X
THESIS ........................................................................................... 1
CHAPTER 1: INTRODUCTION .......................................................... 1
1.1 EPIDEMIOLOGY OF BRAIN TUMOURS .......................................... 1 1.2 AETIOLOGY OF BRAIN TUMOURS ............................................... 3 1.3 CLASSIFICATION OF GLIOMAS ................................................... 7 1.4 GLIOMAS .............................................................................. 2 1.5 CLINICAL PRESENTATION OF GLIOMAS ........................................ 7 1.6 DIAGNOSIS AND CLASSIFICATION OF GLIOMAS ............................. 9 1.7 BIOLOGICAL FEATURES EVADING TREATMENT ............................ 13 1.8 APOPTOSIS ......................................................................... 25 1.9 CONVENTIONAL TREATMENT .................................................. 29 1.10 CONVENTIONAL MEDICINE CLINICAL TRIALS. ........................... 35 1.11 REQUIREMENTS OF NEW THERAPIES ...................................... 37 1.12 USE OF COMPLEMENTARY AND ALTERNATIVE MEDICINE............ 37 1.13 PHYTOCHEMICALS AND CANCER ............................................ 40 1.14 CAM: A THEARPY FOR GLIOMAS .......................................... 41 1.15 EVALUATION OF MICRONUTRIENTS IN GLIOMA THERAPY ........... 43 1.16 RED CLOVER EXTRACT ......................................................... 43 1.17 RED GRAPE SEED EXTRACT ................................................... 46
iv | P a g e
1.18 AIMS ............................................................................... 49 1.19 AN OVERVIEW OF THE THESIS ............................................... 50
CHAPTER 2: MATERIALS AND METHODS ...................................... 51
2.1 SOURCE OF CELL CULTURES .................................................... 51 2.2 MICRONUTRIENTS ................................................................ 52 2.3 CELL CULTURE TECHNIQUES ................................................... 53 2.4 CELL VIABILITY TECHNIQUES ................................................... 55 2.5 CHARCTERISATION OF ASTROCYTIC CELL CULTURES ..................... 57 2.6 INVASION ASSAYS................................................................. 59 2.7 DETECTION OF APOPTOSIS ..................................................... 60 2.8 DETECTION OF ANGIOGENESIS ................................................ 61 2.9 STATISTICS .......................................................................... 63
CHAPTER 3: MICROENVIRONMENTAL CHANGES OF GROWTH
SERA ............................................................................................ 64
3.1 INTRODUCTION .................................................................... 64 3.2 MATERIALS AND METHODS .................................................... 68 3.3 RESULTS ............................................................................. 70 3.4 DISCUSSION ........................................................................ 77 3.5 CONCLUSION ....................................................................... 80 4.3 THE EFFECT OF MICRONUTRIENT EXTRACTS ON CELL VIABILITY ..... 85
CONCLUSION ............................................................................. 147
REFERNCES ................................................................................ 148
REFERENCES .............................................................................. 149
APPENDIX .................................................................................. 226
HPLC RED CLOVER EXTRACT ....................................................... 227
RED GRAPE SEED EXTRACT ......................................................... 227

v | P a g e
List of Figures
Figure 1 The approximate percentage incidence of various cancers in 2010 ........................................................................................ 1
Figure 2 The incidence of brain tumours over the average adult lifespan, in the UK, ................................................................................... 2
Figure 3 Differentiation of progenitor cells in the neural tube .......... 6
Figure 4 Phase contrast micrograph of an anaplastic astrocytoma (III) ............................................................................................................ 14
Figure 5 Apoptosis initiation pathways both extrinsic and intrinsic including caspases involved................................................................. 28
Figure 6 The isoflavonoids of Red Clover Extract. .......................... 44
Figure 7 The isoflavonoids of Red Grape Seed Extract. ................ 48
Figure 8 MTT structure. ........................................................................ 56
Figure 9 Illustration how coverslips were seeded with both HUVECs and brain tumour cells. ......................................................... 62
Figure 10 Phase contrast micrographs of the IPSB-18 cell line when cultured in the presence of (a) FCS (b) NCS and (c) HS.. ... 71
Figure 11 Micrographs of the changes in antigenic expression of Gal C (red) and GFAP (green) ............................................................. 73
Figure 12 Phase contrast micrographs of the cell lines involved in this study including. ............................................................................... 82
Figure 13 Population doubling time of glioma cell lines ................. 84
Figure 14 The mean cell viability of IPSB-18 l . ............................... 86
Figure 15 The mean cell viability of IPSB-18. .................................. 87
Figure 16 Mean percentage viability of MUAB-C ............................ 90

vi | P a g e
Figure 17 Mean percentage viability of IPSB-18 using RCE ......... 91
Figure 18 Mean percentage viability of IPSB-18 using RGSE ...... 92
Figure 19 Absorption spectra of three concentrations read at 570nm ...................................................................................................... 94
Figure 20 Cell viability of glioma cell cultures .................................. 95
Figure 21 Scatter plot illustrating the cell viability of IPSB-18) ...... 96
Figure 22 Mean percentage cell viability ........................................... 97
Figure 23 Cell viability of glioma cell cultures when treated for 48 hours with red grape seed extract. ...................................................... 99
Figure 24 Mean percentage cell viability of IPSB-18 following 48 hr treatment with RGSE. ..................................................................... 100
Figure 25 Mean percentage viability of (a) MUMG-GM, (b) MUIH-GM (c) MUTC-GM and (d) MUPK-GM. ............................................ 101
Figure 26 Representative plots of the percentage of fluorescent cells. ....................................................................................................... 104
Figure 27 Representative micrographs of the expression of (a)
GFAP, (b) CD44, (c) Eric-1 NCAM, (d) 1 integrin and (e) v integrin ................................................................................................... 107
Figure 28 Representative micrographs of the invasive potential of GBs ......................................................................................................... 109
Figure 29 The mean number (three repetitions) of MUAB-C control cells which have invaded across the ECM in the Boyden chamber. ................................................................................................................ 110
Figure 30 The mean number (three repetitions) of glioma cells invading across the ECM of the Boyden chamber following 48 hour treatment with RCE .............................................................................. 110
Figure 31 The mean number (three repetitions) of glioma cells invading across the ECM of the Boyden chamber following 48 hour treatment with RGSE, .......................................................................... 111

vii | P a g e
Figure 32 Apoptosis in the IPSB-18 glioma cell culture ............... 112
Figure 33 Micrographs representing apoptosis following the TUNEL assay ........................................................................................ 115
Figure 34 Micrograph representing apoptosis using the TUNEL assay in untreated MUAB-C control cells ........................................ 116
Figure 35 The average numbers of tubules formed by HUVEC cells. ....................................................................................................... 118
Figure 36 Representative micrographs illustrating tubule development of HUVEC cells ........................................................... 119
Figure 37 The average number of tubules counted ..................... 120
Figure 38 Growth Curve..................................................................... 126
Figure 39 The expression of 3 integrin in a) normal brain tissue and b) glioma cultures.. ....................................................................... 142

viii | P a g e
List of Tables
Table 1 Who classification of gliomas adapted from Louis 2007 .... 1
Table 2 Symptoms that can be caused by tumours .......................... 8
Table 3 Some stimulants and inhibitors of angiognenesis. ............ 22
Table 4 A brief summary of the top 10 clinical trials ........................ 36
Table 5 A brief summary of a fraction of clinical trials currently being performed for the use of CAM therapy in 2016. ..................... 42
Table 6 Four biopsy-derived malignant cell lines and 1 normal astrocytic culture .................................................................................... 51
Table 7 Primary antibodies were used to characterise cell cultures.. .................................................................................................. 58
Table 8 Primary antibodies used to characterise cell cultures. ..... 59
Table 9 Summary of the cell cultures used as part of this study including the source ............................................................................... 68
Table 10 Primary antibodies used to characterise cell cultures. An illustration of the dilutions used and the host species the antibody was cultured in........................................................................................ 69
Table 11 Summary population doubling times (PDTs) of the cell cultures in this study .............................................................................. 72
Table 12 Summary of the immunocytochemical results ................. 74
Table 13 Summary of the significant difference between the median flow cytometry results ............................................................. 76
Table 14 Similarities and differences in three different sera; foetal calf serum, newborn calf serum and human serum ......................... 78
Table 15 Population doubling times (PDT) of glioma cell lines and the control cell line (MUAB-C) ............................................................. 83
Table 16 Summary of the IC50 of RCE with various cell cultures. . 98

ix | P a g e
Table 17 Summary of the IC50 of RGSE for various cell cultures ................................................................................................................ 102
Table 18 Mean antigenic expression .............................................. 105
Table 19 Antigenic expression in glioma cell lines incubated with the respective IC50 of either RCE or RGSE for 48 hours,). ........... 108
Table 20 Summary of the percentage of live, apoptotic and necrotic cells. ........................................................................................ 113
Table 21 Mean number of fluorescent cells counted ..................... 117
Table 22 Summary of population doubling times ........................... 127
Table 23 Summary of the IC50s of the micronutrients using various cell cultures including primary cultures set up from biopsies, an existing low passage cell line. ............................................................ 130

x | P a g e
List of Abbreviations
CAM Complementary and alternative medicine
CD44 Cluster of differentiation 44
CNS Central nervous system
DMEM Dulbecco’s modified Eagle’s medium
ECM Extra celluar matrix
FCS Foetal calf serum
GalC Galactocerebroside
GB Glioblastoma multiforme
GD3 Ganglioside
GFAP Glial fibrillary acidic protein
HS Human serum
MMP Matrix metalloproteinases
NCAM Neural cell adhesion molecules
NCS Newborn calf serum
NG2 Neural Glial 2
RCE Red clover extract
RGSE Red grape seed extract

THESIS
1 | P a g e
CHAPTER 1: Introduction
1.1 Epidemiology of Brain Tumours
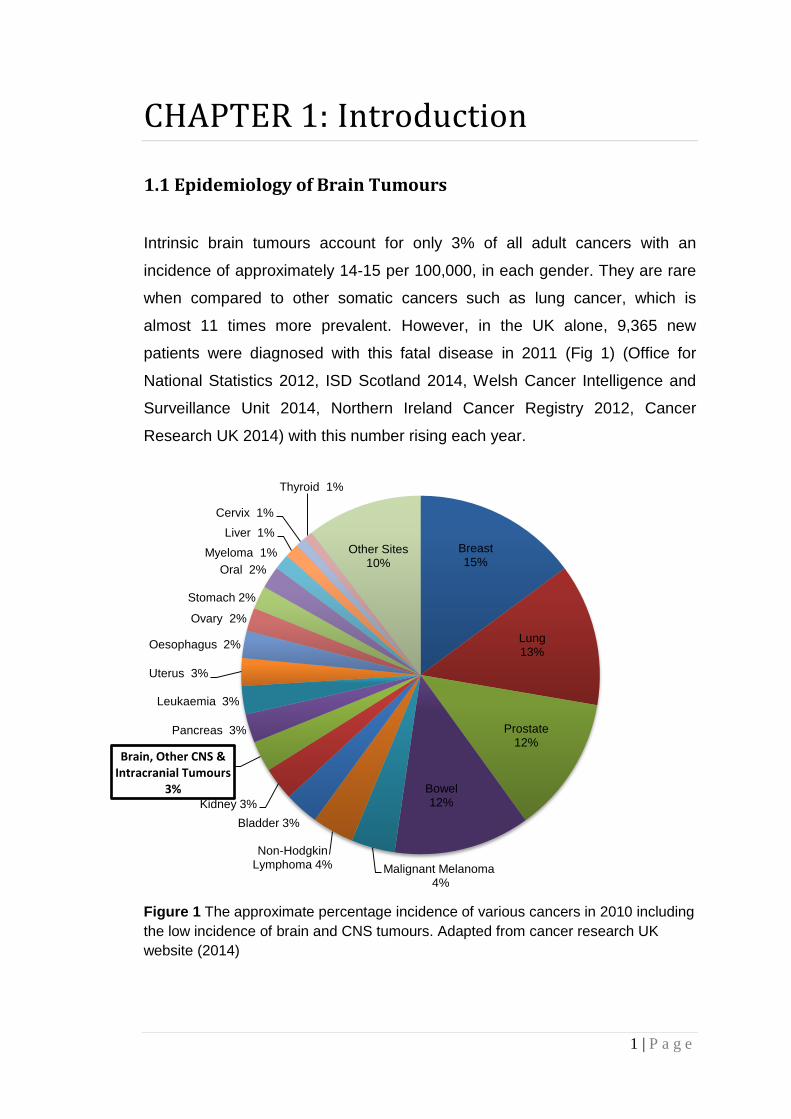
Intrinsic brain tumours account for only 3% of all adult cancers with an
incidence of approximately 14-15 per 100,000, in each gender. They are rare
when compared to other somatic cancers such as lung cancer, which is
almost 11 times more prevalent. However, in the UK alone, 9,365 new
patients were diagnosed with this fatal disease in 2011 (Fig 1) (Office for
National Statistics 2012, ISD Scotland 2014, Welsh Cancer Intelligence and
Surveillance Unit 2014, Northern Ireland Cancer Registry 2012, Cancer
Research UK 2014) with this number rising each year.
Figure 1 The approximate percentage incidence of various cancers in 2010 including
the low incidence of brain and CNS tumours. Adapted from cancer research UK
website (2014)
Breast 15%
Lung 13%
Prostate 12%
Bowel 12%
Malignant Melanoma 4%
Non-Hodgkin Lymphoma 4%
Bladder 3%
Kidney 3%
Brain, Other CNS & Intracranial Tumours
3%
Pancreas 3%
Leukaemia 3%
Uterus 3%
Oesophagus 2%
Ovary 2%
Stomach 2%
Oral 2%
Myeloma 1%
Liver 1%
Cervix 1%
Thyroid 1%
Other Sites 10%
2 | P a g e
Over the past three decades the incidence in developed countries has rapidly
risen increasing by between 35% - 45% (Inskip 2010; Hoffman 2006 p27;
Pilkington 2001 p408; Radhakrishnan 1995 p 67). This is probably due to a
number of factors including, improved diagnostic and imaging techniques,
better documentation of diagnosis, environmental factors and an increasingly
elderly population. Differences in incidence can also be seen across ages,
gender and ethnic groups in developed countries.
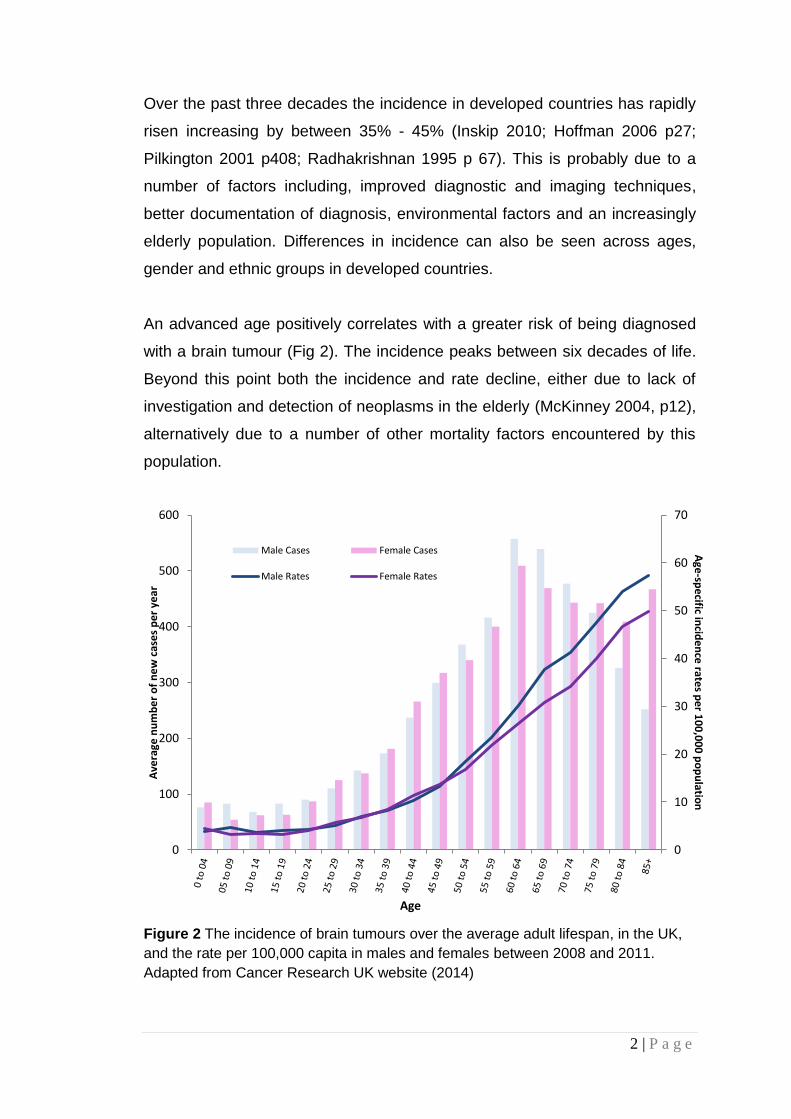
An advanced age positively correlates with a greater risk of being diagnosed
with a brain tumour (Fig 2). The incidence peaks between six decades of life.
Beyond this point both the incidence and rate decline, either due to lack of
investigation and detection of neoplasms in the elderly (McKinney 2004, p12),
alternatively due to a number of other mortality factors encountered by this
population.
Figure 2 The incidence of brain tumours over the average adult lifespan, in the UK,
and the rate per 100,000 capita in males and females between 2008 and 2011.
Adapted from Cancer Research UK website (2014)
0
10
20
30
40
50
60
70
0
100
200
300
400
500
600
Age
-spe
cific incid
en
ce rate
s pe
r 10
0,0
00
po
pu
lation
Ave
rage
nu
mb
er
of
ne
w c
ase
s p
er
year
Age
Male Cases Female Cases
Male Rates Female Rates

3 | P a g e
Figure 2 also illustrates a general male predilection, most significantly beyond
the fifth decade. Gliomas in particular have a male: female ratio of 1.5:1.0.
Although this is not representative of the greater tendency of females to be
diagnosed with meningiomas, it has been suggested that this inclination could
be a result of socio-economic factors such as occupation (McKinney 2004,
p12).
As well as a gender partiality, Caucasians have an increased risk of being
diagnosed with brain tumours compared to Asian or African origins, in the
same country. Glaser et al. (1996) demonstrated that non-Hispanic whites, in
the San Francisco Bay Area have a higher frequency of brain malignancies
than white Hispanics, Japanese, African Americans, Chinese, and Filipinos.
This data is mimicked when examining global incidences with American
Indians and Asians being the groups with the lowest risk between 2002 and
2006 (National Center for Health Statistics). Unfortunately, unlike ethnicity,
global differences are usually cautiously interpreted, as around, a four-fold
difference is observed in incidence of malignant brain tumours when
comparing countries with high incidences such as Australia, Canada,
Denmark, Finland, New Zealand and the US to countries with a low incidence
such as the Philippines and India. This difference is probably due to
inconsistancies in registration and criteria for diagnosis but also too many
socio-economic factors which result in brain tumours being undiagnosed in
many patients (Lo 2012; Wiemels 2010, p308; Schwartzbaum 2006, p501).
1.2 Aetiology of Brain Tumours
Despite improvements in diagnosis and registration, to date, the causes of
brain tumours remain unknown. Speculation and the current school of thought
suggests that brain tumour development results from an accumulation of
genetic alterations which occur as a result of physical, chemical and/or
biological damage. (McKinney 2004, p14). Very little is known about the
genetic risk factors for brain tumours, though this may be attributed to the few
factors identified within this field (Reilly 2009, p2). Of the identified inherited

4 | P a g e
syndromes, brain tumours are associated with several familial cancer
predispositions including Li-Fraumeni, neurofibromatosis type 1 and 2,
tuberous sclerosis, and syndromes involving adenomatous polyps lead to a
genetic predisposition to the occurrence of brain tumours. This development
only accounts for around 1-2% of brain tumours. Other genetic abnormalities
thought to be associated with the development of brain tumours involve
mutations of genes associated with basic cellular metabolic pathways for
example pathways involved in DNA repair and stability, immune responses,
oxidation and detoxification. Published data into the risk associated with
genetic mutations is very limited and further study is required to identify any
specific polymorphisms related to brain tumour growth.
This however is not considered the sole causative agent and in addition a
number of other environmental risk factors are being investigated including
ionising radiation, extremely low frequency electromagnetic fields, mobile
phones, infections and chemical agents (McKinney 2004, p14).
High frequency radiation, involved in radiotherapy, can result in the breaking
of molecular bonds, thus causing DNA damage. Therefore, patients suffering
from paediatric cancer or leukaemia, receiving radiation therapy, have an
increased risk of developing brain tumours in adulthood despite radiation
being administered at therapeutic doses (McKinney 2004, p6). It has also
been reported that survivors of the Hiroshima atomic bomb have a greater risk
of developing meningiomas (Shintani 1999) though the radiation did not seem
to increase the risk of brain tumours to developing foetuses.
Extremely low frequency electromagnetic fields (ELF-EMF) (30-300 Hz) are
present in domestic and industrial electricity supplies including but not limited
to pylons, energy plants, radio, TV, public transport vehicles and video
terminals. The effects of ELF-EMFs depended on their intensity and time of
exposure. Investigation and published research into the risk of developing
brain tumours due to ELF is very sparse and methodologies are inconsistent.
Kheifets et al (2010) suggested inconsistent results may be attributable to

5 | P a g e
numerous shortcomings in the studies, notably assessment of exposure.
Despite this various in vitro studies have indicated ELF-EMFs lead to DNA
breaks of double and single strands (Lai 1996), DNA-protein and DNA-DNA
crosslinks (Singh 1998), and increased apoptosis (Lai 2004) in rat brain cells.
These effects were reported to be mediated by free radicals (Simko 2007).
Currently, conclusions concur that ELF-EMF has a weak link to the risk of
developing brain tumours, though research is still ongoing (Gadhia 2004, p65;
Kheifets 1995). Conversely, recent studies have investigated the therpeutic
effects of ELF-EMF such as improvement and facilitation of bone healing,
increasing neurogenesis and in the treatment of cancer (Cuccurazzu 2010,
Masutani 1995, p462; Robles 1998, p1113). Due to the inconsistent nature of
current conclusions the need to better assess exposure, including
development of a more complete job-exposure matrix combining job title, work
environment, and exposure to electric fields, magnetic fields, contact current,
spark discharge, and other chemical and physical agents (Khiefets 2010; Mee
2009; Estécio 2002) is warranted.
Similarly mobile phone handsets emit radiofrequency signals from the
microwave spectrum. Though the energy levels of these waves are
insufficient to damage DNA, public concern over the possible health effects of
using mobile phones has resulted in various investigations into the
relationship between mobile phones and brain tumours. Hardell et al. (2013;
Carlberg 2012) reported an association, clearly indicating an increased risk for
both malignant brain tumors and acoustic neuroma after long-term use of
wireless phones and mobile phones. Other studies have shown leakage
across the blood brain barrier (BBB) (Salford 1994; Persson 1992) and data
suggesting indirect damage to neurons (Salford 2003; Hassel 1994). Despite
this, the risk associated with mobile phones is controversial as the studies
published either reported on small sample numbers or have allowed for short
latent periods. The general consensus, currently, is that mobile phone use
presents no risk, but this requires further investigation (Kundi 2010; Lahkola
2005).

6 | P a g e
A number of viruses, including retroviruses, papovaviruses, and adenoviruses
have been found to induce brain tumours in experimental animal models.
However, this has not been shown in humans. Various studies have
suggested that live polio vaccines contaminated with SV40 might increase the
risk of brain tumours (Pepper 1996; Martini 1996) though further studies did
not support this evidence. In contrast atopic diseases, for example asthma
and eczema, have been found, in a number of independent studies, to be
‘protective’ against the development of gliomas. Limited research has been
done to identify possible mechanisms related to how infections may initiate
alignancy or play a protective role remains unknown and further study is
required.
A variety of both beneficial and harmful chemicals may be found in various
foods and within the environment. One such example, found both the
environment and foods, such as some vegetables and cured meats, are the
N-nitroso compounds. These compounds are able to cross the blood brain
barrier (BBB) and have mutagenic tendencies, enabling them to potentiate the
carcinogenic process. N-nitroso compounds both environmental and dietary
have been studied as potential carcinogens (Lewin 2006; Tricker 1991). In
contrast to these studies N-nitroso compounds, are involved in chemotherapy
regimens given to patients subsequent to diagnosis of any cancer, therefore
suggesting that some N-nitroso compounds may be protective and not
harmful.
Another chemical studied for its potential carcinogenic effects is aspartame, a
low calorie sweetener found in various food products and fizzy drinks like diet
coke. It was suggested that aspartame might be involved in the aetiology of
some brain tumours though it was concluded in a study, that aspartame was
not a risk factor (Mallikarjun 2015). However, if there was a pre-existing
tumour, it has been suggested that it progresses rapidly in the presence of
aspartame (Olney 1996; Pilkington and Rooprai personal communication).
7 | P a g e
Tobacco has been found not to cross the BBB and therefore, though
carcinogenic to other organs of the body, studies are inconsistent with only
some populations being linked to development of brain tumours (Hou 2015).
Alcohol similarly does not seem to be related to brain tumour development.
Other chemicals including hair dyes and hair sprays, pesticides and traffic
pollution, which have been linked to other cancers, have yielded inconclusive
results though are all still undergoing further study (Khanolkar 2016).
A variety of occupations have been linked to an increased risk of developing
brain tumours due to exposure to carcinogenic or neurotoxin compounds such
as polycyclic aromatic hydrocarbons, phenols, organic solvents, and
lubricating oils. Farmers, for example, are 30% more prone to brain tumours
(Khuder 1998, p252) probably due to their exposure of pesticides and other
specifics related to farming (Viel 1998; Bohnen 1995). Apart from workers
associated with farming and the petrochemical and oil industries, studies
within other occupations, investigating this risk factor remains inconsistent
and no specific chemical has been associated with the risk of petrochemical
and oil industry workers though multiple exposures have to be considered
(McKinney 2004, p16).
1.3 Classification of Gliomas
1.3.1 WHO Classification
Today the most widely accepted classification scheme of CNS tumours is that
of the World Health Organisation (WHO) (Table 1) (Louis 2007; Kleihues
2002). The WHO system, developed by Zulch, was first published in 1979, as
a result of a series of meetings over the period of the 1970s between various
neuropathologists, neuro-oncologists, radiation oncologists and various other
health professionals. Revision thereafter of this original WHO system, by
Kleihues and Cavanee, occurred in 1993, 2000 and most recently in 2007
(Louis 2007; Kleihues 2002; Kleihues 2000; Kleihues 1993). This scheme

8 | P a g e
sought to classify all CNS tumours using a system based on the
histopathologic features of the tumour, as described in the Daumas-Duport
scheme, and survival rates.
Daumas-Duport et al. (1988) developed a classification based on the
presence of cellularity and the presence or absence of four histopathological
features; presence of mitoses, nuclear atypia, endothelial cell proliferation,
and the presence and extent of necrosis (Daumas-Duport 1988). In this
system, one point was given for each malignant feature thus increasing points
correlated with increasing malignancy accordingly Grade I tumours display
cellularity only, grade II tumours display mitosis as well, grade III tumours
display grade II characteristics and nuclear atypia and finally grade IV
tumours display all 4 histological features including anaplasia and necrosis.
This scheme is now referred to as the St Anne-Mayo classification system
(Doolittle 2004). The WHO classification is based on cell of origin, proportion
of malignant features, and tumour grade (I-IV). A brief description of glial
tumours is illustrated in Table 1.
1.3.2 The Future of Classification
New techniques of classifying brain tumours may lie in gene expression
analysis and molecular genetics. Techniques such as these invite the
possibility of improved tumour classification thus resulting in patient
stratification for treatment and prognosis (Caskey 2000). An example of such
a study has profiled the gene expression, using cDNA array technology of
human primary glioma tissue samples. A good correlation was reported for
survival against molecular classification (Fuller 2002). Another new method
includes the use of support vector machines (SVM), creating a model to
predict astrocytoma grades following MRI to identify common features of the
neoplasms (Milchenko 2016). The diagnostic performance of SVM was
reported to be significantly better than clinician diagnosis for higher grade
tumours.

1 | P a g e
Table 1 Who classification of gliomas adapted from Louis 2007
Tumour classification Histological grade of malignancy
Astrocytoma
Pilocytic Astrocytoma I
Pilomyxoid astrocytoma II
Pleomorphic xanthoastrocytoma I
Subependymal giant cell
astrocytoma
I
Astrocytoma (Low-grade, diffuse) I-II
Anaplastic astrocytoma III
Glioblastoma multiforme IV
Giant cell glioblastoma IV
Gliosacrcoma IV
Oligodendroglioma
Oligodendroglioma (low grade) I-II
Anaplastic oligodendroglioma III
Mixed gliomas
Oligoastrocytoma
Anaplastic oligoastrocytoma
II
III
Ependymoma
Subependymoma I
Myxopapillary ependymoma I
Ependymoma II
Anaplastic ependymoma III
Glioblastoma
Giant cell glioblastoma IV

2 | P a g e
1.4 Gliomas
Gliomas are thought to be derived from glial cells or neural progenitor cell and
are the most commonly diagnosed CNS tumour accounting for approximately
86% of diagnosed tumours (McKinney 2004, p12). Gliomas include
astrocytomas, oligodendrogliomas, ependymomas and mixed gliomas.
Astrocytomas are the most commonly occurring glioma with grade IV
astrocytomas or glioblastoma multiforme being the most difficult neoplasm to
treat.
1.4.1 Astrocytomas: The Most Common Glioma
Astrocytomas are the most commonly occurring neuroepithelial tumours and
may be described as well-differentiated diffusely infiltrating tumours
predominately comprising neoplastic astrocytes. They may be characterised
into two groups; those that diffusely infiltrate and those that do not. Diffuse
astrocytomas account for at least 75% of astrocytic tumours. They have a
poorer prognosis and a higher risk of recurrence as there is no discernible
boundary between the tumour and the normal tissue, thus during resection
many residual cells in the brain tissue lead to recurrence.
Location of the tumours varies greatly and is largely dependent upon age
though they are most commonly located in the frontal, temporal and parietal
lobes of the brain.
Low grade tumours are graded WHO grades I or II, thus presenting only one
or two malignancy features. These tumours exist as either non-diffusely
infiltrating, such as pilocytic astrocytoma (WHO grade I), pleomorphic
xanthoastrocytoma (WHO grade II) and subepndymal giant cell astrocytoma
(WHO grade I), or as diffusely infiltrating tumours. The former tumour type
occurs in paediatric patients and young adults which, are all generally slow
growing, well differentiated and circumscribed with a lack of anaplastic
progression due to slow limited invasion thus the prognosis of these tumours
3 | P a g e
is more favourable. The later tumour types occur mainly in adults and are
capable of undergoing malignant transformation, therefore carrying a more
worrying prognosis. These tumours may be categorised into one of three
variants which are identified upon resection, using histological techniques, in
accordance to the most predominant cell type, specifically fibrillary
astrocytomas which are by far the most common, gemistocytic astrocytomas
and protoplasmic astrocytomas (Kleihues 2000).
Malignant tumours are graded WHO grades III or IV. These tumours display
three or more histological characteristics and are all poorly differentiated with
a more marked malignant progression. Unlike most solid tumours, these
neoplasms rarely metastasize outside the brain instead they undergo a ‘go or
grow’ phenomemnon (Bolteus 2001). This theory describes the mutually
exclusive nature of brain tumour cells to either proliferate or diffusely infiltrate
the contingent brain. Invasion is perhaps the most significant biological
feature that precludes successful treatment. Other biological features
exhibited by malignant neoplasms that obstruct treatment are cellular
heterogeneity and angiogenesis. Evasion of treatment therefore leaves
patients diagnosed with malignant neoplasms with a bleak prognosis.
Anaplastic astrocytomas are diffusely infiltrating astrocytomas with
proliferative potential and either focal or dispersed anaplasia and a display of
hypercellularity which is often important in diagnosis. They have a tendency to
infiltrate without tissue destruction thus often leading to enlargement of
adjacent structures. The tumour mass frequently appears granular and
opaque with a soft consistency. Anaplastic astrocytomas have a poor
prognosis with tumours undergoing malignant progression, though
progression of recurrent tumours is more rapid that those that arise de novo.
Glioblastoma multiforme (GB) is the most malignant form of astrocytoma, at
WHO grade IV this neoplasm portrays all the features of malignancy and is
amongst the most difficult of astrocytomas to treat effectively and remains
incurable. GBs account for approximately 15-20% of all intracranial
neoplasms and 50% of all gliomas (Glantz 1991, p1741). Morphology of GBs

4 | P a g e
varies greatly, due to its heterogeneous nature. Cells appear a number of
different shapes with marked invasive cell populations budding of the tumour
mass thus invading both hemispheres of the brain and characteristically
displaying the ‘butterfly’ effect. GBs are also associated with oedema,
degeneration and occasional haemorrhaging. Molecular studies support two
pathways of occurrence of GBs, they can arise both de novo and as a result
of malignant progression from anaplastic astrocytomas. Prognosis of GBs is
poor with most cases leading to mortality with a year of diagnosis (Hottinger
2014, p32; Stupp 2005, p988; Grossman 2004; McKinney 2004, p13;).
1.4.2 Oligodendrogliomas
Oligodendroglial tumours can be either well-differentiated, low grade tumours
(WHO grade I or II) or malignant tumours (WHO grade III). Unlike astrocytic
tumours the incidence for oligodendrogliomas is far less. Traditionally these
were thought to comprise 2% to 5% of primary brain tumors however recent
studies have indicated these account for around 4% to 15% of gliomas
(Engelhard 2003, p444; Paleologos 2001, p59). Oligodendrogliomas are
localized to the white matter of the cerebral hemispheres. Macroscopically the
tumours mass may appear soft and gelatinous and can be associated with
infiltration of the surrounding cortex and adjacent leptomeninges. The tumour
cells are monomorphous and in areas of increased cellularity the tumour
mass may display circumscribed nodules. Morphologically they have uniform
round nuclei slightly larger than those of normal cells. During degeneration the
mass creates a distinctive ‘honey-comb’ effect which is used as a useful
diagnostic feature. Survival rates of oligodendrogliomas are more favourable
than diffuse astrocytomas specifically post-operative median survival time is
3-5 years (Chinot 2001, p13; Sun 1998, p886; Shaw 1996, p288). Also, in
contrast to astrocytomas, recurrence and malignant progression occurs less
frequently.
5 | P a g e
1.4.3 Progenitor Cells
The presence of a population of cancer stem cells has been discovered, over
the years, as a result of research into the existence of cancer progenitor cells
in cancers such as leukemia (Lapidot 2001; Reya 2001; Bonnet 1997).
Normally progenitor cells or stem cells are cells that indefinitely self-renew
and give rise to differentiated cells (Watt 2000). Pluripotent stems cells, have
the ability to give rise to multipotent or tissue-specific stems cells, which in
turn have been identified in various organs including bone marrow, breast,
intestine, lung, skin and brain (Shackleton 2006; Dekaney 2005; Kim 2005;
Alonso 2003; Krause 2001; Uchida 2000). Though dormant under normal
physiological conditions, these, may also, be stimulated, during homeostasis
and injury repair, into simultaneous self-renewal, maintaining a stem cell
population, and differentiation, giving rise to a new population of all the cell
types of a given tissue (Shackleton 2006; Krause 2001), accountable for
tissue function and homeostasis (Weissman. 2001) for example stem cells of
neural tube origin give rise to neurones, astrocytes, oligodendrocytes and
ependymal cells (Fig 3). Such a phenomenon is known as trans-
differentiation.

6 | P a g e
Figure 3 Differentiation of progenitor cells in the neural tube adapted from Fan et al.
(2007)
Cancerous stem cells however continually clone tumour cells thus are
responsible for maintenance of the tumour mass which ultimately leads to
increasing malignancy (Singh 2003, p5822).
O-2A progenitors
Neurons Oligodendrocytes Astrocytes
Neural Stem Cells
Neuronal –restricted progenitor cells
Glial –restricted progenitor cells
Astrocyte progenitors
?

7 | P a g e
1.5 Clinical Presentation of Gliomas
Patients with primary neoplasms usually present with drowsiness, headaches,
vomiting/nausea and/or papilloedema as a result of increased pressure and
neural tissue compression due to small increases in the tumour mass.
Cerebrospinal fluid (CSF) pathways may also be blocked as a consequence
of raised pressure preventing drainage thus causing hydroencephalus.
Personality & cognitive changes, focal neurological deficit or seizures may
also present if increased compression, direct infiltration or neuronal
destruction occurs.
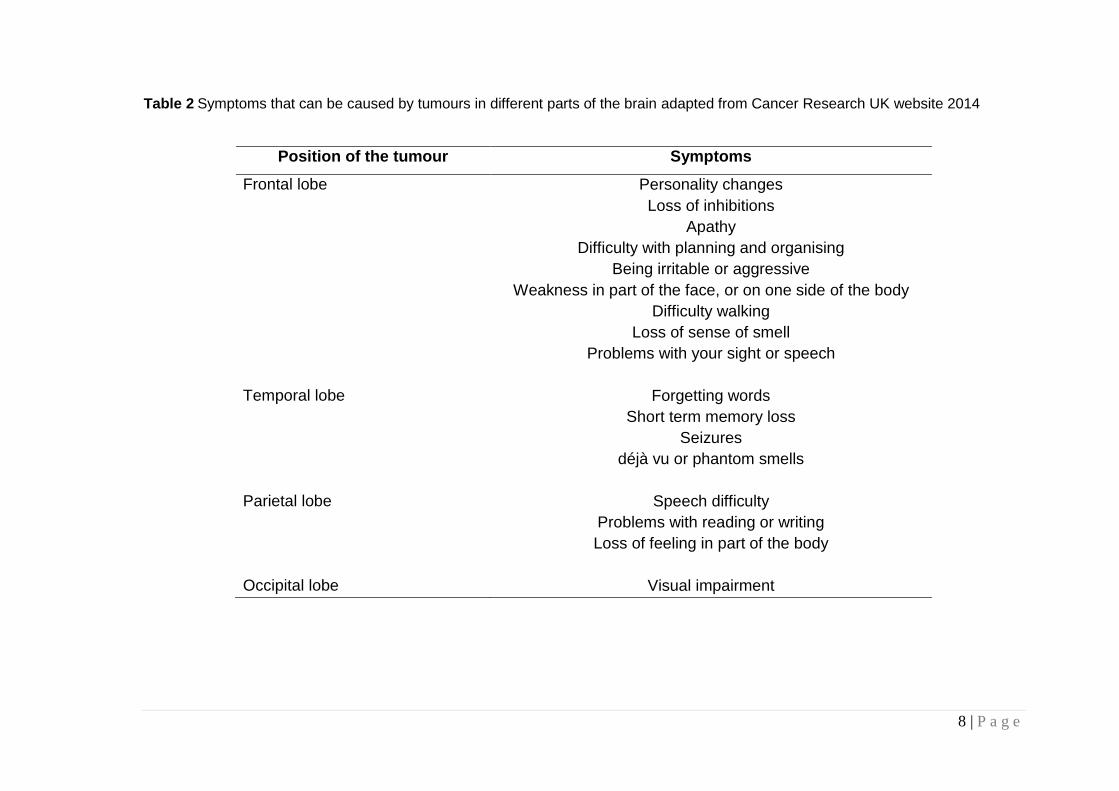
Presentation varies according to location of the tumour and whether or not it is
deep seated. Table 2 illustrates the symptoms associated with some of the
various regions, of the brain. The most common primary symptoms will be a
seizure or epileptic fit, upon which hospitalization and emergency surgery is
required.
8 | P a g e
Table 2 Symptoms that can be caused by tumours in different parts of the brain adapted from Cancer Research UK website 2014
Position of the tumour Symptoms
Frontal lobe Personality changes
Loss of inhibitions
Apathy
Difficulty with planning and organising
Being irritable or aggressive
Weakness in part of the face, or on one side of the body
Difficulty walking
Loss of sense of smell
Problems with your sight or speech
Temporal lobe Forgetting words
Short term memory loss
Seizures
déjà vu or phantom smells
Parietal lobe Speech difficulty
Problems with reading or writing
Loss of feeling in part of the body
Occipital lobe Visual impairment

9 | P a g e
1.6 Diagnosis and Classification of Gliomas
Advances in diagnostic tools over the years have lead to successful diagnosis
of brain tumours. Examples of such include better visualisation of the tumours
using computed tomography (CT) and magnetic resonance imaging (MRI)
scanning and better diagnostic conclusions using microscopy and
Immunohistology.
1.6.1 Imaging
CT scanning was first introduced in the 1970s by Sir Godfrey Hounsfield. This
technique is an advancement of the X-ray machine though unlike an X-ray
machine a CT scanner emits multiple beams to examine a cross-sectional
image of the body thus allowing a 3-dimensional visualisation of the tumour.
This scan is usually accompanied by iodine based compounds which are
absorbed by the tissues and detected by the CT scanner. Unfortunately, the
resolution of soft tissues, compared to bony tissues is poor therefore CT
scans are better used for bony tissues. McCormack et al. (1992) showed that
the seven times increase in the risk of recurrence of low grade astrocytomas
was associated contrast enhancement on a CT scan. Reduced integrity of the
BBB increases enhancement in CT scans rather than the presence of the
tumour itself.
MRI uses the presence of strong magnetic fields to visualise the soft tissues
of the body and is based on the alignment of hydrogen atoms in the body in
response radio waves of the magnetic fields. Images are produced on a
computer to visualise not only 2-dimensional slices of a 3-dimensional image
but also different planes of the image. Contrast enhancements agents or
paramagnetic compounds, such as gadolinium are not normally required
though on occasion they are administered intravenously to increase image
sensitivity.

10 | P a g e
Positron Emission Tomography (PET) measure cerebral blood flow &
metabolic activity. A variant of PET, Single Photon Emission Computerized
Tomography (SPECT), also functions using the same principles. PET scans
are effective in identifying the progression of low grade tumours to high grade
tumours. They are also able to identify recurrent tumours. PET scans
visualise the low grade tumours as ‘cold’ as they are hypometabolic and
malignant areas are perceived as ‘hot’ or hypermetabolic (Francavilla 1989,
p1). Unfortunately as it is an expensive procedure it is very rarely used except
in the case of private patients.
1.6.2 Immunohistology
Following initial diagnosis during surgery, a clinical diagnosis is usually
determined as a result of histological examination of biopsy derived paraffin
sections. This technique is used to investigate and conclude cell lineage,
histological type and malignancy. This technique was first discovered in the
late 1970s when Kohler and Milstein reported immortal/transformed cells
developed monoclonal antibodies (Kohler 1975). These cells gave rise to cell
populations that divided indefinitely and secreted the antibody. These
antibodies were used to identify surface antigens, their receptors or
cytoplasmic and nuclear antigens of both normal and neoplastic cells. A
number of antigenic markers may be related to the detection of astrocytic
tumours some of which include glial fibrillary acidic protein, cluster of
differentiation 44, neural cell adhesion molecules and integrins.
Glial fibrillary acidic protein (GFAP) is an intermediate filament thought to
retain the mechanical strength and structure of astrocytes (Eng 1971) it is a
distinguished marker of normal, reactive and neoplastic astrocytes. Extended
studies of astrocytomas have proved this marker to be invaluable for both
diagnosis and research. It is not however, thought to be exclusive to
astrocytomas alone, instead it is expressed, to some extent, in all gliomas
apart from meningiomas, medulloblastomas and brain metastasis (Oh 1999;
Fischer 1989). The origin of such tumours may be misinterpreted as

11 | P a g e
astrocytic. Instead they are more likely to display a plastic phenotype in vitro
when the microenvironment is changed (Tenenbaum 1996).
Cluster of differentiation 44 (CD44) is an adhesion molecue and a marker of
invasion and progenitor cells. It is up-regulated in brain tumours as a result of
involvement of hylauronic acid (HA) expression increasing in the extracellular
matrix (ECM), during invasion, regardless of tumour grade (Delpech 1993).
CD44 is involved in this invasive process and is commonly studied as a
marker of astrocytic invasion. Ranuncolo et al. (2002) suggested that
overexpression of CD44 could be relevant in determining the highly invasive
behaviour of gliomas, though it does not behave as an independent
prognostic factor for survival
Neural cell adhesion molecules (NCAMs) are members of the immunoglobulin
super family. They are cell surface glycoproteins that mediate cell-cell
adhesion independent of Ca2+ (Keilhauer 1985), play an important role in
neurite outgrowth and fasciculation and are involved in migration/invasion
(Appel 1993). Expression of NCAM has been shown to reduce
migration/invasion of glioma cells both in vitro as well as in vivo (Owens 1998;
Gratsa 1997; Edvardsen 1994; Edvardsen 1993). In addition to cell-cell
adhesion, signal transduction is induced by hemophilic interaction of NCAM,
resulting in neuronal differentiation (Kolkova 2000; Walsh 1996) and inhibition
of cell proliferation (Edvardsen 1993; Edvardsen 1993). Additionally Prag et
al. (2002) reported exposure to NCAM strongly affected the motile behaviour
of glioma cells independently of homophilic NCAM interactions, probably
through interference with factors regulating cellular attachment.
The fundamental cellular function of integrins is their adhesive properties,
which mediate extensive and important cellular functions by interacting with
the extracellular matrix (Palecek 1997; Condic 1997; Gumbiner 1996;
Miyamoto 1995;). The interactions of integrins with the ECM also activate
signal transduction (Clark 1995; Zachary 1992). Many known ECM molecules
that interact with integrins, including fibronectin, collagen, and vitronectin,

12 | P a g e
contain an RGD consensus sequence (D'Souza 1988; Ruoslahti 1986). As
such integrins are an attractive target for the treatment of several cancers
(Xiao 2016). Several factors expressed in glioma cells have been found to
regulate integrin expression, particularly, urokinase, a plasminogen activator
(uPA), secreted by glioma cells. uPA has been shown to upregulate integrin
v3 expression by autocrine mechanism (Pedroja 2009, p20708).
Galactocerebroside (Gal C) belongs to the family of cerebrosides. It is a
common cell surface glycolipid marker for mature oligodendrocytes and
appears to regulate myelin formation (Marcus 2006; Dupree 1998; Bosio
1996; Coetzee 1996). Tenebaum et al. (1996) identified the loss of this
marker in their studies, identifying the changes in antigenic expression in the
presence of different serum supplementation.
Neural glial 2 (NG2) a transmembrane chondroitin sulphate proteoglycan, is
expressed on oligodendrocyte progenitor cells (OPCs) (Chekenya 2002).
OPCs or NG2 cells terminally differentiate into oligodendrocytes and NG2
cells, thus the number of NG2 cells is comparable to the number of mature
oligodendrocytes in the gray matter (Dawson 2000). Unlike astrocytes and
oligodendrocytes, mature cell markers such as GFAP and Gal C are not
expressed on NG2 cells (Butt 1999 Reynolds 1997; Levine 1993; Levine
1987) demonstrating their distinct nature.
Ganglioside GD3 belongs to a family of complex acidic glycolipids. Despite
poor documentation it is thought they are functionally diverse in the normal
brain and are also expressed and play a role in brain tumours (Yates 1995;
Wikstrand 1994; Fredman 1994; Pilkington 1993; Shinoura 1992). GD3 is not
specific to oligodendrogliomas it is reported to be down-regulated in gliomas
(Gratsa 1997).

13 | P a g e
1.7 Biological Features Evading Treatment
1.7.1 Heterogeneity
A predominant challenging feature of astrocytic tumours is their cellular
heterogeneity or complexity (Fig 4). When compared to the single sub cell
population of liver cells of a hepatoma, gliomas can result in up to 14 different
sub populations. Differing processes of differentiation and anaplasia conceive
a variety of morphologies with cells displaying antigenic difference. This
therefore results in sub populations which are not only phenotypically different
but also genotypically different (Marusyk 2010; Pilkington 1992). This
characteristic cellular heterogeneity is seen in early passages and is important
in tumour growth and maintainance. Later passages see retention of fewer
cell sub populations (Pilkington 1992).
Development of cell culture techniques such as cloning individual cell
populations, in vitro growth of neurospheres and multicellular tumour
spheroids, and identification of new markers including nestin, Mushashi-1 and
CD133 confirm the existing heterogeneity of gliomas and are also suggestive
of the existance of a stem cell population within gliomas. The presence of
stem cells in the CNS strongly suggests a role for these cells in tumour
initiation and resistance to current therapeutic strategies.
Differential resistances to radiation and drug therapies makes gliomas more
complicated to treat. One study cloned 16 sub populations from an early
passage (P3-10) human glioma cell culture and exposed each to radiation. Of
the 16 populations two populations remained completely resistant to the
radiation and were employed for further study (Yang 1992). An eariler study
reported a similar resistance to chemotherapy (Yung 1982). Identification of
properties of the individual cell populations opens new and exciting
paramaeters of study, providing vectors in novel therapeutic strategies for
these tumours.

14 | P a g e
Figure 4 Phase contrast micrograph of an anaplastic astrocytoma (III) primary cell
culture IPSB-18. Cells of different morphologies are depicted in particular elongated
and partial star shapped cells are illustrated.
1.7.2 Invasion
Perhaps the most significant biological feature which precludes successful
therapy is invasion. Invasion is a complex pathway, which involves the
interaction of various components (Liotta 1986) including cell adhesion
molecules (e.g. Cluster of differentiation 44, CD44), proteases (e.g. matrix
metalloproteinases – MMPS), extracellular matrix (ECM) components and
growth factors enabling the attachment of invading tumor cells to extracellular
matrix (ECM), disruption of ECM components, and subsequent cell
penetration into adjacent brain structures.

15 | P a g e
In non- CNS tumours, metastasis is the major cause of morbidity and death,
however, in primary brain tumours, there is no metastasis. Invasion allows the
formation of secondary tumours within the brain. Under normal conditions, a
negative feedback mechanism may limit the behavior of normal cells, such as
endothelial cells, and lymphocytes. Although tumor cells use the same
mechanism as normal cells, they seem to lack the appropriate feed back
mechanism during invasion.
One of the most plausible reasons for the failure of brain tumours to
metastasize lies in the interaction of neoplastic glia with the non-brain
endothelial cells. For extravasation of glioma cells at a distant site they must
possess the complement of adhesion molecules necessary to facilitate
adherence to the endothelial wall. Cluster of differentiation 15 (CD15), is an
adhesive oligosaccharide epitope which facilitates neoplastic cell/endothelial
cell adhesion and confers high metastatic potential in non-neural tumours
(Dejana 1992; Matsusako 1992). Human brain tumours show little or no CD15
expression (Martin 1995; Reifenberger 1992) while the chemically induced rat
glioma cell lines, A15A5, F98 and C6, show strong expression of the CD15
antigen (Martin 1995). These latter experimental rat tumours, unlike their
human counterparts, show a propensity for metastatic behaviour.
Furthermore, in vitro adhesion of metastatic carcinoma cells and brain tumour
cells to vascular endothelium correlates with the level of CD15 expression
(Martin 1995).
Invasive ‘guerrilla’ cells display the ‘go or grow’ theory (Bolteus 2001)
whereby the cells are either growing and proliferating within the tumour mass
or the cells enter G0 phase and bud away from the tumour mass and migrate
across the brain cortex by primarily digesting the ECM with the aid of elevated
levels of glycosidases, which break down the glycosaminoglycan chains that
form the mesh of the ECM, and proteases that break down protein structures
with the ECM. Elevated levels of hyluronic acid (HA) also digest the ECM. It is
unknown how HA facilitates tumour cell in vitro (Nakagawa 1996) though
various possibilities have arisen; 1) it may provide a lead for the tumour cells

16 | P a g e
to follow across the ECM 2) it may provide immunity for the cells.
The sequence of events, originally described by Liotta, during tumour cell
invasion of the extracellular matrix are described as a three-step hypothesis
(Onishi 2011). The first step is tumour cell detachment from the primary tumor
mass and attachment via cell surface receptors which specifically bind to
components of the extra cellular matrix (ECM) such as laminin and
fibronectin. The anchored tumour cells then secrete hydrolytic enzymes which
can locally degrade the matrix. And finally tumour cell locomotion into the
region of the matrix modified by proteolysis.
Detachement of the cells involves various events. Firstly destabilization of
cadherin-mediated junctions that hold the primary mass together must occur.
Cadherins (E-, P-, and N-cadherin) form calcium-dependent, transmembrane,
cell–cell adherent junctions. Cadherins may function as suppressors of tumor
growth and invasion (Demuth 2004). Decreased cadherin function in
carcinoma progression, is correlated with poor prognosis (Bremnes 2002).
Subsequently a decline in the expression of connexin 43, a component of gap
junctions, leads to a reduction in junction formation. Fewer inhibitory signals
may be resulted due to decreased gap junction formation, facilitating
uncontrolled cell division and de-differentiation (Ruch 1994). Connexin 43 is
the most abundant gap junction protein in CNS and is expressed primarily in
astrocytes (Dermietzel 1993). McDonough et al. (1999) reported that reduced
gap junction formation correlates with increased motility of glioma cells in
vitro. Clevage of CD44, which anchors the primary mass to ECM, by the
metalloproteinase ADAM is the final part of the process. CD44 is cleaved by
ADAM 10 and 17. Both the intracellular and extracellular cleaved components
of CD44 promote cell migration (Okamoto 1999, p 25530).
Adherence to the ECM is most commonly facilitated by integrins. They
interact with two groups of ligands including a variety of ECM proteins, such
as fibronectin, fibrinogen and vitronectin, and cell surface molecules, that are

17 | P a g e
members of the immunoglobulin supergene family, such as vascular cell
adhesion molecule (VCAM-1) and intracellular adhesion molecules (ICAM-1,
ICAM-2). In particular, the integrin v3, which binds to fibronectin,
vitronectin, and tenascin-C in ECM, is thought to play a central role in glioma
invasion (Leavesley 1993, p165). Up regulation of v3 expresion leads to
increased motility of human glioma cells and a decrease in apoptosis
sensitivity (Platten 2000).
The most common proteases involved in the degradation of the ECM are
MMPs. The first experimental evidence for a role of MMPs in tumor
development was discovered in the 1980s. It was reported that a type IV
collagenase was demonstrated to be involved in melanoma invasion and
metastasis (Liotta 1980). These are a family of zinc dependent enzymes
which all pave a pathway for the malignant tissue to migrate or invade along.
23 members of the MMP gene family have been identified to date (Nagase
2006) the most commonly noted in GBs as being up-regulated, are MMP-2,
MMP-7, MMP-9, MMP-14 and MMP-15, these can be down-regulated in the
presence of micronutrients such as selenium (Rooprai 2007).
Regulation of MMPs occurs at many levels: transcriptional activation of MMP
genes can occur in response to agents such as growth factors, oncogene
expression and phorbol esters (Matrisian 1985; Kerr 1988; Matrisian & Hogan,
1990). TGFβ upregulates the expression of MMP-2 and MMP-9 (Wick 2001;
Salo 1991; Overall 1991) while EGF and PDGF were shown to induce
stromelysin gene expression in fibroblasts (Matrisian 1985).
Integrins have also been shown to induce MMP expression. The ligation α5β1
integrin, reported by Werb et al. (1997), showed that, very late antigen-5
(VLA-5) on fibroblasts induced collagenase and stromelysin gene expression.
Another study reported that binding of the αvβ3 integrin up-regulated the
expression of MMP-2 in melanoma cells (Seftor 1992, p1557). The αvβ3
integrin was also capable of directly binding to the active MMP-2 enzyme
inhibiting adhesion to vitronectin (Brooks 1996, p687). From studies in glioma

18 | P a g e
cells Deryugina et al. (1997, p2474) showed that αvβ3 binding to MMP-2
occurred through the C-terminal portion of the enzyme. Treatment of GB cell
lines with α3β1 antibodies increased MMP-2 activity and invasion in matrigel
assays (Chintala 1996).
Interleukin-1β (IL-1β) has also been shown to induce stromelysin gene
expression in fibroblasts (Frisch & Ruley, 1987; Quinones 1989).The
conversion of latent proenzyme to its active form is another level of regulation
via plasmin or active stromelysin. Although neither plasmin nor stromelysin
appear to activate MMP-2 (Okada 1990) in vitro, they have been shown to
activate MMP-2 by means of MMP-14 (MT-MMP) (Strongin 1995).
A variety of zymographic & enzyme-linked immunosorbent assay (ELISA)
studies have revealed increased activity of MMPs in GBs and anaplastic
astrocytomas when compared to low grade astrocytomas and normal brain,
particularly for MMP-9 (Nakagawa, 1994; Rao 1993, 1996). Glioma cells in
vitro have been shown to secrete many MMPs including MMP-1, MMP-2,
MMP-9, MMP-3 and MMP-7 (Nakano 1993). The amounts secreted into the
culture medium are often higher than those extracted from tissue (Woessner,
1995). In GBs and anaplastic astrocytomas immunoreactivity to MMP-9 and
MMP-2 has been reported in endothelial and tumour cells (Rao 1996; Sawaya
1996).
Secreted MMPs, from glioma cells have the ability to degrade the surrounding
brain tissue (Lund-Johansen 1991; Bjerkvig 1986), and MMP-2 & MMP-9 can
degrade collagen IV a component of the ECM. Liotta (1986) proposed that
such proteolytic enzymes were involved in invasion. Indeed, the highly
invasive astrocytoma cell line, SF-188 expressed MMP-2 & MMP-9 (Rutka,
1995) also GB cell cultures have been shown to secrete MMP-9 during in vitro
2-dimensional invasion studies using Matrigel (Rao 1994). Upon treatment
with the appropriate inhibitors the ability to invade was reduced (Pan 2015).

19 | P a g e
Upregulation of MMP-2, and MMP-9, in particular, has been associated with a
high degree of maglinancy and enhanced glioma invasion in several in vitro
and in vivo model systems (Wild-Bode 2001). The transition of tumour cells
towards the invasive phenotype, involves gene products such as MMP-2,
though the mechanisms of initiation and maintenance of glioma invasiveness
remain unknown.
Inhibition of MMPs could aid a reduction in invasion ultimately preventing
recurrence of tumour growth. The natural tissue inhibitors of MMPs (TIMPS),
these are currently being studied for their anti-invasive and anti-angiogenic
properties. The classical notion of TIMPs in tumour biology is rather narrow,
however, and there is a growing appreciation that these proteins.
In vivo, TIMPs, play a major role in the regulation of MMP activity. (Liotta,
1986; Ennis & Matrisian, 1994; Matrisian, 1990). TIMPs are secreted proteins
that consist of a family of inhibitors that is comprised of 4 gene products
(TIMPs 1–4) which inhibit secreted MMPs with similar potencies (Apte 1995;
Greene, 1996; Blavier 1999). Individually, TIMPs differ markedly in their
affinity for MMP interactions and gene regulatory mechanisms. Specifically
TIMP-1 interacts with pro-gelatinase-B (MMP-9) and is subject to tight control
at the transcription level (Phillips 1999), whereas TIMP-2 binds pro-gelatinase
A (MMP-2) and shows constitutive gene expression (Blavier 1999).
Existance of differences also occurs with regard to biochemical properties:
TIMP-3 is itself an ECM-associated protein but TIMP-1, -2 and -4 are freely
diffusible (Leco 1994). Moreover, TIMP-1 is ineffective as an inhibitor of MT1-
MMP, whereas TIMP-2 and TIMP-3 are both functional in this regard (Will
1996). The general notion is that TIMPs act as the ‘brakes’ of the malignant
process. Thus, antisense-mediated down-regulation of TIMP-1 can induce
tumorigenic and migratory behavior of cells in mouse fibroblasts (Khokha,
1989). Overexpressed or exogenous TIMP-1 and TIMP-2 reduce tumour
invasion and metastasis in vivo (DeClerck 1991; DeClerck 1992). Additionally,
TIMP-3 down-regulation has been noted at the invasive edge of highly
20 | P a g e
aggressive colorectal carcinomas (Powe 1997), and overexpressed TIMP-4
resulted in decreased invasive capacity of breast carcinoma cells (Wang
1997).
The uses of TIMPs lay across a broad spectrum.TIMP-1 can stimulate the
proliferation of erythroid precursors (Gasson 1985), and alongside TIMP-2
can positively influence the proliferation of numerous cell types (Hayakawa
1992; Hayakawa 1994; Wingfield 1999). Additionally, TIMP-2 is able to inhibit
in vitro proliferation of human microvascular endothelial cells stimulated with
bFGF (Murphy 1993), and TIMP-3 promotes apoptosis (Ahonen 2003, p2122;
Baker 1998), possibly through stabilization of TNF alpha receptors (Smith
1997).
There is a wealth of evidence showing that MMPs are overexpressed in
malignant gliomas but studies of TIMPs in gliomas give conflicting results.
High TIMP levels have been linked with increased malignancy. The
suggestion of a balance between MMPs and TIMPs to increase the activity of
MMPs in culture may be due to reduced TIMP levels rather than elevated
enzyme secretion. Notably, lesser amounts of TIMP would be secreted by
tumour cells having an invasive phenotype compared to tumour cells with a
non-invasive phenotype (Halaka 1983). Reduced expression of TIMP-1 and -2
with increasing glioma grade has been reported, suggesting that a lack of
inhibitor expression may contribute to a more aggressive glioma phenotype
(Mohanam 1995; Kachra 1999). In contrast other studies have reported an
upregulation of TIMP-1 or -2 expressions in malignant tumours (Nakano 1995;
Saxena 1995; Lampert 1998). Recently the expression of TIMP-4 was
described as a marker of gliomas (Rorive 2010) and has also been shown to
be upregulated with increasing malignancy.

21 | P a g e
1.7.3 Angiogenesis
Angiogenesis, another hallmark of malignant gliomas, is the formation of new
blood vessels from the pre-existing microvasculature thus supporting the
tumour mass (Auerbach 2003). The formation of new blood vessels is
attributed to either vasculogenesis or arteriogenesis. Vasculogenesis is the
embryonic process, however was also identified in tumours in the novo
production of blood vessels from circulating marrow derived endothelial
progenitor cells. Arteriogenesis refers to enlarged arteriolar networks
produced to sustain increased oxygen demands and this process doesn’t play
significant role in tumour biology (Tate 2009).
Angiogenesis is a critical process for cell survival and development (Arias
2009) in particular during the development events in the female reproductive
organs and wound healing. However, aberrant angiogenesis in the
pathogenesis of numerous diseases including rheumatoid arthritis, diabetic
retinopathy, Parkinson’s disease, Alzheimer disease and cancer is also
associated with excessive angiogenesis. In contrast, insufficient angiogenesis
can be linked to stroke, infertility and heart disease. Normally endothelial
cells, which line all blood vessels and constitute virtually the entirety of
capillaries, divide rapidly in response to a physiological stimulus like hypoxia.
Tumour blood vessels differ from those formed in wound healing and from
those in normal organs. The structure of these new blood vessels is abnormal
with an irregular or increased diameter, thickened basement membrane,
random branching, elevated permeability, lack the defining structural features
of arterioles, capillaries or venules, and highly proliferative endothelial cells
(Tate 2009). Additionally, it has been shown that abnormal blood vessels in
gliomas create a vascular niche that houses glioma stem cells capable of
giving rise to an entire tumour (Tate 2009). Unusually, despite the large size
of some vessels, blood flow is typically poor and can change directions or
even stop. The ‘leaky’ nature of these tumour vessels allows macromolecules
to leave and may be the cause of metastasis by facilitating the movement of

22 | P a g e
tumour cells into the bloodstream. Though this is a rare consequence and
may be attributed to the lack of Cluster of differentiation 15 (CD15). Blood
vessel permeability can also lead to the accumulation of fibrin in the
extracellular matrix thus creating a favourable environment for angiogenesis
(Tuettenberg 2006).
Induced by hypoxia, a cause of oedema, and oncogenic mutations, vascular
endothelial growth factor (VEGF) is one of the many factors involved in
angiogenesis and is a primary stimulant (Brekken 2000). Some MMPs are
thought to be mediators of both invasion and angiogenesis (Nuttall 2003).
Other stimulants of anigiogenesis are summarised in Table 3.
Table 3 Some stimulants and inhibitors of angiognenesis.
Proteins Inhibitors
Proteins
Vascular endothelial growth factor
Angiogenin
Accidic fibroblast growth factor
Basic fibroblast growth factor (bFGF)
Interleukin 8
Hepatocyte growth factor
Epidermal growth factor
Placental growth factor
Platelet-derived growth factor
Transforming growth factor alpha
Tumour necrosis factor alpha
Scatter factor
MMPs
Small molecules
Prostaglandins E1 and E2
1-Butyryl glycerol
Adenosine
Nicotinamide
TIMP-1 (tissue inhibitor of
metalloproteinase-1)
TIMP-2 (tissue inhibitor of
metalloproteinase-2)
TIMP-3 (tissue inhibitor of
metalloproteinase-3)
Angiostatin
Endostatin
Thrombospondin
Interferons
Platelet factor 4

23 | P a g e
VEGF increases vascular permeability leading to extravasation of plasma
proteins and dissociation of pericyte coverage. VEGF is a great deal more
active than histamine in enhancing vascular permeability (Nagy 1989).
Studies have shown antibodies specific to VEGF reduced angiogenesis and
almost completely inhibited the growth of human tumours in mice (Kim 1993;
Asano 1995). Colorectal cancers have been known to produce VEGF this
therefore may be an indication that other cancers also secrete the protein
(Nakata. 1998). Studies have suggested the use of VEGF as a marker of
tumour growth or recurrence (Fuhrmann-Benzakein 2000).
There are four main steps involved in angiogenesis (Krishna 2016; Paper
1998; Denekamp 1993) angiogenic factors are secreted by cancer cells (or
adjacent tissues) which instigates the growth of a bud from the dissolved
basement membrane. The basement membrane is a layer of specialized
connective tissue that encircles capillaries and serves as the connection point
between the extracellular matrix (ECM), it also provides structural support to
the capillary. Vascular (endothelial) cells proliferate and migrate from the bud
toward the angiogenic stimulus for example a low-oxygen (hypoxic)
environment. Finally the sprout eventually forms a hollow tube (lumen) and
joins its end with another sprout to form a new capillary vessel.
The key components of the first step of angiogenesis, the breaking down of
existing blood vessels, are the Angiopoietin-1 and its receptor Tie-2, which in
normal brain are bound together resulting in a close association between
pericytes and endothelial cells that stabilise the vasculature. In hypoxic
conditions Ang-2 is up-regulated in endothelial cells whereas Ang-1 is
increased in tumour cells. Ang-2’s increased expression seems to lead to the
initial regression of blood vessels seen in early tumour angiogenesis. Tie-2
signalling up-regulates MMP-2 expression and in conjunction with VEGF
promotes continuation of angiogenesis (Tate 2009) it is at this stage the
vessel basement membrane and surrounding ECM are degraded allowing
endothelial cell migration and proliferation (Tate 2009). Angiogenic stimuli

24 | P a g e
cause increased permeability through dissolution of adherens junctions (Haas
2012) between endothelial cells. Proliferation of these cells occurs early in
angiogenesis and continues when the new capillary sprouts elongates. The
survival and proliferation of endothelial cells is promoted by activation of
PI3K/Akt through modulation of numerous cell cycle regulators like: cyclin D1,
p27 and Bcl-X2. The MAPK signalling pathways (ERK1/2, p38 and JNK)
mediate growth factor and mechanical force-induced proliferation. The
proteolysis of basement membrane is necessary to promote invasion into the
surrounding matrix and is controlled by proteolytic enzymes and its inhibitors.
The MMP-2 and MMP-9 play major synergistic role in basement membrane
degradation they are also promoting pro-angiogenic signalling by exposing
endothelial cells to molecules such as VEGF and fibroblast growth factor
(FGF). (Tate 2009) MMPs have a great affinity for fibronectin, elastin, laminins
and collagens which are the major extracellular matrix components found in
endothelial cell basement membrane and interstitial space. Following
regression of existing vessels and breakdown of the basement membrane,
endothelial cells proliferate and begin migrating toward tumour cells that
express pro-angiogenic compounds. Activation of endothelial cells
upregulates cell surface adhesion and migration molecules such as integrins
and CD44. Upregulation of cell surface receptors, transmembrane
heterodimer proteins integrins ανβ3, α5β1 and ανβ5 in addition to cell
migration increases cell adhesion and survival (Tate 2009) Activated
endothelial cells secrete platelet-derived growth factor (PDGF) that ‘recruit’
smooth muscle cells and pericytes to the site of newly sprouting vessels to aid
in establishment of a new basement membrane (Tate 2009). Pericytes play a
major role in vascular stability by inducing the deposit of a matrix and initiating
signals allowing cell differentiation and quiescence. The complex final steps of
tumour angiogenesis involve a dramatic changes in extracellular environment
and are not well understood (Tate 2009). Formation of new blood vessel is
accomplished by alignment of EC in bipolar mode, then tubular
morphogenesis and finally the lumen formation. In the following step the
vascular loops are formed from connected sprouts and blood begin to flow
through the new vessel loop.

25 | P a g e
Judah Folkman (1971) introduced the concept of angiogenesis in 1971. He
postulated that if a tumour was deprived of new blood vessel formation the
tumour would only grow a few centimeters in diameter, thus reducing
malignant progression and the problems faced by current treatment.
Consequently an anti-angiogenic therapy would manage tumour development
and aid current treatment.
1.8 Apoptosis
A high rate of angiogenesis in brain tumours is accompanied by a severe
reduction in apoptosis (programmed cell death) a pathway which ideally would
be activated during treatment. However, apoptotic resistance is a classic
feature of gliomas which result in accumulation of these mutations. Apoptosis
was discovered in the early seventies, before this necrosis was thought to be
the only form of cell death. The importance of studying apoptosis in cancer
remained unappreciated for nearly 2 decades. Now it is well documented that
most cytotoxic anti-cancer agents induce apoptosis (Boik 2001). Apoptosis is
mediated by a family of cysteine aspartic acid-specific proteases or caspases
(Fig 5). Caspases exist within the body, as inactive precursors of their active
forms (zymogens). Upon activation these zymogens engage in various
pathways resulting in apoptosis. They are divided into three groups; apoptosis
effectors (including 3, 6 and 7), apoptosis initiators (including 2, 9, 8 and 10)
and cytokine maturation (1, 4, 5, 11, 12, 13 and 14) (Strasser 2000; Cryns
1998). Activation of the apoptosis pathways may be initiated in one of two
modes; mitochondrion (intrinsic) pathway and Death Receptor (extrinsic)
pathway (Fig 5).
The intrinsic pathway involves the disruption of the mitochondrial membrane.
Consequently a number of mitochondrial proteins are released including
cytochrome c. Cytochrome c in conjunction with apoptotic protease activating
26 | P a g e
factor -1 (Apaf-1) and zymogen procaspase 9, promote the assembly of
apoptosomes; cytochrome c, Apaf-1 and caspase 9 complex, ensuing the
activation of caspase 9 which consequently initiates the apoptotic caspase
cascade.
The extrinsic pathway employs a death receptor; a transmembrane receptor
(including Fas, TNF and TRAIL) which upon ligation with its respective ligand
(FasL, TNF and TRAIL) activates caspases 8 and 10. These subsequently
cleave and activate effector caspases 3 and 7 resulting in apoptosis. Unlike
the intrinsic pathway the extrinsic pathway is independent of the p53 protein.
It has been reported that glioma cell cultures do not appear to activate the
extrinsic apoptotic pathway in response to irradiation or cytotoxic drugs
(Steinbach 2004), instead they display a high expression of inhibitor proteins,
which may be responsible for the failure of glioma cells to activate caspases
in response to apoptotic stimuli.
There have been tremendous advances in the understanding of apoptosis,
particularly, in the identification of molecules involved and understanding of
function and pathways (Bogler, 2002; Lowe, 2000). The protein p53, is
commonly associated with defects in cancerous tissue. It is an example of a
molecule implicated in regulation of apoptosis (Pucci, 2000; Smith 2000). p53
acts as a scanner for proliferating cells. Minor damage to DNA is repaired and
cells with major DNA destruction are destroyed by apoptosis. It also facilitates
the process of differentiating cells to leaving the cell cycle. Many brain and
systemic tumours have shown mutation and/or loss of the p53 gene
suggesting that cycling cells accumulate defective DNA material. p53 is
implicated in the intrinsic pathway of apoptosis. Increasing activation of the
p53 molecule could induce a pro-apoptotic effect.
It has been reported that the protective gene p53 is activated by progesterone
therefore redudcing the risk of cancer. As RCE mimics the structure of
progesterone it would be assumed to induce activation of p53 and as such
apoptosis
27 | P a g e
Tumour cell death by cytotoxic approaches such as anticancer drugs,
irradiation, suicide genes or immunotherapy, is predominantly mediated
through induction of apoptosis (Boik 2001; Fulda 1998; 2001; 2002;
Hengartner 2000; Kaufmann 2000; Herr 2001; Debatin 2002; Johnstone
2002). Despite the concept that anticancer drugs act by inducing cell death,
defects in apoptosis programs may contribute to tumour progression and
treatment resistance (Cory 2002; Igney 2002).
Resistance to apoptosis is seen in the normal brain, where differential
resistances exist (Salgado 2007) and increases during malignancy. Migrating
cells in the marginal zones of the GBs do appear to be more sensitive to
apoptosis (Lefranc 2005) illustrating an inverse correllation between
resistance to apoptosis and migration (Sarafian 2009). Such a phenomenon is
attributed to the increased expression of V3 in the marginal infiltrating
zones where it acts as a regulator of invasion, proliferation and angiogenesis
(Bogler 2005), confirming the inverse relationship between apoptosis and
angiogenesis.
There is little evidence that the current modes of coventional treatment
mediate their effects via induction of apoptosis (Steinbach 2004). Thus pro-
apoptotic novel therapies are increasingly studied. One such therapy is
Clomipramine Hydrochloride (CLOM), a tricyclic antidepressant. In use for
over thirty years, it has the ability to induce apoptosis in malignant glioma
cells in vitro (Daley 2005). The induction of apoptosis when using CLOM is
associated with the intrinsic pathway (Daley 2005; Levkovitz 2005; Ekert
2004).

28 | P a g e
Figure 5: Apoptosis initiation pathways both extrinsic and intrinsic including
caspases involved.

29 | P a g e
1.9 Conventional Treatment
Current conventional therapies for malignant gliomas include neurosurgery
followed by radiotherapy. Previously, chemotherapy was only offered to these
patients at recurrence to provide adjuvant and palliative support (Grant 2004;
Grossman 2004; Rampling 2004), though it is now offerefed concomitantly
with radiotherapy. Provided as a combination these therapies are known as
the gold standard treatment.
1.9.1 Neurosurgery
Neurosurgery is not curative as local recurrence occurs due to the ability of
such tumours to invade the contiguous nervous tissue instead surgery aims to
histologically diagnose, debulk or resect as much of the tumour mass as
possible to relieve symptoms created by the presence of the tumour. Risks
associated with neurosurgery include post operative paralysis, brain damage,
infection, psychosis and even death.
However, over the years new sophisticated developments in surgery have
reduced the potential risks associated with neurosurgery. For example, the
availability of corticosteroids in the 1960s reduced pressure in the brain thus
easing the debulking process. Sterotactic frames (Kelly 1986) allowed a
greater precision in locating exact sites of tumours thus reducing the space
operated on. Stereotactic surgery is commonly used to operate of ill-defined
tumours, small tumours or those that exist in locations which are difficult to
operate in and to map and define expressive tissue (Salcman 1990; Moore
1989). Stereotactic surgery is also favoured when deriving biopsies for
diagnosis purposes.
The use of real time MRI (RT-MRI) and micro cameras have allowed greater
precision allowing the surgeon to identify not just the location of the tumour
but also the quantity of tumour mass removed thus avoiding unnecessary

30 | P a g e
removal of brain tissue (Carpentier 2008). The invention of microsurgical tools
have also allowed for greater accuracy at the tumour border. Various other
surgical techniques using laser beams have recently been produced these are
less invasive processes.
Complete surgical resection of the tumour with sufficient margins of adjacent
normal tissue cannot be achieved due to the diffuse mode of local spread so
most gliomas are reported to re-grow (Berger 1996). As such radiotherapy is
considered.
1.9.2. Radiotherapy
Radiotherapy, although considered to be aggressive, is the most effective of
the three therapies. It is give to patients with malignant brain tumours, when
the cels are rapidly dividing. Though it is most commonly administered in
conjunction with neurosurgery with the intention of killing any residual cells, it
is only admistered once, due to the resitrait of the body against radiation.
Radiotherapy damages the DNA using the cytotoxic affects of X-rays or
rays, produced by megavoltage linear accelerators or nuclear particles such
as cobalt60 and caesium137.
Randomized studies have shown 50 to 60 Gy post operative radiation of the
whole brain increases median survival time from 14 weeks to 36 weeks
(Shapiro 1976; Walker 1980; Walker 1978) however these quantities have
been associated with radiation injury (Walker 1979; Bleehen 1980; Chang
1983) various studies are continually being carried out to reduce radiation
injury and neurotoxicity however results represent selected patients with local
diseases have a significant impact as shown in a study by Sarkaria et al
(1995) who underwent a clinical trial of a novel interstitial radiation device
placed after debulking. Further studies in this field are required to reduce
toxicity and unnecessary necrosis. Also, new approaches to improve
treatment of brain tumours, incorporating radio-chemotherapy after surgery
are being investigated.
31 | P a g e
1.9.3 Chemotherapy
Chemotherapy is an adjuvant therapy which was given to patients with high
risk of recurrence, though now is commonly concomitant with radiotherapy.
Chemotherapy may improve survival albeit slightly, but is associated with
significant toxicity, however important advances in the development and use
of cytotoxic drugs have been made recently including the use of
Temozolomide (an oral alkylating agent) (Gilbert 2013; Stupp 2005),
carmustine (gliadel wafers) (Westphal 2003; Westphal 2003) and Avastin
(Junck 2011). The advantage of chemotherapy over other therapies is that it
is administered when the cells are at their most vulnerable; after surgery.
Success with chemotherapy relies on three fundamentals; debulking must
have occurred, the chemotherapy agent should be available and
chemotherapy should be administered immediately after surgery at the
maximum dose tolerated and for a limited time only (Grossman 2004).
Unfortunately, these prerequisites are not always achieved. For example,
during the therapy of brain tumours, patients are put on adjuvant trials after
partial resections and stereotactic biopsies the cytotoxic drug is required to
act upon a larger number of impervious cells. Chemotherapy can be
administered either individually or as a combination of cytotoxic drugs. Some
of which include carmustine, lomustine, Irinotecan, Methotrexate, Carboplatin,
Vincristine, Procarbazine and the newly developed Temozolomide.
Having demonstrated the ability to cross the blood-brain barrier (Ostermann
2004; Patel 2003), temozolomide, was considered for glioma therapy, after
phase I and II clinical trials indicated that temozolomide has considerable
potential in treating gliomas and improving the quality of life of patients (Bower
1997; Newlands 1996; Paulsen 1999). Professor Malcolm Stevens et al.
introduced this novel molecule in the late 1980s.
Temozolomide, is a new class of second-generation imidazotetrazine
prodrugs, it undergos spontaneous conversion under physiological conditions
to the active alkylating metabolite methyltriazeno-imidazole-arboxamide

32 | P a g e
(MTIC) (Stevens 1987) and as such, does not require hepatic metabolism for
activation (Clark 1995). These agents are structurally unique as they contain
three adjacent nitrogen atoms that confer unique physicochemical properties
and much greater antitumor activity (Stevens 1987). The principle mechanism
responsible for temozolomide cytotoxicity seems to be the methylation of
DNA. The active alkylating agent MTIC, degrades to the methyldiazonium
cation, and transfers the methyl group to DNA (Spassova 1985; Denny 1994).
The methylation of the O6 position of GMP in DNA, although relatively
infrequent (6-7%), is usually regarded as the lethal lesion (Zhang 2006;
Danson 2001; Newlands 1996; Friedman. 2002; Nagasubramanian. 2003).
Hegi et al. (2005) did a correlative study on specimens from EORTC
26981/NCIC CE.3 to examine the association of O6-methylguanine-DNA
methyltransferase (MGMT) gene promoter methylation status with survival.
MGMT is cytoprotective, it repairs methyl adducts at the O6 position on
guanine in DNA, and transfers the methyl group to an internal cysteine
acceptor residue. This reaction results in irreversible inactivation of MGMT,
requiring increased de novo protein synthesis to restore repair activity.
Restoration of MGMT activity is a relatively rapid event, usually occurring
within several hours, in human malignant brain tumors (Schold 2004). The
effectiveness of temozolomide, therefore, is only assumed to be significant
with daily repetitive dosing schedules predicted to be most successful at
depleting MGMT and thereby enhancing its cytotoxicity. As such it was
reported the effect on survival of combining radiation and temozolomide was
most marked in glioblastoma patients whose tumors had MGMT promoter
methylation, those without did not appear to receive significant benefits of the
combined therapy.
The methyldiazonium cation can also react with RNA and with soluble and
cellular protein (Bull 1987). However, the methylation of RNA and the
methylation or carbamoylation of protein do not appear to have any known
significant role in the antitumor activity of temozolomide (Friedman. 2000).

33 | P a g e
Studies into the efficacy of temozolomide as an adjuvant to radiotherapy
(Stupp 2005; Stupp 2002) to improve survival time by 14.6 months after
primary surgical resection. When comparing the effects of temozolomide as
adjuvant therapy with radiation and radiation alone, adjuvant therapy
improved survival rates with approximately 9 % of patients surviving 5 years
(Stupp 2009). In addition, temozolmide taken with other chemotherapies has
been shown to be efficacious (Vredenburgh 2009), however may also exhibit
increased adverse effects (Saran 2016).
Studies into administrating the chemotherapy systemically has led to the
production of carmustine (1,3-bis(2-chloroethyl)-1-nitrosourea) wafers or
Gliadel wafers which are inserted after debulking into the surgical bed with the
aim of destroying any residual cells in the vicinity of the surgical bed. Gliadel
wafers are increasingly a popular approach for delivery of chemotherapy.
These biodegradable, impregnated polymers are implanted in the tumor bed
at the time of resection, providing a controlled release of local chemotherapy
for approximately 3 weeks (Brem 1996), while minimizing systemic adverse
effects (Tamargo 1989; Fung 1998; Ewend 1996; Ewend 1998; Brem 1992;
Withrow 2004). Many studies on the use of Gliadel wafers for the treatment of
both primary and recurrent gliomas have shown improved survival with no
marked increase in adverse effects (Brem 1991; Brem 1995; Sipos 1997; Olivi
2003; Westphal 2003), though concern about associated complications have
arisen, both in published case reports and in a small case series (Weber
2005; McGirt 2002; Engelhard 2000; Subach 1999) . These reported
complications include malignant cerebral edema, resection cavity cyst
formation, cerebrospinal fluid (CSF) leak, wound healing abnormalities, and
increased perioperative seizure activity (Engelhard 2000). Gliadel wafers were
reported to increase median survival of >13 months in primary malignant
glioma patients (Westphal 2003). Recent studies reported Gliadel wafers with
concomitant temozolomide was not only well tolerated by patients but also
resulted in a median survival of >18 months (McGirt 2009; Larocca 2005).

34 | P a g e
1.9.4 Avastin: An Anti-Angiogenic Treatment
Another mode, of increasing interest within the field of conventional therapy,
are molecular targets, in particular the drug Avastin (Bevacizumab). Avastin
targets the molecule vascular endothelial growth factor A (VEGF-A).
Malignant gliomas are highly vascularized tumors. Angiogenesisis is one of
the pathological hallmarks of GBs. One of the difficulties of developing
effective treatments for gliomas has been poor drug penetration through the
blood-brain barrier. By targeting tumor vasculature, theoretically it may be
possible to bypass this dependence of drugs to cross the blood-brain barrier
to reach their target. Both experimental (Kamoun 2009; Wong 2010) and
clinical (Friedman 2009; Kreisl 2009) evidence have reported anti-angiogenic
drugs decrease vasogenic edema and patients' requirement for
corticosteroids which are a significant cause of morbidity.
Avastin is a humanized monoclonal antibody that binds to, a stimulant of
angiogenesis, VEGF-A, and stops tumor growth by preventing the formation
of new blood vessels. Avastin may work by causing regression of existing
microvessels, helping arrest tumor growth and reduce tumor size,
‘normalization’ of surviving mature vasculature, making the tumor vasculature
more conducive to effective anti-cancer therapy and inhibition of
neovascularization (Mukherji 2010).
Avastin was first approved in combination with chemotherapy in the treatment
of lung (Johnson 2004), breast (Miller 2007), renal (Yang 2003) and colorectal
cancers (Berretta 2008; Hurwitz 2004). Investigation into the use of Avastin in
the treatment of GBs has yielded positive results and in 2009 the FDA granted
approval for Avastin to be used in the treatment of GBs following prior therapy
(Cohen 2009). Studies combining Avastin and chemotherapy drugs, in
particular irinotecan and temozolomide reported improved overall survival
times.

35 | P a g e
Despite initial reluctance to investigate Avastin in patients with brain tumors
owing to concerns of intracranial haemorrhage, a series of 29 patients with
recurrent malignant gliomas treated with Avastin and irinotecan showed no
significant haemorrhage (Stark-Vance 2005). Schiff et al. (2008) reported
Avastin in combination with irinotecan, when compared to Avastin alone not
only reduced progression but also improved survival rates. However,
irinotecan had been previously tested as a single agent in phase 2 trials and
was found to have low levels of progression free survival. These results led to
investigation of the use of Avastin alongside temozolomide. Although this
combination was also well tolerated, it did not improve median overall survival
or progression free survival (Verhoeff 2010, p1723). Investigation into
combinations with Avastin and other chemotherapy drugs is on-going.
1.10 Conventional Medicine Clinical Trials.
Conventional medicine is continually being investigated and evaluated.
Globablly clinical trials into the efficacy of various drug combinations are being
performed. Currently in the UK alone there are approximately 20 clinical trials
recruiting adults for glioma therapy research. Table 4 summaries a few of the
trials currently recruiting.
Gliomas display several biological features that succesfully evade
conventional therapy. Due to these complications, despite continuing clinical
trials and experimentation, conventional medicine has only made two novel
advances in the past three decades, namely Temozolomide and Avastin.
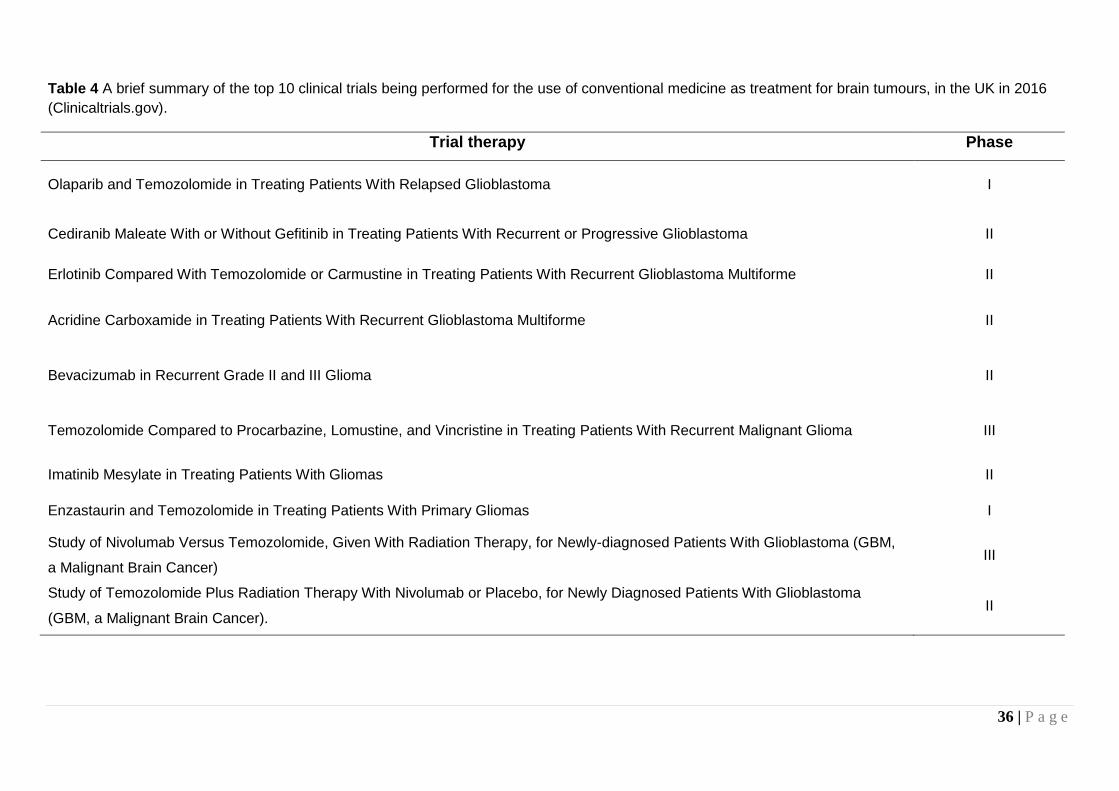
36 | P a g e
Table 4 A brief summary of the top 10 clinical trials being performed for the use of conventional medicine as treatment for brain tumours, in the UK in 2016
(Clinicaltrials.gov).
Trial therapy Phase
Olaparib and Temozolomide in Treating Patients With Relapsed Glioblastoma I
Cediranib Maleate With or Without Gefitinib in Treating Patients With Recurrent or Progressive Glioblastoma II
Erlotinib Compared With Temozolomide or Carmustine in Treating Patients With Recurrent Glioblastoma Multiforme II
Acridine Carboxamide in Treating Patients With Recurrent Glioblastoma Multiforme II
Bevacizumab in Recurrent Grade II and III Glioma II
Temozolomide Compared to Procarbazine, Lomustine, and Vincristine in Treating Patients With Recurrent Malignant Glioma III
Imatinib Mesylate in Treating Patients With Gliomas II
Enzastaurin and Temozolomide in Treating Patients With Primary Gliomas I
Study of Nivolumab Versus Temozolomide, Given With Radiation Therapy, for Newly-diagnosed Patients With Glioblastoma (GBM,
a Malignant Brain Cancer) III
Study of Temozolomide Plus Radiation Therapy With Nivolumab or Placebo, for Newly Diagnosed Patients With Glioblastoma
(GBM, a Malignant Brain Cancer). II

37 | P a g e
1.11 Requirements of New Therapies
Treatment for GBs to date, regrettably has not been successful in curing
these debilitating neoplasms, though a number of possible therapies have
been investigated, for their management, in both the conventional (including
temozolomide, gene therapy and stem cells) and complementary (including
flavonoids) fields. For an agent to be of therapeutic value for brain tumour
management it should not only be cytotoxic, anti-invasive, anti-angiogenic or
pro-apoptotic but most importantly it should be able to cross the blood-brain
barrier (BBB).
1.12 Use of Complementary and Alternative Medicine
Complementary and alternative medicine refers to those health care practices
and products that are not considered part of conventional medicine. The
words 'complementary' and 'alternative' are used in conjuction, suggesting
they mean the same thing. Although they are a combined phrase i.e.
complementary and alternative therapies' (CAM), but there is an important
difference. It is not always easy to decide whether something is a
complementary or alternative therapy.
Originally described by Eisenberg et al. (1998) as interventions neither taught
widely in medical schools nor generally available in US hospitals, CAM has
undergone a radical change of thought and has recently been described by
Ernst et al (2008) as diagnosis, treatment and/or prevention which
complements mainstream medicine by contributing to a common whole, by
satisfying a demand not met by orthodoxy or by diversifying the conceptual
frameworks of medicine.
A complementary therapy is a therapy which can be used alongside
conventional medical treatment. They aim to decrease morbidity and help
cope with treatment. An alternative therapy is generally used instead of
conventional medical treatment. The main difference between alternative and

38 | P a g e
conventional treatments is all conventional cancer treatments have to go
through rigorous testing by law in order to prove that they work though most
alternative therapies have not been through such testing. As such it some
alternative therapies may cause previously unknown side effects.
There are many different types of complementary therapy, including
aromatherapy, acupuncture, massage therapy, visualization, yoga and herbal
medicines. Health care professionals are generally supportive of the use of
complementary therapies, though some can be reluctant of their use as many
have not been scientifically tested in the same way as conventional
treatments. Various research trials have been performed though more studies
and consistency of testing is needed to help develop knowledge on the
optimum function and use of complementary therapies. Unlike complementary
therapies, alternative therapies are used instead of conventional medical
treatment. People with cancer have various reasons for wanting to try
alternative therapies, some may not start conventional treatment and may
choose to use an alternative therapy instead and others stop conventional
cancer treatment and switch to an alternative therapy. Currently investigation
on complementary and alternative medicines (CAM) in the
management/treatment of, not only brain tumours but also many other
aliments including other cancers, heart disease, asthma and many more, is
actively being performed.
The prevalence of CAM is increasing every year; one or more CAM therapies
are used by 46% of the UK population in their lifetime and 10% annually visit
a CAM practitioner (Thomas. 2004; Thomas 2001). CAM, in the UK, has been
divided into three groups by the government; professionally organised
alternative therapies, complementary therapies and alternative disciplines
which is sub divided into; Long-established and traditional systems of
healthcare and other alternative (House of Lords; Science and Technology,
sixth report, 2001).
CAM has widely been investigated as part of a therapeutic regime against
cancer. Up to 90% of cancer patients use one or more forms of CAM,
39 | P a g e
including relaxation and meditative techniques, vitamins and herbal medicines
and physical or movement therapies (Shen 2002; Richardson 2000; Navo
2004; Swarup 2006; Vapiwala 2006). Specifically, evaluation of the primary
brain tumour patients found that approximately 40% use one or more forms of
CAM (Armstrong 2006; Heese 2010) in particular 39% of patients chose to
employ homeopathy (Heese 2010). Another common CAM modality, chosen
by patients, is Chinese herbal medicine. Chinese herbal medicine has long
been used for treating malignancies, side effects of conventional treatment
and as adjuvant therapies (Hedigan 2010; Chiaramonte 2010).
Despite the current popularity of CAM, most mainstream oncologists have
very little understanding of the therapies (Newell 2000). CAM is also not
aways encouraged due to a lack of herbal standardization, quality control
issues, safety and toxicity concerns, interactions with existing therapeutic
modalities, a lack of proven efficacy by standard clinical trials and a lack of
mechanistic details, to name a few (Azaizeh 2006) this therefore disheartens
patients who believe a greater interest and understanding, in CAM, should be
offered by doctors (Gray 2002).
The increased interest in CAM can be attributed to several factors including
the suggested benefits of CAM for cancer patients, the desire to take control
of their illness and feel hopeful, the notion that CAM modalities are safe and
nontoxic, the ease with which they may be obtained and the decreased faith
in conventional medicine to meet patient needs. (Balneaves 1999; Henderson
2004; Munstedt 1996; Navo 2004; Ponholzer 2003; Richardson 2000;
Richardson 2002; Sparber 2000; Verhoef 1999; Verhoeff 2010; Hilsden 1999;
White 2002). Expectations for CAM are quite high with patients expecting
CAM to improve their quality of life, alleviate symptoms, prolong life and cure
their disease. Those with incurable diseases, particularly value CAM for its
medicinal potential (Richardson 2000; Ernst 1998; Eisenberg 1998; Kaptchuk
1998).
Health professionals in general do express positive views when CAM is used
complementarily and not as an alternative. Results so far published have
40 | P a g e
shown that CAM can play a role in improving the quality of life and general
well-being (Adams 2004; Adams 2011). CAM modalities are also involved in
supportive care (Leis 2007). In recent years, naturally occurring compounds
present in diet and beverages, known as nutraceuticals, have gained
considerable attention because of their beneficial effects on health as cancer
chemopreventive or cardioprotective agents. Nutraceuticals play an important
role, in CAM, as a source of effective anti-cancer agents currently over 62% of
currently used anti-cancer agents are derived in one way or another from
natural sources (Gonzales 2006), including phytochemicals
1.13 Phytochemicals and Cancer
Phytochemicals are nutraceuticals which derive from plants products.
Successful studies are being conducted in vitro to show a wide range of
antioxidant phytochemicals, (including flavonoids, polyphenols and
carotenoids) are radioprotective in experimental systems (Paul 2010; Weiss
2003; Borek 2001). Some phytochemicals induce apoptosis in cancer cells
(Banjerdpongchai 2016; Mehdinezhad 2016) such as, including prostate
cancer cells and breast cancer cells (Pinto 2001), colon cancer cells (Zheng.
2003) and ovarian cancer (Zhang 2016). Additional research is needed to
establish the role of phytochemicals in conjunction with cancer treatment by
radiation as antioxidant supplementation during radiation therapy may protect
cancer cells, in conjunction to normal cells, and reduce the efficacy of
treatment (Borek 2004).
There are also reasons for thinking that some herbal supplements might
biochemically interfere with chemotherapy as well as radiation treatments,
(Labriola 1999) alter treatment compliance (Durant 1998). Patients taking
chemotherapeutic drugs and CAM are at least 27% at risk of developing
clinically relevant CAM–drug interactions (Welder 2006). As such health
professionals are reluctant to recommend CAM. An increasing number of
CAM practitioners, though, aid understanding and knowledge of any drug
interactions between CAM and conventional therapies.

41 | P a g e
1.13.1 Flavonoids
Flavonoids are commonly found in foodstuffs including vegetables, fruit, nuts,
seeds, wine and tea, and it is estimated that the daily intake in the western diet
ranges from 200mg/day to 1gram (Hertog 1995; Pierpoint 1990).
The basic structure comprises two benzene rings linked by heterocyclic pyran or
pyrone ring in the middle. These agents display many therapeutic properties
including anti-inflammatory, antioxidant, antiviral, and anticarcinogenic activity.
Certain flavonoids have been found to exhibit anti-proliferative properties against
some cancers and are known to cross the BBB (Zbarsky 2005; Datla 2001).
1.14 CAM: A Thearpy for Gliomas
1.14.1 CAM in clinical trials
The rising use of CAM has also had an impact on the number of clinical trials
performed. Clinical studies can provide CAM modalities the necessary scientific
accreditation for use as therapies. Table 5 summaries the limited clinical trials
currently being performed in brain related therapies.
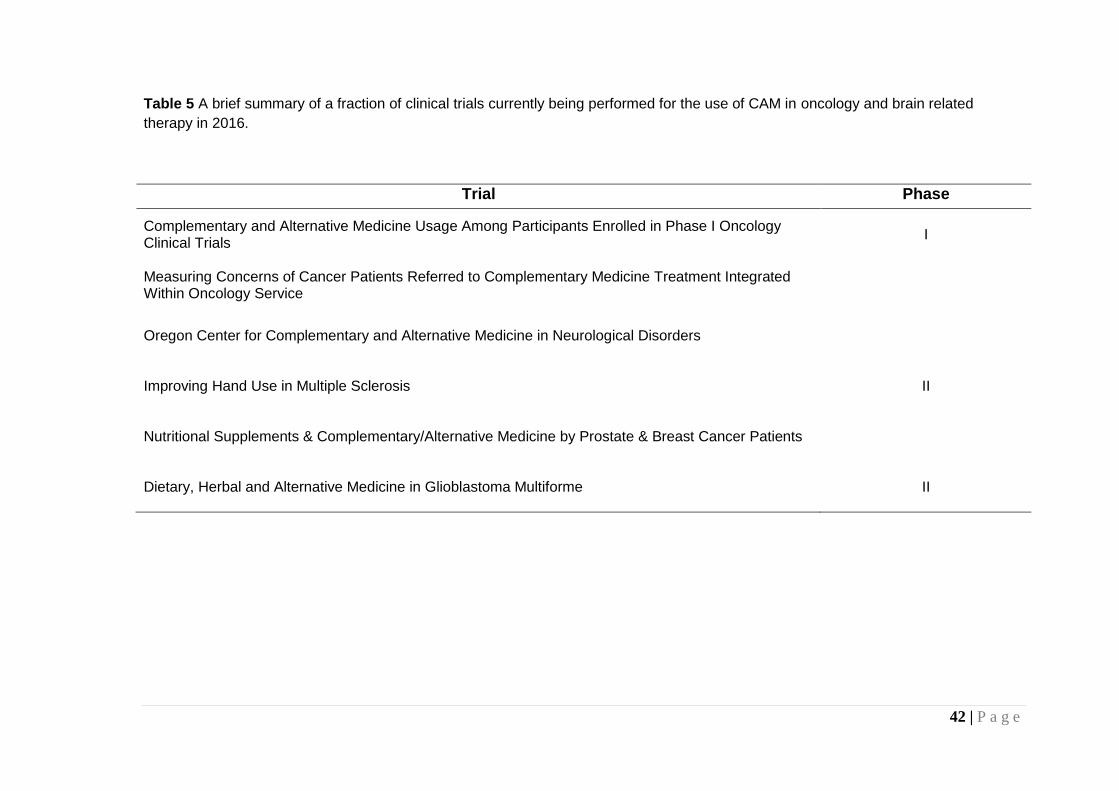
42 | P a g e
Table 5 A brief summary of a fraction of clinical trials currently being performed for the use of CAM in oncology and brain related
therapy in 2016.
Trial Phase
Complementary and Alternative Medicine Usage Among Participants Enrolled in Phase I Oncology Clinical Trials
I
Measuring Concerns of Cancer Patients Referred to Complementary Medicine Treatment Integrated Within Oncology Service
Oregon Center for Complementary and Alternative Medicine in Neurological Disorders
Improving Hand Use in Multiple Sclerosis II
Nutritional Supplements & Complementary/Alternative Medicine by Prostate & Breast Cancer Patients
Dietary, Herbal and Alternative Medicine in Glioblastoma Multiforme II
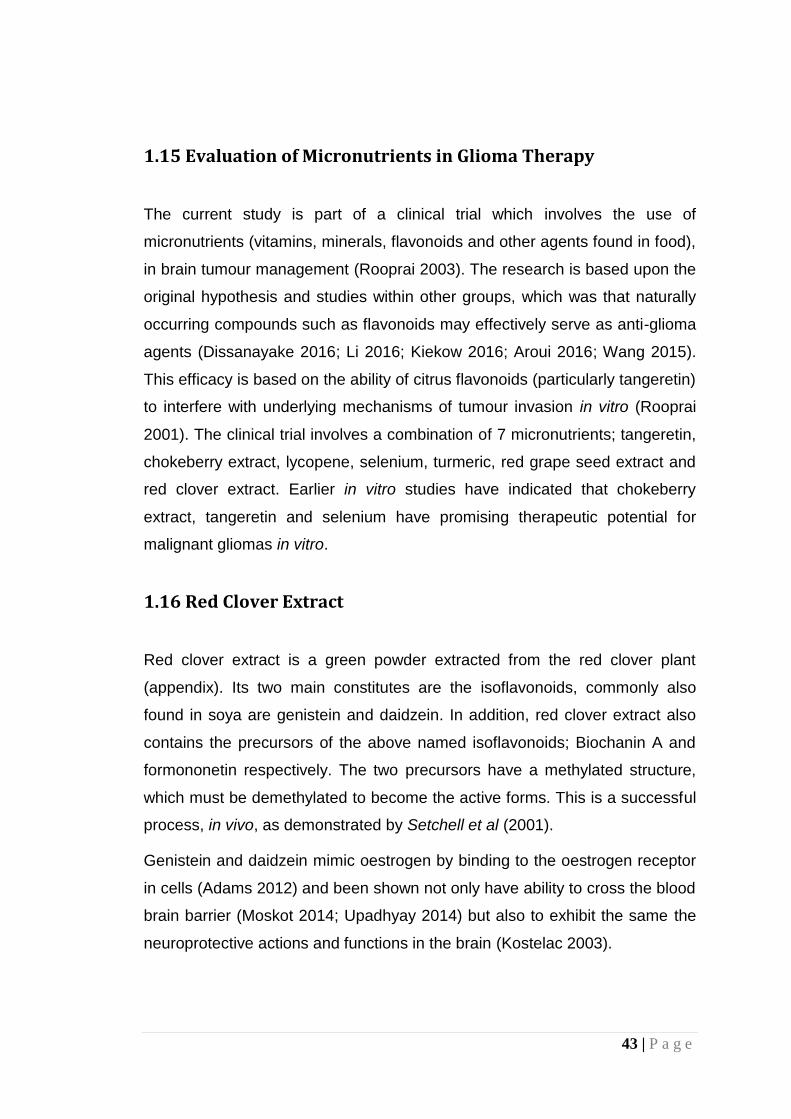
43 | P a g e
1.15 Evaluation of Micronutrients in Glioma Therapy
The current study is part of a clinical trial which involves the use of
micronutrients (vitamins, minerals, flavonoids and other agents found in food),
in brain tumour management (Rooprai 2003). The research is based upon the
original hypothesis and studies within other groups, which was that naturally
occurring compounds such as flavonoids may effectively serve as anti-glioma
agents (Dissanayake 2016; Li 2016; Kiekow 2016; Aroui 2016; Wang 2015).
This efficacy is based on the ability of citrus flavonoids (particularly tangeretin)
to interfere with underlying mechanisms of tumour invasion in vitro (Rooprai
2001). The clinical trial involves a combination of 7 micronutrients; tangeretin,
chokeberry extract, lycopene, selenium, turmeric, red grape seed extract and
red clover extract. Earlier in vitro studies have indicated that chokeberry
extract, tangeretin and selenium have promising therapeutic potential for
malignant gliomas in vitro.
1.16 Red Clover Extract
Red clover extract is a green powder extracted from the red clover plant
(appendix). Its two main constitutes are the isoflavonoids, commonly also
found in soya are genistein and daidzein. In addition, red clover extract also
contains the precursors of the above named isoflavonoids; Biochanin A and
formononetin respectively. The two precursors have a methylated structure,
which must be demethylated to become the active forms. This is a successful
process, in vivo, as demonstrated by Setchell et al (2001).
Genistein and daidzein mimic oestrogen by binding to the oestrogen receptor
in cells (Adams 2012) and been shown not only have ability to cross the blood
brain barrier (Moskot 2014; Upadhyay 2014) but also to exhibit the same the
neuroprotective actions and functions in the brain (Kostelac 2003).

44 | P a g e
Figure 6 The isoflavonoids of Red Clover Extract. Genistein and Daidzein are the
active components and Formononetin and Biochainin A are their respective
precursors.
In addition to affecting the pathways effected by activation of the oestrogen
recepetor, genistein in particular, has been shown to inhibit the nuclear
protein topoisomerase II (Okura 1988), platelet-activating factor- and
epidermal growth factor-induced expression of c-fos (Tripathi 1992),
diacylglycerol synthesis (Akiyama 1987), and tyrosine kinases (Dean 1989).
Additionally, it inhibits microsomal lipid peroxidation (Jha 1985) and
angiogenesis (Fotsis 1993).
1.16.1 Red Clover Extract and Cancer
Due to the isoflavonoids being structurally related to oestrogenic steroids and
thus having the ability to mimic oestrogen and bind to its receptor sites, this
provide the rationale for lower rates of hormone related cancers such as

45 | P a g e
breast, prostate and ovarian cancers(Zhao 2016; Marcela 2016; Yang 2016;
Kang 2016; Wang 2015)..
The active isofalonioids found in red clover extract have also been shown in a
vast number of studies to inhibit a number of non-hormone dependent
cancers including leukaemia (Zhang 2012), liver cancer (Zhou 2016), lung
cancer (Yang 2016) and stomach cancer (Huang 2014).
Kang et al (2016), demonstrated that the consumution of genistein, through
soy milk, decreased the proliferation of human prostate cancer cells by
regulating p21 (component of cell cycle regulation). Other studies like Shen et
al (2000) also found that genistein was also anti-proliferative in prostate
cancer. The study found the cells became arrested in the G1 phase of the cell
cycle thus ceasing proliferation, however unlike in breast cancer; it did not
promote a pro-apoptotic effect in prostate cancer.
Similar effects on cancer cell proliferation have also been noted in non-
hormone related cancers in humans such as osteosarcomas (Hu 2015), lung
cancer (Liu 2015), pancreatic cancer (Han 2012) and colon cancer (Yoo
2015).
In a 2008 study, Li et al (2008) illustrated that genistein inhibits cell
proliferation and promotes apoptosis via the intrinsic pathway in breast
cancer. An earlier study carried out in 2003 by Gong et al. noted a similar
finding. A study analyzing testicular cancer cells demonstrated an enhanced
expression of caspase 8, caspase 3 and PARP, suggesting genistein
exhibited a pro-apoptotic effect on these cells (Al-Maghrebi 2016). Laryngeal
cancer cell lines have also exhibited pro-apoptotic effects when treated with
genistein (Du 2016).
Fortunately, in 2008, Zhang et al, found that genistein was anti-invasive, on
prostate cancer. Genistein has also been found to induce apoptosis via the
extrinsic pathway in ovarian cancer cells (Thasni 2008).

46 | P a g e
As the effects of the isoflavonoids, found in RCE, have been increasingly
positive when looking the anti-invasive and pro-apoptotic properties in other
cancers, though few studies have been carried out on the effects of genistein
or daidzein on brain tumours and no studies have been performed on the
effect of red clover extract on brain tumours this warrants further investigation.
1.17 Red Grape Seed Extract
Red grape seed extract is a red powder (appendix) containing a number of
active flavonoids including catechins, epicatechins and epicatechin (-3-0-)
gallate or collectively polyphenols (Polyphenolics.com). In vivo these
flavonoids exist as monomers, dimmers and/or oligomers. They are active in
conjunction with one another rather than as separate entities i.e. in oligomeric
form.
Polyphenols are important components of dietary agents that have been
demonstrated by epidemiological, preclinical, and clinical studies to have
various health promoting benefits, including neuroprotective (Malhotra 2016),
cardioprotective (Zhang 2015), and chemopreventive effects. These regulate
various cellular processes, such as cell proliferation, cell cycle, cell survival,
and apoptosis that have been implicated in cancer prevention and treatment.
1.17.1 Red Grape Seed Extract and Cancer
Its active ingredients, oligomeric proantho-cyanidins (OPCs) are known to be
anti-angiogenic (Boik 2001) and have also been shown to inhibit growth of
cancerous cells.
Eng et al (2003) suggested the use of RGSE as a chemo protective agent for
breast cancer as it arrests the cells in the G1 phase of the cell cycle. Similarly
prostate cancer also undergoes a block in tumour cell growth when treated

47 | P a g e
with RGSE (Singh 2003). Yao et al (2016) analyzed the effect of proantho-
cyanidins in nasopharyngeal carcinoma. This study found not only a reduction
in the viability of cells but also the induction of cell cycle arrest at the G2/M
phase causing apoptosis. Furthermore, upon examination of the mechanism
of apoptosis they noted a increased expression of the pro-apoptotic protein
Bax, cleaved caspase-3 and cleaved poly(ADP-ribose) polymerase (PRAP)
protein, along with a decrease expression of the anti-apoptotic proteins Bcl-2
and Bcl-xL. Other examples of studies with demonstrate the increase in
apoptotic potential following treatment with either grape seed extract or
proantho-cyanidins (Zhou 2016; Kumar 2015; Chen 2014;Parsad 2012)
illustrated similar mechanisms of action in other cancer types.
In 2004 Singh et al also found that grape seed extract induced apoptosis and
reduced angiogenesis in prostate cancer cell. Much like Singh et al, Zheng et
al (2015) demonstrated a reduction in angiogenesis following rtreatement with
an OPC. They looked at human astrocytoma cells and human hepatoma cells
following treatment with oligomer procyanidins (F2), a fraction extracted from
grape seeds. They noted that EGFR-PI3K-AKT-mTOR and MAPK-ERK1/2
pathways were inactivated and vascular endothelial growth factor (VEGF) and
matrix metalloproteinases (MMP)-2 expressions were supressed, ultimately
reducing the presence of angiogenesis. Other studies also demonstrated a
reduction in the expression of VEGF and MMPs (Stagos 2015; Kanavi 2014;
Kuroyanagi 2014).
Metastatic cancers, when treated with a form of grape seed extract also tend
to have similar outcomes; anti-proliferative effects and pro-apoptotic effects
(Rivera 2016; Martinez 2005).
Much like RCE, although components of grape seeds have been reviewed for
their effects on brain tumours, RGSE has not yet been investigated for its anti-
glioma effects. As grape seed extracts and their components have anti-cancer
effects RGSE warrants investigation into it’s anti-glioma effects. Preliminary
studies have indicated that this extract has got anti-invasive potential in brain
tumours (Rooprai et al. personal communication).
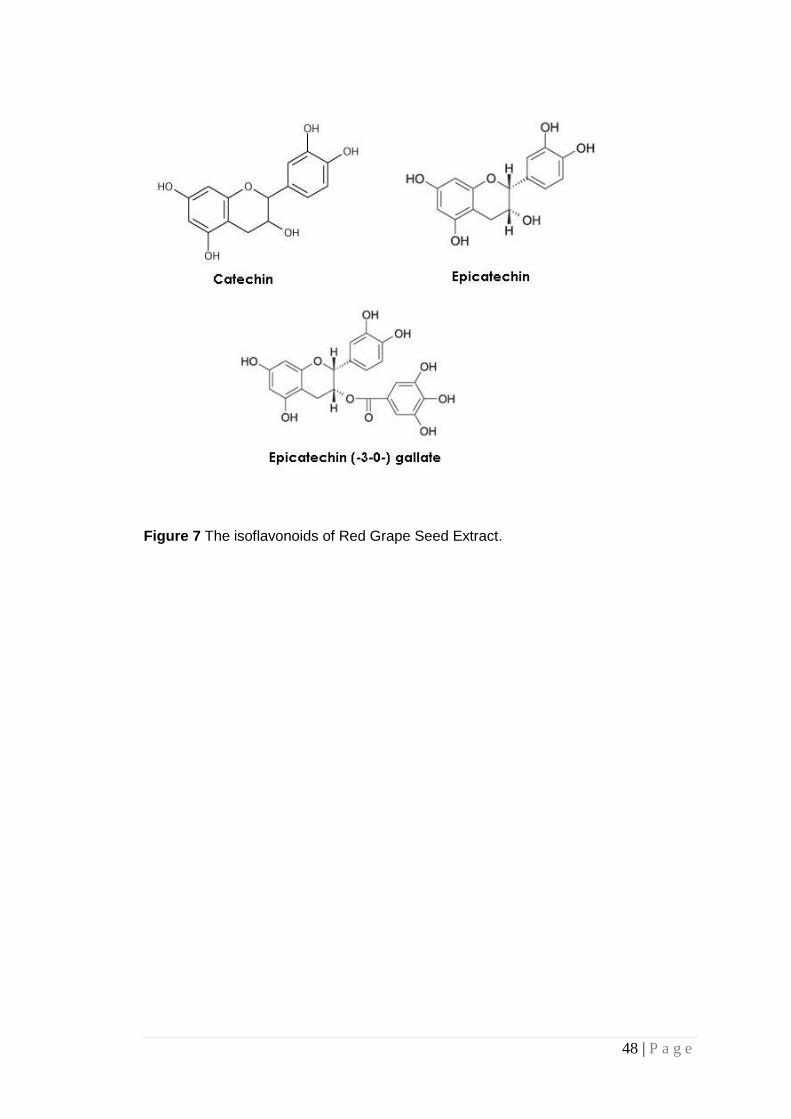
48 | P a g e
Figure 7 The isoflavonoids of Red Grape Seed Extract.
49 | P a g e
1.18 Aims
The current study is part of a clinical trial which involves the use of
micronutrients (vitamins, minerals, flavonoids and other agents found in food),
in brain tumour management (Rooprai 2003). The research is based upon the
original hypothesis which was that naturally occurring compounds such as
flavonoids may effectively serve as anti-glioma agents. This efficacy is based
on the ability of citrus flavonoids (particularly tangeretin) to interfere with
underlying mechanisms of tumour invasion in vitro (Rooprai 2001). The
clinical trial involves a combination of 7 micronutrients; tangeretin, chokeberry
extract, lycopene, selenium, turmeric, red grape seed extract and red clover
extract. Earlier in vitro studies have indicated that chokeberry extract,
tangeretin and selenium have promising therapeutic potential for malignant
gliomas in vitro (Personal communication; Rooprai 2001).
The aims of the proposal are to evaluate the anti-invasive, pro-apoptotic and
anti-angiogenic potential of red clover extract and red grape seed extract on a
number of biopsy-derived GBs by answering the following questions;
At what concentration is the viability of the cells affected?
Do the micronutrients affect cell invasion?
Is the expression of cell adhesion molecules impacted by the
micronutrients?
Do the micronutrients affect apoptosis?
Can changes in microenvironment affect antigenic expression?
Do the micronutrients affect angiogenesis?

50 | P a g e
1.19 An Overview of the Thesis
Chapter 2 outlines the methods used as part of this study to address the
research questions set out. Chapter 3 is a small study undertaken to
determine if changing the microenvironment, in which the cells are cultured,
changes the phenotypic properties of glioma cells. The phenotypic changes of
these cells were determined by investigating their antigenic expression.
Results of experimentation are highlighted in chapter 4 and are discussed in
chapter 5. Following this are the references and appendicies.

51 | P a g e
CHAPTER 2: Materials and Methods
2.1 Source of Cell Cultures
Specimens provided from the Neurosurgical staff at King’s College Hospital,
London, obtained from epileptic patients at temporal lobectomy, served as
normal astrocytic cultures and four biopsy-derived malignant cell lines at low
passages were also studied. Ethical approval for this study has been granted
by King’s; LREC protocols 02-056 (Do flavonoids cross the human Blood
brain barrier) and 00-173 (Brain tumour invasion: in vitro studies). Table 6
summaries all the biopsy cultures used as part of this study.
Table 6 Four biopsy-derived malignant cell lines and 1 normal astrocytic culture
Cell line Sex of Patient Passage number
Biopsy grade
MUAB-C F 4-6 Normal astrocytic cell line
MUMG-GM M 4-6 Grade IV GBM
MUTC-GM M 5-7 Grade IV GBM
MUIH-GM M 4-6 Grade IV GBM
MUPK-GM M 3-5 Grade IV GBM
Biopsies provided by staff at King’s College Hospital. Following initial culture, these cultures
were investigated at low passage.
Human umbilical vein endothelial cells (HUVECs), used as part of
angiogenesis assays, were provided by Dr Alan Cooper, University of
Portsmouth. The passage of these cells is unknown, though experimentation
was carried out after 3-5 passages. Existing cultures of IPSB-18 (P26-30), for
all other studies were provided by Dr Timothy van Meter, Virginia
Commonwealth University, though were originally cultured from biopsy by
other members of the neuro-oncology group. Cell lines employed for micro-
environment studies were provided by collaborators in Ireland and Norway.
52 | P a g e
2.2 Micronutrients
The red clover extract (RCE), donated by Linnea, in Switzerland is a green
coloured powder constituting a mixture of four isoflavones of which
Formononetin and Biochanin A are precursors of Genistein and Daidzien,
respectively. Linnea performed HPLC yielding a total quantity of isoflavones
found in the extract, to be 40.4%, specifically 17.8% biochanin A, 22.1%
formononetin, 0.4% genistein and 0.1% daidzein (appendix).
The red grape seed extract (RGSE) supplied by Polyphenolics, USA is a fine
red/brown coloured powder. The main constituents of the red grape seed
extract are; catechin, epicatechin and epicatehin (-3-0-) gallate, of which 10%
(min) are monomers, 60-80% oligomers and 25% (max) polymers as
illustrated by HPLC analysis by Polyphenolics (appendix). These individual
constituents undergo condensation reactions thus elongating to form
oligomeric proanthocyanidins (personal communication)
Initially the micronutrients were dissolved in Dimethyl sulfoxide (DMSO –
Acros Organics 414885000) (100mg/ml), and filtered. Though further dilutions
employed Dulbecco’s modified Eagle’s medium without phenol red (clear
DMEM – GIBCO 31053-028). A working solution of 1mg/ml was prepared,
from which subsequent dilutions were formulated. At a later date it was
discovered that the DMSO had a direct effect on the cells, resulting in
anomulus results. Subsequent adaptation of the methodology meant the
micronutrients were dissolved in clear DMEM instead, before being filtered
and diluting further.

53 | P a g e
2.3 Cell Culture techniques
2.3.1 Setting up Primary Human Astrocytic Culture
Upon resection the neurosurgeon immediately placed the biopsy into DMEM
supplemented with 1% antibiotic/antimycotic solution and then treated as
Freshney et al. (2006, p 5; 2005) describe in the protocol for setting up a
primary explants culture. The tissue was rinsed in Hanks balanced salt
solution (HBSS – GIBCO 14170070) in a petri dish and unwanted tissue, such
as blood vessels or necrotic areas were dissected and removed. Remaining
tissue was finely chopped with scalpels into pieces, approximately < 1mm3.
This was diluted in DMEM supplemented with 10% heat-inactivated foetal calf
serum (FCS) and 1% antibiotic/antimycotic solution (complete medium). The
mixture was transferred to culture flasks, which were placed in the incubator
at 37oC and 5% CO2. The cultures were maintained for 1-2months (dependent
upon the individual cultures) to achieve confluence.
2.3.2 Maintenance of Glioblastoma and Astrocytic Cultures
The astrocytic cultures were routinely cultured as monolayers at physiological
pH by equilibration with 5% CO2 in air in a standard humidified incubator at
37oC, in either 25cm2 or 75cm2 culture flasks using complete media;
constituting 10% foetal calf serum (FCS – Sigma F-7524), unless stated
otherwise and 1% antibiotic/antimycotic solution (penicillin/ streptomycin –
GIBCO 15240-062) in Dulbecco’s modified Eagle’s medium (DMEM – GIBCO
61965-026), unless otherwise stated. Prior to use the FCS was heat
inactivated a procedure which involves immersing the serum into a 60oC
waterbath for five minutes, to inactivate the complement. The medium was
changed whenever it was required, usually between 3-4 days, dependent
upon the culture. Once confluent cells were passaged or harvested for
experimentation.

54 | P a g e
Cells involved in the evaluation of microenvironment changes (chapter 3)
were cultured for 48hr in complete medium supplemented with 10% FCS,
newborn calf serum (NCS – Biowest S0450) or human serum (HS – Biowest
S4190), as required.
Cultures involved with all other experiments were treated with the
micronutrients 48hrs prior to experimentation unless stated otherwise.
2.3.3 Maintenance of HUVEC Cultures
HUVEC cultures were maintained in a similar manner to the astrocytic
cultures with the exception of the media used. Prior to culture the 25 mm2
flasks were coated in 1% gelatin for 1 hour and the excess removed the cells
were then seeded in a media specific to HUVEC cells; large vessel
endothelial cell basal medium (TCS cellworks) constitutes 10% foetal calf
serum, 0.1% antibiotic supplement (Gentamicin/Amphotericin), and 0.1% of
each of the following beta fibroblast growth factor (bFGF), epidermal growth
factor (EGF) and hydrocortisone.
2.3.4 Mycoplasma Testing
Mycoplasma staining is important in the use of cell culture, as contamination
of cultures is unaffected by ordinary antibiotics (Hay 1989; Harlin 2008). The
procedure was followed in accordance to the instructions of the mycoplasma
kit (GIBCO M7006).
55 | P a g e
2.4 Cell Viability Techniques
2.4.1 Phase Contrast Microscopy
Phase contrast microscopy is a technique to obtain micrographs of the
morphology of the cells. Briefly cultures were maintained to around 80%
confluence upon which they were examined under a phase contrast
microscope. Micrographs were also taken after treatment of flasks with
concentrations of the micronutrients to observe any cell death, if any, and to
what extent angiogenesis occurred during experiments involving HUVEC
cultures.
2.4.2 Population Doubling Time
Population doubling time (PDT) is important to measure, to determine whether
any abnormalities in growth periods occur at any point during
experimentation. For example as mycoplasma contamination is undetectable
to the naked eye, contamination may be detected indirectly via the culture
growth patterns.
To calculate the population doubling time, the cells were harvested and
counted, in order that a population of 100,000 cells could be seeded into a 6
well plate. Cell count was achieved using the trypan blue method. Cells were
initially harvested and resuspended in 1ml of complete media, from which
20l was combined with 20l of trypan blue stain. 20l of this were then
placed on a haemocytometer. Live cells, those that were not stained blue,
were counted in the central square. Both chambers of the haemocytometer
were counted and the cell count deduced by inserting the two counts ( and
β) into the below equation:
Number of cells/ml = ( + β) x 2 x 10,000
2

56 | P a g e
Each cultured well was counted at timed intervals and the total number of
cells, plotted against time.
The lag phase of this curve may be due to a period of adaptation to the in vitro
environment thus there are only a few cells present. As the cells enter the log
phase they begin to replicate and grow. It is from this region of the graph that
we may calculate population doubling time. The plateau phase represents
depletion in environmental conditions such as space and nutrients and
therefore the number of cells begin to settle and die.
2.4.3 MTT cytotoxicity assay
Figure 8 MTT structure which reacts with active mitochondrial proteins to form a
soluble blue/purple salt which may be dissolved.
MTT, a quantitative, colorimetric assay for mammalian cell survival and
proliferation, is a tetrazolium salt, which is converted from yellow and soluble

57 | P a g e
to a blue/purple, insoluble formazan salt, by the succinate-tetrazolium system
active only in viable cells. This insoluble compound is unable to be measured
by normal absorbance methods; therefore it must be solubilised using DMSO.
The intensity of the colour change indicates the enzymatic activity of viable
cells. Optimized for glioma cells this protocol is based on the experiment
described by Nikkah et al (1992) and adapted due to apparent biphasic
results.
Cell were harvested and plated in 96 microtitre plates in clear complete
medium, as the phenol red may interfere with the final reading. They were
plated at a density of 10,000 cells per plate in 200µl clear complete medium.
Cells were left overnight to adhere after which the medium was replaced with
fresh medium (without foetal calf serum) containing a range of concentrations
of the micronutrients dissolved in clear DMEM (initially DMSO) and incubated
for 48hr at 37oC and 5% CO2. To ensure consitancy between experimentation
and indication of inconsistencies, a positive and negative control were
concurrently observed in each plate.
Subsequent to incubation the media was replaced with 100 µl MTT solution
(1mg/ml) for 4 hours after which it was discarded and the formazan crystals
dissolved in 200 l DMSO. The solution was gently pipetted up and down to
attain homogeneity and then placed in an incubator at 37°C for 5 minutes to
let the air bubbles that may have been generated disappear. Absorbance was
measured at 570 nm on a FLUOstar Optima plate reader.
2.5 Charcterisation of Astrocytic Cell Cultures
2.5.1 Analysis of Antigenic Expression Using Flow Cytometry
This semi-quantitative method characterises the antigenic expression of cells
using fluorescently labelled antibodies. This procedure will allow for the
comparison of untreated tumour cells against either untreated normal

58 | P a g e
astrocytes or tumour cells treated with micronutrients. Once confluent the
cells were harvested from flasks using tryple express (trypsin) for 10min. The
cells were then neutralised and washed with phosphate buffer solution (PBS)
supplemented with 5% FCS. All washes were performed using PBS
supplemented with 5% FCS and then centrifuged for 5 mins at 1000rpm. The
cells were resuspended in 200l of for 10 mins the appropriate primary
antibody (Table 7) washed and resuspended in the appropriate secondary
streptavidin fluorescein (FITC); for example, if the host species was mouse
the secondary adopted would be anti-mouse.
Table 7 Primary antibodies were used to characterise cell cultures. An illustration of
the dilutions used and the host species the antibody was cultured in.
Antibody Dilution Host species Monoclonal or Polyclonal Source
GFAP Neat Mouse Monoclonal CRUK
CD44 1:100 Mouse Monoclonal CRUK
1 Neat Mouse Monoclonal CRUK
V Neat Mouse Monoclonal CRUK
NCAM 1.1000 Mouse Monoclonal Abcam
The cells were then washed and resuspended in PBS (2% FCS). Prior to
analysis 5l of propidium iodide (PI) was added and analysis was performed
using a FACs Calibur against a suitable control.
2.5.2 Immunocytochemistry
Complementing flow cytometry, this qualitative method of characterisation will
allow for the detection of the antigens GFAP, CD44, 1, v, and Eric-1
(NCAM) using the biotin streptavidin FITC protocol. Cells were harvested and
resuspended in either complete medium or various concentrations of the
micronutrient, onto 24x24 mm glass coverslips, previously autoclaved, and

59 | P a g e
placed inside 35mm sterile plastic petri dishes. These were then incubated for
48hrs. The cells were then rinsed in PBS and incubated for one hour with the
primary antibody at the appropriate dilution (Table 8).
Table 8 Primary antibodies used to characterise cell cultures. An illustration of the
dilutions used and the host species the antibody was cultured in.
Antibody Dilution Host species Monoclonal or
Polyclonal
Source
GFAP Neat Mouse Monoclonal CRUK/Abcam
CD44 1:100 Mouse Monoclonal CRUK/Abcam
1 Neat Mouse Monoclonal CRUK
V Neat Mouse Monoclonal CRUK
NCAM 1.1000 Mouse Monoclonal Abcam
Coverslips were washed three times in PBS and incubated with biotinylated
secondary antibody specific to the host species of the primary antibody
(DAKO monoclonal (anti-mouse) - F0313 polyclonal (anti-rabbit) - E0354) for
30 mins. Consequently the coverslips were washed in HBSS and incubated in
the dark with fluorescein-streptavidin conjugate (FITC). The cells were
washed, again, three times and fixed with acid alcohol (1ml concentrated HCl
in 90 ml of 70% ethanol) for two mins after which they were rinsed three times
in HBSS or until discolouration of the phenol red indicator ceases. It is
important to remember, for internal antigen detection such as GFAP fixation
occurs prior to incubation with primary antibody. Counterstaining with
propidium iodide (PI) followed for 10 sec, only, then immediately flushed with
HBSS. The coverslips were rinsed in HBSS and then mounted on to glass
slides in Citiflour anti-fadent.
2.6 Invasion Assays
2.6.1 2-dimesional Invasion Assay using Boyden Chambers

60 | P a g e
Boyden or Transwell TM chambers measure the ability of the cells to invade
the surrounding matrix. Prior to performing the invasion assay, cells were
required to be gradually weaned down to serum free media as abruptly
depriving cells of serum is not always well received by many cell types. To
achieve this, cells were first cultured in the presence of 10% FCS and 1%
antibiotic for approximately 24hrs or until the cells were sub-confluent, after
which, the medium was replaced with complete media supplemented with 5%
FCS and antibiotic and incubated for a further 24 hrs. Subsequent to this
incubation the serum supplemented media was once again decreased this
time to 2.5% FCS for 24 hrs. Finally the media was replaced after 24hrs with
serum free media.
Four hours prior to seeding, the chamber is coated in 100l of ECM
component proteins routinely human placental collagen type IV (10g/ml.
Sigma no. C5533). The polycarbonate filter divides the well into an upper and
lower compartment, the cells are seeded on the upper surface of the filter in
serum-free medium and the lower chamber is filled with complete medium, a
chemo attractant. Upon incubation at 37oC for 48hrs the cells were washed
and stained with a crystal violet stain diluted 1:100. The cells were then
counted in both the upper and lower chambers and the percentage invasion is
calculated using the equation below;
Percent invasion = mean cells in the lower compartment x 100
mean total cell number
2.7 Detection of Apoptosis
2.7.1 Annexin V Assay
Cells were plated in 25 cm2 tissue culture flasks at 1 × 10⁵ cells per flask,
incubated overnight, and treated with micronutrients or DMSO control for
48hr. Subsequent to incubation, media from the flasks wasa collected as they
could contain dead or dying cells that had detached from the flasks. Adherent
61 | P a g e
cells were harvested and added to the respective media. Cells, at a
concentration of 1 × 10⁵ cells per 100 μl, were washed with ice cold
phosphate-buffered saline and resuspended in binding buffer (140 mM NaCl,
10 mM HEPES, 2.5 mM CaCl, pH 7.4) and stained using annexin V-FITC
followed by incubation at room temperature in the dark 15 min. Before
analysis a few drops of PI was added and measured by flow cytometry on a
Beckman Coulter Epics XL-MCL Flow Cytometer within one hour of annexin
V/PI staining. A minimum of 10,000 events was collected for each sample.
2.7.2 TUNEL Assay
The terminal deoxynucleotidyl transferase–mediated dUTP nick end labeling
(TUNEL) assay was performed in order to detect apoptotic cells to confirm
annexin V results. Beyond treatment of cells with the micronutrients, the cells
were fixed in 4% paraformaldehyde for 10 min. TUNEL staining for detection
of apoptotic cells was done using the TUNEL Apoptotic Detection kit
(Promega) as per the manufacturer's instructions. Briefly, the fixed cells were
washed in PBS and then incubated with 0.2% Triton x 100 in PBS for 5 min at
room temperature. After washing the cells were then incubated in 50 µL of
terminal deoxynucleotidyl transferase end-labeling cocktail with FITC for 60
min in the dark at room temperature. The reaction was terminated, with 2%
SSC solution for 15min and washed in PBS. The cells were then mounted
with antifading DAPI mount (Vecter Labs). Slides were allowed to dry in the
dark, observed under a fluorescent microscope.
2.8 Detection of Angiogenesis
2.8.1 Tubule formation assay
HUVEC cells were cultured in the presence of the IC50 of the micronutrients or
in complete media in 24 well plates coated in 1% gelatine. These were then
incubated for 48hrs. Assessment of tubule formation involved fixing the cell
preparation in 70% ethanol at 4°C for 15 min, rinsing in PBS, and staining with
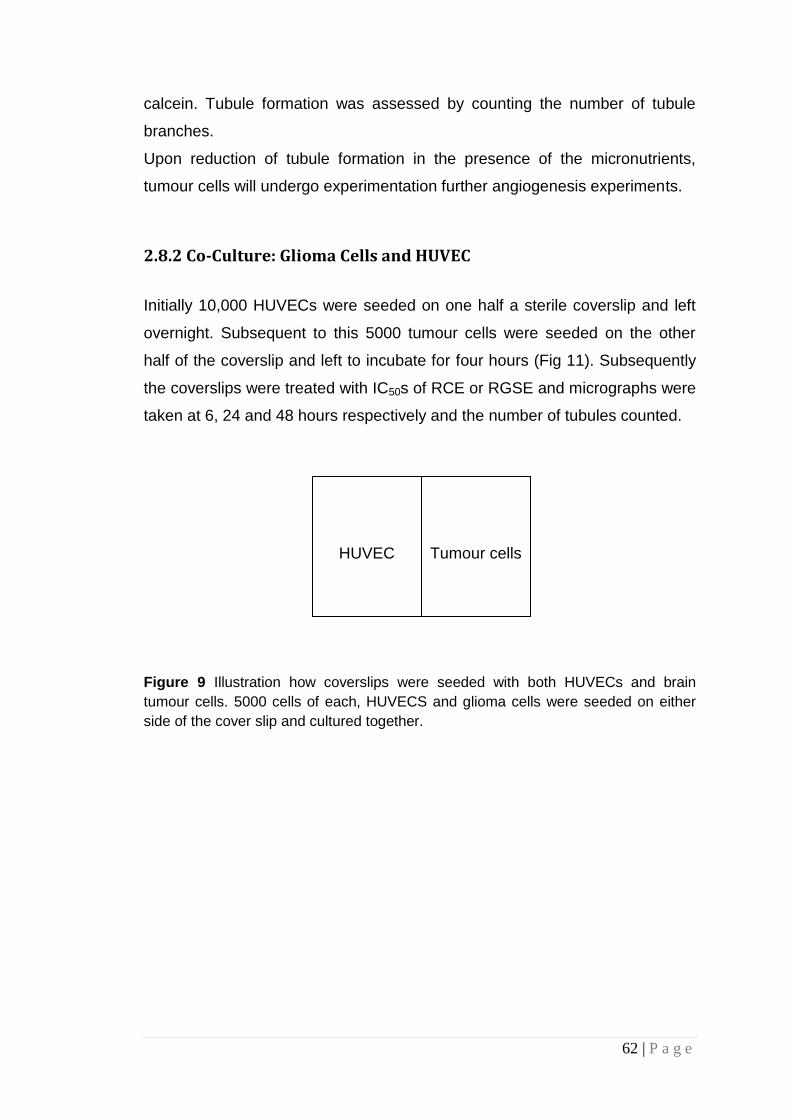
62 | P a g e
calcein. Tubule formation was assessed by counting the number of tubule
branches.
Upon reduction of tubule formation in the presence of the micronutrients,
tumour cells will undergo experimentation further angiogenesis experiments.
2.8.2 Co-Culture: Glioma Cells and HUVEC
Initially 10,000 HUVECs were seeded on one half a sterile coverslip and left
overnight. Subsequent to this 5000 tumour cells were seeded on the other
half of the coverslip and left to incubate for four hours (Fig 11). Subsequently
the coverslips were treated with IC50s of RCE or RGSE and micrographs were
taken at 6, 24 and 48 hours respectively and the number of tubules counted.
HUVEC Tumour cells
Figure 9 Illustration how coverslips were seeded with both HUVECs and brain
tumour cells. 5000 cells of each, HUVECS and glioma cells were seeded on either
side of the cover slip and cultured together.

63 | P a g e
2.9 Statistics
All studies analysed were performed in triplicate with the average of three
experiments being statistically analysed as required. In particular statistical
analyses were carried out on the MTT results using Stats direct software, to
determine the mean and standard deviation. Any outliers, outside three
standard deviations, were excluded.
Analysis on the flow cytochemical data was examined using ANOVA analysis.

64 | P a g e
CHAPTER 3: Microenvironmental
Changes of Growth Sera
Preliminary investigations into the effects of microenvironmental changes, of
growth sera, on astrocytic cultures were performed. This was achieved
through the evaluation of antigenic expression, commonly associated with
gliomas.
3.1 Introduction
Heterogeneity is regarded as a prominent feature of gliomas due to the
divergent processes of differentiation and anaplasia giving rise to a mixture of
different cellular appearances. It is likely that this phenomenon may give rise
to differing degrees of malignancy being manifest in different regions of the
same tumour. The cellular heterogeneity seen histologically is, to some
extent, retained in vitro during early passages. Histological recognition in vitro
generally includes the expression of common differentiation markers such as
glial fibrillary acidic protein (GFAP) for astrocytes and galactocerobroside (Gal
C) for oligodendrocytes. Indeed glioblastoma (GB) is generally believed to
arise from cells of astrocytic lineage, although oligodendroglial or progenitor
cell derivation is also possible (Pilkigton 2001). It has also been proposed that
a rare sub-population of cells within the tumour mass has the ability to self re-
new, differentiate and sustain tumour growth (Bruce 1963).
Recent studies have shown that individual cells within these tumors are
capable of giving rise to cells of multiple lineages (Hemmati 2003; Ignatova
2002; Kukekov 1997). This could be explained by cells undergoing trans-
differentiation; manipulation of tissue-specific stem cells into tissue specific
cells that they would not normally develop into (Fan 2007) for example

65 | P a g e
hematopoietic stem cells giving rise to neural cells or neural stem cells giving
rise to blood cells (Mezey 2000; Bjornson 1999). Another example of this was
seen when dorsal domains of the spinal cord and telencephalon, which were
thought to give rise to astrocytes, were also found to produce
oligodendrocytes (Kessaris 2006; Richardson 2006; Cai 2005; Fogarty 2005;
Vallstedt 2005). One study reported that glia that express NG2, which have
been shown previously to be progenitor cells for glia during development, in
the adult mouse are capable of producing both oligodendrocytes and
protoplasmic astrocytes in vivo (Zhu 2012). However, two independent
studies found that adult NG2-positive glia gave rise to oligodendrocytes and
neurons, but not astrocytes, in vivo (Rivers 2008; Menn 2006). Despite
controversy, positive evidence surrounds the study of manipulation of tissue-
specific stem cells into tissue specific cells that they would not develop into
(Fan 2007).
A similar phenomenon was reported in earlier studies by Raff et al. (1983)
who explored the influences of external factors the cellular environment, such
as the presence or absence of foetal calf serum in the culture medium, on the
developmental pathways of astrocytes and oligodendrocytes. They assessed
morphological and imunocytochemical criteria of the divergent pathways of
cell development in the immature glia of the rat optic nerve. They used A2B5
antibody for the detection of Type 2 astrocytes (fibrous) in this study and
proposed that both fibrous astrocytes and oligodendrocytes may be derived
from a primitive precursor cell (the so-called “O-2A” or oligodendrocyte Type 2
astrocyte progenitor cell), dependent upon the influence of the environment
(Temple 1985; Raff 1984; Raff 1983). This observation provided the first
evidence for developmental plasticity and environmental influence in the
differentiation of glial cells in the central nervous system (CNS). Subsequent
studies showed that the presence of GFAP-negative, A2B5-positive cells and
GFAP-positive, A2B5-positive cells in a malignant astrocytoma culture (IPSB-
18) which provided evidence that the O-2A progenitor and Type 2 astrocyte
phenotypes occur both in vitro in human neoplastic as well as in normal
developing rat neural tissue (Pilkington 1992; Knott 1990).

66 | P a g e
Furthermore, Tenebaum et al. (1996) identified the plasticity of
oligodendroglioma cells by successfully showing that when taken from a rat
brain, they could be manipulated in the presence of serum supplementation,
into losing the expression of oligodendrocytic antigenic markers and acquiring
astrocytic markers. Upon re-introduction into the rat, these cells were able to
revert back to their original antigenic expression. They also confirmed that
human oligodendroglioma cells had a similar culmination being induced, by
the absence or presence of serum, into oligodendrocytes or Type 2
astrocytes, respectively.
Various antigenic markers characteristically expressed by gliomas, aid
identification of tumour phenotypes in vitro. Such markers include cluster of
differentiation 44 (CD44), neural cell adhesion molecules (NCAM), GFAP,
ganglioside (GD3), Gal C and Neuron-Glial 2 (NG2).
Astrocytic marker CD44 is a cell surface adhesion molecule (Ariza 1995; Li
1995; Radotra 1994; Pilkington 1993) and a principal receptor for hyaluronan
(HA) (Aruffo 1990), a glycosaminoglycan found to be highly expressed in the
extra cellular matrix (ECM). Brian tumours are highly diffuse and are difficult
to target because of this invasive behaviour. Involvement of HA in this
invasive process results in its increased ECM expression, regardless of
tumour grade (Delpech 1993). CD44 is as a result also up-regulated in brain
tumours. As CD44 is involved in this invasive process and is commonly
studied as a marker of astrocytic invasion.
Members of the immunoglobulin super family, NCAMs are cell surface
glycoproteins that mediate cell-cell adhesion independent of Ca2+ (Keilhauer
1985), play an important role in neurite outgrowth and fasciculation (Appel
1993) and are involved in migration/invasion (Gratsa 1997). Gratsa et al
(1997) showed that during migration the NCAM expression is down-regulated.

67 | P a g e
GFAP an intermediate filament protein constituent thought to retain the
mechanical strength and structure of astrocytes (Eng 1971) and is a valuable
marker of normal, reactive and neoplastic astrocytes (Pilkington 2001).
GD3 is a ganglioside belonging to a family of complex acidic glycolipids. It is
thought they are functionally diverse in the normal brain and are also
expressed and play a role in brain tumours (Yates 1995; Fredman 1994,
Wikstrand 1994; Pilkington 1993; Shinoura 1992). Earlier studies have
reported that malignant gliomas contain a higher concentration of GD3. Its
expression has been shown to correlate with the degree of malignancy (Berra
1985).
Gal C belongs to the family of cerebrosides. It is a common cell surface
glycolipid marker for mature oligodendrocytes and appears to regulate myelin
formation (Marcus 2006; Dupree 1998; Bosio 1996; Coetzee 1996).
Tenebaum et al. (1996) identified the loss of this marker in their studies when
the microenvironment was altered.
NG2 a transmembrane chondroitin sulphate proteoglycan, is expressed on
oligodendrocyte progenitor cells (OPCs) (Chekenya 2002; Chekenya 2007)
though it is not expressed by multipotent stem cells. It is however up
regulated once stem cells begin to differentiate. NG2 is then strongly
expressed whilst cells undergo proliferation and retain a certain degree of
developmental plasticity. Upon termination of this, NG2 expression is down
regulated. However NG2 remains up regulated in tumours, due to continual
proliferative activity (Stallcup 2008).
CD73 is known to be expressed in oligodendrocytes (Maienschein 1996), its
function. It is known to be involved in various signalling pathways in the body
including extracellular dephosphorylation of nucleoside monophosphates to
their corresponding nucleosides and cell– matrix interactions (Stochaj 1992).
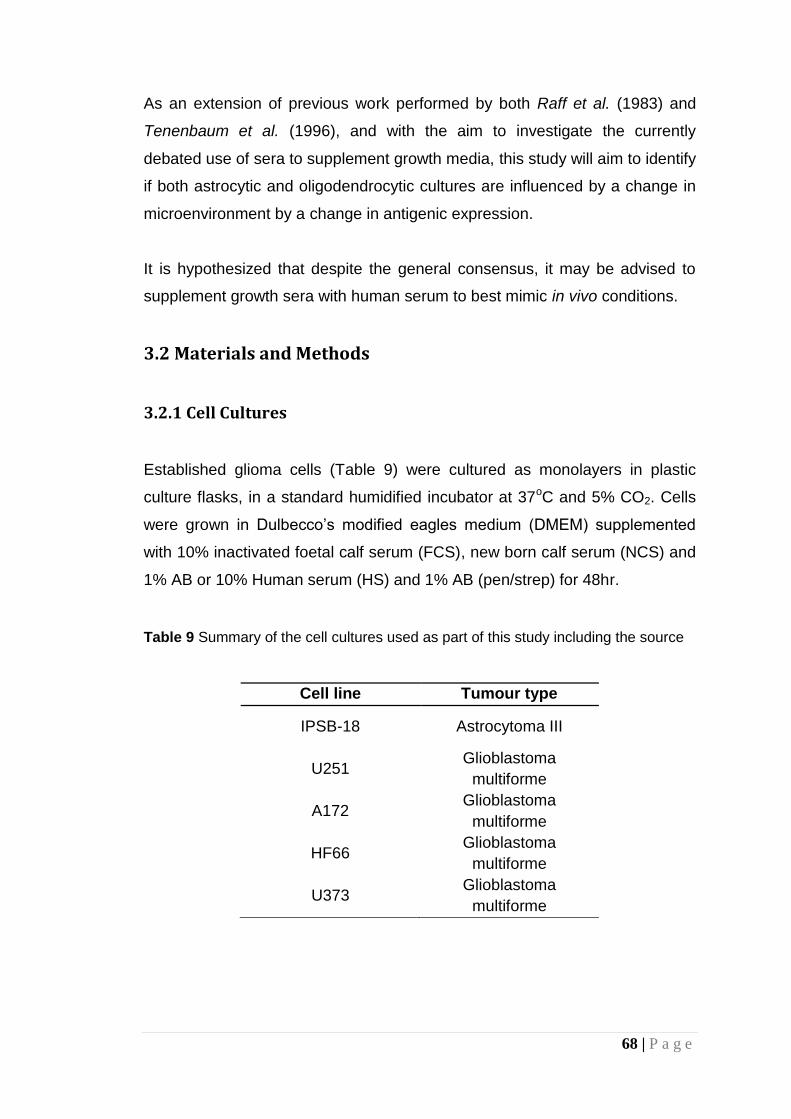
68 | P a g e
As an extension of previous work performed by both Raff et al. (1983) and
Tenenbaum et al. (1996), and with the aim to investigate the currently
debated use of sera to supplement growth media, this study will aim to identify
if both astrocytic and oligodendrocytic cultures are influenced by a change in
microenvironment by a change in antigenic expression.
It is hypothesized that despite the general consensus, it may be advised to
supplement growth sera with human serum to best mimic in vivo conditions.
3.2 Materials and Methods
3.2.1 Cell Cultures
Established glioma cells (Table 9) were cultured as monolayers in plastic
culture flasks, in a standard humidified incubator at 37oC and 5% CO2. Cells
were grown in Dulbecco’s modified eagles medium (DMEM) supplemented
with 10% inactivated foetal calf serum (FCS), new born calf serum (NCS) and
1% AB or 10% Human serum (HS) and 1% AB (pen/strep) for 48hr.
Table 9 Summary of the cell cultures used as part of this study including the source
Cell line Tumour type
IPSB-18 Astrocytoma III
U251 Glioblastoma
multiforme
A172 Glioblastoma
multiforme
HF66 Glioblastoma
multiforme
U373 Glioblastoma
multiforme
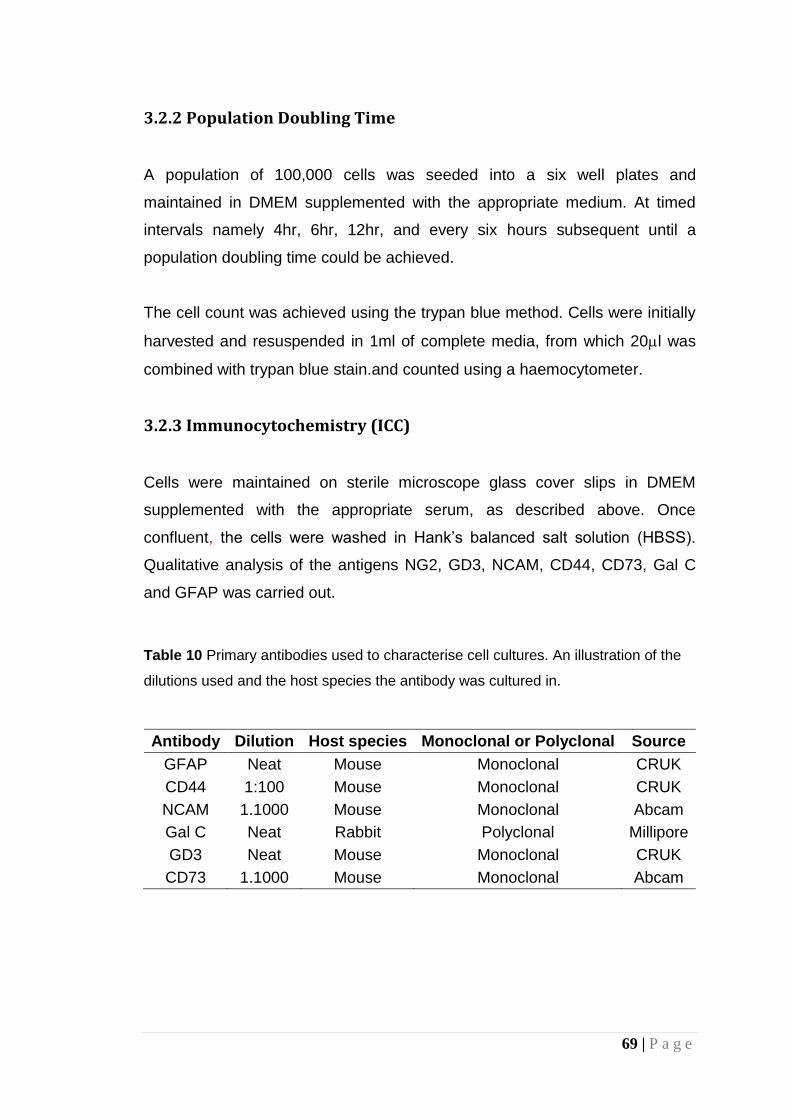
69 | P a g e
3.2.2 Population Doubling Time
A population of 100,000 cells was seeded into a six well plates and
maintained in DMEM supplemented with the appropriate medium. At timed
intervals namely 4hr, 6hr, 12hr, and every six hours subsequent until a
population doubling time could be achieved.
The cell count was achieved using the trypan blue method. Cells were initially
harvested and resuspended in 1ml of complete media, from which 20l was
combined with trypan blue stain.and counted using a haemocytometer.
3.2.3 Immunocytochemistry (ICC)
Cells were maintained on sterile microscope glass cover slips in DMEM
supplemented with the appropriate serum, as described above. Once
confluent, the cells were washed in Hank’s balanced salt solution (HBSS).
Qualitative analysis of the antigens NG2, GD3, NCAM, CD44, CD73, Gal C
and GFAP was carried out.
Table 10 Primary antibodies used to characterise cell cultures. An illustration of the
dilutions used and the host species the antibody was cultured in.
Antibody Dilution Host species Monoclonal or Polyclonal Source
GFAP Neat Mouse Monoclonal CRUK
CD44 1:100 Mouse Monoclonal CRUK
NCAM 1.1000 Mouse Monoclonal Abcam
Gal C Neat Rabbit Polyclonal Millipore
GD3 Neat Mouse Monoclonal CRUK
CD73 1.1000 Mouse Monoclonal Abcam

70 | P a g e
For cell surface staining fixation was performed after incubation with the
primary and secondary antibodies for two mins with acid alcohol (1 vol 1%
HCL: 99 vol 70% ethanol), whereas fixation for cytoplasmic staining was
carried out with acid alcohol for one min prior to incubating with the primary
antibody. Upon incubation with both antibodies the cells were washed and
counterstained with Hoechst Blue. The monolayer of cells were then mounted
in Citifluor and analysed with a confocal microscope.
Each micrograph was scored by identifying the intensity/quantity of
fluorescence. An average score of three micrographs was taken.
3.2.4 Flow Cytometry
When confluent the cells were harvested from flaks using cell dissociation
solution (GIBCO) for 10min. The cells were then neutralised with phosphate
buffer solution (PBS) supplemented with 5% appropriate serum and washed.
All washes were performed using PBS supplemented with 5% appropriate
serum and then centrifuged for 5 mins at 1000rpm. The cells were
resuspended in 200l of for 10 mins the appropriate primary antibody (NG2,
GD3, NCAM, CD44, GalC, GFAP and CD73) washed and resuspended in
streptavidin fluorescin (FITC). The cells were then washed and resuspended
in PBS (2% appropriate serum). Prior to analysis 5l of propidium iodide (PI)
was added and analysis was performed using a Beckton-Dickenson FACS
Calibur against a suitable control.
3.3 Results
The standard morphology of malignant glioma cells cultured in different
microenvironments, exhibit differing growth patterns. Illustrated here, the
IPSB-18 cell line (Fig 12) develops in a monolayer formation in the presence
of FCS though when cultured in NCS and HS the pattern becomes ‘patchy’
and the cells begin to grow as clumps.

71 | P a g e
(a) (b)
(c)
Figure 10 Phase contrast micrographs of the IPSB-18 cell line when cultured in the
presence of (a) FCS (b) NCS and (c) HS. Cells grown in the presence of FCS grew in
a consistant monolayer, whereas in the presence of NCS or HS the cells grew in
patches and the morphology of the cells differed in each microenvironment.
FCS NCS
HS

72 | P a g e
The population doubling times (PDTs) supported the growth rates seen in the
micrographs of the indiviual cultures when grown in the presence of differing
growth media.
Table 11 Summary population doubling times (PDTs) of the cell cultures in this study
Cell line PDT
FCS NCS HS
IPSB-18 48 72 102
U251 26 29 63
A172 37 49 76
HF66 32 56 93
U373 20 42 72
Table 11 summarises the PDTs of all the cultures. When the
microenvironment was supplemented with NCS, in all cultures, the PDT was
approximately double that of cultures grown in FCS. Cultures supplemented
with HS grew slower still with most PDTs being more than double those
cultured in FCS. This initial morphological change is mimicked in the apparent
phenotypical change of antigenic expression.
Representative micrographs depict dual staining of the changes seen in Gal C
and GFAP when cultured in differing serum supplementation (Fig 11).
Evaluation of the antigenic expression of Gal C and GFAP, the two prominent
markers for olidendrocytes and astrocytes respectively illustrated staining
intensity of glioma cell cultures varies when the serum supplementation is
altered, when the microenvironment is changed such that there is no antigenic
expression of Gal C seen when the cells are cultured in FCS. However when
cultured in NCS or HS there is a slight indication of fluorescence.
Table 12 and 13 summarise the expression of GFAP is down regulated, in
cultures grown in FCS compared to those grown in NCS and HS. This is
commonly seen across the remaining cell cultures also.

73 | P a g e
Figure 11 Micrographs of the changes in antigenic expression of Gal C (red) and GFAP (green) when cultured in the in the presence of (a)
FCS (b) NCS and (c) HS for the cell line IPSB-18 (an established anaplastic astrocytoma). The nuclei are counterstained with DAPI (blue).
(a) (b) (c)
HS FCS NCS

74 | P a g e
Table 12 Summary of the immunocytochemical results of the presence of six prominent markers found in oligodendrogliomas and
astrocytomas when grown in media supplemented with foetal calf serum (FCS), Newborn calf serum (NCS) and Human serum (HS)
Cell line Serum used to culture
Antibody Expression %
CD44 NCAM GFAP GD3 Gal C NG2 CD73
IPSB-18 FCS +++ + +++ +++ ± - + NCS + ± + ± - - + HS ± ± + ± + ++ + U251 FCS +++ + +++ +++ - + - NCS + + ++ ++ ++ + - HS - ± + + ++ + - A172 FCS +++ + +++ +++ - ± + NCS + ± ++ + ± + - HS + - ++ ± + ++ + HF66 FCS +++ + +++ +++ - ± + NCS ++ ± ++ + ± + + HS + ± ++ ± + + + U373 FCS +++ + +++ +++ - ± - NCS ++ ± ++ + + + + HS ± ± ++ ± ± ++ +
Where + = positive expression ± = some expression and - = little or no expression

75 | P a g e
When investigating Gal C an opposite phenomenon occurred namely when
the microenvironment was changed from FCS to NCS or HS, in all the cell
lines Gal C appeared to be up regulated. The down regulation of Gal C
expression in the IPSB-18 cell line when cultured in NCS could be assume an
anomaly (Table 12), as Fig 11 clearly depicts the presence of Gal C
expression. Table 12 also illustrated an apparent down regulation of CD44,
NCAM, GD3 and NG2. The expression of CD73 remained fairly consistent.
Flow cytometry semi-quantitatively compliments the immunocytochemical
data. The plots illustrated fluorescent intensity against cell count and all plots
are compared to the no primary antibody, negative control. The significance of
the variation in expression of the different antigens after flow cytometry, as
calculated by the t-test when compared back to cells cultured in FCS, is
summarised in Table 13.
The t-test confirmed significant changes in expression of the antigenic
markers across all the cell line for CD44, NCAM, GFAP and NG2. Gal C and
CD73 were only depicted to illustrate significant changes in cultures grown in
HS not those in NCS.
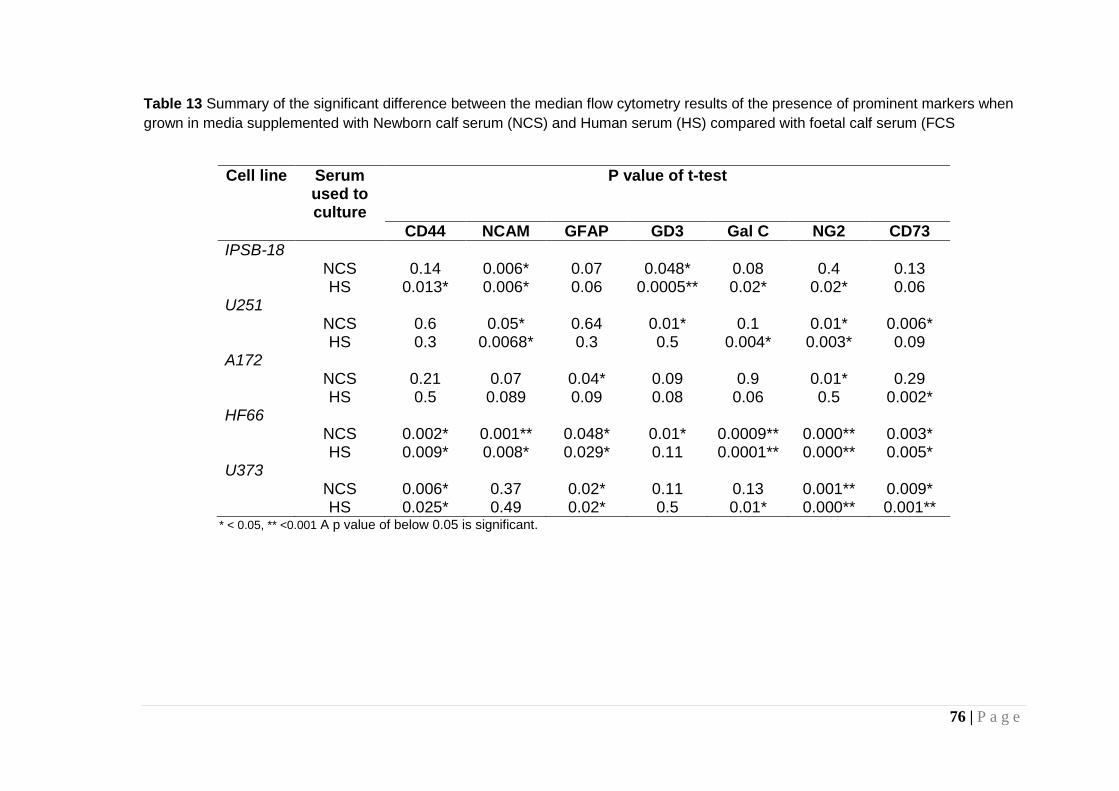
76 | P a g e
Table 13 Summary of the significant difference between the median flow cytometry results of the presence of prominent markers when
grown in media supplemented with Newborn calf serum (NCS) and Human serum (HS) compared with foetal calf serum (FCS
Cell line Serum used to culture
P value of t-test
CD44 NCAM GFAP GD3 Gal C NG2 CD73
IPSB-18 NCS 0.14 0.006* 0.07 0.048* 0.08 0.4 0.13 HS 0.013* 0.006* 0.06 0.0005** 0.02* 0.02* 0.06 U251 NCS 0.6 0.05* 0.64 0.01* 0.1 0.01* 0.006* HS 0.3 0.0068* 0.3 0.5 0.004* 0.003* 0.09 A172 NCS 0.21 0.07 0.04* 0.09 0.9 0.01* 0.29 HS 0.5 0.089 0.09 0.08 0.06 0.5 0.002* HF66 NCS 0.002* 0.001** 0.048* 0.01* 0.0009** 0.000** 0.003* HS 0.009* 0.008* 0.029* 0.11 0.0001** 0.000** 0.005* U373 NCS 0.006* 0.37 0.02* 0.11 0.13 0.001** 0.009* HS 0.025* 0.49 0.02* 0.5 0.01* 0.000** 0.001**
* < 0.05, ** <0.001 A p value of below 0.05 is significant.

77 | P a g e
3.4 Discussion
A change in serum supplementation impacted antigenic expression in both
original studies performed by Tenenbaum et al (1996) and Raff et al (1983).
More recent studies (Brewer 2007) also depicted similar variations in cell
differentiation under different serum supplements. Serum supplementation of
the culture media is required to provide the cells with basic nutrients,
hormones and growth factors. These constituents promote growth and
potentiate specialised cellular functions. Although different sera constitute
similar components, differences are identified in the percentage of these
constituents as in the comparison of foetal calf serum, newborn calf serum
and human, particularly in the protein content. Serum supplementation of the
culture media is required to provide the cells with basic nutrients, hormones
and growth factors. These constituents promote growth and potentiate
specialised cellular functions. Although different sera constitute similar
components differences are identified in the percentage of these constituents
as Table 14 illustrates in the comparison of foetal calf serum, newborn calf
serum and human serum.
The major differences between the three sera are the percentages of
haemoglobin and total protein. Previous studies have found haemoglobin had
no effect on cell growth (Rooprai et al. personal communication), therefore the
key to trans-differentiation suggestively lies in the differing content of the total
protein. The choice of sera used in this study was initially based on previous
studies in Norway where normally newborn calf serum is used to supplement
media (personal communication).

78 | P a g e
Table 14 Similarities and differences in three different sera; foetal calf serum,
newborn calf serum and human serum
Component Foetal calf
serum
Newborn calf
serum Human serum
Total protein
(g/100ml) 3 - 4.5 4.5 – 6.0 5.7
Haemoglobin
(mg/100ml) < 25 20 6.21
pH 6.8 – 8.1 7 – 8 7.62
Osmolarity
(mOsm/kg) 260 - 330 240 – 340 325
Endotoxin (EU/ml) < 10.0 100 9
Mycoplasma none none none
The results of this study found that there were differences in the antigenic
expression using both flow cytometry and immunocytochemistry as a result it
was suggested cells should be cultured in media supplemented with human
serum. However, due to the cost and impracticality of obtaining human serum
it was suggested use of foetal calf serum as a media supplement should
continue until such time, human serum becomes readily available.
Such differences may be responsible for the differing growth patterns
exhibited by the IPSB-18 culture (Fig 10), specifically the difference in
percentage protein content. This most immediate difference illustrated, upon
changing the microenvironment, cells cultured in foetal calf serum normally
grow as a monolayer, however on changing to human sera the cells began to
grow in patches. We may therefore assume the ability to manipulate
characteristically astrocytic cultures, to differentiate away from the norm
resulting trans-differentiation. This does suggest the presence of a potential
cell type with the ability to become manipulated by varying the
microenvironment.
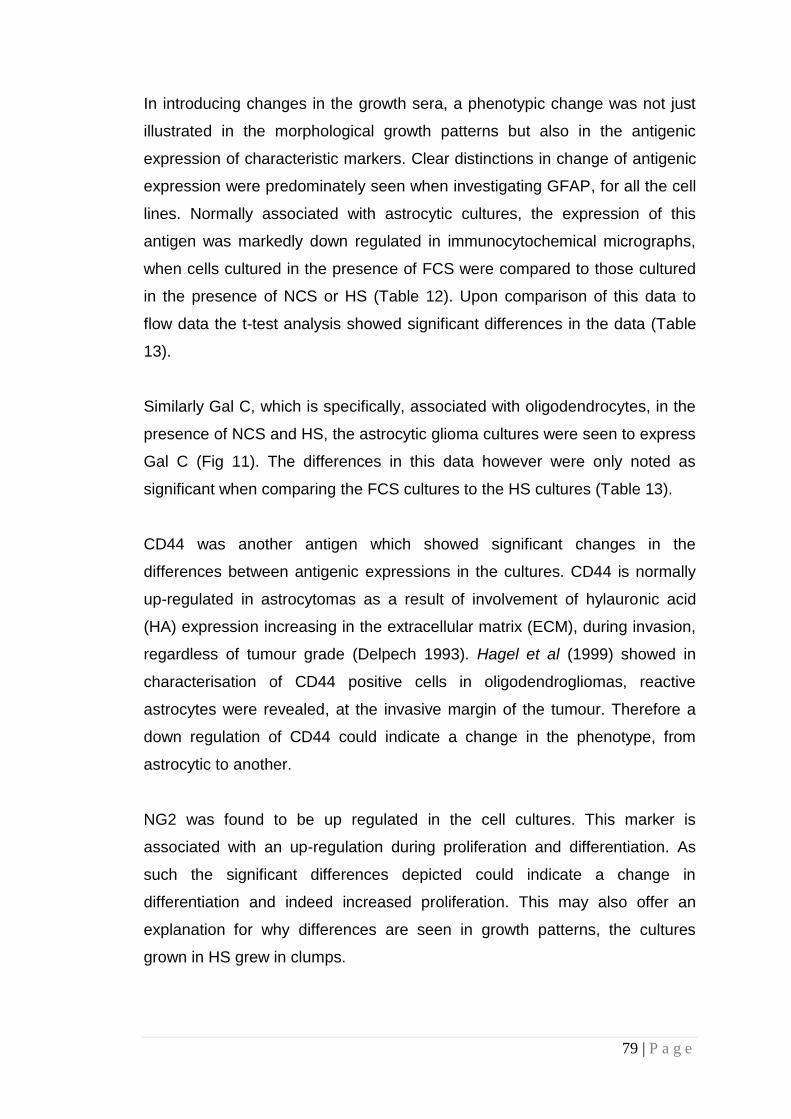
79 | P a g e
In introducing changes in the growth sera, a phenotypic change was not just
illustrated in the morphological growth patterns but also in the antigenic
expression of characteristic markers. Clear distinctions in change of antigenic
expression were predominately seen when investigating GFAP, for all the cell
lines. Normally associated with astrocytic cultures, the expression of this
antigen was markedly down regulated in immunocytochemical micrographs,
when cells cultured in the presence of FCS were compared to those cultured
in the presence of NCS or HS (Table 12). Upon comparison of this data to
flow data the t-test analysis showed significant differences in the data (Table
13).
Similarly Gal C, which is specifically, associated with oligodendrocytes, in the
presence of NCS and HS, the astrocytic glioma cultures were seen to express
Gal C (Fig 11). The differences in this data however were only noted as
significant when comparing the FCS cultures to the HS cultures (Table 13).
CD44 was another antigen which showed significant changes in the
differences between antigenic expressions in the cultures. CD44 is normally
up-regulated in astrocytomas as a result of involvement of hylauronic acid
(HA) expression increasing in the extracellular matrix (ECM), during invasion,
regardless of tumour grade (Delpech 1993). Hagel et al (1999) showed in
characterisation of CD44 positive cells in oligodendrogliomas, reactive
astrocytes were revealed, at the invasive margin of the tumour. Therefore a
down regulation of CD44 could indicate a change in the phenotype, from
astrocytic to another.
NG2 was found to be up regulated in the cell cultures. This marker is
associated with an up-regulation during proliferation and differentiation. As
such the significant differences depicted could indicate a change in
differentiation and indeed increased proliferation. This may also offer an
explanation for why differences are seen in growth patterns, the cultures
grown in HS grew in clumps.

80 | P a g e
NCAM also showed significant differences in expression (Table 13) depicting
an up regulation upon change. This supports the changes seen in NG2 as the
change in proliferation and differentiation may also be associated with there
invasive potential. NCAMs are also seen to be up regulated in cultures grown
in HS where the cells grew in clumps.
A consistency in GD3 expression suggests the malignancy of the tumours did
not vary. Though a significant difference in CD73 when cells were cultured in
HS compared to cells cultured in FCS, did suggest a greater presence of
oligodendrocytic phenotypes.
Additional experimentation was also carried out on some cell lines using
serum free medium (SFM) with and without platelet derived growth factor
(PDGF). This data showed a similar occurrence. The Gal C expression of two
established oligodendrogliomas cell lines was down-regulated in the presence
of NCS and HS and the GFAP expression was up-regulated.
These dramatic indications, suggested trans-differentiation in astrocytic
glioma cultures when their microenvironment is altered. As such, a cell type
with the ability to change phenotypically.
3.5 Conclusion
The suggestion of trans-differentiation indicates the importance of the
microenvironment in which the cells are cultured. Whilst evaluation of the
changing environments would suggest the optimum serum supplement is
human serum, it is not readily available. It is therefore favourable to continue
using FCS as the chosen serum supplement.

81 | P a g e
CHAPTER 4: Results
4.1 Morphology
Heterogeneity is a feature of malignant brain tumours, each unique in
morphology with up to 14 different sub populations of cells, including
progenitor cells. The classic shape associated with astrocytic cells, ‘star’ or
‘spindle’, was seen in micrographs of the control cell cultures (MUAB-C) (Fig
12f). When compared to the control culture the glioma cells illustrated a
differing morphology, with large spindle like extensions, each cell growing
separately from one another and consistently across a monolayer. The cell
shape seen in IPSB-18, (Fig 12a) however, were smaller in size and initially
grew in small patches, overlapping one another, eventually spreading across,
and growing as a consistent monolayer.

82 | P a g e
Figure 12 Phase contrast micrographs of the cell lines involved in this study including (a) IPSB-18, (b) MUMG-GM, (c) MUIH-GM, (d) MUTC-GM, (e) MUPK-GM and (f) control cell line MUAB-C (where possible arrows indicate examples of individual cell morphologies). Magnification x 40. Differences between the cell cultures are clearly visible. The most noted difference includes, that between MUAB-C, (f) the control cell culture with clear star shaped cells and the remaining cultures which have spindle shaped cells.
(a) (b) (c)
(d) (e) (f)
IPSB-18 MUMG-GM MUIH-GM
MUTC-GM MUPK-GM MUAB-C
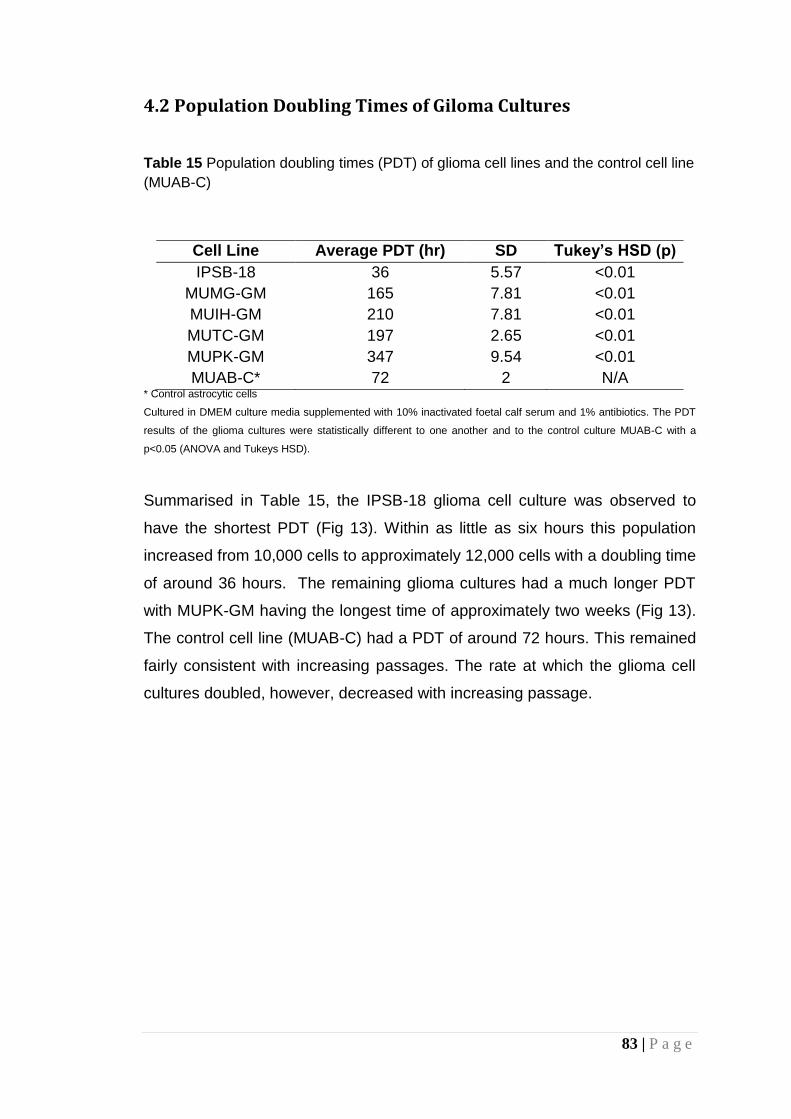
83 | P a g e
4.2 Population Doubling Times of Giloma Cultures
Table 15 Population doubling times (PDT) of glioma cell lines and the control cell line
(MUAB-C)
Cell Line Average PDT (hr) SD Tukey’s HSD (p)
IPSB-18 36 5.57 <0.01
MUMG-GM 165 7.81 <0.01
MUIH-GM 210 7.81 <0.01
MUTC-GM 197 2.65 <0.01
MUPK-GM 347 9.54 <0.01
MUAB-C* 72 2 N/A * Control astrocytic cells
Cultured in DMEM culture media supplemented with 10% inactivated foetal calf serum and 1% antibiotics. The PDT
results of the glioma cultures were statistically different to one another and to the control culture MUAB-C with a
p<0.05 (ANOVA and Tukeys HSD).
Summarised in Table 15, the IPSB-18 glioma cell culture was observed to
have the shortest PDT (Fig 13). Within as little as six hours this population
increased from 10,000 cells to approximately 12,000 cells with a doubling time
of around 36 hours. The remaining glioma cultures had a much longer PDT
with MUPK-GM having the longest time of approximately two weeks (Fig 13).
The control cell line (MUAB-C) had a PDT of around 72 hours. This remained
fairly consistent with increasing passages. The rate at which the glioma cell
cultures doubled, however, decreased with increasing passage.

84 | P a g e
Figure 13 Population doubling time of glioma cell line IPSB-18 (a), MUMG-GM (b), MUIH-GM (c) MUTC-GM (d) and MUPK-GM (e). Readings
were taken wherever possible at least at 12 hourly intervals. Identification of the population doubling time (i.e. increase from 10,000 cells to
20,000 cells) has been indicated by the black line.
(a) (b) (c)
(d) (e)
IPSB-18 MUMG-GM MUIH-GM
MUTC-GM MUPK-GM
85 | P a g e
4.3 The Effect of Micronutrient Extracts on Cell Viability
4.3.1 The Toxic Effects of DMSO
Optimized for glioma cells the MTT protocol is based on the experiment
described by Nikkah et al (1992), this protocol was adapted due to apparent
biphasic results. Despite being a simple, well documented and widely used
assay, errors of analysis have been reported as a result of various problems
ranging from differing responses within various cell lines (Nikkhah 1992;
Nikkhah 1992; Chen 1990) to interactions with various compounds (Wang
2010; Young 2005; Ngai 1998), the use of micronutrients being one such
hindrance. Undesirably the use of micronutrients has been shown to reduce
the MTT salt in the absence of cells (Peng 2005; Bruggisser 2002) at fairly
high concentrations.
Initial experiments using the IPSB-18 primary cell culture (grade III) yielded
inconsistent and rarely reproducible results with large standard deviations.

86 | P a g e
Figure 14 The mean cell viability of IPSB-18 (an established anaplastic astrocytoma cell line), as a percentage of the positive control
(clear DMEM) against the concentration of (a) RCE dissolved in clear DMEM, (b) RCE dissolved in DMSO and (c) DMSO only on a log
scale. Indicated is a decrease in cell viability upon treatment of cell cultures with DMSO thus impacting the cell viability of the treated
cells. The inserted absorbance spectra indicate upon a concentration of RCE greater than 1g/ml (blue and red) the colour of the
micronutrient affects the absorbance reading at 570nm.
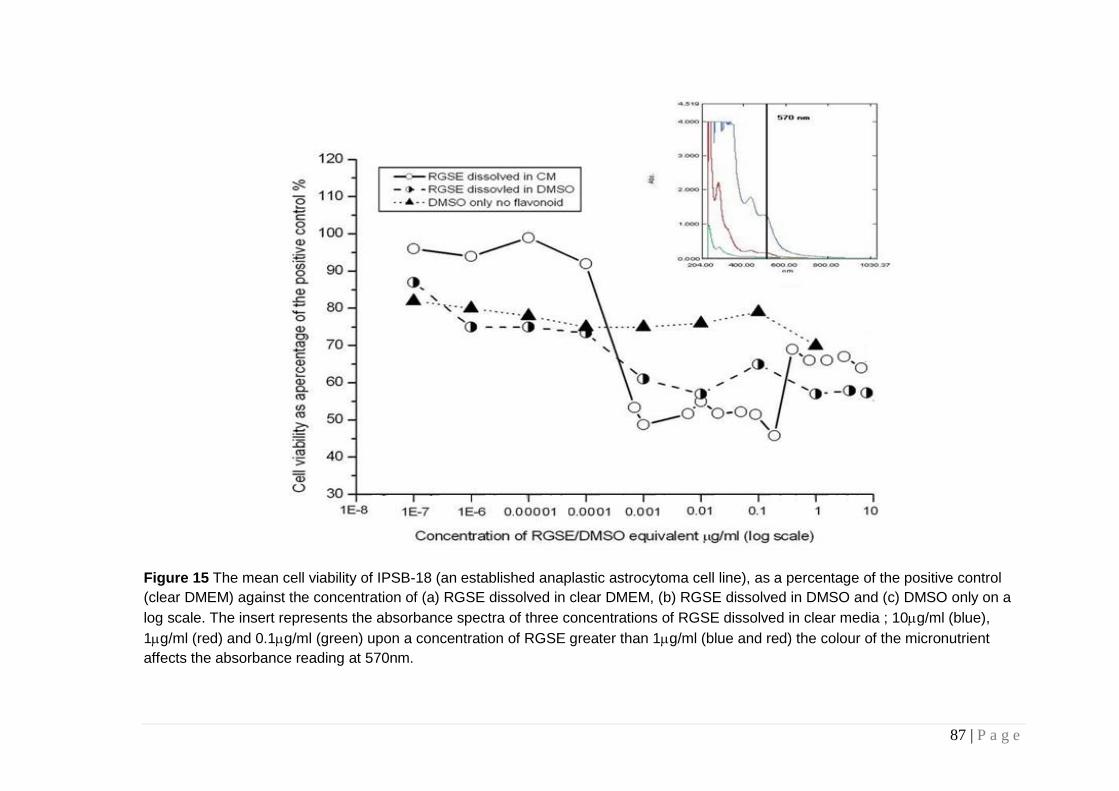
87 | P a g e
Figure 15 The mean cell viability of IPSB-18 (an established anaplastic astrocytoma cell line), as a percentage of the positive control
(clear DMEM) against the concentration of (a) RGSE dissolved in clear DMEM, (b) RGSE dissolved in DMSO and (c) DMSO only on a
log scale. The insert represents the absorbance spectra of three concentrations of RGSE dissolved in clear media ; 10g/ml (blue),
1g/ml (red) and 0.1g/ml (green) upon a concentration of RGSE greater than 1g/ml (blue and red) the colour of the micronutrient
affects the absorbance reading at 570nm.

88 | P a g e
DMSO, often used to aid solubilisation of micronutrient extract, has a
significant toxic effect on the IPSB-18 astrocytoma cell line (Fig 14). Results
using the MTT viability assay on glioma cells exposed to DMSO used to
dissolve the micronutrients showed at least a 20% decrease in viability when
compared to cells treated with micronutrient extracts dissolved in clear DMEM
only. When this DMSO toxicity his combined with high concentration
deposition of RCE, evaluation of cel viability is anomulus. An almost identical
pattern is seen with RGSE treatment of the IPSB-18 as RGSE also has a
significant absorption at 570nm (Fig 38). This suggested the DMSO used to
dissolve the micronutrient extracts may be having a toxic effect on the delicate
brain tumour cells. This affect may be attributed to the mode of action of
DMSO.
4.3.2 Cell viability following treatment with micronutrient
extracts
Initial studies treated glioma cell cultures with RCE and RGSE over a wide
range of concentrations. In particular the IPSB-18 cell line was treated using a
range of concentrations between 250mg/ml to 0.04g/ml. When performing
the MTT assay, concentrations <20g/ml appeared to decrease cell viability of
glioma cultures, whereas concentrations >20g/ml appeared to increase
viability. Each of the assays was compared with phase contrast micrography.
The reduction in cell viability was seen in all the respective analyses.
However, following further investigation it was found that the pigmentation of
the micronutrients at higher concentrations was interfering with the
absorbance reading of the assay. Therefore, subsequent evaluation of the cell
viability of RCE and RGSE was carried out with micronutrient concentrations
below 10g/ml and 20g/ml, respectively. These analyses suggested that
both micronutrient extracts had an effect on cell viability. To ensure the effect
of the micronutrient extracts was specific to glioma cells, experimentation on
the control culture (MUAB-C) was performed. Neither micronutrient appeared

89 | P a g e
to affect the viability of normal brain tissue following 48 hours of treatment at
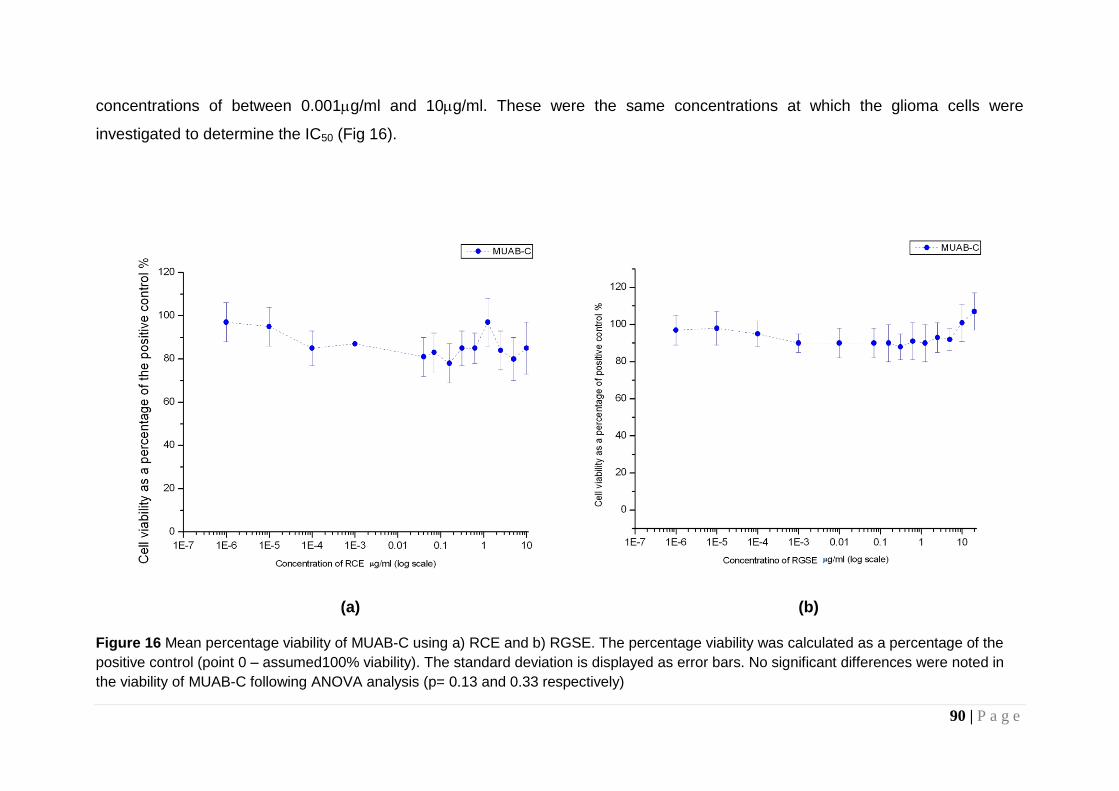
90 | P a g e
concentrations of between 0.001g/ml and 10g/ml. These were the same concentrations at which the glioma cells were
investigated to determine the IC50 (Fig 16).
(a) (b) Figure 16 Mean percentage viability of MUAB-C using a) RCE and b) RGSE. The percentage viability was calculated as a percentage of the
positive control (point 0 – assumed100% viability). The standard deviation is displayed as error bars. No significant differences were noted in
the viability of MUAB-C following ANOVA analysis (p= 0.13 and 0.33 respectively)

91 | P a g e
4.3.3 Interference of Micronutrient Pigments on Cell Viability Assay
Initial studies on the IPSB-18 glioma cell culture found that, at concentrations
of between 20g/ml and 250g/ml, incubation with RCE resulted in an initial
decrease in cell viability at the lower concentrations of the micronutrient,
followed by an apparent increase at the highest concentrations (Fig 17). This
apparent increase in viability was also seen when IPSB-18 was treated with
the same concentrations of RGSE (Fig 18).
Figure 17 Mean percentage viability of IPSB-18 using RCE at concentrations
between 250g/ml to 20g/ml. The percentage viability was calculated as a
percentage of the positive control (untreated cells - point 0 is assumed 100%
viability). The standard deviation is displayed as error bars. Significant difference
between untreated and treated cells, following a Tukey’s HSD test is displayed (*
p<0.01)
* *
*
*
*
*
*
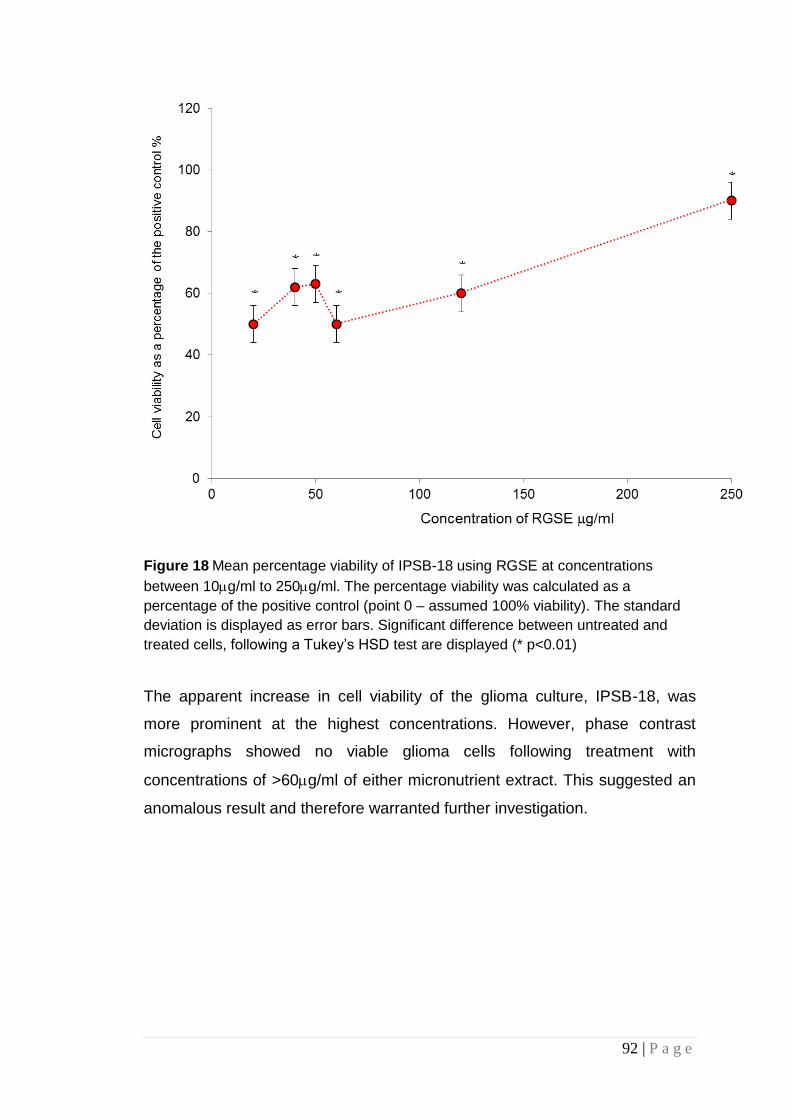
92 | P a g e
Figure 18 Mean percentage viability of IPSB-18 using RGSE at concentrations
between 10g/ml to 250g/ml. The percentage viability was calculated as a
percentage of the positive control (point 0 – assumed 100% viability). The standard
deviation is displayed as error bars. Significant difference between untreated and
treated cells, following a Tukey’s HSD test are displayed (* p<0.01)
The apparent increase in cell viability of the glioma culture, IPSB-18, was
more prominent at the highest concentrations. However, phase contrast
micrographs showed no viable glioma cells following treatment with
concentrations of >60g/ml of either micronutrient extract. This suggested an
anomalous result and therefore warranted further investigation.
*
* *
*
*
*
93 | P a g e
The mean viability, as a percentage of the positive control, of the IPSB-18
(astrocytoma) cell line when treated with RCE shows a dose dependant
decrease up to approximately 1g/ml of RCE. Beyond this a variable and
general increase in viability appears. Following washing of the wells during
viability assays, it was noted that, despite copious washing, it was not
possible to remove all of the extract. The absorbance of treated plates without
the presence of the MTT assay components added was examined to
determine whether any residual extract may be contributing to the unusual
result found with increasing concentration of the micronutrients. Despite
increased washing of the wells (> 4 times) it was confirmed that the extract
was resulting in the biphasic anomaly.
Supplementary studies confirmed that the natural colour of the extracts
interfered with the optical density/absorbance readings (Fig 19). Although
RCE and RGSE has absorption maxima at between 200 and 400nm it still has
significant absorption at 570nm which rises dramatically as we move to
concentrations greater than 0.1g/ml. Thus, any deposited RCE at such
concentration can significantly contribute to absorption at this wavelength.
making, concentrations of >1g/ml of both micronutrients were unsuitable for
use in the MTT viability assay.

94 | P a g e
(a) (b)
Figure 19 Absorption spectra of three concentrations read at 570nm; 10g/ml (blue),
1g/ml (red) and 0.1g/ml (green) for (a) RCE and (b) RGSE. Both RCE and RGSE
indicate an absorbance at 570nm (vertical black line), the absorbance at which the
MTT assay is read.
4.3.4 Red Clover Extract and Cell Viability
The IC50 of RCE was found to be in the g/ml range for all of the glioma cell
cultures. The MUTC-GM and IPSB-18 cultures were more sensitive to the
micronutrient, with a lower IC50 (Fig 20).

95 | P a g e
Figure 20 Cell viability of glioma cell cultures when treated for 48 hours with red
clover extract (n=3). The three primary glioma cultures namely, MUMG-GM, MUIH-
GM and MUTC-GM depicted IC50s in the g/ml range. MUPK-GM and IPSB-18
illustrated much lower IC50s. Error bars are illustrated in Figures 22 and 23
IPSB-18 was the only established cell culture to be used in the evaluation of
the affects of RCE and RGSE on human adult glioma cells. The increased
passage number of the IPSB-18 is suggestive of decreased heterogeneity of
the cells (Pilkington 2001), as such the IC50 was expected to be lower than the
other glioma cultures.

96 | P a g e
Figure 21 Scatter plot illustrating the cell viability of IPSB-18 (an established
anaplastic astrocytoma cell line) as a percentage of the positive control (clear
DMEM) against the concentration of RCE on a log scale. The error bars represent
the standard deviation. A significant difference is seen in the change in viability of
treated cells when compared to untreated (*p <0.001 following Tukey’s HSD test)
The IC50 of RCE on IPSB-18 was found to be 400ng/ml (Fig 21). Due to the
increased heterogeneity indicated in low passage cultures, the IC50s of the
other glioma cultures were expected to be higher than 0.001g/ml. The IC50
of RCE for MUMG-GM (p5) was found to lie around 1g/ml (Fig 22).
* *
*

97 | P a g e
Figure 22 Mean percentage cell viability of (a) MUMG-GM, (b) MUIH-GM (c) MUTC-GM and (d) MUPK-GM following incubation with RCE for 48hrs at
concentrations between 0 and 1g/ml. The percentage viability was calculated as a percentage of the positive control (point 0 – assumed 100% viability).
The standard deviation is displayed as error bars. A significant difference is seen in the change in viability (*p <0.001 following Tukey’s HSD test for all
glioma cell lines)
(a) (b)
(c) (d)
*
*
* * * *
* *

98 | P a g e
Similarly, to MUMG-GM, the remaining primary cultures, MUIH-GM, MUTC-
GM and MUPK-GM (p4), were also investigated following incubation with
RCE at concentrations below 1g/ml. The IC50 values illustrated in figure 22
have been summarised in Table 16. The IC50 of MUTC-GM was found to be
the lowest, followed by IPSB-18. The other glioma cultures indicated higher
IC50 values when compared to IPSB-18, as expected.
Table 16 Summary of the IC50 of RCE with various cell cultures including biopsy
derived primary cultures (MUMG, MUTC, MUIH and MUPK) and an existing low
passage cell line (IPSB-18).
Cell Culture Passage Number
IC50
RCE
IPSB-18 29-30 0.4g/ml MUMG-GM 4-5 1 g/ml MUTC-GM 3-4 0.007g/ml MUIH-GM 3-4 0.98g/ml MUPK-GM 3-4 0.80g/ml

99 | P a g e
4.3.5 Red grape seed extract
Figure 23 Cell viability of glioma cell cultures when treated for 48 hours with red
grape seed extract (n=3). The IC50 for red grape seed extract was at a low
concentration (ng/ml) for all cell cultures.
Incubation with red grape seed extract resulted in a similar reduction in
viability of the glioma cell cultures as that seen in response to incubation with
RCE. Figure 24 illustrates the mean percentage cell viability of IPSB-18
following 48 hr treatment with RGSE and the IC50 for RGSE was found to be
0.0008g/ml, lower than the IC50 of RCE (0.4g/ml). The remaining glioma
cultures were also found to be more sensitive to RGSE (Figure 25 and Table
17).

100 | P a g e
Figure 24 Mean percentage cell viability of IPSB-18 following 48 hr treatment with
RGSE. The percentage viability was calculated as a percentage of the positive
control (point 0 – assumed 100% viability). The standard deviation is displayed as
error bars. A significant difference is seen in the change in viability of treated cells
when compared to untreated (*p <0.001 following Tukey’s HSD test)
*
*
*
*
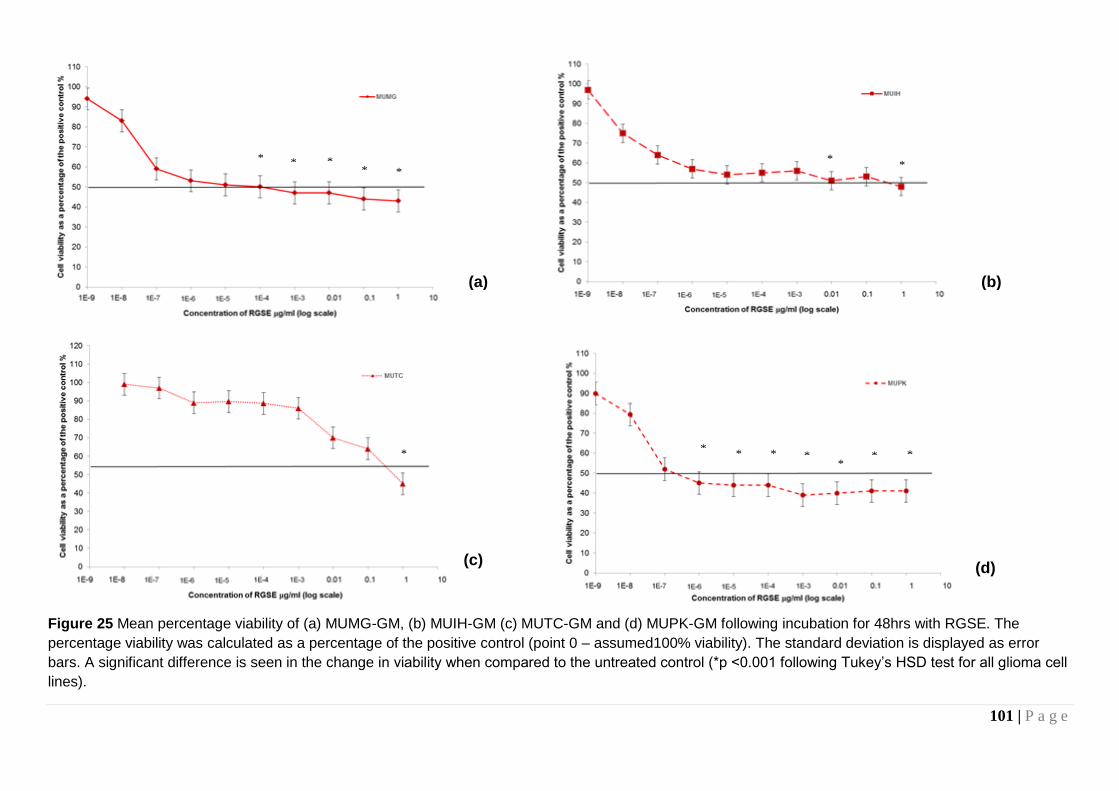
101 | P a g e
Figure 25 Mean percentage viability of (a) MUMG-GM, (b) MUIH-GM (c) MUTC-GM and (d) MUPK-GM following incubation for 48hrs with RGSE. The
percentage viability was calculated as a percentage of the positive control (point 0 – assumed100% viability). The standard deviation is displayed as error
bars. A significant difference is seen in the change in viability when compared to the untreated control (*p <0.001 following Tukey’s HSD test for all glioma cell
lines).
(a) (b)
(c) (d)
* * * *
*
* * *
* * * * *
* *
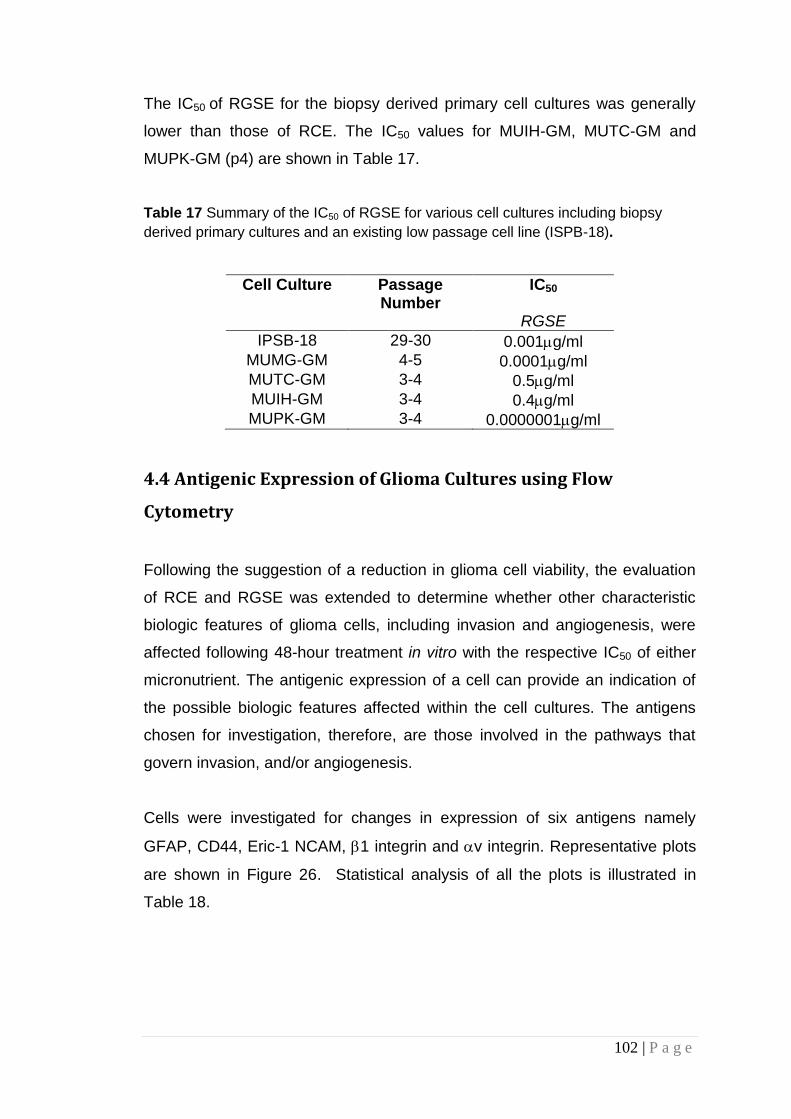
102 | P a g e
The IC50 of RGSE for the biopsy derived primary cell cultures was generally
lower than those of RCE. The IC50 values for MUIH-GM, MUTC-GM and
MUPK-GM (p4) are shown in Table 17.
Table 17 Summary of the IC50 of RGSE for various cell cultures including biopsy
derived primary cultures and an existing low passage cell line (ISPB-18).
Cell Culture Passage Number
IC50
RGSE
IPSB-18 29-30 0.001g/ml MUMG-GM 4-5 0.0001g/ml MUTC-GM 3-4 0.5g/ml MUIH-GM 3-4 0.4g/ml MUPK-GM 3-4 0.0000001g/ml
4.4 Antigenic Expression of Glioma Cultures using Flow
Cytometry
Following the suggestion of a reduction in glioma cell viability, the evaluation
of RCE and RGSE was extended to determine whether other characteristic
biologic features of glioma cells, including invasion and angiogenesis, were
affected following 48-hour treatment in vitro with the respective IC50 of either
micronutrient. The antigenic expression of a cell can provide an indication of
the possible biologic features affected within the cell cultures. The antigens
chosen for investigation, therefore, are those involved in the pathways that
govern invasion, and/or angiogenesis.
Cells were investigated for changes in expression of six antigens namely
GFAP, CD44, Eric-1 NCAM, 1 integrin and v integrin. Representative plots
are shown in Figure 26. Statistical analysis of all the plots is illustrated in
Table 18.

103 | P a g e
Plots were produced showing only cells which were PI negative and FITC
positive; these are live cells expressing the antigen. Cells were excluded if
propidium iodide (PI) positive (indicating a permeable nuclear membrane and
therefore dead) and if PI negative but also FITC negative (indicating no
expression of the antigen).
The expression of GFAP in the IPSB-18 culture was found to be as high as
that of the biopsies in this study, in particular MUTC-GM (Table 18). When
compared to the untreated cells GFAP did not appear to change in the
micrographs. CD44 did not exhibit a significant up or down regulation in any of
the cultures. Though a slight up regulation was illustrated following treatment
with RCE, when compared with the untreated culture, this was not marked
enough to be statistically significant. Eric-1 NCAM did not indicate a
significant difference in expression following treatment with either
micronutrient extract when compared to the untreated cultures. Both 1 and
v integrins demonstrated marked up regulation in the flow plots and a
significant difference was found between the treated and untreated cultures
suggesting an effect of RCE and RGSE on the invasive properties of the
glioma cells.

104 | P a g e
(a) (b)
(c) (d)
(e)
Figure 26 Representative plots of the percentage of fluorescent cells, indicating the
median expression (FL-1H-FITC – intensity of fluorescence) of (a) GFAP, (b) CD44,
(c) Eric-1 NCAM, (d) 1 integrin and (e) v integrin in a treated glioma cell culture
(IPSB-18), following 48 hour treatment with the IC50 of RCE. The expression of
CD44, Eric-1 NCAM and both integrins was expected to be up or down regulated
upon treatment with the IC50 of RCE. The median percentage expression is indicated
on the plot.
GFAP CD44
Eric-1 1 integrin
V integrin
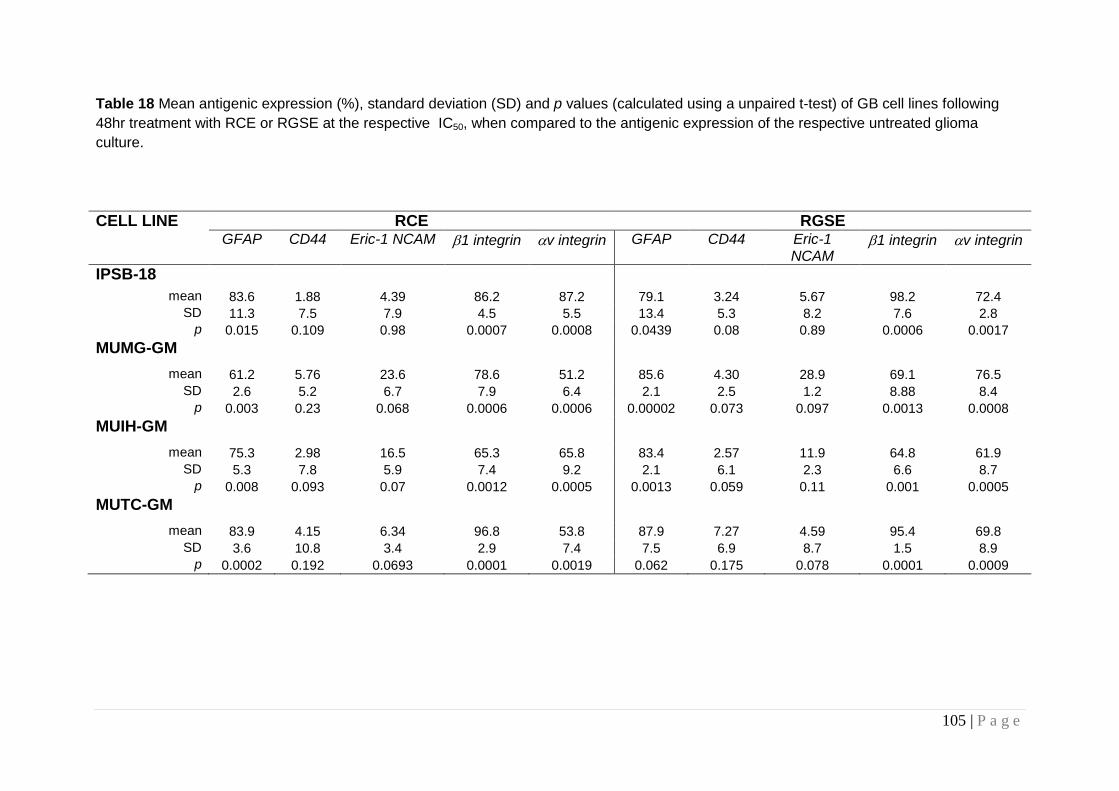
105 | P a g e
Table 18 Mean antigenic expression (%), standard deviation (SD) and p values (calculated using a unpaired t-test) of GB cell lines following
48hr treatment with RCE or RGSE at the respective IC50, when compared to the antigenic expression of the respective untreated glioma
culture.
CELL LINE RCE RGSE GFAP CD44 Eric-1 NCAM 1 integrin v integrin GFAP CD44 Eric-1
NCAM 1 integrin v integrin
IPSB-18 mean 83.6 1.88 4.39 86.2 87.2 79.1 3.24 5.67 98.2 72.4
SD 11.3 7.5 7.9 4.5 5.5 13.4 5.3 8.2 7.6 2.8
p 0.015 0.109 0.98 0.0007 0.0008 0.0439 0.08 0.89 0.0006 0.0017
MUMG-GM
mean 61.2 5.76 23.6 78.6 51.2 85.6 4.30 28.9 69.1 76.5
SD 2.6 5.2 6.7 7.9 6.4 2.1 2.5 1.2 8.88 8.4
p 0.003 0.23 0.068 0.0006 0.0006 0.00002 0.073 0.097 0.0013 0.0008
MUIH-GM
mean 75.3 2.98 16.5 65.3 65.8 83.4 2.57 11.9 64.8 61.9
SD 5.3 7.8 5.9 7.4 9.2 2.1 6.1 2.3 6.6 8.7
p 0.008 0.093 0.07 0.0012 0.0005 0.0013 0.059 0.11 0.001 0.0005
MUTC-GM
mean 83.9 4.15 6.34 96.8 53.8 87.9 7.27 4.59 95.4 69.8
SD 3.6 10.8 3.4 2.9 7.4 7.5 6.9 8.7 1.5 8.9
p 0.0002 0.192 0.0693 0.0001 0.0019 0.062 0.175 0.078 0.0001 0.0009

106 | P a g e
4.6 Analysis of Antigenic Expression using
Immunocytochemistry
To verify flow cytometry data, the expression of the same six antigens was
investigated using immunocytochemistry. Upon comparing the
immunocytochemical micrographs against the flow cytometry plots, it was
found that the same trends in antigenic expression changes were seen. Of the
six antigens measured on the IPSB-18 glioma cell culture, the most
discernable differences in expression, following treatment with either RCE or
RGSE, were seen with the and integrins (Fig 27). The change in
expression of GFAP, following treatment, was not as clearly seen in the
micrographs (Fig 27a). Table 19 summaries the intensity of fluorescence
visualized following 48hr treatment of the glioma cell cultures with the IC50 of
RCE or RGSE. The expression was measured over three fields under the
microscope.
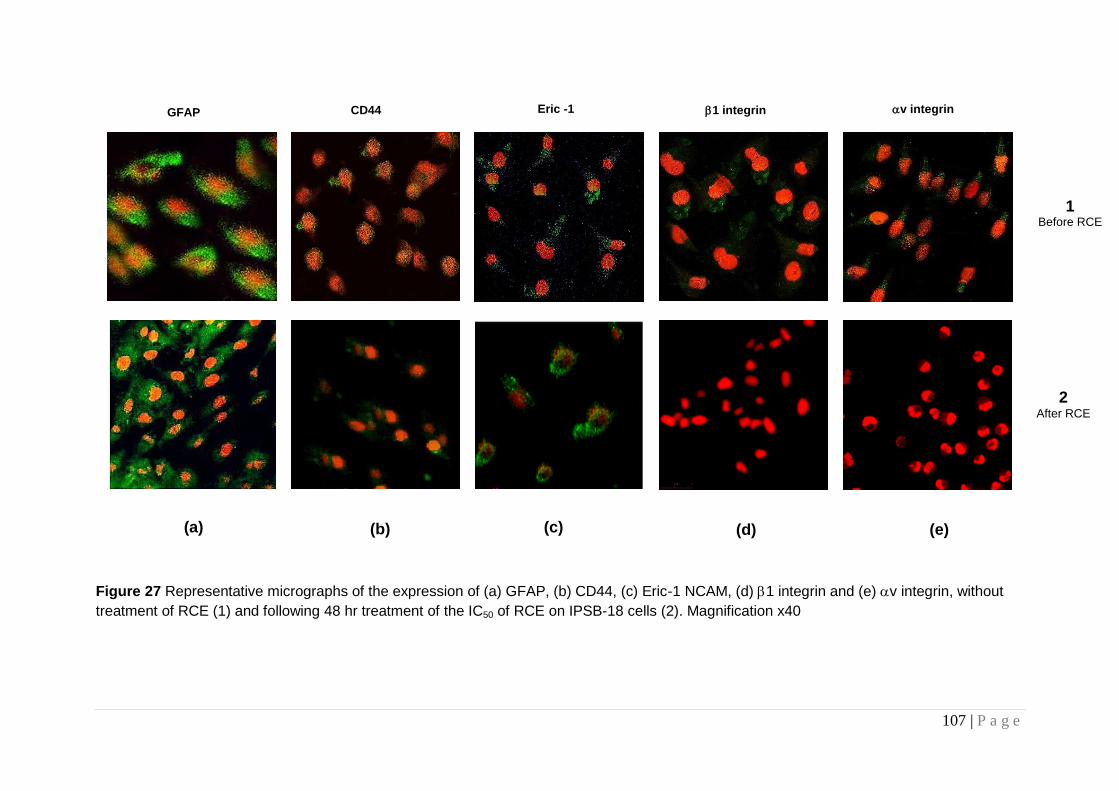
107 | P a g e
Figure 27 Representative micrographs of the expression of (a) GFAP, (b) CD44, (c) Eric-1 NCAM, (d) 1 integrin and (e) v integrin, without
treatment of RCE (1) and following 48 hr treatment of the IC50 of RCE on IPSB-18 cells (2). Magnification x40
(a) (e) (d) (c) (b)
2 After RCE
1 Before RCE
GFAP CD44 Eric -1 1 integrin v integrin

108 | P a g e
Table 19 Antigenic expression in glioma cell lines incubated with the respective IC50 of either RCE or RGSE for 48 hours, of five antigens were
visualized over three fields and compared to an untreated control (assumed 100%) (+ = positive expression, ± = some expression and – little to
no perceived expression).
CELL LINE RCE RGSE
GFAP CD44 Eric-1 NCAM 1 integrin v integrin GFAP CD44 Eric-1 NCAM 1 integrin v integrin
MUAB-C +++ ± ± ++ ± +++ ± - ++ ± IPSB-18 +++ ± ++ ± - +++ ± ± ± - MUMG-GM +++ - ++ ± - +++ ± ± ± - MUIH-GM ++ - ++ ± - ++ - + ± - MUTC-GM +++ - + ± - +++ - ++ - -

109 | P a g e
4.5 2D Change in Invasive Potential of Glioma Cell Cultures
Significant changes in the expression of the integrins suggested that there
would be a change in the invasive potential of the glioma cells subsequent to
treatment with either micronutrient. All the cultures were analysed in transwell
chambers (Chapter 2.7) after treatment with either micronutrient extract (at
the IC50), for 48 hours, including the control cell culture (MUAB-C). Three
fields were counted using a haemocytometer and each analysis was repeated
three times, resulting in a total of nine field counts per experiment.
Figure 28 Representative micrographs of the invasive potential of GBs (IPSB-18)
untreated (a) and after treatment with the respective IC50 of micronutrient extracts; (b)
RCE and (c) RGSE. Following treatment in the presence of either micronutrient fewer
cells diffused across the chamber indicating a reduction in invasive potential.
Micrographs illustrate cells which have invaded. Magnification x40
(a)
(b) (c)
Untreated
IPSB-18
IPSB-18 after RCE
treatment
IPSB-18 after RGSE
treatment

110 | P a g e
Figure 29 The mean number (three repetitions) of MUAB-C control cells which have
invaded across the ECM in the Boyden chamber. Invasion of cells treated with the
IC50 of RCE or RGSE were compared to untreated cells. The standard deviation is
displayed as error bars. Following an ANOVA analysis no significant difference was
found between the untreated and treated cultures
Figure 30 The mean number (three repetitions) of glioma cells invading across the
ECM of the Boyden chamber following 48 hour treatment with RCE as a percentage
of the positive control (clear DMEM). The standard deviation is displayed as error
bars. Significant differences calculated using Tukey HSD test are indicated (* p<0.05,
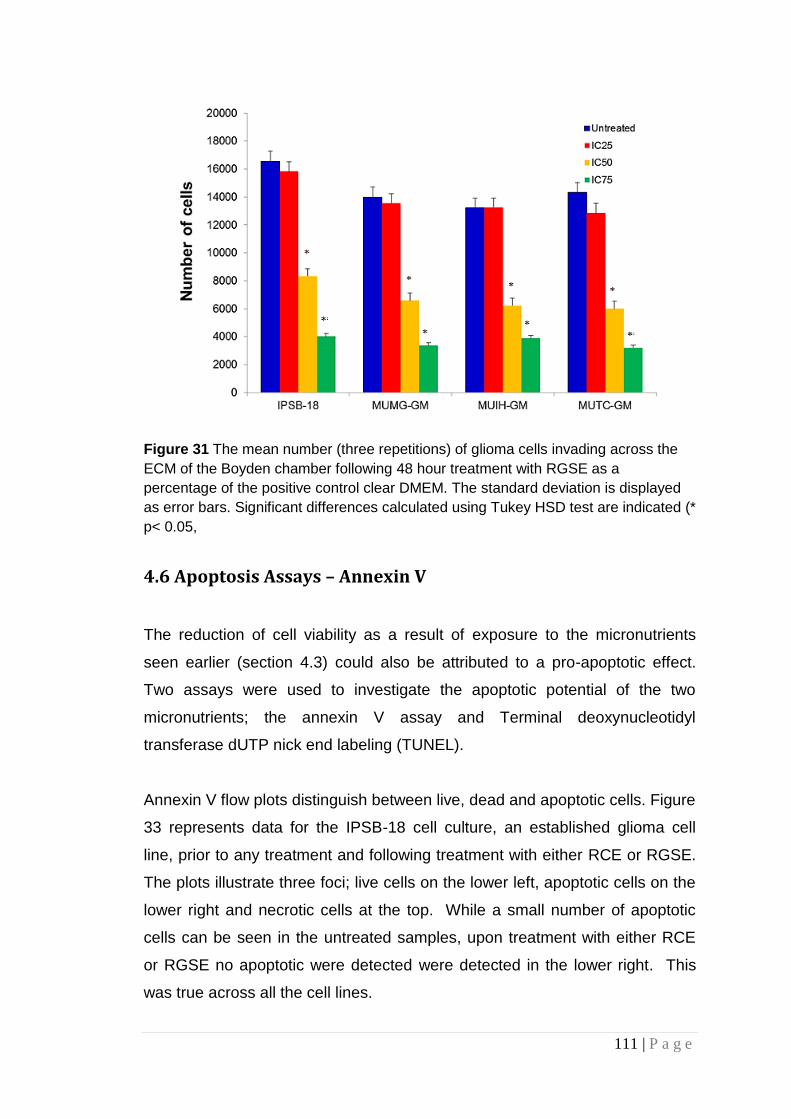
111 | P a g e
Figure 31 The mean number (three repetitions) of glioma cells invading across the
ECM of the Boyden chamber following 48 hour treatment with RGSE as a
percentage of the positive control clear DMEM. The standard deviation is displayed
as error bars. Significant differences calculated using Tukey HSD test are indicated (*
p< 0.05,
4.6 Apoptosis Assays – Annexin V
The reduction of cell viability as a result of exposure to the micronutrients
seen earlier (section 4.3) could also be attributed to a pro-apoptotic effect.
Two assays were used to investigate the apoptotic potential of the two
micronutrients; the annexin V assay and Terminal deoxynucleotidyl
transferase dUTP nick end labeling (TUNEL).
Annexin V flow plots distinguish between live, dead and apoptotic cells. Figure
33 represents data for the IPSB-18 cell culture, an established glioma cell
line, prior to any treatment and following treatment with either RCE or RGSE.
The plots illustrate three foci; live cells on the lower left, apoptotic cells on the
lower right and necrotic cells at the top. While a small number of apoptotic
cells can be seen in the untreated samples, upon treatment with either RCE
or RGSE no apoptotic were detected were detected in the lower right. This
was true across all the cell lines.

112 | P a g e
Figure 32 Apoptosis in the IPSB-18 glioma cell culture before (a) and after 48hr treatment with the IC50 of RCE (b) or RGSE (c). Data
highlighted in the square are dead cells. Data highlighted by the ovals shown live cells (left) and apoptotic cells (right).
(a) (b) (c)

113 | P a g e
Table 20 Summary of the percentage of live, apoptotic and necrotic cells after 48 hour treatment with either micronutrient extract (at the IC50)
(n=3). Change was measured in comparison to the respective untreated cell culture, using a t-test. No significant differences when compared to
untreated cells were noted.
CELL LINE RCE RGSE
Live Apoptotic Necrotic Live Apoptotic Necrotic
MUAB-C* 52.8 10.5 29.7 67.3 12.8 32.4
IPSB-18 3.02 0.05 84.5 1.75 0.01 95.5
MUMG-GM 2.04 0.03 79.9 1.25 0.02 89.4
MUIH-GM 2.14 0.08 85.7 2.01 0.01 91.6
MUTC-GM 1.95 0.04 90.3 0.95 0.01 89.1
Note: percentages do not add up to 100%. Cells not included were not viable *Control cell line
IC50 of RCE - IPSB-18, 0.4g/ml; MUMG-GM, 1 g/ml; MUTC-GM, 0.007g/ml; MUIH-GM, 0.98g/ml; MUPK-GM, 0.80g/ml
IC50 of RGSE - IPSB-18, 0.001g/ml; MUMG-GM, 0.0001g/ml; MUTC-GM, 0.5g/ml; MUIH-GM, 0.4g/ml; MUPK-GM, 0.0000001g/ml

114 | P a g e
No early pro-apoptotic effect was noted for any cell lines when compared to
MUAB-C. Instead, a mass of dead cells were visible in the uppermost
quadrants and some cells remained in the lower left quadrant (live cells). The
cells indicated in the uppermost right hand quadrants suggest perhaps the
occurance of late apoptosis. This indicated that, RCE and RGSE were indeed
cytotoxic, and perhaps a shorter exposure to the respective IC50s either
micronutrient extract would illustrate an early pro-apoptotic effect. To ensure
that this result was not a false negative an additional assay, the TUNEL
assay, was performed to support the analysis.
4.7 Apoptosis Assays - TUNEL
The TUNEL assay results suggested a similar outcome to that seen in the
annexin V plots. Apoptotic potential was indicated by the visualization of
fluorescence in three different fields of the cultures analysed. The
micrographs illustrated in Figure 34 illustrate that there were no visual
differences between the untreated glioma cells, which indicated little to no
fluorescence, and those treated with either RCE or RGSE. The lack of
fluorescence suggests very little or no apoptotic potential. This result was
seen across all the glioma cell cultures and the MUAB-C control culture. This
result suggested that neither RCE nor RGSE affect the apoptotic potential of
the glioma cells. Furthermore, due to the limited apoptotic potential seen in
the untreated cultures it may be speculated that these cell cultures do not
undergo apoptosis as their major pathway of cell death.

115 | P a g e
(a) (b) (c)
Figure 33 Micrographs representing apoptosis following the TUNEL assay in (a) untreated cells and following treatment with (b) RCE or (c)
RGSE for IPSB-18 (nuclei = blue, apoptotic cells = green). Magnification x40
IPSB-18 after RCE treatment IPSB-18 after RGSE treatment Untreatment

116 | P a g e
Figure 34 Micrograph representing apoptosis using the TUNEL assay in untreated
MUAB-C control cells (nuclei = blue, apoptotic cells = green).
The suggestion that neither RCE nor RGSE induce apoptosis, at
concentrations tested, in GB cell cultures was indicated by the results of the
two independent assays.

117 | P a g e
Table 21 Mean number of fluorescent cells counted
CELL LINE Untreated RCE RGSE
MUAB-C*
Mean 4 3 1
SD 3 2 1
IPSB-18
Mean 2 1 0
SD 1 1 0
MUMG-GM
Mean 1 0 0
SD 1 0 0
MUIH-GM
Mean 1 1 0
SD 1 1 0
MUTC-GM
Mean 3 0 0
SD 2 0 0
Counts across three fields in an average of three experiments totaling nine counts, following 48hr treatment with the respective micronutrient at the IC50. *Control cell line
IC50 of RCE - IPSB-18, 0.4g/ml; MUMG-GM, 1 g/ml; MUTC-GM, 0.007g/ml; MUIH-GM, 0.98g/ml;
MUPK-GM, 0.80g/ml
IC50 of RGSE - IPSB-18, 0.001g/ml; MUMG-GM, 0.0001g/ml; MUTC-GM, 0.5g/ml; MUIH-GM,
0.4g/ml; MUPK-GM, 0.0000001g/ml

118 | P a g e
4.8 Angiogenesis Assays – Tubule Formation Assay
This initial angiogenesis assay was carried out to determine whether either
micronutrient could be shown to have an anti-angiogenic effect. This was
achieved by culturing HUVEC cells and incubating these in the presence of
either RCE or RGSE. During the angiogenesis process HUVEC cells normally
exhibit tubule formation. In this assay the number of tubules formed after 48
hour treatment with either of the micronutrients were counted and plotted on a
histogram. Figure 36 illustrates the findings and suggests a propensity for
both micronutrient extracts to decrease tubule formation. In particular RCE
was found to have a greater anti-angiogenic effect when compared to RGSE.
Figure 35 The average numbers of tubules formed by HUVEC cells were counted in
three different fields, to examine the extent of the affect of RCE and RGSE on tubule
formation. The graph illustrates the counts taken as an average of three repetitions of
the experiment. Significant differences calculated using ANOVA are indicated (*
p<0.05, ** p<0.001).

119 | P a g e
4.9 Angiogenesis Assays – Co-Culture Assay
The number of tubules counted upon co-culturing HUVECs with each of the
glioblastoma cell lines were found to increase with time and could be seen to
protrude towards the GB cells (Fig 37). It was also visually noted that the cell
viability and the rate of growth of the HUVEC cells also increased upon
introduction of GB cells. When treated with either of the micronutrient extracts,
it was found that the number of tubules counted were fewer than those
counted in the untreated cultures.
(a)
(b)
Figure 36 Representative micrographs illustrating tubule development of HUVEC
cells (a) co-cultured with glioblastoma cells (the dotted line illustrates the delineation
of the GBs on the left and HUVECs on the right) and (b) not co-cultured with GBs,
without treatment with RCE or RGSE. Arrows indicate tubule formation. Cells were
cultured for 48 hours
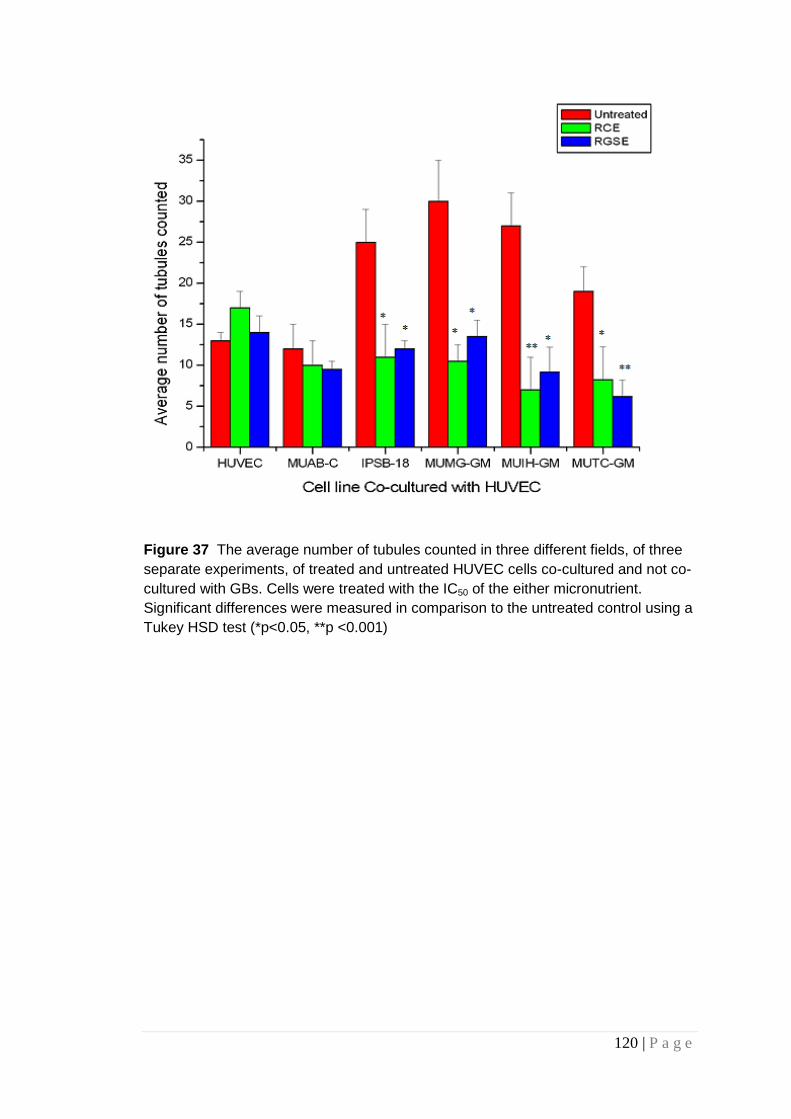
120 | P a g e
Figure 37 The average number of tubules counted in three different fields, of three
separate experiments, of treated and untreated HUVEC cells co-cultured and not co-
cultured with GBs. Cells were treated with the IC50 of the either micronutrient.
Significant differences were measured in comparison to the untreated control using a
Tukey HSD test (*p<0.05, **p <0.001)

121 | P a g e
4.10 Summary of Results
Analysis of both red clover extract (RCE) and red grape seed extract (RGSE)
found both micronutrient extracts had an effect on the glioma cell cultures
investigated, but not the control astrocytic cell culture MUAB-C. It can be seen
that both micronutrients reduce viability, decrease invasive potential and
decrease angiogenesis. However this study did not illustrate an effect on the
apoptotic potential of the glioma cultures or the control cell culture.
122 | P a g e
CHAPTER 5: Discussion
High grade gliomas, in particular glioblastoma multiforme (GB), continue to
have a poor prognosis. Conventional therapies such as radiotherapy and
chemotherapy have been largely unsuccessful in curing malignant brain
tumours (Biasoli 2014; Farah 2016). Survival rates for grade IV tumours are
as little as six to nine months (McKinney 2004; Ho 2014; Farah 2016), and
significant advances in conventional therapies are also limited (Weathers
2014 p.1; Tseng 2016). This has encouraged patients to investigate the
benefits of complementary and/or alternative medicines (Eisele 2014), which
could potentially alleviate the trauma associated with disease progression and
side effects of radiation and chemotherapy.
This study investigated the therapeutic effect of two micronutrient extracts,
specifically red clover extract and red grape seed extract in adult malignant
brain tumours in vitro. Both these extracts and their individual active
compounds are known to exhibit anticancer effects and and in some cases
the individual active compunds have been known to show to affect various
aspects of brain tumour development and growth, however, to the best of our
knowledge neither extract has been reported for their to affect biopsy derived
glioma cell cultures. The investigation of these two extracts analysed their
effect on cell viability, invasion and angiogenesis. The study also investigated
both micronutrient extracts for their effect on apoptosis. Both red clover
extract (RCE) and red grape seed extract (RGSE) were found to affect the
invasive and angiogenic potential of the glioma cultures but did not appear to
exhibit early apoptosis in the cells.
123 | P a g e
5.1 The Effect of Glioma Cell Heterogenity on Cell Culture
Survival
Initially the study evaluated four biopsy glioblastoma multiforme (GB) cultures
(grade IV), a primary cell culture (anaplastic astrocytoma grade III), a control
astrocytic cell culture and a human umbilical vein endothelial cell culture.
Biopsy cultures were chosen for experimentation as they offer several
advantages over autopsy-derived materials and animal models. Being
relatively fresh, the cell viability of the extracted and cultured biopsy cells is
high, in the range of at least 90% (Totowa 2001), thus providing cultured cells
of a similar phenotype as those in vivo. In vitro, however, unpredictability of
biopsy derived cultures is seen with increasing passage (Janus 1992).
Therefore, biopsy derived glioma cultures at no greater than passage 10 were
used as part of this study to maintain integrity.
As low passage cultures are extremely sensitive to the freezing and
resurrection process, unfortunately, the biopsy derived culture MUPK-GM,
initially used in this study was unable to be sustained. This failure to resurrect
might be due to the DMSO found in freezing media. DMSO when used as part
of freezing medium partially solubilizes the membrane of the cells (Yamashita
2000). It may be that the particular biopsy derived culture (MUPK-GM) was
particularly sensitive to DMSO in the freezing medium explaining the failed
resurrection. Further study on the affects of DMSO in freezing medium on
biopsy derived glioma cells is warranted.
The primary cell culture, IPSB-18 was evaluated at passage 20. IPSB-18 has
historically been used to assess the affect of other micronutrients on
characteristic biologic features such as cell viability and invasion (Rooprai
2001; Rooprai 2007; Rooprai personal communication). To retain consistency
with previous studies, and allow future comparisons of the various
micronutrient affects on glioma cell cultures, the therapeutic affects of both
RCE and RGSE were examined on this primary culture also.

124 | P a g e
5.2 Morphological Heterogeneity of Glioma Cell Cultures
Gliomas are highly heterogeneous and can consist of up to 14 different cell
sub-populations (Pilkington 2001; Marusyk 2010; Sottoriva 2013; Inda 2014;
Crespin 2016). Potter et al (2009) reported low passage cultures retain the
global tumour profile in vivo when compared to higher passage cultures. As a
result, each tumour is genotypically and phenotypically different from any
other, thus presenting the initial hurdle in developing a common treatment for
brain tumours (Rao 2003; Louis 2006; Mason 2008; Sathornsumetee 2008;
Wen 2008; Weathers 2014). Within this study heterogeneity of the glioma cell
cultures was seen using phase contrast microscopy.
The IPSB-18 primary GB culture exhibited small cells which grew rapidly in
small clumps. The biopsy derived cultures; MUMG-GM, MUIH-GM, MUTC-
GM and MUPK-GM exhibited larger, longer spindle like cells, with clear
differences in the morphology between cell cultures. The differences in the
morphology of the GB cultures may be assumed to be related to the
heterogeneous nature of the GB tumour (Bozkurt 2014, p1021). Further study
into the various cell types found within each of the biopsy cultures is required.
One such technique to investigate the different subpopulations within the
cultures is flow cytometry. Studies have shown by measuring the antigenic
expression of glioma cell cultures a number of different populations may be
identified (Prestegarden 2010). Flow cytometry assays in this study do
indicate differing percentages of antigenic expression between the glioma
cultures (Table 18), though further investigation would be required to
investigate the different subpopulations which exist between the cultures.
The control astrocytic cell culture, MUAB-C, was the only culture which
depicted the classical astrocytic ‘star shape’. This result was expected of the
normal astrocytic cell culture. MUAB-C cells were found to develop at a
slower rate when compared to the biopsy derived GB cultures, which not only
grew at a faster rate but only partially presented the classic ‘star shape’

125 | P a g e
illustrated by the control cell culture. Cancer cells are known to divide and
grow indefinitely though normal cells will only grow when required, this may
explain the differences seen between the GB cultures and normal astocytic
cultures. This was also illustrated by the population doubling times (PDTs).
5.3 Differences between Population Doubling Times of Glioma
Cultures
Most normal cell lines are only able to undergo a few subcultures, or
passages. These are called finite cell lines. The limited number of passages is
dictated by the population doubling time of a particular cell population, before
it stops growing due to aging (Hayflick 1985; Hayflick 1994).
The process of doubling the cell population can be described by growth
curves which show the population doubling time (PDT). The PDT indicates the
period of time during which the number of cells double in number. The
traditional curve illustrates three growth phases (as shown in Figure 36).
Initially the cells enter a latent period which shows no growth, called the lag
phase. This period allows the cells to recover from trypsinisation, reconstruct
the cytoskeleton, secrete matrix to aid attachment, and spread out across the
surface, thus re-entering the cell cycle (Figure 36). Subsequently an
exponential growth is noted known as the log phase. In this period the cell
population doubles over a definable period, known as the doubling time and
characteristic for each cell line. Increased growth results in eventual
overcrowding such that the entire surface is occupied. Overcrowding
eventually withdraws the cells from a growth cycle. This is illustrated as a
plateau or stationary phase. Some cells may differentiate during this phase;
others simply exit the cell cycle and return to G0 but retain viability. A
reduction in proliferation in the stationary phase can be attributed to a high
cell density and exhaustion of growth factors in the growth medium (Stoker
1973; Westermark 1975).

126 | P a g e
Figure 38 Growth Curve: Cell growth follows a three phase pattern. Initially the cells
the cells enter a lag phase during which no growth occurs this is followed by the log
phase. Here the cells increase exponentially. Finally, the cells enter the latent phase
where cells are unable to growth and develop any further (Laird 1965, p282).
MUAB-C was found to have a PDT of 72 hours and unlike the biopsy cultures
this time remained consistent with increasing passage number. IPSB-18
(passage 29-30) indicated the shortest PDT at 36 hours, when compared to
the longer PDTs of the lower passage biopsy derived cultures in particular
MUPK-GM took around two weeks to double its population. The population
doubling times (PDT) of the glioma cell cultures were statistically analysed to
compare each glioma culture with the control cell culture (MUAB-C). The
ANOVA analysis yielded a p value of 0.000 and as such a Tukey’s test was
performed to identify where the significant difference lay. As summarised in
Table 23 there appeared to be a statistically significant difference between the
PDT of each glioma culture compared to the normal astocytic cell culture,
MUAB-C (p=<0.01) (Table 23).
As previously discussed the differences between the PDTs may be due to the
greater heterogeneous nature of the biopsy derived cultures (Pilkington 1992).

127 | P a g e
Different cells, with differing phenotypes, may exhibit unique periods of
growth, which may be affected with increasing passage number. The cultures
were therefore only investigated at specific passages, to best retain an
assumed phenotypic consistency, throughout evaluations (Table 22).
Table 22 Summary of population doubling times of the cell cultures used in this
study. A p value following a Tukey test illustrates the comparison between the glioma
cultures and the control culture (MUAB-C – PDT = 72hr)
Cell Line
Population
doubling time
(hr)
p value
(when compared to
MUAB-C)
Passage
investigated
IPSB-18 36 <0.01 29-30
MUMG-GM 165 <0.01 4-6
MUIH-GM 210 <0.01 5-7
MUTC-GM 197 <0.01 4-6
MUPK-GM 347 <0.01 3-5
5.4 Cell Viability: The Toxic Effects of RCE and RGSE
5.4.1 DMSO Alters the Effects of Micronutrient Extracts
DMSO is known to permeate the cell membrane and interact with the cell
metabolism (Violante 2002; He 2012). Peng (2005) has suggested that DMSO
has no direct effects on the MTT assay and in fact DMSO is used to solubilise
the deposited tetrazolium salt prior to microtitre plate reading. It was therefore
assumed these results occurred due to DMSO being used to dissolve the
flavonoid extracts. DMSO has been known to display a variety of therapeutic
effects and cytotoxic effects (Santos 2003) and thus it is reasonable to
suggest DMSO does have an affect on cell viability of brain tumour cell
cultures investigated as part of this study. As this study showed DMSO had a
cytotoxic effect on glioma cultures, it is therefore suggested that, prior to
dissolving any extract in any solvent, the cells being treated should be initially
investigated for any toxicity the solvent may display towards the cell culture,
using a suitable viability assay.

128 | P a g e
5.4.2 Pigmentation of Micronutrient Extracts
Despite removing DMSO from the assay and replacing this with clear DMEM,
the results remained confusing; there was an apparent reduction in viability
following 48-hour treatment with low concentrations of either extract, followed
by an apparent increase in viability at higher concentrations, depicting a
biphasic curve (Figs 18 and 19). This increase in percentage viability at higher
concentrations, for both RCE and RGSE, suggested that both micronutrients
were encouraging cell growth and maintenance of cell populations between
concentrations of 50g/ml and 250g/ml. Similar results were also reported in
other studies (personal communication) and remain unexplained. Some
groups suggest a lag within the cell cycle (personal communication) though
this did not seem plausible as the investigation yielded an end-point result
rather that a continuous result.
Further analysis into the occurrence of the biphasic curve analysed phase
contrast micrographs of glioma cells following 48-hour treatment with either of
the micronutrient extracts. The micrographs have shown that at
concentrations greater than 10g/ml for RCE and 20g/ml for RGSE, more
than 90% cell death was induced. The biphasic curve therefore appears to be
an anomaly. Such a phenomenon has previously been reported using
concentrations of anthocyanidins (Elisia 2008). In this study, Elisia et al (2008)
showed that when determining the differences between various viability
assays, at concentrations of anthocyanidins between 0.4 to 9.4 mg/mL, the
results yielded were inconsistent.
As reported (Chapter 2) further analysis of the treated 96 well plates found
residues of the extracts remaining, which despite copious washing, were not
being entirely removed from the wells. The interference of the pigments in the
extracts on the viability assay absorbance value was determined by
measuring the optical density of RCE and RGSE. It was noted that RCE and
RGSE both interfere with absorbance values at 570nm at concentrations
higher than 1g/ml, as demonstrated by the peaks on the optical density

129 | P a g e
graphs at 570nm (Fig 24). As the residual colour of both RCE and RGSE
interfered with the final absorbance at 570nm it was determined that RCE and
RGSE should not be analysed at high concentrations using the MTT assay. It
is therefore recommended that prior to any viability investigation, the chosen
compound be tested for interference, at the desired concentrations, with the
appropriate wavelength.
Viability assays read at a wavelength of lower than 570nm, such as the MTS
assay (470nm), should be replaced by viability assays read at higher
wavelengths. An alternative to both the MTT and MTS assays, is using
DRAQ7™. This flow cytometry technique accurately differentiates and
quantifies live and dead/dying cells in a given cell sample, by using the
fluorescent dye DRAQ7™ (Biostatus). DRAQ7™ is a far-red emitting DNA-
specific dye, having its Exλmax at 488 nm especially for detection by flow
cytometry. It is impermeant to live cells but rapidly enters any leaky or dead
cell and stains its nuclear DNA. Unlike some nuclear dyes like PI, DRAQ7™
does not stain cytoplasmic RNA of viable cells and thus avoids false positive
results (Rieger, 2010). The low wavelength at which it is read also does not
interfere with micronutrient dyes thus alleviating the problem of interference
with absorbance readings, in the MTT assay.
As a reduced viability had been demonstrated by concentrations of RCE and
RGSE lower than 10g/ml it could be inferred the IC50 of each micronutrient
extract may be found at lower concentrations which would not interfere with
the use of the MTT assay. Table 24 summarizes the IC50 values for all the
glioma cultures.

130 | P a g e
Table 23 Summary of the IC50s of the micronutrients using various cell cultures
including primary cultures set up from biopsies, an existing low passage cell line.
Cell Culture Passage Number
IC50
RCE RGSE
IPSB-18 29-30 400ng/ml 1ng/ml
MUMG-GM 4-6 1 g/ml 0.1ng/ml
MUTC-GM 5-7 7ng/ml 500ng/ml
MUIH-GM 4-6 0.98g/ml 400ng/ml
MUPK-GM 3-5 0.80g/ml 0.1pg/ml
The IC50 for RCE and for RGSE for the glioma cultures all differ from one
another. This may reflect the previously discussed, heterogeneous natures of
these cultures. Previous researchers have reported that glioma cultures differ
phenotypically (Pilkington 2001, Sottoriva 2013). Each sub-cell population
within each culture may respond to a different concentration of micronutrient
extract. As such, differences in the glioma culture IC50s were expected to be
seen. This study showed significant differences in viability were seen within
the glioma cultures, as the concentration or RCE or RGSE was increased.
The glioma culture, IPSB-18 was found to have one of the lowest IC50s, for
RCE (400ng/ml). Knott et al. (1990) showed IPSB-18 consisted of a low
number of different cell populations. This reduced heterogenous nature of the
culture may explain the lower IC50. The effect of the micronutrients on each
cell type will be reacted upon in a different way so it can be speculated that
the more cell variations within a culture, more micronutrient is required to
target the cells. This is supported by the higher IC50’s seen for some of the
biopsy cultures which are assumed to be more heterogeneous.
Interestingly MUPK-GM and MUTC-GM did display increased sensitivity to
RGSE and RCE respectively, when compared to the other cell cultures (Table
24). Given the decreased cell heterogeneity found within IPSB-18, it may be
assumed MUPK-GM and MUTC-GM also exhibit a low number of different cell

131 | P a g e
populations. Further characterization of the sub populations within these
glioma cultures, using flow cytometry is warranted.
Despite limited analysis on the MUPK-GM cell culture this assay indicated a
reduction in cell viability following treatment with RCE or RGSE. This
suggested that MUPK-GM was likely to have yielded similar outcomes as the
other biopsy derived GB cultures. Given the reduction in cell viability of all the
glioma cultures, further investigation into why this occurred was required.
5.5 Changes in Environment Effect Antigenic Expression of
Glioma Cultures
Routinely cell biopsies and established cultures are characterised by
examining the antigenic expression of the cells. In this particular study flow
cytometry and immunocytochemistry were used to analyse the antigenic
expression of the glioma cultures and whether treatment with either of the
micronutrient extracts affected expression.
5.5.1 Changes in Microenvironment affect the Phenotype of the
Glioma Cells
Prior to evaluating the antigenic profile of the biopsy derived GB cultures, this
study appraised the microenvironment in which the cells were cultured;
specifically, serum supplement. Globally, the controversial topic of debate
around the choice of serum used to supplement growth media has resulted in
differing use of serum supplementation (Chimenti, 2014). Personal
communication with labs in Norway, who have adopted the use of newborn
calf serum instead of foetal calf serum to culture glioma cells in vitro,
encouraged the investigation into whether the microenvironmental properties,
of the culture media have an affect on glioma cells.
This study assessed the antigenic expression of seven antigens in five

132 | P a g e
established glioma cell cultures, with particular focus on glial fibrillary acidic
protein (GFAP) and galactocerbrosicide (Gal C) (Chapter 3). These two
indicative markers of cells of astrocytic and oligodendrocytic origin
respectively, were investigated specifically to support studies performed by
Raff et al. (1983) and Tenenbaum et al. (1996). The culture media in which
glioma cells were grown, were supplemented with either foetal calf serum
(FCS); the standard serum supplementation adopted, newborn calf serum
(NCS); the serum adopted by colleagues in Norway (personal communication)
and human serum (HS); to mimic glioma cell growth in vivo.
The change of antigenic expression found in this study can be seen in the
immunocytochemical micrographs of GFAP expression (Fig 13). In particular,
the expression of GFAP was shown to be down regulated with differing sera
supplementation, specifically FCS<NCS<HS. Upon analysis of the flow
cytochemical data (Table 13) statistically significant differences were seen in
three of the glioma cell cultures when compared to cells cultured in FCS,
namely A172 (NCS p=0.04), HF66 (NCS p=0.048; HS p=0.029) and U373
(NCS p=0.02; HS p=0.02).
A similar but opposing, result was seen when analyzing the expression of the
oligodendrocytic marker galactocerobroside (Gal C). Immunocytochemical
micrographs indicated altered expression with the antigens being up
regulated, specifically FCS>NCS>HS. Flow cytochemical results showed
significant differences in four of the five glioma cell cultures evaluated; IPSB-
18 (HS p=0.02), U251 (HS p=0.004), HF66 (NCS p= 0.0009; HS p= 0.0001)
and U373 (HS p=0.01).
These findings support similar occurrences reported in previous studies by
Raff et al (1983) and Tenenbaum et al (1996), reinforcing the notion that
microenvironmental changes manipulate cells to change phenotype. Studies
by Raff et al. (1983) explored the influences of external factors the cellular
environment, such as the presence or absence of foetal calf serum in the
culture medium, on the developmental pathways of astrocytes and

133 | P a g e
oligodendrocytes. They assessed morphological and immunocytochemical
criteria of the divergent pathways of cell development in the immature glia of
the rat optic nerve. They used A2B5 antibody for the detection of Type 2
astrocytes in this study and proposed that both fibrous astrocytes and
oligodendrocytes may be derived from a primitive precursor cell (the so-called
“O-2A” or oligodendrocyte Type 2 astrocyte progenitor cell) dependent upon
the influence of the environment. Subsequent studies showed that the
presence of GFAP-negative, A2B5-positive cells and GFAP-positive, A2B5-
positive cells in a malignant astrocytoma culture (IPSB-18) which provided
evidence that the O-2A progenitor and Type 2 astrocyte phenotypes occur
both in human neoplastic cells in vitro and in normal developing rat neural
tissue (Knott 1990; Pilkington 1992).
Furthermore, Tenebaum et al. (1996) identified the plasticity of
oligodendroglioma cells by successfully showing that, when taken from a rat
brain, they could be manipulated in the presence of serum supplementation,
into losing the expression of oligodendrocytic antigenic markers and acquiring
astrocytic markers. Upon re-introduction into the rat, these cells were able to
revert back to their original antigenic expression. They also confirmed that
human oligodendroglioma cells had a similar fate being induced, by the
absence or presence of serum, into oligodendrocytes or Type 2 astrocytes,
respectively.
Conclusions of these studies suggested the optimal use of serum
supplementation with the growth media for GB cultures was human serum as
this mimicked conditions in vivo. Unfortunately, as human serum is not readily
available and/or produced, studies may be subject to delay and it is not an
economically viable option. As such, to maintain consistency with previous
studies, investigation into the effects of other micronutrient extracts on IPSB-
18 and other glioma cultures (Rooprai 2007), the remainder of this study grew
the glioma cells in growth media supplemented with 10% FCS, unless
otherwise indicated. Further investigation into trans-differentiation of glioma
cells, cultured in the presence of FCS as the growth supplement of choice, is

134 | P a g e
warranted, with the aim to develop a media supplement able to imitate
conditions in vivo.
5.5.2 Micronutients Alter Antigenic Expression of Glioma Cell
Cultures
Evaluation of the glioma cell cultures investigated the expression of five
antigens; GFAP, CD44, NCAM eric-1, v and 1. These antigens were
chosen to retain uniformity with studies performed previously on glioma cell
lines, assessing the effect of other micronutrient extracts (Rooprai, 2007).
Flow cytochemical data compared the antigenic expression of untreated
glioma cultures vs. glioma cultures following 48-hour treatment with either
RCE or RGSE. The immunocytochemical data illustrated the approximate
percentage expression based on the amount of fluorescence visualized.
GFAP expression
Glial fibrillary acidic protein (GFAP) was first described in 1971 by Eng et al.
(1971) and is a member of the cytoskeletal protein family and is widely
expressed in astroglial cells and in neural stem cells (Eng 1971; Doetsch
2003). It is also expressed in astroglial tumours, such as astrocytomas and
GB (Jacque, 1978; Hamaya, 1985; Abaza, 1998). The expression of GFAP
provided a positive control confirming the integrity of the cultures used as
astrocytic in origin. Flow cytochemical data indicated that GFAP expression in
IPSB-18 cells treated with RCE was found to be significantly down-regulated
compared to untreated IPSB-18 cells (p = 0.015). When treated with RGSE
however, although the expression of GFAP appeared to be down regulated,
this change did not reach significance (p=0.0439). This change in antigenic
expression was mimicked by the other glioma cultures (Table 18).
Immunocytochemical data did not however confirm a down regulation in the
expression of GFAP.

135 | P a g e
CD44 expression
CD44, a cell surface adhesion molecule (Pilkington 1993; Radotra 1998; Ariza
1995; Li 1995) and a principal receptor for hyaluronan (HA) (Aruffo 1990), is a
glycosaminoglycan found in the extra cellular matrix (ECM). CD44 has been
implicated in the invasive process (Merzak 1994) and has been suggested as
a biomarker of cancer stem like cells (Yan 2015). As part of the evaluation of
the effects of RCE and RGSE, investigation into the expression of CD44 by
gliomal cells following treatment with the micronutrients was carried out.
Neither flow cytochemical nor immunocytochemical data indicated a
significant change in expression of CD44 by the cell lines under investigation
following treatment with RCE and RGSE (Table 18 and 19). CD44 is
overexpressed in brain tumours and is involved in the invasive process and
cell-cell adhesion (Merzak, 1994). Therefore, a down regulation would have
indicated a possible anti-invasive effect. A slight decrease in CD44 was seen
in the immunocytochemical micrographs of glioma cultures following
treatment with RCE and RGSE when compared to the untreated glioma
cultures, however, analysis of the flow cytochemical data found that this was
not statistically different (p=>0.05). RCE and RGSE do not appear to affect
the pathways underlying the invasive process within GBs as indicated by
expression of this antigen. Although CD44 is known to mediate invasion in
gliomas (Merzak 1994; Yoshida 2012) and has previously been shown to be
down regulated following treatment with micronutrient extracts (Rooprai
2007). Additionally, grape seed extract and its individual components have
been shown to downregulate CD44 in other cancers, including colon cancer
(Kumar 2014) and breast cancer (Ouhtit 2014). Curcumin is also amongst one
of the other micronutrients which has demonstrated a clear down regulation of
CD44 (Chung 2015). Further investigation into the expression of CD44 is
required.

136 | P a g e
Eric-1 NCAM expression
Eric-1 NCAM is a cell surface glycoprotein that also mediates cell-cell
adhesion independent of Ca2+ (Keilhauer 1985), and plays an important role
in neurite outgrowth and fasciculation (Appel 1993). Eric-1 NCAM has also
been found to be involved in migration/invasion (Gratsa 1997). Although no
significant difference was found in the expression of Eric-1 NCAM between
the treated and untreated cultures (p=0.06-0.11) (Table 18),
immunocytochemical micrographs indicated a down regulation. This therefore
suggested further study may be warranted.
As both CD44 and Eric-1 NCAM exhibited only a slight down regulation in
expression in immunocytochemical data but analysis of the flow cytochemical
data did not indicate a significant change, further investigation into the anti-
invasive potential of both micronutrient extracts was required.
V integrin expression
In malignant gliomas, the expression of many integrins, including v and 1
are reportedly increased, relative to their levels in normal brain tissue
(Gingras, 1995; Rooprai, 1999; Paulus, 1993).
The expression of v intergrin was found to be down regulated in all the IPSB-
18 cell cultures following treatment with RCE (p<0.001) and RGSE (p<0.001)
when compared to the untreated cell culture. A similar result was found for the
biopsy derived glioma cultures (p<0.001) (Table 18). Immunocytochemical
data also depicted a clear down regulation in the expression of V when
compared to untreated cell (Fig 28).
v is unique in that it can pair with multiple subunits to form five recognized
receptors, v1, v3, v5, v6 and v8 (Nemeth 2007). Integrins v3
and v5 are consistently overexpressed in GBs in comparison, other
integrins and play an important role in gliomagenesis, progression, invasion

137 | P a g e
and angiogenesis (Brooks 1994; Friedlander 1995; Hynes 2002; D’Abaco
2007). Integrin αvβ3 in particular, is necessary for the formation, survival, and
maturation of newly formed blood vessels (Brooks 1994). Therefore, a down
regulation in αv suggests that RCE and RGSE have anti-invasive and anti-
angiogenic potential. Blandin et al (2016), suggested a downregulation of αv
integrin may be useful to reduce invasion of GBs.
1 integrin expression
1 integrin is also highly expressed in glioma cell lines, when compared to
normal brain tissue (Gingras 1995; Paulus 1993). It has been shown that
blocking the 1 integrin can reduce invasive potential in glioma cell lines
(Tysnes, 1996; Friedlander, 1996; Tonn, 1998).
Following 48-hour treatment of IPSB-18 with RCE or RGSE a down regulation
of 1 integrin was seen. Following comparison of this against the untreated
cells, the down regulation was found to be statistically significant for both RCE
(p<0.001) and RGSE (p<0.01) (Table 18). Down regulation of 1 integrin
expression was also found following treatment with RCE or RGSE in all the
biopsy derived cultures (p<0.001). Immunocytochemical micrographs also
illustrated a clear down regulation in expression of 1 integrin (Fig 28).
1-integrin initiated invasion is likely mediated by the 31 integrin receptor,
although several subunits can pair with 1 integrin (Tysnes 1996; Knott 1998;
Fukushima 1998). The data for the expression of integrins supported the anti-
invasive capabilities of both micronutrients.
138 | P a g e
5.6 Diffuse Invasion Reduced After Micronutrient Treatement
Various molecules are implicated in the invasive potential of gliomas,
including CD44, NCAM and integrins. Investigation into the antigenic
expression of these molecules may support the suggestion both RCE and
RGSE may exhibit anti-invasive potential, however the difference in
expression of CD44 and NCAM were not found to be statistically significant.
Therefore, to investigate the anti-invasive potential of both micronutrient
extracts further, modified Boyden chambers were used. This 2-dimensional
study was performed using all the glioma cultures and the control cell line
MUAB-C. Cells were seeded into the modified Boyden chamber above a layer
of extra cellular matrix (ECM). The cells which migrated through the chamber
and across the ECM were then counted.
When analysed, the normal cell culture MUAB-C, very little invasion.
Examination of data found that this was based on only 1 or 2 cells migrating
through the chamber. Given MUAB-C was assumed to have ‘no’ invasive
potential, incubation with RCE or RGSE would determine if either
micronutrient promoted the invasive process. Neither of the micronutrient
extracts was found to have an effect on invasive potential of MUAB-C, with
the average invasion remaining at 0%. This indicated RCE and RGSE do not
promote invasion in MUAB-C.
The glioma cultures (Fig 29) did initially display invasive potential. The anti-
invasive effects of both micronutrient extracts are visible in Figures 29, 31 and
32 where upon treatment with RCE and RGSE, the number of invading glioma
cells reduced dramatically. Invasion is a multi process biological feature, and
it may only be speculated which pathway may be affected. Recent research
has identified several key molecules that regulate GB cell migration and
invasion, and may serve as attractive targets. Similarly, Zhou et al (2016),
found that grape seed extract also demonstrated a reduction in invasion in
luncg cancer.

139 | P a g e
One such explanation for the anti-invasive potential may lie in the down
regulation of integrins and their interaction with the cells migratory processes.
Integrins, in particular 1 subunit, play an important role in glioma biology and
its expression has been correlated with the invasive behavior of glioma
(Paulus, 1996) It is supported by the observation that inhibition of 1 integrin
leads to decreased motility while inhibition of v integrin results in increased
motility. This correlates with data previously depicted by flow cytochemical
and immunocytochemical data.
Another possible explanation may lie in the effect of the micronutrients on
matrix metalloproteinanses (MMPs). MMPs play a vital role in invasion by
paving a pathway for the malignant tissue to migrate or invade along. Down
regulation of various MMPs in the presence of micronutrients has previously
been reported (Rooprai 2007). As such, inhibition of MMPs could aid a
reduction in invasion ultimately preventing recurrence of tumour growth.
Preliminary flow cytochemical data illustrated a slight down regulation of MMP
2 and 9 following treatment of glioma cell cultures with either of the
micronutrients. Initial findings indicated MMP2, an initiator of both invasion
and angiogenesis, was reduced in treated glioma cells, when compared to
untreated cells. Recent studies in to the ‘knock-out’ of MircoRNAs for
membrane type MMPs found that this downregulation suppressed the
malignancy of gliomas cells in vitro (Sakr 2016), supporting the suggestion
that targeting MMPs could reduce the likelihood of both invasion and
angiogenesis.
Grape seed extract has been shown in breast cancer (Dinicola 2014) to
downregulate the expression of both MMP2 and MMP9. Further investigation
into the expression of MMPs could provide an explanation into the pathways
interrupted by RCE or RGSE during invasion.
Other possible targets to investigate the affect of the invasive potential include
tGLI1 (a novel splice variant of GLI1), SDF-1, Pin1, OPN, MGP, ADAM19,

140 | P a g e
VAT-1, Sema3A-neuropilin-1, and AJAP1. (Nakada, 2010; Mertsch 2009; Lo
2009; Kenig 2010; Bagci 2009; Atkinson 2009; Lamour 2010; Qi 2009;
Mertsch 2009).
5.7 Late Pro Apoptotic Potential: A Qualitative Indication
In the normal brain, cells of the CNS exhibit differences in their resistance to
the automated process of apoptosis, the most resistant of cells being
microglia and the most vulnerable, neurons. The sensitivity of glial cells lies
between the two extremes (Salgado 2007). During malignant progression,
tumour cells acquire an increased resistance to apoptotic agents and
procedures. In particular the invading cells of GBs are less sensitive to
apoptosis, resulting in a high frequency of relapse (LeFrank 2005). Two
assays were performed to determine whether either of the micronutrients
displayed pro-apoptotic characteristics, annexin V and the TUNEL assay.
The control cell line (MUAB-C) displayed a small number of apoptotic cells
when analysed with the annexin V assay (an average of 10%). This remained
consistent following treatment with RCE (10.5%) or RGSE (12.8%). The
TUNEL assay illustrated apoptotic cells as fluorescent. The number of
fluorescent cells was then counted in an average of three fields. The results
were similar to those in the annexin V assay with only three or four fluorescent
cells in each field counted (Fig 35).
Untreated IPSB-18 glioma cells displayed a small proportion of apoptotic cells
(2.9 %) (Fig 33). Following treatment with RCE and RGSE the percentage of
apoptotic cells decreased (0.05% and 0.01% respectively), though this
change was not significant. Instead, the majority of cells appeared in the
necrosis quadrant of the annexin V plot. The TUNEL assay micrographs also
showed an average of 0-1 fluorescent cells in each field (Fig 34). This result
was seen across all the biopsy derived glioma cultures (Table 20).
141 | P a g e
Although a slight reduction in apoptotic potential was illustrated in treated
glioma cells when compared to untreated cells, this was not a significant
change with only a difference of around one or two cells. It can therefore be
suggested that glioma cells do not exhibit an apoptotic affect following
treatment with either RCE or RGSE, though cell death had occurred.
Apoptosis is rarely seen in glioma cultures, possibly as a result of the
relationship between rates of apoptosis and tumor grade, not being straight
forward, though one explanation could be attributed to integrins, in particular
the expression of v3. As more cells enter an invasive state their sensitivity
for apoptosis decreases. This phenomenon can be attributed to the enhanced
expression of v3, in the marginals infiltrating zones (Sarafian 2009). v3
serves as a basic regulator of proliferation, invasion and angiogenesis (Bogler
2005). Integrins bind to a variety of ECM ligands including vitronectin,
fibronectin, fibrinogen, thrombospondin, proteolyzed collagen, von Willebrand
factor and osteopontin. Such ligation activates intracellular signaling pathways
that promote cell survival, proliferation, motility and inhibit apoptosis (Bogler
2005; Horton 1997; Stupack 2002).
As discussed earlier, the expression of the v was found to be down
regulated in all treated glioma cultures, when compared to the control cell
culture MUAB-C. Preliminary investigation of the 3 integrin also exhibited a
very slight upregulation of antigenic expression when compared to the normal
brain tissue in vitro (Fig 39).This would suggest more cells should be sensitive
to the apopotic pathway, however, the limited apoptotic potential displayed
when analysed using both annexin V and TUNEL assays was not significant
and therefore does not suggest that RCE or RGSE induce apoptosis.

142 | P a g e
a b
Figure 39 The expression of 3 integrin in a) normal brain tissue and b) glioma
cultures. 3 expression is increased in malignant tissue. When in compound form,
v3, thus resulting in a resistance to apoptosis and a vulnerability to invasion and
angiogenesis.
These findings suggest the dominant form of cell death in glioblastoma is
necrosis rather than apoptosis, and this histological feature is part of the
definition of this tumor type (Kleihues 2000). This has been verified in recent
literature which states that despite apoptosis being caspase dependent and
necrosis caspase independent, both these pathways share common starting
points such as death domains like p55 TNF receptor (TNF-RI) and Fas and
the adapter protein FADD. Both micronutrients in particular RGSE exhibit
antioxidant properties and are thus are known to reduce free radicals (Bagchi
2000) and induce apoptosis mainly by targeting Fas death domain. However,
prolonged activation of Fas without phagocytosis of apoptotic cells is seen to
induce cell death via necrosis in vitro in cell lines (Eisele 2011). In the annexin
V plots the majority of cells lay in the live or dead quadrants, with one or two
cells in the apoptotic quadrant, suggesting RCE and RGSE exhibit a possible
necrotic effect.
An explanation for such an occurrence can be related to defective apoptosis
signaling. This may be caused by increased expression of anti-apoptotic
molecules or by impaired function of pro-apoptotic molecules (Igney and

143 | P a g e
Krammer 2002). Examples of such mechanisms are illustrated by inhibitor of
apoptosis proteins (IAPs) such as survivin. This is expressed at high levels in
many tumours and has been reported to be associated with noncompliant
disease and poor prognosis (Salvesen 2002; Altieri 2003). It has been
reported that glioblastoma cultures are positive for survivin expression
(Chakravarti A, 2002). A downregulation of survivin combined with
administration of the chemotherapeutic agents temozolomide or etoposide
was has been shown to exhibit a synergistic cytotoxic effect on GBs (Cruz
2016). Such IAPs can inhibit effector caspases, including caspase 3, 6 and 7,
at the core of the apoptotic pathways. Therefore, therapeutic modulation of
IAPs could target a key control point in cancer resistance (Goyal 2001).
Although neither RCE nor RGSE instigated apoptosis alone, it could be
postulated, in the presence of another factor, either micronutrient could
potentially exhibit pro-apoptotic features. Apoptosis is rarely seen in glioma
cultures though some studies have increased the affinity for glioma cells to
undergo apoptosis. It was reported by Gondi et al. (2010) that in the presence
of human umbilical cord cells, enriched in CD44 and CD133, gliomas cultures,
underwent apoptosis. This suggests glioma cells have the ability to
demonstrate apoptotic behavior. Further investigation, therefore, is warranted
into adjuvant compounds which together with the chosen micronutrients could
induce apoptosis.
Alternatively, autophagy of glioma cells could have occurred. Autophagy is
accepted as the mechanism by which glioma cells undergo programmed cell
death when the apoptotic pathway is inhibited (LeFrank 2005). It operates in
stress conditions such as low oxygen, commonly found in GBs.
Proautophagic drugs block the mechanistic target of rapamycin (mTOR) a
serine/threonine protein kinase that regulates cell growth, cell proliferation,
cell motility, cell survival, protein synthesis, and transcription (Hay 2004;
Beevers 2006; Fulda 2015). mTOR belongs to the phosphatidylinositol 3-
kinase-related kinase protein family. Expression of of mTOR in GBs is up
regulated and results in a resistance to apoptosis and autophagy. Further

144 | P a g e
study is warranted into the effects of RCE or RGSE on the expression of
mTOR and their ability to induce autophagy.
5.8 Anti-angiogenic potential of the micronutrients
In addition to being highly invasive, GBs are extremely vascular.
Angiogenesis plays an important role in GB growth. Anti-angiogenesis based
therapies have been shown to be effective in reducing vascularization in GB
patients. However, therapeutic resistance can develop in patients, suggesting
that GB cells are capable of altering their signaling pathway (Soda 2013).
Therefore, it is important to identify novel angiogenic factors that play
essential roles in tumor angiogenesis and GB progression.
This study found that RCE and RGSE both exhibit anti-angiogenic activity.
Though the mechanisms by which they do this, have not been confirmed. It is
clear that when human umbilical vein endothelial cells (HUVEC) are treated
with either micronutrient the number of tubules produced decrease when
compared to untreated HUVECs (Fig 36). The reduction in the percentage
number of tubules reduced from 100%, in untreated cells to 55% (p=<0.05)
following treatment RCE and 50% (p=<0.001) when treated with RGSE. This
suggested both micronutrients do exhibit anti-angiogenic properties.
This phenomenon was also depicted when HUVECs were co-cultured against
glioma cells (Fig 38). The percentage number of tubules reduced significantly
(p=<0.05), following treatment with either RCE or RGSE.
These results supported studies by Su et al (2005), who illustrated a reduced
number of blood vessels in bladder cancer cells both in vitro and in vivo, after
cells had been treated with genistein, the active compound found in RCE.
Additionally grape seed extracts have been reported to reduce angiogenesis
in breast cancer cells and prostate cancer cells in vitro (Kaur 2009).
Furthermore this study suggested the mechanism by which grape seed

145 | P a g e
extracts inhibit this biological feature, is by inhibiting vascular endothelial
growth factor (VEGF) (Wen 2008; Kanavi 2014). It is possible, therefore, for
RCE and/or RGSE to affect any number of factors in the angiogenesis
pathways including VEGF and MMPs.
In brain tumors, VEGF was shown to be over expressed in gliomas compared
to normal tissue (Osterberg 2016; Li 2009; Plate 1993; 1992). VEGF has been
implicated as a central mediator of angiogenesis in GBs. In vitro and in vivo
studies have confirmed a correlation between tumor grade and VEGF
expression in gliomas (Kawai 2014). Additionally, studies using animal models
have shown that inhibiting VEGF function also inhibits growth of glioma cells
in vivo and causes regression of blood vessels (Maity 2000). Osterberg et al.
(2016) illustrated myeloid cell-restricted VEGF-A deficiency led growth delays
in gliomas. VEGF is known to enhance vascular permeability (Nagy 1989) and
studies have shown that antibodies specific to VEGF reduced angiogenesis
(Alishekevitz 2014).
In addition some MMPs are thought to mediate angiogenesis (Nuttall 2003).
MMP-2 and MMP-9 are highly expressed in astrocytic tumours and their
expression positively correlates with tumour grade, especially those of MMP-9
(Kargiotis 2006). MMPs are involved in proteolytic degradation of ECM
proteins to facilitate invasion and angiogenesis (Binder 2002). MMP-9 in
particular, has also been shown to activate TGF- (Yu 2000) and to increase
availability of VEGF (Bergers 2000), in turn promoting angiogenesis.
As this study has shown that both micronutrients have anti-invasive and anti-
angiogenic properties it is possible they are acting through down-regulation of
MMPs. Another MMP, which belongs to the membrane-type MMPs (MT-
MMPs), MT1-MMP is up-regulated in malignant gliomas with it’s expression is
associated with tumour invasion and angiogenesis (Forsyth 1999; Nakada
1998). MT-MMPs play a part in both invasion and angiogenesis (Hotary 2000;
Hiraoka 1998) by cleaving ECM substrates and cell surface receptors,
including integrins. MT1-MMP mediates activation of MMP2, which binds to

146 | P a g e
integrin v3 that promotes MMP2 maturation (Deryugina 2001). Interestingly,
it has been shown that two growth factor-cytokine dependent pathways of
angiogenesis exist that are promoted by distinct integrins one dependent on
v3 and the other dependent on v5 (Friedlander 1995). It has been
reported, that the key role of v3 integrin is in the survival and maturation of
newly formed blood vessels (Ucuzian 2010). By using antagonists of this
integrin, after angiogenesis is initiated, such antagonists induce apoptosis of
the proliferating vascular cells without affecting pre-existing quiescent vessels
(Brooks 1994), probably because v3 is shown to be selectively up-
regulated in proliferating vascular cells (Brooks 1994). Thus the down
regulation of v could suggest decreased maturation of MMP2 and thus a
decrease in the survival of newly formed blood vessels and thus
angiogenesis. Additionally over expression of MT1-MMP in glioma cells
results in up-regulation of VEGF secretion and consequently increased
invasion of endothelial cells and angiogenesis (Deryngina 2002).
There are many mechanisms and pathways by which RCE and RGSE display
anti-angiogenic potential, which warrant further investigation. As has been
illustrated in this study invasion and angiogenesis are both affected by both
micronutrients and therefore it is probable the mechanism by which they are
both inhibited relies on the same molecules including integrins, MMPs and
growth factors such as VEGF.

147 | P a g e
Conclusion
This study examined the effect of red clover extract and red grape seed
extract on cell viability, invasive potential, apoptotic potential and angiogenic
potential in malignant human adult brain tumours in vitro. The evaluation of
both micronutrient extracts indicated that both micronutrient extracts appear to
display anti-cancer potential.
It was reported that both micronutrients affect glioma cell viability, although it
was identified that neither micronutrient exhibits pro-apoptotic properties
implying cell viability may be resultant of an alternative pathway. The study
also indicated both micronutrients affect the ability of glioma cells to invade
across an extracellular matrix in vitro, thus suggesting both micronutrients
have an effect on invasive potential. Examination of tubule viability and growth
following treatment with either micronutrient resulted in a reduction of tubules
when compared to untreated glioma cells, suggesting both micronutrients
display an anti-angiogenic affect. This study has provided a firm foundation for
further investigation into, the underlying mechanisms in which both
micronutrient extracts affect cell viability, invasion and angiogenesis in human
adult brain tumours.
This novel find strongly suggests the vital need to investigate natural
compounds such as the micronutrients within red clover extract and red grape
seed extract for therapeutic roles for brain tumour therapy.

148 | P a g e
REFERNCES

149 | P a g e
References
Adams J. (2004). Exploring the Interface between Complementary and
Alternative Medicine (CAM) and Rural General Practice: A Call for
Research. Health & Place. 10, (3), p. 285-287.
Adams J., Sibbritt D. and Lui C. (2011). The Urban-Rural Divide in
Complementary and Alternative Medicine Use: A Longitudinal Study of
10,638 Women. BMC Complementary and Alternative Medicine. 11, (1), p.
2.
Adams J., Sibbritt D., Easthope G. and Young A. (2003). The Profile of
Women Who Consult Alternative Health Practitioners in Australia. Medical
Journal of Australia. 179, p. 297-300.
Adams, S. M., Aksenova, M. V., Aksenov, M. Y., Mactutus, C. F., & Booze,
R. M. (2012). Soy Isoflavones Genistein and Daidzein Exert Anti-Apoptotic
Actions via a Selective ER-mediated Mechanism in Neurons following HIV-
1 Tat1–86 Exposure. PLoS ONE. 7, (5), e37540.
Adjakly M., Ngollo M., Boiteux J.P., Bignon Y.J., Guy L., and Bernard-
Gallon D. (2013) Review: Genistein and Daidzein: Different Molecular
Effects on Prostate Cancer. Anticancer Res.33, (1), p. 39-44
Adlercreutz H. (2002). Phytoestrogens and Breast Cancer. The Journal of
Steroid Biochemistry and Molecular Biology. 83, (1-5), p. 113-118.
Agarwal C., Singh R.P. and Agarwal R. (2002). Grape Seed Extract
Induces Apoptotic Death of Human Prostate Carcinoma Du145 Cells Via
Caspases Activation Accompanied By Dissipation of Mitochondrial
Membrane Potential and Cytochrome C Release. Carcinogenesis. 23,
(11), p. 1869-1876.

150 | P a g e
Ahonen M, Poukkula M, Baker AH, Kashiwagi M, Nagase H, Eriksson JE,
Kähäri VM. (2003). Tissue inhibitor of metalloproteinases-3 induces
apoptosis in melanoma cells by stabilization of death receptors.
Oncogene. 22, (14), p. 2121-34.
Akiyama T, Ishida J, Nakagawa S, Ogawara H, Watanabe S, Itoh N,
Shibuya M and Fukami Y. (1987). Genistein, a specific inhibitor of
tyrosine-specific protein kinases. J Biol Chem. 262, p. 5592-5595.
Alishekevitz D., Bril R., Loven D., Miller V., Voloshin T., Gingis-Velistki S.,
Fremder E., Scherer S.J., Shaked Y. (2014). Differential Therapeutic
effects of Anti–VEGF-A Antibody in Different Tumor Models: Implications
for Choosing Appropriate Tumor Models for Drug Testing. Mol Cancer
Ther. 13, p. 202-213.
Alonso L. and Fuchs E. (2003). Stem Cells of the Skin Epithelium.
Proceedings of the National Academy of Sciences of the United States of
America. 100, (1), p. 11830-11835.
Appel F., Holm J., Conscience J.F. and Schachner M. (1993). Several
Extracellular Domains of The Neural Cell Adhesion Molecule L1 are
involved in Neurite Outgrowth and Cell Body Adhesion. The Journal of
Neuroscience, 13, (11), p. 4764-4775.
Apte S., Olsen B.R. and Murphy G. (1995). The gene structure of tissue
inhibitor of metalloproteinases (TIMP)-3 and its inhibitory activities define
the distinct TIMP gene family. J Biol Chem. 270, p. 14313–14318.
Arcury T.A., Bell R.A., Snively B.M., Smith S.L., Skelly A.H., Wetmore,
L.K. and Quandt, S.A. (2006). Complementary and Alternative Medicine
Use as Health Self-Management: Rural Older Adults with Diabetes.
Journals of Gerontology. 61b, (2), p. 562-570.

151 | P a g e
Arias H.R., Richards V.E., Ng D., Ghafoori M.E., Le V. and Mousa S.A.
(2009). Role of Non-Neuronal Nicotinic Acetylcholine Receptors in
Angiogenesis. The International Journal of Biochemistry & Cell Biology.
41, (7), p. 1441-1451.
Ariza A., Lopez D., Mate J.L., Isamat M., Musulen E., Pujol M., Ley A. and
Navas-Palacios J.J. (1995). Role of CD44 in the Invasiveness of
Glioblastoma Multiforme and the Noninvasiveness of Meningioma: an
Immunohistochemistry Study. Human Pathology. 26, (10), p. 1144-1147.
Armstrong T., Cohen M.Z., Hess K.R., Manning R., Lee E.L., Tamayo G.,
Baumgartner K., Min S.J., Yung A. and Gilbert M. (2006). Complementary
and Alternative Medicine Use and Quality of Life in Patients with Primary
Brain Tumors. Journal of Pain and Symptom Management. 32, (2), p. 148-
154.
Aroui, S., Aouey, B., Chtourou, Y., Meunier, A.C., Fetoui, H., Kenani, A.,
(2016). Naringin suppresses cell metastasis and the expression of matrix
metalloproteinases (MMP-2 and MMP-9) via the inhibition of ERK-P38-
JNK signaling pathway in human glioblastoma. Chem Biol Interact. 25,
(244), p.195-203.
Aruffo A., Stamenkovic I., Melnick M., Underhill C.B. and Seed B. (1990).
CD44 Is the Principal Cell Surface Receptor for Hyaluronate. Cell. 61, (7),
p. 1303-1313.
Asano M., Yukita A., Matsumoto T., Kondo S. and Suzuki H. (1995).
Inhibition of Tumor Growth and Metastasis by an Immunoneutralizing
Monoclonal Antibody to Human Vascular Endothelial Growth
Factor/Vascular Permeability Factor121. Cancer Research. 55, (22), p.
5296-5301.

152 | P a g e
Ashby L., Troester M. and Shapiro W. (2006). Central Nervous System
Tumors. Update on Cancer Therapeutics 1, (4), p. 475-513.
Astrinidis A and Henske EP. (2005) Tuberous sclerosis complex: linking
growth and energy signaling pathways with human disease. Oncogene.
24, p. 7475–7481.
Auerbach R., Lewis R., Shinners B., Kubai L. and Akhtar N. (2003).
Angiogenesis Assays: A Critical Overview. Clinical Chemistry, 49, (1), p.
32-40.
Auger C., Al-Awwadi N., Bornet A., Rouanet J., Gasc F., Cros G. and
Teissedre P. (2004). Catechins and Procyanidins in Mediterranean Diets.
Food Research International. 37, (3), p. 233-245.
Australian Bureau, O.S. (2008). Complementary Therapies. Australian
Social Trends. p. 1-5.
Australian Institute of Health and Welfare. (2004). Rural, Regional and
Remote Health: A Guide to Remoteness Classifications. In AIHW Cat. No.
PHE 53. Canberra: AIHW (http://www.aihw.gov.au/publication-
detail/?id=6442467589)
Axena A., Robertson J., Kufta C., Stetlerstevenson W. and Ali I. (1995).
Increased Expression of Gelatinase-A and TIMP-2 in Primary Human
Glioblastomas. International Journal of Oncology. 7, p. 469-473.
Azaizeh H., Saad B., Khalil K. and Said O. (2006). The State of the Art of
Traditional Arab Herbal Medicine in the Eastern Region of the
Mediterranean: A Review. Evidence-Based Complementary and
Alternative Medicine. 3, (2), p. 229-235.
153 | P a g e
Baker A.H., Zaltsman A.B., George S.J., Newby A.C. (1998). Divergent
effects of tissue inhibitor of metalloproteinase-1, -2, or -3 overexpression
on rat vascular smooth muscle cell invasion, proliferation, and death in
vitro. TIMP-3 promotes apoptosis. Journal of Clinical Investigation. 101,
(6), p. 1478-1487.
Balneaves L.G., Kristjanson L.J. and Tataryn D. (1999). Beyond
Convention: Describing Complementary Therapy Use by Women Living
with Breast Cancer. Patient Education and Counseling. 38, (2), p. 143-
153.
Banerjee S., Li Y., Wang Z., Sarkar F.H. (2008). Multi-Targeted Therapy of
Cancer by Genistein. Cancer Letters. 269, (2), p. 226-242.
Banjerdpongchai, R., Khawon, P., Pompimon, W., (2016). Phytochemicals
from Goniothalamus griffithii Induce Human Cancer Cell Apoptosis. Asian
Pac J Cancer Prev. 17, (7), p.3281-7.
Barish R. and Snyder A.E. (2008). Use of Complementary and Alternative
Healthcare Practices among Persons Served by a Remote Area Medical
Clinic. Family & Community Health. 31, (3), p. 221-227.
Barnes P.M., Bloom B. and Nahin R.L. (2008). Complementary and
Alternative Medicine Use among Adults and Children: United States, 2007.
Hyattsville: U.S.Department of Health and Human Services, Division of
Health Interview Statistics, Centers for Disease Control and Prevention,
National Center For Health Statistics.
Batra S.K., Castelino-Prabhu S., Wikstrand C.J., Zhu X., Humphrey P.A.,
Friedman H.S. and Bigner D.D. (1995). Epidermal Growth Factor Ligand-
Independent, Unregulated, Cell-Transforming Potential of a Naturally
Occurring Human Mutant EGFviii Gene. Cell Growth & Differentiation. 6,
(10), p. 1251-1259.

154 | P a g e
Beier D., Hau P., Proescholdt M., Lohmeier A., Wischhusen J., Oefner
P.J., Aigner L., Brawanski A., Bogdahn U. and Beier C.P. (2007).
CD133(+) and CD133(-) Glioblastoma-Derived Cancer Stem Cells Show
Differential Growth Characteristics and Molecular Profiles. Cancer
Research. 67, (9), p. 4010-4015.
Bell D.W., Varley J.M., Szydlo T.E., Kang D.H., Wahrer D.C., Shannon
K.E., et al. (1999). Heterozygous germ line hCHK2 mutations in Li-
Fraumeni syndrome. Science. 286, p. 2528–2531.
Bell R.A., Stafford J.M., Arcury T.A., Snively B.M., Smith S.L., Grzywacz
J.G. and Quandt S.A. (2006). Complementary and Alternative Medicine
Use and Diabetes Self-Management among Rural Older Adults.
Complementary Health Practice Review. 11, (2), p. 95-106.
Bennett M. and Lengacher C. (1999). Use of Complementary Therapies in
a Rural Cancer Population. Oncology Nursing Forum. 26, (8), p. 1287-
1294.
Berger F., Gay E., Pelletier L., Tropel P. and Wion D. (2004). Development
of Gliomas: Potential Role of Asymmetrical Cell Division of Neural Stem
Cells. The Lancet Oncology. 5, (8), p. 511-514.
Berger M.S. (1996). The Impact of Technical Adjuncts in the Surgical
Management of Cerebral Hemispheric Low-Grade Gliomas of Childhood.
Journal of Neuro-Oncology. 28, (2-3), p. 129-155.
Berra B., Gaini S.M., Riboni L. (1985). Correlation between ganglioside
distribution and histological grading of human astrocytomas. Int J Cancer.
36, p. 363–366
155 | P a g e
Berretta M., Lleshi A., Zanet E., Bearz A., Simonelli C., Fisichella R., Nasti
G., Berretta S. and Tirelli U. (2008). Bevacizumab Plus Irinotecan-,
Fluorouracil-, and Leucovorin-Based Chemotherapy with Concomitant
HAART in an HIV-Positive Patient with Metastatic Colorectal Cancer.
Onkologie. 31, (7), p. 394-397.
Bjerkvig R., Lund-Johansen M. and Edvardsen K. (1997). Tumor Cell
Invasion and Angiogenesis in the Central Nervous System. Current
Opinion in Oncology. 9, (3), p. 223-229.
Bjornson C.R., Rietze R.L., Reynolds B.A., Magli M.C. and Vescovi A.L.
(1999). Turning Brain into Blood: A Hematopoietic Fate Adopted by Adult
Neural Stem Cells in vivo. Science. 283, (5401), p. 534-537.
Blaber M., Disalvo J. and Thomas K.A. (1996). X-Ray Crystal Structure of
Human Acidic Fibroblast Growth Factor. Biochemistry. 35, (7), p. 2086-
2094.
Blavier L., Henriet P., Imren S. and Declerck Y.A. (1999). Tissue inhibitors
of matrix metalloproteinases in cancer. Ann NY Acad Sci. 878, p. 108–119
Bleehen N.M. (1980). The Cambridge Glioma Trial of Misonidazole and
Radiation Therapy with Associated Pharmacokinetic Studies. Cancer
Clinical Trials. 3, (3), p. 267-273.
Bogler O. and Mikkelsen T. (2005). Angiogenesis and Apoptosis in
Glioma: Two Arenas for Promising New Therapies. Journal of Cellular
Biochemistry. 96, (1), p. 16-24.
Bohnen, N.I. and Kurland L.T. (1995). Brain tumor and exposure to
pesticides in humans: a review of the epidemiologic data. Journal of the
neurological sciences. 132, (2), p. 110-121.

156 | P a g e
Boik, J., 2001. Natural Compounds in Cancer Therapy. USA: Oregon
Medical Press.
Bolteus A.J., Berens M.E., Pilkington G.J. (2001). Migration and invasion
in brain neoplasms. Curr Neurol Neurosci Rep. 1, (3), p. 225-32.
Bonnet D. and Dick J.E. (1997). Human Acute Myeloid Leukemia is
Organized as a Hierarchy that Originates from a Primitive Hematopoietic
Cell. Nature Medicine. 3, (7), p. 730-737.
Borek C. (2001). Antioxidant Health Effects of Aged Garlic Extract. The
Journal of Nutrition. 131, (3), p. 1010s-1015s.
Borek C. (2004). Antioxidants and Radiation Therapy. The Journal of
Nutrition 134, (11), p. 3207s-3209s.
Borras C., Gambini J., Gomez-Cabrera M.C., Sastre J., Pallardo F.V.,
Mann G.E. and Vina J. (2006). Genistein, a Soy Isoflavone, Up-Regulates
Expression of Antioxidant Genes: Involvement of Estrogen Receptors,
ERK1/2, and NFKAPPAB. The Faseb Journal. 20, (12), p. 2136-2138.
Bosio A., Binczek E. and Stoffel, W. (1996). Functional Breakdown of the
Lipid Bilayer of the Myelin Membrane in Central and Peripheral Nervous
System by Disrupted Galactocerebroside Synthesis. Proceedings of the
National Academy of Sciences of the United States of America. 93, (23), p.
13280-13285.
Bower M., Newlands E.S., Bleehen N.M., Brada M., Begent R.J., Calvert
H., Colquhoun I., Lewis P. and Brampton M.H. (1997). Multicentre CRC
Phase II Trial of Temozolomide in Recurrent or Progressive High-Grade
Glioma. Cancer Chemotherapy and Pharmacology. 40, (6), p. 484-488.
157 | P a g e
Bozkurt F. (2014). Stability Analysis of a Fractional-Order Differential
Equation System of a GBM-IS Interaction Depending on the Density. Appl.
Math. Inf. Sci. 8, (3), p. 1021-1028.
Brekken R.A., Overholser J.P., Stastny V.A., Waltenberger J., Minna J.D.
and Thorpe P.E. (2000). Selective Inhibition of Vascular Endothelial
Growth Factor (VEGF) Receptor 2 (KDR/FLK-1) Activity by a Monoclonal
Anti-VEGF Antibody Blocks Tumor Growth in Mice. Cancer Research. 60,
(18), p. 5117-5124.
Brem H and Langer R. (1996). Polymer-Based Drug Delivery to the Brain.
Science and medicine. 3, (4), p. 52.
Brem H., Domb A., Lenartz D., Dureza C., Olivi A. and Epstein J.I. (1992).
Brain Biocompatibility of a Biodegradable Controlled Release Polymer
Consisting of Anhydride Copolymer of Fatty Acid Dimer and Sebacic Acid.
Journal of Controlled Release. 19, (1-3), p. 325-329.
Brem H., Mahaley M.S., Vick N.A., Black K.L., Schold S.C., Burger P.C.,
Friedman A.H., Ciric I.S., Eller T.W., Cozzens J.W. and Kenealy J.N.
(1991). Interstitial Chemotherapy with Drug Polymer Implants for the
Treatment of Recurrent Gliomas. Journal of Neurosurgery. 74, (3), p. 441-
446.
Brem H., Piantadosi S., Burger P.C., Walker M., Selker R., Vick N.A.,
Black K., Sisti M., Brem S. and Mohr G. (1995). Placebo-Controlled Trial of
Safety and Efficacy of Intraoperative Controlled Delivery by Biodegradable
Polymers of Chemotherapy for Recurrent Gliomas. The Polymer-Brain
Tumor Treatment Group. Lancet. 345, (8956), p. 1008-1012.
158 | P a g e
Bremnes R.M., Veve R., Gabrielson E., Hirsch F.R., Baron A., Bemis L.,
Gemmill R.M., Drabkin H.A., Franklin W.A. (2002). High-throughput tissue
microarray analysis used to evaluate biology and prognostic significance
of the E-cadherin pathway in non-small-cell lung cancer. J Clin Oncol. 20,
(10) p. 2417-28.
Brew K. (1999). "Engineering of selective TIMPs." Ann N Y Acad Sci. 878,
p. 1-11.
Brewer G.J. and Leroux P.D. (2007). Human Primary Brain Tumor Cell
Growth Inhibition in Serum-Free Medium Optimized for Neuron Survival.
Brain Research. 1157, p. 156-166.
Brooks P.C., Strömblad S., Sanders L.C., von Schalscha T.L., Aimes R.T.,
Stetler-Stevenson W.G., Quigley J.P., Cheresh D.A. (1996) Localization of
Matrix Metalloproteinase MMP-2 to the Surface of Invasive Cells by
Interaction with Integrin αvβ3. Cell. 85, (5), p. 683 – 693.
Brown W.J., Bryson L., Byles J.E., Dobson A.J., Lee C., Mishra G. and
Schofield M. (1998). Women's Health Australia: Recruitment for a National
Longitudinal Cohort Study. Women Health. 28, (1), p. 23-40.
Brown W.J., Dobson A.J., Bryson L. and Byles J.E. (1999). Women's
Health Australia: On the Progress of the Main Study Cohorts. Journal of
Women's Health and Gender Based Medicine. 8, (5), p. 681-688.
Bruce W.R. and Van Der Gaag H. (1963). A quantitative assay for the
number of murine lymphoma cells capable of proliferation in vivo. Nature.
199, p. 79–80.

159 | P a g e
Bruggisser R., Von Daeniken K., Jundt G., Schaffner W. and Tullberg-
Reinert H. (2002). Interference of Plant Extracts, Phytoestrogens and
Antioxidants with the MTT Tetrazolium Assay. Planta Medica. 68, (5), p.
445-448.
Bull V.L. and Tisdale M.J. (1987). Antitumour Imidazotetrazines—XVI:
Macromolecular Alkylation by 3-Substituted Imidazotetrazinones.
Biochemical Pharmacology. 36, (19), p. 3215-3220.
Butt A.M., Duncan A., Hornby M.F., Kirvell S.L., Hunter A., Levine J.M.
and Berry M. (1999). Cells Expressing The NG2 Antigen Contact Nodes of
Ranvier in Adult CNS White Matter. Glia. 26, (1), p. 84-91.
Cai J., Qi Y., Hu X., Tan M., Liu Z., Zhang J., Li Q., Sander M., Qiu M.
(2005). Generation of oligodendrocyte precursor cells from mouse dorsal
spinal cord independent of NKX6 regulation and Shh signaling. Neuron.
45, (1), p. 41-53.
Cao Y., Fu Z.D., Wang F., Liu H.Y. and Han R. (2005). Anti-Angiogenic
Activity of Resveratrol, a Natural Compound from Medicinal Plants.
Journal of Asian Natural Products Research. 7, (3), p. 205-213.
Carlberg M, Hardell L. (2012). On the association between glioma,
wireless phones, heredity and ionising radiation. Pathophysiology. 19, (4),
p. 243–252.
Carpentier A.C. (2008). La Chirurgie Des Gliomes Cérébraux En 2008.
Cancer/Radiothérapie. 12, (6-7), p. 676-686.
Carraway K.L. and Cantley L.C. (1994). A Neu Acquaintance for erbB3
and erbB4: A Role for Receptor Heterodimerization in Growth Signaling.
Cell. 78, (1), p. 5-8.

160 | P a g e
Caskey L.S., Fuller G.N., Bruner J.M., Yung W.K., Sawaya R.E., Holland
E.C. and Zhang W. (2000). Toward a molecular classification of the
gliomas: histopathology, molecular genetics, and gene expression
profiling. Histology and histopathology. 15, (3), p. 971-981.
Chang C.H., Horton J., Schoenfeld D., Salazer O., Perez-Tamayo R.,
Kramer S., Weinstein A., Nelson J.S. and Tsukada Y. (1983). Comparison
of Postoperative Radiotherapy and Combined Postoperative Radiotherapy
and Chemotherapy in the Multidisciplinary Management of Malignant
Gliomas. A Joint Radiation Therapy Oncology Group and Eastern
Cooperative Oncology Group Study. Cancer. 52, (6), p. 997-1007.
Chekenya M. and Pilkington G.J. (2002). NG2 Precursor Cells in
Neoplasia: Functional, Histogenesis and Therapeutic Implications for
Malignant Brain Tumours. Journal of Neurocytology. 31, (6-7), p. 507-521.
Chekenya M., Enger P.O., Thorsen F., Tysnes B.B., Al-Sarraj S., Read
T.A., Furmanek T., Mahesparan R., Levine J.M., Butt A.M., Pilkington G.J.
and Bjerkvig R. (2002). The Glial Precursor Proteoglycan, NG2, is
expressed on Tumour Neovasculature by Vascular Pericytes in Human
Malignant Brain Tumours. Neuropathology and Applied Neurobiology. 28,
(5), p. 367-380.
Chekenya M., Hjelstuen M., Enger P.O., Thorsen F., Jacob A.L., Probst,
B., Haraldseth O., Pilkington G., Butt A., Levine J.M. and Bjerkvig R.
(2002). NG2 Proteoglycan Promotes Angiogenesis-Dependent Tumor
Growth in CNS By Sequestering Angiostatin. The Faseb Journal: Official
Publication of the Federation of American Societies for Experimental
Biology. 16, (6), p. 586-588.
Chen C. Campbell P.A. and Newman L.S. (1990) MTT Colorimetric Assay
Detects Mitogen Responses of Spleen but Not Blood Lymphocytes. Int
Arch Allergy Appl Immunol. 93, (2-3), p. 249-55.
161 | P a g e
Chen P., Aldape K., Wiencke J.K., Kelsey K.T., Miike R., Davis R.L., Liu
J., Kesler-Diaz A., Takahashi M. and Wrensch M. (2001). Ethnicity
Delineates Different Genetic Pathways in Malignant Glioma. Cancer
Research. 61, (10), p. 3949-3954.
Cherniack E.P., Senzel R.S. and Pan C.X. (2001). Correlates of Use of
Alternative Medicine by the Elderly in an Urban Population. Journal of
Alternative and Complementary Medicine. 7, (3), p. 277-280.
Chiaramonte D. and Lao L. (2010). Integrating Chinese and Western
Medicine in Cancer Treatment. Supportive Cancer Care with Chinese
Medicine. Illustrated Edn. Springer, p. 341-361.
Chimenti, I., Gaetani, R., Forte, E., Angelini, F., De Falco, E., Zoccai, G. B
et al. (2014). Serum and supplement optimization for EU GMP-compliance
in cardiospheres cell culture. Journal of Cellular and Molecular Medicine.
18, (4), p. 624–634.
Chinot O. (2001). Chemotherapy for the Treatment of Oligodendroglial
Tumors. Seminars in Oncology. 28, (4 Suppl 13), p. 13-18.
Chintala S. K., Sawaya R., Gokaslan Z. L. and Rao J. S. (1996).
Modulation of matrix metalloprotease-2 and invasion in human glioma cells
by alpha 3 beta 1 integrin. Cancer Lett. 103, 201-208.
Chung Y.C., Huang C.C., Chen C.H., Chiang H.C., Chen K.B., Chen Y.J.,
Liu C.L., Chuang L.T., Liu M., Hsu C.P. (2012). Grape-seed procyanidins
inhibit the in vitro growth and invasion of pancreatic carcinoma cells.
Pancreas.41, (3), p.447-54.
Chung, S.S and Vadgama J V. (2015). Curcumin and Epigallocatechin
Gallate Inhibit the Cancer Stem Cell Phenotype via Down-regulation of
STAT3–NFκB Signaling. Anticancer Res. 35, (1), p. 39-46.
162 | P a g e
Ciapetti G., Cenni E., Pratelli L. and Pizzoferrato A. (1993). In vitro
Evaluation of Cell/Biomaterial Interaction by MTT Assay. Biomaterials. 14,
(5), p. 359-364.
Clark A.S., Deans B., Stevens M.F., Tisdale M.J., Wheelhouse R.T.,
Denny B.J. and Hartley J.A. (1995). Antitumor Imidazotetrazines. 32.
Synthesis of Novel Imidazotetrazinones and Related Bicyclic Heterocycles
to Probe the Mode of Action of the Antitumor Drug Temozolomide. Journal
of Medicinal Chemistry. 38, (9), p. 1493-1504.
Clark E. and Brugge J. (1995). Integrins and Signal Transduction
Pathways: The Road Taken. Science. 268, (5208), p. 233-239.
Coetzee T., Fujita N., Dupree J., Shi R., Blight A., Suzuki K., Suzuki K.
and Popko B. (1996). Myelination in the Absence of Galactocerebroside
and Sulfatide: Normal Structure with Abnormal Function and Regional
Instability. Cell. 86, (2), p. 209-219.
Cohen M.H., Shen Y.L., Keegan P. and Pazdur R. (2009). FDA Drug
Approval Summary: Bevacizumab (Avastin(R)) as Treatment of Recurrent
Glioblastoma Multiforme. The Oncologist. 14, (11), p. 1131-1138.
Colin C., Virard I., Baeza N., Tchoghandjian A., Fernandez C., Bouvier C.,
Calisti A., Tong S., Durbec P. and Figarella-Branger D. (2007). Relevance
of Combinatorial Profiles of Intermediate Filaments and Transcription
Factors for Glioma Histogenesis. Neuropathology and Applied
Neurobiology. 33, (4), p. 431-439.
Collins A.T., Berry P.A., Hyde C., Stower M.J. and Maitland N.J. (2005).
Prospective Identification of Tumorigenic Prostate Cancer Stem Cells.
Cancer Research. 65, (23), p. 10946-10951.

163 | P a g e
Condic M.L. and Letourneau P.C. (1997). Ligand-Induced Changes in
Integrin Expression Regulate Neuronal Adhesion and Neurite Outgrowth.
Nature. 389, (6653), p. 852-856.
Corbeil D., Röper K., Hellwig A., Tavian M., Miraglia S., Watt S.M.,
Simmons P.J., Peault B., Buck D.W. and Huttner W.B. (2000). The Human
AC133 Hematopoietic Stem Cell Antigen is Also Expressed in Epithelial
Cells and Targeted to Plasma Membrane Protrusions. Journal of Biological
Chemistry. 275, (8), p. 5512-5520.
Cruickshank G. (2004). Tumours of the Brain. Surgery. 22, p. 69-72.
Cryns V. and Yuan J. (1998). Proteases to Die For. Genes &
Development. 12, (11), p. 1551-1570.
Cuccurazzu B., Leone L., Podda M.V., Piacentini R., Riccardi E., Ripoli C.,
Azzena G.B., Grassi C. (2010). Exposure to extremely low-frequency (50
Hz) electromagnetic fields enhances adult hippocampal neurogenesis in
C57BL/6 mice. Exp Neurol. 226, (1), p. 173-82.
Da Violante G., Zerrouk N., Richard I., Provot G., Chaumeil J.C., Arnaud
P. (2002). Evaluation of the cytotoxicity effect of dimethyl sulfoxide
(DMSO) on Caco2/TC7 colon tumor cell cultures. Biol Pharm Bull. 25,
(12), p. 1600-3.
Daley E., Wilkie D., Loesch A., Hargreaves I.P., Kendall D.A., Pilkington
G.J. and Bates T.E. (2005). Chlorimipramine: A Novel Anticancer Agent
with a Mitochondrial Target. Biochemical and Biophysical Research
Communications. 328, (2), p. 623-632.
Danson S.J. and Middleton M.R. (2001). Temozolomide: A Novel Oral
Alkylating Agent. Expert Rev Anticancer Ther. 1, (1), p. 13-19.

164 | P a g e
Daumas-Duport C., Scheithauer B., O'fallon J. and Kelly P. (1988).
Grading of astrocytomas. A simple and reproducible method. Cancer. 62,
(10), p. 2152-2165.
Dawson M.R., Levine J.M. and Reynolds R. (2000). NG2-Expressing Cells
in The Central Nervous System: Are They Oligodendroglial Progenitors?
Journal of Neuroscience Research. 61, (5), p. 471-479.
Dean N. M., Kanemitsu M. and Boynton A. L. (1989). Effects of the
tyrosine kinase inhibitor genistein on DNA synthesis and phospholipid
derived second messenger generation in mouse 10T1/2 fibroblast and
liver T51B cells. Biochem Biophys Res Commun. 165, p. 795-801.
Deangelis L.M. (2001). Brain Tumors. The New England Journal of
Medicine. 344, (2), p. 114-123.
DeClerck Y.A., Perez N., Shimada H., Boon T.C., Langley K.E. and Taylor
S.M. (1992). Inhibition of invasion and metastasis in cells transfected with
an inhibitor of metalloproteinases. Cancer Res. 52, p. 701–708.
DeClerck Y.A., Yean T.D., Chan D., Shimada H. and Langely K.E. (1991).
Inhibition of tumour invasion of smooth muscle cell layers by recombinant
human metalloproteinase inhibitor. Cancer Res. 51, p. 2151–2157.
Dejana E. (1992). The Endothelial Cell: A Cell Structurally Simple but
Functionally Very Complex. Recenti Progressi in Medicina. 83, (10), p.
582-591.
Dekaney C.M., Rodriguez J.M., Graul M.C. and Henning S.J. (2005).
Isolation and Characterization of a Putative Intestinal Stem Cell Fraction
from Mouse Jejunum. Gastroenterology. 129, (5), p. 1567-1580.

165 | P a g e
Del Bas J.M., Ricketts M.L., Baiges I., Quesada H., Ardevol A., Salvado
M.J., Pujadas G., Blay M., Arola L., Blade C., Moore D.D. and Fernandez-
Larrea J. (2008). Dietary Procyanidins Lower Triglyceride Levels Signaling
Through The Nuclear Receptor Small Heterodimer Partner. Molecular
Nutrition & Food Research. 52, p. 1172–1181.
Del Mundo W., Shepherd W.C. and Marose T.D. (2002). Use of Alternative
Medicine by Patients in a Rural Family Practice Clinic. Family Medicine.
34, (3), p. 2.
Delpech B., Maingonnat C., Girard N., Chauzy C., Maunoury R., Olivier,
A., Tayot J. and Creissard P. (1993). Hyaluronan and Hyaluronectin in the
Extracellular Matrix of Human Brain Tumour Stroma. European Journal of
Cancer. 29a, (7), p. 1012-1017.
Demuth T., Berens M.E. (2004). Molecular mechanisms of glioma cell
migration and invasion. J Neurooncol. 70, (2), p. 217-28.
Denekamp J. (1993). Review Article: Angiogenesis, Neovascular
Proliferation and Vascular Pathophysiology as Targets for Cancer
Therapy. The British Journal of Radiology. 66, (783), p. 181-196.
Denny B.J., Wheelhouse R.T., Stevens M.F., Tsang L.L. and Slack J.A.
(1994). NMR and Molecular Modeling Investigation of the Mechanism of
Activation of the Antitumor Drug Temozolomide and its Interaction with
DNA. Biochemistry. 33, (31), p. 9045-9051.
Department of Primary Industries and Energy, Department of Human
Services, and Health. (1994). Rural, Remote and Metropolitan Areas
Classification: 1991 Census Edition.
Dermietzel R., Spray D.C. (1993). Gap junctions in the brain: where, what
type, how many and why? Trends Neurosci. 16, (5), p.186-92.

166 | P a g e
Dissanayake, A.A., Bejcek, B.E., Zhang, C.R., Nair, M.G., (2016).
Sesquiterpenoid Lactones in Tanacetum huronense Inhibit Human
Glioblastoma Cell Proliferation. Nat Prod Commun. 11, (5), p.579-82.
Dixon R.A. and Ferreira D. (2002). Genistein. Phytochemistry. 60, (3), p.
205-211.
Dixon R.A., Xie D.Y. and Sharma S.B. (2005). Proanthocyanidins-A Final
Frontier in Flavonoid Research? The New Phytologist. 165, (1), p. 9-28.
Doolittle N.D. (2004). State of the science in brain tumor classification.
Seminars in oncology nursing. 20, (4), p. 224-230.
D'souza S., Ginsberg M., Burke T., Lam S. and Plow E. (1988).
Localization of an Arg-Gly-Asp Recognition Site within an Integrin
Adhesion Receptor. Science. 242, (4875), p. 91-93.
Dupree J.L., Coetzee T., Suzuki K. and Popko B. (1998). Myelin
Abnormalities in Mice Deficient in Galactocerebroside and Sulfatide.
Journal of Neurocytology. 27, (9), p. 649-659.
Durant J. (1998). Alternative Medicine: An Attractive Nuisance. Journal of
Clinical Oncology. 16, (1), p. 1-2.
Edvardsen K., Brunner N., Spang-Thomsen M., Walsh F.S. and Bock E.
(1993). Migratory, Invasive and Metastatic Capacity of NCAM Transfected
Rat Glioma Cells. International Journal of Developmental Neuroscience.
11, (5), p. 681-690.
Edvardsen K., Chen W., Rucklidge G., Walsh F.S., Obrink B. and Bock E.
(1993). Transmembrane Neural Cell-Adhesion Molecule (NCAM), but not
Glycosyl-Phosphatidylinositol-Anchored NCAM, Down-Regulates
Secretion of Matrix Metalloproteinases. Proceedings of the National

167 | P a g e
Academy of Sciences of the United States of America. 90, (24), p. 11463-
11467.
Edvardsen, K., Pedersen, P.H., Bjerkvig, R., Hermann, G.G., Zeuthen, J.,
Laerum, O.D., Walsh, F.S. and Bock, E. (1994). Transfection of Glioma
Cells with The Neural-Cell Adhesion Molecule NCAM: Effect on Glioma-
Cell Invasion and Growth in vivo. International Journal of Cancer. 58, (1),
p. 116-122.
Eisele G., Roelcke U., Conen K., Huber F., Weiss T., Hofer S., Heese O.,
Westphal M., and Weller M. (2014). Complementary Therapy use in a
Cohort of Swiss Glioma Patients. Neuro Oncol. 16, (2), P18.01.
Eisenberg, D.M., Davis, R.B., Ettner, S.L., Appel, S., Wilkey, S., Van
Rompay, M. and Kessler, R.C. (1998). Trends in Alternative Medicine Use
in the United States, 1990-1997. Jama. 280, (18), p. 1569-1575.
Ekert, P.G., Read, S.H., Silke, J., Marsden, V.S., Kaufmann, H., Hawkins,
C.J., Gerl, R., Kumar, S. and Vaux, D.L. (2004). APAF-1 and Caspase-9
Accelerate Apoptosis, but do not Determine Whether Factor-Deprived or
Drug-Treated Cells Die. The Journal of Cell Biology. 165, (6), p. 835-842.
Ekstrand, A.J., Longo, N., Hamid, M.L., Olson, J.J., Liu, L., Collins, V.P.
and James, C.D. (1994). Functional Characterization of an EGF Receptor
with a Truncated Extracellular Domain Expressed in Glioblastomas with
EGFR Gene Amplification. Oncogene. 9, (8), p. 2313-2320.
Ekstrand, A.J., Sugawa, N., James, C.D. and Collins, V.P. (1992).
Amplified and Rearranged Epidermal Growth Factor Receptor Genes in
Human Glioblastomas Reveal Deletions of Sequences Encoding Portions
of The N- and/Or C-Terminal Tails. Proceedings of the National Academy
of Sciences of the United States of America. 89, (10), p. 4309-4313.

168 | P a g e
Eng, L.F., Vanderhaeghen, J.J., Bignami, A. and Gerstl, B. (1971). An
Acidic Protein Isolated from Fibrous Astrocytes. Brain Research. 28, (2), p.
351-354.
Engebraaten, O., Bjerkvig, R., Pedersen, P.H. and Laerum, O.D. (1993).
Effects of EGF, BFGF, NGF and PDGF(Bb) on Cell Proliferative, Migratory
and Invasive Capacities of Human Brain-Tumour Biopsies in vitro.
International Journal of Cancer. 53, (2), p. 209-214.
Engel N., Falodun A., Kühn J., Kragl U., Langer P., Nebe B. (2014). Pro-
apoptotic and anti-adhesive effects of four African plant extracts on the
breast cancer cell line MCF-7. BMC Complementary and Alternative
Medicine. 14, p. 334.
Engelhard H.H., 2000. Tumor Bed Cyst Formation after BCNU Wafer
Implantation: Report of Two Cases. Surgical Neurology. 53, (3), p. 220-
224.
Engelhard H.H., Stelea A., Mundt A. (2000). Oligodendroglioma and
anaplastic oligodendroglioma: clinical features, treatment and prognosis.
Surg Neurol. 60, p. 443–56.
Ennis B.W., Matrisian L.M. (1994). Matrix degrading metalloproteinases. J
Neurooncol. 18, (2), p. 105-9.
Ernst E. (1998). The Prevalence of Complementary/Alternative Medicine in
Cancer. Cancer. 83, (4), p. 777-782.
Ernst E. (2008). Editorial Comment. The Journal of Urology. 179, (3), p.
906-910.

169 | P a g e
Estécio M.R.H. and Silva A.E. (2002). Alterações cromossômicas
causadas pela radiação dos monitores de vídeo de computadores.
Revista de Saúde Pública. 36, (3), p. 330-336.
Ewend, M.G., Sampath, P., Williams, J.A., Tyler, B.M. and Brem, H.
(1998). Local Delivery of Chemotherapy Prolongs Survival in Experimental
Brain Metastases From Breast Carcinoma. Neurosurgery. 43, (5), p. 1185-
1193.
Ewend, M.G., Williams, J.A., Tabassi, K., Tyler, B.M., Babel, K.M.,
Anderson, R.C., Pinn, M.L., Brat, D.J. and Brem, H. (1996). Local Delivery
of Chemotherapy and Concurrent External Beam Radiotherapy Prolongs
Survival in Metastatic Brain Tumor Models. Cancer Research. 56, (22), p.
5217-5223.
Fan X., Salford L.G. and Widegren B. (2007). Glioma Stem Cells:
Evidence and Limitation. Seminars in Cancer Biology. 17, (3), p. 214-218.
Featherstone C., Godden D., Selvaraj S., Emslie M. and Took-Zozaya M.
(2003). Characteristics Associated With Reported CAM Use in Patients
Attending Six GP Practices in the Tayside and Grampian Regions of
Scotland: A Survey. Complementary Therapies in Medicine. 11, (3), p.
168-176.
Fischer W., Heller T., Herrmann E. and Schreiber D. (1989). A Simple
Method for the Isolation of GFAP and its Use for the Study of Brain
Tumors. Zentralblatt Fur Allgemeine Pathologie Und Pathologische
Anatomie. 135, (1), p. 33-41.
Fogarty M, Richardson WD, Kessaris N. (2005). A Subset of
Oligodendrocytes Generated From Radial Glia in the Dorsal Spinal Cord.
Development. 132, p. 1951–1959.
170 | P a g e
Folkman J., Merler E., Abernathy C. and Williams G. (1971). Isolation of a
Tumor Factor Responsible For Angiogenesis. The Journal of Experimental
Medicine. 133, (2), p. 275-288.
Forester S. C., Choy Y. Y., Waterhouse A. L. and Oteiza P. I. (2014). The
anthocyanin metabolites gallic acid, 3-O-methylgallic acid, and 2,4,6-
trihydroxybenzaldehyde decrease human colon cancer cell viability by
regulating pro-oncogenic signals. Mol. Carcinog. 53, p. 432–439.
Fotsis T., Pepper M., Adlercreutz H., Fleischmann G., Hase T., Montesano
R. & Schweigerer L. (1993) Genistein, a dietaryderived inhibitor of in vitro
angiogenesis. Proc Nati Acad Sci. 90, p. 2690-2694.
Francavilla T.L., Miletich R.S., Di Chiro G., Patronas N.J., Rizzoli H.V. and
Wright D.C. (1989). Positron Emission Tomography in the Detection of
Malignant Degeneration of Low-Grade Gliomas. Neurosurgery. 24, (1), p.
1-5.
Fredman P. (1994). Gangliosides Associated with Primary Brain Tumors
and Their Expression in Cell Lines Established from these Tumors.
Progress in Brain Research. 101, p. 225-240.
Freshney R. I. (2005) Basic Principles of Cell Culture, in Culture of Cells
for Tissue Engineering (eds G. Vunjak-Novakovic and R. I. Freshney),
John Wiley & Sons, Inc., Hoboken, NJ, USA.
Freshney R.I. (2005) Culture of Animal Cells, a Manual of Basic
Technique, 5th Ed. Hoboken, NJ, John Wiley & Sons.
Friedman H.S., Pluda J., Quinn J.A., Ewesuedo R.B., Long L., Friedman
A.H., Cokgor I., Colvin O.M., Haglund M.M., Ashley D.M., Rich J.N.,
Sampson J., Pegg A.E., Moschel R.C., Mclendon R.E., Provenzale J.M.,
Stewart E.S., Tourt-Uhlig S., Garcia-Turner A.M., Herndon J.E., Bigner

171 | P a g e
D.D. and Dolan M.E. (2000). Phase I Trial of Carmustine Plus O6-
Benzylguanine For Patients with Recurrent or Progressive Malignant
Glioma. Journal of Clinical Oncology. 18, (20), p. 3522-3528.
Friedman H.S., Prados M.D., Wen P.Y., Mikkelsen T., Schiff D., Abrey
L.E., Yung W.K.A., Paleologos N., Nicholas M.K., Jensen R., Vredenburgh
J., Huang J., Zheng M. and Cloughesy T. (2009). Bevacizumab Alone and
in Combination with Irinotecan in Recurrent Glioblastoma. Journal of
Clinical Oncology. 27, (28), p. 4733-4740.
Friedman J.M., Gutmann D.H., MacCollin M., Riccardi V.M. (1999).
Neurofibromatosis: Phenotype, Natural History, and Pathogenesis. 3rd
edn. Johns Hopkins University Press; Baltimore
Friedman, H.S., Keir, S., Pegg, A.E., Houghton, P.J., Colvin, O.M.,
Moschel, R.C., Bigner, D.D. and Dolan, M.E. (2002). O6-Benzylguanine-
Mediated Enhancement of Chemotherap. Molecular Cancer Therapeutics.
1, (11), p. 943-948.
Frisch S.M. and Ruley H.E. (1987). Transcription from the stromelysin
promoter is induced by interleukin-1 and repressed by dexamethasone. J
Biol Chem. 262, p. 16300–16304.
Fuhrmann-Benzakein E., Ma M. N., Rubbia-Brandt L., Mentha G.,
Ruefenacht D., Sappino A.-P. and Pepper M. S. (2000). Elevated levels of
angiogenic cytokines in the plasma of cancer patients. Int. J. Cancer. 85,
p. 40–45.
Fuhrmann-Benzakein E., Ma, M.N., Rubbia-Brandt L., Mentha G.,
Ruefenacht D., Sappino A.P. and Pepper M.S. (2000). Elevated Levels of
Angiogenic Cytokines in The Plasma of Cancer Patients. International
Journal of Cancer.Journal International Du Cancer. 85, (1), p. 40-45.

172 | P a g e
Fulda S., Kögel D. (2015). Cell death by autophagy: emerging molecular
mechanisms and implications for cancer therapy. Oncogene. 34, (40),
p.5105-13.
Fuller C.E., Wang H., Zhang W., Fuller G.N. and Perry A. (2002). High-
throughput molecular profiling of high-grade astrocytomas: the utility of
fluorescence in situ hybridization on tissue microarrays (TMA-FISH).
Journal of neuropathology and experimental neurology. 61, (12), p. 1078-
1084.
Fung L.K., Ewend M.G., Sills A., Sipos E.P., Thompson R., Watts M.,
Colvin O.M., Brem H. and Saltzman W.M. (1998). Pharmacokinetics of
Interstitial Delivery of Carmustine, 4-Hydroperoxycyclophosphamide, and
Paclitaxel from a Biodegradable Polymer Implant in the Monkey Brain.
Cancer Research. 58, (4), p. 672-684.
Gadhia P. K., Shah Nehal, Nahata S, Patel S, Patel K, Pithawala M and
Tamakuwala D. (2004). Cytogenetic Analysis of Radiotherapeutic and
Diagnostic Workers Occupationally Exposed to Radiations. International
Journal Human Genetics, 4, pp. 65-69.
Gagliano N., Moscheni C., Torri C., Magnani I., Bertelli A.A. and Gioia M.
(2005). Effect of Resveratrol on Matrix Metalloproteinase-2 (MMP-2) and
Secreted Protein Acidic and Rich in Cysteine (SPARC) On Human
Cultured Glioblastoma Cells. Biomedecine & pharmacotherapy. 59, (7), p.
359-364.
Gao D., Zhang X., Jiang X., Peng Y., Huang W., Cheng G. and Song L.
(2006). Resveratrol Reduces the Elevated Level of MMP-9 Induced by
Cerebral Ischemia-Reperfusion in Mice. Life Sciences. 78, (22), p. 2564-
2570.

173 | P a g e
Gao Q., Zhang L., Zhang B., Wang Q., Sun C., Dong X., and Ying J.
(2014). Phosphatase and tensin homolog overexpression decreases
proliferation and invasion and increases apoptosis in oral squamous cell
carcinoma cells. Oncology Letters 8, p. 1058-1064.
Gilbert M.R., Wang M., Aldape K.D., Stupp R., Hegi M.E., Jaeckle K.A.,
Armstrong T.S., Wefel J.S., Won M., Blumenthal D.T., Mahajan A., Schultz
C.J., Erridge S., Baumert B., Hopkins K.I., Tzuk-Shina T., Brown P.D.,
Chakravarti A., Curran W.J., Mehta M.P. (2013). Dose-dense
temozolomide for newly diagnosed glioblastoma: a randomized phase III
clinical trial. J Clin Oncol. 31, p.4085–91.
Glantz M.J., Burger P.C., Herndon J.E., Friedman A.H., Cairncross J.G.,
Vick N.A. and Schold S.C.,Jr. (1991). Influence of the type of surgery on
the histologic diagnosis in patients with anaplastic gliomas. Neurology. 41,
(11), p. 1741-1744.
Glanz C., Rebetz J., Stewenius Y., Persson A., Englund E., Mandahl N.,
Mertens F., Salford L.G., Widegren B., Fan X. and Gisselsson D. (2007).
Genetic Intratumour Heterogeneity in High-Grade Brain Tumours Is
Associated With Telomere-Dependent Mitotic Instability. Neuropathology
and Applied Neurobiology. 33, (4), p. 440-454.
Glaser S.L., Satariano E., Leung R.W., Prehn A.W., Cady C.M. and West
D.W., Eds. (1996). Cancer Incidence by Race/Ethnicity in the San
Francisco Bay Area: Twenty Years of Cancer Reporting 1973-1992. Union
City, California: North California Cancer Center.
Glaser T., Winter S., Groscurth P., Safayhi H., Sailer E.R., Ammon H.P.,
Schabet M. and Weller M. (1999). Boswellic Acids and Malignant Glioma:
Induction of Apoptosis but no Modulation of Drug Sensitivity. British
Journal of Cancer. 80, (5-6), p. 756-765.

174 | P a g e
Gong L., Li Y., Nedeljkovic-Kurepa A. and Sarkar F.H. (2003). Inactivation
of NF-Kappab by Genistein is Mediated via AKT Signaling Pathway in
Breast Cancer Cells. Oncogene. 22, (30), p. 4702-4709.
Gonzales G.F. and Valerio L.G.,Jr. (2006). Medicinal Plants from Peru: A
Review of Plants as Potential Agents against Cancer. Anti-Cancer Agents
in Medicinal Chemistry. 6, (5), p. 429-444.
Goto I., Yamamoto-Yamaguchi Y. and Honma Y. (1996). Enhancement of
Sensitivity of Human Lung Adenocarcinoma Cells to Growth-Inhibitory
Activity of Interferon Alpha by Differentiation-Inducing Agents. British
Journal of Cancer. 74, (4), p. 546-554.
Grant R. (2004). Overview: Brain Tumour Diagnosis and
Management/Royal College of Physicians Guidelines. Journal of
Neurology, Neurosurgery, and Psychiatry. 75, (2), p. 18-23.
Gratsa A., Rooprai H.K., Rogers J.P., Martin K.K. and Pilkington G.J.
(1997). Correlation of Expression of NCAM and GD3 Ganglioside to Motile
Behaviour in Neoplastic Glia. Anticancer Research. 17, (6b), p. 4111-
4117.
Gray C.M., Tan A.W., Pronk N.P. and O'connor P.J. (2002).
Complementary and Alternative Medicine Use among Health Plan
Members. A Cross-Sectional Survey. Effective Clinical Practice. 5, (1), p.
17-22.
Greene J., Wang M., Liu Y.E., Raymond L.A., Rosen C. and Shi Y.E.
(1996). Molecular cloning and characterization of human tissue inhibitor of
metalloproteinase 4. J Biol Chem. 271, p. 30375–3038.
Grossman S.A. and Batara J.F. (2004). Current management of
glioblastoma multiforme. Seminars in oncology. 31, (5), p. 635-644.

175 | P a g e
Grzywacz J.G., Lang W., Suerken C., Quandt S.A., Bell R.A. and Arcury
T.A. (2005). Age, Race, and Ethnicity in the Use of Complementary and
Alternative Medicine for Health Self-Management: Evidence from the 2002
National Health Interview Survey. Journal of Aging and Health. 17, (5), p.
547-572.
Guha A., Dashner K., Black P.M., Wagner J.A. and Stiles C.D. (1995).
Expression of PDGF and PDGF Receptors in Human Astrocytoma
Operation Specimens Supports the Existence of an Autocrine Loop.
International Journal of Cancer. 60, (2), p. 168-173.
Gumbiner B.M. (1996). Cell Adhesion: The Molecular Basis of Tissue
Architecture and Morphogenesis. Cell. 84, (3), p. 345-357.
Haas T. L., Lloyd P. G., Yang H.T, and Terjung R. L. (2012). Exercise
Training and Peripheral Arterial Disease. Comprehensive Physiology. 2, p.
2933–3017.
Halaka A.N., Bunning R.A., Bird C.C., Gibson M., Reynolds J.J. (1983).
Production of collagenase and inhibitor (TIMP) by intracranial tumors and
dura in vitro. Journal of Neurosurgery. 59, (3), p. 461-466.
Hanssen B., Grimsgaard S., Launsoslash L., Foslashnneboslash V.,
Falkenberg T. and Rasmussen N.K. (2005). Use of Complementary and
Alternative Medicine in the Scandinavian Countries. Scandinavian Journal
of Primary Health Care. 23, p. 57-62.
Hardell L., Carlberg M., Hansson Mild K. (2013). Use of mobile phones
and cordless phones is associated with increased risk for glioma and
acoustic neuroma. Pathophysiology. 20, (2), p. 85 – 110.

176 | P a g e
Harris P. and Rees R. (2000). The Prevalence of Complementary and
Alternative Medicine Use among the General Population: A Systematic
Review of the Literature. Complementary Therapies in Medicine. 8, p. 88-
96.
Hassel B., Iversen E.G. and Fonnum F. (1994). Neurotoxicity of Albumin in
vivo. Neuroscience Letters. 167, (1-2), p. 29-32.
Hayakawa T. (1994). Tissue inhibitors of metalloproteinases and their cell
growth-promoting activity. Cell Struct Funct. 19, p. 109-114.
Hayakawa T., Yamashita K., Ohuchi E. and Shinagawa A. (1994). Cell
growth-promoting activity of tissue inhibitor of metalloproteinases-2 (TIMP-
2). J. Cell Sci. 107, p. 2373-2379.
Hayakawa T., Yamashita K., Tanzawa K., Uchijima E. and Iwata K. (1992).
Growth-promoting activity of tissue inhibitor of metalloproteinases- 1
(TIMP-1) for a wide range of cells. A possible new growth factor in serum.
FEBS Lett. 298, p. 29-32.
Hayflick L. (1985). "The cell biology of aging." Clin Geriatr Med. 1, (1), p.
15-27.
Hayflick L. (1994). How and Why We Age. Ballantine Books, New York.
Hedigan K. (2010). Cancer: Herbal Medicine Reduces Chemotherapy
Toxicity. Nature Reviews.Drug Discovery. 9, (10), p. 765.
Heese O., Schmidt M., Nickel S., Berger H., Goldbrunner R., Tonn J.C.,
Bhar O., Steinbach J.P., Simon M., Schramm J., Krex D., Schackert G.,
Reithmeier T., Nikkhah G., Loffler M., Weller M., Westphal M. and German
Glioma Network. (2010). Complementary Therapy use in Patients with
Glioma: An Observational Study. Neurology. 75, (24), p. 2229-2235.

177 | P a g e
Hegi M.E., Diserens A.C., Gorlia T., Hamou M.F., De Tribolet N., Weller
M., Kros J.M., Hainfellner J.A., Mason W., Mariani L., Bromberg J.E., Hau
P., Mirimanoff R.O., Cairncross J.G., Janzer R.C. and Stupp R. (2005).
MGMT Gene Silencing and Benefit from Temozolomide in Glioblastoma.
The New England Journal of Medicine. 352, (10), p. 997-1003.
Heidaran M.A., Pierce J.H., Yu J.C., Lombardi D., Artrip J.E., Fleming
T.P., Thomason A. and Aaronson S.A. (1991). Role of Alpha Beta
Receptor Heterodimer Formation in Beta Platelet-Derived Growth Factor
(PDGF) Receptor Activation by PDGF-Ab. The Journal of Biological
Chemistry. 266, (30), p. 20232-20237.
Hemmati H. D., Nakano I., Lazareff J. A., Masterman-Smith M.,
Geschwind D. H., Bronner-Fraser M., & Kornblum H. I. (2003). Cancerous
stem cells can arise from pediatric brain tumors. Proceedings of the
National Academy of Sciences of the United States of America. 100, (25),
p. 15178–15183.
Henderson J.W. and Donatelle R.J., 2004. Complementary and Alternative
Medicine Use by Women after Completion of Allopathic Treatment for
Breast Cancer. Alternative Therapies in Health and Medicine. 10, (1), p.
52-57.
Hermanson M., Funa K., Hartman M., Claesson-Welsh L., Heldin C.H.,
Westermark B. and Nister M. (1992). Platelet-Derived Growth Factor and
Its Receptors in Human Glioma Tissue: Expression of Messenger Rna and
Protein Suggests The Presence of Autocrine and Paracrine Loops. Cancer
Research. 52, (11), p. 3213-3219.
Herron M. and Glasser M. (2003). Use of and Attitudes toward
Complementary and Alternative Medicine among Family Practice Patients
in Small Rural Illinois Communities. Journal of Rural Health. 19, (3), p.
209-300.

178 | P a g e
Hertog M.G., Kromhout D., Aravanis C., Blackburn H., Buzina R., Fidanza
F., Giampaoli S., Jansen A., Menotti A. and Nedeljkovic S. (1995).
Flavonoid Intake and Long-Term Risk of Coronary Heart Disease and
Cancer in the Seven Countries Study. Archives of Internal Medicine. 155,
(4), p. 381-386.
Hilsden R.J. and Verhoef M.J. (1999). Complementary Therapies:
Evaluating Their Effectiveness in Cancer. Patient Education and
Counseling. 38, (2), p. 101-108.
Ho V.K., Reijneveld J.C., Enting R.H., Bienfait H.P., Robe P, Baumert BG,
Visser O. On behalf of the Dutch Society for Neuro-Oncology (LWNO).
(2014). Changing incidence and improved survival of gliomas. European
Journal of Cancer. 50, (13), p. 2309 – 2318.
Hoffman S., Propp J.M., McCarthy B.J. (2006). Temporal trends in
incidence of primary brain tumors in the United States, 1985–1999. Neuro-
Oncology. 8, (1), p. 27-37.
Hottinger A.F., Stupp R., Homicsko K. (2014). Standards of care and novel
approaches in the management of glioblastoma multiforme. Chinese
Journal of Cancer. 33, (1), p. 32-39.
House of Lords; Science and Technology, sixth report, 2001
http://www.parliament.the-stationery-
office.co.uk/pa/ld199900/ldselect/ldsctech/123/12301.htm (accessed June
2014).
Huang, W., Wan, C., Luo, Q., Huang, Z., & Luo, Q. (2014). Genistein-
Inhibited Cancer Stem Cell-Like Properties and Reduced
Chemoresistance of Gastric Cancer. International Journal of Molecular
Sciences. 15, (3), p.3432–3443.

179 | P a g e
Hurwitz H., Fehrenbacher L., Novotny W., Cartwright T., Hainsworth J.,
Heim W., Berlin J., Baron A., Griffing S., Holmgren E., Ferrara N., Fyfe G.,
Rogers B., Ross R. and Kabbinavar F. (2004). Bevacizumab Plus
Irinotecan, Fluorouracil, and Leucovorin for Metastatic Colorectal Cancer.
The New England Journal of Medicine. 350, (23), p. 2335-2342.
Hussain R.F., Nouri A.M. and Oliver R.T. (1993). A New Approach for
Measurement of Cytotoxicity Using Colorimetric Assay. Journal of
Immunological Methods. 160, (1), p. 89-96.
Hwang I.K., Yoo K.Y., Kim D.S., Jeong Y.K., Kim J.D., Shin H.K., Lim S.S.,
Yoo I.D., Kang T.C., Kim D.W., Moon W.K. and Won M.H. (2004).
Neuroprotective Effects of Grape Seed Extract on Neuronal Injury by
Inhibiting DNA Damage in the Gerbil Hippocampus after Transient
Forebrain Ischemia. Life Sciences. 75, (16), p. 1989-2001.
Ignatova T. N., Kukekov V. G., Laywell E. D., Suslov O. N., Vrionis F. D.
and Steindler D. A. (2002). Human cortical glial tumors contain neural
stem-like cells expressing astroglial and neuronal markers in vitro. Glia.
39, p. 193–206.
Inskip, P.D., Hoover, R.N., and Devesa, S.S. (2010). Brain cancer
incidence trends in relation to cellular telephone use in the United
States. Neuro-Oncology. 12, (11), p. 1147–1151.
ISD Scotland on request, April 2014. Similar data can be found here:
http://www.isdscotland.org/Health-Topics/Cancer/Publications/index.asp
Jansen M., De Witt Hamer P.C., Witmer A.N., Troost D. and Van Noorden
C.J.F. (2004). Current Perspectives on Antiangiogenesis Strategies in the
Treatment of Malignant Gliomas. Brain Research Reviews. 45, (3), p. 143-
163.
180 | P a g e
Jha H. C., Von Recklinghausen G. and Zilliken F. (1985). Inhibition of in
vitro microsomal lipid peroxidation by isoflavonoids.Biochem. Pharmacol.
34, p. 1367-1369.
Jirojwong S. and Maclennan R. (2002). Management of Episodes of
Incapacity by Families in Rural and Remote Queensland. Australian
Journal of Rural Health. 10, p. 249-255.
Jo G.H., Bögler O., Chwae Y.J., Yoo H., Lee S.H., Park J.B., Kim Y.J., Kim
J.H., Gwak H.S. (2014). Radiation-Induced Autophagy Contributes to Cell
Death and Induces Apoptosis Partly in Malignant Glioma Cells. Cancer
Res Treat. [Epub ahead of print] doi: 10.4143/crt.2013.159.
Johnson D.H., Fehrenbacher L., Novotny W.F., Herbst R.S., Nemunaitis
J.J., Jablons D.M., Langer C.J., Devore R.F., Gaudreault J., Damico L.A.,
Holmgren E. and Kabbinavar F. (2004). Randomized Phase II Trial
Comparing Bevacizumab Plus Carboplatin and Paclitaxel With Carboplatin
and Paclitaxel Alone in Previously Untreated Locally Advanced Or
Metastatic Non-Small-Cell Lung Cancer. Journal of Clinical Oncology. 22,
(11), p. 2184-2191.
Junck L. (2011). Bevacizumab Antiangiogenic Therapy for Glioblastoma.
Neurology. 76, (5), p. 414-415.
Kachra Z., Beaulieu E., Delbecchi L., Mousseau N., Berthelet F.,
Moumdjian R., Del Maestro R., Béliveau R. (1999). Expression of matrix
metalloproteinases and their inhibitors in human brain tumors. Clin Exp
Metastasis. 17, (7), p. 555-66.
Kamoun W.S., Ley C.D., Farrar C.T., Duyverman A.M., Lahdenranta J.,
Lacorre D.A., Batchelor T.T., Di Tomaso E., Duda D.G., Munn L.L.,
Fukumura D., Sorensen A.G. and Jain R.K. (2009). Edema Control by
Cediranib, A Vascular Endothelial Growth Factor Receptor–Targeted

181 | P a g e
Kinase Inhibitor, Prolongs Survival Despite Persistent Brain Tumor Growth
in Mice. Journal of Clinical Oncology. 27, (15), p. 2542-2552.
Kang, N.H., Shin, H.C., Oh, S., Lee, K.H., Lee, Y.B., Choi, K.C., (2016).
Soy milk digestion extract inhibits progression of prostate cancer cell
growth via regulation of prostate cancer‑specific antigen and cell cycle-
regulatory genes in human LNCaP cancer cells. Mol Med Rep. 14, (2),
p.1809-16.
Kanzawa T., Germano I.M., Komata T., Ito H., Kondo Y., Kondo S. (2004).
Role of autophagy in temozolomide-induced cytotoxicity for malignant
glioma cells. Cell Death Differ. 11, p. 448–57.
Kaptchuk T.J. and Eisenberg D.M. (1998). The Persuasive Appeal of
Alternative Medicine. Annals of Internal Medicine. 129, (12), p. 1061-1065.
Kaur M., Agarwal C., and Agarwal R. (2009). Anticancer and Cancer
Chemopreventive Potential of Grape Seed Extract and Other Grape-
Based Products. The Journal of Nutrition, 139(9), 1806S–1812S.
Kawai N., Lin W., Cao W.D., Ogawa D., Miyake K., Haba R., Maeda Y.,
Yamamoto Y., Nishiyama Y., Tamiya T. (2014) Correlation between 1F-
fluoromisonidazole PET and expression of HIF-1α and VEGF in newly
diagnosed and recurrent malignant gliomas. Eur J Nucl Med Mol Imaging.
41, (10), p. 1870-8.
Keilhauer G., Faissner A. and Schachner M. (1985). Differential Inhibition
of Neurone-Neurone, Neurone-Astrocyte and Astrocyte-Astrocyte
Adhesion by L1, L2 and N-CAM Antibodies. Nature. 316, (6030), p. 728-
730.
182 | P a g e
Kelly P.J. (1986). Applications and Methodology for Contemporary
Stereotactic Surgery. Neurological Research. 8, (1), p. 2-12.
Kernohan J.W. and Mabon R.F. (1949). A Simplified Classification of the
Gliomas. Mayo Clinic Proceedings.Mayo Clinic. 24, (3), p. 71-75.
Kessaris N., Fogarty M., Iannarelli P., Grist M., Wegner M., Richardson
W.D. (2006). Competing waves of oligodendrocytes in the forebrain and
postnatal elimination of an embryonic lineage. Nat Neurosci. 9, (2), p.173-
9.
Khanolkar, A.R., Ljung, R., Talbäck, M., Brooke, H.L., Carlsson, S.,
Mathiesen, T., Feychting, M., (2016). Socioeconomic position and the risk
of brain tumour: a Swedish national population-based cohort study. J
Epidemiol Community Health
Khaw A. K., Yong J. W. Y., Kalthur G. and Hande M. P. (2012). Genistein
induces growth arrest and suppresses telomerase activity in brain tumor
cells. Genes Chromosom. Cancer. 51, p. 961–974.
Khaw A. K., Yong J.W.Y., Kalthur G. and Hande M.P. (2012), Genistein
induces growth arrest and suppresses telomerase activity in brain tumor
cells. Genes Chromosom. Cancer, 51: 961–974.
Kheifets L., Renew D., Sias G. and Swanson J. (2010). Extremely low
frequency electric fields and cancer: Assessing the evidence.
Bioelectromagnetics. 31, (2), p. 89-101.
Kheifets L.I., Afifi A.A., Buffler P.A. and Zhang Z.W. (1995). Occupational
electric and magnetic field exposure and brain cancer: a meta-analysis.
Journal of occupational and environmental medicine / American College of
Occupational and Environmental Medicine. 37, (12), p. 1327-1341.
183 | P a g e
Khokha R., Waterhouse P., Yagel S., Lala P.K., Overall C.M., et al. (1989).
Antisense RNA-induced reduction in murine TIMP levels confers
oncogenicity on Swiss 3T3 cells. Science. 243, p. 947–950.
Khuder S.A., Mutgi A.B. and Schaub E.A. (1998). Meta-analyses of brain
cancer and farming. American Journal of Industrial Medicine. 34, (3), p.
252-260.
Kiekow, C.J., Figueiró, F., Dietrich, F., Vechia, L.D., Pires, E.N., Jandrey,
E.H., Gnoatto, S.C., Salbego, C.G., Battastini, A.M., Gosmann, G., (2016).
Quercetin derivative induces cell death in glioma cells by modulating NF-
κB nuclear translocation and caspase-3 activation. Eur J Pharm Sci. 10,
(84), p.116-22.
Kim C.F., Jackson E.L., Woolfenden A.E., Lawrence S., Babar I., Vogel S.,
Crowley D., Bronson R.T., Jacks T. (2005). Identification of
Bronchioalveolar Stem Cells in Normal Lung and Lung Cancer. Cell. 121,
(6), p. 823 – 835.
Kim K.J., Li B., Winer J., Armanini M., Gillett N., Phillips H.S. and Ferrara
N. (1993). Inhibition of Vascular Endothelial Growth Factor-Induced
Angiogenesis Suppresses Tumour Growth in vivo. Nature. 362, (6423), p.
841-844.
Kirkpatrick C., Page R. and Hayward K. (2006). Nonvitamin, Nonmineral
Supplement Use and Beliefs about Safety and Efficacy among Rural
Adults in Southeast and South Central Idaho. Journal of Nutrition for the
Elderly. 26, (1-2), p. 59-82.
Kleihues P. and Sobin L.H. (2000). World Health Organization
Classification of Tumors. Cancer. 88, (12), p. 2887.
184 | P a g e
Kleihues P., Burger P.C. and Scheithauer B.W. (1993). The New Who
Classification of Brain Tumours. Brain Pathology. 3, (3), p. 255-268.
Kleihues P., Louis D.N., Scheithauer B.W., Rorke L.B., Reifenberger G.,
Burger P.C. and Cavenee W.K. (2002). The WHO Classification of Tumors
of the Nervous System. Journal of Neuropathology and Experimental
Neurology. 61, (3), p. 215-25; Discussion 226-9.
Knott J.C., Edwards A.J., Gullan R.W., Clarke T.M. and Pilkington G.J.
(1990). A Human Glioma Cell Line Retaining Expression of GFAP and
Gangliosides, Recognized By A2B5 and LB1 Antibodies, after Prolonged
Passage. Neuropathology and Applied Neurobiology. 16, (6), p. 489-500.
Kohler G. and Milstein C. (1975). Continuous Cultures of Fused Cells
Secreting Antibody of Predefined Specificity. Nature. 256, (5517), p. 495-
497.
Kolkova K., Pedersen N., Berezin V. and Bock E. (2000). Identification of
an Amino Acid Sequence Motif in the Cytoplasmic Domain of the NCAM-
140 Kda Isoform Essential for Its Neuritogenic Activity. Journal of
Neurochemistry. 75, (3), p. 1274-1282.
Kostelac, D, Rechkemmer, G, Briviba, K (2003). Phytoestrogens modulate
binding response of estrogen receptors α and β to the estrogen response
element. J Agric Food Chem. 51, (26), p. 7632–7635
Krause D.S., Theise N.D., Collector M.I., Henegariu O., Hwang S.,
Gardner R., Neutzel S. and Sharkis S.J. (2001). Multi-Organ, Multi-
Lineage Engraftment by A Single Bone Marrow-Derived Stem Cell. Cell.
105, (3), p. 369-377.

185 | P a g e
Kreisl T.N., Kim L., Moore K., Duic P., Royce C., Stroud I., Garren N.,
Mackey M., Butman J.A., Camphausen K., Park J., Albert P.S. and Fine
H.A. (2009). Phase II Trial of Single-Agent Bevacizumab Followed By
Bevacizumab Plus Irinotecan at Tumor Progression in Recurrent
Glioblastoma. Journal of Clinical Oncology. 27, (5), p. 740-745.
Krex D., Klink B., Hartmann C., Von Deimling A., Pietsch T., Simon M.,
Sabel M., Steinbach J.P., Heese O., Reifenberger G., Weller M.,
Schackert G. and German Glioma Network. (2007). Long-Term Survival
with Glioblastoma Multiforme. Brain: A Journal of Neurology. 130, (Pt 10),
p. 2596-2606.
Kukekov V. G., Laywell E. D., Thomas L. B. and Steindler D. A. (1997). A
nestin-negative precursor cell from the adult mouse brain gives rise to
neurons and glia. Glia. 2, p. 399–407.
Kumar, S., Kumar, D., Raina, K., Agarwal, R. and Agarwal, C., (2014).
Functional modification of adipocytes by grape seed extract impairs their
pro-tumorigenic signaling on colon cancer stem cells and the daughter
cancer cells. Oncotarget. 5, (20), p. 10151-69
Kundi M. (2010). Essential problems in the interpretation of epidemiologic
evidence for an association between mobile phone use and brain tumours.
Comptes Rendus Physique, 11(9-10), pp. 556-563.
La V.D., Bergeron C., Gafner S., Grenier D. (2009). Grape seed extract
suppresses lipopolysaccharide-induced matrix metalloproteinase (MMP)
secretion by macrophages and inhibits human MMP-1 and -9 activities. J
Periodontol. 80, (11), p.1875-82.
Labriola D. and Livingston R. (1999). Possible Interactions between
Dietary Antioxidants and Chemotherapy. Oncology. 13, (7), p. 1003-8.

186 | P a g e
Lahkola A., Salminen T., Auvinen A. (2005). Selection Bias Due to
Differential Participation in a Case–Control Study of Mobile Phone Use
and Brain Tumors. Annals of Epidemiology. 15, (5), p. 321 – 325.
Lai H. (2004). Interaction of Microwaves and a Temporally Incoherent
Magnetic Field on Spatial Learning in the Rat. Physiology & Behavior,
82(5), Pp. 785-789.
Lai H. and Singh N.P. (1996). Single- and Double-Strand DNA Breaks in
Rat Brain Cells After Acute Exposure To Radiofrequency Electromagnetic
Radiation. International Journal of Radiation Biology. 69, (4), p. 513-521.
Laird A. K. (1965). Dynamics of Tumour Growth: Comparison of Growth
Rates and Extrapolation of Growth Curve to One Cell. British Journal of
Cancer. 19, (2), p. 278–291.
Lampert K., Machein U., Machein M.R., Conca W., Peter H.H. and Volk B.
(1998). Expression of matrix metalloproteinases and their tissue inhibitors
in human brain tumors. Am J Pathol. 153, p. 429– 437.
Lang F.F., Gumin J., Amano T., Hata N., Heimberger A.B., Marini F.,
Andreeff M., Aldape K.D., Sulman E. and Colman H. (2008). Tumor-
Derived Mesenchymal Stem Cells in Human Gliomas: Isolation and
Biological Properties. ASCO Meeting Abstracts. 26, (15), p. 2001.
Lapidot T. (2001). Mechanism of Human Stem Cell Migration and
Repopulation of Nod/Scid and B2mnull Nod/Scid Mice. The Role of Sdf-
1/Cxcr4 Interactions. Annals of the New York Academy of Sciences. 938,
p. 83-95.

187 | P a g e
Larocca R.V., Vitaz T.W., Morassutti D.J., Doyle M.J., Glisson S.D., Hargis
J.B., Goldsmith G.H., Cervera A., Stribinskiene L. and New P. (2005). A
Phase II Study of Radiation With Concomitant and Then Sequential
Temozolomide (TMZ) in Patients (Pts) With Newly Diagnosed
Supratentorial High Grade Malignant Glioma (MG) Who Have Undergone
Surgery With Carmustine (BCNU) Wafer Insertion. Journal of Clinical
Oncology: ASCO Annual Meeting Proceedings. 23, (16S) p. 1547
Laurent C., Besançon P. and Caporiccio B., 2007. Flavonoids From a
Grape Seed Extract Interact With Digestive Secretions and Intestinal Cells
As Assessed in an in vitro Digestion/Caco-2 Cell Culture Model. Food
Chemistry. 100, (4), p. 1704-1712.
Leavesley D.I., Schwartz M.A., Rosenfeld M., Cheresh D.A. (1993).
Integrin beta 1- and beta 3-mediated endothelial cell migration is triggered
through distinct signaling mechanisms. The Journal of Cell Biology. 121,
(1), p. 163-170.
Leco K.J., Khokha R., Pavloff N., Hawkes S.P., and Edwards D.R. (1994).
Tissue inhibitor of metalloproteinase-3 (TIMP-3) is an extracellular matrix-
associated protein with a distinctive pattern of expression in mouse cells
and tissues. J Biol Chem. 269, p. 9352–9360.
Lefranc F., Brotchi J. and Kiss R. (2005). Possible Future Issues in the
Treatment of Glioblastomas: Special Emphasis on Cell Migration and the
Resistance of Migrating Glioblastoma Cells to Apoptosis. Journal of
Clinical Oncology. 23, (10), p. 2411-2422.
Lei Hou, L., Jiang, J., Liu, B., Han, W., Wu, Y., Zou, X., et al. Smoking and
adult glioma: a population-based case-control study in China, (2016).
Neuro Oncol. 18, (1), p. 105-113.

188 | P a g e
Leipert B., Matsui D. and Rieder M. (2006). Women and Pharmacologic
Therapy in Rural and Remote Canada. Canadian Journal of Rural Health.
11, (4), p. 296-300.
Leipert B.D., Matsui D., Wagner J. and Rieder M.J. (2008). Rural Women
and Pharmacologic Therapy: Needs and Issues in Rural Canada.
Canadian Journal of Rural Medicine. 13, (4), p. 171-179.
Leis A. and Millard J. (2007). Complementary and Alternative Medicine
(CAM) and Supportive Care in Cancer: A Synopsis of Research
Perspectives and Contributions by an Interdisciplinary Team. Supportive
Care in Cancer: Official Journal of the Multinational Association of
Supportive Care in Cancer. 15, (8), p. 909-912.
Levine J.M. and Card J.P. (1987). Light and Electron Microscopic
Localization of a Cell Surface Antigen (NG2) in the Rat Cerebellum:
Association with Smooth Protoplasmic Astrocytes. The Journal of
Neuroscience: The Official Journal of the Society for Neuroscience. 7, (9),
p. 2711-2720.
Levine J.M. and Stallcup W.B. (1987). Plasticity of Developing Cerebellar
Cells in vitro Studied with Antibodies against the NG2 Antigen. The
Journal of Neuroscience: The Official Journal of the Society for
Neuroscience. 7, (9), p. 2721-2731.
Levine J.M., Stincone F. and Lee Y.S. (1993). Development and
Differentiation of Glial Precursor Cells in the Rat Cerebellum. Glia. 7, (4),
p. 307-321.
Levine, J.M., 1994. Increased Expression of The Ng2 Chondroitin-Sulfate
Proteoglycan After Brain Injury. The Journal of Neuroscience: The Official
Journal of The Society For Neuroscience, 14(8), Pp. 4716-4730.
189 | P a g e
Levkovitz Y., Gil-Ad I., Zeldich E., Dayag M. and Weizman A. (2005).
Differential Induction of Apoptosis by Antidepressants in Glioma and
Neuroblastoma Cell Lines: Evidence for P-C-Jun, Cytochrome C, and
Caspase-3 Involvement. Journal of Molecular Neuroscience. 27, (1), p. 29-
42.
Lewin M.H., Bailey N., Bandaletova T., Bowman R., Cross A.J., Pollock J.,
Shuker D.E., Bingham S.A. (2006). Red Meat Enhances the Colonic
Formation of the DNA Adduct O6-Carboxymethyl Guanine: Implications for
Colorectal Cancer Risk. Cancer Res. 66, p. 1859-1865.
Li H., Liu J. and Hofmann M. (1995). CD44 Expression Patterns in Primary
and Secondary Brain Tumors. Zhonghua Yi Xue Za Zhi. 75, (9), p. 525-8,
573.
Li H., Liu J., Hofmann M., Hamou M.F. and De Tribolet N. (1995).
Differential CD44 Expression Patterns in Primary Brain Tumours and Brain
Metastases. British Journal of Cancer. 72, (1), p. 160-163.
Li Z., Li J., Mo B., Hu C., Liu H., Qi H., Wang X. and Xu J. (2008).
Genistein Induces Cell Apoptosis in MDA-MB-231 Breast Cancer Cells Via
The Mitogen-Activated Protein Kinase Pathway. Toxicology in vitro: An
International Journal Published in Association with Bibra. 22, (7), p. 1749-
1753.
Li, H.G., Chen, J.X., Xiong, J.H., Zhu, J.W., (2016). Myricetin exhibits anti-
glioma potential by inducing mitochondrial-mediated apoptosis, cell cycle
arrest, inhibition of cell migration and ROS generation. J BUON. 21, (1),
p.182-90.
Libermann T.A., Nusbaum H.R., Razon N., Kris R., Lax I., Soreq H.,
Whittle N., Waterfield M.D., Ullrich A. and Schlessinger J. (1985).
Amplification and Overexpression of the EGF Receptor Gene in Primary
190 | P a g e
Human Glioblastomas. Journal of Cell Science.Supplement 3, p. 161-172.
Lind B.K., Diehr P.K., Grembowski D.E. and Lafferty W.E. (2009).
Chiropractic Use by Urban and Rural Residents with Insurance Coverage.
Journal of Rural Health. 25, (3), p. 253-258.
Liotta L.A. (1986). Tumor Invasion and Metastases--Role of the
Extracellular Matrix: Rhoads Memorial Award Lecture. Cancer Research.
46, (1), p. 1-7.
Lo, S.F., Chang, S.N., Muo, C.H., Chen, S.Y., Liao, F.Y., Dee, S.W.,
Chen, P.C., Sung, F.C., (2012). Modest increase in risk of specific types of
cancer types in type 2 diabetes mellitus patients. Int J Cancer. 132, (1),
p.182-8
Louis D.N., Ohgaki H., Wiestler O.D., Cavenee W.K., Burger P.C., Jouvet
A., Scheithauer B.W. and Kleihues P. (2007). The 2007 WHO
classification of tumours of the central nervous system. Acta
Neuropathologica, 114(2), pp. 97-109.
Lund-Johansen M., Forsberg K., Bjerkvig R. and Laerum O.D. (1992).
Effects of Growth Factors on a Human Glioma Cell Line during Invasion
into Rat Brain Aggregates in Culture. Acta Neuropathologica. 84, (2), p.
190-197.
Maclennan A.H., Wilson D.H. and Taylor A.W. (2002). The Escalating Cost
and Prevalence of Alternative Medicine. Preventive Medicine. 35, p. 166-
173.
Malden L.T., Novak U., Kaye A.H. and Burgess A.W. (1988). Selective
Amplification of the Cytoplasmic Domain of the Epidermal Growth Factor
Receptor Gene in Glioblastoma Multiforme. Cancer Research. 48, (10), p.
2711-2714.

191 | P a g e
Malhotra, S., Tavakkoli, M., Edraki, N., Miri, R., Sharma, S.K., Prasad,
A.K., Saso, L., Len, C., Parmar, V.S., Firuzi, O., (2016). Neuroprotective
and Antioxidant Activities of 4-Methylcoumarins: Development of
Structure-Activity Relationships. Biol Pharm Bull. 39, (9), p.1544-8.
Malkin D. (1994). p53 and the Li-Fraumeni syndrome. Biochim Biophys
Acta.1198, p. 197–213.
Mallikarjun, S. and McNeill Sieburth, R., (2015). Aspartame and Risk of
Cancer: A Meta-analytic Review. Archives of Environmental &
Occupational Health. 70, (3)
Malmer B., Haraldsson S., Einarsdottir E., Lindgren P., Holmberg D.
(2005). Homozygosity mapping of familial glioma in Northern Sweden.
Acta Oncol. 44, p. 114–119.
Marcela, G.M., Eva, R.G., Del Carmen, R.M., Rosalva, M.E., (2016).
Evaluation of the Antioxidant and Antiproliferative Effects of Three Peptide
Fractions of Germinated Soybeans on Breast and Cervical Cancer Cell
Lines.Plant Foods Hum Nutr.
Marcus J., Honigbaum S., Shroff S., Honke K., Rosenbluth J. and Dupree
J.L. (2006). Sulfatide is Essential for the Maintenance of CNS Myelin and
Axon Structure. Glia. 53, (4), p. 372-381.
Martin K., Akinwunmi J., Rooprai H.K., Kennedy A.J., Linke A., Ognjenovic
N., Pilkington G.J. (1995). Nonexpression of CD15 by neoplastic glia: a
barrier to metastasis? Anticancer Res. 15, (4), p. 1159-66.
Martinez C., Vicente V., Yanez J., Alcaraz M., Castells M.T., Canteras M.,
Benavente-Garcia O. and Castillo J. (2005). The Effect of the Flavonoid
Diosmin, Grape Seed Extract and Red Wine on the Pulmonary Metastatic
B16f10 Melanoma. Histology and Histopathology. 20, (4), p. 1121-1129.

192 | P a g e
Martini F., Iaccheri L., Lazzarin, L., Carinci P., Corallini A., Gerosa M.,
Iuzzolino P., Barbanti-Brodano G. and Tognon M. (1996). SV40 early
region and large T antigen in human brain tumors, peripheral blood cells,
and sperm fluids from healthy individuals. Cancer research. 56, (20), p.
4820-4825.
Marusyk A, Polyak K. (2010). Tumor heterogeneity: Causes and
consequences. Biochim. Biophys. Acta. 1805, p. 105–117.
Masutani M., Nozaki T., Wakabayashi K. and Sugimura T. (1995). Role of
poly(ADP-ribose) polymerase in cell-cycle checkpoint mechanisms
following γ-irradiation. Biochimie. 77, (6), p. 462-465.
Matrisian L.M., Glaichenhaus N., Gesnel M.-C. and Breathnach R. (1985)
EMBO J. 4, p. 1435-1440.
Matsusako T., Muramatsu H., Shirahama T., Muramatsu T. and Ohi Y.,
(1992). A Metastasis-Associated Antigen Is Present on A 60 Kda
Glycoprotein in Transitional Cell Carcinoma of the Human Urinary Bladder.
The Histochemical Journal. 24, (11), p. 805-810.
McCormack B.M., Miller D.C., Budzilovich G.N., Voorhees G.J. and
Ransohoff J. (1992). Treatment and Survival of Low-Grade Astrocytoma in
Adults--1977-1988. Neurosurgery. 31, (4), p. 636-42.
McDonough W.S, Johansson A, Joffee H, Giese A, Berens M.E. (1999).
Gap junction intercellular communication in gliomas is inversely related to
cell motility Int J. Dev. Neurosci. 17, p. 601–611.
McGirt M.J., Than K.D., Weingart J.D., Chaichana K.L., Attenello F.J., Olivi
A., Laterra J., Kleinberg L.R., Grossman S.A., Brem H. and Quiñones-
Hinojosa A. (2009). Gliadel (BCNU) Wafer plus Concomitant
Temozolomide Therapy After Primary Resection of Glioblastoma

193 | P a g e
Multiforme. Journal of Neurosurgery. 110, (3), p. 583-588.
McGirt M.J., Villavicencio A.T., Bulsara K.R., Friedman H.S. and Friedman
A.H. (2002). Management of Tumor Bed Cysts after Chemotherapeutic
Wafer Implantation. Journal of Neurosurgery. 96, (5), p. 941-945.
McKinney P.A. (2004). Brain Tumours: Incidence, Survival, and Aetiology.
Journal of Neurology, Neurosurgery, and Psychiatry. 75, (2), p. ii12-7.
Mee T., Whatmough P., Broad L., Dunn C., Maslanyj M., Allen S., Muir K.,
Mckinney P.A. and Van Tongeren M. (2009). Occupational exposure of UK
adults to ELF magnetic fields. Occup Environ Med. 66, (9), p. 619-627.
Mehdinezhad, N., Ghannadi, A., Yegdaneh, A., (2016). Phytochemical and
biological evaluation of some Sargassum species from Persian Gulf. Res
Pharm Sci. 11, (3), p.243-9.
Menn B., Garcia-Verdugo J. M., Yaschine C., Gonzalez-Perez O., Rowitch
D., Alvarez-Buylla A. (2006). Origin of oligodendrocytes in the
subventricular zone of the adult brain. J. Neurosci. 26, p. 7907–7918.
Merzak A. and Pilkington G.J. (1997). Molecular and Cellular Pathology of
Intrinsic Brain Tumours. Cancer Metastasis Reviews. 16, (1-2), p. 155-
177.
Mezey E., Chandross K.J., Harta G., Maki R.A. and Mckercher S.R.,
(2000). Turning Blood into Brain: Cells Bearing Neuronal Antigens
Generated in vivo from Bone Marrow. Science. 290, (5497), p. 1779-1782.
Miller C.R. and Perry A. (2007). Glioblastoma. Archives of Pathology &
Laboratory Medicine. 131, (3), p. 397-406.

194 | P a g e
Miller K., Wang M., Gralow J., Dickler M., Cobleigh M., Perez E.A.,
Shenkier T., Cella D. and Davidson N.E. (2007). Paclitaxel plus
Bevacizumab versus Paclitaxel Alone for Metastatic Breast Cancer. New
England Journal of Medicine. 357, (26), p. 2666-2676.
Miyamoto S., Teramoto H., Coso O.A., Gutkind J.S., Burbelo P.D.,
Akiyama S.K. and Yamada K.M. (1995). Integrin Function: Molecular
Hierarchies of Cytoskeletal and Signaling Molecules. The Journal of Cell
Biology. 131, (3), p. 791-805.
Moga M.M., Mowery B. and Geib R. (2008). Patients Are More Likely To
Use Complementary Medicine If It Is Locally Available. Rural and Remote
Health. 8, (1028), [Epub]
Mohanam S., Wang S.W., Rayford A., Yamamoto M., Sawaya R.,
Nakajima M., Liotta L.A., Nicolson G.L., Stetler-Stevenson W.G., Rao J.S.
(1995). Expression of tissue inhibitors of metalloproteinases: negative
regulators of human glioblastoma invasion in vivo. Clin Exp Metastasis.13,
(1), p. 57-62.
Moore M.R., Black P.M., Ellenbogen R., Gall C.M. and Eldredge E. (1989).
Stereotactic Craniotomy: Methods and Results Using the Brown-Roberts-
Wells Stereotactic Frame. Neurosurgery. 25, (4), p. 572-7.
Mosmann T. (1983). Rapid Colorimetric Assay for Cellular Growth and
Survival: Application to Proliferation and Cytotoxicity Assays. Journal of
Immunological Methods. 65, (1-2), p. 55-63.
Mukherji S.K. (2010). Bevacizumab (Avastin). American Journal of
Neuroradiology. 31, (2), p. 235-236.

195 | P a g e
Munstedt K., Kirsch K., Milch W., Sachsse S. and Vahrson H. (1996).
Unconventional Cancer Therapy--Survey of Patients with Gynaecological
Malignancy. Archives of Gynecology and Obstetrics. 258, (2), p. 81-88.
Murphy A.N., Unsworth E.J., and Stetler-Stevenson W.G. (1993). Tissue
inhibitor of metalloproteinases-2 inhibits bFGF-induced human
microvascular endothelial cell proliferation. J. Cell. Physiol.157, p. 351–
358.
Nagase H., Visse R. and Murphy G. (2006). Structure and Function of
Matrix Metalloproteinases and Timps. Cardiovascular Research. 69, (3), p.
562-573.
Nagase, H., Meng, Q., Malinovskii, V., Huang, W., Chung, L., Bode, W.,
Maskos, K. and Brew K. (1999). Engineering of selective TIMPs. Ann N Y
Acad Sci. 30, (878), p. 1-11.
Nagasubramanian R. and Dolan M.E. (2003). Temozolomide: Realizing
the Promise and Potential. Current Opinion in Oncology. 15, (6), p. 412-
418.
Nagy J.A., Brown L.F., Senger D.R., Lanir N., Van De Water L., Dvorak
A.M. and Dvorak H.F. (1989). Pathogenesis of Tumor Stroma Generation:
A Critical Role for Leaky Blood Vessels and Fibrin Deposition. Biochimica
Et Biophysica Acta. 948, (3), p. 305-326.
Nakagawa T., Kubota T., Kabuto M. and Kodera T. (1996). Hyaluronic
Acid Facilitates Glioma Cell Invasion in vitro. Anticancer Research. 16,
(5a), p. 2917-2922.

196 | P a g e
Nakamizo A., Marini F., Amano T., Khan A., Studeny M., Gumin J., Chen
J., Hentschel S., Vecil G., Dembinski J., Andreeff M. and Lang F.F. (2005).
Human Bone Marrow-Derived Mesenchymal Stem Cells in the Treatment
of Gliomas. Cancer Research. 65, (8), p. 3307-3318.
Nakano A., Tani E., Miyazaki K., Furuyama J., Matsumoto T. (1993).
Expressions of matrilysin and stromelysin in human glioma cells. Biochem
Biophys Res Commun. 192, (3), p. 999-1003.
Nakata S., Ito K., Fujimori M., Shingu K., Kajikawa S., Adachi W.,
Matsuyama I., Tsuchiya S., Kuwano M. and Amano J. (1998). Involvement
of Vascular Endothelial Growth Factor and Urokinase-Type Plasminogen
Activator Receptor in Microvessel Invasion in Human Colorectal Cancers.
International Journal of Cancer. 79, (2), p. 179-186.
Navo M.A., Phan J., Vaughan C., Palmer J.L., Michaud L., Jones K.L.,
Bodurka D.C., Basen-Engquist K., Hortobagyi G.N., Kavanagh J.J. and
Smith J.A. (2004). An Assessment of the Utilization of Complementary and
Alternative Medication in Women with Gynecologic or Breast
Malignancies. Journal of Clinical Oncology. 22, (4), p. 671-677.
Newell S. and Sanson-Fisher R.W. (2000). Australian Oncologists' Self-
Reported Knowledge and Attitudes about Non-Traditional Therapies Used
By Cancer Patients. The Medical Journal of Australia. 172, (3), p. 110-113.
Newlands E.S., O'reilly S.M., Glaser M.G., Bower M., Evans H., Brock C.,
Brampton M.H., Colquhoun I., Lewis P., Rice-Edwards J.M., Illingworth
R.D. and Richards P.G. (1996). The Charing Cross Hospital Experience
with Temozolomide in Patients with Gliomas. European Journal of Cancer.
32a, (13), p. 2236-2241.
Newlands E.S., Stevens M.F., Wedge S.R., Wheelhouse R.T. and Brock
C. (1997). Temozolomide: A Review of Its Discovery, Chemical Properties,
Pre-Clinical Development and Clinical Trials. Cancer Treatment Reviews.
197 | P a g e
23, (1), p. 35-61.
Ngai K.C., Yeung C.Y. and Karlberg J. (1998). Modification of the MTT
Method for the Study of Bilirubin Cytotoxicity. Acta Paediatrica Japonica.
40, (4), p. 313-317.
Nichols E., Sullivan T., Ide B., Shreffler-Grant J. and Weinert C. (2005).
Health Care Choices: Complementary Therapy, Chronic Illness, and Older
Rural Dwellers. Journal of Holistic Nursing. 23, (4), p. 381-394.
Nichols E., Weinert C., Grant J.S. and Ide B. (2006). Complementary and
Alternative Medicine Providers in Rural Locations. Online Journal of Rural
Nursing and Health Care. 6, (2), p. 40-46.
Nikkhah G., Tonn J.C., Hoffmann O., Kraemer H.P., Darling J.L.,
Schachenmayr W. and Schonmayr R. (1992). The MTT Assay for
Chemosensitivity Testing of Human Tumors of the Central Nervous
System. Part II: Evaluation of Patient- and Drug-Specific Variables.
Journal of Neuro-Oncology. 13, (1), p. 13-24.
Nikkhah G., Tonn J.C., Hoffmann O., Kraemer H.P., Darling J.L.,
Schonmayr R. and Schachenmayr W. (1992). The MTT Assay for
Chemosensitivity Testing of Human Tumors of the Central Nervous
System. Part I: Evaluation of Test-Specific Variables. Journal of Neuro-
Oncology. 13, (1), p. 1-11.
Nilsson M., Trehn G. and Asplund K. (2001). Use of Complementary and
Alternative Medicine Remedies in Sweden. A Population-Based
Longitudinal Study within the Northern Sweden Monica Project. Journal of
Internal Medicine. 250, (3), p. 225-233.
Nordenson I., Mild K.H., Järventaus H., Hirvonen A., Sandström M., Wilén
J., Blix N. and Norppa H. (2001). Chromosomal Aberrations in Peripheral
Lymphocytes of Train Engine Drivers. Bioelectromagnetics. 22, (5), p. 306-
315.
198 | P a g e
Northern Ireland Cancer Registry on request, October 2012. Similar data
can be found here: http://www.qub.ac.uk/research-
centres/nicr/CancerData/OnlineStatistics
Nuttall R.K., Pennington C.J., Taplin J., Wheal A., Yong V.W., Forsyth P.A.
and Edwards D.R. (2003). Elevated Membrane-Type Matrix
Metalloproteinases in Gliomas Revealed by Profiling Proteases and
Inhibitors in Human Cancer Cells. Molecular Cancer Research. 1, (5), p.
333-345.
Oak M.H., El Bedoui J. and Schini-Kerth V.B. (2005). Antiangiogenic
Properties of Natural Polyphenols from Red Wine and Green Tea. The
Journal of Nutritional Biochemistry. 16, (1), p. 1-8.
Occhiuto F., Zangla G., Samperi S., Palumbo D.R., Pino A., De Pasquale
R. and Circosta C. (2008). The Phytoestrogenic Isoflavones from Trifolium
Pratense L. (Red Clover) Protects Human Cortical Neurons From
Glutamate Toxicity. Phytomedicine. 15, (9), p. 676-682.
Office for National Statistics on request, June 2012. Similar data can be
found here: http://www.ons.gov.uk/ons/rel/vsob1/cancer-statistics-
registrations--england--series-mb1-/index.html
Oh D. and Prayson R.A. (1999). Evaluation of Epithelial and Keratin
Markers in Glioblastoma Multiforme: An Immunohistochemical Study.
Archives of Pathology & Laboratory Medicine. 123, (10), p. 917-920.
Oka N., Soeda A., Inagaki A., Onodera M., Maruyama H., Hara A.,
Kunisada T., Mori H. and Iwama T. (2007). VEGF Promotes
Tumorigenesis and Angiogenesis of Human Glioblastoma Stem Cells.
Biochemical and Biophysical Research Communications. 360, (3), p. 553-
559.
Okada Y., Morodomi T., Enghild J. J., Suzuki K., Yasui A., Nakanishi I.,
Salvesen G. and Nagase H. (1990), Matrix metalloproteinase 2 from
human rheumatoid synovial fibroblasts. European Journal of Biochemistry.

199 | P a g e
194, p. 721–730.
Okamoto I., Kawano Y., Matsumoto M., Suga M., Kaibuchi K., Ando M.,
Saya H.(1999). Regulated CD44 cleavage under the control of protein
kinase C, calcium influx, and the Rho family of small G proteins. J Biol
Chem. 274, (36), p. 25525-34.
Okura A., Arakawa H., Oka H., Yoshinari T. and Monden Y. (1988). Effect
of genistein on topoisomerase activity and on the growth of [Val 12]Ha-ras-
transformed NIH 3T3 cells. Biochem Biophys Res Commun. 157, p. 183-
189.
Olivi A., Grossman S.A., Tatter S., Barker F., Judy K., Olsen J., Bruce J.,
Hilt D., Fisher J. and Piantadosi S. (2003). Dose Escalation of Carmustine
in Surgically Implanted Polymers in Patients With Recurrent Malignant
Glioma: A New Approaches To Brain Tumor Therapy CNS Consortium
Trial. Journal of Clinical Oncology. 21, (9), p. 1845-1849.
Olney, J.W., Farber, N.B., Spitznagel, E. and Robins, L.E., (1996).
Increasing Brain Tumor Rates: Is There a Link to Aspartame? Journal of
Neuropathology & Experimental Neurology. 55, (11), p.1115-1123
Omuro A.M., Leite C.C., Mokhtari K. and Delattre J.Y. (2006). Pitfalls in
the Diagnosis of Brain Tumours. Lancet Neurology. 5, (11), p. 937-948.
Onishi M., Ichikawa T., Kurozumi K., Date I. (2011). Angiogenesis and
invasion in glioma. Brain Tumor Pathol. 28, (1), p. 13-24.
Ornitz D.M. and Itoh N. (2001). Fibroblast Growth Factors. Genome
Biology. 2, (3), p. Reviews 3005.
Ostermann S., Csajka C., Buclin T., Leyvraz S., Lejeune F., Decosterd
L.A. and Stupp R. (2004). Plasma and Cerebrospinal Fluid Population
Pharmacokinetics of Temozolomide in Malignant Glioma Patients. Clinical
Cancer Research. 10, (11), p. 3728-3736.

200 | P a g e
Ouhtit, A., Gaur, R. L., Abdraboh, M., Ireland, S. K., Rao, P. N., Raj, S.
G.,et al. (2013). Simultaneous Inhibition of Cell-Cycle, Proliferation,
Survival, Metastatic Pathways and Induction of Apoptosis in Breast Cancer
Cells by a Phytochemical Super-Cocktail: Genes That Underpin Its Mode
of Action. Journal of Cancer. 4, (9), p. 703–715.
Owens G.C., Orr E.A., Demasters B.K.K., Muschel R.J., Berens M.E. and
Kruse C.A. (1998). Overexpression of a Transmembrane Isoform of Neural
Cell Adhesion Molecule Alters the Invasiveness of Rat CNS-1 Glioma.
Cancer Research. 58, (9), p. 2020-2028.
Page M., Bejaoui N., Cinq-Mars B. and Lemieux P. (1988). Optimization of
the Tetrazolium-Based Colorimetric Assay for the Measurement of Cell
Number and Cytotoxicity. International Journal of Immunopharmacology.
10, (7), p. 785-793.
Palecek S.P., Loftus J.C., Ginsberg M.H., Lauffenburger D.A. and Horwitz
A.F. (1997). Integrin-Ligand Binding Properties Govern Cell Migration
Speed Through Cell-Substratum Adhesiveness. Nature. 385, (6616), p.
537-540.
Paleologos NA. (2001). Oligodendroglioma. Curr Treatment Options
Neurol. 3, p. 59–66.
Pan, H.C., Jiang, Q., Yu, Y., Mei, J.P., Cui, Y.K., Zhao, W.J., (2015).
Quercetin promotes cell apoptosis and inhibits the expression of MMP-
9 and fibronectin via the AKT and ERK
signalling pathways in human glioma cells. Neurochem Int. 80, p. 60-71
Paper D.H. (1998). Natural Products as Angiogenesis Inhibitors. Planta
Medica. 64, (8), p. 686-695.
Park H.C., Bao C., Ko J., Lee J., Lee H.L. (2014). 6,7,4-
Trihydroxyisoflavone, a daidzein metabolites, regulated glycogen synthase
kinase 3β/β-catenin signaling and inhibited cell proliferation in
MCF10DCIS.com human breast cancer cells. Proceedings of the 105th

201 | P a g e
Annual Meeting of the American Association for Cancer Research; AACR;
Cancer Res. 74, (19): Abstract nr 4228.
Patel M., Mccully C., Godwin K. and Balis F.M. (2003). Plasma and
Cerebrospinal Fluid Pharmacokinetics of Intravenous Temozolomide in
Non-Human Primates. Journal of Neuro-Oncology. 61, (3), p. 203-207.
Paulsen F., Hoffmann W., Becker G., Belka C., Weinmann M., Classen J.,
Kortmann R.D. and Bamberg M. (1999). Chemotherapy in the Treatment
of Recurrent Glioblastoma Multiforme: Ifosfamide versus Temozolomide.
Journal of Cancer Research and Clinical Oncology. 125, (7), p. 411-418.
Paulus W., Grothe C., Sensenbrenner M., Janet T., Baur I., Graf M. and
Roggendorf W. (1990). Localization of Basic Fibroblast Growth Factor, a
Mitogen and Angiogenic Factor, in Human Brain Tumors. Acta
Neuropathologica. 79, (4), p. 418-423.
Paunu N., Lahermo P., Onkamo P., Ollikainen V., Rantala I., Helen P., et
al. (2002). A novel low-penetrance locus for familial glioma at 15q23-
q26.3. Cancer Res. 62, p. 3798–3802.
Pavese J.M., Farmer R.L., Bergan R.C. (2010). Inhibition of Cancer Cell
Invasion and Metastasis by Genistein. Cancer Metastasis Reviews. 29,
(3), p.465-482.
Pavese J.M., Krishna S.N., Bergan R.C. (2014). Genistein inhibits human
prostate cancer cell detachment, invasion, and metastasis. Am J Clin Nutr.
100, (Supplement 1), p. 431S-436S. [Epub ahead of print].
Pedersen P.H., Ness G.O., Engebraaten O., Bjerkvig R., Lillehaug J.R.
and Laerum O.D. (1994). Heterogeneous Response to the Growth Factors
[EGF, PDGF (BB), TGF-Alpha, BFGF, IL-2] on Glioma Spheroid Growth,
Migration and Invasion. International Journal of Cancer. 56, (2), p. 255-
261.
Pedroja B.S., Kang L.E., Imas A.O., Carmeliet P., Bernstein A.M. (2009).

202 | P a g e
Plasminogen Activator Inhibitor-1 Regulates Integrin αvβ3 Expression and
Autocrine Transforming Growth Factor β Signaling. The Journal of
Biological Chemistry. 284, (31), p. 20708-20717.
Peng L., Wang B. and Ren P. (2005). Reduction of MTT by Flavonoids in
the Absence of Cells. Colloids and Surfaces B: Biointerfaces. 45, (2), p.
108-111.
Pepper C., Jasani B., Navabi H., Wynford-Thomas D. and Gibbs A.R.,
(1996). Simian virus 40 large T antigen (SV40LTAg) primer specific DNA
amplification in human pleural mesothelioma tissue. Thorax. 51, (11), p.
1074-1076.
Persson B.R., Salford L.G., Brun A., Eberhardt J.L. and Malmgren L.,
(1992). Increased permeability of the blood-brain barrier induced by
magnetic and electromagnetic fields. Annals of the New York Academy of
Sciences. 649, p. 356-358.
Pfenninger, C.V., Roschupkina T., Hertwig F., Kottwitz D., Englund E.,
Bengzon J., Jacobsen S.E. and Nuber U.A. (2007). CD133 is not present
on Neurogenic Astrocytes in the Adult Subventricular Zone, but on
Embryonic Neural Stem Cells, Ependymal Cells, and Glioblastoma Cells.
Cancer Research. 67, (12), p. 5727-5736.
Phillips B.W., Sharma R., Leco P.A. and Edwards D.R. (1999). A
sequence-selective single-strand DNA-binding protein regulates basal
transcription of the mouse tissue inhibitor of metalloproteinases-1 (TIMP-1)
gene. J Biol Chem. 274, p. 22197–22207.
Pierpoint W.S. (1990). PQQ in Plants. Trends in Biochemical Sciences.
15, (8), p. 299.
Pilkington G.J. (1992). Glioma Heterogeneity in vitro: The Significance of
Growth Factors and Gangliosides. Neuropathology and Applied
Neurobiology. 18, (5), p. 434-442.

203 | P a g e
Pilkington G.J. (2001). Pathology of the Aging Human Nervous System.
UK: Oxford University Press.
Pilkington G.J., Akinwunmi J., Ognjenovic N. and Rogers J.P. (1993).
Differential Binding of Anti-CD44 on Human Gliomas in vitro. Neuroreport.
4, (3), p. 259-262.
Pilkington G.J., Dunan J.R., Rogers J.P., Clarke T.M. and Knott J.C.A.
(1993). Growth Factor Modulation of Surface Ganglioside Expression in
Cloned Neoplastic Glia. Neuroscience Letters. 149, (1), p. 1-5.
Pinto J.T., Lapsia S., Shah A., Santiago H. and Kim G. (2001).
Antiproliferative Effects of Garlic-Derived and Other Allium Related
Compounds. Advances in Experimental Medicine and Biology. 492, p. 83-
106.
Planta M., Gundersen B. and Petitt J.C. (2000). Prevalence of the Use of
Herbal Products in a Low-Income Population. Family Medicine. 32, (4), p.
252-257.
Platten M., Wick W., Wild-Bode C., Aulwurm S., Dichgans J., Weller M.
(2000). Transforming growth factors beta(1) (TGF-beta(1)) and TGF-
beta(2) promote glioma cell migration via Upregulation of alpha(V)beta(3)
integrin expression. Biochem Biophys Res Commun. 268, p. 607–611.
Pollack I.F., Randall M.S., Kristofik M.P., Kelly R.H., Selker R.G. and
Vertosick F.T.,Jr. (1991). Response of Low-Passage Human Malignant
Gliomas in vitro to Stimulation and Selective Inhibition of Growth Factor-
Mediated Pathways. Journal of Neurosurgery. 75, (2), p. 284-293.
Ponholzer A., Struhal G. and Madersbacher S. (2003). Frequent Use of
Complementary Medicine by Prostate Cancer Patients. European Urology.
43, (6), p. 604-608.
Powe D.G., Brough J.L., Carter G.I., Bailey E.M., Stetler-Stevenson W.G.,
et al. (1997). TIMP-3 mRNA expression is regionally increased in

204 | P a g e
moderately and poorly differentiated colorectal adenocarcinoma. Br J
Cancer. 75, p. 1678–1683.
Prados M.D., Yung W.K., Fine H.A., Greenberg H.S., Junck L., Chang
S.M., Nicholas M.K., Robins H.I., Mehta M.P., Fink K.L., Jaeckle K.A.,
Kuhn J., Hess K.R., Schold S.C.,Jr and North American Brain Tumor
Consortium Study. (2004). Phase 2 Study of BCNU and Temozolomide for
Recurrent Glioblastoma Multiforme: North American Brain Tumor
Consortium Study. Neuro-Oncology. 6, (1), p. 33-37.
Prag S., Lepekhin E. A., Kolkova K., Hartmann-Petersen R., Kawa A.,
Walmod P.S., Belman V., Gallagher H.C., Berezin V., Bock E., and
Pedersen N. (2002). NCAM regulates cell motility. J. Cell Sci. 115, p. 283-
292.
Prayson R.A. and Estes M.L. (1995). Protoplasmic Astrocytoma. A
Clinicopathologic Study of 16 Tumors. American Journal of Clinical
Pathology. 103, (6), p. 705-709.
Prestegarden L., Svendsen A., Wang J., Sleire L., Skaftnesmo K.O.,
Bjerkvig R., Yan T., Askland L., Persson A., Sakariassen P.Ø., Enger P.Ø.
(2010). Glioma cell populations grouped by different cell type markers
drive brain tumor growth. Cancer Res. 70, (11), p. 4274-9.
Quinones S., Saus J., Otani Y., Harris E.D. Jr, Kurkinen M. (1989).
Transcriptional regulation of human stromelysin. J Biol Chem. 264, p.
8339-8344
Radhakrishnan K., Mokri B., Parisi J.E., O'fallon W.M., Sunku J. and
Kurland, L.T. (1995). The Trends in Incidence of Primary Brain Tumors in
the Population of Rochester, Minnesota. Annals of Neurology. 37, (1), p.
67-73.
Radotra B., Mccormick D. and Crockard A. (1994). CD44 Plays a Role in
Adhesive Interactions Between Glioma Cells and Extracellular Matrix
Components. Neuropathology and Applied Neurobiology. 20, (4), p. 399-

205 | P a g e
405.
Raff M.C., Miller R.H. and Noble M. (1983). A Glial Progenitor Cell That
Develops in vitro into an Astrocyte or an Oligodendrocyte Depending On
Culture Medium. Nature. 303, (5916), p. 390-396.
Ramnarayan R., Dodd S., Das K., Heidecke V. and Rainov N.G. (2007).
Overall Survival in Patients with Malignant Glioma may be Significantly
Longer with Tumors Located in Deep Grey Matter. Journal of The
Neurological Sciences. 260, (1-2), p. 49-56.
Rampling R., James A. and Papanastassiou V. (2004). The Present and
Future Management of Malignant Brain Tumours: Surgery, Radiotherapy,
Chemotherapy. Journal of Neurology, Neurosurgery, and Psychiatry. 75,
(2), p. ii24-30.
Ranuncolo S. M., Ladeda V., Specterman S., Varela M., Lastiri J., Morandi
A., Matos E., De Kier Joffe E. B., Puricelli L. and Pallotta M. G. (2002).
CD44 expression in human gliomas. J. Surg. Oncol. 79, p. 30–36.
Rao J.S., Steck P.A., Mohanam S., Stetler-Stevenson W.G., Liotta L.A.,
Sawaya R. (1993). Elevated levels of M(r) 92,000 type IV collagenase in
human brain tumors. Cancer Res. 53,(10), p. 2208-11.
Rao J.S., Yamamoto M., Mohaman S., Gokaslan Z.L., Fuller G.N., Stetler-
Stevenson W.G., Rao V.H., Liotta L.A., et al. (1996). Expression and
localization of 92 kDa type IV collagenase/gelatinase B (MMP-9) in human
gliomas. Clinical and Experimental Metastasis. 14, p. 12–18.
Reifenberger G., Sieth P., Niederhaus M., Wechsler W. (1992).
Expression of CD15 in tumours of the nervous system. Histochem. 24,
(11), p. 890-901.
Reilly K.M. (2009). Brain Tumor Susceptibility: the Role of Genetic Factors
and Uses of Mouse Models to Unravel Risk. Brain pathology. 19, (1), p.
121-131.

206 | P a g e
Reya T., Morrison S.J., Clarke M.F. and Weissman I.L. (2001). Stem Cells,
Cancer, and Cancer Stem Cells. Nature. 414, (6859), p. 105-111.
Reynolds R. and Hardy R. (1997). Oligodendroglial Progenitors Labeled
with The O4 Antibody Persist in The Adult Rat Cerebral Cortex in vivo.
Journal of Neuroscience Research. 47, (5), p. 455-470.
Richardson M.A. and Straus S.E. (2002). Complementary and Alternative
Medicine: Opportunities and Challenges for Cancer Management and
Research. Seminars in Oncology. 29 (6), p. 531-545.
Richardson M.A., Sanders T., Palmer J.L., Greisinger A. and Singletary
S.E. (2000). Complementary/Alternative Medicine Use in a
Comprehensive Cancer Center and the Implications For Oncology. Journal
of Clinical Oncology. 18, (13), p. 2505-2514.
Richardson, W.D., Kessaris, N., and Pringle, N. (2006). Oligodendrocyte
wars. Nat Rev Neurosci. 7, p. 11–18.
Ringertz N. (1950). Grading of Gliomas. Acta Pathologica Et
Microbiologica Scandinavica. 27 (1), p. 51-64.
Rivers L. E., Young K. M., Rizzi M., Jamen F., Psachoulia K., Wade A.,
Kessaris N., Richardson W. D. (2008). PDGFRA/NG2 glia generate
myelinating oligodendrocytes and piriform projection neurons in adult
mice. Nat. Neurosci. 11, p. 1392–1401.
Robinson A. (2007). People's Choice: Complementary and Alternative
Medicine Modalities. Complementary Health Practice Review. 12, (2), p.
99-119.
Robinson A. and Chesters J. (2008). Rural Diversity in Cam Usage: The
Relationship between Rural Diversity and the Use of Complementary and
Alternative Medicine Modalities. Rural Society. 18, (1), p. 64-75.
Robles S.J. and Adami G.R. (1998). Agents that cause DNA double strand

207 | P a g e
breaks lead to p16INK4a enrichment and the premature senescence of
normal fibroblasts. Oncogene. 16, (9), p. 1113-1123.
Rooprai H.K., Christidou M. and Pilkington G.J. (2003). The Potential for
Strategies Using Micronutrients and Heterocyclic Drugs to Treat Invasive
Gliomas. Acta Neurochirurgica. 145, (8), p. 683-690.
Rooprai H.K., Kandanearatchi A., Maidment S.L., Christidou M., Trillo-
Pazos G., Dexter D.T., Rucklidge G.J., Widmer W. and Pilkington G.J.
(2001). Evaluation of the Effects of Swainsonine, Captopril, Tangeretin
and Nobiletin on the Biological Behaviour of Brain Tumour Cells in vitro.
Neuropathology and Applied Neurobiology. 27, (1), p. 29-39.
Rooprai H.K., Kyriazis I., Nuttall R.K., Edwards D.R., Zicha D., Aubyn D.,
Davies D., Gullan R. and Pilkington G.J. (2007). Inhibition of Invasion and
Induction of Apoptosis by Selenium in Human Malignant Brain Tumour
Cells in Vitro. International Journal of Oncology. 30, (5), p. 1263-1271.
Rorive S., Lopez X.M., Maris C., Trepant A.L., Sauvage S., Sadeghi N.,
Roland I., Decaestecker C., Salmon I.(2010). TIMP-4 and CD63: new
prognostic biomarkers in human astrocytomas. Mod Pathol. 23, (10), p.
1418-28.
Ross R., Glomset J., Kariya B. and Raines E. (1978). Role of Platelet
Factors in The Growth of Cells in Culture. National Cancer Institute
Monograph. 48, p. 103-108.
Ruch R.J. (1994). The Role of Gap Junctional Intercellular Communication
in Neoplasia. Annals of Clinical & Laboratory Science. 24, (3), p. 216-231.
Rucklidge G.J., Edvardsen K. and Bock E. (1994). Cell-Adhesion
Molecules and Metalloproteinases: A Linked Role in Tumour Cell
Invasiveness. Biochemical Society Transactions. 22, (1), p. 63-68.
Ruoslahti E. and Pierschbacher M.D. (1986). Arg-Gly-Asp: A Versatile Cell
Recognition Signal. Cell. 44, (4), p. 517-518.

208 | P a g e
Rutka J.T., Matsuzawa K., Hubbard S.L. et al. (1995). Expression of TIMP-
1, TIMP-2, 72- and 92-kDa type IV collagenase transcripts in human
astrocytoma cell lines: correlation with astrocytoma cell invasiveness. Int J
Oncol. 6, p. 877–884.
Ryder P.T., Wolpert B., Orwig D., Carter-Pokras O. and Black S.A. (2008).
Complementary and Alternative Medicine Use among Older Urban African
Americans: Individual and Neighborhood Associations. Journal of the
National Medical Association. 100, (10), p. 1186-1192.
Salcman M. (1990). Malignant Glioma Management. Neurosurgery Clinics
of North America. 1, (1), p. 49-63.
Salford L.G., Brun A., Sturesson K., Eberhardt J.L. and Persson B.R.
(1994). Permeability of the blood-brain barrier induced by 915 MHz
electromagnetic radiation, continuous wave and modulated at 8, 16, 50,
and 200 Hz. Microscopy research and technique. 27, (6), p. 535-542.
Salford L.G., Brun A.E., Eberhardt J.L., Malmgren L. and Persson B.R.
(2003). Nerve cell damage in mammalian brain after exposure to
microwaves from GSM mobile phones. Environmental health perspectives.
111, (7), p. 881-3 .
Salgado S. (2007). Apoptotic Mechanisms in Neurons and Glial Cells after
Damage of Immature Brain. University of Barcelona.
Salim A.S. (1992). Role of Oxygen-Derived Free Radical Scavengers in
the Management of Recurrent Attacks of Ulcerative Colitis: A New
Approach. The Journal of Laboratory and Clinical Medicine. 119, (6), p.
710-717.
Santos N.C., Figueira-Coelho J., Martins-Silva J. and Saldanha C. (2003).
Multidisciplinary Utilization of Dimethyl Sulfoxide: Pharmacological,
Cellular, and Molecular Aspects. Biochemical Pharmacology. 65, (7), p.
1035-1041.

209 | P a g e
Sarafian V., Koev I. and Staykov D. (2009). Mechanisms of Cell
Resistance in Glioblastoma Multiforme. Journal of IMAB. 1, p. 6-8.
Sarkaria J.N., Mehta M.P., Loeffler J.S., Buatti J.M., Chappell R.J., Levin
A.B., Alexander E.,3rd, Friedman, W.A. and Kinsella, T.J. (1995).
Radiosurgery in the Initial Management of Malignant Gliomas: Survival
Comparison with the Rtog Recursive Partitioning Analysis. Radiation
Therapy Oncology Group. International Journal of Radiation Oncology,
Biology, Physics. 32, (4), p. 931-941.
Sathornsumetee S. and Rich J.N. (2006). New Approaches to Primary
Brain Tumor Treatment. Anti-Cancer Drugs. 17, (9), p. 1003-1016.
Sawaya R.E., Yamamoto M., Gokaslan Z.L., Wang S.W., Mohanam S.,
Fuller G.N. (1996). Expression and localization of 72 kDa type IV
collagenase (MMP-2) in human malignant gliomas in vivo. Clin Exp
Metastasis. 14, (1), p. 35-42.
Schiff D. and Purow B. (2008). Bevacizumab in Combination with
Irinotecan for Patients with Recurrent Glioblastoma Multiforme. Nature
Clinical Practice.Oncology. 5, (4), p. 186-187.
Schold S.C.,Jr, Kokkinakis D.M., Chang S.M., Berger M.S., Hess K.R.,
Schiff D., Robins H.I., Mehta M.P., Fink K.L., Davis R.L. and Prados M.D.
(2004). O6-Benzylguanine Suppression of O6-Alkylguanine-DNA
Alkyltransferase in Anaplastic Gliomas. Neuro-Oncology. 6, (1), p. 28-32.
Schwartzbaum J.A., Fisher J.L., Aldape K.D. and Wrensch M. (2006).
Epidemiology and Molecular Pathology of Glioma. Nature Clinical
Practice.Neurology. 2, (9), p. 494-503.
Schwechheimer K., Läufle R.M., Schmahl W., Knödlseder M., Fischer H.
and Höfler H. (1994). Expression of Neu/C-ERBB-2 in Human Brain
Tumors. Human Pathology. 25, (8), p. 772-780.
Seftor R.E., Seftor E.A., Gehlsen K.R., et al. (1992). Role of the alpha v

210 | P a g e
beta 3 integrin in human melanoma cell invasion. Proceedings of the
National Academy of Sciences of the United States of America. 89, (5), p.
1557-1561.
Setchell K.D. (2001). Soy Isoflavones--Benefits and Risks from Nature's
Selective Estrogen Receptor Modulators (Serms). Journal of the American
College of Nutrition. 20, (5), p. 354s-362s.
Setchell, K.D., Brown, N.M. and Lydeking-Olsen, E. (2002). The Clinical
Importance of the Metabolite Equol-A Clue to the Effectiveness of Soy and
Its Isoflavones. The Journal of Nutrition. 132, (12), p. 3577-3584.
Shackleton M., Vaillant F., Simpson K.J., Stingl J., Smyth G.K., Asselin-
Labat M.L., Wu L., Lindeman G.J. and Visvader J.E. (2006). Generation of
a Functional Mammary Gland from a Single Stem Cell. Nature. 439,
(7072), p. 84-88.
Shao Z.M., Wu J., Shen Z.Z. and Barsky S.H. (1998). Genistein Inhibits
both Constitutive and EGF-Stimulated Invasion in Er-Negative Human
Breast Carcinoma Cell Lines. Anticancer Research. 18, (3a), p. 1435-
1439.
Shapiro W.R. and Young D.F. (1976). Treatment of Malignant Glioma. A
Controlled Study of Chemotherapy and Irradiation. Archives of Neurology.
33, (7), p. 494-450.
Shaw E.G. (1996). In Search of Better Prognostic Indicators for Patients
with Oligodendrogliomas. Cancer Investigation. 14, (3), p. 288-289.
Shen J., Andersen R., Albert P.S., Wenger N., Glaspy J., Cole M. and
Shekelle P. (2002). Use of Complementary/Alternative Therapies by
Women with Advanced-Stage Breast Cancer. BMC Complementary and
Alternative Medicine. 2, p. 8.
Sherwood P. (2000). Patterns of Use of Complementary Health Services
in the South-West of Western Australia. Australian Journal of Rural Health.
211 | P a g e
8, p. 194-200.
Shinoura N., Dohi T., Kondo T., Yoshioka M., Takakura K. and Oshima M.
(1992). Ganglioside Composition and its Relation to Clinical Data in Brain
Tumors. Neurosurgery. 31, (3), p. 541-549.
Shintani T., Hayakawa N., Hoshi M., Sumida M., Kurisu K., Oki S.,
Kodama Y., Kajikawa H., Inai K. and Kamada N. (1999). High Incidence of
Meningioma among Hiroshima Atomic Bomb Survivors. Journal of
Radiation Researc., 40, (1), p. 49-57.
Shmelkov S.V., St.Clair R., Lyden D. and Rafii S. (2005).
C133/CD133/Prominin. The International Journal of Biochemistry & Cell
Biology. 37, (4), p. 715-719.
Shreffler-Grant J., Hill W., Weinert C., Nichols E. and Ide B. (2007).
Complementary Therapy and Older Rural Women: Who Uses It and Who
Does Not? Nursing Research. 56, (1), p. 28-33.
Shreffler-Grant J., Weinert C., Nichols E. and Ide B. (2005).
Complementary Therapy Use among Older Rural Adults. Public Health
Nursing. 22, (4), p. 323-331.
Sibbritt D.W., Adams J. and Young A.F. (2004). A Longitudinal Analysis of
Mid-Age Women's Use of Complementary and Alternative Medicine (CAM)
in Australia, 1996-1998. Women & Health. 40, (4), p. 41-56.
Simko M. (2007). Cell Type Specific Redox Status is Responsible for
Diverse Electromagnetic Field Effects. Current Medicinal Chemistry. 14,
(10), p. 1141-1152.
Singh R.P., Tyagi A.K., Dhanalakshmi S., Agarwal R. and Agarwal C.
(2004). Grape Seed Extract Inhibits Advanced Human Prostate Tumor
Growth and Angiogenesis and Upregulates Insulin-Like Growth Factor
Binding Protein-3. International Journal of Cancer. 108, (5), p. 733-740.
212 | P a g e
Singh S., Farhan Asad S. and Hadi S.M. (1998). Uric Acid Inhibits -DOPA-
CU(II) Mediated DNA Cleavage. Neuroscience Letters. 258, (2), p. 69-72.
Singh S.K., Clarke I.D., Terasaki M., Bonn V.E., Hawkins C., Squire J. and
Dirks P.B. (2003). Identification of a Cancer Stem Cell in Human Brain
Tumors. Cancer Research. 63, (18), p. 5821-5828.
Sipos E.P., Tyler B., Piantadosi S., Burger P.C. and Brem H. (1997).
Optimizing Interstitial Delivery of BCNU from Controlled Release Polymers
for the Treatment of Brain Tumors. Cancer Chemotherapy and
Pharmacology. 39, (5), p. 383-389.
Smith M.R., Kung H., Durum S.K., Colburn N.H., Sun Y. (1997). TIMP-3
induces cell death by stabilizing TNF-alpha receptors on the surface of
human colon carcinoma cells. Cytokine. 9, (10), p. 770–780.
Smith R.S. (1992). A Comprehensive Macrophage-T-Lymphocyte Theory
of Schizophrenia. Medical Hypotheses. 39, (3), p. 248-257.
Soda Y., Myskiw C., Rommel A., and Verma I. M. (2013). Mechanisms of
Neovascularization and Resistance to Anti-angiogenic Therapies in
Glioblastoma Multiforme. Journal of Molecular Medicine. 91, (4), 439–448.
Sparber A., Wootton J.C., Bauer L., Curt G., Eisenberg D., Levin T. and
Steinberg S.M. (2000). Use of Complementary Medicine by Adult Patients
Participating in HIV/Aids Clinical Trials. Journal of Alternative and
Complementary Medicine. 6, (5), p. 415-422.
Spassova M.K. and Golovinsky E.V. (1985). Pharmacobiochemistry of
Arylalkyltriazenes and Their Application in Cancer Chemotherapy.
Pharmacology & Therapeutics. 27, (3), p. 333-352.
Stallcup W. B. and Huang F.J. (2008). A role for the NG2 proteoglycan in
glioma progression. Cell Adhesion & Migration. 2, (3), p. 192–201.
Stark-Vance V. (2005). Bevacizumab and Cpt-11 in the Treatment of

213 | P a g e
Relapsed Malignant Glioma. Proceedings of the World Federation of
Neuro-Oncology Meeting.
Steinbach J.P. and Weller M., (2004). Apoptosis in Gliomas: Molecular
Mechanisms and Therapeutic Implications. Journal of Neuro-Oncology.
70, (2), p. 245-254.
Stevens M.F., Hickman J.A., Langdon S.P., Chubb D., Vickers L., Stone
R., Baig G., Goddard C., Gibson N.W. and Slack J.A. (1987). Antitumor
Activity and Pharmacokinetics in Mice of 8-Carbamoyl-3-Methyl-
Imidazo[5,1-D]-1,2,3,5-Tetrazin-4(3h)-One (CCRG 81045; M & B 39831),
A Novel Drug With Potential As An Alternative To Dacarbazine. Cancer
Research. 47, (22), p. 5846-5852.
Stochaj U. and Silver P. (1992). A conserved phosphoprotein that
specifically binds nuclear localization sequences is involved in nuclear
import. J. Cell Biol.117, p. 473-482.
Strasser A., O'connor L. and Dixit V.M. (2000). Apoptosis Signaling.
Annual Review of Biochemistry. 69, p. 217-245.
Strongin AY, Collier I, Bannikov G, et al. (1995). Mechanism of cell surface
activation of 72 kDa type IV collagenase: isolation of the activated form of
the membrane metalloprotease. J Biol Chem. 270, p. 5331–5338.
Stupp R., Dietrich P., Kraljevic S.O., Pica, A., Maillard I., Maeder, P., Meuli
R., Janzer R., Pizzolato G., Miralbell R., Porchet F., Regli L., De Tribolet
N., Mirimanoff R.O. and Leyvraz S. (2002). Promising Survival for Patients
with Newly Diagnosed Glioblastoma Multiforme Treated With Concomitant
Radiation plus Temozolomide Followed By Adjuvant Temozolomide.
Journal of Clinical Oncology. 20, (5), p. 1375-1382.
Stupp R., Mason W.P., Van Den Bent M.J., Weller M., Fisher B., Taphoorn
M.J., Belanger K., Brandes A.A., Marosi C., Bogdahn U., Curschmann J.,
Janzer R.C., Ludwin S.K., Gorlia T., Allgeier A., Lacombe D., Cairncross
J.G., Eisenhauer E., Mirimanoff R.O., European Organisation for Research

214 | P a g e
and Treatment of Cancer Brain Tumor and Radiotherapy Groups and
National Cancer Institute of Canada Clinical Trials Group. (2005).
Radiotherapy plus Concomitant and Adjuvant Temozolomide for
Glioblastoma. The New England Journal of Medicine. 352, (10), p. 987-
996.
Stupp R., Van Den Bent M.J. and Hegi M.E. (2005). Optimal Role of
Temozolomide in the Treatment of Malignant Gliomas. Current Neurology
and Neuroscience Reports. 5, (3), p. 198-206.
Stupp, R., Roila, F. and on Behalf of the ESMO Guidelines Working
Group. (2009). Malignant Glioma: ESMO Clinical Recommendations for
Diagnosis, Treatment and Follow-Up. Annals of Oncology. 20, (4), p.
iv126-iv128.
Subach B.R., Witham T.F., Kondziolka D., Lunsford L.D., Bozik M. and
Schiff D. (1999). Morbidity and Survival after 1,3-Bis(2-Chloroethyl)-1-
Nitrosourea Wafer Implantation For Recurrent Glioblastoma: A
Retrospective Case-Matched Cohort Series. Neurosurgery. 45, (1), p. 17-
22.
Sugimori H., Speller H. and Finklestein S.P. (2001). Intravenous Basic
Fibroblast Growth Factor Produces a Persistent Reduction in Infarct
Volume Following Permanent Focal Ischemia in Rats. Neuroscience
Letters. 300, (1), p. 13-16.
Sun Z.M., Genka S., Shitara N., Akanuma A. and Takakura K. (1988).
Factors Possibly Influencing the Prognosis of Oligodendroglioma.
Neurosurgery. 22, (5), p. 886-891.
Swarup A.B., Barrett W. and Jazieh A.R. (2006). The Use of
Complementary and Alternative Medicine by Cancer Patients Undergoing
Radiation Therapy. American Journal of Clinical Oncology. 29, (5), p. 468-
473.
Tamargo R.J., Epstein J.I., Reinhard C.S., Chasin M. and Brem H. (1989).
215 | P a g e
Brain Biocompatibility of a Biodegradable, Controlled-Release Polymer in
Rats. Journal of Biomedical Materials Research. 23, (2), p. 253-266.
Taraboletti G. and Giavazzi R. (2004). Modelling Approaches for
Angiogenesis. European Journal of Cancer. 40, (6), p. 881-889.
Tate M.C. and Aghi M.K. (2009). Biology of Angiogenesis and Invasion in
Glioma. Neurotherapeutics: The Journal of the American Society For
Experimental Neurotherapeutics. 6, (3), p. 447-457.
Tate M.C., Aghi M.K. (2009). Biology of angiogenesis and invasion in
glioma. Neurotherapeutics.6, (3), p.447–457.
Temple S. and Raff M. C. (1985). Differentiation of a bipotential glial
progenitor cell in single cell microculture. Nature, Lond. 313, p. 223-225.
Tenenbaum L., Teugels E., Dogusan Z., Avellana-Adalid V. and Hooghe-
Peters E.L. (1996). Plastic Phenotype of Human Oligodendroglial Tumour
Cells in vitro. Neuropathology and Applied Neurobiology. 22, (4), p. 302-
310.
Thasni K.A., Rojini G., Rakesh S.N., Ratheeshkumar T., Babu M.S.,
Srinivas G., Banerji A. and Srinivas P. (2008). Genistein Induces
Apoptosis in Ovarian Cancer Cells via Different Molecular Pathways
Depending On Breast Cancer Susceptibility Gene-1 (BRCA1) Status.
European Journal of Pharmacology. 588, (2-3), p. 158-164.
Thomas K. and Coleman P. (2004). Use of Complementary or Alternative
Medicine in a General Population in Great Britain. Results from the
National Omnibus Survey. Journal of Public Health. 26, (2), p. 152-157.
Thomas K.J., Nicholl J.P. and Coleman P. (2001). Use and Expenditure on
Complementary Medicine in England: A Population Based Survey.
Complementary Therapies in Medicine. 9, (1), p. 2-11.
Tihan T., Vohra P., Berger M.S. and Keles G.E. (2006). Definition and

216 | P a g e
Diagnostic Implications of Gemistocytic Astrocytomas: A Pathological
Perspective. Journal of Neuro-Oncology. 76, (2), p. 175-183.
Trangmar P. and Diaz V. (2008). Investigating Complementary and
Alternative Medicine Use in a Spanish-Speaking Hispanic Community in
South Carolina. Annals of Family Medicine. 6, p. S12-15.
Tricker A.R., Preussmann R. (1991). Carcinogenic N-nitrosamines in the
diet: occurrence, formation, mechanisms and carcinogenic potential. Mutat
Res. 259, (3-4), p. 277-89.
Tripathi Y.B., Lim R.W., Fernandez-Gallardo S., Kandala J.C., Guntaka
R.V., Shukla S.D. (1992). Involvement of tyrosine kinase and protein
kinase C in platelet-activating-factor-induced c-fos gene expression in A-
431 cells. Biochemical Journal. 286, (Pt 2), p. 527-533.
Tuettenberg J., Friedel C., Vajkoczy P. (2006). Angiogenesis in malignant
glioma--a target for antitumor therapy? Crit Rev Oncol Hematol.59, (3), p.
181-93.
Uchida N., Buck D.W., He D., Reitsma M.J., Masek M., Phan T.V.,
Tsukamoto A.S., Gage F.H. and Weissman I.L. (2000). Direct Isolation of
Human Central Nervous System Stem Cells. Proceedings of the National
Academy of Sciences of the United States of America. 97, (26), p. 14720-
14725.
Ucuzian A. A., Gassman A. A., East A. T., and Greisler H. P. (2010).
Molecular Mediators of Angiogenesis. Journal of Burn Care & Research :
Official Publication of the American Burn Association, 31(1), p. 158.
Upadhyay, R.K., (2014). Drug Delivery Systems, CNS Protection, and the
Blood Brain Barrier. BioMed Research International, vol. 2014, Article ID
869269,
Vallstedt A., Klos J.M., Ericson J. (2005). Multiple dorsoventral origins of
oligodendrocyte generation in the spinal cord and hindbrain. Neuron. 45,

217 | P a g e
p. 55–67.
Valtonen S., Timonen U., Toivanen P., Kalimo H., Kivipelto L., Heiskanen
O., Unsgaard G. and Kuurne T. (1997). Interstitial Chemotherapy with
Carmustine-Loaded Polymers for High-Grade Gliomas: A Randomized
Double-Blind Study. Neurosurgery. 41, (1), p. 44-8.
Van D.W. and Streuli R.A. (2003). Use of Alternative Medicine by Patients
with Cancer in a Rural Area of Switzerland. Swiss Medical Weekly. 133,
(15-16), p. 233-240.
Van Den Bent M.J., Reni M., Gatta G. and Vecht C., (2008).
Oligodendroglioma. Crit Rev Oncol Hematol. 66, (3), p. 262-72.
Van Der Woude H., Gliszczynska-Swiglo A., Struijs K., Smeets A., Alink
G.M. and Rietjens I.M. (2003). Biphasic Modulation of Cell Proliferation by
Quercetin at Concentrations Physiologically Relevant in Humans. Cancer
Letters. 200, (1), p. 41-47.
Vapiwala N., Mick R., Hampshire M.K., Metz J.M. and Denittis A.S. (2006).
Patient Initiation of Complementary and Alternative Medical Therapies
(CAM) Following Cancer Diagnosis. Cancer Journal. 12, (6), p. 467-474.
Verhoef M.J., Hilsden R.J. and O’beirne M. (1999). Complementary
Therapies and Cancer Care: An Overview. Patient Education and
Counseling. 38, (2), p. 93-100.
Verhoeff J.J.C., Lavini C., Van Linde M.E., Stalpers L.J.A., Majoie
C.B.L.M., Reijneveld J.C., Van Furth W.R. and Richel D.J. (2010).
Bevacizumab and Dose-Intense Temozolomide in Recurrent High-Grade
Glioma. Annals of Oncology. 21, (8), p. 1723-1727.
Viel J.F., Challier B., Pitard A. and Pobel D. (1998). Brain cancer mortality
among French farmers: the vineyard pesticide hypothesis. Archives of
Environmental Health. 53, (1), p. 65-70.

218 | P a g e
Vredenburgh J.J., Desjardins A., Reardon D.A. and Friedman H.S. (2009).
Experience with Irinotecan for the Treatment of Malignant Glioma. Neuro-
Oncology. 11, (1), p. 80-91.
Walker M.D., Alexander E.,Jr, Hunt W.E., Maccarty C.S., Mahaley M.S.,Jr,
Mealey J.,Jr, Norrell H.A., Owens G., Ransohoff J., Wilson C.B., Gehan
E.A. and Strike T.A. (1978). Evaluation of BCNU and/or Radiotherapy in
the Treatment of Anaplastic Gliomas. A Cooperative Clinical Trial. Journal
of Neurosurgery. 49, (3), p. 333-343.
Walker M.D., Green S.B., Byar D.P., Alexander E.,Jr, Batzdorf U., Brooks
W.H., Hunt W.E., Maccarty C.S., Mahaley M.S.,Jr, Mealey J.,Jr, Owens
G., Ransohoff J., Robertson J.T., Shapiro W.R., Smith K.R.,Jr, Wilson C.B.
and Strike T.A. (1980). Randomized Comparisons of Radiotherapy and
Nitrosoureas for the Treatment of Malignant Glioma After Surgery. The
New England Journal of Medicine. 303, (23), p. 1323-1329.
Walker M.D., Strike T.A. and Sheline G.E. (1979). An Analysis of Dose-
Effect Relationship in the Radiotherapy of Malignant Gliomas. International
Journal of Radiation Oncology, Biology, Physics. 5, (10), p. 1725-1731.
Walsh F.S. and Doherty P. (1996). Cell Adhesion Molecules and Neuronal
Regeneration. Current Opinion in Cell Biology. 8, (5), p. 707-713.
Wang C.Z., Fishbein A., Aung H.H., Mehendale S.R., Chang W.T., Xie
J.T., Li J. and Yuan C.S. (2005). Polyphenol Contents in Grape-Seed
Extracts Correlate with Antipica Effects in Cisplatin-Treated Rats. Journal
of Alternative and Complementary Medicine. 11, (6), p. 1059-1065.
Wang H., Bastian S.E, Lawrence A., Howarth G.S., (2015). Factors
derived from Escherichia coli Nissle 1917, grown in different growth media,
enhance cell death in a model of 5-fluorouracil-induced Caco-2 intestinal
epithelial cell damage. Nutr Cancer. 67, (2), p.316-26.
Wang M., et al., (1997). Inhibition of tumor growth and metastasis of
human breast cancer cells transfected with tissue inhibitor of
219 | P a g e
metalloproteinase 4. Oncogene. 14, p. 2767-2774.
Wang T.T., Sathyamoorthy N. and Phang J.M. (1996). Molecular Effects of
Genistein on Estrogen Receptor Mediated Pathways. Carcinogenesis. 17,
(2), p. 271-275.
Wang, G., Wang, J., Du, L., Li, F., (2015). Effect and Mechanism of Total
Flavonoids Extracted from Cotinus coggygria against Glioblastoma Cancer
In Vitro and In Vivo. Biomed Res Int. Epub 2015 Oct 18.
Wardle J., Adams J. and Lui C. (2010). A Qualitative Study of Naturopathy
in Rural Practice: A Focus upon Naturopaths' Experiences and
Perceptions of Rural Patients and Demand for Their Services. BMC Health
Services Research. 10, p. 185.
Watt F.M. and Hogan B.L. (2000). Out of Eden: Stem Cells and Their
Niches. Science. 287, (5457), p. 1427-1430.
Weathers S.P., and Gilbert, M.R. (2014). Advances in treating
glioblastoma. F1000Prime Reports. 6, 46, p. 1-9.
Weber E.L. and Goebel E.A. (2005). Cerebral Edema Associated With
Gliadel Wafers: Two Case Studies. Neuro-Oncology. 7, (1), p. 84-89.
Weiss J.F. and Landauer M.R. (2003). Protection against Ionizing
Radiation by Antioxidant Nutrients and Phytochemicals. Toxicology. 189,
(1-2), p. 1-20.
Weissman I.L., Anderson D.J. and Gage F. (2001). Stem and Progenitor
Cells: Origins, Phenotypes, Lineage Commitments, and
Transdifferentiations. Annual Review of Cell and Developmental Biology.
17, p. 387-403.
Weissman I.L., Anderson D.J., Gage F. (2001). Stem and progenitor cells:
origins, phenotypes, lineage commitments, and trans differentiations. Ann
Rev Cell Dev Biol. 17, p. 387-403.

220 | P a g e
Welder G.J., Wessel T.R., Arant C.B., Schofield R.S. and Zineh I. (2006).
Complementary and Alternative Medicine Use among Individuals
Participating in Research: Implications for Research and Practice.
Pharmacotherapy. 26, (12), p. 1794-1801.
Welsh Cancer Intelligence and Surveillance Unit on request, April 2012.
Similar data can be found here:
http://www.wales.nhs.uk/sites3/page.cfm?orgid=242&pid=59080
Werb Z. (1997). ECM and cell surface proteolysis: regulating cellular
ecology. Cell. 91, p. 439-442.
Westermark B. and Heldin C. (1989). Growth Factors and Their
Receptors. Current Opinion in Cell Biology. 1, (2), p. 279-285.
Westphal M., Hilt D.C., Bortey E., Delavault P., Olivares R., Warnke P.C.,
Whittle I.R., Jaaskelainen J. and Ram Z. (2003). A Phase 3 Trial of Local
Chemotherapy with Biodegradable Carmustine (BCNU) Wafers (Gliadel
Wafers) in Patients with Primary Malignant Glioma. Neuro-Oncology. 5,
(2), p. 79-88.
Westphal M., Lamszus K. and Hilt D. (2003). Intracavitary Chemotherapy
for Glioblastoma: Present Status and Future Directions. Acta
Neurochirurgica.Supplement. 88, p. 61-67.
White J.D. (2002). Complementary and Alternative Medicine Research: A
National Cancer Institute Perspective. Seminars in Oncology. 29, (6), p.
546-551.
Wick W., Platten M., Weller M. (2001). Glioma cell invasion: regulation of
metalloproteinase activity by TGF-beta. J Neurooncol. 53, (2), p.177-85.
Wiemels J., Wrensch M., Claus E. (2010). Epidemiology and etiology of
meningioma. Journal of Neuro-Oncology. 99, (3), p. 307 -314.
Wikstrand C.J., Fredman P., Svennerholm L. and Bigner D.D. (1994).
221 | P a g e
Detection of Glioma-Associated Gangliosides GM2, GD2, GD3, 3'-ISOLM1
3',6'-ISOLD1 in Central Nervous System Tumors in vitro and in vivo Using
Epitope-Defined Monoclonal Antibodies. Progress in Brain Research. 101,
p. 213-223.
Wild-Bode C., Weller M., Rimner A., Dichgans J., Wick W. (2001).
Sublethal irradiation promotes migration and invasiveness of glioma cells:
implications for radiotherapy of human glioblastoma. Cancer Res. 61, (6),
p.2744-50.
Wilkinson J.M. and Jelinek H. (2009). Complementary Medicine Use
among Attendees at a Rural Health Screening Clinic. Complementary
Therapies in Clinical Practice. 15, (2), p. 80-84.
Wilkinson J.M. and Simpson M.D. (2001). High Use of Complementary
Therapies in a New South Wales Rural Community. Australian Journal of
Rural Health. 9, (4), p. 166-171.
Will H., Atkinson S.J., Butler G.S., Smith B., Murphy G. (1996). The
soluble catalytic domain of membrane type 1 matrix metalloproteinase
cleaves the propetide of progelatinase A and initiates autoproteolytic
activation. J Biol Chem. 271, p. 17119–17123.
Wingfield P.T., Sax J.K., Stahl S.J., Kaufman J., Palmer I., Chung V.,
Corcoran M.L., Kleiner D.E., and Stetler-Stevenson W.G. (1999).
Biophysical and functional characterization of full-length, recombinant
human tissue inhibitor of metalloproteinases-2 (TIMP-2) produced in
Escherichia coli. J. Biol. Chem. 274, p. 21362–21368.
Withrow S.J., Liptak J.M., Straw R.C., Dernell W.S., Jameson V.J., Powers
B.E., Johnson J.L., Brekke J.H. and Douple E.B. (2004). Biodegradable
Cisplatin Polymer in Limb-Sparing Surgery for Canine Osteosarcoma.
Annals of Surgical Oncology. 11, (7), p. 705-713.
Woessner J.F. (1995). Quantification of matrix metalloproteinases in tissue
samples. Methods Enzymol. 248, p. 510–528.

222 | P a g e
Wong H.K., Lahdenranta J., Kamoun W.S., Chan A.W., McClatchey A.I.,
Plotkin S.R., Jain R.K. and Di Tomaso E. (2010). Anti–Vascular
Endothelial Growth Factor Therapies as a Novel Therapeutic Approach to
Treating Neurofibromatosis-Related Tumors. Cancer Research. 70, (9), p.
3483-3493.
Wrensch M., Minn Y., Chew T., Bondy M. and Berger M.S. (2002).
Epidemiology of Primary Brain Tumors: Current Concepts and Review of
the Literature. Neuro-Oncology. 4, (4), p. 278-299.
Wu A.H., Yu M.C., Tseng C.C., Twaddle N.C. and Doerge D.R. (2004).
Plasma Isoflavone Levels Versus Self-Reported Soy Isoflavone Levels in
Asian-American Women in Los Angeles County. Carcinogenesis. 25, (1),
p. 77-81.
Yamashita S., Furubayashi T., Kataoka M., Sakane T., Sezaki H., Tokuda
H. (2000). Optimized conditions for prediction of intestinal drug
permeability using Caco-2 cells. Eur J Pharm Sci. 10, (3), p. 195-204.
Yan, Y., Zuo, X., and Wei, W., (2015). Concise Review: Emerging Role of
CD44 in Cancer Stem Cells: A Promising Biomarker and Therapeutic
Target. Stem Cells Trans Med. 4, (9), p.1033-43.
Yang J.C., Haworth L., Sherry R.M., Hwu P., Schwartzentruber D.J.,
Topalian S.L., Steinberg S.M., Chen H.X. and Rosenberg S.A. (2003). A
Randomized Trial of Bevacizumab, an Anti–Vascular Endothelial Growth
Factor Antibody, For Metastatic Renal Cancer. New England Journal of
Medicine. 349, (5), p. 427-434.
Yang S., Kim M., Lee T., Lee K., Jeun S., Park C., Kang J., Kim M. and
Hong Y. (2006). Temozolomide Chemotherapy in Patients with Recurrent
Malignant Gliomas. J Korean Med Sci. 21, (4), p. 739-744.
Yang X., Darling J.L., McMillan T.J., Peacock J.H. and Steel G.G. (1992).
Heterogeneity of Radiosensitivity in a Human Glioma Cell Line.
International Journal of Radiation Oncology*Biology*Physics. 22, (1), p.
223 | P a g e
103-108.
Yang, Y., Zang A., Jia, Y., Shang, Y., Zhang, Z., Ge, K., Zhang, J., Fan,
W., Wang, B., (2016). Genistein inhibits A549 human lung cancer cell
proliferation via miR-27a and MET signalling. Oncol Lett. 12, (3), p.2189-
2193.
Yang, Y.M., Yang, Y., Dai, W.W., Li, X.M., Ma, J.Q., Tang, L.P., (2016).
Genistein-induced apoptosis is mediated by endoplasmic reticulum stress
in cervical cancer cells. Eur Rev Med Pharmacol Sci. 20, (15), p.3292-6.
Yates A.J., Saqr H.E. and Van Brocklyn J. (1995). Ganglioside Modulation
of the PDGF Receptor. a Model for Ganglioside Functions. Journal of
Neuro-Oncology. 24, (1), p. 65-73.
Yip S., Sabetrasekh R., Sidman R.L. and Snyder E.Y. (2006). Neural Stem
Cells as Novel Cancer Therapeutic Vehicles. European Journal of Cancer.
42, (9), p. 1298-1308.
Yoshida T., Matsuda Y., Naito Z. and Ishiwata T. (2012). CD44 in human
glioma correlates with histopathological grade and cell migration.
Pathology International. 62, p. 463–470.
Young F.M., Phungtamdet W. and Sanderson B.J.S. (2005). Modification
of MTTAssay Conditions to Examine the Cytotoxic Effects of Amitraz on
the Human Lymphoblastoid Cell Line, WIL2NS. Toxicology in vitro. 19, (8),
p. 1051-1059.
Yu X., Zhu J., Mi M., Chen W., Pan Q., Wei M. (2012). Anti-angiogenic
genistein inhibits VEGF-induced endothelial cell activation by decreasing
PTK activity and MAPK activation. Med Oncol. 29, (1), p. 349-57.
Yung W.A., Shapiro J.R. and Shapiro W.R. (1982). Heterogeneous
Chemosensitivities of Subpopulations of Human Glioma Cells in Culture.
Cancer Research. 42, (3), p. 992-998.

224 | P a g e
Zachary I. and Rozengurt E. (1992). Focal Adhesion Kinase (P125fak): A
Point of Convergence in the Action of Neuropeptides, Integrins, and
Oncogenes. Cell. 71, (6), p. 891-894.
Zagzag D., Miller D.C., Sato Y., Rifkin D.B. and Burstein D.E. (1990).
Immunohistochemical Localization of Basic Fibroblast Growth Factor in
Astrocytomas. Cancer Research. 50, (22), p. 7393-7398.
Zbarsky V., Datla K.P., Parkar S., Rai D.K., Aruoma O.I. and Dexter D.T.
(2005). Neuroprotective Properties of the Natural Phenolic Antioxidants
Curcumin and Naringenin but not Quercetin and Fisetin in A 6-Ohda Model
of Parkinson's disease. Free Radical Research. 39, (10), p. 1119-1125.
Zhang C., Mattern J., Haferkamp A., Pfitzenmaier J., Hohenfellner M.,
Rittgen W., Edler L., Debatin K.M., Groene E. and Herr I. (2006).
Corticosteroid-Induced Chemotherapy Resistance in Urological Cancers.
Cancer Biology & Therapy. 5, (1), pp. 59-64.
Zhang M. and Chakravarti A. (2006). Novel Radiation-Enhancing Agents in
Malignant Gliomas. Seminars in Radiation Oncology. 16, (1), p. 29-37.
Zhang, L., Zhang, J., Qi, B., Jiang, G., Liu, J., Zhang, P., Ma, Y., Li, W.,
(2016). The anti-tumor effect and bioactive phytochemicals of Hedyotis
diffusa willd on ovarian cancer cells. J Ethnopharmacol. S0378-8741, (16),
p.30449-4.
Zhang, P.Y., (2015). Cardioprotection by Phytochemicals via Antiplatelet
Effects and Metabolism Modulations. Cell Biochem Biophys. 73, (2),
p.369-79.
Zhang, S.J., Sun, D., Hao, J.B., Wei, Y.F., Yin, L.F., Liu, X., (2012). The
effect of dietary soyabean isoflavones on photodynamic therapy in K562
leukemia cells. J Photochem Photobiol B. 2, (10), p.28-33.
Zhao Q., Zhao, M., Parris, A.B., Xing, Y., Yang, X., (2016). Genistein
targets the cancerous inhibitor of PP2A to induce growth inhibition and

225 | P a g e
apoptosis in breast cancer cells. Int J Oncol. 49, (3), p.1203-10.
Zheng S., Xiao Z.X., Pan Y.L., Han M.Y. and Dong Q. (2003). Continuous
Release of Interleukin 12 from Microencapsulated Engineered Cells for
Colon Cancer Therapy. World Journal of Gastroenterology. 9, (5), p. 951-
955.
Zhou, Y., Li, Y., Zhou, T., Zheng, J., Li, S., & Li, H.-B. (2016). Dietary
Natural Products for Prevention and Treatment of Liver Cancer. Nutrients.
8, (3), p.156.
Zhou, Y., Ye, X., Shi, Y., Wang, K., Wan, D., Grape seed
proanthocyanidins inhibits the invasion and migration of A549 lung cancer
cells. Xi Bao Yu Fen Zi Mian Yi Xue Za Zhi. 2016 32, (2), p.173-6.
Zhu X., Zuo H., Maher B. J., Serwanski D. R., LoTurco J. J., Lu Q. R., and
Nishiyama A. (2012). Olig2-dependent developmental fate switch of NG2
cells. Development. 139, (13), p. 2299–2307.

226 | P a g e
APPENDIX

227 | P a g e
HPLC RED CLOVER EXTRACT

228 | P a g e
RED GRAPE SEED EXTRACT