Evaluation of soil flushing potential for clean-up of desert soil contaminated by industrial...
9
Evaluation of soil flushing potential for clean-up of desert soil contaminated by industrial wastewater Shai Arnon a,b, * , Zeev Ronen a , Alexander Yakirevich a , Eilon Adar a,b a Department of Environmental Hydrology and Microbiology, Zuckerberg Institute for Water Research, J. Blaustein Institutes for Desert Research, Ben-Gurion University of the Negev, Sede-Boqer Campus 84990, Israel b Department of Geological and Environmental Sciences, Ben-Gurion University of the Negev, Israel Received 13 January 2005; received in revised form 28 March 2005; accepted 6 April 2005 Available online 9 June 2005 Abstract The flushing potential of a desert loess soil contaminated by the flame retardant Tetrabromobisphenol A (TBBPA), chloride (Cl ) and bromide (Br ) was studied in undisturbed laboratory column experiments (20 cm diameter, 45 cm long) and a small field plot (2 · 2 m). While the soluble inorganic ions (Cl and Br ) were efficiently flushed from the soil profile after less than three pore volumes (PV) of water, about 50% of the initial amount of TBBPA in the soil was also flushed, despite its hydrophobic nature. TBBPA leaching was made possible due to a significant increase in the pH of the soil solution from 7.5 to 9, which increased TBBPA aqueous solubility. The remaining TBBPA mass in the soil was not mobilized from its initial location in the topsoil due to the decrease in pH at this horizon. In situ soil flushing demonstrated that this method is a feasible treatment for reducing soil contamination at this site. Ó 2005 Elsevier Ltd. All rights reserved. Keywords: Tetrabromobisphenol A; Loess; Leaching; Ionizable organic compounds 1. Introduction In recent years, inappropriate waste disposal has become a major environmental problem that requires cost-effective remediation solutions. The ability of contami- nants to reach groundwater and put water resources at risk lies in their inherent physico-chemical properties, as well as their resistance to removal by complex physi- cal, chemical and biological reactions in unsaturated and saturated geological media (Mackay et al., 1985; Saint- Fort, 1991; Schwarzenbach et al., 1993). Applying water, with or without additives, is frequently used for soil flushing in order to clean up the vadose zone (Thom- sen et al., 1989; MacKay et al., 1996). In situ soil flush- ing can be limited due to several reasons, primarily: (1) soils that have been contaminated for a long period of time exhibit a bi-phasic pattern of desorption with an initial fast stage (min–h) and a subsequent longer slow phase (days–years) (Pavlostathis and Jaglal, 1991); (2) the heterogeneous nature of soil implies that regions with low hydraulic conductivity may exist, from which contaminants must diffuse over a long period of time to the more effectively flushed layers (MacKay et al., 1996); and (3) the slow solubility rates of hydrophobic 0045-6535/$ - see front matter Ó 2005 Elsevier Ltd. All rights reserved. doi:10.1016/j.chemosphere.2005.04.050 * Corresponding author. Address: Department of Civil and Environmental Engineering, Northwestern University, 2145 Sheridan Road, Evanston, IL 60208-3109, USA. Tel.: +1 847 467 4980; fax: +1 847 491 4011. E-mail addresses: [email protected] (S. Arnon), [email protected] (Z. Ronen), [email protected]. ac.il (A. Yakirevich), [email protected] (E. Adar). Chemosphere 62 (2006) 17–25 www.elsevier.com/locate/chemosphere
Transcript of Evaluation of soil flushing potential for clean-up of desert soil contaminated by industrial...

Chemosphere 62 (2006) 17–25
www.elsevier.com/locate/chemosphere
Evaluation of soil flushing potential for clean-up ofdesert soil contaminated by industrial wastewater
Shai Arnon a,b,*, Zeev Ronen a, Alexander Yakirevich a, Eilon Adar a,b
a Department of Environmental Hydrology and Microbiology, Zuckerberg Institute for Water Research,
J. Blaustein Institutes for Desert Research, Ben-Gurion University of the Negev, Sede-Boqer Campus 84990, Israelb Department of Geological and Environmental Sciences, Ben-Gurion University of the Negev, Israel
Received 13 January 2005; received in revised form 28 March 2005; accepted 6 April 2005
Available online 9 June 2005
Abstract
The flushing potential of a desert loess soil contaminated by the flame retardant Tetrabromobisphenol A (TBBPA),
chloride (Cl�) and bromide (Br�) was studied in undisturbed laboratory column experiments (20 cm diameter, 45 cm
long) and a small field plot (2 · 2 m). While the soluble inorganic ions (Cl� and Br�) were efficiently flushed from
the soil profile after less than three pore volumes (PV) of water, about 50% of the initial amount of TBBPA in the soil
was also flushed, despite its hydrophobic nature. TBBPA leaching was made possible due to a significant increase in the
pH of the soil solution from 7.5 to 9, which increased TBBPA aqueous solubility. The remaining TBBPA mass in
the soil was not mobilized from its initial location in the topsoil due to the decrease in pH at this horizon. In situ soil
flushing demonstrated that this method is a feasible treatment for reducing soil contamination at this site.
� 2005 Elsevier Ltd. All rights reserved.
Keywords: Tetrabromobisphenol A; Loess; Leaching; Ionizable organic compounds
1. Introduction
In recent years, inappropriate waste disposal has
become a major environmental problem that requires
cost-effective remediation solutions. The ability of contami-
nants to reach groundwater and put water resources at
risk lies in their inherent physico-chemical properties,
as well as their resistance to removal by complex physi-
0045-6535/$ - see front matter � 2005 Elsevier Ltd. All rights reserv
doi:10.1016/j.chemosphere.2005.04.050
* Corresponding author. Address: Department of Civil and
Environmental Engineering, Northwestern University, 2145
Sheridan Road, Evanston, IL 60208-3109, USA. Tel.: +1 847
467 4980; fax: +1 847 491 4011.
E-mail addresses: [email protected] (S. Arnon),
[email protected] (Z. Ronen), [email protected].
ac.il (A. Yakirevich), [email protected] (E. Adar).
cal, chemical and biological reactions in unsaturated and
saturated geological media (Mackay et al., 1985; Saint-
Fort, 1991; Schwarzenbach et al., 1993). Applying
water, with or without additives, is frequently used for
soil flushing in order to clean up the vadose zone (Thom-
sen et al., 1989; MacKay et al., 1996). In situ soil flush-
ing can be limited due to several reasons, primarily: (1)
soils that have been contaminated for a long period of
time exhibit a bi-phasic pattern of desorption with an
initial fast stage (min–h) and a subsequent longer slow
phase (days–years) (Pavlostathis and Jaglal, 1991); (2)
the heterogeneous nature of soil implies that regions
with low hydraulic conductivity may exist, from which
contaminants must diffuse over a long period of time
to the more effectively flushed layers (MacKay et al.,
1996); and (3) the slow solubility rates of hydrophobic
ed.

18 S. Arnon et al. / Chemosphere 62 (2006) 17–25
compounds further increase the flushing duration. Iden-
tifying which process limits the clean-up of a particular
site may assist in suggesting approaches for enhancing
the clean-up. For example, MacKay et al. (1996) con-
cluded that the flushing pattern is highly dependent on
the desorption and solubility rates of the different tested
compounds (benzene, toluene, ethylbenzene and xylene).
They also found that the presence of a non-aqueous
phase liquid would substantially increase the site�s esti-mated flushing duration. Thomsen et al. (1989) demon-
strated efficient cleaning of the unsaturated zone from
volatile organic compounds by using in situ soil flushing
(with water), groundwater pumping, ex situ treatment
and recharge. In many other cases the use of specific
solutions has been suggested, such as water with surfac-
tants or organic solvents, rather than clean water, to en-
hance contaminant flushing (e.g., Bettahar et al., 1999;
Di Palma, 2003). Nevertheless, the use of water for
flushing, without additives, reduces operation activities
and costs.
In this study, we assess the flushing potential of
undisturbed contaminated desert soil at the laboratory
and small field scales, as an optional method for soil
remediation. The site, 25 acres of desert loess soil, 0.1–
2 m thick, overlying fractured chalk bedrock, was con-
taminated in the late 1980s as a result of industrial
wastewater disposal in a forced evaporation facility
(Nativ et al., 1999). The inorganic contamination was
dominated by Cl� and Br� ions and the major organic
contaminant was tetrabromobisphenol A (TBBPA).
Although soil flushing might increase the risk of ground-
water contamination, when combined with additional
groundwater treatment it can provide an inexpensive
method for clean-up of contaminated soils (Thomsen
et al., 1989; MacKay et al., 1996). An underground
drain, a pumping station and a treatment facility were
already in place at the downstream edge of this site
(Nativ et al., 2003); therefore soil flushing was proposed
as a solution to clean up the contaminated soil.
TBBPA (Fig. 1) is used as a flame retardant in elec-
tronic circuit boards and in the plastics industry (de
Wit, 2002). It is of concern since it was found in stream
sediments and municipal wastewater, which also makes
it a potential groundwater contaminant (Sellstrom and
Jansson, 1995; Ronen and Abeliovich, 2000; Oberg
Br
Br
Br
Br
HO OH
CH3
CH3
C
Fig. 1. Chemical structure of TBBPA.
et al., 2002). In some cases, increased levels of TBBPA
were linked to industrial sources (Oberg et al., 2002).
There is evidence that prolonged exposure of rats to
TBBPA disturbs the liver heme metabolism (Szymanska
et al., 2000), as well as the neural system (Eriksson et al.,
1998). In vitro assays demonstrated that TBBPA was up
to 25 times more potent in binding to human transthy-
retin (thyroid transport protein) than thyroxin (the na-
tive hormone) (Brouwer, 1998).
TBBPA aqueous solubility, sorption and bioavail-
ability are pH dependent since TBBPA can be partially
ionized (Lee et al., 1991). TBBPA is not easily
biodegraded and only recently was its mineralization
demonstrated through dehalogenation under anaerobic
conditions and further biodegradation of bisphenol A
under aerobic conditions (Ronen and Abeliovich,
2000; Voordeckers et al., 2002; Arbeli and Ronen,
2003). Ionized compounds such as TBBPA exhibit com-
plex transport behavior, as some of their physico-chemi-
cal properties are pH dependent. For example,
Schellenberg et al. (1984) demonstrated that the equilib-
rium partition coefficient (Kd) of chlorinated phenols
between the sorbent and the solution could be estimated
based upon their lipophilicity, as expressed by the octa-
nol/water partition coefficient (Kow), and on the organic
carbon contents (foc) of the sorbent. Mathematical rela-
tionships between Kd, Kow and foc have been derived for
various sets of compounds and natural sorbents:
Kd ¼ focbðkowÞa ð1Þ
where a and b are coefficients peculiar to the organic
compounds under consideration. For example, Schellen-
berg et al. (1984) found from their experiment with chlo-
rinated phenols that the values of a and b are 0.82 and
1.05, respectively. They also stated that if the pH of
the solution is not more than one unit above the acid
dissociation constant (pKa) of the compound, the contri-
bution of the phenolate ion to the overall adsorption of
the phenolic compound could be neglected. For pHs
higher than one unit above the pKa, the aforementioned
adsorption model (1) failed to describe phenolate
adsorption, as was shown by Fiore et al. (2003) and by
Shimizu et al. (1992). The latter have demonstrated that
the mineral constituents (mainly clay content) of the
soils controlled the adsorption of the ionic form of
pentachlorophenol.
2. Materials and methods
2.1. Sample collection and soil properties
The soil monoliths were collected from a contami-
nated site located in the northern Negev desert, Israel.
The sampling technique was designed to collect soil
cores, 10 cm in diameter and �45 cm long, in an attempt
S. Arnon et al. / Chemosphere 62 (2006) 17–25 19
to represent the soil structure at the field site. The col-
umns consisted of a PVC cylinder with a removable
sharpened steel edge attached to its base. As the sharp-
ened column edge was pressed down by weight, shovels
were used to remove the soil around the exterior of the
steel edge to lower the soil resistance and compaction
near the monolith edge. At all times, 5 cm of soil re-
mained constantly around the column edge to prevent
separation of the soil and the steel edge. When the col-
umn was filled, the steel edge was removed, and a
2 cm layer of glass fibers was positioned at both core
ends to prevent solid particles from being washed out
of the column during the flushing experiment. The col-
umn was then sealed with caps and transported to the
laboratory. Soil samples adjacent to the sharpened edge
were taken during the collection of the monoliths for
assessment of the initial contaminant concentrations
and soil properties.
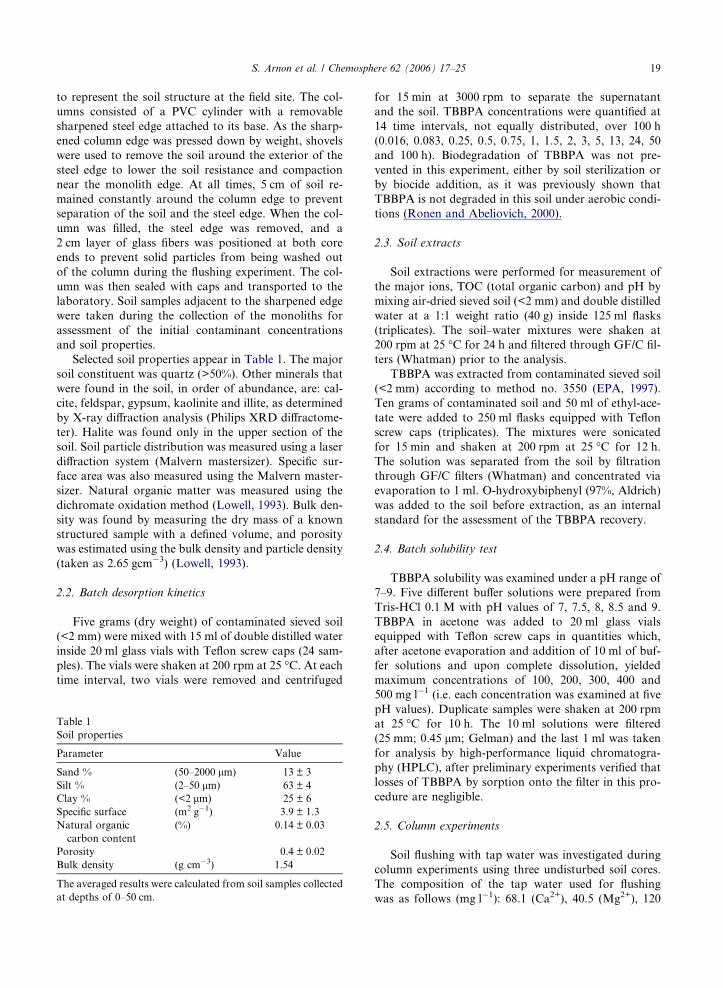
Selected soil properties appear in Table 1. The major
soil constituent was quartz (>50%). Other minerals that
were found in the soil, in order of abundance, are: cal-
cite, feldspar, gypsum, kaolinite and illite, as determined
by X-ray diffraction analysis (Philips XRD diffractome-
ter). Halite was found only in the upper section of the
soil. Soil particle distribution was measured using a laser
diffraction system (Malvern mastersizer). Specific sur-
face area was also measured using the Malvern master-
sizer. Natural organic matter was measured using the
dichromate oxidation method (Lowell, 1993). Bulk den-
sity was found by measuring the dry mass of a known
structured sample with a defined volume, and porosity
was estimated using the bulk density and particle density
(taken as 2.65 gcm�3) (Lowell, 1993).
2.2. Batch desorption kinetics
Five grams (dry weight) of contaminated sieved soil
(<2 mm) were mixed with 15 ml of double distilled water
inside 20 ml glass vials with Teflon screw caps (24 sam-
ples). The vials were shaken at 200 rpm at 25 �C. At each
time interval, two vials were removed and centrifuged
Table 1
Soil properties
Parameter Value
Sand % (50–2000 lm) 13 ± 3
Silt % (2–50 lm) 63 ± 4
Clay % (<2 lm) 25 ± 6
Specific surface (m2 g�1) 3.9 ± 1.3
Natural organic
carbon content
(%) 0.14 ± 0.03
Porosity 0.4 ± 0.02
Bulk density (g cm�3) 1.54
The averaged results were calculated from soil samples collected
at depths of 0–50 cm.
for 15 min at 3000 rpm to separate the supernatant
and the soil. TBBPA concentrations were quantified at
14 time intervals, not equally distributed, over 100 h
(0.016, 0.083, 0.25, 0.5, 0.75, 1, 1.5, 2, 3, 5, 13, 24, 50
and 100 h). Biodegradation of TBBPA was not pre-
vented in this experiment, either by soil sterilization or
by biocide addition, as it was previously shown that
TBBPA is not degraded in this soil under aerobic condi-
tions (Ronen and Abeliovich, 2000).
2.3. Soil extracts
Soil extractions were performed for measurement of
the major ions, TOC (total organic carbon) and pH by
mixing air-dried sieved soil (<2 mm) and double distilled
water at a 1:1 weight ratio (40 g) inside 125 ml flasks
(triplicates). The soil–water mixtures were shaken at
200 rpm at 25 �C for 24 h and filtered through GF/C fil-
ters (Whatman) prior to the analysis.
TBBPA was extracted from contaminated sieved soil
(<2 mm) according to method no. 3550 (EPA, 1997).
Ten grams of contaminated soil and 50 ml of ethyl-ace-
tate were added to 250 ml flasks equipped with Teflon
screw caps (triplicates). The mixtures were sonicated
for 15 min and shaken at 200 rpm at 25 �C for 12 h.
The solution was separated from the soil by filtration
through GF/C filters (Whatman) and concentrated via
evaporation to 1 ml. O-hydroxybiphenyl (97%, Aldrich)
was added to the soil before extraction, as an internal
standard for the assessment of the TBBPA recovery.
2.4. Batch solubility test
TBBPA solubility was examined under a pH range of
7–9. Five different buffer solutions were prepared from
Tris-HCl 0.1 M with pH values of 7, 7.5, 8, 8.5 and 9.
TBBPA in acetone was added to 20 ml glass vials
equipped with Teflon screw caps in quantities which,
after acetone evaporation and addition of 10 ml of buf-
fer solutions and upon complete dissolution, yielded
maximum concentrations of 100, 200, 300, 400 and
500 mg l�1 (i.e. each concentration was examined at five
pH values). Duplicate samples were shaken at 200 rpm
at 25 �C for 10 h. The 10 ml solutions were filtered
(25 mm; 0.45 lm; Gelman) and the last 1 ml was taken
for analysis by high-performance liquid chromatogra-
phy (HPLC), after preliminary experiments verified that
losses of TBBPA by sorption onto the filter in this pro-
cedure are negligible.
2.5. Column experiments
Soil flushing with tap water was investigated during
column experiments using three undisturbed soil cores.
The composition of the tap water used for flushing
was as follows (mg l�1): 68.1 (Ca2+), 40.5 (Mg2+), 120
0
20
40
60
80
100
7 7.5 8 8.5 9
100 mg/l200 mg/l300 mg/l400 mg/l500 mg/l
Solu
ble
fract
ion
(%)
pH
Initial concentration
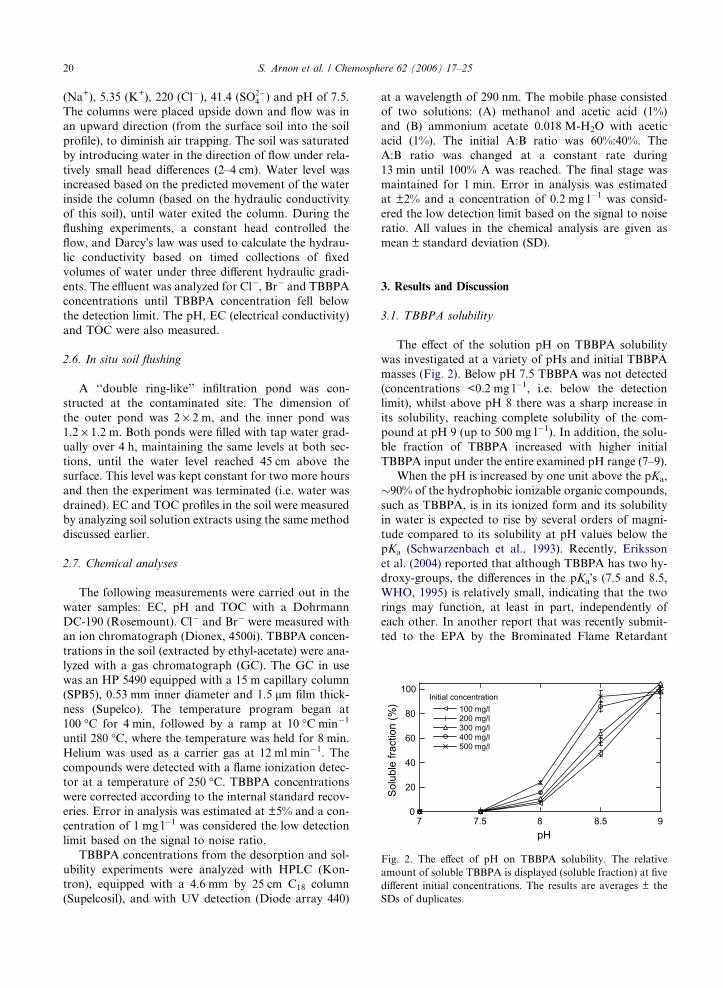
Fig. 2. The effect of pH on TBBPA solubility. The relative
amount of soluble TBBPA is displayed (soluble fraction) at five
different initial concentrations. The results are averages ± the
SDs of duplicates.
20 S. Arnon et al. / Chemosphere 62 (2006) 17–25
(Na+), 5.35 (K+), 220 (Cl�), 41.4 (SO2�4 ) and pH of 7.5.
The columns were placed upside down and flow was in
an upward direction (from the surface soil into the soil
profile), to diminish air trapping. The soil was saturated
by introducing water in the direction of flow under rela-
tively small head differences (2–4 cm). Water level was
increased based on the predicted movement of the water
inside the column (based on the hydraulic conductivity
of this soil), until water exited the column. During the
flushing experiments, a constant head controlled the
flow, and Darcy�s law was used to calculate the hydrau-
lic conductivity based on timed collections of fixed
volumes of water under three different hydraulic gradi-
ents. The effluent was analyzed for Cl�, Br� and TBBPA
concentrations until TBBPA concentration fell below
the detection limit. The pH, EC (electrical conductivity)
and TOC were also measured.
2.6. In situ soil flushing
A ‘‘double ring-like’’ infiltration pond was con-
structed at the contaminated site. The dimension of
the outer pond was 2 · 2 m, and the inner pond was
1.2 · 1.2 m. Both ponds were filled with tap water grad-
ually over 4 h, maintaining the same levels at both sec-
tions, until the water level reached 45 cm above the
surface. This level was kept constant for two more hours
and then the experiment was terminated (i.e. water was
drained). EC and TOC profiles in the soil were measured
by analyzing soil solution extracts using the same method
discussed earlier.
2.7. Chemical analyses
The following measurements were carried out in the
water samples: EC, pH and TOC with a Dohrmann
DC-190 (Rosemount). Cl� and Br� were measured with
an ion chromatograph (Dionex, 4500i). TBBPA concen-
trations in the soil (extracted by ethyl-acetate) were ana-
lyzed with a gas chromatograph (GC). The GC in use
was an HP 5490 equipped with a 15 m capillary column
(SPB5), 0.53 mm inner diameter and 1.5 lm film thick-
ness (Supelco). The temperature program began at
100 �C for 4 min, followed by a ramp at 10 �C min�1
until 280 �C, where the temperature was held for 8 min.
Helium was used as a carrier gas at 12 ml min�1. The
compounds were detected with a flame ionization detec-
tor at a temperature of 250 �C. TBBPA concentrations
were corrected according to the internal standard recov-
eries. Error in analysis was estimated at ±5% and a con-
centration of 1 mg l�1 was considered the low detection
limit based on the signal to noise ratio.
TBBPA concentrations from the desorption and sol-
ubility experiments were analyzed with HPLC (Kon-
tron), equipped with a 4.6 mm by 25 cm C18 column
(Supelcosil), and with UV detection (Diode array 440)
at a wavelength of 290 nm. The mobile phase consisted
of two solutions: (A) methanol and acetic acid (1%)
and (B) ammonium acetate 0.018 M-H2O with acetic
acid (1%). The initial A:B ratio was 60%:40%. The
A:B ratio was changed at a constant rate during
13 min until 100% A was reached. The final stage was
maintained for 1 min. Error in analysis was estimated
at ±2% and a concentration of 0.2 mg l�1 was consid-
ered the low detection limit based on the signal to noise
ratio. All values in the chemical analysis are given as
mean ± standard deviation (SD).
3. Results and Discussion
3.1. TBBPA solubility
The effect of the solution pH on TBBPA solubility
was investigated at a variety of pHs and initial TBBPA
masses (Fig. 2). Below pH 7.5 TBBPA was not detected
(concentrations <0.2 mg l�1, i.e. below the detection
limit), whilst above pH 8 there was a sharp increase in
its solubility, reaching complete solubility of the com-
pound at pH 9 (up to 500 mg l�1). In addition, the solu-
ble fraction of TBBPA increased with higher initial
TBBPA input under the entire examined pH range (7–9).
When the pH is increased by one unit above the pKa,
�90% of the hydrophobic ionizable organic compounds,
such as TBBPA, is in its ionized form and its solubility
in water is expected to rise by several orders of magni-
tude compared to its solubility at pH values below the
pKa (Schwarzenbach et al., 1993). Recently, Eriksson
et al. (2004) reported that although TBBPA has two hy-
droxy-groups, the differences in the pKa�s (7.5 and 8.5,
WHO, 1995) is relatively small, indicating that the two
rings may function, at least in part, independently of
each other. In another report that was recently submit-
ted to the EPA by the Brominated Flame Retardant
S. Arnon et al. / Chemosphere 62 (2006) 17–25 21
Industry Panel (BFRIP) (BFRIP, 2004), the pKa of
TBBPA was reported to be 9.4. While the pKa�s of
TBBPA in the aforementioned studies (BFRIP, 2004;
Eriksson et al., 2004) differ significantly from each other,
our experimental results suggest that the values reported
by Eriksson et al. (2004) better describe the behavior of
TBBPA, since TBBPA concentrations increase signifi-
cantly above pH 8 (up to 500 mg l�1). The BFRIP report
also states that the solubility of TBBPA at pHs 5, 7, and
9 was 0.148, 1.26 and 2.34 mg l�1, respectively. These re-
sults also differ from our results shown in Fig. 2. One
possible reason for the difference between our results
and those reported by the BFRIP might lie in the specific
details of the experimental procedure (e.g., what is the
maximum TBBPA concentration that might be expected
from the amount of TBBPA that was added to the
water).
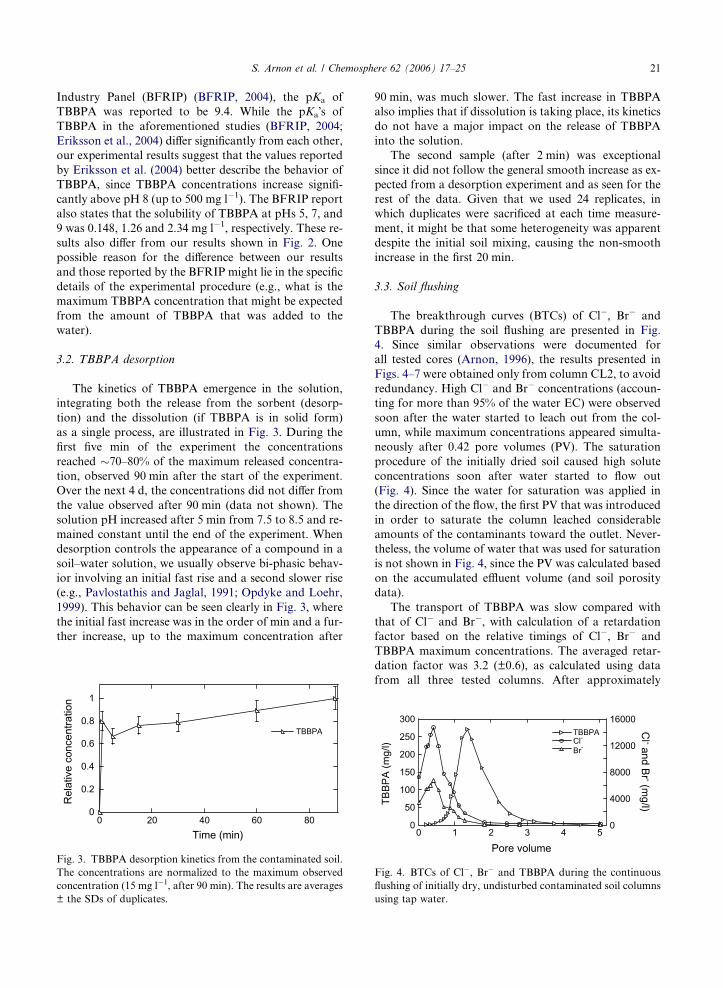
3.2. TBBPA desorption
The kinetics of TBBPA emergence in the solution,
integrating both the release from the sorbent (desorp-
tion) and the dissolution (if TBBPA is in solid form)
as a single process, are illustrated in Fig. 3. During the
first five min of the experiment the concentrations
reached �70–80% of the maximum released concentra-
tion, observed 90 min after the start of the experiment.
Over the next 4 d, the concentrations did not differ from
the value observed after 90 min (data not shown). The
solution pH increased after 5 min from 7.5 to 8.5 and re-
mained constant until the end of the experiment. When
desorption controls the appearance of a compound in a
soil–water solution, we usually observe bi-phasic behav-
ior involving an initial fast rise and a second slower rise
(e.g., Pavlostathis and Jaglal, 1991; Opdyke and Loehr,
1999). This behavior can be seen clearly in Fig. 3, where
the initial fast increase was in the order of min and a fur-
ther increase, up to the maximum concentration after
0
0.2
0.4
0.6
0.8
1
0 20 40 60 80
TBBPA
Rel
ativ
e co
ncen
tratio
n
Time (min)
Fig. 3. TBBPA desorption kinetics from the contaminated soil.
The concentrations are normalized to the maximum observed
concentration (15 mg l�1, after 90 min). The results are averages
± the SDs of duplicates.
90 min, was much slower. The fast increase in TBBPA
also implies that if dissolution is taking place, its kinetics
do not have a major impact on the release of TBBPA
into the solution.
The second sample (after 2 min) was exceptional
since it did not follow the general smooth increase as ex-
pected from a desorption experiment and as seen for the
rest of the data. Given that we used 24 replicates, in
which duplicates were sacrificed at each time measure-
ment, it might be that some heterogeneity was apparent
despite the initial soil mixing, causing the non-smooth
increase in the first 20 min.
3.3. Soil flushing
The breakthrough curves (BTCs) of Cl�, Br� and
TBBPA during the soil flushing are presented in Fig.
4. Since similar observations were documented for
all tested cores (Arnon, 1996), the results presented in
Figs. 4–7 were obtained only from column CL2, to avoid
redundancy. High Cl� and Br� concentrations (accoun-
ting for more than 95% of the water EC) were observed
soon after the water started to leach out from the col-
umn, while maximum concentrations appeared simulta-
neously after 0.42 pore volumes (PV). The saturation
procedure of the initially dried soil caused high solute
concentrations soon after water started to flow out
(Fig. 4). Since the water for saturation was applied in
the direction of the flow, the first PV that was introduced
in order to saturate the column leached considerable
amounts of the contaminants toward the outlet. Never-
theless, the volume of water that was used for saturation
is not shown in Fig. 4, since the PV was calculated based
on the accumulated effluent volume (and soil porosity
data).
The transport of TBBPA was slow compared with
that of Cl� and Br�, with calculation of a retardation
factor based on the relative timings of Cl�, Br� and
TBBPA maximum concentrations. The averaged retar-
dation factor was 3.2 (±0.6), as calculated using data
from all three tested columns. After approximately
0
50
100
150
200
250
300
0
4000
8000
12000
16000
0 1 2 3 4 5
TBBPACl-Br-
TBBP
A (m
g/l)
Cl - and Br - (m
g/l)
Pore volume
Fig. 4. BTCs of Cl�, Br� and TBBPA during the continuous
flushing of initially dry, undisturbed contaminated soil columns
using tap water.
0 50 100 150 200 250 300 350 400
Before flushingAfter flushing
TBBPA (mg/kgdry soil)
b
0 1000 2000 3000 4000 5000
0
10
20
30
40
Cl- - before flushingCl- - after flushingBr- - before flushingBr- - after flushing
Concentration (mg/kgdry soil)
Dep
th (c
m)
a
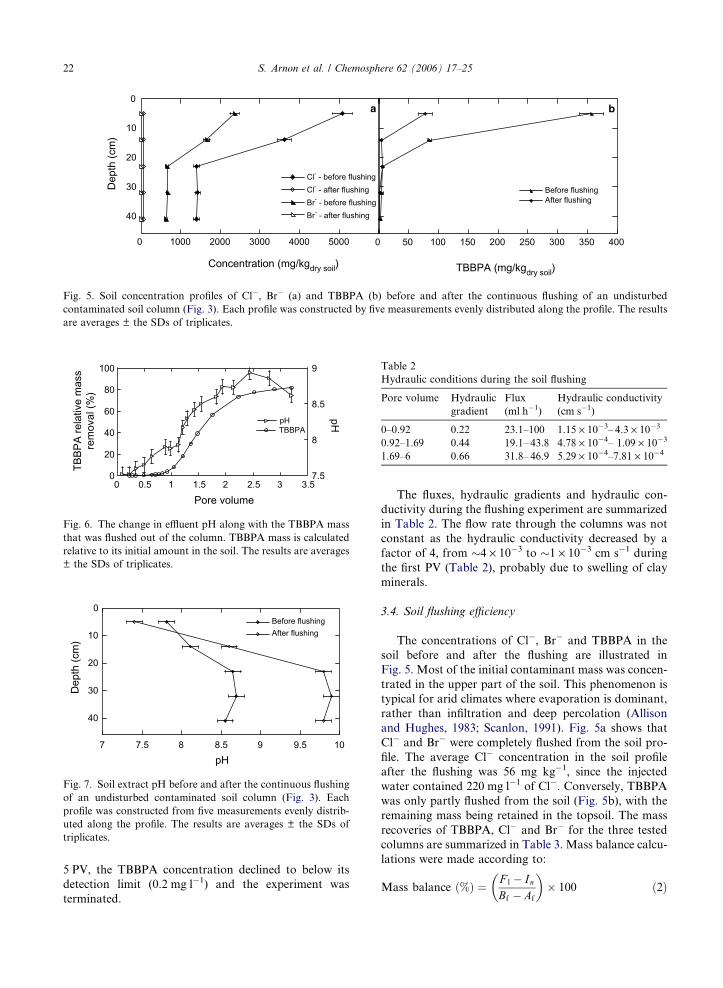
Fig. 5. Soil concentration profiles of Cl�, Br� (a) and TBBPA (b) before and after the continuous flushing of an undisturbed
contaminated soil column (Fig. 3). Each profile was constructed by five measurements evenly distributed along the profile. The results
are averages ± the SDs of triplicates.
0
20
40
60
80
100
7.5
8
8.5
9
0 0.5 1 1.5 2 2.5 3 3.5
TBBPA pH
TBBP
A re
lativ
e m
ass
rem
oval
(%)
pH
Pore volume
Fig. 6. The change in effluent pH along with the TBBPA mass
that was flushed out of the column. TBBPA mass is calculated
relative to its initial amount in the soil. The results are averages
± the SDs of triplicates.
7 7.5 8 8.5 9 9.5 10
0
10
20
30
40
Before flushingAfter flushing
pH
Dep
th (c
m)
Fig. 7. Soil extract pH before and after the continuous flushing
of an undisturbed contaminated soil column (Fig. 3). Each
profile was constructed from five measurements evenly distrib-
uted along the profile. The results are averages ± the SDs of
triplicates.
Table 2
Hydraulic conditions during the soil flushing
Pore volume Hydraulic
gradient
Flux
(ml h�1)
Hydraulic conductivity
(cm s�1)
0–0.92 0.22 23.1–100 1.15 · 10�3– 4.3 · 10�3
0.92–1.69 0.44 19.1– 43.8 4.78 · 10�4– 1.09 · 10�3
1.69–6 0.66 31.8– 46.9 5.29 · 10�4–7.81 · 10�4
22 S. Arnon et al. / Chemosphere 62 (2006) 17–25
5 PV, the TBBPA concentration declined to below its
detection limit (0.2 mg l�1) and the experiment was
terminated.
The fluxes, hydraulic gradients and hydraulic con-
ductivity during the flushing experiment are summarized
in Table 2. The flow rate through the columns was not
constant as the hydraulic conductivity decreased by a
factor of 4, from �4 · 10�3 to �1 · 10�3 cm s�1 during
the first PV (Table 2), probably due to swelling of clay
minerals.
3.4. Soil flushing efficiency
The concentrations of Cl�, Br� and TBBPA in the
soil before and after the flushing are illustrated in
Fig. 5. Most of the initial contaminant mass was concen-
trated in the upper part of the soil. This phenomenon is
typical for arid climates where evaporation is dominant,
rather than infiltration and deep percolation (Allison
and Hughes, 1983; Scanlon, 1991). Fig. 5a shows that
Cl� and Br� were completely flushed from the soil pro-
file. The average Cl� concentration in the soil profile
after the flushing was 56 mg kg�1, since the injected
water contained 220 mg l�1 of Cl�. Conversely, TBBPA
was only partly flushed from the soil (Fig. 5b), with the
remaining mass being retained in the topsoil. The mass
recoveries of TBBPA, Cl� and Br� for the three tested
columns are summarized in Table 3. Mass balance calcu-
lations were made according to:
Mass balance ð%Þ ¼ F l � InBf � Af
� �� 100 ð2Þ
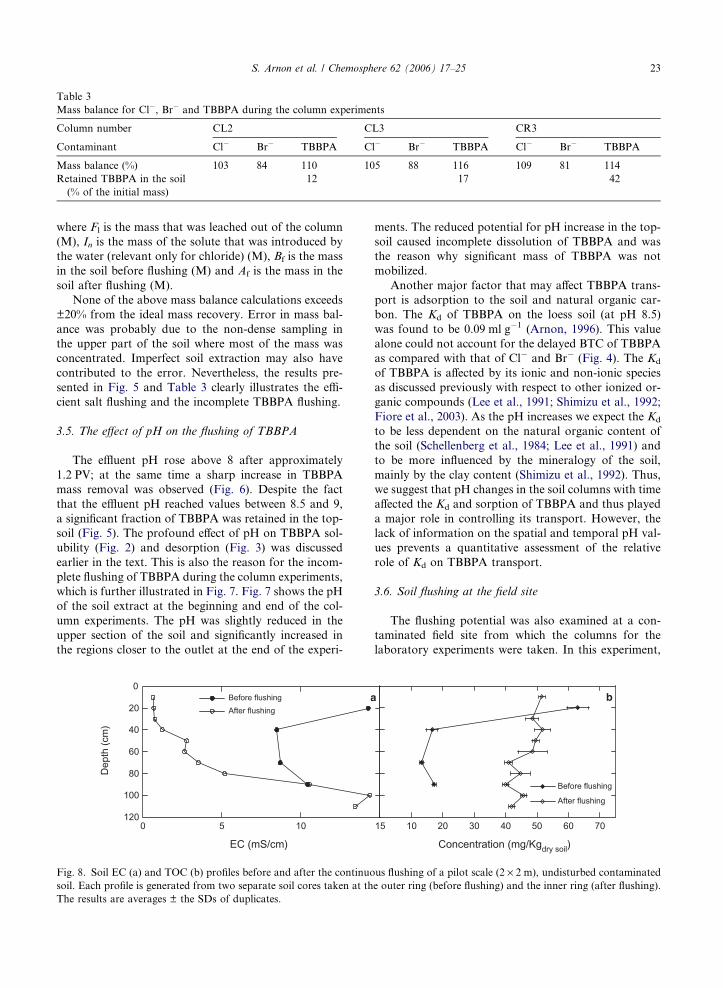
Table 3
Mass balance for Cl�, Br� and TBBPA during the column experiments
Column number CL2 CL3 CR3
Contaminant Cl� Br� TBBPA Cl� Br� TBBPA Cl� Br� TBBPA
Mass balance (%) 103 84 110 105 88 116 109 81 114
Retained TBBPA in the soil
(% of the initial mass)
12 17 42
S. Arnon et al. / Chemosphere 62 (2006) 17–25 23
where Fl is the mass that was leached out of the column
(M), In is the mass of the solute that was introduced by
the water (relevant only for chloride) (M), Bf is the mass
in the soil before flushing (M) and Af is the mass in the
soil after flushing (M).
None of the above mass balance calculations exceeds
±20% from the ideal mass recovery. Error in mass bal-
ance was probably due to the non-dense sampling in
the upper part of the soil where most of the mass was
concentrated. Imperfect soil extraction may also have
contributed to the error. Nevertheless, the results pre-
sented in Fig. 5 and Table 3 clearly illustrates the effi-
cient salt flushing and the incomplete TBBPA flushing.
3.5. The effect of pH on the flushing of TBBPA
The effluent pH rose above 8 after approximately
1.2 PV; at the same time a sharp increase in TBBPA
mass removal was observed (Fig. 6). Despite the fact
that the effluent pH reached values between 8.5 and 9,
a significant fraction of TBBPA was retained in the top-
soil (Fig. 5). The profound effect of pH on TBBPA sol-
ubility (Fig. 2) and desorption (Fig. 3) was discussed
earlier in the text. This is also the reason for the incom-
plete flushing of TBBPA during the column experiments,
which is further illustrated in Fig. 7. Fig. 7 shows the pH
of the soil extract at the beginning and end of the col-
umn experiments. The pH was slightly reduced in the
upper section of the soil and significantly increased in
the regions closer to the outlet at the end of the experi-
0 5 10
0
20
40
60
80
100
120
Before flushingAfter flushing
EC (mS/cm)
Dep
th (c
m)
a
Fig. 8. Soil EC (a) and TOC (b) profiles before and after the continuo
soil. Each profile is generated from two separate soil cores taken at th
The results are averages ± the SDs of duplicates.
ments. The reduced potential for pH increase in the top-
soil caused incomplete dissolution of TBBPA and was
the reason why significant mass of TBBPA was not
mobilized.
Another major factor that may affect TBBPA trans-
port is adsorption to the soil and natural organic car-
bon. The Kd of TBBPA on the loess soil (at pH 8.5)
was found to be 0.09 ml g�1 (Arnon, 1996). This value
alone could not account for the delayed BTC of TBBPA
as compared with that of Cl� and Br� (Fig. 4). The Kd
of TBBPA is affected by its ionic and non-ionic species
as discussed previously with respect to other ionized or-
ganic compounds (Lee et al., 1991; Shimizu et al., 1992;
Fiore et al., 2003). As the pH increases we expect the Kd
to be less dependent on the natural organic content of
the soil (Schellenberg et al., 1984; Lee et al., 1991) and
to be more influenced by the mineralogy of the soil,
mainly by the clay content (Shimizu et al., 1992). Thus,
we suggest that pH changes in the soil columns with time
affected the Kd and sorption of TBBPA and thus played
a major role in controlling its transport. However, the
lack of information on the spatial and temporal pH val-
ues prevents a quantitative assessment of the relative
role of Kd on TBBPA transport.
3.6. Soil flushing at the field site
The flushing potential was also examined at a con-
taminated field site from which the columns for the
laboratory experiments were taken. In this experiment,
15 10 20 30 40 50 60 70
Before flushing
After flushing
Concentration (mg/Kgdry soil)
b
us flushing of a pilot scale (2 · 2 m), undisturbed contaminated
e outer ring (before flushing) and the inner ring (after flushing).
24 S. Arnon et al. / Chemosphere 62 (2006) 17–25
TOC was monitored as a marker of organic contami-
nant (mainly TBBPA) concentrations, while the EC
represented the soluble salt (Cl� and Br�) concentra-
tions. Both tracers, TOC and EC, exhibited linear cor-
relations to TBBPA and to Cl� + Br� (R2 = 0.8 and
0.94, respectively), as measured during the laboratory
experiments. Fig. 8 shows the EC and TOC profiles
in the soil before and after flushing. No comprehensive
effort was made to deal with the spatial distribution of
the soil contaminants. Therefore, the results in Fig. 8
should be treated as qualitative, expressing mainly the
major patterns of the contaminants� distribution in
the soil.
The amount of water that percolated into the soil was
equal to 1 PV of a soil section up to a depth of 0.9 m.
This was calculated based on the volume of water that
percolated through the inner pond (1.2 · 1.2 m) and a
porosity of 0.4 (Table 1). The salts front (EC) leached
into the soil profile up to 90 cm, leaving the topsoil al-
most completely leached (Fig. 8a). The calculated PV
and the depth of the front verify that the salts were effi-
ciently flushed from the soil, as observed in the labora-
tory studies. The TOC profile suggests that a major
fraction of the organic contaminants still remained in
the topsoil (Fig. 8b), similar to the laboratory experi-
ments (Fig. 5). Nevertheless, a significant amount of
TOC was still abundant in the entire soil profile as a re-
sult of the relatively small volume of water that was used
(1 PV).
4. Summary and conclusions
The results of this study suggest that soil flushing can
be efficiently applied to remediate contaminated desert
soils. The laboratory experiments show that complete re-
moval of Cl� and Br� from the soil required about 3 PV,
while at the same time more than 50% of TBBPA initial
mass was also removed. Nevertheless, after 5 PV,
TBBPA leaching became inefficient due to inability to
increase the pH to the value needed for dissociation of
TBBPA in the topsoil. Thus, the remaining TBBPA
mass was sustained in the uppermost part of the soil pro-
file rather than being leached to the lower parts of the
profile. An artificial increase in the flushing solution
pH has the potential to increase the efficiency of this
treatment.
A pilot scale field experiment demonstrated that in
situ soil flushing is a feasible treatment for reducing con-
tamination levels in desert loess soils, when accompa-
nied by groundwater extraction and treatment (‘‘pump
& treat’’). Since saline soils are ubiquitous in arid zones
it is expected that high pH will be developed upon wet-
ting. (Hillel, 1998), which is favorable for the flushing of
ionogenic compounds. Nevertheless, further study is
needed, mainly on the two-dimensional flow patterns
that are expected to develop when irrigating with water
on a highly saline soil such as loess.
Acknowledgements
We thank Zoe Grabinar for editorial assistance and
Dr. Helen Graber for constructive comments.
References
Allison, G.B., Hughes, M.W., 1983. The use of natural tracers
as indicators of soil–water movement in a temperate semi-
arid region. J. Hydrol. 60, 157–173.
Arbeli, Z., Ronen, Z., 2003. Enrichment of a microbial culture
capable of reductive debromination of the flame retardant
tetrabromobisphenol-A, and identification of the interme-
diate metabolites produced in the process. Biodegradation
14, 385–395.
Arnon, S., 1996. Transport of organic and inorganic contam-
inants in desert soil—evaluation of contaminants flushing
potential from a contaminated soil near Ramat–Hovav
industrial park (in Hebrew). M.Sc. Thesis, Ben Gurion
University of the Negev, Beer–Sheva.
Bettahar, M., Ducreux, J., Schafer, G., Van Dorpe, F., 1999.
Surfactant enhanced in situ remediation of LNAPL con-
taminated aquifers: large scale studies on a controlled
experimental site. Transp. Porous Media 37, 255–276.
BFRIP, 2004. HPV data summary and test plan for phenol,
4,4 0-isopropylidenbis[2,6-dibromo-(TETRABROMOBI-
SPHENOL A, TBBPA). EPA report number: 201-15678.
Available from: <http://www.epa.gov/chemrtk/phenolis/
c13460rt2.pdf>.
Brouwer, A., 1998. Structure-dependent multiple interactions of
polyhalogenated aromatic hydrocarbons with the thyroid
hormone system. Organohalogen Compd. 37, 225–228.
de Wit, C.A., 2002. An overview of brominated flame
retardants in the environment. Chemosphere 46, 583–
624.
Di Palma, L., 2003. Experimental assessment of a process for
the remediation of organophosphorous pesticides contam-
inated soils through in situ soil flushing and hydrolysis.
Water Air Soil Pollut. 143, 301–314.
EPA, 1997. Test methods for evaluating solid waste, physical/
chemical methods. Method no. 3550 (CD-ROM version 2),
Springfield, VA.
Eriksson, J., Rahm, S., Green, N., Bergman, A., Jakobsson, E.,
2004. Photochemical transformations of tetrabromobisphe-
nol A and related phenols in water. Chemosphere 54, 117–
126.
Eriksson, P., Jakobsson, E., Fredriksson, A., 1998. Develop-
mental neurotoxicity of brominated flame-retardants, poly-
brominated diphenyl ethers, and tetrabromo-bis-phenol A.
Organohalogen Compd. 35, 375–377.
Fiore, S., Zanetti, M.C., Genon, G., 2003. Experimental study
of the pH influence on the transport mechanisms of phenols
in soil. Ann. Chim. 93, 595–605.
Hillel, D., 1998. Environmental Soil Physics. Academic Press,
San Diego, Ca.
S. Arnon et al. / Chemosphere 62 (2006) 17–25 25
Lee, L.S., Rao, P.S.C., Brusseau, M.L., 1991. Nonequilibrium
sorption and transport of neutral and ionized chlorophe-
nols. Environ. Sci. Technol. 25, 722–729.
Lowell, D.L., 1993. Soil Science: Methods and Applications.
Longman Scientific & Technical, Singapore.
MacKay, A.A., Chin, Y.-P., MacFarlane, J.K., Gschwend,
P.M., 1996. Laboratory assessment of BTEX soil flushing.
Environ. Sci. Technol. 30, 3223–3231.
Mackay, D.M., Roberts, P.V., Cherry, J.A., 1985. Transport of
organic contaminants in groundwater. Environ. Sci. Tech-
nol. 19, 384–392.
Nativ, R., Adar, E., Assaf, L., Nygaard, E., 2003. Character-
ization of the hydraulic properties of fractures in chalk.
Ground Water 41 (4), 532–543.
Nativ, R., Adar, E.M., Becker, A., 1999. Designing a monitor-
ing network for contaminated ground water in fractured
chalk. Ground Water 37, 38–47.
Oberg, K., Warman, K., Oberg, T., 2002. Distribution and
levels of brominated flame retardants in sewage sludge.
Chemosphere 48, 805–809.
Opdyke, D.R., Loehr, R.C., 1999. Determination of chemical
release rates from soils: experimental design. Environ. Sci.
Technol. 33, 1193–1199.
Pavlostathis, S.G., Jaglal, K., 1991. Desorptive behavior of
trichloroethylene in contaminated soil. Environ. Sci. Tech-
nol. 25, 274–279.
Ronen, Z., Abeliovich, A., 2000. Anaerobic–aerobic process for
microbial degradation of tetrabromobisphenol A. Appl.
Environ. Microbiol. 66, 2372–2377.
Saint-Fort, R., 1991. Groundwater contamination by anthro-
pogenic organic compounds from waste disposal sites:
transformations and behavior. J. Environ. Sci. Health. A
26, 13–62.
Scanlon, B.R., 1991. Evaluation of moisture flux from chloride
data in desert soils. J. Hydrol. 128, 137–156.
Schellenberg, K., Leuenberger, C., Schwarzenbach, R.P., 1984.
Sorption of chlorinated phenols by natural sediments and
aquifer materials. Environ. Sci. Technol. 18, 652–657.
Schwarzenbach, R.P., Gschwend, P.M., Imboden, D.M., 1993.
Environmental Organic Chemistry. John Wiley & Sons,
New-York.
Sellstrom, U., Jansson, B., 1995. Analysis of tetrabromobi-
sphenol a in a product and environmental-samples. Che-
mosphere 31, 3085–3092.
Shimizu, Y., Yamazaki, S., Terashima, Y., 1992. Sorption of
anionic pentachlorophenol (PCP) in aquatic environments:
the effect of pH. Water Sci. Technol. 25, 41–48.
Szymanska, J.A., Piotrowski, J.K., Frydrych, B., 2000. Hepa-
totoxicity of tetrabromobisphenol-A: effects of repeated
dosage in rats. Toxicology 142, 87–95.
Thomsen, K.O., Chaudhry, M.A., Dovantzis, K., Riesing,
R.R., 1989. Groundwater remediation using an extraction,
treatment, and recharge system. Ground Water Monitor.
Rev. 9, 92–99.
Voordeckers, J.W., Fennell, D.E., Jones, K., Haggblom Max,
M., 2002. Anaerobic biotransformation of tetrabromobi-
sphenol A, tetrachlorobisphenol A, and bisphenol A in
estuarine sediments. Environ. Sci. Technol. 36, 696–701.
WHO, 1995. Environmental Health Criteria 172. Tetrabromo-
bisphenol A and derivatives International Program on
Chemical Safety. World Health Organization, Geneva,
Switzerland.