Evaluation of six primer pairs targeting the nuclear rRNA operon for characterization of arbuscular...
8
Evaluation of six primer pairs targeting the nuclear rRNA operon for characterization of arbuscular mycorrhizal fungal (AMF) communities using 454 pyrosequencing Maarten Van Geel a, ⁎, Pieter Busschaert b , Olivier Honnay a , Bart Lievens b a Plant Conservation and Population Biology, Biology Department, KU Leuven, Kasteelpark Arenberg 31, B-3001 Heverlee, Belgium b Laboratory for Process Microbial Ecology and Bioinspirational Management (PME&BIM), Department of Microbial and Molecular Systems (M 2 S), KU Leuven, Campus De Nayer, B-2860 Sint Katelijne-Waver, Belgium abstract article info Article history: Received 2 June 2014 Received in revised form 7 August 2014 Accepted 10 August 2014 Available online 27 August 2014 Keywords: Glomeromycota Apple trees Primers Community analysis High-throughput sequencing Ribosomal RNA In the last few years, 454 pyrosequencing-based analysis of arbuscular mycorrhizal fungal (AMF; Glomeromycota) communities has tremendously increased our knowledge of the distribution and diversity of AMF. Nonetheless, comparing results between different studies is difficult, as different target genes (or regions thereof) and primer combinations, with potentially dissimilar specificities and efficacies, are being utilized. In this study we evaluated six primer pairs that have previously been used in AMF studies (NS31–AM1, AMV4.5NF–AMDGR, AML1–AML2, NS31–AML2, FLR3–LSUmBr and Glo454–NDL22) for their use in 454 pyrosequencing based on both an in silico ap- proach and 454 pyrosequencing of AMF communities from apple tree roots. Primers were evaluated in terms of (i) in silico coverage of Glomeromycota fungi, (ii) the number of high-quality sequences obtained, (iii) selectivity for AMF species, (iv) reproducibility and (v) ability to accurately describe AMF communities. We show that primer pairs AMV4.5NF–AMDGR, AML1–AML2 and NS31–AML2 outperformed the other tested primer pairs in terms of number of Glomeromycota reads (AMF specificity and coverage). Additionally, these primer pairs were found to have no or only few mismatches to AMF sequences and were able to consistently describe AMF communities from apple roots. However, whereas most high-quality AMF sequences were obtained for AMV4.5NF–AMDGR, our results also suggest that this primer pair favored amplification of Glomeraceae sequences at the expense of Ambisporaceae, Claroideoglomeraceae and Paraglomeraceae sequences. Furthermore, we demonstrate the com- plementary specificity of AMV4.5NF–AMDGR with AML1–AML2, and of AMV4.5NF–AMDGR with NS31–AML2, making these primer combinations highly suitable for tandem use in covering the diversity of AMF communities. © 2014 Elsevier B.V. All rights reserved. 1. Introduction Arbuscular mycorrhizal fungi (AMF) form a root symbiosis with approximately 80% of the terrestrial plant species and improve nu- trient and water uptake as well as pathogen resistance in their hosts in exchange for plant assimilated carbon (Smith and Read, 2008). It is therefore increasingly acknowledged that AMF play a key role in ecosystem functioning, and therefore, quantifying and understanding their distribution and diversity is of major impor- tance (Rillig and Mummey, 2006; van der Heijden et al., 2008). All AMF belong to the phylum Glomeromycota (Schüβler et al., 2001), which is divided in four orders (Diversisporales, Glomerales, Archaeosporales and Paraglomerales) and ten families. Most AMF species belong to the families of Diversisporaceae, Acaulosporaceae, Gigasporaceae, Claroideoglomeraceae and Archaeosporaceae (Redecker et al., 2013). Molecular methods have become the standard for studying AMF communities (Gorzelak et al., 2012). Especially high throughput sequencing technologies such as 454 amplicon pyrosequencing (Margulies et al., 2005), enabling highly efficient characterization of microbial communities by sequencing medium-sized (200–600 bp) amplicons are currently often used (e.g. Öpik et al., 2009, 2013; Lekberg et al., 2012; De Beenhouwer et al., 2014). For molecular identi- fication of AMF, the nuclear ribosomal RNA (rRNA) operon is commonly used, mainly due to its high resolving power and alignment capability across broad taxonomic groups (Stockinger et al., 2010; Schoch et al., 2012). Whereas the internal transcribed spacer (ITS) region has been suggested as the standard fungal barcode (Schoch et al., 2012), this region is exceptionally variable for AMF and does not resolve closely related species (Stockinger et al., 2010). Therefore, Stockinger et al. (2010) recommended a 1500 bp region, including a segment of the small subunit (SSU) rRNA gene, the entire ITS region, and a portion of Journal of Microbiological Methods 106 (2014) 93–100 ⁎ Corresponding author. Tel.: +32 16 37 37 86. E-mail address: [email protected] (M. Van Geel). http://dx.doi.org/10.1016/j.mimet.2014.08.006 0167-7012/© 2014 Elsevier B.V. All rights reserved. Contents lists available at ScienceDirect Journal of Microbiological Methods journal homepage: www.elsevier.com/locate/jmicmeth
Transcript of Evaluation of six primer pairs targeting the nuclear rRNA operon for characterization of arbuscular...

Journal of Microbiological Methods 106 (2014) 93–100
Contents lists available at ScienceDirect
Journal of Microbiological Methods
j ourna l homepage: www.e lsev ie r .com/ locate / jmicmeth
Evaluation of six primer pairs targeting the nuclear rRNA operon forcharacterization of arbuscular mycorrhizal fungal (AMF) communitiesusing 454 pyrosequencing
Maarten Van Geel a,⁎, Pieter Busschaert b, Olivier Honnay a, Bart Lievens b
a Plant Conservation and Population Biology, Biology Department, KU Leuven, Kasteelpark Arenberg 31, B-3001 Heverlee, Belgiumb Laboratory for Process Microbial Ecology and Bioinspirational Management (PME&BIM), Department of Microbial and Molecular Systems (M2S), KU Leuven, Campus De Nayer,B-2860 Sint Katelijne-Waver, Belgium
⁎ Corresponding author. Tel.: +32 16 37 37 86.E-mail address: [email protected] (M
http://dx.doi.org/10.1016/j.mimet.2014.08.0060167-7012/© 2014 Elsevier B.V. All rights reserved.
a b s t r a c t
a r t i c l e i n f oArticle history:Received 2 June 2014Received in revised form 7 August 2014Accepted 10 August 2014Available online 27 August 2014
Keywords:GlomeromycotaApple treesPrimersCommunity analysisHigh-throughput sequencingRibosomal RNA
In the last few years, 454 pyrosequencing-based analysis of arbuscularmycorrhizal fungal (AMF; Glomeromycota)communities has tremendously increased our knowledge of the distribution and diversity of AMF. Nonetheless,comparing results between different studies is difficult, as different target genes (or regions thereof) and primercombinations, with potentially dissimilar specificities and efficacies, are being utilized. In this study we evaluatedsix primer pairs that have previously been used in AMF studies (NS31–AM1, AMV4.5NF–AMDGR, AML1–AML2,NS31–AML2, FLR3–LSUmBr andGlo454–NDL22) for their use in 454 pyrosequencing based on both an in silico ap-proach and 454 pyrosequencing of AMF communities from apple tree roots. Primers were evaluated in terms of(i) in silico coverage of Glomeromycota fungi, (ii) the number of high-quality sequences obtained, (iii) selectivityfor AMF species, (iv) reproducibility and (v) ability to accurately describe AMF communities.We show that primerpairs AMV4.5NF–AMDGR, AML1–AML2 and NS31–AML2 outperformed the other tested primer pairs in terms ofnumber of Glomeromycota reads (AMF specificity and coverage). Additionally, these primer pairs were found tohave no or only few mismatches to AMF sequences and were able to consistently describe AMF communitiesfrom apple roots. However, whereas most high-quality AMF sequences were obtained for AMV4.5NF–AMDGR,our results also suggest that this primer pair favored amplification of Glomeraceae sequences at the expense ofAmbisporaceae, Claroideoglomeraceae and Paraglomeraceae sequences. Furthermore, we demonstrate the com-plementary specificity of AMV4.5NF–AMDGR with AML1–AML2, and of AMV4.5NF–AMDGR with NS31–AML2,making these primer combinations highly suitable for tandem use in covering the diversity of AMF communities.
© 2014 Elsevier B.V. All rights reserved.
1. Introduction
Arbuscular mycorrhizal fungi (AMF) form a root symbiosis withapproximately 80% of the terrestrial plant species and improve nu-trient and water uptake as well as pathogen resistance in theirhosts in exchange for plant assimilated carbon (Smith and Read,2008). It is therefore increasingly acknowledged that AMF play akey role in ecosystem functioning, and therefore, quantifying andunderstanding their distribution and diversity is of major impor-tance (Rillig and Mummey, 2006; van der Heijden et al., 2008). AllAMF belong to the phylum Glomeromycota (Schüβler et al., 2001),which is divided in four orders (Diversisporales, Glomerales,Archaeosporales and Paraglomerales) and ten families. Most AMFspecies belong to the families of Diversisporaceae, Acaulosporaceae,
. Van Geel).
Gigasporaceae, Claroideoglomeraceae and Archaeosporaceae (Redeckeret al., 2013).
Molecular methods have become the standard for studying AMFcommunities (Gorzelak et al., 2012). Especially high throughputsequencing technologies such as 454 amplicon pyrosequencing(Margulies et al., 2005), enabling highly efficient characterization ofmicrobial communities by sequencing medium-sized (200–600 bp)amplicons are currently often used (e.g. Öpik et al., 2009, 2013;Lekberg et al., 2012; De Beenhouwer et al., 2014). For molecular identi-fication of AMF, the nuclear ribosomal RNA (rRNA) operon is commonlyused, mainly due to its high resolving power and alignment capabilityacross broad taxonomic groups (Stockinger et al., 2010; Schoch et al.,2012). Whereas the internal transcribed spacer (ITS) region has beensuggested as the standard fungal barcode (Schoch et al., 2012), thisregion is exceptionally variable for AMF and does not resolve closelyrelated species (Stockinger et al., 2010). Therefore, Stockinger et al.(2010) recommended a 1500 bp region, including a segment of thesmall subunit (SSU) rRNA gene, the entire ITS region, and a portion of
94 M. Van Geel et al. / Journal of Microbiological Methods 106 (2014) 93–100
the large subunit (LSU) rRNAgene for AMFDNAbarcoding. However, sofar the SSU region has been most commonly used for studying AMFcommunities (Öpik et al., 2013).
Different primer pairs have been used to amplify different parts ofthe SSU region to investigate AMF communities. Öpik et al. (2009)were the first studying AMF communities using 454 pyrosequencingand used the NS31–AM1 primer pair, one of the first primer pairs de-signed for the detection and identification of AMF (Simon et al., 1992;Helgason et al., 1998). Whereas this primer pair has been frequentlyused in AMF studies, it was also shown to pick up non-AMF speciesand to not detect all species from thebasal AMF families Ambisporaceae,Archaeosporaceae and Paraglomeraceae (Daniell et al., 2001). Luminiet al. (2010) used AMV4.5NF and AMDGR (Sato et al., 2005) for 454pyrosequencing-based AMF investigation, and showed that this primerpair resulted in a higher proportion of AMF sequences and detection of abroader spectrum of Glomeromycota when compared to NS31–AM1. Inorder to overcome the disadvantages of the NS31–AM1 primer pair, Leeet al. (2008) designed primer pair AML1–AML2 showing a better insilico specificity and coverage across the Glomeromycota. For 454pyrosequencing-based AMF studies, the reverse primer AML2 hasbeen combined with NS31 (Davison et al., 2012).
In addition to the SSU region, segments of the LSU region have alsobeen used for studying AMF communities using pyrosequencing. Morespecifically, Stockinger et al. (2010) recommended the LSU-D2 region,marked by the primers FLR3 and LSUmBr. Lekberg et al. (2012)exploited this region to study shifts in AMF communities using a novelforward primer, Glo454, in combination with the reverse primerNDL22 designed by van Tuinen et al. (1998).
AMF community analysis using next-generation sequencing has tre-mendously increased our knowledge of the diversity and the spatial andtemporal variation of AMF communities. However, comparing resultsbetween studies is often difficult, as there has been little consistencyin target genes and primer sets utilized. Moreover, each combinationof target region and primer pair, with potentially different specificitiesand amplification kinetics (Kohout et al., 2014), may bias the descrip-tion of the fungal community sampled. Therefore, the objective ofthis study was to critically evaluate the performance of six differentAMF primer pairs, previously used in AMF studies, for use in high-throughput sequencing-based AMF community analysis. Differentregions of the rRNA gene were evaluated in silico with respect totheir effectiveness to resolve AMF species; the in silico coverage ofGlomeromycota was assessed; and the primer pairs were comparedby evaluating their ability to characterize AMF communities infield samples using 454 pyrosequencing. Primers were evaluatedwith respect to (i) the number of high-quality sequences obtained,
Table 1Primer pairs used in this study.
Primer paira Sequence (5′ → 3′)
1. NS31 (F) TTGGAGGGCAAGTCTGGTGCCAM1 (R) GTTTCCCGTAAGGCGCCGAA
2. AMV4.5NF (F) AAGCTCGTAGTTGAATTTCGAMDGR (R) CCCAACTATCCCTATTAATCAT
3. AML1 (F) ATCAACTTTCGATGGTAGGATAGAAML2 (R) GAACCCAAACACTTTGGTTTCC
4. NS31 (F) TTGGAGGGCAAGTCTGGTGCCAML2 (R) GAACCCAAACACTTTGGTTTCC
5. FLR3 (F) TTGAAAGGGAAACGATTGAAGTLSUmBr1 (R) DAACACTCGCATATATGTTAGALSUmBr2 (R) AACACTCGCACACATGTTAGALSUmBr3 (R) AACACTCGCATACATGTTAGALSUmBr4 (R) AAACACTCGCACATATGTTAGALSUmBr5 (R) AACACTCGCATATATGCTAGA
6. Glo454 (F) TGAAAGGGAAACGATTGAAGTNDL22 (R) TGGTCCGTGTTTCAAGACG
a F, Forward primer; R, Reverse primer.b SSU, small subunit rRNA gene; LSU, large subunit rRNA gene.
(ii) selectivity for AMF species, (iii) reproducibility and (iv) ability toaccurately describe AMF communities. In the framework of an ongoingstudy on the distribution of AMF across apple orchards of differentman-agement types, we focused on the AMF communities of cultivated andwild apple trees in the central and eastern part of Belgium. Previouswork has shown that cultivated apple trees harbor a high diversity ofAMF species and genera (Purin et al., 2006).
2. Materials and methods
2.1. Primer selection
Six SSU- or LSU-targeting primer pairs, commonly used in AMF stud-ies, were selected for this study (Table 1; Fig. 1). Primer combinationsincluded four primer pairs previously used in 454 pyrosequencing-based AMF community analyses: NS31–AM1, AMV4.5NF–AMDGR,NS31–AML2 and Glo454–NDL22. Additionally, we included FLR3–LSUmBr and AML1–AML2 in our comparison.
2.2. In silico target region evaluation
In order to assess the capacity of the different rRNA gene regionstargeted by the selected primers to distinguish different AMF species,the nucleotide diversity (Pi) was calculated using 458 (SSU) and 614(LSU) aligned AMF reference sequences belonging to almost 100 AMFspecies (retrieved from Krüger et al., 2012). Pi is the average numberof nucleotide differences in a 10 base window between two sequences(Nei, 1987).
2.3. In silico primer evaluation
In order to assess the ability of the selected primers to efficientlyand specifically amplify AMF sequences, all primer sequences wereindividually subjected to an in silico analysis using the PrimerProspectorsoftware (Walters et al., 2011). Each primer sequence was screenedagainst all sequences from the Krüger et al. (2012) database,representing the ten major families in the Glomeromycota, in-cluding the Acaulosporaceae, Ambisporaceae, Archaeosporaceae,Claroideoglomeraceae, Diversisporaceae, Glomeraceae, Geosiphonoceae,Gigasporaceae, Pacisporaceae and Paraglomeraceae. PrimerProspectorscores were calculated as [non-3′ mismatches ∗ 0.40] + [3′ mis-matches ∗ 1.00] + [3′ terminus mismatch = True, + 3.00] + [non 3′gaps ∗ 1.00] + [3′ gaps ∗ 3.00], giving larger penalties to gaps andmismatches in the 3′ end (last 5 bp) of the primer, which representsthe most crucial region for primer extension (Lefever et al., 2013). For
Fragment size Target regionb Reference
550 bp SSU Simon et al. (1992)Helgason et al. (1998)
300 bp SSU Sato et al. (2005)Sato et al. (2005)
800 bp SSU Lee et al. (2008)Lee et al. (2008)
550 bp SSU Simon et al. (1992)Lee et al. (2008)
370–436 bp LSU Krüger et al. (2009)Krüger et al. (2009)Krüger et al. (2009)Krüger et al. (2009)Krüger et al. (2009)Krüger et al. (2009)
350 bp LSU Lekberg et al. (2012)van Tuinen et al. (1998)

ITS1 ITS2Small subunit D2 Large subunit5.8S D1
190 bp
AMV4.5NF-AMDGR
NS31-AM1,NS31-AML2
AML1 Glo454FLR3
AMDGR
NS31
NDL22 LSUmBr
AMV4.5NF
Glo454-NDL22
FLR3-LSUmBr
AM1 AML2
Fig. 1. Schematicmap indicating the target regions of the rRNA gene and primer locations. Dashed lines represent the sequenced regions and arrows indicate the direction of sequencing.
95M. Van Geel et al. / Journal of Microbiological Methods 106 (2014) 93–100
each primer, the proportion of sequences having a good (b1), mediocre(≥1 and b2) and poor (≥2) score was calculated. In this regard, se-quences representing the different AMF families were equallyweightedto evaluate the primers at the family level rather than at the level ofindividual isolates.
2.4. Primer pair evaluation by assessing field samples using454 pyrosequencing
Five commercial apple (Malus domestica; cv. ‘Jonagold’) orchardsfrom the central and eastern part of Flanders, Belgium, were selectedfor this study. Additionally, wild apple trees (Malus sylvestris) fromMeerdaalwoud, a forest 10 km south of Leuven (Belgium)were includedin the study. All trees in the commercial orchards were grafted on M9rootstocks. In August 2012, roots from three randomly chosen appletrees per sampling sitewere excavated, and thefine rootswere collected,as these are especially known to contain AMF (Smith and Read, 2008)(Table 2).
Following microscopic verification of mycorrhizal colonization, theroots were cut in 1–2 cm pieces and rinsed twice with sterile distilledwater. Subsequently, DNA was extracted from c. 0.25 g root materialusing the UltraClean Plant DNA Isolation Kit (MoBio Laboratories Inc.,Solana Beach, CA, USA) according to the manufacturer's instructions,and 10 times diluted prior to PCR amplification. ‘Fusion’ primers, re-quired for the 454 process, were designed according to the guidelinesfor 454 GS-FLX Titanium Lib-L sequencing containing the Roche 454pyrosequencing adapters and a sample-specific MID barcode in be-tween each adapter and primer sequence (Table S1). In order to obtainsequences that could be compared betweendifferent primer sets, fusionprimers were constructed in such a way that amplicons generated withNS31–AM1, AML1–AML2 and NS31–AML2 were sequenced from thereverse primer, whereas the other amplicons were sequenced in theforward direction (Fig. 1; Table S1). PCR reactions were performed ona Bio-Rad T100 thermal cycler (Bio-Rad Laboratories, CA, USA) in a reac-tion volume of 20 μl, containing 0.15 mM of each dNTP, 0.5 μM of eachprimer, 1× Titanium Taq PCR buffer, 1U Titanium Taq DNA polymerase(Clontech Laboratories, Palo Alto, CA, USA), and 1 μl genomic DNA. Be-fore amplification, DNA samples were denatured at 94 °C for 2 min.
Table 2Orchardsa sampled in this study.
Orchard ID Location Latitude, longitude Sample ID
Bi Oetingen 50°46′25″N, 4°4′34″E Bi1, Bi2, Bi3Ca Nieuwerkerken 50°52′18″N, 5°11′33″E Ca1, Ca2, Ca3Ha Herk-de-Stad 50°56′19″N, 5°10′6″E Ha1, Ha2,Ha3Hu Ranst 51°10′13″N, 4°36′1.23″E Hu1, Hu2, Hu3Lo Heers 50°45′13″N, 5°18′07″E Lo1, Lo2, Lo3Wia Meerdaalwoud 50°48′19″N, 4°41′17″E Wi1, Wi2, Wi3
a Representing wild apple trees in a forest.
Next, 35 cycles were run, consisting of 45 s at 94 °C, 45 s at 65 °C and45 s at 72 °C, followed by a final elongation of 10 min at 72 °C. ForNS31–AM1, the conditions as described in Öpik et al. (2009) wereused. After resolving the amplicons by agarose gel electrophoresis,amplicons within the appropriate size range were cut from the geland purified using the QIAquick Gel Extraction Kit (Qiagen, Hamburg,Germany). Purified dsDNA amplicons were quantified using theQuant-iT PicoGreen® dsDNA Assay Kit and the Qubit fluorometer(both from Invitrogen, Gent, Belgium). PCR amplifications were per-formed twice for each primer pair to verify reproducibility. Subsequent-ly, for each primer pair, ampliconswere pooled in equimolar quantities,resulting in six amplicon libraries (one for each primer pair). The qualityof the amplicon libraries was assessed using the Agilent Bioanalyzer2100 (Agilent Technologies, Waldbronn, Germany). Each ampliconlibrary was loaded onto a separate 1/8th of a 454 Pico Titer Plate (PTP)and pyrosequencingwas performed using theRocheGS-FLX instrumentand Titanium chemistry according to the manufacturer's instructions(Roche Applied Science, Mannheim, Germany)
Irrespective of the target gene and targeted region within the gene,sequences obtained from the 454 pyrosequencing run were clusteredinto operational taxonomic units (OTUs) defined at 97% sequencesimilarity. This was particularly done to facilitate the downstream pro-cessing of all data obtained. Additionally, in previous studies the samesequence identity level was considered a reliable threshold to discrimi-nate possible AMF species based on SSU or LSU sequences (Lumini et al.,2010). However, it should be noted that species-level OTU cut-offs ap-plied to different regions are probably better inferred from the analysisof sequence variability within the targeted region (see also further;Fig. 2). Clustering was performed with the Uparse algorithm, followingthe recommended pipeline (Edgar, 2013). Quality filtering of the readswas donewith the ‘fastq-filter’ command allowing amaximumexpectederror of 0.5 for individual sequences. In order to maximize the numberand length of retained sequences from the shorter amplicons, truncationlength was set to 220, 250 and 210 bp for AMV4.5NF–AMDGR, FLR3–LSUmBr and Glo454–NDL22, respectively. For NS31–AM1, AML1–AML2and NS31–AML2 obtained reads were truncated at 200 bp to be able tocompare them to the shorter amplicons and at 400 bp for the analysisof the overlapping fragment (see later). Global singletons, i.e. OTUs rep-resented by only a single sequence in the entire dataset, were removedprior to clustering as this improves the accuracy of diversity estimates(Waud et al., 2014), as were chimeric sequences. OTUs were identifiedby querying the representative sequences (selected by Uparse) againstGenBank using the BLAST algorithm (Altschul et al., 1990). Taxonomicassignments were considered reliable when a ≥200 BLAST score valuewas found (Lumini et al., 2010). Sequences with BLAST scores lowerthan 200 were classified as ‘unknown’. Obtained identities wereused to determine the distribution of the obtained sequences over themajor five fungal phyla (Glomeromycota, Ascomycota, Basidiomycota,Zygomycota and Chytridiomycota) allowing to assess the primer pair'sselectivity towards Glomeromycota.
96 M. Van Geel et al. / Journal of Microbiological Methods 106 (2014) 93–100
As the primer pairs NS31–AM1, FLR3–LSUmBr and Glo454–NDL22yielded a low number of AMF sequences, these primer pairs werediscarded from further analysis. In order to make a fair ‘like for like’comparison of the remaining three primer pairs further evaluationwas based on (i) the same samples, (ii) the same target region and(iii) the same amount of AMF sequences per sample (N350 sequencesper sample). Hence, the analysis was restricted to 8 out of the 16 sam-ples studied (Hu1, Bi1, Ca2, Ca3, Lo1, Lo2, Lo3, Wi1), as these were theonly samples resulting in sufficient AMF sequences for all three primerpairs. Sequences obtained with the AMV4.5NF–AMDGR primer pairwere trimmed to 220 bp and sequences originating from the AML1–AML2 and NS31–AML2 primer pairs were trimmed to 400 bp, resultingin an overlapping fragment of c. 190 bp between the reads obtainedfrom the different primer pairs (Fig. 1). The resulting overlappingsequences were clustered in OTUs defined at 97% sequence similarityas described above. Representative sequences from each OTU were de-posited in GenBank under the accession numbers KF776958–KF776996.Finally, samples were rarified to 350 AMF sequences per sample toperform further statistical analyses, resulting in a total of 5600 AMFsequences for each primer pair (8 samples; 2 replicates; 350 AMF se-quences per sample). First, in order to assess primer pair reproducibility,pairwise Bray–Curtis, Jaccard en Sorensendissimilarity indiceswere cal-culated in R (Vegan package, Oksanen et al., 2013) for the two technicalreplicates and compared using an Analysis of Variance (ANOVA)model.Next, in order to compare the AMF communities obtained with thesethree primer pairs, non-metrical multidimensional scaling (NMDS)using Bray–Curtis distances was performed in R (Vegan package,Oksanen et al., 2013). Additionally, the number of shared OTUs betweenthe different primer pairswas calculated inMothur (Schloss et al., 2009)using the ‘Venn’ command. Further, OTU richness (i.e. the number ofOTUs) and evenness (calculated in EstimateS, Colwell, 2006) per samplewas compared for the different primer pairs using linear mixedmodels.‘Sample’ was included as a random factor to account for between-sample variation. To accurately identify the obtained AMF OTUs, therepresentative sequence for each OTU was queried against the Krügeret al. (2012) database using the BLAST algorithm. This curated databasewas used as public databases such as GenBank may contain sequencesof incorrectly identified AMF isolates (Schüssler et al., 2003;Bidartondo, 2008). In contrast, the Krüger et al. (2012) database con-tains high-quality sequences, obtained from well characterized isolatesaccording to the taxonomy of Schüßler and Walker (2010). To assessbias towards certain AMF families, the relative abundance of eachGlomeromycota family per samplewas compared between the differentprimer pairs using linearmixedmodels. Again, ‘Sample’was included asa random factor to account for between-sample variation. All statisticalanalyses were performed in SPSS 20.0 (SPSS Inc., Chicago, IL).
0
0.1
0.2
0.3
0.4
0.5
300 500 700 900 1100 1300 1500
Pi
Alignment positionNS31 AMV4.5NF
AMDGR AM1 AML2
AML1
Pi
a b
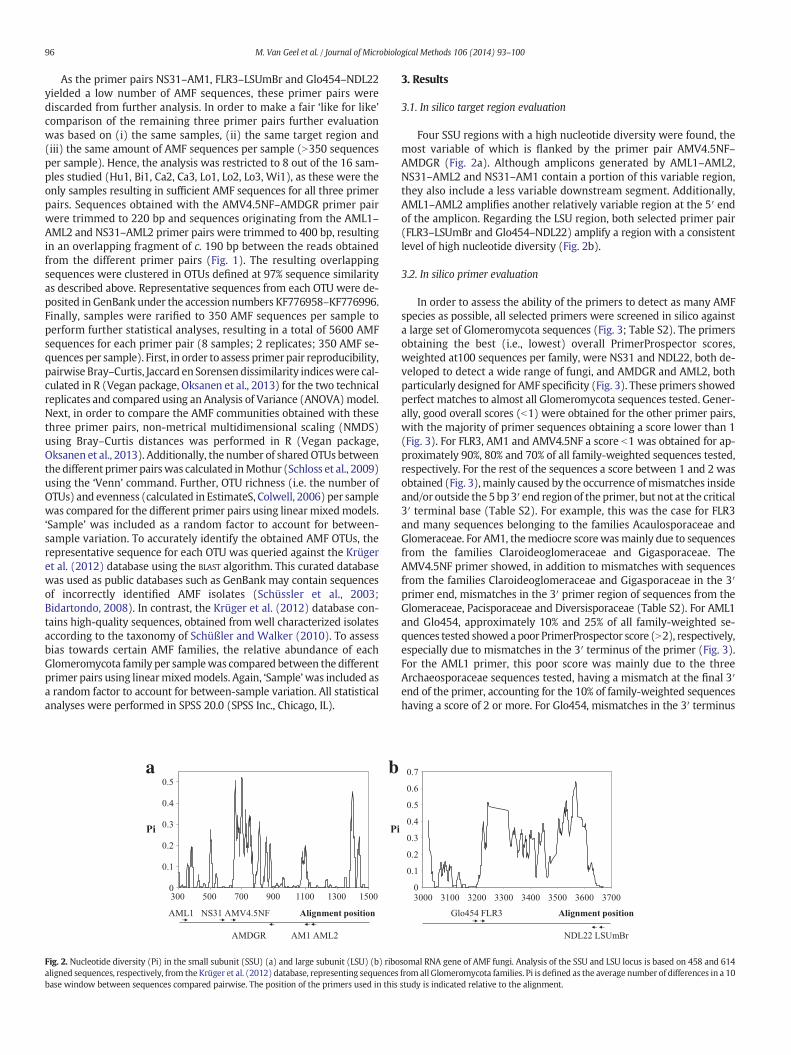
Fig. 2. Nucleotide diversity (Pi) in the small subunit (SSU) (a) and large subunit (LSU) (b) riboaligned sequences, respectively, from the Krüger et al. (2012) database, representing sequencesbase window between sequences compared pairwise. The position of the primers used in this
3. Results
3.1. In silico target region evaluation
Four SSU regions with a high nucleotide diversity were found, themost variable of which is flanked by the primer pair AMV4.5NF–AMDGR (Fig. 2a). Although amplicons generated by AML1–AML2,NS31–AML2 and NS31–AM1 contain a portion of this variable region,they also include a less variable downstream segment. Additionally,AML1–AML2 amplifies another relatively variable region at the 5′ endof the amplicon. Regarding the LSU region, both selected primer pair(FLR3–LSUmBr and Glo454–NDL22) amplify a region with a consistentlevel of high nucleotide diversity (Fig. 2b).
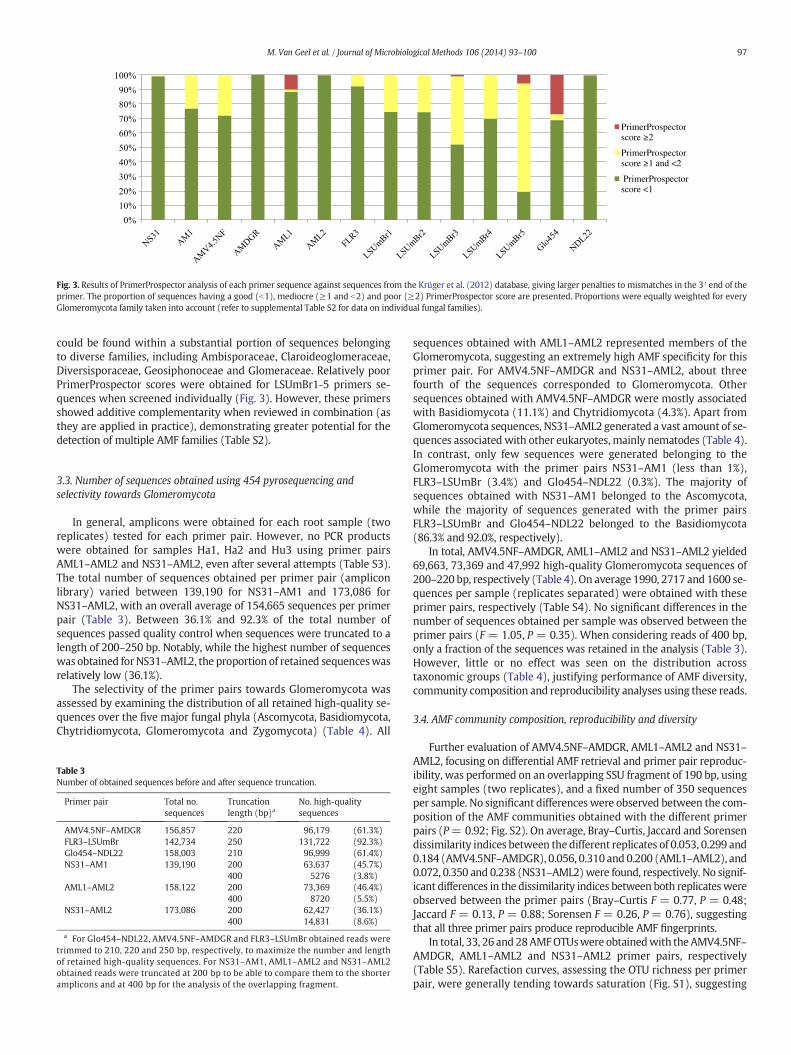
3.2. In silico primer evaluation
In order to assess the ability of the primers to detect as many AMFspecies as possible, all selected primers were screened in silico againsta large set of Glomeromycota sequences (Fig. 3; Table S2). The primersobtaining the best (i.e., lowest) overall PrimerProspector scores,weighted at100 sequences per family, were NS31 and NDL22, both de-veloped to detect a wide range of fungi, and AMDGR and AML2, bothparticularly designed for AMF specificity (Fig. 3). These primers showedperfect matches to almost all Glomeromycota sequences tested. Gener-ally, good overall scores (b1) were obtained for the other primer pairs,with the majority of primer sequences obtaining a score lower than 1(Fig. 3). For FLR3, AM1 and AMV4.5NF a score b1 was obtained for ap-proximately 90%, 80% and 70% of all family-weighted sequences tested,respectively. For the rest of the sequences a score between 1 and 2 wasobtained (Fig. 3),mainly caused by the occurrence ofmismatches insideand/or outside the 5 bp3′ end region of the primer, but not at the critical3′ terminal base (Table S2). For example, this was the case for FLR3and many sequences belonging to the families Acaulosporaceae andGlomeraceae. For AM1, themediocre scorewasmainly due to sequencesfrom the families Claroideoglomeraceae and Gigasporaceae. TheAMV4.5NF primer showed, in addition to mismatches with sequencesfrom the families Claroideoglomeraceae and Gigasporaceae in the 3′primer end, mismatches in the 3′ primer region of sequences from theGlomeraceae, Pacisporaceae and Diversisporaceae (Table S2). For AML1and Glo454, approximately 10% and 25% of all family-weighted se-quences tested showed apoor PrimerProspector score (N2), respectively,especially due to mismatches in the 3′ terminus of the primer (Fig. 3).For the AML1 primer, this poor score was mainly due to the threeArchaeosporaceae sequences tested, having a mismatch at the final 3′end of the primer, accounting for the 10% of family-weighted sequenceshaving a score of 2 or more. For Glo454, mismatches in the 3′ terminus
0
0.1
0.2
0.3
0.4
0.5
0.6
0.7
3000 3100 3200 3300 3400 3500 3600 3700
Alignment positionGlo454 FLR3
NDL22 LSUmBr
somal RNA gene of AMF fungi. Analysis of the SSU and LSU locus is based on 458 and 614from all Glomeromycota families. Pi is defined as the average number of differences in a 10study is indicated relative to the alignment.
0%
10%
20%
30%
40%
50%
60%
70%
80%
90%
100%
PrimerProspectorscore ≥2
PrimerProspectorscore ≥1 and <2
PrimerProspectorscore <1
Fig. 3. Results of PrimerProspector analysis of each primer sequence against sequences from the Krüger et al. (2012) database, giving larger penalties to mismatches in the 3′ end of theprimer. The proportion of sequences having a good (b1), mediocre (≥1 and b2) and poor (≥2) PrimerProspector score are presented. Proportions were equally weighted for everyGlomeromycota family taken into account (refer to supplemental Table S2 for data on individual fungal families).
97M. Van Geel et al. / Journal of Microbiological Methods 106 (2014) 93–100
could be found within a substantial portion of sequences belongingto diverse families, including Ambisporaceae, Claroideoglomeraceae,Diversisporaceae, Geosiphonoceae and Glomeraceae. Relatively poorPrimerProspector scores were obtained for LSUmBr1-5 primers se-quences when screened individually (Fig. 3). However, these primersshowed additive complementarity when reviewed in combination (asthey are applied in practice), demonstrating greater potential for thedetection of multiple AMF families (Table S2).
3.3. Number of sequences obtained using 454 pyrosequencing andselectivity towards Glomeromycota
In general, amplicons were obtained for each root sample (tworeplicates) tested for each primer pair. However, no PCR productswere obtained for samples Ha1, Ha2 and Hu3 using primer pairsAML1–AML2 and NS31–AML2, even after several attempts (Table S3).The total number of sequences obtained per primer pair (ampliconlibrary) varied between 139,190 for NS31–AM1 and 173,086 forNS31–AML2, with an overall average of 154,665 sequences per primerpair (Table 3). Between 36.1% and 92.3% of the total number ofsequences passed quality control when sequences were truncated to alength of 200–250 bp. Notably, while the highest number of sequenceswas obtained forNS31–AML2, the proportion of retained sequenceswasrelatively low (36.1%).
The selectivity of the primer pairs towards Glomeromycota wasassessed by examining the distribution of all retained high-quality se-quences over the five major fungal phyla (Ascomycota, Basidiomycota,Chytridiomycota, Glomeromycota and Zygomycota) (Table 4). All
Table 3Number of obtained sequences before and after sequence truncation.
Primer pair Total no.sequences
Truncationlength (bp)a
No. high-qualitysequences
AMV4.5NF–AMDGR 156,857 220 96,179 (61.3%)FLR3–LSUmBr 142,734 250 131,722 (92.3%)Glo454–NDL22 158,003 210 96,999 (61.4%)NS31–AM1 139,190 200 63,637 (45.7%)
400 5276 (3.8%)AML1–AML2 158,122 200 73,369 (46.4%)
400 8720 (5.5%)NS31–AML2 173,086 200 62,427 (36.1%)
400 14,831 (8.6%)
a For Glo454–NDL22, AMV4.5NF–AMDGR and FLR3–LSUmBr obtained reads weretrimmed to 210, 220 and 250 bp, respectively, to maximize the number and lengthof retained high-quality sequences. For NS31–AM1, AML1–AML2 and NS31–AML2obtained reads were truncated at 200 bp to be able to compare them to the shorteramplicons and at 400 bp for the analysis of the overlapping fragment.
sequences obtained with AML1–AML2 represented members of theGlomeromycota, suggesting an extremely high AMF specificity for thisprimer pair. For AMV4.5NF–AMDGR and NS31–AML2, about threefourth of the sequences corresponded to Glomeromycota. Othersequences obtained with AMV4.5NF–AMDGR were mostly associatedwith Basidiomycota (11.1%) and Chytridiomycota (4.3%). Apart fromGlomeromycota sequences, NS31–AML2 generated a vast amount of se-quences associated with other eukaryotes, mainly nematodes (Table 4).In contrast, only few sequences were generated belonging to theGlomeromycota with the primer pairs NS31–AM1 (less than 1%),FLR3–LSUmBr (3.4%) and Glo454–NDL22 (0.3%). The majority ofsequences obtained with NS31–AM1 belonged to the Ascomycota,while the majority of sequences generated with the primer pairsFLR3–LSUmBr and Glo454–NDL22 belonged to the Basidiomycota(86.3% and 92.0%, respectively).
In total, AMV4.5NF–AMDGR, AML1–AML2 and NS31–AML2 yielded69,663, 73,369 and 47,992 high-quality Glomeromycota sequences of200–220 bp, respectively (Table 4). On average 1990, 2717 and 1600 se-quences per sample (replicates separated) were obtained with theseprimer pairs, respectively (Table S4). No significant differences in thenumber of sequences obtained per sample was observed between theprimer pairs (F = 1.05, P = 0.35). When considering reads of 400 bp,only a fraction of the sequences was retained in the analysis (Table 3).However, little or no effect was seen on the distribution acrosstaxonomic groups (Table 4), justifying performance of AMF diversity,community composition and reproducibility analyses using these reads.
3.4. AMF community composition, reproducibility and diversity
Further evaluation of AMV4.5NF–AMDGR, AML1–AML2 and NS31–AML2, focusing on differential AMF retrieval and primer pair reproduc-ibility, was performed on an overlapping SSU fragment of 190 bp, usingeight samples (two replicates), and a fixed number of 350 sequencesper sample. No significant differences were observed between the com-position of the AMF communities obtained with the different primerpairs (P= 0.92; Fig. S2). On average, Bray–Curtis, Jaccard and Sorensendissimilarity indices between the different replicates of 0.053, 0.299 and0.184 (AMV4.5NF–AMDGR), 0.056, 0.310 and 0.200 (AML1–AML2), and0.072, 0.350 and 0.238 (NS31–AML2)were found, respectively. No signif-icant differences in the dissimilarity indices between both replicateswereobserved between the primer pairs (Bray–Curtis F = 0.77, P = 0.48;Jaccard F = 0.13, P = 0.88; Sorensen F = 0.26, P = 0.76), suggestingthat all three primer pairs produce reproducible AMF fingerprints.
In total, 33, 26 and 28AMFOTUswere obtainedwith the AMV4.5NF–AMDGR, AML1–AML2 and NS31–AML2 primer pairs, respectively(Table S5). Rarefaction curves, assessing the OTU richness per primerpair, were generally tending towards saturation (Fig. S1), suggesting

Table 4Distribution of retained high-quality sequences over the five major fungal phyla, as obtained with the six different primer pairs evaluated in this study.
AMV4.5NF-
NS31–AM1 NS31–AM1 AMDGR AML1–AML2 AML1–AML2 NS31–AML2 NS31–AML2 FLR3–LSUmBr Glo454–NDL22
(200 bp) (400 bp) (220 bp) (200 bp) (400 bp) (200 bp) (400 bp) (250 bp) (210 bp)
Phylum No. % No. % No. % No. % No. % No. % No. % No. % No. %Glomeromycota 602 0.95 29 0.55 69663 72.43 73369 100.00 8720 100.00 47992 76.88 12462 84.03 4423 3.36 324 0.33Ascomycota 45220 71.06 2951 55.93 55 0.06 0 0.00 0 0.00 67 0.11 0 0.00 2580 1.96 2306 2.38Basidiomycota 28 0.04 0 0.00 10712 11.14 0 0.00 0 0.00 0 0.00 0 0.00 113662 86.29 89197 91.96Zygomycota 14 0.02 0 0.00 442 0.46 0 0.00 0 0.00 0 0.00 0 0.00 0 0.00 0 0.00Chytridiomycota 14 0.02 0 0.00 4176 4.34 0 0.00 0 0.00 0 0.00 0 0.00 0 0.00 0 0.00Other Eukaryotes 3150 4.95 308 5.84 1329 1.38 0 0.00 0 0.00 9466 15.16 1795 12.10 0 0.00 0 0.00Unknown 14609 22.96 1988 37.68 9802 10.19 0 0.00 0 0.00 4902 7.85 574 3.87 11057 8.39 5172 5.33Total 63637 5276 96179 73369 8720 62427 14831 131722 96999
6
7
8
9
10
Num
ber
of O
TU
s
ab
a a
b
a
b b
98 M. Van Geel et al. / Journal of Microbiological Methods 106 (2014) 93–100
that our sequencing depthwas sufficient to accurately detect themajor-ity of AMF. Twenty OTUs were shared between the different primerpairs, while 25 OTUs were shared between AMV4.5NF–AMDGR andNS31–AML2, 21 between AMV4.5NF–AMDGR and AML1–AML2 and23 between AML1–AML2 and NS31–AML2 (Fig. 4). Out of the 33 OTUsobtained with AMV4.5NF–AMDGR, 7 OTUs (5 Glomeraceae and 2Claroideoglomeraceae OTUs) were unique to this primer pair, while 2(1 Glomeraceae and 1 Diversisporaceae OTU) out of 26 OTUs wereunique to the AML1–AML2 primer pair (Fig. 4). The obtained numberof OTUs was not significantly different between the three primer pairs(F = 0.26, P = 0.73) (Fig. 5). However, when results from differentprimer pairs (also rarified to 350 AMF sequences per sample) werecombined, the combination of AMV4.5NF–AMDGR and AML1–AML2and the combination of AMV4.5NF–AMDGR and NS31–AML2 did resultin a higher number of OTUs per sample, whereas the combinationof AML1–AML2 and NS31–AML2 did not (Fig. 5). The combination ofall three primer pairs, did not result in significantly more OTUs thanobserved for AMV4.5NF–AMDGR + AML1–AML2 and AMV4.5NF–AMDGR+ NS31–AML2 (Fig. 5). The evenness of the AMF communitiesobtained with AMV4.5NF–AMDGR was found to be significantly lowerthan the evenness of the other (combinations of) primer pairs (F =5.36, P b 0.001) (Fig. 5), suggesting that this primer pair displayedpreferential amplification of certain AMF lineages.
In order to assess potential bias towards specific AMF families, therelative abundance of the different AMF families was comparedbetween the different primer pairs (Table 5). In general, the majority
20
AMV4.5NF-
AMDGR
AML1-AML2NS31-AML2
1
7
20
3
5
Fig. 4. Venn diagram showing the number of shared and unique OTUs between theAMV4.5NF–AMDGR, AML1–AML2 and NS31–AML2 primer pairs based on 8 samples(two replicates), a 190 bp overlapping SSU rRNA gene fragment and 350 AMF sequencesper sample.
of the AMF sequences belonged to the Claroideoglomeraceae(39.93–44.04%), Gigasporaceae (12.34–12.43%) and Glomeraceae(34.95–47.39%), whereas the Ambisporaceae, Diversisporaceae andParaglomeraceae together accounted for less than 11% of the se-quences. The AMV4.5NF–AMDGR primer pair yielded significantlymore Glomeraceae sequences in comparison with the other primerpairs. This was also the case for the AMV4.5NF–AMDGR + AML1–AML2 and AMV4.5NF–AMDGR + NS31–AML2 primer pair combina-tions. Ambisporaceae were not detected using AMV4.5NF–AMDGR,while the other primer pairs generated at least a few Ambisporaceaesequences. Additionally, significantly fewer sequences originatingfrom the families Claroideoglomeraceae, Diversisporaceae andParaglomeraceae were obtained with AMV4.5NF–AMDGR. Particu-larly for the Paraglomeraceae, a large difference was found between
0.4
0.45
0.5
0.55
0.6
Eve
ness
a
b
b
b
b
b
b
Fig. 5.OTU richness and evenness of the AMF communities obtainedwith the primer pairsAMV4.5NF–AMDGR, AML1–AML2 and NS31–AML2 based on 8 samples (two replicates),an 190 bp overlapping SSU rRNA gene fragment and 350 AMF sequences per sample.Additionally, number ofOTUs and evenness are also shown for combinations of the primerpairs (also rarified to 350 AMF sequences per sample). Different letters represent signifi-cant differences at P = 0.05 and error bars indicate standard errors.
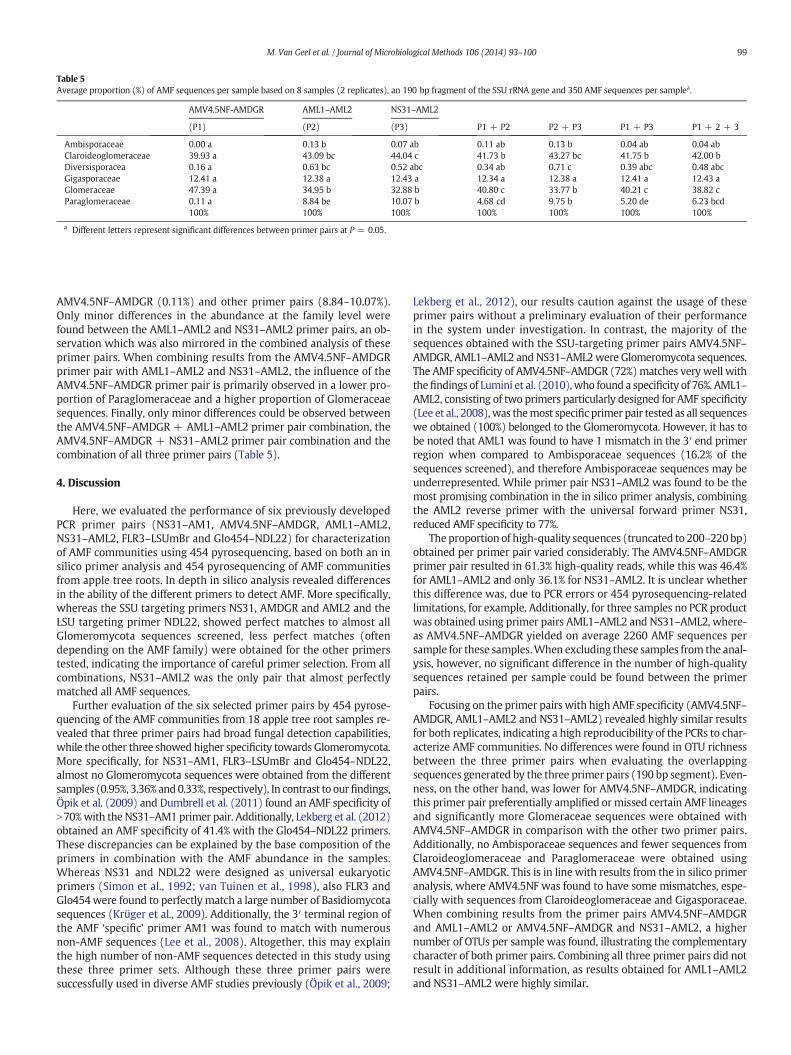
Table 5Average proportion (%) of AMF sequences per sample based on 8 samples (2 replicates), an 190 bp fragment of the SSU rRNA gene and 350 AMF sequences per samplea.
AMV4.5NF-AMDGR AML1–AML2 NS31–AML2
(P1) (P2) (P3) P1 + P2 P2 + P3 P1 + P3 P1 + 2 + 3
Ambisporaceae 0.00 a 0.13 b 0.07 ab 0.11 ab 0.13 b 0.04 ab 0.04 abClaroideoglomeraceae 39.93 a 43.09 bc 44.04 c 41.73 b 43.27 bc 41.75 b 42.00 bDiversisporacea 0.16 a 0.63 bc 0.52 abc 0.34 ab 0.71 c 0.39 abc 0.48 abcGigasporaceae 12.41 a 12.38 a 12.43 a 12.34 a 12.38 a 12.41 a 12.43 aGlomeraceae 47.39 a 34.95 b 32.88 b 40.80 c 33.77 b 40.21 c 38.82 cParaglomeraceae 0.11 a 8.84 be 10.07 b 4.68 cd 9.75 b 5.20 de 6.23 bcd
100% 100% 100% 100% 100% 100% 100%
a Different letters represent significant differences between primer pairs at P = 0.05.
99M. Van Geel et al. / Journal of Microbiological Methods 106 (2014) 93–100
AMV4.5NF–AMDGR (0.11%) and other primer pairs (8.84–10.07%).Only minor differences in the abundance at the family level werefound between the AML1–AML2 and NS31–AML2 primer pairs, an ob-servation which was also mirrored in the combined analysis of theseprimer pairs. When combining results from the AMV4.5NF–AMDGRprimer pair with AML1–AML2 and NS31–AML2, the influence of theAMV4.5NF–AMDGR primer pair is primarily observed in a lower pro-portion of Paraglomeraceae and a higher proportion of Glomeraceaesequences. Finally, only minor differences could be observed betweenthe AMV4.5NF–AMDGR + AML1–AML2 primer pair combination, theAMV4.5NF–AMDGR + NS31–AML2 primer pair combination and thecombination of all three primer pairs (Table 5).
4. Discussion
Here, we evaluated the performance of six previously developedPCR primer pairs (NS31–AM1, AMV4.5NF–AMDGR, AML1–AML2,NS31–AML2, FLR3–LSUmBr and Glo454–NDL22) for characterizationof AMF communities using 454 pyrosequencing, based on both an insilico primer analysis and 454 pyrosequencing of AMF communitiesfrom apple tree roots. In depth in silico analysis revealed differencesin the ability of the different primers to detect AMF. More specifically,whereas the SSU targeting primers NS31, AMDGR and AML2 and theLSU targeting primer NDL22, showed perfect matches to almost allGlomeromycota sequences screened, less perfect matches (oftendepending on the AMF family) were obtained for the other primerstested, indicating the importance of careful primer selection. From allcombinations, NS31–AML2 was the only pair that almost perfectlymatched all AMF sequences.
Further evaluation of the six selected primer pairs by 454 pyrose-quencing of the AMF communities from 18 apple tree root samples re-vealed that three primer pairs had broad fungal detection capabilities,while the other three showed higher specificity towards Glomeromycota.More specifically, for NS31–AM1, FLR3–LSUmBr and Glo454–NDL22,almost no Glomeromycota sequences were obtained from the differentsamples (0.95%, 3.36% and 0.33%, respectively). In contrast to ourfindings,Öpik et al. (2009) and Dumbrell et al. (2011) found an AMF specificity ofN70%with the NS31–AM1 primer pair. Additionally, Lekberg et al. (2012)obtained an AMF specificity of 41.4% with the Glo454–NDL22 primers.These discrepancies can be explained by the base composition of theprimers in combination with the AMF abundance in the samples.Whereas NS31 and NDL22 were designed as universal eukaryoticprimers (Simon et al., 1992; van Tuinen et al., 1998), also FLR3 andGlo454were found to perfectly match a large number of Basidiomycotasequences (Krüger et al., 2009). Additionally, the 3′ terminal region ofthe AMF ‘specific’ primer AM1 was found to match with numerousnon-AMF sequences (Lee et al., 2008). Altogether, this may explainthe high number of non-AMF sequences detected in this study usingthese three primer sets. Although these three primer pairs weresuccessfully used in diverse AMF studies previously (Öpik et al., 2009;
Lekberg et al., 2012), our results caution against the usage of theseprimer pairs without a preliminary evaluation of their performancein the system under investigation. In contrast, the majority of thesequences obtained with the SSU-targeting primer pairs AMV4.5NF–AMDGR, AML1–AML2 and NS31–AML2were Glomeromycota sequences.The AMF specificity of AMV4.5NF–AMDGR (72%)matches very well withthefindings of Lumini et al. (2010),who found a specificity of 76%. AML1–AML2, consisting of two primers particularly designed for AMF specificity(Lee et al., 2008),was themost specific primer pair tested as all sequenceswe obtained (100%) belonged to the Glomeromycota. However, it has tobe noted that AML1 was found to have 1 mismatch in the 3′ end primerregion when compared to Ambisporaceae sequences (16.2% of thesequences screened), and therefore Ambisporaceae sequences may beunderrepresented. While primer pair NS31–AML2 was found to be themost promising combination in the in silico primer analysis, combiningthe AML2 reverse primer with the universal forward primer NS31,reduced AMF specificity to 77%.
The proportion of high-quality sequences (truncated to 200–220 bp)obtained per primer pair varied considerably. The AMV4.5NF–AMDGRprimer pair resulted in 61.3% high-quality reads, while this was 46.4%for AML1–AML2 and only 36.1% for NS31–AML2. It is unclear whetherthis difference was, due to PCR errors or 454 pyrosequencing-relatedlimitations, for example. Additionally, for three samples no PCR productwas obtained using primer pairs AML1–AML2 and NS31–AML2, where-as AMV4.5NF–AMDGR yielded on average 2260 AMF sequences persample for these samples.When excluding these samples from the anal-ysis, however, no significant difference in the number of high-qualitysequences retained per sample could be found between the primerpairs.
Focusing on the primer pairs with high AMF specificity (AMV4.5NF–AMDGR, AML1–AML2 and NS31–AML2) revealed highly similar resultsfor both replicates, indicating a high reproducibility of the PCRs to char-acterize AMF communities. No differences were found in OTU richnessbetween the three primer pairs when evaluating the overlappingsequences generated by the three primer pairs (190 bp segment). Even-ness, on the other hand, was lower for AMV4.5NF–AMDGR, indicatingthis primer pair preferentially amplified or missed certain AMF lineagesand significantly more Glomeraceae sequences were obtained withAMV4.5NF–AMDGR in comparison with the other two primer pairs.Additionally, no Ambisporaceae sequences and fewer sequences fromClaroideoglomeraceae and Paraglomeraceae were obtained usingAMV4.5NF–AMDGR. This is in line with results from the in silico primeranalysis, where AMV4.5NF was found to have some mismatches, espe-cially with sequences from Claroideoglomeraceae and Gigasporaceae.When combining results from the primer pairs AMV4.5NF–AMDGRand AML1–AML2 or AMV4.5NF–AMDGR and NS31–AML2, a highernumber of OTUs per sample was found, illustrating the complementarycharacter of both primer pairs. Combining all three primer pairs did notresult in additional information, as results obtained for AML1–AML2and NS31–AML2 were highly similar.

100 M. Van Geel et al. / Journal of Microbiological Methods 106 (2014) 93–100
To conclude, we have shown that 454 pyrosequencing is a powerfulapproach to characterize AMF communities, but that different primerpairs may lead to different results, illustrating that comparison of stud-ies using different primer pairs is difficult. Our results indicate that theAMV4.5NF–AMDGR, AML1–AML2 and NS31–AML2 primer pairs arepowerful primer pairs for the characterization of AMF communities.They have fewmismatches to AMF sequences, a high selectivity towardsGlomeromycota, and are able to consistently describe AMF communi-ties. However, our results also suggest that Glomeraceae sequencesare favored with the AMV4.5NF–AMDGR primer pair at the expenseof Ambisporaceae, Claroideoglomeraceae and Paraglomeraceae se-quences. Additionally, our results indicate that a combination ofAMV4.5NF–AMDGR and AML1–AML2 or AMV4.5NF–AMDGR andNS31–AML2 may present a powerful complementary combination fortandem use when studying AMF communities.
Author contributions
MVG designed and performed experiments, analyzed data andwrote the manuscript. BL and OH designed experiments, analyzeddata, and wrote the manuscript. PB assisted with data analysis. Allauthors helped edit the manuscript.
Acknowledgments
This study was funded by an IWT (Institute for the Promotion ofInnovation by Science and Technology in Flanders) agricultural project(IWT-LA 110775).Wewould like to thank An Ceustermans for the sam-pling andMichael Waud for the assistance in the laboratory and editingthe text.
Appendix A. Supplementary data
Supplementary data to this article can be found online at http://dx.doi.org/10.1016/j.mimet.2014.08.006.
References
Altschul, S.F., Gish, W., Miller, W., Myers, E.W., Lipman, D.J., 1990. Basic local alignmentsearch tool. J. Mol. Biol. 215, 403–410.
Bidartondo, M., 2008. Preserving accuracy in GenBank. Science (New York, N.Y.) 319,1616.
Colwell, G.C., 2006. Estimates: Statistical Estimation of Species Richness and SharedSpecies From Samples, Version 9. viceroy.eeb.uconn.edu/estimates/ed.
Daniell, T., Husband, R., Fitter, A., Young, J., 2001. Molecular diversity of arbuscularmycorrhizal fungi colonising arable crops. FEMS Microbiol. Ecol. 36, 203–209.
Davison, J., Öpik, M., Zobel, M., Vasar, M., Metsis, M., Moora, M., 2012. Communities ofarbuscular mycorrhizal fungi detected in forest soil are spatially heterogeneous butdo not vary throughout the growing season. PloS One 7, e41938.
De Beenhouwer, M., Muleta, D., Peeters, B., Van Geel, M., Lievens, B., Honnay, O., 2014.DNA pyrosequencing evidence for large diversity differences between natural andmanaged coffee mycorrhizal fungal communities. Agron. Sustain. Dev. http://dx.doi.org/10.1007/s13593-014-0231-8.
Dumbrell, A., Ashton, P., Aziz, N., Feng, G., Nelson, M., Dytham, C., Fitter, A., Helgason, T.,2011. Distinct seasonal assemblages of arbuscular mycorrhizal fungi revealed bymassively parallel pyrosequencing. New Phytol. 190, 794–804.
Edgar, R., 2013. UPARSE: highly accurate OTU sequences from microbial amplicon reads.Nat. Methods 10, 996–998.
Gorzelak, M., Holland, T., Xing, X., Hart, M., 2012. Molecular approaches for AM fungalcommunity ecology: a primer. J. Microbiol. Methods 90, 108–114.
Helgason, T., Daniell, T.J., Husband, R., Fitter, A.H., Young, J.P., 1998. Ploughing up thewood-wide web? Nature 394, 431.
Kohout, P., Sudová, R., Janoušková,M., Čtvrtlíková,M., Hejda,M., Pánková, H., Slavíková, R.,Štajerová, K., Vosátka, M., Sýkorová, Z., 2014. Comparison of commonly used primersets for evaluating arbuscular mycorrhizal fungal communities: is there a universalsolution? Soil Biol. Biochem. 68.
Krüger, M., Stockinger, H., Krüger, C., Schüssler, A., 2009. DNA-based species leveldetection of Glomeromycota: one PCR primer set for all arbuscular mycorrhizalfungi. New Phytol. 183, 212–223.
Krüger, M., Krüger, C., Walker, C., Stockinger, H., Schussler, A., 2012. Phylogeneticreference data for systematics and phylotaxonomy of arbuscular mycorrhizal fungifrom phylum to species level. New Phytol. 193, 970–984.
Lee, J., Lee, S., Young, J., 2008. Improved PCR primers for the detection and identification ofarbuscular mycorrhizal fungi. FEMS Microbiol. Ecol. 65, 339–349.
Lefever, S., Pattyn, F., Hellemans, J., Vandesompele, J., 2013. Single-nucleotide polymor-phisms and other mismatches reduce performance of quantitative PCR assays. Clin.Chem. 59, 1470–1480.
Lekberg, Y., Schnoor, T., Kjøller, R., Gibbons, S.M., Hansen, L.H., Al-Soud, W.A., Sørensen, S.J.,Rosendahl, S., 2012. 454-Sequencing reveals stochastic local reassembly and highdisturbance tolerance within arbuscular mycorrhizal fungal communities. J. Ecol.100, 1–10.
Lumini, E., Orgiazzi, A., Borriello, R., Bonfante, P., Bianciotto, V., 2010. Disclosing arbuscularmycorrhizal fungal biodiversity in soil through a land-use gradient using a pyrose-quencing approach. Environ. Microbiol. 12, 2165–2179.
Margulies, M., Egholm,M., Altman,W., Attiya, S., Bader, J., Bemben, L., Berka, J., Braverman,M., Chen, Y.-J., Chen, Z., 2005. Genome sequencing in microfabricated high-densitypicolitre reactors. Nature 437, 376–380.
Nei, M., 1987. Molecular Evolutionary Genetics. Columbia University Press, New York.Oksanen, J., Blanchet, G., Kindt, R., Legendre, P., Minchin, P., Simpson, G., Solymos, P.,
Stevens, M.H.W., 2013. Vegan: Community Ecology Package. R Package Version 2.0–10.
Öpik, M., Metsis, M., Daniell, T.J., Zobel, M., Moora, M., 2009. Large-scale parallel 454sequencing reveals host ecological group specificity of arbuscular mycorrhizal fungiin a boreonemoral forest. New Phytol. 184, 424–437.
Öpik, M., Zobel, M., Cantero, J., Davison, J., Facelli, J., Hiiesalu, I., Jairus, T., Kalwij, J., Koorem,K., Leal, M., Liira, J., Metsis, M., Neshataeva, V., Paal, J., Phosri, C., Põlme, S., Reier, U.,Saks, U., Schimann, H., Thiéry, O., Vasar, M., Moora, M., 2013. Global sampling ofplant roots expands the described molecular diversity of arbuscular mycorrhizalfungi. Mycorrhiza 23, 411–430.
Purin, S., Filho, O.K., Stürmer, S.L., 2006. Mycorrhizae activity and diversity in conventionaland organic apple orchards from Brazil. Soil Biol. Biochem. 38, 1831–1839.
Redecker, D., Schüssler, A., Stockinger, H., Stürmer, S.L., Morton, J.B., Walker, C., 2013. Anevidence-based consensus for the classification of arbuscular mycorrhizal fungi(Glomeromycota). Mycorrhiza 23, 515–531.
Rillig, M., Mummey, D., 2006. Mycorrhizas and soil structure. New Phytol. 171, 41–53.Sato, K., Suyama, Y., Saito, M., Sugawara, K., 2005. A new primer for discrimination of
arbuscular mycorrhizal fungi with polymerase chain reaction-denature gradient gelelectrophoresis. Grassl. Sci. 51, 179–181.
Schloss, P.D., Westcott, S.L., Ryabin, T., Hall, J.R., Hartmann, M., Hollister, E.B., Lesniewski, R.A.,Oakley, B.B., Parks, D.H., Robinson, C.J., Sahl, J.W., Stres, B., Thallinger, G.G., Van Horn,D.J., Weber, C.F., 2009. Introducing mothur: open-source, platform-independent,community-supported software for describing and comparing microbial communi-ties. Appl. Environ. Microbiol. 75, 7537–7541.
Schoch, C., Seifert, K., Huhndorf, S., Robert, V., Spouge, J., Levesque, C., Chen, W., FungalBarcoding, C., Fungal Barcoding Consortium Author, L., 2012. Nuclear ribosomalinternal transcribed spacer (ITS) region as a universal DNA barcode marker forFungi. Proc. Natl. Acad. Sci. U. S. A. 109, 6241–6246.
Schüßler, A., Walker, C., 2010. The Glomeromycota. A species list with new families andnew genera. Published in libraries at The Royal Botanic Garden Edinburgh, TheRoyal Botanic Garden Kew, Botanische Staatssammlung Munich, and Oregon StateUniversity.
Schüssler, A., Schwarzott, D., Walker, C., 2003. Glomeromycota rRNA genes—the diversityof myths? Mycorrhiza 13, 233–236.
Schüβler, A., Schwarzott, D., Walker, C., 2001. A new fungal phylum, the Glomeromycota:phylogeny and evolution. Mycol. Res. 105, 1413–1421.
Simon, L., Lalonde, M., Bruns, T.D., 1992. Specific amplification of 18S fungal ribosomalgenes from vesicular–arbuscular endomycorrhizal fungi colonizing roots. Appl.Environ. Microbiol. 58, 291–295.
Smith, S.E., Read, D.J., 2008. Mycorrhizal symbiosis. Academic Press, Amsterdam, theNetherlands.
Stockinger, H., Krüger, M., Schüssler, A., 2010. DNA barcoding of arbuscular mycorrhizalfungi. New Phytol. 187, 461–474.
van der Heijden, M.G., Bardgett, R.D., van Straalen, N.M., 2008. The unseen majority: soilmicrobes as drivers of plant diversity and productivity in terrestrial ecosystems. Ecol.Lett. 11, 296–310.
van Tuinen, D., Jacquot, E., Zhao, B., Gollotte, A., Gianinazzi-Pearson, V., 1998. Characteriza-tion of root colonization profiles by amicrocosm community of arbuscularmycorrhizalfungi using 25S rDNA-targeted nested PCR. Mol. Ecol. 7, 879–887.
Walters, W.A., Caporaso, J.G., Lauber, C.L., Berg-Lyons, D., Fierer, N., Knight, R., 2011.PrimerProspector: de novo design and taxonomic analysis of barcoded polymerasechain reaction primers. Bioinformatics 27, 1159–1161.
Waud, M., Busschaert, P., Ruyters, S., Jacquemyn, H., Lievens, B., 2014. Impact of primerchoice on characterization of orchid mycorrhizal communities using 454 pyrose-quencing. Mol. Ecol. Resour. 14, 679–699.