Evaluation of real-time PCR assays for detection and quantification of fraudulent addition of bovine...
8
Evaluation of real time PCR assays for the detection and enumeration of enterohemorrhagic Escherichia coli directly from cattle feces Brandon E. Luedtke, James L. Bono, Joseph M. Bosilevac ⁎ U.S. Department of Agriculture 1 , Agricultural Research Service, Roman L. Hruska U.S. Meat Animal Research Center, Clay Center, NE 68933-0166, USA abstract article info Article history: Received 3 June 2014 Received in revised form 11 July 2014 Accepted 14 July 2014 Available online 23 July 2014 Keywords: Enterohemorrhagic E. coli Limit of detection Limit of quantification Multiplex qPCR Non-O157 Shiga toxin-producing E. coli Shiga toxin-producing Escherichia coli are a growing concern in the area of food safety, and the United States De- partment of Agriculture Food Safety and Inspection Service has identified the serotypes O26, O45, O103, O111, O121, O145, and O157 as adulterants in certain types of raw beef. The most relevant to human disease are the enterohemorrhagic E. coli (EHEC) strains that possess intimin (eae), Shiga toxin 1 and/or 2 (stx1–2), and in most cases the conserved pO157 or pO157 like virulence plasmid. Contamination of raw beef with EHEC is likely to occur via the transfer of cattle feces on hides to the carcass. To detect EHEC directly from cattle feces, we eval- uated the utility of a multiplex real time PCR assay that targets the EHEC associated gene target ecf1 in combina- tion with eae and stx1–2. Our assay had an increased sensitivity and provided a reliable limit of detection (LOD) of 1.25 × 10 3 colony-forming units per mL (CFUs/mL) in an EHEC spiked fecal background. In addition, we evaluated the use of a duplex qPCR assay using ecf1 for the enumeration of total EHEC directly from cattle feces. The reliable limit of quantification (LOQ) was determined to be 1.25 × 10 3 CFUs/mL. Our assay requires minimal sample pro- cessing and provides LOD and LOQ of EHEC directly from cattle feces that are the lowest reported. The application of this assay towards the identification of cattle shedding EHEC at a level above 1.25 × 10 3 CFUs/mL could be a first line of defense in identifying cattle shedding these pathogens. Published by Elsevier B.V. 1. Introduction The contamination of food products by Shiga toxin-producing Escherichia coli (STEC) is a worldwide problem and can result in out- breaks of human disease (Mathusa et al., 2010). In most outbreaks, human illness is attributed to one of the top 7 STEC serotypes, O26, O45, O103, O111, O121, O145, and O157 (Gyles, 2007), while sporadic cases of other non-top 7 serotypes have been observed (Buchholz et al., 2011). The degree of illness can range from low grade fever, vomiting, and abdominal pain with nonbloody or bloody diarrhea. Children under 10 and the elderly are the most likely to develop hemor- rhagic colitis and/or hemolytic uremic syndrome, which can be fatal (Goldwater and Bettelheim, 2012). Transmission of STEC occurs via the fecal oral route and can be spread zoonotically and from person to person (Erickson and Doyle, 2007). In the environment, wild and domestic animals are the primary reservoir of STEC while domesticated ruminants have the highest asso- ciation with contributing to human disease (Mathusa et al., 2010). A recent concern in the beef industry is the effect that super shedding cattle have in food safety. Super shedding cattle are defined as releas- ing N 10 4 STEC CFUs/g of feces (Matthews et al., 2006; Menrath et al., 2010). Interestingly, it has been shown that 20% of super shedding cattle in a herd can be accountable for transmission of STEC 0157:H7 to 80% of the herd (Matthews et al., 2006) while cattle contained in pens absent of a super shedder were found to be five times less likely to shed STEC O157:H7 (Cobbold et al., 2007). Moreover, super shedding cattle have a high propensity for the cross contamination of hides in the pre-harvest environment, and it was suggested to keep herd prevalence below 20% and the fecal shedding of STEC O157:H7 below the high shedding level of 200 CFU/g to minimize carcass contamination at harvest (Arthur et al., 2009). Although not as well studied, non-O157 STEC are likely to fol- low a similar trend (Menrath et al., 2010), and recently the United States Department of Agriculture (USDA) Food Safety and Inspection Service (FSIS) has deemed the top 6 non-O157 STEC as adulterants in non- intact beef (Almanza, 2011). Further control of spreading is thought to be attainable if colonization is decreased by 5% amongst super shedding cattle (Matthews et al., 2006). However, a cost efficient and rapid quanti- tative detection method to identify cattle shedding the top 7 and non-top 7 STEC serotypes directly from cattle feces is currently not available. The detection of STEC from feces has classically been performed using enrichment cultures with or without serotype specific immunomagnetic bead separation prior to plating on selective media followed by PCR con- firmation (Jacob et al., 2010; Walker et al., 2010) while the enumeration of STEC has been performed using most probable number determination Journal of Microbiological Methods 105 (2014) 72–79 ⁎ Corresponding author. Tel.: +1 402 762 4225; fax: +1 402 762 4149. E-mail address: [email protected] (J.M. Bosilevac). 1 USDA is an equal opportunity provider and employer. Trade names are necessary to report factually on available data; however, the USDA neither guarantees nor warrants the standard of the product, and the use of the name by USDA implies no approval of the product to the exclusion of others that may also be suitable. http://dx.doi.org/10.1016/j.mimet.2014.07.015 0167-7012/Published by Elsevier B.V. Contents lists available at ScienceDirect Journal of Microbiological Methods journal homepage: www.elsevier.com/locate/jmicmeth
-
Upload
independent -
Category
Documents
-
view
13 -
download
0
Transcript of Evaluation of real-time PCR assays for detection and quantification of fraudulent addition of bovine...

Journal of Microbiological Methods 105 (2014) 72–79
Contents lists available at ScienceDirect
Journal of Microbiological Methods
j ourna l homepage: www.e lsev ie r .com/ locate / jmicmeth
Evaluation of real time PCR assays for the detection and enumeration ofenterohemorrhagic Escherichia coli directly from cattle feces
Brandon E. Luedtke, James L. Bono, Joseph M. Bosilevac ⁎U.S. Department of Agriculture 1, Agricultural Research Service, Roman L. Hruska U.S. Meat Animal Research Center, Clay Center, NE 68933-0166, USA
⁎ Corresponding author. Tel.: +1 402 762 4225; fax: +E-mail address: [email protected] (J.M. Bos
1 USDA is an equal opportunity provider and employerreport factually on available data; however, the USDA nethe standard of the product, and the use of the name bythe product to the exclusion of others that may also be su
http://dx.doi.org/10.1016/j.mimet.2014.07.0150167-7012/Published by Elsevier B.V.
a b s t r a c t
a r t i c l e i n f oArticle history:Received 3 June 2014Received in revised form 11 July 2014Accepted 14 July 2014Available online 23 July 2014
Keywords:Enterohemorrhagic E. coliLimit of detectionLimit of quantificationMultiplex qPCRNon-O157 Shiga toxin-producing E. coli
Shiga toxin-producing Escherichia coli are a growing concern in the area of food safety, and the United States De-partment of Agriculture Food Safety and Inspection Service has identified the serotypes O26, O45, O103, O111,O121, O145, and O157 as adulterants in certain types of raw beef. The most relevant to human disease are theenterohemorrhagic E. coli (EHEC) strains that possess intimin (eae), Shiga toxin 1 and/or 2 (stx1–2), and inmost cases the conserved pO157 or pO157 like virulence plasmid. Contamination of raw beef with EHEC is likelyto occur via the transfer of cattle feces on hides to the carcass. To detect EHEC directly from cattle feces, we eval-uated the utility of a multiplex real time PCR assay that targets the EHEC associated gene target ecf1 in combina-tionwith eae and stx1–2. Our assay had an increased sensitivity and provided a reliable limit of detection (LOD) of1.25× 103 colony-forming units permL (CFUs/mL) in an EHEC spiked fecal background. In addition, we evaluatedthe use of a duplex qPCR assay using ecf1 for the enumeration of total EHEC directly from cattle feces. The reliablelimit of quantification (LOQ)was determined to be 1.25 × 10³ CFUs/mL. Our assay requiresminimal sample pro-cessing and provides LOD and LOQ of EHEC directly from cattle feces that are the lowest reported. The applicationof this assay towards the identification of cattle shedding EHEC at a level above1.25×103 CFUs/mL couldbe afirstline of defense in identifying cattle shedding these pathogens.
Published by Elsevier B.V.
1. Introduction
The contamination of food products by Shiga toxin-producingEscherichia coli (STEC) is a worldwide problem and can result in out-breaks of human disease (Mathusa et al., 2010). In most outbreaks,human illness is attributed to one of the top 7 STEC serotypes, O26,O45, O103, O111, O121, O145, and O157 (Gyles, 2007), while sporadiccases of other non-top 7 serotypes have been observed (Buchholzet al., 2011). The degree of illness can range from low grade fever,vomiting, and abdominal pain with nonbloody or bloody diarrhea.Children under 10 and the elderly are themost likely to develop hemor-rhagic colitis and/or hemolytic uremic syndrome, which can be fatal(Goldwater and Bettelheim, 2012). Transmission of STEC occurs viathe fecal oral route and can be spread zoonotically and from person toperson (Erickson and Doyle, 2007).
In the environment, wild and domestic animals are the primaryreservoir of STEC while domesticated ruminants have the highest asso-ciation with contributing to human disease (Mathusa et al., 2010). Arecent concern in the beef industry is the effect that super shedding
1 402 762 4149.ilevac).. Trade names are necessary toither guarantees nor warrantsUSDA implies no approval of
itable.
cattle have in food safety. Super shedding cattle are defined as releas-ing N104 STEC CFUs/g of feces (Matthews et al., 2006; Menrath et al.,2010). Interestingly, it has been shown that 20% of super shedding cattlein a herd can be accountable for transmission of STEC 0157:H7 to 80% ofthe herd (Matthews et al., 2006) while cattle contained in pens absentof a super shedder were found to be five times less likely to shed STECO157:H7 (Cobbold et al., 2007). Moreover, super shedding cattle have ahigh propensity for the cross contamination of hides in the pre-harvestenvironment, and it was suggested to keep herd prevalence below 20%and the fecal shedding of STEC O157:H7 below the high shedding levelof 200 CFU/g to minimize carcass contamination at harvest (Arthuret al., 2009). Althoughnot aswell studied, non-O157 STEC are likely to fol-low a similar trend (Menrath et al., 2010), and recently the United StatesDepartment of Agriculture (USDA) Food Safety and Inspection Service(FSIS) has deemed the top 6 non-O157 STEC as adulterants in non-intact beef (Almanza, 2011). Further control of spreading is thought tobe attainable if colonization is decreased by 5% amongst super sheddingcattle (Matthews et al., 2006). However, a cost efficient and rapid quanti-tative detectionmethod to identify cattle shedding the top 7 and non-top7 STEC serotypes directly from cattle feces is currently not available.
The detection of STEC from feces has classically beenperformedusingenrichment cultureswith orwithout serotype specific immunomagneticbead separation prior to plating on selectivemedia followed by PCR con-firmation (Jacob et al., 2010;Walker et al., 2010) while the enumerationof STEC has been performed usingmost probable number determination

Collection of cattle
feces by RAMS
Suspension of feces in
5 mL of pTBS and
stored on ice
Liberation of template
DNA
Fecal suspension diluted
1:10 using BAX®
system lysis buffer
Addition of 8 µl of
template DNA to
multiplex qPCR reaction
Detection of EHEC Enumeration of total EHEC
Addition of 8 µl of
template DNA to
duplex qPCR reaction
Samples in BAX®
system lysis buffer
heated to 37C for 20 min
then 95C for 10min
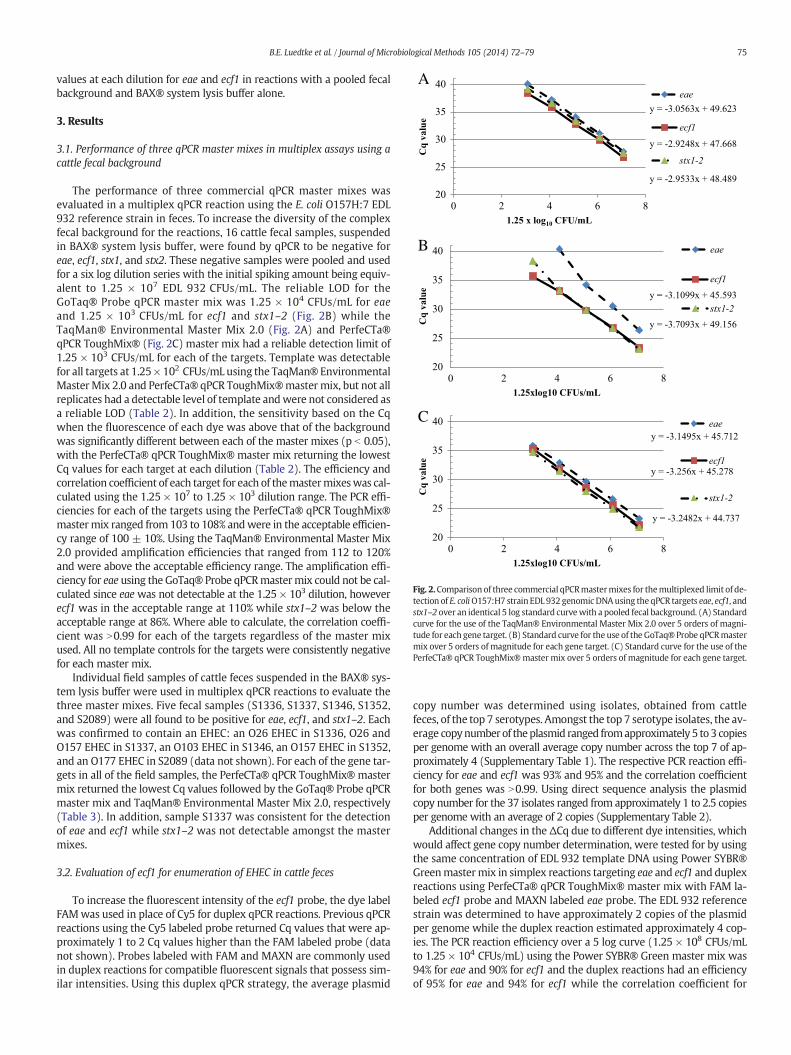
Fig. 1. Flow diagram detailing the experimental procedure for the direct detection orenumeration of total EHEC using qPCR.
73B.E. Luedtke et al. / Journal of Microbiological Methods 105 (2014) 72–79
(Fox et al., 2007) and direct or spiral platting (Arthur et al., 2009). Specif-ic molecular targets have been established for the detection and geneticcharacterization of STEC (Paton and Paton, 1999;Wasilenko et al., 2012),but the use of molecular methods to enumerate STEC directly from fecalsamples has been limited. The current detection and enumerationmethods for STEC from fecal samples use a combination of the genetictargets stx1, stx2, eae, uidA, rfbE, and filC alleles in real time PCR (qPCR)assays (Jacob et al., 2012; Jinneman et al., 2003; Sharma andDean-Nystrom, 2003). Thesemarkers have been used primarily to detectand enumerate O157:H7 or a subset of non-O157:H7 serotypes, More-over, some reports have shown an inability to discriminate betweenstx1, stx2, and eae of non-O157 STEC serotypes (Ibekwe et al., 2002;Jacob et al., 2012). This lack of discrimination could lead to the detectionof false positives and inflate the estimation of O157:H7 CFUs/g in cattleco-colonized with O157 non-H7, and/or a non-O157 STEC, and/or back-ground microflora. To detect and assess the total STEC load from cattlefecal samples, with relevance towards human pathogenesis, the sub-group of STEC classified as enterohemorrhagic E. coli (EHEC), whichpossesses eae, stx, and in 90% to 99% of isolates the virulence plasmidencoded enterohemolysin A (exhA) (Lorenz et al., 2013) would be avaluable target.
Here we evaluated the use of the EHEC specific target E. coli attachingand effacing gene-positive conserved fragment 1 (ecf1), which is con-served on the virulence plasmid pO157 and pO157 like plasmids(Boerlin et al., 1998; Ogura et al., 2009; Groschel and Becker, 2013), inmultiplex qPCR with eae, stx1, and stx2 targets and in duplex qPCR witheae for the detection and enumeration of EHEC directly from cattlefeces, respectively. In addition, we evaluated the use of three commercialmaster mixes to identify a DNA polymerase that is insensitive to PCR in-hibitors commonly found in feces and capable of multiplexing. We iden-tified a master mix that had high sensitivity and a reliable limit ofdetection (LOD) of 1.25 × 10³ CFUs/mL in amultiplex assay and had a re-liable limit of quantification (LOQ) of 1.25 × 10³ CFUs/mL in a duplex re-action. Moreover, the inclusion of ecf1 as a target in amultiplex detectionwould limit EHEC false positives due to samples containing separate or-ganisms possessing either eae or stx andprovide for the detection of atyp-ical EPECs,which retain the pO157or pO157 like plasmid but have lost stxduring the culturing process (Bielaszewska et al., 2007). By using thisqPCR protocol, we eliminated the need to perform time-consuming en-richment steps or extensive DNA purification procedures that can resultin the loss of template. To our knowledge, this is thefirst study to describethe direct detection and enumeration of EHEC loads in cattle feces.
2. Materials and methods
2.1. Standard curve development and fecal samples
Standard curves were constructed using the E. coli O157:H7 refer-ence strain EDL 932 (ATCC 43894), which was grown from a freezerstock in Luria–Bertani (LB) broth overnight at 37 °C overnight. A 1 mLaliquot was then harvested by centrifugation and washed once withphosphate buffered saline (PBS). The pellet was resuspended in 1 mLof PBS. Serial dilutions of the aliquotweremade using PBS and a dilutionproviding a countable number of colony-forming units (CFUs) was plat-ed in quadruplicate on aerobic plate count Petrifilm™ (3M Microbiolo-gy, St. Paul, MN) and grown at 37 °C overnight prior to enumerationusing a Petrifilm™ reader. Concurrently with the Petrifilm dilutions, a10-fold dilution of the culturewasmade using BAX® system lysis buffer(DuPont, Wilmington, DE). To liberate the template DNA, cells werelysed and proteins were degraded at 37 °C for 20 min using the BAX®system protease. The BAX® system proteasewas inactivated by heatingto 95 °C for 10 min. Further 10-fold dilutions were made in inactivatedBAX® system lysis buffer. In addition, cattle feces were collected by rec-tal–analmucosal swabs (RAMS) and suspended in 5mLphosphate buff-ered Tryptic Soy Broth (pTSB) (Arthur et al., 2009) then diluted in BAX®system lysis buffer (Fig. 1). qPCRwas used to identify fecal samples that
were negative for stx, eae, and ecf1. Negative fecal samples were pooledand used as diluent for the construction of a six log standard curve. Allstandard curves were stored at −20 °C in single use aliquots.
Additional cattle fecal samples were collected by RAMS. After sam-pling, RAMS were placed in sterile 15 mL conical tubes containing5 mL of pTSB and stored on ice until returning to the laboratory. A por-tion of the resuspended fecal sample was processed using the BAX®lysis as described above and stored at −20 °C (Fig. 1). The RAMS tubewas then incubated at 42 °C for 12 h to enrich for EHEC. After enrich-ment of the sample, a 1 mL portion was removed and prepared in aRoka G2 Sample Transfer Tube (Roka Biosciences, San Diego, CA) andthen submitted to Roka Biosciences laboratory for analysis to identifysamples that were positive for ecf1. A second 1 mL portion was usedto generate a DNA boil lysis and screened for the presence of stx, eae,and any of the top 7 serogroups according to established protocols(Bosilevac and Koohmaraie, 2012). Glycerol was added to the remain-der of the bacterial enrichment and stored at −20 °C. Samples thatwere indicative of a top 7 EHEC were thawed and processed forimmunomagnetic separation using magnetic beads conjugated withantibodies against a specific serogroup (Romer Labs, Newark, DE). Sam-ples containing the respective magnetic beads were shaken at roomtemperature for 15min prior to the automated processing using a King-Fisher 96 magnetic separator as previously described (Bosilevac et al.,2009). The immuno-separated samples were diluted for plating onwashed sheep blood agar containing 0.5 mg/L mitomycin C (Sugiyama
74 B.E. Luedtke et al. / Journal of Microbiological Methods 105 (2014) 72–79
et al., 2001) and STEC Differential Agar (Kalchayanand et al., 2013)using an Autoplate 4000 spiral plater (Advanced Instruments, NorwoodMA). Plates were incubated overnight at 37 °C. Individual colonies werepicked into 96 well blocks containing TSB and incubated at 37 °C over-night. All isolateswere screened by PCR for serotype and genes associat-ed with EHEC. Isolates possessing eae and stx, regardless of serotype,were suspended in 12.5% glycerol and stored at −20 °C. Select fecalsamples with confirmed EHEC were used for additional qPCR analyses.
2.2. Evaluation of qPCR master mixes in multiplex reactions
Themultiplex qPCR assays were performed on the EDL 932 standardcurves developed using the BAX® system lysis bufferwith an EHEC neg-ative cattle fecal background and five selected field samples of cattlefeces that had characterized EHEC isolates. Samples were run in tripli-cate and no template controls run in duplicate 25 μl reactions thatconsisted of 12.5 μl of either TaqMan® Environmental Master Mix 2.0(Applied Biosystems® by Life Technologies, Carlsbad, CA), GoTaq®Probe qPCR master mix with the addition of carboxy-X-rhodamine at30 nM (Promega, Madison,WI), or PerfeCTa® qPCR ToughMix®mastermix (Quanta Biosciences, Gaithersburg, MD), primers and probestargeting eae, ecf1, and stx1 and stx2 were used at the final concentra-tions indicated in Table 1, and 8 μl of template DNA (Fig. 1). For multi-plex assays, the fluorescent dye on the ecf1 probe was Cy5. Themaximum volume of template DNA in a fecal background was empiri-cally determined, using the PerfeCTa® qPCR ToughMix® master mix.A 96-well plate format was used for all assays and run using an ABI7500 Fast Real-Time PCR system with version 2.0.6 software (AppliedBiosystems® by Life Technologies). Cycling conditions were 95 °C for10 min followed by 45 cycles of 95 °C for 15 s and 59 °C for 1 min asdescribed in the USDA FSIS MLG 5B Appendix 1.01 protocol (USDA,2012). A quantification cycle (Cq) threshold of 0.2 was manually setfor all gene targets after an automatic adjustment of the baseline. ThePCR efficiencies and correlation coefficients were evaluated using thetrend line created from the standard curve, which was generatedusing MS Excel 2007 (Microsoft, Redmond, WA).
2.3. Evaluation of ecf1 for enumeration of EHEC
To address variations in the copy number of pO157 and pO157 likeplasmids between serotypes, isolates recovered from cattle feces ofthe top 7 serotypes were used to create template DNA using the BAXsystem lysis buffer. The resulting template DNA from six O26, four
Table 1Primersa and probes used for multiplex and duplex qPCR assays for the detection and quantifi
Genetarget
Sequence Final conc(μM)
eae-Pr 5′-/MAXN/ATAGTCTCGCCAGTATTCGCCACCAATACC/IABkFQ/-3′ 0.2eae-F 5′-CATTGATCAGGATTTTTCTGGTGATA-3′ 1.0eae-R 5′-CTCATGCGGAAATAGCCGTTM-3′ 1.0eae98-F 5′-GAAATGATGGTCGTGCGACG-3′ 0.5eae98-R 5′-AGTCGCTTTAACCTCAGCCC-3′ 0.5ecf1-Pr 5′-/FAM/AAAGGCGTCGTTTCAGCCAGCCGGAA/IABkFQ/-3′ 0.15ecf1-Pr 5′-/TYE665/AAAGGCGTCGTTTCAGCCAGCCGGAA/3IAbRQSp/-3′ 0.2ecf1-F 5′-TATCAGCACCAAAGAGCGGGAACA-3′ 1.0ecf1-R 5′-CCCTTATGAAGAGCCAGTACTGAA-3′ 1.0stx1-Pr 5′-/FAM/CTGGATGAT/zen/CTCAGTGGGCGTTCTTATGTAA/IABkFQ/-3′ 0.25stx2-Pr 5′-/FAM/TCGTCAGGC/zen/ACTGTCTGAAACTGCTCC/IABkFQ/-3′ 0.25stx-F 5′-TTTGTYACTGTSACAGCWGAAGCYTTACG-3′ 1.25
stx-R 5′-CCCCAGTTCARWGTRAGRTCMACDTC-3′ 1.25
Pr = Probe, F = Forward, R = Reverse.a Degenerate nucleotide codes as follows: Y (C, T), W (A, T), R (A, G), M (A, C), D (A, G, T), ab Used for SYBR Green based qPCR.c Location within sequence for stx1.d Location within sequence for stx2.
O45, six O103, five O111, one O121, six O145, and six O157 serotypeswas used in duplicate duplex qPCR reactions targeting the plasmidencoded gene ecf1 and the single copy number chromosomal geneeae. Duplex qPCR reactions were performed as described previously inthis study. Plasmid copy number was determined using a relative quan-tification method as previously described (Skulj et al., 2008). In addi-tion, direct sequencing data was analyzed to determine the pO157 andpO157 like copy number from 37 EHEC isolates, which included eightO26, two O45, five O111, five O103, five O121, three O145, threeO157, one O15, three O118, one O123, and one O186. Plasmid copynumbers were determined by comparing the chromosome sequencecoverage to the plasmid sequence coverage as previously described(Rasko et al., 2007).
The delta Cq (ΔCq) between eae and ecf1 in duplex and in simplexqPCR assays over a five log standard curve of the EDL 932 referencestrain DNA was compared to determine the changes in the ΔCq due todifferences in fluorescent intensity of FAM. Simplex qPCR assays wereperformed in triplicate 25 μl reactions containing 12.5 μl of the PowerSYBR® Green (Applied Biosystems® by Life Technologies), 0.5 μM ofeach primer set, eae98 and ecf1, 8 μl of template DNA, and 3.5 μl ofPCR grade H2O. Duplex qPCR assays were composed as indicated hereand used similar amounts of the same DNA preparation. Real time reac-tions were run and analyzed as previously described here.
Duplex qPCR reactions targeting ecf1 and eae were performed intriplicate 25 μl reactions containing 12.5 μl of the PerfeCTa® qPCRToughMix® master mix, the indicated final concentration of primersand probes (Table 1), 8 μl of template DNA (Fig. 1), and 1.5 μl of PCRgrade H2O. For duplex assays, the ecf1 probe was labeled with FAM.The EDL 932 reference strainwas used for template DNA in the standardcurves made with a BAX® system lysis buffer with or without a cattlefeces background. Five selected field samples of cattle feces that hadcharacterized EHEC isolates were used for enumeration. The plate for-mat, cycling conditions using the ABI 7500 Fast Real-Time PCR system,determination of Cq threshold, and calculation of PCR efficiencies andcorrelation coefficients were as previously stated.
2.4. Statistics
All statistical tests were performed using the SigmaStat 3.1 software(Systat Software, San Jose CA). Statistical significance between theresulting Cq values at each dilution for the three master mixes was de-termined using a one-way ANOVA and the Holm–Šidák post hoc test. Apaired T-testwas used to detect a statistical significance between the Cq
cation of eae, ecf1, stx1, and stx2 in cattle feces.
entration Location withinsequence
GenBankaccession
Source
4,394,309–4,394,338 CP003109 Wasilenko et al. (2012)4,394,375–4,394,3504,394,274–4,394,2944,666,080–4,666,099 AE005174 This study4,666,002–4,666,021
18,692–18,717 AP010959 K.W. Livezey (personal communication)18,692–18,71718,668–18,69118,766–18,742
5,388,313–5,388,343 AP010958 Wasilenko et al. (2012)2,897,489–2,897,463d
5,388,250–5388279b
2,897,519–2897490c
5,388,445–5388420b
2,897,414–2897440c
nd S (C, G).
A
B
C
y = -3.0563x + 49.623
y = -2.9248x + 47.668
y = -2.9533x + 48.489
20
25
30
35
40
0 2 4 6 8
Cq
valu
e
1.25 x log10 CFU/mL
eae
ecf1
stx1-2
y = -3.1099x + 45.593
y = -3.7093x + 49.156
20
25
30
35
40
0 2 4 6 8
Cq
valu
e
1.25xlog10 CFUs/mL
eae
ecf1
stx1-2
y = -3.1495x + 45.712
y = -3.256x + 45.278
y = -3.2482x + 44.737
20
25
30
35
40
0 2 4 6 8
Cq
valu
e
1.25xlog10 CFUs/mL
eae
ecf1
stx1-2
Fig. 2.Comparison of three commercial qPCRmastermixes for themultiplexed limit of de-tection of E. coliO157:H7 strain EDL 932 genomic DNAusing theqPCR targets eae, ecf1, andstx1–2 over an identical 5 log standard curvewith a pooled fecal background. (A) Standardcurve for the use of the TaqMan® Environmental Master Mix 2.0 over 5 orders of magni-tude for each gene target. (B) Standard curve for the use of the GoTaq® Probe qPCRmastermix over 5 orders of magnitude for each gene target. (C) Standard curve for the use of thePerfeCTa® qPCR ToughMix®master mix over 5 orders of magnitude for each gene target.
75B.E. Luedtke et al. / Journal of Microbiological Methods 105 (2014) 72–79
values at each dilution for eae and ecf1 in reactions with a pooled fecalbackground and BAX® system lysis buffer alone.
3. Results
3.1. Performance of three qPCR master mixes in multiplex assays using acattle fecal background
The performance of three commercial qPCR master mixes wasevaluated in a multiplex qPCR reaction using the E. coli O157H:7 EDL932 reference strain in feces. To increase the diversity of the complexfecal background for the reactions, 16 cattle fecal samples, suspendedin BAX® system lysis buffer, were found by qPCR to be negative foreae, ecf1, stx1, and stx2. These negative samples were pooled and usedfor a six log dilution series with the initial spiking amount being equiv-alent to 1.25 × 10⁷ EDL 932 CFUs/mL. The reliable LOD for theGoTaq® Probe qPCR master mix was 1.25 × 10⁴ CFUs/mL for eaeand 1.25 × 10³ CFUs/mL for ecf1 and stx1–2 (Fig. 2B) while theTaqMan® Environmental Master Mix 2.0 (Fig. 2A) and PerfeCTa®qPCR ToughMix® (Fig. 2C) master mix had a reliable detection limit of1.25 × 103 CFUs/mL for each of the targets. Template was detectablefor all targets at 1.25× 10² CFUs/mL using the TaqMan® EnvironmentalMasterMix 2.0 and PerfeCTa® qPCR ToughMix®master mix, but not allreplicates had a detectable level of template andwere not considered asa reliable LOD (Table 2). In addition, the sensitivity based on the Cqwhen the fluorescence of each dye was above that of the backgroundwas significantly different between each of the master mixes (p b 0.05),with the PerfeCTa® qPCR ToughMix® master mix returning the lowestCq values for each target at each dilution (Table 2). The efficiency andcorrelation coefficient of each target for each of themastermixeswas cal-culated using the 1.25 × 10⁷ to 1.25 × 10³ dilution range. The PCR effi-ciencies for each of the targets using the PerfeCTa® qPCR ToughMix®mastermix ranged from 103 to 108% andwere in the acceptable efficien-cy range of 100 ± 10%. Using the TaqMan® Environmental Master Mix2.0 provided amplification efficiencies that ranged from 112 to 120%and were above the acceptable efficiency range. The amplification effi-ciency for eae using the GoTaq® Probe qPCRmastermix could not be cal-culated since eaewas not detectable at the 1.25 × 10³ dilution, howeverecf1 was in the acceptable range at 110% while stx1–2 was below theacceptable range at 86%. Where able to calculate, the correlation coeffi-cient was N0.99 for each of the targets regardless of the master mixused. All no template controls for the targets were consistently negativefor each master mix.
Individual field samples of cattle feces suspended in the BAX® sys-tem lysis buffer were used in multiplex qPCR reactions to evaluate thethree master mixes. Five fecal samples (S1336, S1337, S1346, S1352,and S2089) were all found to be positive for eae, ecf1, and stx1–2. Eachwas confirmed to contain an EHEC: an O26 EHEC in S1336, O26 andO157 EHEC in S1337, an O103 EHEC in S1346, an O157 EHEC in S1352,and an O177 EHEC in S2089 (data not shown). For each of the gene tar-gets in all of the field samples, the PerfeCTa® qPCR ToughMix® mastermix returned the lowest Cq values followed by the GoTaq® Probe qPCRmaster mix and TaqMan® Environmental Master Mix 2.0, respectively(Table 3). In addition, sample S1337 was consistent for the detectionof eae and ecf1 while stx1–2 was not detectable amongst the mastermixes.
3.2. Evaluation of ecf1 for enumeration of EHEC in cattle feces
To increase the fluorescent intensity of the ecf1 probe, the dye labelFAMwas used in place of Cy5 for duplex qPCR reactions. Previous qPCRreactions using the Cy5 labeled probe returned Cq values that were ap-proximately 1 to 2 Cq values higher than the FAM labeled probe (datanot shown). Probes labeled with FAM and MAXN are commonly usedin duplex reactions for compatible fluorescent signals that possess sim-ilar intensities. Using this duplex qPCR strategy, the average plasmid
copy number was determined using isolates, obtained from cattlefeces, of the top 7 serotypes. Amongst the top 7 serotype isolates, the av-erage copynumberof theplasmid ranged fromapproximately 5 to3 copiesper genome with an overall average copy number across the top 7 of ap-proximately 4 (Supplementary Table 1). The respective PCR reaction effi-ciency for eae and ecf1 was 93% and 95% and the correlation coefficientfor both genes was N0.99. Using direct sequence analysis the plasmidcopy number for the 37 isolates ranged from approximately 1 to 2.5 copiesper genome with an average of 2 copies (Supplementary Table 2).
Additional changes in the ΔCq due to different dye intensities, whichwould affect gene copy number determination, were tested for by usingthe same concentration of EDL 932 template DNA using Power SYBR®Greenmastermix in simplex reactions targeting eae and ecf1 and duplexreactions using PerfeCTa® qPCR ToughMix® master mix with FAM la-beled ecf1 probe and MAXN labeled eae probe. The EDL 932 referencestrain was determined to have approximately 2 copies of the plasmidper genome while the duplex reaction estimated approximately 4 cop-ies. The PCR reaction efficiency over a 5 log curve (1.25 × 10⁸ CFUs/mLto 1.25 × 10⁴ CFUs/mL) using the Power SYBR® Green master mix was94% for eae and 90% for ecf1 and the duplex reactions had an efficiencyof 95% for eae and 94% for ecf1 while the correlation coefficient for
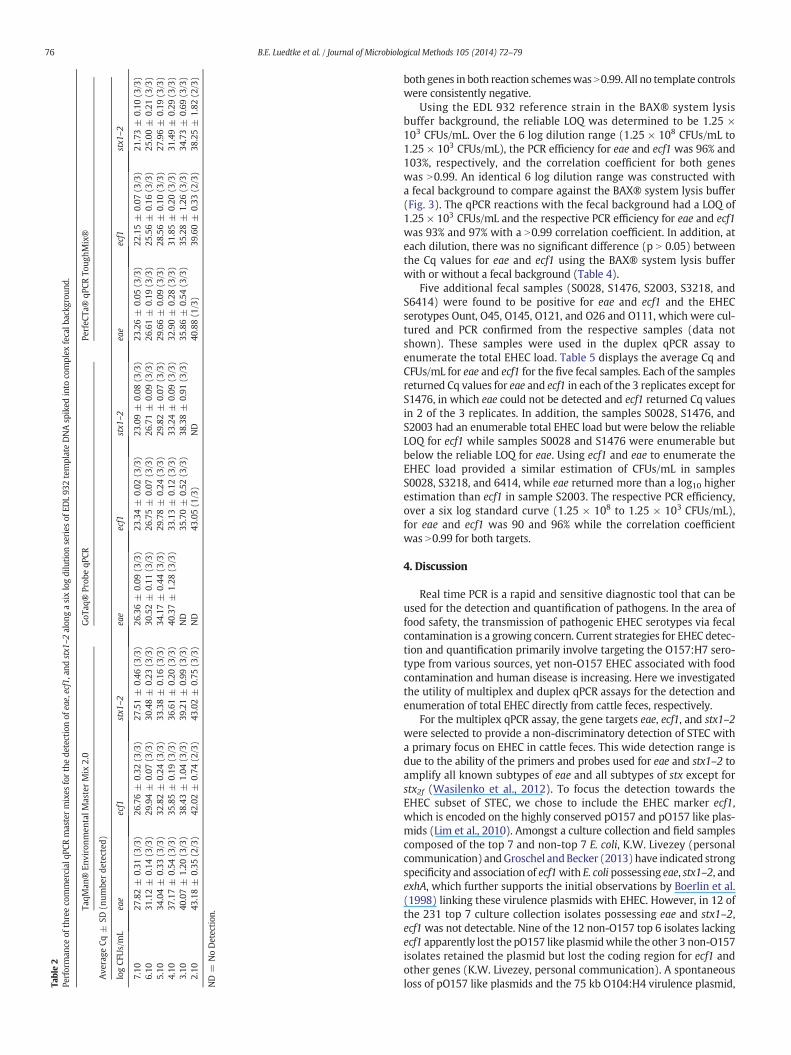
Table2
Performan
ceof
threeco
mmercial
qPCR
mastermixes
forthede
tectionof
eae,ecf1,and
stx1
–2alon
gasixlogdilution
series
ofED
L93
2templateDNAsp
iked
into
complex
fecalb
ackg
roun
d.
TaqM
an®
Environm
entalM
asterMix
2.0
GoT
aq®
Prob
eqP
CRPe
rfeC
Ta®
qPCR
Toug
hMix®
Ave
rage
Cq±
SD(n
umbe
rde
tected
)
logCF
Us/mL
eae
ecf1
stx1
–2
eae
ecf1
stx1
–2
eae
ecf1
stx1
–2
7.10
27.82±
0.31
(3/3)
26.76±
0.32
(3/3)
27.51±
0.46
(3/3)
26.36±
0.09
(3/3)
23.34±
0.02
(3/3)
23.09±
0.08
(3/3)
23.26±
0.05
(3/3)
22.15±
0.07
(3/3)
21.73±
0.10
(3/3)
6.10
31.12±
0.14
(3/3)
29.94±
0.07
(3/3)
30.48±
0.23
(3/3)
30.52±
0.11
(3/3)
26.75±
0.07
(3/3)
26.71±
0.09
(3/3)
26.61±
0.19
(3/3)
25.56±
0.16
(3/3)
25.00±
0.21
(3/3)
5.10
34.04±
0.33
(3/3)
32.82±
0.24
(3/3)
33.38±
0.16
(3/3)
34.17±
0.44
(3/3)
29.78±
0.24
(3/3)
29.82±
0.07
(3/3)
29.66±
0.09
(3/3)
28.56±
0.10
(3/3)
27.96±
0.19
(3/3)
4.10
37.17±
0.54
(3/3)
35.85±
0.19
(3/3)
36.61±
0.20
(3/3)
40.37±
1.28
(3/3)
33.13±
0.12
(3/3)
33.24±
0.09
(3/3)
32.90±
0.28
(3/3)
31.85±
0.20
(3/3)
31.49±
0.29
(3/3)
3.10
40.07±
1.20
(3/3)
38.43±
1.04
(3/3)
39.21±
0.99
(3/3)
ND
35.70±
0.52
(3/3)
38.38±
0.91
(3/3)
35.86±
0.54
(3/3)
35.28±
1.26
(3/3)
34.73±
0.69
(3/3)
2.10
43.18±
0.35
(2/3)
42.02±
0.74
(2/3)
43.02±
0.75
(3/3)
ND
43.05(1
/3)
ND
40.88(1
/3)
39.60±
0.33
(2/3)
38.25±
1.82
(2/3)
ND
=NoDetection
.
76 B.E. Luedtke et al. / Journal of Microbiological Methods 105 (2014) 72–79
both genes in both reaction schemeswas N0.99. All no template controlswere consistently negative.
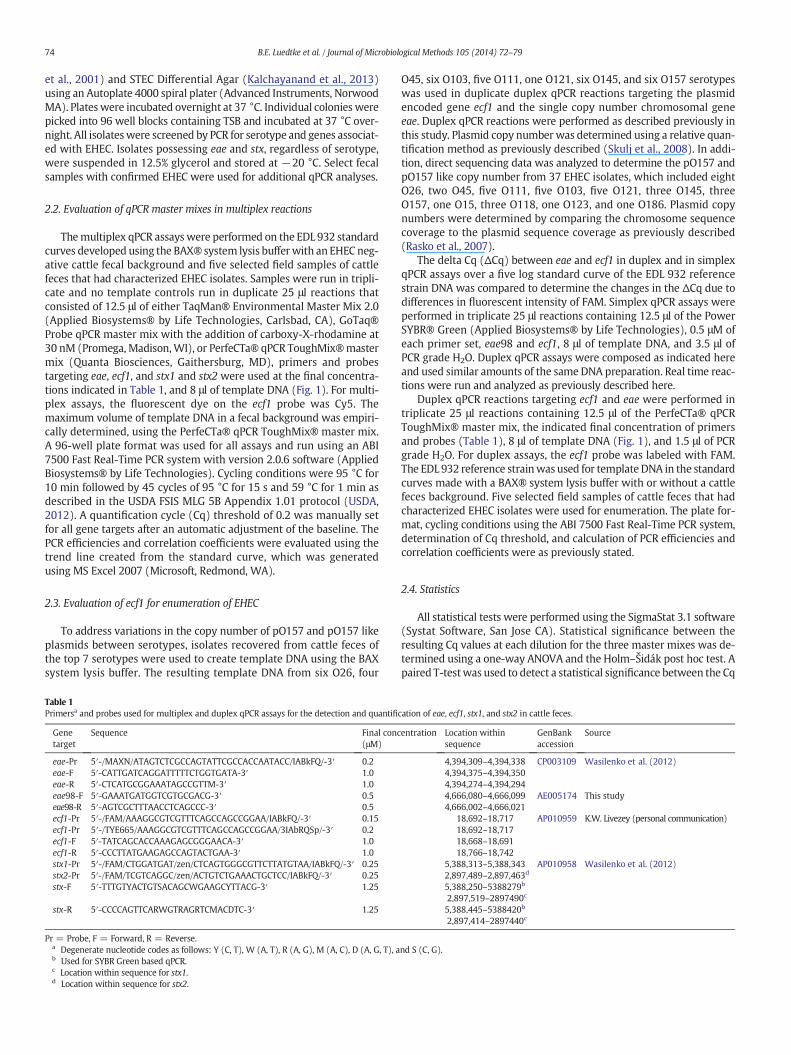
Using the EDL 932 reference strain in the BAX® system lysisbuffer background, the reliable LOQ was determined to be 1.25 ×10³ CFUs/mL. Over the 6 log dilution range (1.25 × 10⁸ CFUs/mL to1.25 × 103 CFUs/mL), the PCR efficiency for eae and ecf1 was 96% and103%, respectively, and the correlation coefficient for both geneswas N0.99. An identical 6 log dilution range was constructed witha fecal background to compare against the BAX® system lysis buffer(Fig. 3). The qPCR reactions with the fecal background had a LOQ of1.25 × 103 CFUs/mL and the respective PCR efficiency for eae and ecf1was 93% and 97% with a N0.99 correlation coefficient. In addition, ateach dilution, there was no significant difference (p N 0.05) betweenthe Cq values for eae and ecf1 using the BAX® system lysis bufferwith or without a fecal background (Table 4).
Five additional fecal samples (S0028, S1476, S2003, S3218, andS6414) were found to be positive for eae and ecf1 and the EHECserotypes Ount, O45, O145, O121, and O26 and O111, which were cul-tured and PCR confirmed from the respective samples (data notshown). These samples were used in the duplex qPCR assay toenumerate the total EHEC load. Table 5 displays the average Cq andCFUs/mL for eae and ecf1 for the five fecal samples. Each of the samplesreturned Cq values for eae and ecf1 in each of the 3 replicates except forS1476, in which eae could not be detected and ecf1 returned Cq valuesin 2 of the 3 replicates. In addition, the samples S0028, S1476, andS2003 had an enumerable total EHEC load but were below the reliableLOQ for ecf1 while samples S0028 and S1476 were enumerable butbelow the reliable LOQ for eae. Using ecf1 and eae to enumerate theEHEC load provided a similar estimation of CFUs/mL in samplesS0028, S3218, and 6414, while eae returned more than a log10 higherestimation than ecf1 in sample S2003. The respective PCR efficiency,over a six log standard curve (1.25 × 10⁸ to 1.25 × 10³ CFUs/mL),for eae and ecf1 was 90 and 96% while the correlation coefficientwas N0.99 for both targets.
4. Discussion
Real time PCR is a rapid and sensitive diagnostic tool that can beused for the detection and quantification of pathogens. In the area offood safety, the transmission of pathogenic EHEC serotypes via fecalcontamination is a growing concern. Current strategies for EHEC detec-tion and quantification primarily involve targeting the O157:H7 sero-type from various sources, yet non-O157 EHEC associated with foodcontamination and human disease is increasing. Here we investigatedthe utility of multiplex and duplex qPCR assays for the detection andenumeration of total EHEC directly from cattle feces, respectively.
For the multiplex qPCR assay, the gene targets eae, ecf1, and stx1–2were selected to provide a non-discriminatory detection of STEC witha primary focus on EHEC in cattle feces. This wide detection range isdue to the ability of the primers and probes used for eae and stx1–2 toamplify all known subtypes of eae and all subtypes of stx except forstx2f (Wasilenko et al., 2012). To focus the detection towards theEHEC subset of STEC, we chose to include the EHEC marker ecf1,which is encoded on the highly conserved pO157 and pO157 like plas-mids (Lim et al., 2010). Amongst a culture collection and field samplescomposed of the top 7 and non-top 7 E. coli, K.W. Livezey (personalcommunication) andGroschel andBecker (2013) have indicated strongspecificity and association of ecf1with E. coli possessing eae, stx1–2, andexhA, which further supports the initial observations by Boerlin et al.(1998) linking these virulence plasmids with EHEC. However, in 12 ofthe 231 top 7 culture collection isolates possessing eae and stx1–2,ecf1was not detectable. Nine of the 12 non-O157 top 6 isolates lackingecf1 apparently lost the pO157 like plasmidwhile the other 3 non-O157isolates retained the plasmid but lost the coding region for ecf1 andother genes (K.W. Livezey, personal communication). A spontaneousloss of pO157 like plasmids and the 75 kb O104:H4 virulence plasmid,

y = -3.5028x + 47.024
y = -3.394x + 44.065
y = -3.4117x + 46.767
y = -3.2563x + 43.027
15
20
25
30
35
40
0 2 4 6 8 10
Cq
Val
ue
1.25 x log10 CFU/mL
eae BAX
ecf1 BAX
eae FP
ecf1 FP
Fig. 3. Standard curves for the quantification of E. coli O157:H7 strain EDL 932 genomicDNA using the qPCR targets eae and ecf1. Identical standard curves were prepared usingthe BAX® system lysis buffer (BAX) or the spiked pooled feces (PF).
77B.E. Luedtke et al. / Journal of Microbiological Methods 105 (2014) 72–79
pAA, has been observed and attributed to culturing conditions (Gradet al., 2013; Wieler et al., 1996). Culturing and environmental con-ditions have also been associated with the spontaneous loss of stx(Bielaszewska et al., 2007; Karch et al., 1992). Interestingly, it hasbeen shown that isogenic EHECs that have lost stx are capable ofregaining stx via phage transduction (Bielaszewska et al., 2007) whilepO157 is suggested to be nonconjugative (Lim et al., 2010). The geneencoding eae has not been shown to be spontaneously lost during cul-turing nor is it known if the virulence plasmid and stx1–2 can be lostfrom the same cell.
A recent study found the genes Z2098 and Z2099 to be primarilyassociated with EHEC but both markers had a varied detection rangeof 67.6% to 94.9% for Z2098 and 78.6% to 96.8% for Z2099 of the top 7EHEC and emerging EHEC strains (Delannoy et al., 2013a). The addition-almarkers ureD, espV, espK, espN, and espM1were also found to be iden-tifiers of EHEC but had varying detection rates between the top 7 andemerging EHEC serotypes. To overcome the limitations of an individualmarker a combination of espK and ureDwas shown to provide 100% de-tection of the top 7 serotypes and 93.7% detection of emerging EHEC(Delannoy et al., 2013b). However, all of these markers were alsofound in a proportion of EPEC, STEC, and apathogenic E. coli (Delannoyet al., 2013a; 2013b), which may lead to false positives in complexpolymicrobial environmental samples like feces. Overall, using our com-bination of targets for multiplex qPCR is ideal for the detection of EHEC
Table 3Use of three commercial qPCR master mixes for the detection of eae, ecf1, and stx1–2directly from field samples of cattle feces.
TaqMan® EnvironmentalMaster Mix 2.0
GoTaq®Probe qPCR
PerfeCTa® qPCRToughMix®
Sample Target Cq ± SD
S1336 eae 40.23 ± 0.71 ND 36.25 ± 1.10ecf1 39.07 ± 0.63 32.07 ± 0.12 30.71 ± 0.25stx1–2 39.55 ± 0.65 32.41 ± 0.03 30.34 ± 0.31
S1337 eae 39.08 ± 0.14 36.95 ± 0.54 34.64 ± 0.28ecf1 37.86 ± 0.25 34.69 ± 0.20 33.28 ± 0.31stx1–2 ND ND ND
S1346 eae 35.60 ± 0.63 37.03 ± 0.45 30.31 ± 0.25ecf1 33.92 ± 0.48 30.28 ± 0.09 28.81 ± 0.24stx1–2 36.38 ± 0.51 31.94 ± 0.39 29.49 ± 0.33
S1352 eae 37.16 ± 0.19 35.09 ± 0.39 32.14 ± 0.26ecf1 36.47 ± 0.54 33.11 ± 0.04 31.74 ± 0.35stx1–2 36.11 ± 0.55 31.69 ± 0.21 30.37 ± 0.06
S2089 eae 34.10 ± 0.45 32.46 ± 0.3 29.33 ± 0.42ecf1 32.98 ± 0.80 29.82 ± 0.10 28.31 ± 0.08stx1–2 31.18 ± 0.85 27.22 ± 0.05 25.75 ± 0.14
ND = No Detection.
since ecf1 is mutually associated with STEC with eae, which further de-creases the chance for false positives. However, the potential for the lossof ecf1 or stx1–2 during culturing indicates a need for a sensitive assaywith minimal enrichment and subculturing.
Our assay is based on the FSIS MLG 5B Appendix 1.01 protocol(USDA, 2012), but FSIS recently supported the use of the BAX® SystemReal-Time PCR STEC Suite (USDA, 2013) and made the MLG 5B Appen-dix 1.01 and 1.03 protocols an alternative method for STEC detection. Inboth methods a 15 to 24 h enrichment step is required. With the alter-native protocol an extensive DNA extraction process is required whilethe BAX® system utilizes a lysis buffer, which is described here. Byusing the BAX® system lysis buffer, a sample can be directly added sotemplate DNA is not lost or mechanically damaged during the purifica-tion process, which can occur with different extraction procedures(Yuan et al., 2012). However, the direct lysis of an environmental fieldsample could introduce qPCR inhibitors into the reaction and wouldbe indicated by an increased PCR efficiency (Kavanagh et al., 2011). Adecrease in PCR efficiency due to the competition for shared reagentscan be observed in multiplex qPCR reactions. Both PCR inhibition andreagent competitionwould lead to a decreased sensitivity and reliabilityof the reaction. In addition, the proprietary composition of commercialmaster mixes can result in significant differences in the resistance toPCR inhibitors and the sensitivity of the reaction (Morgan et al., 2012).
From our evaluation of three commercial master mixes, which wereindicated by themanufacturers to be insensitive to PCR inhibitors, it wasfound that the PerfeCTa® qPCR ToughMix® master mix provided themost sensitive detection and acceptable PCR efficiency of each targetusing spiked BAX® system lysis bufferwith a complex fecal background.With the increased sensitivity, the reliable LOD of 1.25 × 10³ CFUs/mLwas reached in less than 36 cycles. To save run time, it would be possi-ble to decrease the number of cycles indicated by the FSIS method from45 to 40. The PerfeCTa® qPCR ToughMix®master mix also returned thelowest Cq values for each of the targets from five field samples. Interest-ingly, the field sample S1337 was consistently negative between thethree master mixes for stx1–2 despite having detectable amounts ofeae and ecf1 and culture confirmedO26 andO157 EHEC isolates. SampleS1337 could have stx1–2 copies below the detectable level while thecombined amount of eae and ecf1 from the O26 and O157 could bemaintained above the LOD. In addition, K.W. Livezey (personal commu-nication) has found isolates that are positive for eae and ecf1 but lackedstx1–2 and the typical enteropathogenic E. coli (EPEC) marker bundle-forming pili (bfpA), which suggests that these isolates are atypicalEPECs. With the presence of infectious stx-converting bacteriophagesin the environment, including ground beef, it cannot be overlookedthat atypical EPECs could regain stx under favorable conditions andcause disease (Martinez-Castillo et al., 2013). This linkage of ecf1 withEHEC and atypical EPECs further highlights the utility of our multiplexqPCR assay not to limit positive samples to those possessing a combina-tion of eae, stx1–2, and a targeted serotype, which could cause falsepositives or misidentify a potential EHEC as an EPEC. However, fecalsampleswith detectable amounts of eae and stx1–2 should be further in-vestigated for possible EHEC as the ecf1 containing virulence plasmidcould have been lost in the environment or the strain(s) did not possessthe plasmid.
With the ability to directly detect ecf1 in cattle feces, we investigatedthe use of qPCR to enumerate EHEC directly from cattle feces. Sincestx1–2 has an increased propensity over eae to be associated with back-groundmicroflora (Renter et al., 2005) and can be transiently lost in theenvironment (Bielaszewska et al., 2007),we chose to target eae and ecf1in a duplex qPCR reaction. Since ecf1 resides on a plasmid the plasmidcopy number could affect the EHEC enumeration. In addition, little isknown about the plasmid copy number of pO157 and pO157 like plas-mids between serogroups. Amongst the 34 top 7 serotypes, we foundthat the plasmid copy number ranged from 5 to 3 copies with a meanof 4 copies per genome by using our duplex qPCR assay. However, byusing direct sequencing analysis of another set of EHEC isolates, we
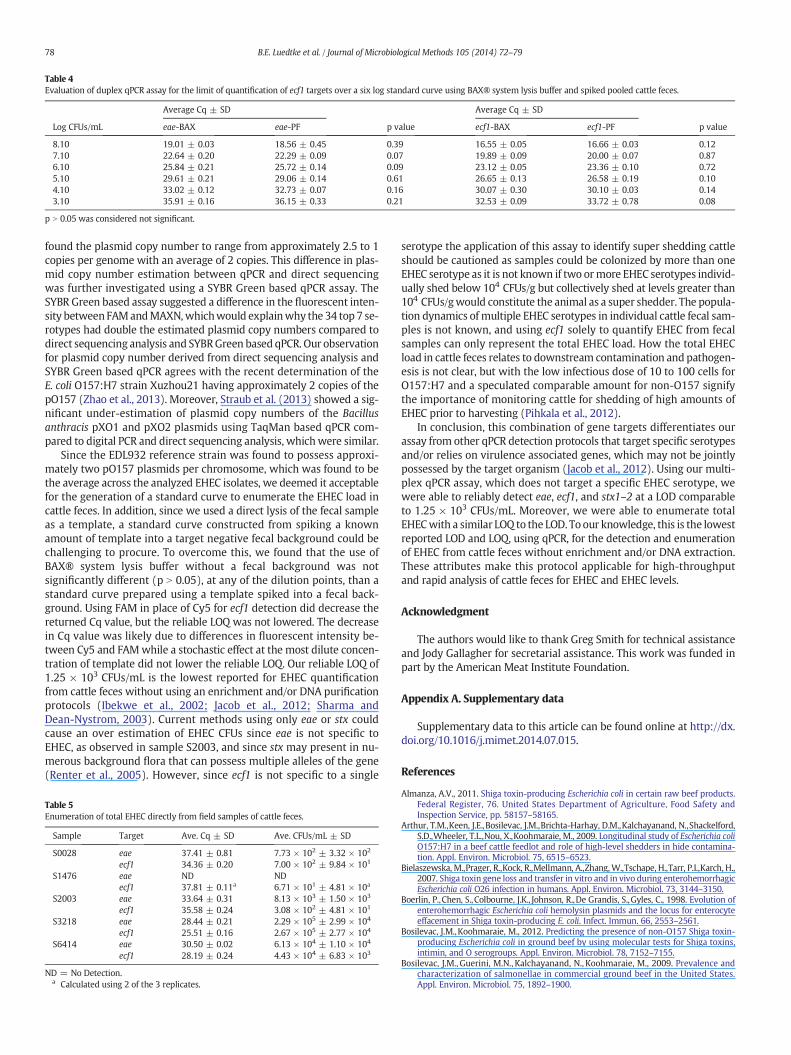
Table 4Evaluation of duplex qPCR assay for the limit of quantification of ecf1 targets over a six log standard curve using BAX® system lysis buffer and spiked pooled cattle feces.
Average Cq ± SD Average Cq ± SD
Log CFUs/mL eae-BAX eae-PF p value ecf1-BAX ecf1-PF p value
8.10 19.01 ± 0.03 18.56 ± 0.45 0.39 16.55 ± 0.05 16.66 ± 0.03 0.127.10 22.64 ± 0.20 22.29 ± 0.09 0.07 19.89 ± 0.09 20.00 ± 0.07 0.876.10 25.84 ± 0.21 25.72 ± 0.14 0.09 23.12 ± 0.05 23.36 ± 0.10 0.725.10 29.61 ± 0.21 29.06 ± 0.14 0.61 26.65 ± 0.13 26.58 ± 0.19 0.104.10 33.02 ± 0.12 32.73 ± 0.07 0.16 30.07 ± 0.30 30.10 ± 0.03 0.143.10 35.91 ± 0.16 36.15 ± 0.33 0.21 32.53 ± 0.09 33.72 ± 0.78 0.08
p N 0.05 was considered not significant.
78 B.E. Luedtke et al. / Journal of Microbiological Methods 105 (2014) 72–79
found the plasmid copy number to range from approximately 2.5 to 1copies per genome with an average of 2 copies. This difference in plas-mid copy number estimation between qPCR and direct sequencingwas further investigated using a SYBR Green based qPCR assay. TheSYBR Green based assay suggested a difference in the fluorescent inten-sity between FAMandMAXN,whichwould explainwhy the 34 top 7 se-rotypes had double the estimated plasmid copy numbers compared todirect sequencing analysis and SYBRGreen based qPCR. Our observationfor plasmid copy number derived from direct sequencing analysis andSYBR Green based qPCR agrees with the recent determination of theE. coli O157:H7 strain Xuzhou21 having approximately 2 copies of thepO157 (Zhao et al., 2013). Moreover, Straub et al. (2013) showed a sig-nificant under-estimation of plasmid copy numbers of the Bacillusanthracis pXO1 and pXO2 plasmids using TaqMan based qPCR com-pared to digital PCR and direct sequencing analysis, whichwere similar.
Since the EDL932 reference strain was found to possess approxi-mately two pO157 plasmids per chromosome, which was found to bethe average across the analyzed EHEC isolates, we deemed it acceptablefor the generation of a standard curve to enumerate the EHEC load incattle feces. In addition, since we used a direct lysis of the fecal sampleas a template, a standard curve constructed from spiking a knownamount of template into a target negative fecal background could bechallenging to procure. To overcome this, we found that the use ofBAX® system lysis buffer without a fecal background was notsignificantly different (p N 0.05), at any of the dilution points, than astandard curve prepared using a template spiked into a fecal back-ground. Using FAM in place of Cy5 for ecf1 detection did decrease thereturned Cq value, but the reliable LOQ was not lowered. The decreasein Cq value was likely due to differences in fluorescent intensity be-tween Cy5 and FAMwhile a stochastic effect at the most dilute concen-tration of template did not lower the reliable LOQ. Our reliable LOQ of1.25 × 103 CFUs/mL is the lowest reported for EHEC quantificationfrom cattle feces without using an enrichment and/or DNA purificationprotocols (Ibekwe et al., 2002; Jacob et al., 2012; Sharma andDean-Nystrom, 2003). Current methods using only eae or stx couldcause an over estimation of EHEC CFUs since eae is not specific toEHEC, as observed in sample S2003, and since stx may present in nu-merous background flora that can possess multiple alleles of the gene(Renter et al., 2005). However, since ecf1 is not specific to a single
Table 5Enumeration of total EHEC directly from field samples of cattle feces.
Sample Target Ave. Cq ± SD Ave. CFUs/mL ± SD
S0028 eae 37.41 ± 0.81 7.73 × 10² ± 3.32 × 10²
ecf1 34.36 ± 0.20 7.00 × 10² ± 9.84 × 101
S1476 eae ND NDecf1 37.81 ± 0.11a 6.71 × 101 ± 4.81 × 10a
S2003 eae 33.64 ± 0.31 8.13 × 10³ ± 1.50 × 10³
ecf1 35.58 ± 0.24 3.08 × 10² ± 4.81 × 101
S3218 eae 28.44 ± 0.21 2.29 × 10⁵ ± 2.99 × 10⁴
ecf1 25.51 ± 0.16 2.67 × 10⁵ ± 2.77 × 10⁴
S6414 eae 30.50 ± 0.02 6.13 × 10⁴ ± 1.10 × 10⁴
ecf1 28.19 ± 0.24 4.43 × 10⁴ ± 6.83 × 10³
ND = No Detection.a Calculated using 2 of the 3 replicates.
serotype the application of this assay to identify super shedding cattleshould be cautioned as samples could be colonized by more than oneEHEC serotype as it is not known if two ormore EHEC serotypes individ-ually shed below 104 CFUs/g but collectively shed at levels greater than104 CFUs/gwould constitute the animal as a super shedder. The popula-tion dynamics of multiple EHEC serotypes in individual cattle fecal sam-ples is not known, and using ecf1 solely to quantify EHEC from fecalsamples can only represent the total EHEC load. How the total EHECload in cattle feces relates to downstream contamination and pathogen-esis is not clear, but with the low infectious dose of 10 to 100 cells forO157:H7 and a speculated comparable amount for non-O157 signifythe importance of monitoring cattle for shedding of high amounts ofEHEC prior to harvesting (Pihkala et al., 2012).
In conclusion, this combination of gene targets differentiates ourassay from other qPCR detection protocols that target specific serotypesand/or relies on virulence associated genes, which may not be jointlypossessed by the target organism (Jacob et al., 2012). Using our multi-plex qPCR assay, which does not target a specific EHEC serotype, wewere able to reliably detect eae, ecf1, and stx1–2 at a LOD comparableto 1.25 × 10³ CFUs/mL. Moreover, we were able to enumerate totalEHECwith a similar LOQ to the LOD. To our knowledge, this is the lowestreported LOD and LOQ, using qPCR, for the detection and enumerationof EHEC from cattle feces without enrichment and/or DNA extraction.These attributes make this protocol applicable for high-throughputand rapid analysis of cattle feces for EHEC and EHEC levels.
Acknowledgment
The authors would like to thank Greg Smith for technical assistanceand Jody Gallagher for secretarial assistance. This work was funded inpart by the American Meat Institute Foundation.
Appendix A. Supplementary data
Supplementary data to this article can be found online at http://dx.doi.org/10.1016/j.mimet.2014.07.015.
References
Almanza, A.V., 2011. Shiga toxin-producing Escherichia coli in certain raw beef products.Federal Register, 76. United States Department of Agriculture, Food Safety andInspection Service, pp. 58157–58165.
Arthur, T.M.,Keen, J.E.,Bosilevac, J.M.,Brichta-Harhay, D.M.,Kalchayanand, N.,Shackelford,S.D.,Wheeler, T.L.,Nou, X.,Koohmaraie, M., 2009. Longitudinal study of Escherichia coliO157:H7 in a beef cattle feedlot and role of high-level shedders in hide contamina-tion. Appl. Environ. Microbiol. 75, 6515–6523.
Bielaszewska, M.,Prager, R.,Kock, R.,Mellmann, A.,Zhang,W.,Tschape, H.,Tarr, P.I.,Karch, H.,2007. Shiga toxin gene loss and transfer in vitro and in vivo during enterohemorrhagicEscherichia coli O26 infection in humans. Appl. Environ. Microbiol. 73, 3144–3150.
Boerlin, P.,Chen, S.,Colbourne, J.K., Johnson, R.,De Grandis, S.,Gyles, C., 1998. Evolution ofenterohemorrhagic Escherichia coli hemolysin plasmids and the locus for enterocyteeffacement in Shiga toxin-producing E. coli. Infect. Immun. 66, 2553–2561.
Bosilevac, J.M.,Koohmaraie, M., 2012. Predicting the presence of non-O157 Shiga toxin-producing Escherichia coli in ground beef by using molecular tests for Shiga toxins,intimin, and O serogroups. Appl. Environ. Microbiol. 78, 7152–7155.
Bosilevac, J.M., Guerini, M.N., Kalchayanand, N., Koohmaraie, M., 2009. Prevalence andcharacterization of salmonellae in commercial ground beef in the United States.Appl. Environ. Microbiol. 75, 1892–1900.
79B.E. Luedtke et al. / Journal of Microbiological Methods 105 (2014) 72–79
Buchholz, U.,Bernard, H.,Werber, D.,Bohmer, M.M.,Remschmidt, C.,Wilking, H.,Delere, Y.,an der Heiden, M.,Adlhoch, C.,Dreesman, J.,Ehlers, J.,Ethelberg, S.,Faber, M.,Frank, C.,Fricke, G.,Greiner, M.,Hohle, M., Ivarsson, S., Jark, U.,Kirchner, M.,Koch, J.,Krause, G.,Luber, P., Rosner, B., Stark, K., Kuhne, M., 2011. German outbreak of Escherichia coliO104:H4 associated with sprouts. N. Engl. J. Med. 365, 1763–1770.
Cobbold, R.N.,Hancock, D.D.,Rice, D.H., Berg, J., Stilborn, R.,Hovde, C.J., Besser, T.E., 2007.Rectoanal junction colonization of feedlot cattle by Escherichia coli O157:H7 and itsassociation with super shedders and excretion dynamics. Appl. Environ. Microbiol.73, 1563–1568.
Delannoy, S.,Beutin, L.,Fach, P., 2013a. Towards amolecular definition of enterohemorrhagicEscherichia coli (EHEC): detection of genes located on O island 57 as markers to distin-guish EHEC from closely related enteropathogenic E. coli strains. J. Clin. Microbiol. 51,1083–1088.
Delannoy, S., Beutin, L., Fach, P., 2013b. Discrimination of enterohemorrhagic Escherichiacoli (EHEC) from non-EHEC strains based on detection of various combinations oftype III effector genes. J. Clin. Microbiol. 51, 3257–3262.
Erickson, M.C., Doyle, M.P., 2007. Food as a vehicle for transmission of Shiga toxin-producing Escherichia coli. J. Food Prot. 70, 2426–2449.
Fox, J.T., Renter, D.G., Sanderson, M.W., Thomson, D.U., Lechtenberg, K.F.,Nagaraja, T.G.,2007. Evaluation of culture methods to identify bovine feces with high concentra-tions of Escherichia coli O157. Appl. Environ. Microbiol. 73, 5253–5260.
Goldwater, P.N., Bettelheim, K.A., 2012. Treatment of enterohemorrhagic Escherichia coli(EHEC) infection and hemolytic uremic syndrome (HUS). BMC Med. 10, 12.
Grad, Y.H.,Godfrey, P.,Cerquiera, G.C.,Mariani-Kurkdjian, P.,Gouali, M.,Bingen, E.,Shea, T.P.,Haas, B.J.,Griggs, A.,Young, S.,Zeng, Q.,Lipsitch,M.,Waldor,M.K.,Weill, F.X.,Wortman, J.R.,Hanage,W.P., 2013. Comparative genomics of recent Shiga toxin-producing EscherichiacoliO104:H4: short-term evolution of an emerging pathogen. mBio 4 (e00452-00412).
Groschel, B.,Becker, M.M., 2013. Monitoring Shiga Toxin Producing Escherichia coli (Inter-national, publication number WO2013/102218 A1).
Gyles, C.L., 2007. Shiga toxin-producing Escherichia coli: an overview. J. Anim. Sci. 85,E45–E62.
Ibekwe, A.M.,Watt, P.M.,Grieve, C.M.,Sharma, V.K.,Lyons, S.R., 2002. Multiplex fluorogenicreal-time PCR for detection and quantification of Escherichia coli O157:H7 in dairywastewater wetlands. Appl. Environ. Microbiol. 68, 4853–4862.
Jacob, M.E., Renter, D.G., Nagaraja, T.G., 2010. Animal- and truckload-level associationsbetween Escherichia coli O157:H7 in feces and on hides at harvest and contaminationof preevisceration beef carcasses. J. Food Prot. 73, 1030–1037.
Jacob, M.E., Shi, X.,An, B.,Nagaraja, T.G., Bai, J., 2012. Evaluation of a multiplex real-timepolymerase chain reaction for the quantification of Escherichia coli O157 in cattlefeces. Foodborne Pathog. Dis. 9, 79–85.
Jinneman, K.C., Yoshitomi, K.J.,Weagant, S.D., 2003. Multiplex real-time PCR method toidentify Shiga toxin genes stx1 and stx2 and Escherichia coli O157:H7/H-serotype.Appl. Environ. Microbiol. 69, 6327–6333.
Kalchayanand, N.,Arthur, T.M.,Bosilevac, J.M.,Wells, J.E.,Wheeler, T.L., 2013. Chromogenicagar medium for detection and isolation of Escherichia coli serogroups O26, O45,O103, O111, O121, and O145 from fresh beef and cattle feces. J. Food Prot. 76,192–199.
Karch, H.,Meyer, T., Russmann, H.,Heesemann, J., 1992. Frequent loss of Shiga-like toxingenes in clinical isolates of Escherichia coli upon subcultivation. Infect. Immun. 60,3464–3467.
Kavanagh, I., Jones, G.,Nayab, S.N., 2011. Significance of controls and standard curves inPCR. In: Kennedy, S., Oswald, N. (Eds.), PCR Troubleshooting and Optimization: TheEssential Guide. Horizon Scientific Press, Norfolk, UK, pp. 67–78.
Lim, J.Y.,Yoon, J.,Hovde, C.J., 2010. A brief overview of Escherichia coli O157:H7 and itsplasmid O157. J. Microbiol. Biotechnol. 20, 5–14.
Lorenz, S.C.,Son, I.,Maounounen-Laasri, A.,Lin, A.,Fischer, M.,Kase, J.A., 2013. Prevalence ofhemolysin genes and comparison of ehxA subtype patterns in Shiga toxin-producingEscherichia coli (STEC) and non-STEC strains from clinical, food, and animal sources.Appl. Environ. Microbiol. 79, 6301–6311.
Martinez-Castillo, A., Quiros, P., Navarro, F.,Miro, E.,Muniesa, M., 2013. Shiga toxin 2-encoding bacteriophages in human fecal samples from healthy individuals. Appl. En-viron. Microbiol. 79, 4862–4868.
Mathusa, E.C., Chen, Y., Enache, E., Hontz, L., 2010. Non-O157 Shiga toxin-producingEscherichia coli in foods. J. Food Prot. 73, 1721–1736.
Matthews, L.,Low, J.C.,Gally, D.L.,Pearce, M.C.,Mellor, D.J.,Heesterbeek, J.A.,Chase-Topping, M.,Naylor, S.W.,Shaw, D.J.,Reid, S.W.,Gunn, G.J.,Woolhouse, M.E., 2006. Heterogeneousshedding of Escherichia coli O157 in cattle and its implications for control. Proc. Natl.Acad. Sci. U. S. A. 103, 547–552.
Menrath, A.,Wieler, L.H.,Heidemanns, K., Semmler, T., Fruth, A., Kemper, N., 2010. Shigatoxin producing Escherichia coli: identification of non-O157:H7-super-sheddingcows and related risk factors. Gut Pathog. 2, 7.
Morgan, J.K.,Zhou, L., Li, W.,Shatters, R.G.,Keremane, M.,Duan, Y.P., 2012. Improved real-time PCR detection of ‘Candidatus Liberibacter asiaticus’ from citrus and psyllid hostsby targeting the intragenic tandem-repeats of its prophage genes. Mol. Cell. Probes26, 90–98.
Ogura, Y., Ooka, T., Iguchi, A., Toh, H., Asadulghani, M., Oshima, K., Kodama, T., Abe, H.,Nakayama, K.,Kurokawa, K.,Tobe, T.,Hattori, M.,Hayashi, T., 2009. Comparative geno-mics reveal the mechanism of the parallel evolution of O157 and non-O157enterohemorrhagic Escherichia coli. Proc. Natl. Acad. Sci. U. S. A. 106, 17939–17944.
Paton, A.W.,Paton, J.C., 1999. Direct detection of Shiga toxigenic Escherichia coli strains be-longing to serogroups O111, O157, and O113 by multiplex PCR. J. Clin. Microbiol. 37,3362–3365.
Pihkala, N.,Bauer, N.,Eblen, D.,Evans, P.,Johnson, R.,Webb, J.,Williams, C., 2012. Risk Profilefor Pathogenic Non-O157 Shiga Toxin-Producing Escherichia coli (Non-O157 STEC).Office of Public Health Science, Office of Policy and ProgramDevelopment, Food Safe-ty and Inspection Service, United States Department of Agriculture (Available at:http://www.fsis.usda.gov/PDF/Non_O157_STEC_Risk_Profile_May2012.pdf, accessed6 January 2014).
Rasko, D.A.,Rosovitz, M.J.,Okstad, O.A., Fouts, D.E., Jiang, L.,Cer, R.Z.,Kolsto, A.B.,Gill, S.R.,Ravel, J., 2007. Complete sequence analysis of novel plasmids from emetic and peri-odontal Bacillus cereus isolates reveals a common evolutionary history among theB. cereus-group plasmids, including Bacillus anthracis pXO1. J. Bacteriol. 189, 52–64.
Renter, D.G.,Morris Jr., J.G.,Sargeant, J.M.,Hungerford, L.L.,Berezowski, J.,Ngo, T.,Williams, K.,Acheson, D.W., 2005. Prevalence, risk factors, O serogroups, and virulence profiles ofShiga toxin-producing bacteria from cattle production environments. J. Food Prot.68, 1556–1565.
Sharma, V.K.,Dean-Nystrom, E.A., 2003. Detection of enterohemorrhagic Escherichia coliO157:H7 by using a multiplex real-time PCR assay for genes encoding intimin andShiga toxins. Vet. Microbiol. 93, 247–260.
Skulj, M.,Okrslar, V., Jalen, S., Jevsevar, S., Slanc, P., Strukelj, B.,Menart, V., 2008. Improveddetermination of plasmid copy number using quantitative real-time PCR for monitor-ing fermentation processes. Microb. Cell Factories 7, 6.
Straub, T., Baird, C., Bartholomew, R.A., Colburn, H., Seiner, D., Victry, K., Zhang, L.,Bruckner-Lea, C.J., 2013. Estimated copy number of Bacillus anthracis plasmids pXO1and pXO2 using digital PCR. J. Microbiol. Methods 92, 9–10.
Sugiyama, K., Inoue, K., Sakazaki, R., 2001. Mitomycin-supplemented washed blood agarfor the isolation of Shiga toxin-producing Escherichia coli other than O157:H7. Lett.Appl. Microbiol. 33, 193–195.
USDA, 2012. Primer and probe sequences and reagent concentrations for non-O157 Shigatoxin-producing Escherichia coli (STEC) real-time PCR assay. Microbiology LaboratoryGuidebook. Food Safety and Inspection Service, Office of Public Health Science, USDA,Athens, GA (http://www.fsis.usda.gov/PDF/MLG_5B_Appendix_1_01.pdf. Accessed 1November 2013).
USDA, 2013. Detection and isolation of non-O157 Shiga toxin-producing Escherichia coli(STEC) frommeat products and carcass and environmental sponges. Microbiology Lab-oratory Guidebook. Food Safety and Inspection Service, Office of Public Health Science,USDA, Athens, GA (http://www.fsis.usda.gov/wps/wcm/connect/7ffc02b5-3d33-4a79-b50c-81f208893204/MLG-5B.pdf?MOD=AJPERES. Accessed 1 November 2013).
Walker, C.,Shi, X.,Sanderson, M.,Sargeant, J.,Nagaraja, T.G., 2010. Prevalence of Escherichiacoli O157:H7 in gut contents of beef cattle at slaughter. Foodborne Pathog. Dis. 7,249–255.
Wasilenko, J.L.,Fratamico, P.M.,Narang, N.,Tillman, G.E.,Ladely, S.,Simmons, M.,Cray Jr., W.C.,2012. Influence of primer sequences and DNA extraction method on detection of non-O157 Shiga toxin-producing Escherichia coli in ground beef by real-time PCR targetingthe eae, stx, and serogroup-specific genes. J. Food Prot. 75, 1939–1950.
Wieler, L.H., Tigges, M., Ebel, F., Schaferkordt, S., Djafari, S., Schlapp, T., Baljer, G.,Chakraborty, T., 1996. The enterohemolysin phenotype of bovine Shiga-like toxin-producing Escherichia coli (SLTEC) is encoded by the EHEC-hemolysin gene. Vet.Microbiol. 52, 153–164.
Yuan, S., Cohen, D.B., Ravel, J., Abdo, Z., Forney, L.J., 2012. Evaluation of methods for theextraction and purification of DNA from the humanmicrobiome. PLoS ONE 7, e33865.
Zhao, H.,Chen, C.,Xiong, Y.,Xu, X.,Lan, R.,Wang, H.,Yao, X.,Bai, X.,Liu, X.,Meng, Q.,Zhang, X.,Sun, H.,Zhao, A.,Bai, X.,Cheng, Y.,Chen, Q.,Ye, C.,Xu, J., 2013. Global transcriptional andphenotypic analyses of Escherichia coli O157:H7 strain Xuzhou21 and its pO157_Salcured mutant. PLoS ONE 8, e65466.
http://www.fsis.usda.gov/wps/wcm/connect/7ffc02b5-3d33-4a79-b50c-81f208893204/MLG-5B.pdf?MOD=AJPERES