Roadmap-Based Path Planning - Using the Voronoi Diagram for a Clearance-Based Shortest Path
EVALUATION OF PUBLIC PARK LOCATION USING VORONOI DIAGRAM
Pawinee Iamtrakul1) Kardi Teknomo2) and Kazunori HoKao3)
1) Department of Civil Engineering, Saga University 1 Honjo-machi, Saga-shi 840-8502, Japan
E-mail: [email protected] 2) Institute of Lowland Technology
1 Honjo-machi, Saga-shi 840-8502, Japan E-mail: [email protected]
3) Department of Civil Engineering, Saga University 1 Honjo-machi, Saga-shi 840-8502, Japan
E-mail: [email protected]
Abstract. Park is one of the representatives of green spaces that have been recently given much attention as an indicator of urban quality of life. Evaluation of parks needs to be measured to guarantee the effectiveness of service. To reach the ultimate aim of public service provision, the issue of equality of service is becoming significantly important. Several criteria in urban planning for equality of service have been applied to evaluate the utilization of park. Transportation is one of the meaningful criteria since parks provide fixed services that create a tapering effect due to the distance. This study proposes a new approach to measure the equality of public park service by considering the distribution of parks on the transportation point of view using Voronoi Diagram. This concept is based on the relative opportunity for interaction with users to parks specifically relate to the ease to obtain the service. Three main indicators are developed to evaluate the appropriateness of the location of parks within the boundary of service area from Voronoi Diagram that are transportation network, public transport and pedestrian accessibility. By employing this relatively simple method, the size of park can be also incorporated to evaluate the existing of park location and recommend for the suitable location of new park. The results indicated that different location of parks ascertains different accessibility level that need for substantial improvements to maximize access of park. The new approach enables the agencies to function more effectively and to provide better levels of service to community.
INTRODUCTION
As an increasing in the development of technology, many cities have become industrialize and increasingly urbanized societies. Many impacts also have been arising as a resulting from such a development in many areas such as economic, society, environmental and etc. Therefore, the key indicator to measure the quality of life has turned into necessary element to reflect and assess the urban life of the people. It has led to initiatives to identify the quality of life in urban areas in many aspects that has been presented as a means to compare the urban quality. Among all aspects, healthy air, a quiet neighborhood, an attractive street scene and green spaces have been given much attention in the development of indicators for urban liveability. Public park is one kind of green space that provides numerous amenities for nearby residents including recreation opportunities and attractive views. The presence of park creates social benefits to the community that offer to everyone, from kids and teens to the elderly and also can be a cohesive force in a neighborhood. As well as in the view point of economic benefits, park also generate positive impacts on local businesses, real estate and etc. In addition, for the environmental benefits itself, park also provide a community gardens, greenways and other types of urban open space that are significantly improve air,

water and etc. However, the concept of quality of life is applied to evaluate the service of public park that concerns the patterns of inequitable advantages and opportunities that affect each residents through accessibility to services, facilities and amenities. Since park is fixed public facility that users have to travel in order to consume the public output or service. The consumers’ benefits or the benefit that residents can obtain are now dependent on the distance to supply point. It directs to the allocation problem to locate the facility that should be corresponding to guarantee the equal level of service to the residents in the neighborhood area. Therefore, this study proposes new approach to measure the equality of public park service by using Voronoi Diagram. This follows from the fact that the facility should be placed in some optimal manner with respect to all users’ location. The equality for the locational decision process in here requires the use of a particular social utility function according to distance and destination attractiveness. By employing this relatively simple method from Voronoi Diagram, the size of park and transportation point of view can be also incorporated together to evaluate the existing of park location and recommend for the suitable location of new park. The primary goal of this research was to develop and apply transportation indicators for progress towards sustainable green supply to the community. Three main indicators are developed to evaluate the appropriateness of the park location that are transportation network, public transport and pedestrian accessibility. By incorporate with a very interesting property found from Voronoi Diagram that can be utilized to address equality of service by demonstrated the users’ utility in the diagram and compare to the neighborhood location of service. This method may offer a new approach to strengthen the weak position of green spaces in the context of current planning efforts to improve the quality of life for residents in term of equality of park service. The structure of this paper is organized as follows. First, the suggested method for evaluation public park service is presented and the relevant literature is reviewed in the next section. Following that, a number of basic principles and assumptions to guide the development of an indicator for evaluation of park service are given details. The main concepts are subsequently applied in the methodology and illustrated in this section. Then, the Hypothetical data are applied for application and analysis section. Finally, the conclusion of this study is concluded and discussed for future research.
LITERATURE REVIEW
From the reason that park is one kind of public facility, there have been many techniques that are available to evaluate public service. Thisse and Zoller (1983) defined public services as local public goods that each of them can be consumed at the same level by all members of a local community. However, the utility that the consumers or residents can be attainable is related to distance or transportation costs between residence and facilities as a result of fixed spatial distribution of facility. Since the consumers differ only in their residential location and, as a consequence, in their preferences with respect to the location of facilities to be established. Therefore, individuals at different locations will not enjoy the same level of utility (Baudewyns, 2000). To take into a proper account the different users’ propensities, Modelti and Sciomachen (1998) purposed method to make use of an ad hoc utility function for weighing the links both with their cost and time and considering at the same time the preference of the users related to all the possible transportation modalities. As well as the attractiveness of destination also play an important role for users’ decision to travel to park. Zhang et al. (2003) studied the individual choice behavior by consider attractiveness of destination as one of the influenced attributes the relative multinomial logit model.

The benefit to users from utility is not only one ultimate aim of public facility planning. The issue of equity is also becoming important and it is motivated by several potential applications. Based on the fact that the dispersion of the distribution of distances from facility to all users should be equally distribute (Lopez-de-los-Mozos and Mesa, 2001). From this point of view, the equality objective function that is synonymous terms of equity is applied to measure the equality of utility from different park location and the resultant problems attempt to minimize such an inequity by introducing some improvement policy. In this way, several authors suggested that the facility should place by combining both equality and efficiency criteria for an optimal location. Okabe and Suzuki (1997) proposed one of a class of location optimization problems that can be solved through a common geometrical diagram, called the Voronoi Diagram. This measurement provide more realistic result than traditional approach in term of equality since the evaluation of existing park or the allocation of new park can be identified based on the nearest centre in term of Euclidean distance. Furthermore the resulting of computation can be also demonstrated graphically by formally defining Voronoi Diagram and straightforward interpreted (South and Boots, 1999).
CONCEPTS AND DEFINITIONS Due to the multiobjective nature of many optimization problems in the area of public facility location, transportation plays an important role since there is the strongly interaction between land use and transportation in urban planning. This study employs many concepts from different areas to incorporate for the evaluation of park location process. The principles to guide the development of indicators as well as their integration within the study approach are summarized. Furthermore, the following is not only an attempt to clarify these principles but also special attention is paid to the terms accessibility and attractiveness of facility because of the central roles they play in the overall concept. Basic principles It is usually assumed that in multiobjective analysis the objectives are in conflict; therefore, in general, there is no single optimal solution, but rather a set of nondominated or noninferior solutions, denoted Pareto optimal solutions, from which the decision maker must select the most preferred one, or the best compromise solution (Modesti and Sciomachen, 1998). In this paper we deal with multiobjective path planning problem modeled on networks representing urban multimodal transportation systems to evaluate public park location based on Voronoi Diagram concept. In particular, the optimal O-D paths to park location in urban areas where transportation network, public and pedestrian transportation modalities are consider, with the aim of minimizing the over cost, time and discommodity of the users. The following three modes of transportation of traveling to park are considered:
• Transportation network, i.e. users in this networks are car drivers; • Public transportation, i.e. users in the public network go from their residents to park by bus; • Pedestrian, i.e. users move into the pedestrian network by walking.
Since the main aim of this study is to propose a measurement of equality of park service based on the utility of park facility with respect to the accessibility of the given transportation modalities and the attractiveness of park. In order to reach to ultimate aim of this study, two main concepts are introduced as follows:
• The proposed utility measure • Transportation modalities • Voronoi Diagram

The proposed utility measure Random utility model is proposed in this study due to the reason that it provides the means for the transformation of assumptions about desires into a demand function expressing the action of consumer under given circumstances (Ben-Akiva, 1985). The utility that users obtain from travel to park on the shortest path from their resident location is considered as the random utility and may be represented by
ininin VU ε+= (1)
where Uin is the utility value of users to visit park; Vin is called the systematic components or representative of utility i; εin is the random parts of each users. In this paper, a systematic utility can be represented as the means of Uin that are assumed to be deterministic. Then, the reasonable function form for Vin in term of utility function is selected to appropriately define the coefficient of each variables. Here, the linear systematic utility is adopted for this study from the reason that it can both reflect the various elements in x influence on utility and it is convenient to compute value of parameters. Therefore, the systematic utility is demonstrated as follows:
∑=
=n
iiin xxxxU
121 ),...,,( β (2)
where xi is the value of ith attribute and βi is the coefficient of xi. As mentioned earlier that individuals will evaluate their own choice for travel to park by consider accessibility and attractiveness of park as theirs attributes. Not only the parameters β1,β2,…, βi are assumed the same for all members of the population but the users also has a utility function which he/she wants to maximize. In this way, the variables x1, x2,…, xi represent value that influence user’s choice. Transportation modalities In order to reach the aim of this study, concept of utility measure is employed to evaluate the public park service. This application is based on the assumption that the accessibility and attractiveness of destination will influence the decision of users to travel to park. Therefore, transportation modalities play an important role as on of the attribute in utility function. This study also applied classical shortest path to capture all possible transportation mode and interconnection among them for users’ traveling to park. This optimal path corresponds to users’ preferences that try to minimize both transportation cost and time. To illustrate the interaction of users on network, the geometry of the transportation system that consist of nodes and links are developed for useful identification. The following definitions and assumptions for all three modalities on their optimal path are denoted to derive the utility for public park service.
• The geometry of transportation (G): this model include set of nodes (N) representing centroids of urban area and the segment between them are links (L) connecting node i to node j, G = (N,L);
• Transportation network (GC): the O-D paths are determined on users who travel on network to park by using passenger cars, GC = (NC,LC);
• Public transportation (GB): the O-D paths are determined on users who select public transportation for traveling to park, in here is bus, GB = (NB,LB);
• Pedestrian (GP): the O-D paths are determined on users who prefer to visit park by walking, GP = (NP,LP).
The interchanging between car and bus to walking mode are allowed since the walking mode is used as connection between resident location and bus stop or parking, e.g. I1 = NC∩NP ≠ ∅ and I2 = NB∩NP ≠ ∅. This is from the reason that there is the possibility of commuting between networks. Further more the interchanging from public transportation and walking to passenger car are not allowed since it is assumed

that users without car will select public mode and walking to travel to park. As well as the users tend not to have modal transition from passenger car to public transportation for their travel. Voronoi Diagram After obtaining the value of utility for each location of park, the concept of voronoi diagram is utilized to evaluate the appropriateness of both existing and proposed park location. Throughout this section, the description of voronoi diagram is introduced as well as the assumptions for the evaluation of park location are assumed as follows. The n park facilities are given in a community and park location is represented as a geometrical object, si which is point and satisfying si∩sj = ∅, i ≠ j. From the assumption that users tend to travel to park which the distance is nearest to them, therefore, the partition of service area of park can be divided by half plane of distance between neighbors of itself (Preparata and Shamos, 1985). It can be represented that residents in location p bounded by service area S occupy shorter distance d to travel to park (si) that is nearer to them than any other park (sj). For this specification, voronoi diagram can be represented by the following notation:
V(service area of park/ location of park/distance to park) = V(S/si/d) (3) In addition, the recommended location of new park can be determined from this implication since it should be located at the most inconvenient place to access the nearest facility. It means that users in that region have to travel on the farthest point in Vi than others.
METHODOLOGY Consider a problem that involves evaluation of park location, the study area with a road network denoted by directed link and origin destination data related to number of trips are given. And it is also assumed that study area can be divided into transportation analysis unit that are known as zones that is compatible to represent the available modalities (Khisty and Lall, 1998). Each zone centroids can be represented as the point at which trips are loaded onto the networks. Each link connected between nodes also has their own associated weight given by time and cost that required traveling from i to j ∈ N. In particular, let t(i,j) be the time weight associated with link (i,j) ∈ L. The optimal path can be identified by minimize the total travel time spent by users on their own modalities. First of all, the attribute of travel time on passenger car to travel along any feasible path to park are considered. The travel time on O-D path can be derived as:
∑+∑===
n
iPCP
n
iCC jPtjitjt
11
1),(),()( (4)
To be more precise, total travel time of passenger car, tC(j) includes the commutation phase from car to walking mode. Since walking time from parking to destination, t1(PCP,jP) should be taken into account as one of travel time component for total travel time of car users, e.g. I1 = NC∩NP ≠ ∅. Second, tB is indicated for travel time spent on public transportation that is users who visit park by bus. It is given by:
∑+∑+∑====
n
iPBP
n
iWBWW
n
iBB jBtBitjitjt
12
11),(),(),()( (5)
For travel time on public transportation, the waiting time at bus stop, tW(iW,BWB) and walking time from bus stop to park, t2(BBP,jP) are included for total travel time of public mode, e.g. I2 = NB∩NP ≠ ∅.. Finally, tP is considered as total walking time and derived from walking time component of other modes that can be given by:

∑=
=n
iPP jitjt
1),()( (6)
To measure the preferable of time variable that is perceived by users, the coefficients βi need to be specified for differentiate each attributes. As the sign of attribute coefficients affecte the magnitude of users’ satisfaction, the reasonable assumption should be carefully assigned. In this paper, the accessibility and attractiveness of park are assumed to influence the choice of traveling to park. Therefore, the functional form for systematic utility, Uj can be denoted as follows:
AttttU WPBCj 54321 βββββ ++++= (7)
Accessibility and attractiveness of park are defined by {tC, tB, tP and tW} and {A}, respectively. First, begin with accessibility attributes, as the value of each attributes increases, the satisfaction of users will decrease. Therefore, the coefficient of travel time attribute should be negative. Let β1 and β2 be coefficient of tC and tB where the value of β1 should be greater than β2. Since the latter is usually considered to be less pleasant to users than the former as time increase that is measured in minutes. Let begin by setting β1 = -0.01, the users feel unpleasant to spend an equal time on bus as twice as much of car, for that reason β2 is equal to -0.02. As far as the walking time is concerned, it is assumed that an average walking time give inconvenience to users than public means time about two times. If time on taking increase, it gives approximately double discomfort as increase of a minute for transit time. It means that β3 =2 β2 , i.e. β3 = -0.04. Now let consider the coefficient of waiting time that is supposed to be the most unsatisfied for users. Consequently, the value of coefficient β4 is assumed to be 1.5 times of β3 that holds β4 = 1.5β3, i.e. β4 = -0.06. The attractiveness of park attribute is assumed to be represented by size of park that depends on both service purpose and service area. According to this reason, park can be classified into four types that are regional parks, area parks, neighborhood parks and pocket parks. These parks vary from large to small size. Consequently, the last attribute corresponds to the size of park is denoted by A. In here, reversing the sign of the corresponding β5 reflects the preference of users regard to size of park unequally. The positive sign means users prefer to travel to larger park since it offers more opportunities to users to get pleasure from various activities. The coefficient β5 is valued to be 0.01 and measured in unit of 104 square meters. Each O-D network that users select to visit park represent the highest utility among other paths. The aggregation is performed to approximate the utility of each park that correspond to the mean value. Ortuzar and Willumsen (1990) stated that the entropy-maximizing approach can be used to generate models of choice maximization. For this reason, in order to maximize the utility of users’ traveling to park, it is required for rationality that indirect utility that is imposed by estimate as an exponential value as follows:
{ } .,...,2,1)exp(,* niUnessattractiveityaccessibilU jj == (8)
In this case, the aggregation of indirect utility is presumed to drive the ordered categorical response to each park as given by Eq. (9). Under the logistic model, the probability of choosing each specific alternative from all set of parks can be performed to identify the proportion of users respect to each location of park. However, this paper is considered only the utility that users perceived from each park from different optimal O-D path on different network.
n
nijAijWtijPtijBtijCt
U jii
j
∑ ⎟⎠⎞⎜
⎝⎛ ++++
= ≠=1
*
)(5)(4)(3)(2)(1exp βββββ
(9)
The utility of park itself can not reflect the equality of park service in the community. Therefore, this study combine both equality and efficiency criteria for evaluate park location. The evaluation can be carried out through the weighted utility value of park service based on the comparative traditional service area (ST) and voronoi service area (SV). The weighted utility value can be formulated in the following manner:
*
)(
)()(, j
jV
jTjW U
SS
UUtilityWeighted = (10)
The proportion of traditional service area and voronoi service area are defined based on the concept of public facility location that park should locate in order to minimize the maximum absolute deviation of users’ travel distance to its location. As well as the service should distribute or cover residents in community area as much as possible since residents should be able to obtain almost the same public service. From this reason, the greater proportion of weight should increase the utility of park. Since the high value of ST reflects the large design service area and in the same time the lower voronoi service area, SV represent the smaller service area base on the distance relative to the adjacent location.
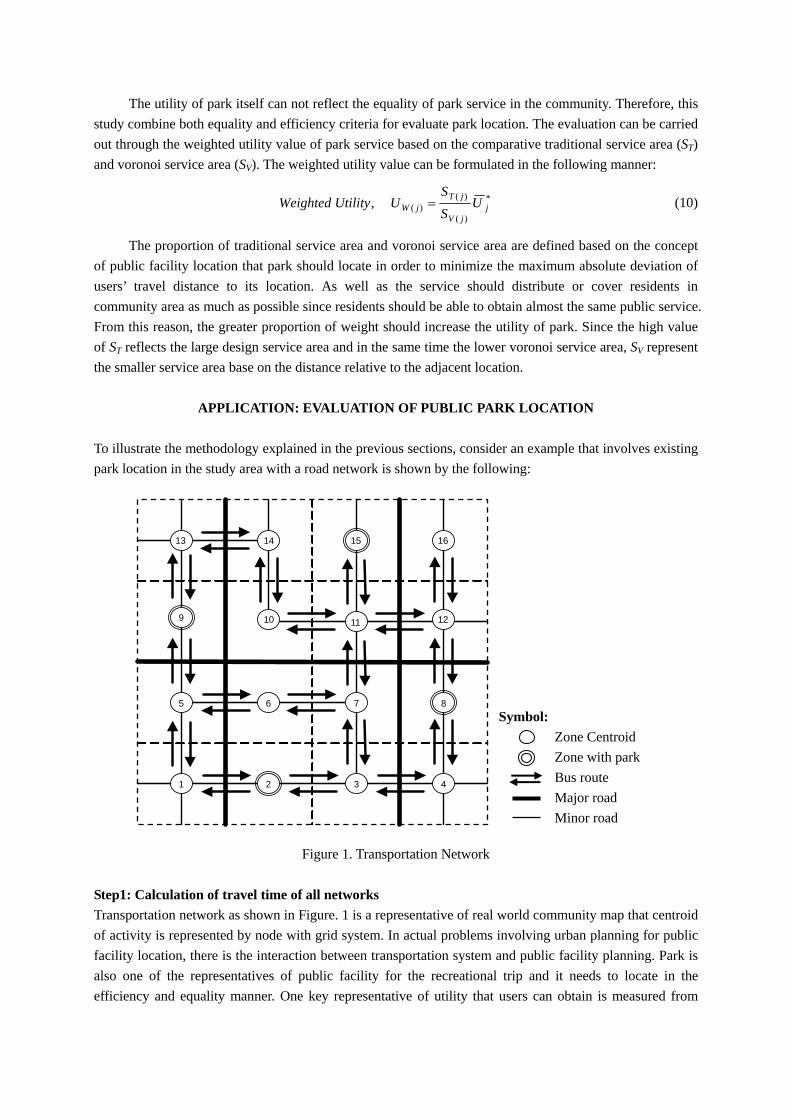
APPLICATION: EVALUATION OF PUBLIC PARK LOCATION To illustrate the methodology explained in the previous sections, consider an example that involves existing park location in the study area with a road network is shown by the following:
Symbol: Zone Centroid
Zone with park Bus route Major road Minor road
13
9
14 16 15
10 12 11
5 6 7 8
1 2 3 4
Figure 1. Transportation Network
Step1: Calculation of travel time of all networks Transportation network as shown in Figure. 1 is a representative of real world community map that centroid of activity is represented by node with grid system. In actual problems involving urban planning for public facility location, there is the interaction between transportation system and public facility planning. Park is also one of the representatives of public facility for the recreational trip and it needs to locate in the efficiency and equality manner. One key representative of utility that users can obtain is measured from

transportation point of view. This study demonstrates the calculation of travel time of users to travel to park based on the network that mentioned earlier. By applying traditional four step model for urban transportation planning, the urban activity in each zone is assumed to quantify number of trip generate. As well as number of trip attracted to various zone in network and the production of them is also set based on the potential of each zone since it depends on the assumption of characteristic and amount of activities taking place among them. In a hypothetical 16 zone city, the distribution of trip can be determined by comparing the relative attractiveness and accessibility of all zones in the network area. Accordingly the optimal path on each alternative transportation services competing to users to travel to park can be derived. To determine travel time on network, BPR method is utilized to attain more reasonable and realistic result under capacity constraint. Before measure the utility of users’ traveling to park, waiting time and walking time (T*(i) ∀ ∈ VC,, VB ) that are concerned for other modality also need to be approximately estimated to complete the availability of data according to the characteristic of each zone. The presented time variable on traveling to each park can be illustrated by Figure.2.
Travel Time to Park1
0102030405060708090
0 1 2 3 4 5 6 7 8 9 10 11 12 13 14 15 16Origin Zone
min
)Ti
me
(
T(car)
T(bus)
Travel Time to Park2
0102030405060708090
0 1 2 3 4 5 6 7 8 9 10 11 12 13 14 15 16Origin Zone
Tim
e (m
in)
T(car)
T(bus)
Travel Time to Park3
0102030405060708090
0 1 2 3 4 5 6 7 8 9 10 11 12 13 14 15 16Origin Zone
min
)e
(Ti
m
T(car)
T(bus)
Travel Time to Park4
0102030405060708090
0 1 2 3 4 5 6 7 8 9 10 11 12 13 14 15 16Origin Zone
Tim
e (m
in)
T(car)
T(bus)
Figure 2. Passenger Car and Transit Travel Time Step2: Calculation of service area of park base on voronoi diagram concept From the reason that public facility deficiencies such as park can not be determined exclusively on only a population basis, it should be balanced with the physical layout of the community in order to meet any locational deficiencies. This study focuses on only neighborhood and area parks within a reasonable distance to their primary service population. It is assumed there are about 2,000 census population numbers with in bordered area of a square of zone. Therefore, the available park in the community can be addressed base on the appropriate service area. Subsequently the calculation of voronoi service area of park can be performed from graphically diagram. The voronoi service area and the traditional service area of existing parks are demonstrated as in Figure. 3.

Park 3
Park 4
Park 2
Park 1
Voronoi Diagram Park 1: Area Park Size = 80.94 x 10³ m2
Service Area = 10 km2
Voronoi Area = 20.25 km2
Park 2: Neighborhood Park Size = 20.23 x 10³ m2
Service Area = 4 km2
Voronoi Area = 12.50 km2
Park 3: Neighborhood Park Size = 40.47 x 10³ m2
Service Area = 5 km2
Voronoi Area = 12.25 km2
Park 4: Area Park Size = 60.70 x 10³ m2
Service Area = 12 km2
Voronoi Area = 18.50 km2
Figure 3. The Comparison of Voronoi Service area and Traditional Service Area of Park
RESULTS
The result as illustrated in Figure 4. present the combination of availability accessibility and attractiveness occupied by each park affect on its utility value. Differentiate of weighted utility values indicate different quality of service. Since not only different park locations ascertain different accessibility level and different attractiveness but their relative distances between adjacent locations also influence the equality of service. It is clearly indicated that in term of efficiency, Park4 has more priority for improvement than others since its utility value is lowest. On the other hand, when apply the equality criteria for evaluation, although Park2 offer high quality of service but this service serve only small portion of the resident neighboring to its location. Therefore, the integration of equality criteria should be considered for more effectively plan.
0
5
10
15
20
25
30
35
40
45
Park1 Park2 Park3 Park4
Tavg(Car),min
Tavg(Bus),min
Tavg(Walking),min
Tavg(Waiting),min
Size (10,000 sq.km.)
Service Area (sq.km.)
Voronoi Area (sq.km.)
SymbolU(4) = 0.1731
UW(4) = 0.1123
U(3) = 0.3301
UW(3) = 0.1347
U(2) = 0.2912
UW(2) = 0.0932
U(1) = 0.2832
UW(1) = 0.1398
Figure 4. The Result of Utility Determination

CONCLUSIONS AND FUTURE RESEARCH The study employed utility concept to measure the satisfaction of users’ traveling to park from the assumption that the satisfaction of users’ traveling to park are influenced by not only accessibility but also attractiveness of park. In addition, Voronoi Diagram is utilized since the quality of service that is perceived to users in term of utility can not reflect the equality of service. Therefore, utility valued is weighted to obtain more realistic and reasonable result from the motivation that deficiencies of green area need for investigation. The advantages of utility model, not only the policy improvement of transportation point of view can be drawn for useful suggestion but also the enhancement of attractiveness of existing park can be estimated. Furthermore, the new location of park can be recommended from the Voronoi Diagram that can indicate the deficiency location of park. Finally, since the benefit function of distance-dependent and attractiveness in term of size of park are not absolutely true because the utility that the users can be obtained is also depend on the other variables such as demographic, socioeconomic and other attractiveness of park. Therefore, it is important to further investigate the real utility function and its parameter to explain the existing service of park in the community from public participation. In addition, GIS also need to be applied since this tool has potential to deal with geographical data and locational analysis. The integration of these schemes can provide fruitful insights about users’ choice behavior to travel to park and to launch more specifically plan according to the requirement of residential.
REFERENCES Baudewyns, D. Spatial Competition within Urban Areas: Hotelling and Bertrand Reconciled, 8th World Congress of the Econometric Society (ES2000), University of Washington, Seattle, WA, August 11-16, 2000, No. 1561. Ben-Akiva, M., and Lerman, S. Discrete Choice Analysis. Cambridge, Massachusetts: MIT Press, 1985. Khisty, C., J. and Lall, B., K. Transportation Engineering An Introduction. The United States of America: Prentice-Hall, Inc., 1998. Lopez-de-los-Mozos, M. and Mesa, J., A., The Maximum Absolute Deviation Measure in Location Problems on Networks, European Journal of Operational Research, Vol. 135, 2001. pp. 184-194. Modesti, P., and Sciomachen, A., A Utility Measure for Finding Multiobjective Shortest Paths in Urban Multimodal Transportation Networks, European Journal of Operational Research, Vol. 111, 1998, pp.495-508. Okabe, A., and Suzuki, A., Locational Optimization Problems Solved Through Voronoi Diagrams, European Journal of Operational Research, Vol. 98, 1997, pp. 445-456. Ortuzar J., D., D. and Willumsen L., G. Modelling Transport. Chichester, New York: John Wiley & Sons, Ltd, 1990. Preparata, F., P. and Shamos, M., I. Computational Geometry An Introduction. New York: Springer-Verlag, 1985. South, R., and Boots, B., Relaxing the Nearest Centre Assumption in Central Place Theory, Regional Science, Vol. 78, 1999, pp.157-177. Thisse, J., and Zoller, H., G. Locational Analysis of Public Facilities. Amsterdam, New York, Oxford: North-Holland Publishing , 1983. Zhang, J., Timmermans, H., Borgers, A. and Wang D. Modeling Travelers Choice Behavior Using the Concepts of Relative Utility and Relative Interest, Transportation Research Part B, 2003 (in press).
Copyright © 2022 FDOKUMEN