Evaluation of New Technologies within Manufacturing ...
128
Evaluation of New Technologies within Manufacturing Engineering Application of Virtual Reality in Automotive Industry’s Manu- facturing Engineering Processes: A Case Study at CEVT Master’s thesis in Production Engineering ANTON JOHANNESSON JULIA PERSSON GIOLITTI Department of Industrial and Materials Science CHALMERS UNIVERSITY OF TECHNOLOGY Gothenburg, Sweden 2019
-
Upload
khangminh22 -
Category
Documents
-
view
0 -
download
0
Transcript of Evaluation of New Technologies within Manufacturing ...
Evaluation of New Technologies withinManufacturing EngineeringApplication of Virtual Reality in Automotive Industry’s Manu-facturing Engineering Processes: A Case Study at CEVT
Master’s thesis in Production Engineering
ANTON JOHANNESSONJULIA PERSSON GIOLITTI
Department of Industrial and Materials ScienceCHALMERS UNIVERSITY OF TECHNOLOGYGothenburg, Sweden 2019

Master’s thesis 2019:NN
Evaluation of New Technologieswithin Manufacturing Engineering
Application of Virtual Reality in Automotive Industry’sManufacturing Engineering Processes: A Case Study at CEVT
ANTON JOHANNESSONJULIA PERSSON GIOLITTI
Department of Industrial and Materials ScienceDivision of Production Engineering
Chalmers University of TechnologyGothenburg, Sweden 2019

Evaluation of New Technologies within Manufacturing EngineeringApplication of Virtual Reality in Automotive Industry’s Manufacturing EngineeringProcesses: A Case Study at CEVTANTON JOHANNESSONJULIA PERSSON GIOLITTI
© ANTON JOHANNESSON, JULIA PERSSON GIOLITTI, 2019.
Supervisor: Liang Gong, Department of Industrial and Materials ScienceSupervisor: Xiaoxia Chen, Department of Industrial and Materials ScienceSupervisor: Alfredo Carter, CEVTExaminer: Björn Johansson, Department of Industrial and Materials Science
Master’s Thesis 2019:NNDepartment of Industrial and Materials ScienceDivision of Production EngineeringChalmers University of TechnologySE-412 96 GothenburgTelephone +46 31 772 1000
Cover: Man wearing Head Mounted Display (Jabil, 2019)
Gothenburg, Sweden 2019
iv

Evaluation of New Technologies within Manufacturing EngineeringApplication of Virtual Reality in Automotive Industry’s Manufacturing EngineeringProcesses: A Case Study at CEVTANTON JOHANNESSONJULIA PERSSON GIOLITTIDepartment of Industrial and Materials ScienceChalmers University of Technology
AbstractAs the manufacturing industry is getting more competitive the need for new sup-porting technologies is increasing. Recently, the market for Virtual Reality (VR)has expanded significantly and become more accessible for consumers, with drivingforces being the gaming industry and Industry 4.0. Therefore this technology willneed to be researched and evaluated to further understand if and where it can beused and implemented. To do this, a method needed to be developed. The aimand purpose for this thesis was set accordingly, to find a method for evaluating newtechnologies and to see what the result from the implementation would be from asustainability perspective. The thesis includes a case study at an automotive com-pany where the method was developed and validated. The purpose and aim werefulfilled by creating a new and functioning method to evaluate new technologieswithin manufacturing engineering and identifying application opportunities. Themethod includes three major steps: a data collection, mapping of the findings anda verification of the result through a physical test.
By following the created method resulted in an identification of three improve-ment areas: analysis, communication and visualization. Within these three areas aset of 17 activities, at the case company, were found. The findings shows that animplementation of VR in these activities would result in improvements for the casecompany. Recommendations to the case company are to implement VR in the foundactivities, for example communication and ergonomics. Further research could in-clude integration of VR peripherals, where haptic feedback should be prioritized,and to then study the effects on cost, quality, time and user experience.
Keywords: Virtual Reality, Manufacturing Engineering, Case Study, Evaluationmethod, Automotive industry, Industry 4.0, VR.
v

AcknowledgementsThere are several people we would like to thank for their help and support duringour master thesis work. First, we would like to thank our supervisors at Chalmers,Liang Gong and Xiaoxia Chen, for their support, advice and feedback during ourmaster thesis. This help has been invaluable for us during our research. We wouldalso like to thank our examiner Björn Johansson for making this thesis possible.
At CEVT, we would like to thank Alfredo Carter for his ongoing unlimited sup-port, providing contacts and answering all our company related questions. Also,thank you Anton Berce for taking the time to help us with software related ques-tions, construction of the virtual environment and all other input during the thesiswork. A special thank you to everyone who we had the opportunity to interviewand who were a part of our testing for your time and the different perspectives anddemonstrations you provided us with. A big thank you to all people working at theBiW department for the warm welcome and inclusion in your department duringour short 20 weeks stay.
Finally, thank you Hannes Andreasson and John Weman for the help with cor-recting and improving this report.
Anton Johannesson and Julia Persson Giolitti, Gothenburg, May 2019
vii

viii

Acronyms
3D Three-dimensional. 6, 8, 11, 15, 39
AR Augmented Reality. XLIII, XLIV, 3, 6
BHI Bare Hand Interaction. 11BIM Building Information Modeling. 16BiW Body in White. 26, 27, 31
CAVE CollAborative Virtual Environment. 8, 9, 13CEVT China Euro Vehicle Technology AB. XXXIX, 3, 26–28, 30, 32, 33, 40, 45CPS Cyber-Physical System. 18
FOV Field Of View. 6–9, 11, 29, 44
HMD Head Mounted Display. XLIII, 3, 7, 9, 11, 12, 16–19, 29, 40, 44, 51
IMMA Intelligently Moving Manikin. 31IoT Internet of Things. 17IPS Industrial Path Solutions. XXXIX, XLII, 12, 30–32, 39
ME Manufacturing Engineering. XXXIX, XL, XLII–XLIV, 1–3, 21, 23, 24, 26, 28,29, 32, 35, 40, 42, 43, 45, 49, 51–53, 55
MR Mixed Reality. 6
PLM Product Lifecycle Management. 39PPI Pixels Per Inch. 9, 19
R&D Research & Development. 1, 41
T&CF Trim & Car Final. 26, 27, 31, 39, 40
VAC Vergence-Accommodation Conflict. 16, 19VR Virtual Reality. XXXIX–XLIV, 2, 3, 5–18, 21–23, 26, 29–33, 35, 38, 40, 43–47,
50–53, 55
ix


Contents
List of Figures xv
List of Tables xvii
1 Introduction 11.1 Background . . . . . . . . . . . . . . . . . . . . . . . . . . . . . . . . 11.2 Research questions . . . . . . . . . . . . . . . . . . . . . . . . . . . . 21.3 Purpose . . . . . . . . . . . . . . . . . . . . . . . . . . . . . . . . . . 21.4 Aim . . . . . . . . . . . . . . . . . . . . . . . . . . . . . . . . . . . . 31.5 Scope and delimitations . . . . . . . . . . . . . . . . . . . . . . . . . 3
2 Literature Study 52.1 Definition of Virtual Reality concept . . . . . . . . . . . . . . . . . . 52.2 General use of Virtual Reality . . . . . . . . . . . . . . . . . . . . . . 62.3 Virtual Reality technologies . . . . . . . . . . . . . . . . . . . . . . . 7
2.3.1 Desktop Virtual Reality . . . . . . . . . . . . . . . . . . . . . 82.3.2 Powerwall . . . . . . . . . . . . . . . . . . . . . . . . . . . . . 82.3.3 CollAborative Virtual Environment . . . . . . . . . . . . . . . 82.3.4 Head Mounted Display . . . . . . . . . . . . . . . . . . . . . . 9
2.4 Features of peripherals . . . . . . . . . . . . . . . . . . . . . . . . . . 102.4.1 Virtual Reality controller . . . . . . . . . . . . . . . . . . . . . 112.4.2 Motion tracking . . . . . . . . . . . . . . . . . . . . . . . . . . 112.4.3 Haptic feedback . . . . . . . . . . . . . . . . . . . . . . . . . . 112.4.4 Eye tracking . . . . . . . . . . . . . . . . . . . . . . . . . . . . 122.4.5 Virtual Reality motion platform . . . . . . . . . . . . . . . . . 12
2.5 Methods for creating virtual environments . . . . . . . . . . . . . . . 122.6 Applications of Virtual Reality . . . . . . . . . . . . . . . . . . . . . 13
2.6.1 Communication . . . . . . . . . . . . . . . . . . . . . . . . . . 132.6.2 Design . . . . . . . . . . . . . . . . . . . . . . . . . . . . . . . 142.6.3 Ergonomics . . . . . . . . . . . . . . . . . . . . . . . . . . . . 142.6.4 Training . . . . . . . . . . . . . . . . . . . . . . . . . . . . . . 142.6.5 Virtual assembly . . . . . . . . . . . . . . . . . . . . . . . . . 152.6.6 Visualization . . . . . . . . . . . . . . . . . . . . . . . . . . . 15
2.7 User experience of Virtual Reality . . . . . . . . . . . . . . . . . . . . 152.8 Driving forces for Virtual Reality . . . . . . . . . . . . . . . . . . . . 17
2.8.1 Industry 4.0 . . . . . . . . . . . . . . . . . . . . . . . . . . . . 17
xi

Contents
2.8.2 Gaming industry . . . . . . . . . . . . . . . . . . . . . . . . . 182.9 Advancements within Virtual Reality technologies . . . . . . . . . . . 18
3 Methodology 213.1 Data collection: Literature study . . . . . . . . . . . . . . . . . . . . 223.2 Data collection: Case study . . . . . . . . . . . . . . . . . . . . . . . 23
3.2.1 Interviews . . . . . . . . . . . . . . . . . . . . . . . . . . . . . 233.2.2 Internal documentation . . . . . . . . . . . . . . . . . . . . . . 243.2.3 Direct observations . . . . . . . . . . . . . . . . . . . . . . . . 253.2.4 Participant observations . . . . . . . . . . . . . . . . . . . . . 253.2.5 Analytic strategy of case study data collection . . . . . . . . . 263.2.6 Chosen case company . . . . . . . . . . . . . . . . . . . . . . . 26
3.3 Mapping . . . . . . . . . . . . . . . . . . . . . . . . . . . . . . . . . . 283.4 Validation: Physical testing . . . . . . . . . . . . . . . . . . . . . . . 29
3.4.1 Preparations of the test development . . . . . . . . . . . . . . 303.4.2 Designing the test . . . . . . . . . . . . . . . . . . . . . . . . . 303.4.3 Building the test . . . . . . . . . . . . . . . . . . . . . . . . . 323.4.4 Performing the test . . . . . . . . . . . . . . . . . . . . . . . . 33
4 Results 354.1 Method for evaluating new technologies . . . . . . . . . . . . . . . . . 35
4.1.1 Step 1: Data collection . . . . . . . . . . . . . . . . . . . . . . 364.1.2 Step 2: Mapping . . . . . . . . . . . . . . . . . . . . . . . . . 374.1.3 Step 3: Validation . . . . . . . . . . . . . . . . . . . . . . . . 38
4.2 Collected case study data . . . . . . . . . . . . . . . . . . . . . . . . 384.2.1 IT tools . . . . . . . . . . . . . . . . . . . . . . . . . . . . . . 384.2.2 Virtual Reality at case company . . . . . . . . . . . . . . . . . 404.2.3 Communication . . . . . . . . . . . . . . . . . . . . . . . . . . 404.2.4 Challenges . . . . . . . . . . . . . . . . . . . . . . . . . . . . . 41
4.3 Result from mapping . . . . . . . . . . . . . . . . . . . . . . . . . . . 434.3.1 High-level cross mapping . . . . . . . . . . . . . . . . . . . . . 434.3.2 Exploring activities . . . . . . . . . . . . . . . . . . . . . . . . 434.3.3 Identifications of combination . . . . . . . . . . . . . . . . . . 44
4.4 Physical testing . . . . . . . . . . . . . . . . . . . . . . . . . . . . . . 444.4.1 Desktop vs. Virtual Reality . . . . . . . . . . . . . . . . . . . 454.4.2 Estimated changes . . . . . . . . . . . . . . . . . . . . . . . . 464.4.3 Evaluating importance of different factors . . . . . . . . . . . 474.4.4 Use of VR in work processes . . . . . . . . . . . . . . . . . . . 47
5 Discussion 495.1 Evaluation method . . . . . . . . . . . . . . . . . . . . . . . . . . . . 495.2 Application areas . . . . . . . . . . . . . . . . . . . . . . . . . . . . . 505.3 Sustainability . . . . . . . . . . . . . . . . . . . . . . . . . . . . . . . 52
6 Conclusion 55
References 57
xii

Contents
A Case Study Data IA.1 Overview of work tasks . . . . . . . . . . . . . . . . . . . . . . . . . . IIA.2 Overview of positions at departments . . . . . . . . . . . . . . . . . . IIIA.3 IT tools . . . . . . . . . . . . . . . . . . . . . . . . . . . . . . . . . . IVA.4 Communication . . . . . . . . . . . . . . . . . . . . . . . . . . . . . . VA.5 Challenges . . . . . . . . . . . . . . . . . . . . . . . . . . . . . . . . . VIA.6 VR and applications . . . . . . . . . . . . . . . . . . . . . . . . . . . VIIIA.7 Ideas for implementation . . . . . . . . . . . . . . . . . . . . . . . . . XI
B Mapping XIIIB.1 High-level cross mapping . . . . . . . . . . . . . . . . . . . . . . . . . XIVB.2 Exploring activities . . . . . . . . . . . . . . . . . . . . . . . . . . . . XVB.3 Identification of combinations . . . . . . . . . . . . . . . . . . . . . . XVII
C Physical testing survey XIXC.1 Preparation questions . . . . . . . . . . . . . . . . . . . . . . . . . . . XXC.2 Desktop vs. Virtual Reality . . . . . . . . . . . . . . . . . . . . . . . XXIIC.3 Estimated changes . . . . . . . . . . . . . . . . . . . . . . . . . . . . XXVIC.4 Evaluating importance of different factors . . . . . . . . . . . . . . . XXXIIC.5 Use of VR in work processes . . . . . . . . . . . . . . . . . . . . . . . XXXIV
D Guidelines and recommendations to case company XXXIXD.1 Summarization of the result . . . . . . . . . . . . . . . . . . . . . . . XXXIXD.2 Potential benefits if implementing VR . . . . . . . . . . . . . . . . . . XL
D.2.1 Time/cost . . . . . . . . . . . . . . . . . . . . . . . . . . . . . XLD.2.2 Quality . . . . . . . . . . . . . . . . . . . . . . . . . . . . . . XLID.2.3 User experience . . . . . . . . . . . . . . . . . . . . . . . . . . XLI
D.3 Time plan . . . . . . . . . . . . . . . . . . . . . . . . . . . . . . . . . XLID.4 Virtual Reality organization . . . . . . . . . . . . . . . . . . . . . . . XLIIID.5 Virtual Reality setup . . . . . . . . . . . . . . . . . . . . . . . . . . . XLIIID.6 Recommendation for continued research work (AE projects) . . . . . XLIII
xiii

Contents
xiv

List of Figures
2.1 Overview of literature study chapter . . . . . . . . . . . . . . . . . . 52.2 Categories of immersion . . . . . . . . . . . . . . . . . . . . . . . . . 72.3 Categories of VR technologies . . . . . . . . . . . . . . . . . . . . . . 82.4 Current areas of peripherals circulating the VR market . . . . . . . . 102.5 Illustration of Vergence-Accommodation Conflict . . . . . . . . . . . . 16
3.1 Overview of the project methodology . . . . . . . . . . . . . . . . . . 213.2 Literature study data collection methods . . . . . . . . . . . . . . . . 223.3 Case study data collection sources . . . . . . . . . . . . . . . . . . . . 233.4 Demonstration areas . . . . . . . . . . . . . . . . . . . . . . . . . . . 253.5 The three mapping phases . . . . . . . . . . . . . . . . . . . . . . . . 283.6 The four development phases . . . . . . . . . . . . . . . . . . . . . . 30
4.1 Overview of the result chapter . . . . . . . . . . . . . . . . . . . . . . 354.2 Method for evaluating new technologies . . . . . . . . . . . . . . . . . 354.3 Current VR room at CEVT with HTC vive setup. (Authors’ image) . 404.4 Result desktop vs. VR . . . . . . . . . . . . . . . . . . . . . . . . . . 454.5 Estimated changes for the activities: ergonomics, claim support, con-
cept verification and status reporting . . . . . . . . . . . . . . . . . . 46
xv

List of Figures
xvi

List of Tables
2.1 Features and function of VR peripherals . . . . . . . . . . . . . . . . 10
3.1 General functions and simplified description . . . . . . . . . . . . . . 28
4.1 The common IT tools used at all ME departments at CEVT . . . . . 394.2 Table presenting the specific IT tools used at different ME depart-
ments at CEVT . . . . . . . . . . . . . . . . . . . . . . . . . . . . . . 39
xvii

List of Tables
xviii

1Introduction
This chapter presents the background for the thesis explaining the context of thesubject and why it is relevant. Research questions, purpose, aim, scope and delimi-tation are also stated here describing the focus of the thesis.
1.1 Background
Manufacturing Engineering (ME) is described as the process of transforming materi-als into products (Davim, 2015). ME consists of the development of manufacturingsystems and processes, which also includes machines, tools and other equipmentneeded to create a product. The planning of the manufacturing systems, processesand practices is also a part of ME. Davim (2015) states that joining methods, ma-terial properties, automation and lean manufacturing can be seen as fundamentalsubjects within ME.
The way manufacturing is performed today have been affected by globalization,competitiveness between companies have increased and Research & Development(R&D) have seen a large increase in time and money (Szabó, 2018). This has led toa rapid increase in the development of new products. The automotive industry isa prime example of this as the development time and the time to market of a newmodel have decreased significantly over the past few decades. The range of the prod-ucts have also increased, and the product life cycles are becoming shorter (Szabó,2018). This have increased the importance of production ramp-up processes. Partof companies’ success are relying on an effective ramp-up process since a delay inthe ramp-up can have great negative effect on the revenue (Szabó, 2018).
Simultaneously as the time to market needs to be shorter, the product design com-plexity has increased leading to more challenges for the manufacturers (Nieuwenhuis& Wells, 2015; Lawson, Salanitri, & Waterfield, 2016). The competitiveness betweencompanies is increasing the demands on higher quality on the manufactured prod-ucts (Lawson et al., 2016). Therefore, the quality of the manufacturing systemsneeds to be high since the process of recalling products is expensive (Szabó, 2018).According to Stoycheva et al. (2018) the demand for sustainability is also growingand sustainable manufacturing have gained attention. Sustainability can be dividedinto three different aspects: environmental, social and economic (Ayers, 2017). Themanufacturing industry affects all three of the aspects. According to Statista (2019b)in 2014, 19.2% of the worldwide CO2 emissions originated from manufacturing and
1

1. Introduction
construction. Stark, Seliger, and Bonvoisin (2017) state that the social aspects areaffected by the working conditions for the operators at the manufacturing plants.Stark et al. (2017) further states that in 2016 manufacturing was responsible for31% of the worldwide gross domestic product. Since manufacturing impacts all thethree aspects it is important that it is driven forward by improved ME. Even thoughsustainable manufacturing is an attractive goal, it has faced many difficulties. Inmore competitive markets, such as the automotive market, the difficulties have beenmore significant (Stoycheva et al., 2018).
All the mentioned challenges above are something that needs to be addressed. Forautomotive companies it is essential to adopt new supporting technologies that canmake it possible to overcome these challenges (Lawson et al., 2016). One of thesetechnologies is said to be Virtual Reality (VR) (Lawson et al., 2016). VR is a technol-ogy that has been increasing in its worldwide market size the recent years (Statista,2019a). It is also expected to expand in the coming years further increasing in world-wide market size (Statista, 2019a). Currently there are many advancements of VRwith new innovative technology being brought to the market. Varjo and Pimax areexamples of VR companies that are working with advancing VR technology (Varjo,2019; Pimax, 2019). Both these companies have recently received investments fortheir development of VR technology (Varjo, 2018; Hayden, 2017). VR has made itinto many different industries. Entertainment in the form of games is an industrywhere VR has become popular but there are many other industrial sectors as well.According to Statista (2019a) education, design and healthcare among others aresectors where VR has gained ground. ME is another sector where VR has beenapplied and shown to be beneficial (Berg & Vance, 2017; Lawson et al., 2016).
1.2 Research questionsBased on the background the thesis aims to answer the following research questions:
• How to evaluate the applicability of new technology in ME processes?• What are the application opportunities between available VR technologies and
ME processes?
1.3 PurposeThe purpose of this thesis is to create an evaluation method to find applicationsopportunities for VR technology within ME. This will support the advancementswithin ME to become more sustainable by studying the effects of the applicationswith respect to environmental, social and economic aspects.
2

1. Introduction
1.4 AimTwo aims are defined for the thesis. The first aim is to contribute to the research anddevelopment of the knowledge of how to evaluate if new technologies are applicableor not within certain ME processes. The second aim is to find areas where the useand applications of VR technology can be beneficial in terms of quality, time, costand user experience within the ME processes. This will potentially lead to a moresustainable way of working with manufacturing changes. The project will generatethe following:
• A method to follow when making the evaluation of new technologies.• Areas of application for VR within ME processes.
1.5 Scope and delimitationsThe project length is 20 weeks and started the 21st January 2019. The thesis willbe created in collaboration with China Euro Vehicle Technology AB (CEVT) andChalmers University of Technology. A case study at CEVT enables a practicalexample to support the thesis and the presented method for evaluation of newtechnologies. The following delimitations have been made to the project:
• The project will only study the ME processes at CEVT.• The project will only focus on VR technology and not on Augmented Reality
(AR) technology or other similar technologies.• The physical testing will only be conducted on existing models and available
VR technology at CEVT.• The project will not include any development of VR technology.• The thesis will have focus on the Head Mounted Display (HMD) technology
because it is currently available for the ME department at CEVT. Other VRtechnologies will be presented in short but will not be evaluated or mapped.
3

1. Introduction
4

2Literature Study
The information found from the literature study is presented in this chapter. Firstly,to understand what VR is, general information about VR and different VR hardwareand software technologies is described. After that, the found application areas of VRare presented showing where VR previously has been used. The VR user experienceis then presented, describing factors that can impact the user experience. Thedriving forces for VR are then presented, explaining why VR technology is relevantand why there will be advancements within the area. Lastly, future advancementsand trends within VR technologies is presented. An overview of the literature studychapter can be seen in Figure 2.1.
Figure 2.1: Overview of literature study chapter
2.1 Definition of Virtual Reality conceptThere are many versions of the definition of VR. The definitions that can be foundare often not identical but have many factors in common (Bryson, 2013; Reza &Eloi, 2018; Taupiac, Rodriguez, & Strauss, 2018). Jaron Lanier is the person who
5

2. Literature Study
is said to have created the term "Virtual Reality" in 1980 (Peddie, 2013). Bryson(2013) made one definition, which states that VR can be defined as “... the use ofcomputer technology to create the effect of an interactive three-dimensional worldin which the objects have a sense of spatial presence” (p.4). This can be comparedto the definition that Reza and Eloi (2018) give, which states that VR consistsof three different properties that defines it. The first one being that the virtualenvironment is interactive. This means that it is possible for the user to interactwith the virtual environment and change it. Secondly, the virtual environment is aThree-dimensional (3D) environment, which will provide the user with a perceptionof depth. This supports the feeling of immersion in the virtual environment. Lastly,the interaction the user has with the virtual environment happens in real time andgives direct feedback. Taupiac et al. (2018) also mention these three properties,interaction, 3D and real time, as a part of the definition of VR. Many sources alsomention that VR is trying to achieve a sense of immersion (Sherman & Craig, 2003;Reza & Eloi, 2018; Bryson, 2013; Peddie, 2013; Fast-Berglund, Gong, & Li, 2018).
VR is only one of many reality concepts on the spectrum from the fully real en-vironment to the fully virtual environment (Eschen, Kötter, Rodeck, Harnisch, &Schüppstuhl, 2018). Kishino and Milgram (1994) call this spectrum for the virtualitycontinuum. Everything between the real environment and the virtual environmentis what Kishino and Milgram (1994) and Fast-Berglund et al. (2018) call MixedReality (MR). VR is on the side towards fully virtual environment of the continuum(Eschen et al., 2018). Another reality concept is Augmented Reality (AR), which isalso on the virtuality continuum but is closer to the real environment. AR combinesthe real environment with interactive augmented objects and aligns them with realobjects (Fast-Berglund et al., 2018). VR is however the most developed technologyaccording to Fast-Berglund et al. (2018) since it has been used and developed withinthe gaming industry for a long time.
2.2 General use of Virtual RealityIt is also important to know how the VR technology will be used and what it will beused for (Rückert, Wohlfromm, & Tracht, 2018; Fast-Berglund et al., 2018). Oth-erwise the wanted effect may not occur. Depending on what will be tested in thevirtual environment different requirements will be put on the VR technology. Thereare many options for input and output devices that all have advantages and draw-backs. With a combination of different technologies and peripherals there will bedifferent areas of use possible.
Rückert et al. (2018) propose five criteria that can be used to evaluate what VRtechnology to use:
• Field Of View (FOV), which will increase the feeling of immersion.• Ease of maintenance, will be affected by the complexity of the technology
that is used. The more complex the technology is the more it will cost and be
6
2. Literature Study
difficult to set up, which may require help from external partners.• Mobility, is important since the user may want to utilize the equipment on
different locations.• Immersion grade, will affect the result of the simulation. Immersion grade is
highly dependent on FOV, the ability to interact with the virtual environmentand how the real movements are transferred to the simulation.
• Number of users, is important to consider, as all technology may not func-tion well with multiple users.
HMD performs well in all the categories except for number of users (Rückert et al.,2018).
There are three elements that are involved when using VR, according to Eschenet al. (2018). These three elements are object, model and human. The object iseverything that exists in the real world except for the human, e.g. tools, floors andwalls. The model is everything that is created virtually. The human is the personusing the system and is interacting with the object and the model. Depending onthe level of interaction, between the human and object or model, different realityconcepts are to prefer. VR is suitable when the interaction between the humanand model is high and the interaction between the human and the object is lower(Eschen et al., 2018).
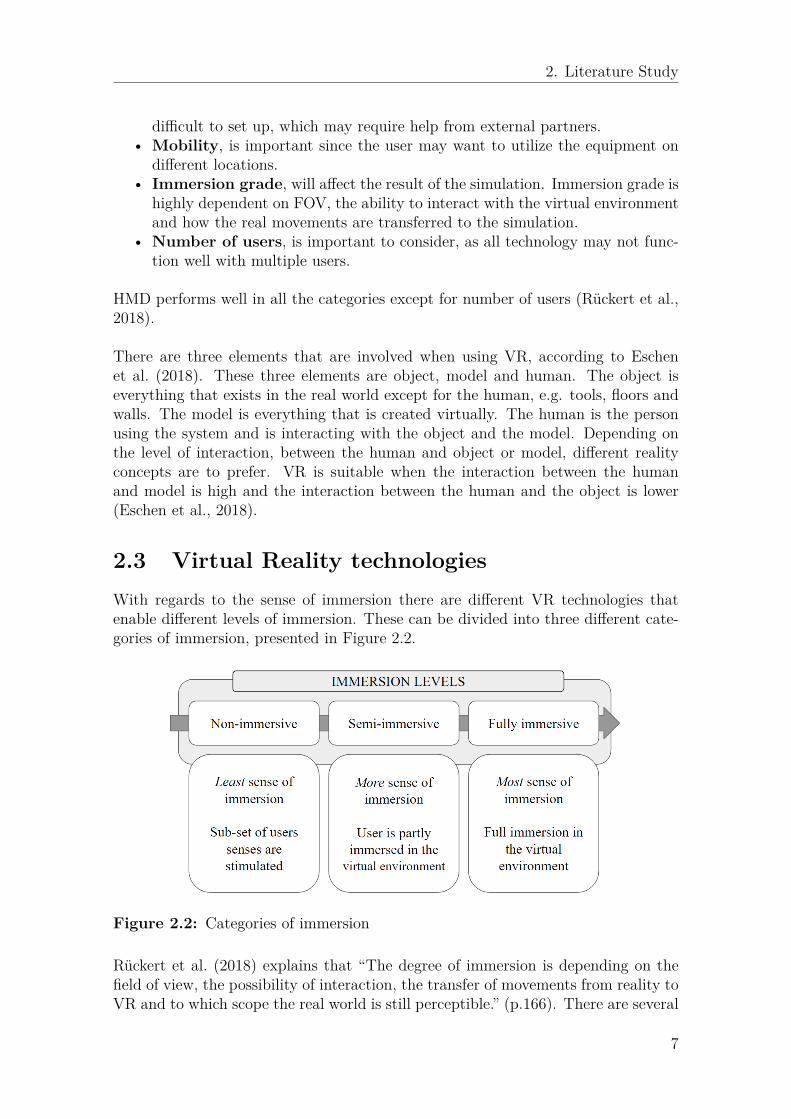
2.3 Virtual Reality technologiesWith regards to the sense of immersion there are different VR technologies thatenable different levels of immersion. These can be divided into three different cate-gories of immersion, presented in Figure 2.2.
Figure 2.2: Categories of immersion
Rückert et al. (2018) explains that “The degree of immersion is depending on thefield of view, the possibility of interaction, the transfer of movements from reality toVR and to which scope the real world is still perceptible.” (p.166). There are several
7

2. Literature Study
different VR technologies available, an overview of some of the most common andwell-known technologies is presented in Figure 2.3. with the level of immersionconnected to the technologies.
Figure 2.3: Categories of VR technologies
Source: (Amos, 2017b; Zzubnik, 2008; Rooch84, 2009; Pape, 2001)
2.3.1 Desktop Virtual RealityDesktop VR is non-immersive and uses a desktop to interact with an environment(Lee & Wong, 2014). Göttig, Newton, and Kaufmann (2005) explains that it is alow-cost solution with a computer monitor rendering the 3D environment. Multipledifferent devices can be used to interact with the environment such as mouse andkeyboard, joystick or gloves. According to Rückert et al. (2018) desktop VR performspoorly in FOV and number of users. The advantages of desktop VR are that it isthat it requires low maintenance and that it is very mobile.
2.3.2 PowerwallPowerwall is typically projection-based and Göttig et al. (2005) describes that theprojection area creates a depth effect in the field of vision that generates a greatersense of immersion than desktop VR. An advantage of a Powerwall is that it is greatfor collaborations since multiple people can stand in front of the Powerwall at thesame time. Disadvantages of the Powerwall is that it has low mobility and FOV(Rückert et al., 2018). The difference between CollAborative Virtual Environment(CAVE) and Powerwall is foremost the number of projection screens, which also isthe reason CAVE is a more immersive technology (Göttig et al., 2005).
2.3.3 CollAborative Virtual EnvironmentPeddie (2013) describes CAVE as a room with three of its walls and the floor pro-jecting images. These images are stereoscopic and with 3D glasses it creates stereovision. The system is also able to track the location of the user to project the cor-rect perspective to create immersion for the user. A drawback of CAVE is that it
8

2. Literature Study
requires a larger investment and more resources to install. CAVE needs a specialroom built for it that can be complicated in an already established working area.Because of the complicated setup of a CAVE it also has low mobility (Rückert etal., 2018).
2.3.4 Head Mounted DisplayHMDs produces stereo vision to create a sense of three dimensions and depth per-ception in the virtual environment (Reza & Eloi, 2018). This enhances the feeling ofimmersion, which is also greatly affected by the quality of the display. The HMD hasbuilt in accelerometers that makes it possible to track the movement of the user’shead in all the six axes to calculate the position and FOV in the virtual environment(Peddie, 2013). Examples of HMDs are HTC Vive and Oculus Rift S (HTC, 2019b;Facebook technologies, 2019a).
There are multiple types of HMD with different characteristics that provide theuser with various features that have advantages and drawbacks. The major featuresfor HMD are high quality displays and FOV. There are HMDs that have displayswith higher resolution and Pixels Per Inch (PPI). Higher resolution and higher PPIallows for more details to be seen in the virtual environment. The HMD could thenbe used for tasks that require the possibility to see finer detailing on the virtualobjects. An HMD with a better display is also likely to be more immersive sinceit produces an image more similar to the reality (Cho, Kim, Jung, Shin, & Kim,2017). A drawback with HMDs containing higher quality displays are that theyrequire more computing power compared to the ones with lower resolution (HTC,2019c, 2019d). Computer components that can handle the number of pixels and stillproduce enough frames per second without negatively affecting the user experienceare an important factor. This will increase the cost for the VR setup since morepowerful computer components are more expensive (Liagkou, Salmas, & Stylios,2019). In those cases where the task does not require the possibility to see finer de-tails of the virtual objects an HMD with lower resolution will be sufficient. A setupwith this equipment will be cheaper since the needed computing power will be lower.
The FOV can also be different depending on which HMD is used. There are HMDswith larger FOV and those with smaller. The larger FOV creates a more realis-tic feeling and increases the immersion when being inside the virtual environment(Rückert et al., 2018). It also provides the possibility to see more of the environmentat the same time. This can be useful when the task benefits from having a largerperipheral vision.
9

2. Literature Study
2.4 Features of peripheralsThe VR technologies presented have different characteristics and areas of use de-pendent on which additional peripherals they are used in combination with. Theperipherals are used to interact with the environment or enable deeper sense ofimmersion in the virtual world. Figure 2.4 shows an overview of current areas of pe-ripherals circulating in the VR market and in Table 2.1 a summary of their featuresand functions can be seen.
Figure 2.4: Current areas of peripherals circulating the VR market
Source: (Amos, 2017a; Minswho, 2015; Torrents, 2015; Markmann, 2015; Virtuix,2013)
Table 2.1: Features and function of VR peripherals
Peripheral Feature Function
VR Controller Virtual controller Interaction by pressing buttons
Motion tracking Tracking body Corresponding body movements in vir-tual environment
Motion tracking Tracking hand Corresponding hand movements in vir-tual environment and interaction
Haptic Feedback Apply motion touser
Generate the feeling of touch
Eye tracking Data collection Analysis of eye movements
Eye tracking Gaze tracking Interaction by gazing
VR motion plat-form
Walking in place Unlimited walking in limited space
10
2. Literature Study
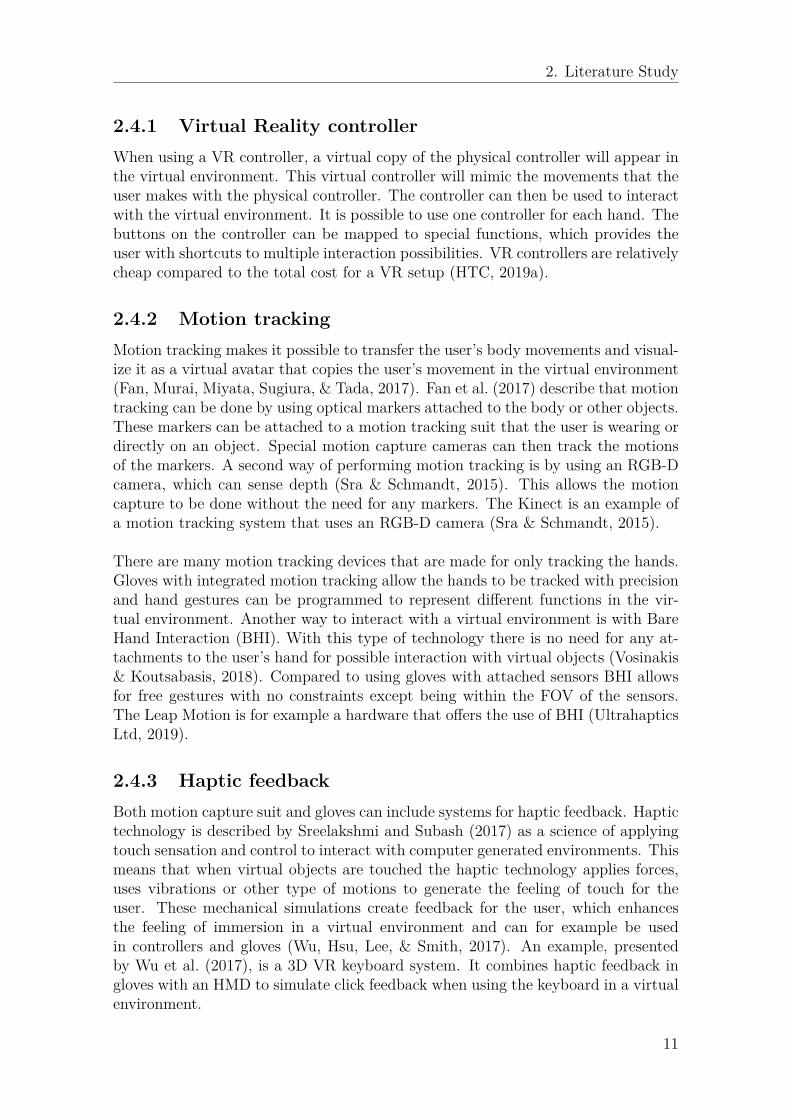
2.4.1 Virtual Reality controllerWhen using a VR controller, a virtual copy of the physical controller will appear inthe virtual environment. This virtual controller will mimic the movements that theuser makes with the physical controller. The controller can then be used to interactwith the virtual environment. It is possible to use one controller for each hand. Thebuttons on the controller can be mapped to special functions, which provides theuser with shortcuts to multiple interaction possibilities. VR controllers are relativelycheap compared to the total cost for a VR setup (HTC, 2019a).
2.4.2 Motion trackingMotion tracking makes it possible to transfer the user’s body movements and visual-ize it as a virtual avatar that copies the user’s movement in the virtual environment(Fan, Murai, Miyata, Sugiura, & Tada, 2017). Fan et al. (2017) describe that motiontracking can be done by using optical markers attached to the body or other objects.These markers can be attached to a motion tracking suit that the user is wearing ordirectly on an object. Special motion capture cameras can then track the motionsof the markers. A second way of performing motion tracking is by using an RGB-Dcamera, which can sense depth (Sra & Schmandt, 2015). This allows the motioncapture to be done without the need for any markers. The Kinect is an example ofa motion tracking system that uses an RGB-D camera (Sra & Schmandt, 2015).
There are many motion tracking devices that are made for only tracking the hands.Gloves with integrated motion tracking allow the hands to be tracked with precisionand hand gestures can be programmed to represent different functions in the vir-tual environment. Another way to interact with a virtual environment is with BareHand Interaction (BHI). With this type of technology there is no need for any at-tachments to the user’s hand for possible interaction with virtual objects (Vosinakis& Koutsabasis, 2018). Compared to using gloves with attached sensors BHI allowsfor free gestures with no constraints except being within the FOV of the sensors.The Leap Motion is for example a hardware that offers the use of BHI (UltrahapticsLtd, 2019).
2.4.3 Haptic feedbackBoth motion capture suit and gloves can include systems for haptic feedback. Haptictechnology is described by Sreelakshmi and Subash (2017) as a science of applyingtouch sensation and control to interact with computer generated environments. Thismeans that when virtual objects are touched the haptic technology applies forces,uses vibrations or other type of motions to generate the feeling of touch for theuser. These mechanical simulations create feedback for the user, which enhancesthe feeling of immersion in a virtual environment and can for example be usedin controllers and gloves (Wu, Hsu, Lee, & Smith, 2017). An example, presentedby Wu et al. (2017), is a 3D VR keyboard system. It combines haptic feedback ingloves with an HMD to simulate click feedback when using the keyboard in a virtualenvironment.
11

2. Literature Study
2.4.4 Eye trackingEye tracking is a technique of tracking or mimicking how the eye moves (Ungvarsky,2017). The users eye movements are traced to where they are looking at any giventime and in which sequence the user is changing location (Poole & Ball, 2006).The data collected from the eye tracking can then be analyzed and used in research(Blascheck et al., 2017). The possibility to know where the user is gazing can also beused to interact with the virtual environment. For example, buttons can be pressedby just looking at them.
2.4.5 Virtual Reality motion platformA problem when walking around in a virtual environment using an HMD is thatthe user is restricted by the room where the VR setup is. By using a VR motionplatform, the user will be able to walk in one place in any direction (Virtuix, 2019).This will remove the restraint given by the size of the room. The platform registersthe movements, which are transferred to the virtual environment (Virtuix, 2019).
2.5 Methods for creating virtual environmentsTo be able to utilize the VR hardware technology it is needed to create a virtual en-vironment that the user can work in. Two ways to create a virtual environment arethrough a simulation software or a game engine (Holubek, Delgado Sobrino Daynier,Košťál, Ružarovský, & Velíšek, 2017; Wang, Kim, Kobayashi, Wu, & Barth, 2018).Some simulation software have an integrated VR function that makes it possible touse the created simulation as a virtual environment for VR. Examples of simulationsoftware with integrated VR tools are Process Simulate and Industrial Path Solu-tions (IPS) (Siemens, 2017; IPS AB, 2019). An advantage for this method is that thespecialized functions for the simulation software are still accessible. A drawback isthat the user is limited by the simulation software developer leading to that wantedchanges may take long time to be released or never will be released. The ability tocustomize the software is also limited by the developer.
Game engines are usually used to develop games but can be used for other purposesas well (Wang et al., 2018). With the use of game engines a virtual environment canbe created. Examples of game engines are Unreal Engine 4 and Unity (Epic Games,2019; Unity Technologies, 2019). Game engines give flexibility in the creation of thevirtual environment so that functions, menu layouts and options can be customizedaccording to the demand of the user. The creation of the whole environment canbe done by an in-house developer meaning that changes can be updated faster andeasier.
12

2. Literature Study
2.6 Applications of Virtual RealityIn 1956 Morton Heilig, “considered by many as the “Father of Virtual Reality””(p.412), presented Sensorama (Peddie, 2013). This was a visual experience displaysystem with 4D effects where one person could experience sound, motion, scent andwind. Sherman and Craig (2003) present a timeline of VR technology history. Itincludes one of the first head-mounted displays (1968), the first public game withmultiple players (1990) and the CAVE on display for the first time (1992). Tech-nologies surrounding VR has been developed within several different industries formany different purposes. Some of the industries using or developing VR technologiesare: gaming, education, healthcare, retail, engineering and manufacturing (Peddie,2013; Bezegová, Ledgard, Molemaker, Oberč, & Vigkos, 2017).
When using VR tools for supporting simulation it is necessary to have a power-ful computer with a graphics card sufficient enough for the task being performed(Holubek et al., 2017). This hardware is relatively expensive and have shown to bea restricting factor for implementing VR because of the high investment cost needed(Reza & Eloi, 2018; Berg & Vance, 2017).
Several areas are identified where VR is applicable and used. These areas are:communication, design, ergonomics, training, virtual assembly and visualization.Each sub-chapter explains the areas in more detail.
2.6.1 CommunicationAccording to Berg and Vance (2017) it is important for everyone in a group tounderstand the problems at hand for a project to be successful. Reza and Eloi(2018) state that a common problem can be that everyone involved in a project islikely to not come from the same discipline. Each discipline also uses their own toolsto communicate (Berg & Vance, 2017). Everyone may not be able to understand allthe information in the usual form it is presented within a certain discipline (Reza& Eloi, 2018; Gong, Berglund, Saluäär, & Johansson, 2017). Communication is anarea where where VR has shown to be very useful in (Reza & Eloi, 2018; Akpan& Shanker, 2017). By entering a virtual environment, the object in question canbe seen from a common viewpoint and therefore it will be easier to discuss andunderstand. This will support the communication and decrease the effect of thegaps in knowledge about the subject. Cases have been identified where VR hasbeen used to facilitate communication within collaborative design review and acrossdiscipline communication (Daily et al., 2000; Berg & Vance, 2017). Another areawhere VR has potential to be very useful in is communication from different physicallocations by entering a virtual environment (Fast-Berglund et al., 2018; Lawson etal., 2016). This benefit with VR would entail both time and cost savings.
13
2. Literature Study
2.6.2 DesignAccording to Lawson et al. (2016) a design process is an iterative process thatrequires changes continuously and often the need to go back to older versions ofthe design. This will likely occur several times during a project and is a very timeconsuming and costly process. The decisions made early in the design phases canhave a great effect on the total cost of the product. This is where VR has beenshown to be beneficial, both saving time and money (Lawson et al., 2016). By usingVR, virtual models can be created and reviewed to support the decision makingand discover necessary modifications early. Since the quality of the rendering haveimproved so has the possibility to review the aesthetics of the product (Berg &Vance, 2017).
2.6.3 ErgonomicsErgonomics is an area where VR has been found useful (Berg & Vance, 2017; Fanet al., 2017). VR is an effective tool for testing and analyzing in an immersiveenvironment that is similar to the real world (Fan et al., 2017). According to Fanet al. (2017) the anthropometry of a person can have an impact on how a productis designed, and can make the design process difficult. It is also important to knowhow the design will affect people with different anthropometry. Fan et al. (2017)furthers explains that in the virtual environment the virtual body could be altered torepresent another body with a different anthropometry. VR can therefore enhancethe perception of affordance regarding the environment and objects around us. Bergand Vance (2017) says that there have been cases where operators have been broughtin to the test facility to try out the virtual workstation. The operator can then giveinput on how well the workstation works. Ergonomists can also try out tasks inthe virtual environment to estimate the forces needed to perform tasks in certainpostures. This allows VR to be used as method to verify the ergonomic safety ofassembly tasks (Berg & Vance, 2017). Lawson et al. (2016) discuss some areas thatcan be improved for the ergonomic evaluations. Haptic feedback of force and torqueand the ability to track the body without using markers would make the evaluationmore accurate and user friendly.
2.6.4 TrainingVR has been shown to be an advantageous tool for work training (Harders, 2008).Firefighting, surgery, flight and manufacturing are examples of areas where VR hasbeen utilized for training (Harders, 2008; Ho, Wong, Chua, & Chui, 2018; Liagkouet al., 2019). The advantage with VR is that it can create realistic simulations ofthe reality with a high level of immersion. This allows for engaging and interactivetraining from which the trainee can create personal experience. The use of a vir-tual environment also makes it possible to train in dangerous environments, whichotherwise would not be possible because of the high risks it would involve. Accord-ing to Ho et al. (2018) in complex assembly systems the level of training for newoperators are essential to keep up the efficiency of the production. Ho et al. (2018)further mentions that VR training can save costs, reduce errors and improve quality
14

2. Literature Study
compared to other training methods. The reduced errors will also save material andenergy.
2.6.5 Virtual assemblyAccording to Winkes and Aurich (2015) errors in the assembly line is often firstfound when the new assembly is physically implemented. Changes at this pointare very costly and therefore planning of the assembly is key for success. By usingVR in the planning phase these errors can be found earlier in the project. Virtualassembly makes it possible to assemble and disassemble the product virtually andthe necessary modifications can be made in the virtual environment (Lawson et al.,2016). This will save money compared to making the modifications on the physicalassembly line (Winkes & Aurich, 2015). Virtual assembly have also shown to beadvantageous in improving product quality (Lawson et al., 2016; Seth, Su, & Vance,2008).
2.6.6 VisualizationVR enables the possibility to observe and interact with virtual objects and environ-ments in 3D. VR also allows the virtual objects and environments to be seen in scale1:1. These two capabilities makes VR a good tool for visualization. According toAkpan and Shanker (2017) visualization in realistic scale and 3D are advantageousfor performing analyses. Akpan and Shanker (2017) further state that using VR asa tool for visualization during presentations is beneficial.
2.7 User experience of Virtual RealityUser experience is defined being a ”person’s perceptions and responses resultingfrom the use and/or anticipated use of a product, system or service” (InternationalOrganization for Standardization, 2016). The relationship between VR and userexperience have been discussed by several researchers (Reski & Alissandrakis, 2019;Reza & Eloi, 2018; Tcha-Tokey, Christmann, Loup-Escande, Loup, & Richir, 2018).
Bougaa, Bornhofen, Kadima, and Rivière (2015) present three categories that canbe used for evaluating the quality of a VR user experience:
• Immersion: The feeling of being in a virtual environment.• Interaction: A set of actions for the user to interact with the system and
each other.• Autonomy: The ability to adapt behavior to unknown changes in the envi-
ronment.
A high feeling of immersion, interaction possibilities and autonomy increases theuser experience, but it is also influenced by VR sickness.
15

2. Literature Study
VR sickness is stated by Kim, Lim, Lee, and Ro (2019) to consist of three differentmajor symptoms:
• Oculomotor symptoms, which includes visual fatigue and having difficultiesto focus.
• Disorientation symptoms, which might be dizziness and vertigo.• Nausea symptoms.
These symptoms are mostly caused by the discrepancy between vestibular sensorsand visual sensors, for example because you feel that you are not moving but yousee that you are in motion.
Some suggestions for avoiding simulator sickness are to ensure the headset is prop-erly adjusted, no unexpected movement, avoid acceleration and avoid fixed-viewitems. This is also connected to the processing power of the computer, both hard-ware and software influences the user experience (Fast-Berglund et al., 2018). If theVR setup cannot refresh the image fast enough undesired latency will be noticeablefor the user (Regan & Pose, 1994). Cho et al. (2017) explain the screen door effectas what makes it possible to see the grid pattern between the pixels on the display.This effect directly affects our vision and lowers the feeling of immersion that mayaffect VR sickness.
According to Kramida (2016) Vergence-Accommodation Conflict (VAC) is a com-mon problem for HMDs and can cause VR sickness. VAC is what occurs when thevergence distance and the accommodation distance for the eye does not match, seeFigure 2.5. When wearing an HMD the vergence distance becomes the distancefrom the eyes to the focal point on the virtual object that the user is looking at.The accommodation distance is the distance from the eyes to the focal plane i.e.the display in the HMD. Kramida (2016) states that using an HMD can thereforecause visual fatigue. This fatigue is more noticeable during longer sessions.
Figure 2.5: Illustration of Vergence-Accommodation Conflict
A study presented by Reza and Eloi (2018) where people participated to see howVR could be used in Building Information Modeling (BIM) processes showed that
16
2. Literature Study
people quickly adapt to the VR environment. A large part of the participants foundthe HMD comfortable to wear during the whole sessions, but some participantsexpressed that they felt motion sickness and that over time it was tiring to wear theHMD. Another study also found that motion sickness is a drawback of the usageof VR (Gong et al., 2017). This study also showed that most of the test usersfound it easy to use the VR tool. According to Mealy (2018) there have been nothorough research surrounding the long-term health effects of using VR. This issomething that needs to be evaluated depending on how long time the user is in theVR environment and how often the VR technology is going to be used.
2.8 Driving forces for Virtual Reality(Statista, 2019a) state the market size for VR has expanded the recent years andis said to continue to expand. Two large drivers for the advancements of VR areIndustry 4.0 and the gaming industry.
2.8.1 Industry 4.0Manufacturers today act in an environment where they must be agile accordingto the changes that the customers are demanding (Fatorachian & Kazemi, 2018).Product quality, manufacturing costs and flexibility in production is forcing a changein the current production systems. Flexibility and connectivity are needed in thebusiness processes to be able to satisfy customer demands in customization, qualityand price. According to Fatorachian and Kazemi (2018) this is what Industry 4.0is said to provide. It will be done by “...digitisation, automation and integrationof production systems and through application of computer-aided programs andsmart systems in manufacturing processes” (p. 637) (Fatorachian & Kazemi, 2018).Bougaa et al. (2015) discuss the use of VR in Factories of the Future, which is anequivalent of Industry 4.0. It is further argued that VR is necessary to implementin Factories of the Future because the systems in the future will have such a highcomplexity.
In Industry 4.0 all the physical processes will be monitored, and sensor data will becollected (Gilchrist, 2016). This will happen in real-time, which means that it willalways be updated to the current state of the actual processes. This means thatproduction processes can be improved by using the valuable data that is constantlygiven by feedback from the connected intelligent devices (Fatorachian & Kazemi,2018). Gilchrist (2016) states that the data will then be linked to virtual models,which engineers can run simulations to modify and perform tests on. This willnot affect the physical processes. All these virtual models can be referred to asthe “digital twin”. This digital twin will allow the engineers to improve the pro-cess and to reduce the lead times for implementations (Gilchrist, 2016). Internet ofThings (IoT) is what will make the digital twin possible (Fatorachian & Kazemi,2018). Fatorachian and Kazemi (2018) describes IoT as an environment where allthe intelligent devices across the globe have the internet as center of connectivity. Itis also stated that IoT provides “...greater insights and visibility and collaboration
17

2. Literature Study
across the plant floor as well as greater real-time machine-to-machine connectiv-ity” (p. 636). The virtual world and the physical world have been merging thanksto the interaction between embedded systems and their connection to the internet(Fatorachian & Kazemi, 2018). This merge is called Cyber-Physical System (CPS).Communication between humans, machines and products are possible because ofthe CPS. According to Ruppert, Jaskó, Holczinger, and Abonyi (2018) VR is anexample of a CPS. Bougaa et al. (2015) have found VR as a technology that can beimplemented in Factories of the Future and benefit multiple engineering processes.
2.8.2 Gaming industryGaming was, according to Mealy (2018), one of the first industries to embrace VR’spotential and help push the VR industry forward. According to Parker (2017) thegaming industry is developing many games that are to be played in VR, which isshowing that there is a large interest for the technology. The gaming industry is alsoinvesting a lot of money into VR for it to be adopted by more people, which keepsthe development of the technology advancing. Parker (2017) states that the gamingindustry is also said to lead other industries in evolving what VR can be capable of.Gaming consoles and mobile VR technology are said to be large contributors to theincrease in revenue for the VR market.
2.9 Advancements within Virtual Reality tech-nologies
The VR industry is constantly moving, and new technology and user applicationsare developed quickly. Statista (2019a) forecasts a continuous increase worldwide inthe market size for consumer VR software and hardware. With the industry’s con-tinuous movement there are several potential advancements in the area of VR beingdeveloped. Based on the found examples presented in this section the VR industryis advancing to more realistic immersion and enhanced user experience. Found areasare standalone HMD, improved haptics, eye tracking and better displays, which areall under development.
HMDs that are standalone, i.e. that are not connected to any wires or computer,are gaining attention on the market. These HMDs are easy to set up and have highmobility since they do not require any additional equipment except for the HMDand possibly controllers. A drawback of the available standalone HMDs today isthat some do not support tracking in all six degrees of freedom. Standalone HMDsare also not as powerful as an HMD connected to a computer. Though, over therecent years, more advanced standalone HMDs have been made e.g. the OculusQuest (Facebook technologies, 2019b).
Both more realistic and precise feedback is wanted for haptics and forces wheninteracting with the virtual environment. There are suits being developed that willgive more precise haptic feedback to the user’s full body when being inside the
18

2. Literature Study
virtual environment, for example the Teslasuit (Teslasuit, 2019). There are alsocompanies, such as HaptX Inc. that are focusing on gloves that will give even morecorrect feedback, both haptic and force to the user’s hands (HaptX Inc., 2019). Bothstated examples are available for developers but not yet for the consumer market(Teslasuit, 2019; HaptX Inc., 2019).
As mentioned in Section 2.4, eye tracking can be integrated within HMDs givingit additional features. With eye tracking the user’s focus can be traced to renderthat area in higher detail and decrease the quality of the peripheral vision to savecomputer processing power. According to Kramida (2016) varifocal displays thatcan alter the focal plane is one option to solve the problem regarding VAC. One wayto achieve a varifocal display is to make the display alter the length between the eyeand the display depending on where the user is looking, which eye tracking can do(Kramida, 2016). Oculus have made a prototype of an HMD that uses a varifocaldisplay that moves (Lang, 2018b).
Development of displays with higher pixel density is also moving forward with manycompanies working to increase the PPI (Lang, 2018a). Higher pixel density displayswill provide the HMD with better image quality giving a more realistic feeling, whichalso will allow details to be seen more clearly. According to Cho et al. (2017), thescreen door effect of being able to see the grid of pixels will also be reduced. Newdisplays that are being developed by Samsung and INT is said to have 1200 PPIrespectively 2228 PPI (Lang, 2018a). This is a significant improvement comparedto the 615 PPI, which is in the HTC Vive pro (HTC, 2019b).
19

2. Literature Study
20

3Methodology
What type of research question is one of the most important conditions for choosinga research methodology according to Yin (2014). Since the research questions aredivided in two areas, different methods are needed in support of the questions. Thedesign of the overall methodology was therefore based on combining methods tobe able to answer the research questions. To reach the aim of the project, theoverall methodology was divided into three major parts: data collection, mappingand validation. Figure 3.1 shows an overview of the different stages in the project.Each sub-chapter contains more details of which methodology and methods wereincluded in each stage.
Figure 3.1: Overview of the project methodology
The data collection was performed to collect knowledge within the area of VR as wellas ME processes. The two methods used were a literature study, which is presentedin Section 3.1, and a case study, presented in Section 3.2. Both methods wereperformed in parallel. The two methods were used as a complement to each otherto get a wider data collection, covering both the theoretical and more practical areaswithin VR and ME processes. The information from the data collection was usedin the mapping phase, presented in Section 3.3. Both the available and applicationpossibilities of VR and the case company’s different actors and tasks relevant in theME processes were mapped and compared. In the validation phase, presented inSection 3.4, the found application areas from the mapping were validated throughphysical testing where different hypotheses were explored.
21

3. Methodology
3.1 Data collection: Literature studyThe method for collecting the data for the literature study was a triangulation ofthree methods, presented in Figure 3.2. A triangulation is used for mixing multiplemethods for increasing the support and outcome of the methods (Allen, 2017).
Figure 3.2: Literature study data collection methods
The literature search was performed to gain deeper knowledge within the areas ofVR. The different areas that were researched were definitions of VR, history of VR,applications of VR within different industries and future technologies. The mainapproach was to search using search terms. According to Byrne (2017) there aretwo types of search terms, authors name or keywords and phrases connected to thetopic. Some examples of the search terms used a are: “Virtual reality“, “Virtual re-ality technology manufacturing engineering“, “Automotive industry VR“, “Virtualreality manufacturing processes“, “Virtual reality application“. The search was donethrough databases that are provided by Chalmers Library. Examples of databasesthat were used are: SpringerLink, ScienceDirect, IEEE, Google scholar and Pro-Quest. During the search the literature was structured according to possible area ofuse in an excel sheet for easier access and for creating a better overview of the re-searched areas. The sheet contained the following information about the literature:Title, Area of use, Database, Search word, Applied filter, No. hits, Date for search,Country, Year.
In addition of the literature search an analysis of the available technology on themarket was made. This analysis was important to be able to answer questions re-garding future technologies. The method was to scope the market and analyze theavailable technologies to be able to find information for the mapping phase. Thescoping was done through an internet research of up-and-coming companies withinthe VR industry as well as scoping well established companies in the industry andtheir future products. This part of the research might differ in outcome dependingon the researcher and case companies’ interest and direction.
The data collection was also supported by a statistical analysis when this was appli-cable. The method for this research was to use the Statista database (Statista, 2007).This database is recommended by Chalmers Library since it contains statistics frommarket and opinion research institutions, as well as from business organizations andgovernment institutions (Chalmers Library Catalogue, 2019). Keywords used forthe research of statistics in the data base was: VR, virtual reality, virtual reality
22

3. Methodology
application, virtual reality market, virtual reality industries. The statistical datafound was mostly connected to the status of the current VR market and the marketin the future.
3.2 Data collection: Case studyA single-case study method was used as a part of the data collection with focuson the ME processes. A case study has a distinctive advantage according to Yin(2014) in situations when a contemporary set of events are researched, over whichthe researchers has little or no control. It is also considered a beneficial method whendoing in-depth analyses of real-world cases. A case study includes a variety of datacollection procedures, the use of multiple sources of evidence is considered a greatstrength of a case study data collection because any findings or conclusions is likelyto be more accurate if they are based on several different sources of information.Yin (2014) also explains that not all sources are applicable for all case studies.Yin (2014) present six sources of evidence, two were not used for this case study.These sources were archival records and physical artifacts because these were notconsidered relevant in this type of case study. The remaining four sources were usedthrough the case study to answer the research questions, presented in Figure 3.3.
Figure 3.3: Case study data collection sources
These sources are explained more in detail in the Sections 3.2.1 - 3.2.4. In Section3.2.5 the method of handling and compiling all data from these sources is presented.As a conclusion of the whole chapter, Section 3.2.6 presents the chosen companyand its current advancements within VR.
3.2.1 InterviewsInterviews are considered one of the most important data sources for a case study(Yin, 2014). This method was chosen because it creates insight when studying hu-man actions, which was necessary for mapping of ME processes at the case company.The interview study was used to identify application opportunities at the case com-pany and identifying modes of interaction. The interviews were semi-structured, andthe questions were predetermined and structured in different topics. This type ofinterview gives the researcher more control over the topics than during an unstruc-tured interview but there is no fixed range of responses to each question like there isfor a structured interview (Given, 2008). The topics were: department related ques-tions, work tasks, IT tools, communication, challenges and VR. These topics werechosen for a way to structure the questions, which were developed in collaboration
23

3. Methodology
with both academic supervisors as well as a company supervisor. These topics werelater used for structuring the summary of the whole case study data collection.
The selection of people to interview was made in collaboration with the departmentheads at the case company and the company supervisor. The suggested people werefrom different position within each department to generate a broad perspective andcollect data from all work tasks within the departments. In total 15 interviewswere conducted over a three week period. The interviewees were contacted by emailand informed of the reason for the interview, that no preparation was necessary andthat it would take approximately 1 hour. The location of the interviews was isolatedrooms at the case company. The interviews were conducted by the two researcherswhere one was responsible of asking questions and the other were responsible forrecording the responses by taking notes. The notes were summarized, and the keypoints noted directly after each interview. This division of work enabled the re-searchers to concentrate on their area of responsibility. After each interview theinterviewee had the possibility of demonstrating their current projects or show someof their work tasks, this data collection method is presented in Section 3.2.3.
Comparing several extended texts can be problematic and confusing and a solu-tion is to display qualitative data in matrices (Miles, Huberman, & Saldaña, 2014).This is explained as a good way to collect and organize data for easier viewing andpreparing for cross-analysis with other information. Once all interviews were com-pleted a summary of the collected data was created in matrices. When summarizingthe interviews the same topics used to organize the interviews were used as matrix’sareas. Categories were identified and were color-coded for easier overview of simi-larities and differences. These matrices were later used for analyzing the case studydata collection and in the mapping phase.
3.2.2 Internal documentationYin (2014) states that documentation is most likely relevant in all case studies butthat it is important to understand that the documentation was created for a specificpurpose and objective and not created for the case study. The documentation stud-ied in this case study was the company’s internal documentation, which was madeavailable by receiving access to the internal document storage space and the intranet.This documentation was studied in advance of the interviews to be able to under-stand the fundamental organization of the ME department at the case company.The documents were studied as a complement to the interviews and to strengthenthe understanding of the organization of the departments. The documents also con-tained information about historical projects, which were studied from beginning tostart to understand all phases of ME processes.
24

3. Methodology
3.2.3 Direct observationsDirect observations are part of most case studies since they are normally performedin a real-world setting and provide additional information about the studied topic(Yin, 2014). The major observations during this case study were different types ofdemonstrations, which are summarized in Figure 3.4.
Figure 3.4: Demonstration areas
Some of the demonstrations were subsequent interviews when the interviewee hadthe possibility of demonstrating current projects, work tasks and the use of software.These demonstrations served as a complement to the interviews to gain a deeperunderstanding and a more in-depth analysis of the work processes. These demon-strations were not formally prepared or followed a structured method to be able toobserve an as realistic as possible work process. Software were also demonstratedin more in-depth sessions where the demonstrator described and showed functionsin the software. The use area within the company, the strengths and limits of thesoftware were described. The final demonstration area was physical products, whichwere demonstrated by viewing virtual prototypes and physical test products.
Another source of direct observations was as a passive observer of different col-laborative meetings. How meetings are conducted, which issues are discussed andthe use of communication tools were observed. Reflections after these meetings werenoted and later used in combination with all collected data for a better understand-ing.
3.2.4 Participant observationsAnother form of observation was participant observation. This is a good complimentto direct observation, where the observer can participate in the actions being stud-ied (Yin, 2014). Participant observations in this case study were testing of differenttechnologies and software to gain real-life experience mostly within user experience.The testing included both unprepared and prepared sessions. The unprepared ses-sions were spontaneous and did not follow any structured method. The responsibleperson for the session invited to and held the demonstration where the researcherswere able to participate and try functions of hardware or software. Notes and re-flections were written after the session to capture the knowledge gained from theparticipation. The prepared sessions were planned in advance, with a purpose anddesired result stated. After the session reflections were noted and the purpose anddesired result were compared to the outcome and result from the session.
25

3. Methodology
3.2.5 Analytic strategy of case study data collectionThe first step in analyzing the data collected during the case study was creatingmatrices summarizing the interviews. These matrices were used as a base in abottom-up approach of analyzing and summarizing the different types of data. Theinput from the rest of the data was used as additional or supportive information tothe interviews. The summary was based on how the information could be relevantfor answering the research questions and to prepare the information for the mappingand comparison phase.
3.2.6 Chosen case companyThe case study was performed at China Euro Vehicle Technology AB, which is abbre-viated CEVT. It is a development center covering all aspects of passenger car devel-opment and is a part of Zhejiang Geely Holding Group (Geely Auto, 2019). CEVTis an innovation center focused on finding smarter ways to build cars – throughmodular development, virtual engineering, and continuous innovation (China EuroVehicle Technology AB, 2019). The vision of CEVT is "To be a world leading inno-vation center, creating mobility solutions for a different tomorrow.". To achieve this,it is of essence for the company to be at the forefront of innovation and technology,which means that VR is an important tool to evaluate to decide how much addedvalue it might have to possibly succeed with the company’s vision.
The study took place at the ME department at CEVT. The department worksto ensure that the developed cars are possible to manufacture. ME is involved inthe whole vehicle development project from start to finish, which consists of multiplemilestones and parallel work processes. The ME department at CEVT consists offive major departments, Body in White (BiW), Geometry (GEO), Painting, Stamp-ing and Trim & Car Final (T&CF). The departments focus on different areas inthe vehicle factory. When manufacturing a car there are several ways of executingthe processes and in which order they should be performed depending on whichcompany or production facilities is studied. However, there are some general stepsand organization which most automotive production facilities follows.
1. Stamping: The first step when manufacturing a car is stamping and formingof sheet metal. This process produces all metal parts of the car, which canbe done both in-house and by external suppliers most common is to have acombination of both.
The Stamping department at CEVT works to ensure that all metal partsof the vehicle are possible to manufacture.
26

3. Methodology
2. BiW: The following step is to join all formed parts into a car body structure,the metal body of the car is assembled. Robot or manual welding are themost common processes. The car in this part of the factory is called a "Bodyin White", which is when sheet metal parts form the skeleton of the car, un-treated and unpainted.
The BiW department at CEVT works to make sure that the car is feasible toassemble from the manufacturing point of view.
3. Painting: The third step is the painting processes when the "Body in White"goes through material treatment processes and several different painting pro-cesses. These processes ensure the material is protected against for examplecorrosion and chipping as well as the car getting the correct color.
The Painting department at CEVT works both as construction department(for example constructing the color and deciding where paint and sealing needsto be placed) and makes sure the processes are possible to execute to get thewanted surface.
4. T&CF: The final stage of the production line is when the rest of the car isassembled, the engine and all trim. Trim is all additional parts of the car, suchas glass, handles, seats and electronics etc. Once all parts are assembled thecar goes through multiple testing phases before it gets shipped to the customer.
The T&CF department at CEVT ensures that the car is possible to assembleand makes it easy for the operators to do the right thing every time.
5. The Geometry (GEO) department at CEVT works to ensure that the caris manufacturable within the correct tolerances to assure the right quality
27
3. Methodology
All ME departments at CEVT are organized in a similar way with some modi-fications. These modifications are dependent on mainly two differences. The firstdifference is in work tasks where some departments have additional work tasks need-ing special competence or work processes to perform that task. The other differenceinfluencing the organization is the size of the departments. Some of the smallerdepartments have people covering several different positions and functions at thesame time but in general there are some positions reoccurring at all departments.They are director, system manager, system project leader, manufacturing engineerand simulation engineer. In Table 3.1 the different purpose and work tasks arepresented of each function.
Table 3.1: General functions and simplified description
Function Description
Director Head of the department
System Manager Works to create an efficient way of working forthe team and works with tasks that require corecompetences
System Project Leader Leading projects and coordinating cross functionalteams
Manufacturing Engineer Plan the production process of a product in themost efficient, effective and economic way
Simulation Engineer Creates virtual models to use for virtual testing ofprocesses
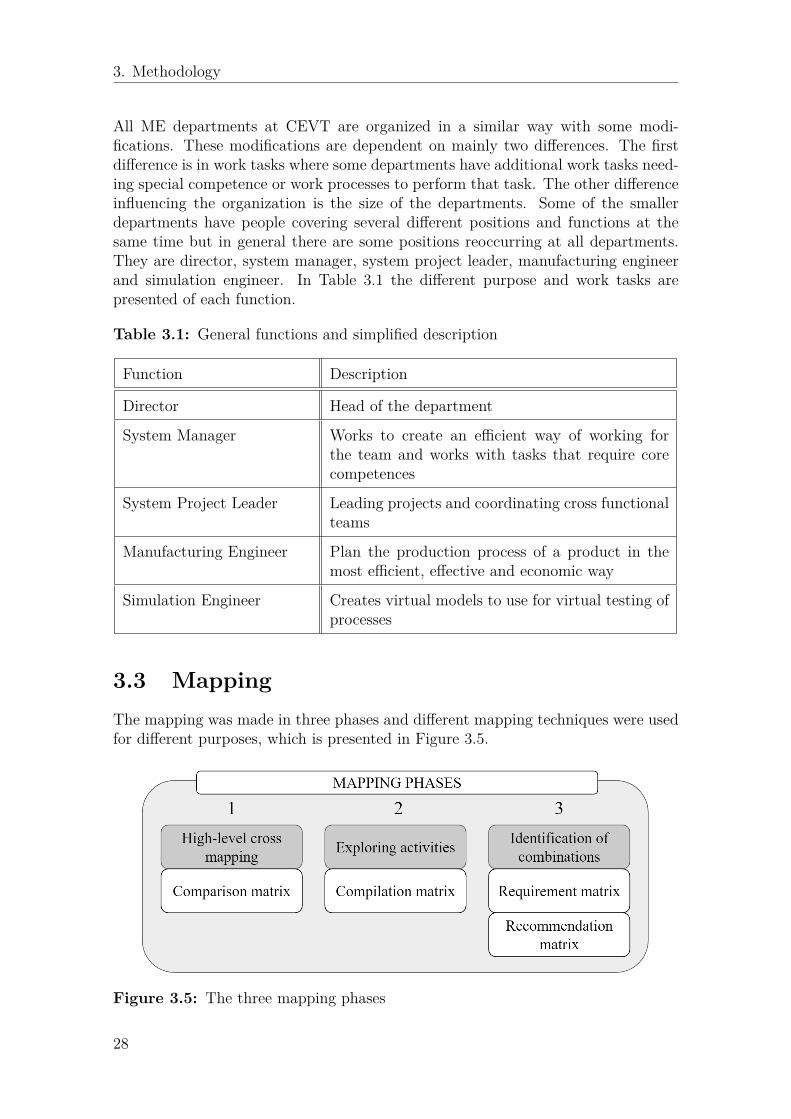
3.3 MappingThe mapping was made in three phases and different mapping techniques were usedfor different purposes, which is presented in Figure 3.5.
Figure 3.5: The three mapping phases
28

3. Methodology
In the first mapping phase a comparison matrix was created to compare differentapplication areas on a high level. Identified areas of application for VR were crosscompared with areas of application at the case company. Identified areas of ap-plication for VR were found in the literature study. From the interview summarycategories were identified and used as areas of application within the case company.When doing the high-level cross mapping weight was put on combinations where VRwould be more beneficial for the category of application area at the case company.This map showed where VR was most suitable but also in which areas it should notbe implemented in. Once this map was finalized the most similar areas were joinedtogether for easier mapping in the second phase.
In the second phase a compilation matrix was created where each activity was ex-plored and deeper described: how it is performed, with which tools, the purposeof the activity and what demands are connected to the activity. This was basedon information from the case study data collection. The activities described wereconnected to the areas identified in the previous phase. This map was made inpreparation for cross mapping the activities with VR in the final mapping phase.The demands on the activities were used as a basis for the requirement specificationon VR.
In the final mapping phase VR applications were identified for each ME activity.The map was built in two steps. The first step identified which requirements dif-ferent activities had on the VR application based on the demands on the activitiesfrom the previous phase. For each activity the demand on FOV and resolution ofthe HMD were defined as well as if haptics, motion tracking and controllers wereneeded for the activity. These requirements areas were based on the literature studydata collection. In the second step recommendations of the suitable VR technologyand peripherals were made based on what requirements each activity had and anapproximate time span was stated based on which technology was needed.
3.4 Validation: Physical testingA validation was necessary to perform to confirm and strengthen the results from themapping. The method chosen was to perform a physical test at the case companywith an evaluation survey connected to the test. The survey was used to gather dataof people’s opinion and behavior. The main purpose was to evaluate the potentialbenefits from using VR compared to regular desktop setup when performing differenttasks since most of the identified activities at the case company are performed witha computer today. Two additional purposes were to make employees at ME aware ofthe VR initiative and to test different hypotheses to strengthen the mapping result.When developing the test four steps were followed, the overview of the process ispresented in Figure 3.6. The sub-steps within preparation and design can be donein any order or parallel. The sub-steps within building and performing needs to bedone in order.
29

3. Methodology
Figure 3.6: The four development phases
3.4.1 Preparations of the test developmentWhen developing the test, the first step was to do the preparations. The prepara-tions consisted of defining the purpose of the test and to state hypotheses that weregoing to be evaluated in the test. The four hypotheses were the following:
• H1: VR is preferred compared to a regular desktop• H2: Estimations of changes when implementing VR in different activities will
result in:– The quality factor will be evaluated to “Great improvements”– The time/cost factor will be evaluated to “Improved”– The user experience factor will be evaluated to “Improved”
• H3: When evaluating factors time is considered the most important, andcommunication is the area which is believed to be the most beneficial activityto implement VR in.
• H4: VR is believed to be a tool to utilize.
3.4.2 Designing the testThe next step was designing the test, survey and what profile the test person shouldhave. The design of the test was made in collaboration with the supervisor at CEVTand an expert in the software IPS. IPS was the chosen software for building the VRenvironment in because this software had the best VR support at CEVT at the timeof the development of the test.
The general idea was to have the test person first perform a task on a desktopsetup and then do the same task in VR. However, the different departments atCEVT do not use the same software and have limited knowledge within IPS. Tolevel out the differences in software knowledge it was decided to pre-record the taskperformed on the desktop. The pre-recording was done by screen recording the task
30

3. Methodology
being performed. The videos created were to demonstrate how the tasks were per-formed today. The videos were edited, and descriptive text was added to explainhow the task was performed.
The test consisted of three different tasks, each task from different parts of thefactory with activities identified in the second mapping phase. The first task wasequipment verification, which is a part of the BiW area. The task was to identifywhich weld gun would be suitable for the welding station. Today this is performedwith simulation in Process Simulate, which was the program used for recording thevideo. Two of the guns were approved in the simulation and in the VR environmentthe test person was to decide which of the two guns were best suited for the station.
The second task was an ergonomic evaluation of a sealing process in the paintingarea of the production. In the paint station there were two car bodies in differentline heights with green markings in the front wheelhouse representing where thesealing was going to be placed. In the video the built-in tool Intelligently MovingManikin (IMMA) in IPS was used for simulating the movement of several manikinsand produce an ergonomic evaluation chart. In the VR environment the test personswere to experience the operators work position when placing the sealing with thepaint gun on the two cars.
The third and final task was an assembly geometry assurance, which is a part ofthe T&CF area of the production. The video demonstrated the use of IPS’ pathplanning function where two engine pads were evaluated if they were possible toassemble and with how much clearance there was to the surrounding components.In the VR environment the test persons were to assemble one engine pad in the carbody.
After a test person had performed all tasks, both by watching the video and complet-ing the tasks in the VR environment, a questionnaire was filled in. The questionnaireconsisted of 5 bigger areas, where no. 2-5 is connected to each hypothesis (H1-H4):
1. Background of the test person.2. Questions about desktop vs. VR.3. Estimation of benefits within quality, time, cost.4. Evaluating importance of different factors.5. Use of VR in work processes.
When designing the survey Google forms were used for creating the questionnaire.The questions were closed-ended where the test person was provided with pre-determined options to choose a response from. Some questions had multiple choiceoptions when this was necessary. The survey was evaluated and adjusted togetherwith supervisors and after feedback from trail runs.
When designing the test one critical part was to determine the test subjects. Bothdemands, and preferences of the person’s profile were defined. The demand was setto that the person should have no or limited knowledge of using VR at the case com-
31

3. Methodology
pany. This was because the pioneers within VR at the case company were not thatmany and their knowledge in comparison with someone with limited knowledge ofVR would have had an impact on the result of the test. By leveling the knowledge ofVR, the comparison between VR and desktop would be more valid. One purpose ofthe testing was also to make people aware of the existence of VR. The preferences ofthe test persons were decided to be simulation engineers or manufacturing engineerssince they are of majority at the ME department but also whom most likely workwith similar tasks and in the future also VR. The test persons were chosen throughthe directors of each ME department. They made their recommendations basedon whom they felt suited the profile of the demand and preferences best. Threepeople from each department were requested. A generic number of people fromeach department were considered representative, even though the percentage of theparticipating people from each department would differ because of the differencesin number of people at each department.
3.4.3 Building the testOnce the tasks were decided the feasibility of the test was discussed with supervi-sor at CEVT. Adjustments were made to the test to be better suited for the timeframe, the competence of the researchers and test persons. Examples of adjustmentswere to reduce the number of weld spots and remove one engine pad. The actualbuilding of the VR environment was in assistance with an expert in the softwareIPS where previous geometry and CAD files were used to build the three differenttasks. Once the environment was built, trial runs were made, and the environmentwas adjusted according to the found complications such as clash detection, position-ing of tools and parts as well as dealing with restrictions that the used computer set.
During the trial runs it was also decided on what information should be presentedto the test person before, during and after the test. This was done to prevent influ-encing the experience and impressions of the different test persons, while the testwas being performed. Points that were presented were the following:
• Presentation of the purpose of the test• Presentation of how the test was going to be performed• Emphasizing that the focus was not the software or the specific tasks, but the
comparison between VR and desktop that was important.• Short guide of how to navigate in the VR environment• Explanation of what to investigate in the VR environment
32

3. Methodology
3.4.4 Performing the testWhen performing all the tests each test person was booked for one hour duringwhich the different tasks and survey were completed. The test location was in thecurrent VR room at CEVT with HTC vive setup. After a short introduction thefirst video was viewed and the same task was then performed in VR, then the secondvideo was shown and so on. This order was decided since it provided the test personwith easier understanding of which task was supposed to be performed in the VRenvironment. When the questionnaire was filled in it was possible for the test personto ask questions if there were any uncertainties.
33

3. Methodology
34

4Results
In this chapter the result is presented and consists of four parts, an overview of thestructure of the chapter is presented in Figure 4.1. In Section 4.1, the methodol-ogy for the study is compiled so it can be used by others for evaluating how newtechnologies can be implemented. In Section 4.2, the collected case study data ispresented with the most relevant areas deeper explained. In Section 4.3, the resultfrom the three mapping phases are presented. The result from the physical testingis presented in the final section, Section 4.4.
Figure 4.1: Overview of the result chapter
4.1 Method for evaluating new technologiesIn this section the first research question is answered, how to evaluate applicabilityof new technology in ME processes. The methodology followed in this thesis is sum-marized and presented in this section as a method for evaluating new technologies.The evaluation method is based on previous developed method and tools, presentedin Chapter 3. Through the case study this method was used to find application op-portunities for VR at the case company. The overall steps for the evaluation methodare presented in Figure 4.2.
Figure 4.2: Method for evaluating new technologies
35

4. Results
4.1.1 Step 1: Data collectionThe first step is to gather the data needed. The literature and case study dataare both equally important because they are the base for the rest of the evaluationprocess. The literature study is performed to research the technology. Points ofresearch are:
• Definition and general use of the technology.• The different type of hardware and software connected to the technology.• Current application areas.• Advancements of the hardware and software development.
The steps to follow when performing the literature study are:1. Search terms: Set up terms to search for what type of information needs to
be acquired, which should be connected to the above points of research.2. Databases: Use the search terms in available databases. Suggestions of
databases are: SpringerLink, ScienceDirect, IEEE, Google scholar and Pro-Quest.
3. Structure: During the literature study make sure to structure the informationabout the literature in for example an excel sheet for easier access to it laterduring the evaluation process.
4. Scope market: In addition to the literature study make a scope of the currenttechnology market to generate additional information about the advancementsof the technology.
The case study data collection is performed to investigate the potential applicationareas. When performing the case study, it is important to research the followingareas:
• Organization of the department or company• Type of work tasks performed• Type of IT tools used• How the communication is executed• Challenges that are faced at the case company• The current state of the researched technology
Tools for gathering this data are:• Performing interviews• Studying internal documents• Making direct and passive observations
The steps to follow when performing the interviews are:1. Type: Decide on the type of interview, unstructured, semi-structured or struc-
tured. This depend on what type of questions you decide to have.2. Questions: Write the questions and do a trial run to understand how they
can be interpreted.3. Topics: Structure the questions in relevant topics to facilitate for the inter-
viewee.
36

4. Results
4. Plan: Plan the interviews. For example, what type of people is needed, howlong time is required and what kind of information needs to be conveyed beforethe interview. The number of people to interview will differ between companiesand departments depending on the size.
5. Choosing people: When choosing people to interview it is important to coverall type of work positions at the company or department that is researched.This is to gather sufficient data about all different work tasks performed.Involve upper management in the selection for choosing interviewees sincethey have best knowledge about the people’s capabilities.
6. Conduct interviews: Conduct the interviews. Make sure to take notes orrecord the interview. Make sure to respect the ethics of the individual andthat they feel comfortable during the interview.
7. Summarize data: Once all data is gathered, it should be compiled into asummary for easier overview of the collected data to identify the possible areasof application.
The steps to follow when studying the internal documents are:1. Plan: Plan what you are looking for in the documents. It is easy to get lost
in the company’s documentation.2. Search: Search yourself or get help from the people working at the company
to make the search easier.3. Document: Document the findings and connect it to the interview data.
The steps to follow when making direct and passive observations are:1. Plan: Plan what the purpose is and what type of questions should be answered
during the observations2. During observations: During the observation make sure to ask questions to
gain a deeper knowledge of the demonstrated task.3. Reflect and note: Make reflections about the leanings from the observations.
Document the findings and connect it to the interview data.
4.1.2 Step 2: MappingThe second step of the evaluation process is mapping the findings from the datacollection by following these phases of mapping:
1. Compare: Compare application areas of the technology and company toidentify which areas are compatible.
2. Explore: Further explore the identified areas of application to understandhow activities are performed today.
3. Identify: Identify combinations of the technologies for each activity withrequirements and recommendations based on the literature study.
37

4. Results
4.1.3 Step 3: ValidationThe final step is to validate the result from the mapping through a physical test.By doing this it is possible to test if the found application areas of the technologyat the company are correct and to gather more information about the attitude ofthe employees towards the technology.
1. Prepare: Define the purpose of the test and set up hypotheses that will betested.
2. Design: Design the test, the survey and what test profile is wanted.3. Build: When building the actual test, evaluate the feasibility of the test, what
adjustments are needed for it to be better suited for the time frame and theknowledge of the test person. Make adjustments accordingly and then buildthe test. Make sure to do a trial run since most errors will then be found andadjust these so they will not occur again.
4. Perform: When performing the test make sure to stick to the time limit andthat the same information is conveyed to each test person so that the risk ofbias is reduced.
5. Analyze: Analyze the result from the test and compare it to the result fromstep 2 in the evaluation method. Identify the differences and evaluate thehypothesis.
4.2 Collected case study dataIn this section the result from the case study data collection is presented. Whenanalysis of the collected data was made matrices were created to summarize thedifferent types of data. In this section the most relevant information from the casestudy will be highlighted and the full matrices can be seen in Appendix A. Thehighlighted areas are: IT tools, current VR status, communication and challenges.
4.2.1 IT toolsCommon IT tools that all departments use are summarized and these are presentedin Table 4.1.
38

4. Results
Table 4.1: The common IT tools used at all ME departments at CEVT
Tool Description
Sharepoint Is a web-based collaborative platform that integrateswith Microsoft Office and is used for document man-agement.
Skype Used as a tool for communication, also possible to sharescreens for easier distance collaboration.
Outlook An email program for communication purposes and isalso used for scheduling.
Office package Tool used for documentation and presentation.
Teamcenter Product Lifecycle Management (PLM) software fromSiemens used for storing and sharing product data andprocesses.
There are multiple other IT tools available at each department. These tools havespecific application areas depending on the task that they are used for, for examplesimulation tools. These tools are summarized and presented in Table 4.2.
Table 4.2: Table presenting the specific IT tools used at different ME departmentsat CEVT
Tool Description Department
AutoForm Software for sheet metal forming usedfor stamp simulations.
Stamping
Catia Software developed by Dassault Sys-tèmes and is used for computer-aideddesign, manufacturing and engineering.
Biw, GEO,Paint
IPS A math-based software tool used forverification of assembly feasibility, de-sign of flexible components and er-gonomic evaluations.
Paint, T&CF
Pam-Stamp A stamping simulation software mostlyused for thermoformed parts.
Stamping
Siemens Process Sim-ulate
Software tool from Siemens used formanufacturing process verification in a3D environment.
BiW, Paint
39

4. Results
4.2.2 Virtual Reality at case companyAt the time of the case study some advancements within the field of VR had beendone at CEVT. The ME department has a room equipped with a VR setup thatthey can use. The VR setup is an HTC Vive HMD with two VR controllers. Thisroom was set up by a few engineers from the T&CF department that saw a potentialof using VR within their work. These are also the people that currently utilizes theVR setup most. The general level of knowledge of VR is however low at the MEdepartment. The people that made the VR setup have the most knowledge aboutit and are working to share the knowledge to others at the ME department so thatit can be utilized more. Even though some people use VR in their work process itis not stated in their work process descriptions as a tool to use for certain activities.A picture from the current room can be seen in Figure 4.3.
Figure 4.3: Current VR room at CEVT with HTC vive setup. (Authors’ image)
4.2.3 CommunicationCEVT is a Swedish company owned by a Chinese cooperation, which means thata lot of the communication is long-distance through several time zones to Chinesemanufacturing partners. This puts a high demand on the type of communication.There is a technical need for fast and stable internet connection, reliable hardwareon both sides and a well-functioning Skype connection. This is sometimes consid-ered, by the interviewees, as a limitation for the employees in their long-distancecommunication with each other. It is perceived as difficult to communicate throughscreen sharing. Connected to this there is also a need for many business trips toChina to enable easier discussions and ensure everyone understands and solves thesame problem with the parts or processes. These trips are also necessary in thephysical testing phase since there are several areas necessary to test in reality beforeramping up production. Areas in need of testing are car crashes, perceived quality,assembly precision and production processes. There is however a desire to minimizethese trips because of possible time and money savings.
40

4. Results
The internal communication is today handled through emails and in different cross-functional meetings. Sometimes it is perceived, by the interviewees, that changesmade to a concept is not communicated properly or missed. This issue is solvedtoday by participating in meetings as audience to receive the necessary informa-tion. The cross-function meeting is a forum where changes to a part or processare discussed together with several different functions participating. During thesemeetings manufacturing challenges are discussed from several different perspectivessince one change in one department affects others as well. The coordination of allchanges is Research & Development (R&D) responsibility therefore it is importantto have good communication so the importance of the issue is understood properly.Several departments wish for a way to simplify their communication barriers us-ing other tools. A lot of communication is also done with internal colleagues fromthe same department. This is considered an easier communication since the peo-ple involved comes from the same discipline and are more closely related to the work.
The meetings most often take place in meeting rooms, but smaller discussions arecommon to have directly at a person’s desk. The number of people attending themeetings can vary a lot, but the majority are under 5 people. Meetings throughSkype are very common if someone cannot be present physically. If this is the casethe screen is often shared so that everyone can see the same image. When presentingsomething during meetings it is mostly done by 2D images in the form of screenshotsof the discussed problem with explaining text and graphics.
4.2.4 ChallengesME works for checking the manufacturability of the car within different areas. Whendoing these checks there are several different occurring problems connected both tothe product but also the work process of the engineers. The problems commonlyfaced can be categorized into: analysis, certification, communication, ergonomics,lack of information, IT, manufacturability and simulation limitation.
• Analysis of a simulation is described as a problem because functions to beanalyzed are so small they cannot be visualized in a simulation. Anotherproblem connected to analysis is when studying for example tool retraction,reachability and perceived quality. In these cases there is a need for physicaltesting to be able to analyze these problems. Analysis is a big category sinceall work tasks include some sort of analysis of a problem to be solved.
• The second category is certification. This was mentioned by the intervieweesas a problem because right now there are laws and regulations, which demandfor example car crash testing to be able to certify the car. Certification of thecars today demand testing in real life and it is not enough to verify it virtually.Laws and regulations are also different depending on if the car is produced inChina or Europe and modifications need to be made to the car depending onwhat part of the world it is produced in.
41

4. Results
• The third category is communication problems. Challenges with commu-nication are for example language barriers and communication regarding de-cisions. Lack of decision making and the communication of the decisions in-fluences the understanding of the actual problem. There are many differentdepartments collaborating and people come from different backgrounds, whichalso influences their perspective on how to communicate.
• Another category is challenges regarding evaluating sustainable ergonomicsfor the operators. These types of problems are connected to analysis but arespecific to if the person can perform the operation or not, if they can reach thewanted position within the ergonomic standard. The standards are howeverdifferent between countries, which also needs to be considered.
• Another category is challenges related to a lack of information. These typesof problems can be related to communication problems but are more specifiedto missing information of prerequisites, decisions, time plans, changes or thatthe information is outdated. These types of problems can be related to work-ing outside of the set standards but also lacking in standards for certain worktasks.
• The limitations and challenges connected to the IT tools are expired licenses,slow internet connection influencing the quality of conversations through Skypeand programs lagging due to high amount of data. This also has connectionto the computer power needed for running simulations, which also is perceivedas being a problem when running bigger simulations.
• Challenges connected to manufacturability are problems with producingand manufacturing the vehicle. It can be that something does not work inthe car, construction problems, problems with material cracking or a need forincreasing soundproof material. These types of problems are part of the worktasks for the ME departments to solve when evaluating if all parts of a car arepossible to manufacture or not.
• The limitations with the simulation software are also a common challengethat is experienced. This means that the simulation software that are acces-sible today cannot simulate everything that is wanted. This problem makesdecision making more difficult and unreliable. Coloring and back spring ofmaterial are examples of cases that cannot be simulated.
These eight categories were decided to be used in the mapping phase as areas ofapplication for ME. Most activities performed at the ME department at the casecompany can be categorized into these areas.
42

4. Results
4.3 Result from mappingIn this section the second research question is answered, what application opportu-nities there are between available VR technologies and ME processes. This sectionwill present the result from the mapping of both VR and ME. Three matrices werecreated for this step. The most relevant information will be highlighted in this sec-tion and the full matrices with more detailed information can be seen in AppendixB.
4.3.1 High-level cross mappingFor the high-level cross mapping areas of application for VR were cross comparedwith areas of application for ME. The application areas for VR were identifiedthrough the literature study, presented in Section 2.6. The areas of applicationfor ME were the eight categories identified through the case study data collection,presented in Section 4.2.4
Areas of application for VR:• Communication• Design• Ergonomics• Training• Virtual assembly• Visualization
Areas of application for ME:• Analysis• Certification• Communication• Ergonomics• Information• IT• Manufacturability• Simulation limit
In the high-level cross mapping, seen in Appendix B.1, two ME areas were removedas possible areas of application of VR. These two areas, IT and certification, werenot supported by the areas of application for VR found in the literature study. Theremaining ME areas were matched together into three different general areas: anal-ysis (analysis and ergonomics), communication (communication and information)and visualization (manufacturability and simulation limit).
4.3.2 Exploring activitiesIn the second mapping phase a deeper research of activities at the case companywas performed. In total 17 potential activities suitable for VR were found withinthe three areas. The activities were appointed a category. The activities mayoverlap between areas but were categorized for structural purposes. More detailedexplanations of the activities can be seen in Appendix B.2.
43

4. Results
Analysis:• Assembly geometry
assurance• Ensure safety of op-
erator• Equipment verifica-
tion• Ergonomics• Reachability• Study processes
Communication:• Claim support• Collaboration• Create work instruc-
tions• Discussions• Meetings• Status reporting
Visualization:• Concept verification• Experience cell lay-
out• Experience factory
layout• Experience line lay-
out• Perceived quality
4.3.3 Identifications of combinationEach activity was appointed a recommended HMD and set of peripherals. The HMDand peripherals used for the recommendations were found in Section 2.3.4 and 2.4and are presented here:
• High resolution HMD• High FOV HMD• VR controller• Motion tracking• Haptic feedback• Eye tracking• VR motion platform• Eye tracking• VR motion platform
The full matrix with all the combinations can be seen in Appendix B.3. It wasfound that most of the activities could be used with standard VR equipment that isavailable today at the case company. These activities could therefore be implementedtoday. The other activities that required extra equipment were set to be able toimplement within one year or later since the equipment is not currently available atthe case company. There was no activity that required eye tracking or a VR motionplatform, which led to them not being in the matrix. For some of the activitiestwo combinations of HMD and peripherals were recommended. One combinationwas done for the minimum requirement of the VR equipment to be able to performthe activity. This combination would be enough to perform the activity and thisimplementation can be done earlier. The other combination was recommended withadditional equipment to have an increased output level of the activity but woulddelay the time span of implementation.
4.4 Physical testingIn this section the result from the test and survey is presented and the hypotheses,from Section 3.4.1, are answered. This is used a base for validating the found appli-cation opportunities, presented in Section 4.3. All the answers to the questionnaire
44

4. Results
are not presented in this section but the full questionnaire with answers can be seenin Appendix C.
4.4.1 Desktop vs. Virtual RealityIn total 13 people, 22% of the ME department, took part in the test. The distribu-tion varied from two to four people from each ME department. The majority of thetest persons matched the designed test person profile and none of the test personshad previously used VR for their work tasks at CEVT. It was not possible to onlyinclude manufacturing engineers or simulation engineers due to unavailability. Thismeant that people who had other positions also participated in the test.
The first hypothesis for the test was that "VR is preferred compared to a regu-lar desktop". Based on the answers from the questions relevant to this hypothesisit can be seen that most of the test persons either prefer VR or wants to use VRin combination with a regular desktop setup. None of the test persons chose onlyto use desktop for explaining tasks and problems and a majority voted for VR asthe preferred option. A majority of the test persons also voted for VR as a bettermethod for visualization. When making decisions a majority voted for the use ofboth VR and desktop. These results can be seen in Figure 4.4. Based on theseanswers it can be said that overall the hypothesis is false but correct in explainingand visualization.
Figure 4.4: Result desktop vs. VR
A majority of the test persons did not feel any symptoms of motion sickness but therewere some persons that did feel motion sickness in different degrees. One personanswered that she/he was close to being stomach sick. The general experienceof being in immersed in the virtual environment was positive among all the testpersons expect for one whom had a neutral experience. From direct observationsit was possible to see that some people had problems using the controllers and tointeract with the environment. This problem was more present in the beginning ofthe test and the test persons got more comfortable with the technology over theduration of the test. Many of the test persons also mentioned that haptic feedbackwhen colliding with objects would be an improvement to the user experience.
45
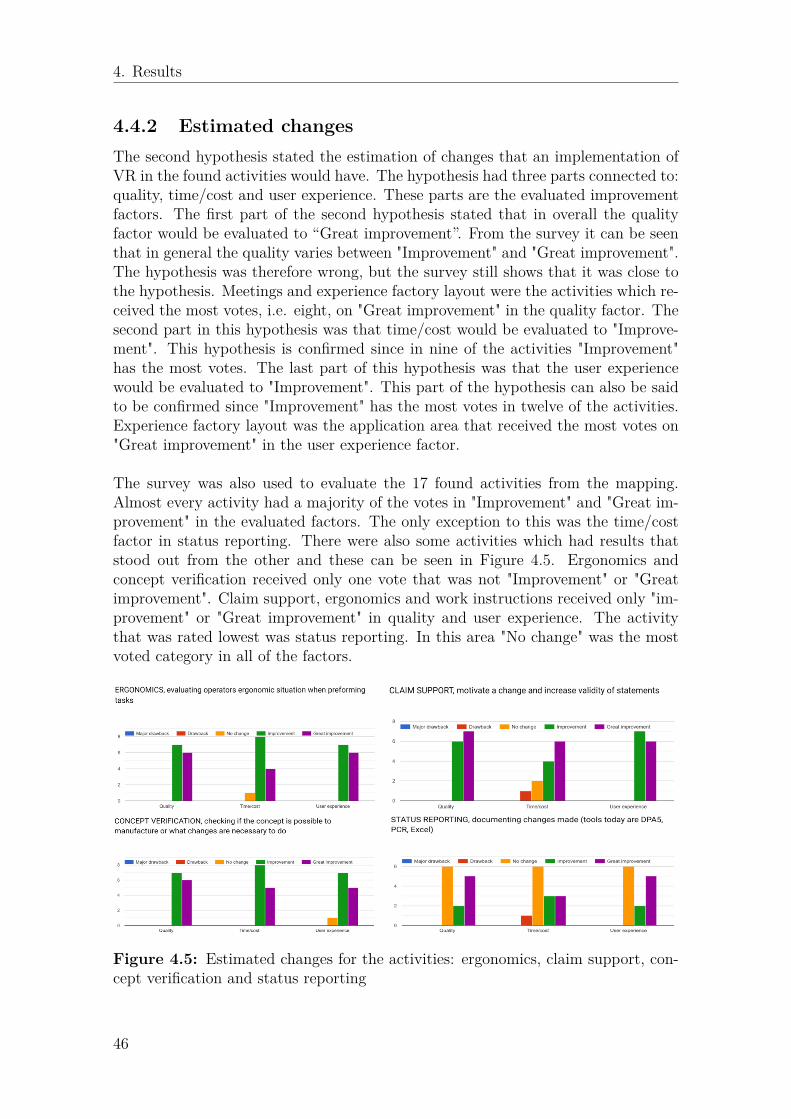
4. Results
4.4.2 Estimated changesThe second hypothesis stated the estimation of changes that an implementation ofVR in the found activities would have. The hypothesis had three parts connected to:quality, time/cost and user experience. These parts are the evaluated improvementfactors. The first part of the second hypothesis stated that in overall the qualityfactor would be evaluated to “Great improvement”. From the survey it can be seenthat in general the quality varies between "Improvement" and "Great improvement".The hypothesis was therefore wrong, but the survey still shows that it was close tothe hypothesis. Meetings and experience factory layout were the activities which re-ceived the most votes, i.e. eight, on "Great improvement" in the quality factor. Thesecond part in this hypothesis was that time/cost would be evaluated to "Improve-ment". This hypothesis is confirmed since in nine of the activities "Improvement"has the most votes. The last part of this hypothesis was that the user experiencewould be evaluated to "Improvement". This part of the hypothesis can also be saidto be confirmed since "Improvement" has the most votes in twelve of the activities.Experience factory layout was the application area that received the most votes on"Great improvement" in the user experience factor.
The survey was also used to evaluate the 17 found activities from the mapping.Almost every activity had a majority of the votes in "Improvement" and "Great im-provement" in the evaluated factors. The only exception to this was the time/costfactor in status reporting. There were also some activities which had results thatstood out from the other and these can be seen in Figure 4.5. Ergonomics andconcept verification received only one vote that was not "Improvement" or "Greatimprovement". Claim support, ergonomics and work instructions received only "im-provement" or "Great improvement" in quality and user experience. The activitythat was rated lowest was status reporting. In this area "No change" was the mostvoted category in all of the factors.
Figure 4.5: Estimated changes for the activities: ergonomics, claim support, con-cept verification and status reporting
46

4. Results
4.4.3 Evaluating importance of different factorsThe third hypothesis was that "When evaluating factors time is considered the mostimportant, and communication is the area which is believed to be the most beneficialactivity to implement VR in". From the survey it can be seen that the most impor-tant factor in general was quality. Quality was also the most voted factor withinthe three different application areas: analysis, communication and visualization.Though, an increase in votes for low time consumption and user experience couldbe seen in visualization and communication. The most beneficial area to implementVR in was believed to be visualization. From direct observation during the tests itcould be noted that many of the test persons commented about visualization as atool for easier communication. However, based on the survey the third hypothesisis false.
4.4.4 Use of VR in work processesThe last hypothesis was that "VR is believed to be a tool to utilize". This hypoth-esis is confirmed based on that almost every one of the test persons thought thatVR could be utilized in their work today. Further, it can also be seen that almostevery test person saw potential benefits with VR within analysis, communicationand visualization. It was also found that the most common concern regarding VRis that the test persons do not know how to implement it in their work tasks.
Based on the mapping and testing, final recommendations and guidelines were givento the case company to explain how they should work with VR in the future, thisis presented in Appendix D.
47

4. Results
48

5Discussion
The structure of the discussion is based on the research question, purpose and aimof the thesis. Section 5.1 discusses the first research question and the first aim.The second research question and the second aim are covered and discussed in 5.2.Lastly, the result’s impact on sustainability is discussed in Section 5.3.
5.1 Evaluation methodThe developed evaluation method is an overall method, which might be applicablefor other technologies and companies as well. The developed method is based onpreviously developed methods and tools. Through the case study this method wasapplied. The three major steps of the evaluation method are all founded on othermethods and theories. When combining methods with theories and verifying thedeveloped evaluation method through the case study it contributed to the contin-ued research and development within manufacturing engineering.
Through the data collection in the first step of the evaluation method both in-formation about the technology and the possible application opportunities withinthe company is gathered. The multiple uses of sources cover different perspectives.For the case study data collection four different sources are used based on the sixsources of evidence described by Yin (2014). From the implementation of the eval-uation method at the case company it was perceived that the two excluded sources,archival records and physical artifacts, were not relevant. Even in other cases thepossible information from these sources are not likely to produce any beneficial in-formation in understanding possible application areas. According to Yin (2014) theinterviews is one of the most important sources of information when performing acase study and this was also true for this case study. The information gathered fromthe interviews made it possible to understand how to further investigate differentareas with the help of the three other sources of evidence. Since a lot of the researchof the case company was based on the interviews it would have been beneficial tointerview even more people to get other perspectives of for example challenges andcommunication issues. However, the actual interviews covered all different typeof relevant profiles at the ME department, which was enough for finding possibleapplication areas in this case.
49
5. Discussion
When doing the mapping, in the second step, the generated matrices give a clearoverview of the evaluated technology and especially the activities and applicationareas where the technology possibly can be used. This overview serves an importantcomponent for understanding and structuring the research. The comparison of thetwo different data sets, included in the mapping (application areas and the technol-ogy’s application areas), creates a possibility to identify application opportunities.It also removes data that is no longer relevant, which further makes the researcheasier to understand.
In the final step, when doing the validation through a physical test, it is possible tovalidate the found application opportunities. In this validation phase the companyalso has the possibility to understand the level of knowledge of their employees.When doing the physical testing 13 people participated in the test, which representsapproximately 22% of the workforce at ME. When studying the responses, a trendin the answers can be spotted in almost all questions, this indicates that the numberof test people were enough. However, if more people would have participated thedata validity had been greater and the spread of VR knowledge at the case com-pany would have been wider. If participants with knowledge of VR would have beenallowed to take part in the test, it would probably have influenced the result. Forexample, they might have focused on comparing how they work with VR instead ofcomparing it to the desktop setup.
The evaluation method has a possibility to be used in other instances where newtechnologies are evaluated. How far from the automotive industry the method mightbe used is hard to state since the case study was made in that particular industry.There is however a possibility that it can be used in other industries as well, forexample within healthcare industry and education. Since no part of the evaluationmethod is connected exclusively to a particular field within the automotive industrythere is a potential for an increased application area of the method. The evaluationmethod worked well for the case company and it would be interesting to apply it forother technologies and other companies to further study the usability of the method.
5.2 Application areasThe three found areas of application for VR were analysis, communication and vi-sualization. All the categories are somewhat intertwined and in regards to whichactivities were categorized into which category it was hard to find distinct differ-ences. This might also be the hardest part of the method to reproduce since otherresearchers might find other categories and activities or categorize them in a dif-ferent way. However, the principle of the function of the different categories is tounderstand where the greatest potential of VR lies, which the found application ar-eas indicated. Another purpose of the categories was to understand where VR mightnot be suitable to implement. Certification was one of the two areas that did notmatch with any of the areas of application for VR. Certification today is connected
50

5. Discussion
to physical testing and cannot be replaced by a virtual test. In the future this mightbe a possibility, but laws and regulations need to be changed for the certificationto be valid for virtual concepts as well. If a virtual concept would be enough forcertification there would be no need for a actual physical build before ramping upproduction. This would probably save a lot of time and reduce major costs.
By following the created method, in total 17 activities to apply VR in were foundand validated through the physical testing. The found activities were based onboth the literature study and case study, which gives the findings good credibility.The credibility is further increased by the result from the validation where it couldbe seen that implementing VR in the found activities was considered to provideimprovements. Even though status reporting was the lowest rated activity in thesurvey it is still included as an application opportunity for VR. One reason thisactivity was the lowest rated is probably because of the standard way that it isperformed today, and that people feel confident in how the activity is structuredand performed. This might lead to that it is perceived as non-beneficial or difficultto change the standard way of working if implementing VR in the activity.
Regarding the questions in the survey, about which method the test person feltmost confident in basing their decision or recommendation on, there was a largedifference between explaining, visualization and decision making. Regarding expla-nation and visualization, VR was perceived as the easiest to use, while for decisionmaking most people would prefer a combination of VR and desktop. This showedthat VR should not replace the current way of working with a desktop but instead beused as a complementary tool to improve the analysis in the ME processes. Thoughas the VR technology evolves, this may change. In the future, problem solving willmost likely be very different. When the use and number of virtual models increasethere will also be a bigger need for virtual tools, such as VR. The problems solvedtoday might not even be discussed in the future because they will already be solved,for example maybe with the use of artificial intelligence.
The 17 activities were categorized into analysis, communication and visualization.The result from the survey showed that visualization was believed to be an areawhere it would be most beneficial to implement VR in. The first impression whenusing the HMD was most likely the visual difference compared to looking at a two-dimensional screen on a traditional desktop. This first impression may have affectedthe result of the questions regarding visualization. The impact on the result wereprobably minimised since the test demonstrated different use cases of VR. Thisresult from the testing is also in correlation with the first mapping phase wherevisualization was the highest rated of the three areas, can be seen in Appendix B.1.Both analysis and communication also need visualization in some sense to be ableto study the problem being analyzed or discussed. Akpan and Shanker (2017) con-firm that visualization in scale 1:1 is advantageous for performing analyses and thatusing the VR tool for presentations is beneficial. This statement confirms that thethree application areas are well connected, and that visualization is a part of theother two areas (analysis and communication). This is probably why visualization
51
5. Discussion
is considered the greatest area of implementation of VR.
Based on the result from the survey, a trend can be seen that all the evaluatedimprovement factors are showing potential to be improved. User experience did notreceive any votes below "No change". The reason for this may be because the wayyou use VR technology is very different from a traditional desktop. The change inmethods will give variation to the work, which probably is seen as a positive aspect.The motion sickness is a drawback of VR regarding user experience but from themarket research it could be seen that there is development to minimize this. Onereason the first part of the second hypothesis, concerning the quality of the activity,was not correct is probably because VR today cannot produce all the informationthat a regular desktop can. The quality factor is still rated high, which is veryimportant since quality was the factor that was voted the most important factor.
5.3 SustainabilityBased on the findings from the research there are potential benefits within all threeareas of sustainability: environmental, social and economic. Since the demand forsustainable manufacturing has increased, according to Stoycheva et al. (2018), thisraises the relevancy of the result and its contribution to the research within the area.The implementation of VR technologies can support and improve the environmentalsustainability. The improved quality in the ME processes will give better solutionsto implement in the manufacturing facilities and improve the quality of the productsthat are produced. This means that there will be less parts that will be scrapped,reducing the material and energy waste. By increasing the amount of ME processsteps that can be done virtually, the need to manufacture physical prototypes willbe reduced, which will further save material and energy. Improved quality of theME will also increase the efficiency of the manufacturing facilities, using less energyper produced car. Instead of travelling to the manufacturing facilities, as it is donetoday, some of the trips may not be necessary or can be replaced by using VR.This is also mentioned by Fast-Berglund et al. (2018) and (Lawson et al., 2016) asa benefit of VR. Fewer trips from Sweden to the manufacturing facilities in Chinacan lead to reduced CO2 emissions.
The result also shows that the social sustainability can be improved since the useof VR technologies make it possible to test work stations from the view of the op-erator. Ergonomics can be evaluated more realistically by performing the task inVR. Harmful tasks can therefore be discovered more easily and changed before theyare implemented. This can prevent injuries and make the work environment saferand more sustainable for the operators. This will also positively affect the economicsustainability since sick or injured employees are very costly. From the survey it canbe seen that user experience is considered to be improved with an implementationof VR technologies in the activities. The social sustainability could therefore beincreased by the improved user experience.
52

5. Discussion
The economic sustainability can also be improved since the results shows that ap-plying VR to the ME processes has potential to reduce the time and cost neededto perform the identified application opportunities. The quality factors also showspotential improvements from implementing VR, which also is stated by Lawson etal. (2016) and Seth et al. (2008). With improved quality better results and lesserrors in ME processes will occur. A reduction in the amount of errors will produceless rework, which can be a very expensive part in a production development pro-cess. By improving the ME, the manufacturing facilities will become more efficientreducing the cost for each car that is produced.
53

5. Discussion
54
6Conclusion
The method for evaluation was developed and validated through the case study. Themethod for evaluating possible application areas for new technologies follows threemajor steps. The first step being two types of data collection, the second step is amapping phase of the findings and the final step is a validation of the result fromthe mapping through a physical testing. This evaluation method can be used forother instances as well when areas of application for new technologies are to be found.
Three areas of application for VR technology were discovered through the casestudy. These areas are analysis, communication and visualization. It is in theseareas where the greatest potential lies for the case company to benefit the mostfrom the technology if implementing it here. Within these three areas 17 activitieswere identified at the case company that had the possibility to be improved with animplementation of VR. VR should however not replace the current way of workingwith a desktop but instead be used as complementary tool to improve the ME pro-cesses. The recommendation for the case company is to firstly start using VR as anaid for enabling better communication and ergonomic evaluations.
From the result and discussion, it could also be seen that the sustainability wouldbe improved from the findings in the thesis meaning that the purpose of the thesisis fulfilled. Future areas of research are to implement VR into the activities andstudy the effects of them within cost, quality, time and user experience. Furtherresearch could be to use the evaluation method at other companies or to evaluateother technologies.
55

6. Conclusion
56
References
Akpan, I. J., & Shanker, M. (2017). The confirmed realities and myths aboutthe benefits and costs of 3d visualization and virtual reality in discreteevent modeling and simulation: A descriptive meta-analysis of evidencefrom research and practice. Computers & Industrial Engineering, 197.Retrieved from http://proxy.lib.chalmers.se/login?url=http://search.ebscohost.com/login.aspx?direct=true&db=edsgao&AN=edsgcl.510559567&site=eds-live&scope=site
Allen, M. (2017). The sage encyclopedia of communication research methods. Thou-sand Oaks, California. Retrieved from http://methods.sagepub.com/reference/the-sage-encyclopedia-of-communication-research-methods
Amos, E. (2017a). Oculus-rift-touch-controllers-pair. Retrieved fromhttps://upload.wikimedia.org/wikipedia/commons/d/d8/Oculus-Rift-Touch-Controllers-Pair.jpg (Accessed: 2019-05-24)
Amos, E. (2017b). Sony-playstation-4-psvr-headset-mk1-bl. Retrievedfrom https://upload.wikimedia.org/wikipedia/commons/e/e9/Sony-PlayStation-4-PSVR-Headset-Mk1-BL.jpg (Accessed: 2019-05-24)
Ayers, J. C. (2017). Sustainability : an environmental science perspective. Boca Ra-ton, FL : CRC Press, Taylor & Francis group, an Imforma business, [2017]. Re-trieved from http://proxy.lib.chalmers.se/login?url=http://search.ebscohost.com.proxy.lib.chalmers.se/login.aspx?direct=true&db=cat06296a&AN=clc.b2556124&lang=sv&site=eds-live&scope=site
Berg, L. P., & Vance, J. M. (2017). Industry use of virtual reality in product de-sign and manufacturing: a survey. VIRTUAL REALITY -WALTHAMCROSS-(1), 1. Retrieved from http://proxy.lib.chalmers.se/login?url=http://search.ebscohost.com/login.aspx?direct=true&db=edsbl&AN=RN383068834&site=eds-live&scope=site
Bezegová, E., Ledgard, M. A., Molemaker, R.-J., Oberč, B. P., & Vigkos, A. (2017).Virtual reality and its potential for europe. Retrieved from https://ec.europa.eu/futurium/en/system/files/ged/vr_ecosystem_eu_report_0.pdf
Blascheck, T., Kurzhals, K., Raschke, M., Burch, M., Weiskopf, D., & Ertl,T. (2017). Visualization of eye tracking data: A taxonomy and sur-vey. Computer Graphics Forum, 36 (8), 260 - 284. Retrieved fromhttp://proxy.lib.chalmers.se/login?url=http://search.ebscohost.com/login.aspx?direct=true&db=buh&AN=126599097&lang=sv&site=eds-live&scope=site
57
References
Bougaa, M., Bornhofen, S., Kadima, H., & Rivière, A. (2015). Virtual reality formanufacturing engineering in the factories of the future. In Applied mechanicsand materials (p. 1275). Retrieved from http://proxy.lib.chalmers.se/login?url=http://search.ebscohost.com/login.aspx?direct=true&db=edsbl&AN=CN600876052&site=eds-live&scope=site
Bryson, S. (2013). Virtual reality: A definition history - a personal essay.Retrieved from http://proxy.lib.chalmers.se/login?url=http://search.ebscohost.com/login.aspx?direct=true&db=edsarx&AN=edsarx.1312.4322&lang=sv&site=eds-live&scope=site
Byrne, D. (2017). How do i do a literature search?. project planner. SAGEPublications, Inc. Retrieved from http://methods.sagepub.com.proxy.lib.chalmers.se/project-planner/reviewing-the-literature
Chalmers library catalogue. (2019). Chalmers Library. Retrievedfrom http://eds.b.ebscohost.com/eds/detail/detail?vid=1&sid=d43c747b-43d2-447d-bcb3-63738802e89b%40pdc-v-sessmgr05&bdata=JnNpdGU9ZWRzLWxpdmUmc2NvcGU9c2l0ZQ%3d%3d#db=cat06296a&AN=clc.b2556815
China Euro Vehicle Technology AB. (2019). Redefining automotive engineering.Retrieved from https://www.cevt.se/what-we-do/ (Accessed: 2019-06-12)
Cho, J.-m., Kim, Y.-d., Jung, S. H., Shin, H., & Kim, T. (2017). 78-4: Screendoor effect mitigation and its quantitative evaluation in vr display. SIDSymposium Digest of Technical Papers, 48 (1), 1154. Retrieved fromhttp://proxy.lib.chalmers.se/login?url=http://search.ebscohost.com/login.aspx?direct=true&db=edb&AN=123395212&lang=sv&site=eds-live&scope=site
Daily, M., Howard, M., Jerald, J., Lee, C., Martin, K., McInnes, D., & Tinker, P.(2000). Distributed design review in virtual environments. In Proceedings ofthe third international conference on collaborative virtual environments (pp.57–63).
Davim, J. P. (2015). Modern manufacturing engineering. Springer. Re-trieved from http://proxy.lib.chalmers.se/login?url=http://search.ebscohost.com/login.aspx?direct=true&db=edsebk&AN=1016289&lang=sv&site=eds-live&scope=site
Epic Games. (2019). Unreal engine. Retrieved from https://www.unrealengine.com (Accessed: 2019-06-12)
Eschen, H., Kötter, T., Rodeck, R., Harnisch, M., & Schüppstuhl, T. (2018).Augmented and virtual reality for inspection and maintenance processesin the aviation industry. Procedia Manufacturing, 19 (Proceedingsof the 6th International Conference in Through-life Engineering Ser-vices, University of Bremen, 7th and 8th November 2017), 156 - 163.Retrieved from http://proxy.lib.chalmers.se/login?url=http://search.ebscohost.com/login.aspx?direct=true&db=edselp&AN=S2351978918300222&lang=sv&site=eds-live&scope=site
Facebook technologies. (2019a). Oculus quest. Retrieved from https://www.oculus.com/rift-s/ (Accessed: 2019-06-12)
Facebook technologies. (2019b). Oculus quest. Retrieved from https://www.oculus
58

References
.com/quest/ (Accessed: 2019-05-22)Fan, K., Murai, A., Miyata, N., Sugiura, Y., & Tada, M. (2017). Multi-
embodiment of digital humans in virtual reality for assisting human-centeredergonomics design. Augmented Human Research, 2 (1), 1. Retrieved fromhttp://proxy.lib.chalmers.se/login?url=http://search.ebscohost.com/login.aspx?direct=true&db=edb&AN=125541108&lang=sv&site=eds-live&scope=site
Fast-Berglund, A., Gong, L., & Li, D. (2018). Testing and validating ex-tended reality (xr) technologies in manufacturing. Procedia Manu-facturing, 25 (Proceedings of the 8th Swedish Production Symposium(SPS 2018)), 31 - 38. Retrieved from http://proxy.lib.chalmers.se/login?url=http://search.ebscohost.com/login.aspx?direct=true&db=edselp&AN=S2351978918305730&site=eds-live&scope=site
Fatorachian, H., & Kazemi, H. (2018). A critical investigation of industry 4.0 in man-ufacturing: theoretical operationalisation framework. Production Planning &Control, 29 (8), 633 - 644. Retrieved from http://proxy.lib.chalmers.se/login?url=http://search.ebscohost.com/login.aspx?direct=true&db=buh&AN=130443731&lang=sv&site=eds-live&scope=site
Geely Auto. (2019). Overview: Geely global. Retrieved from http://global.geely.com/overview/ (Accessed: 2019-06-12)
Gilchrist, A. (2016). Introducing industry 4.0. In Industry 4.0: The indus-trial internet of things (pp. 195–215). Berkeley, CA: Apress. Retrievedfrom https://doi.org/10.1007/978-1-4842-2047-4_13 doi: 10.1007/978-1-4842-2047-4_13
Given, L. (2008). The sage encyclopedia of qualitative research methods. ThousandOaks, California. Retrieved from http://methods.sagepub.com/reference/sage-encyc-qualitative-research-methods
Gong, L., Berglund, J., Saluäär, D., & Johansson, B. (2017). A novel vrtool for collaborative planning of manufacturing process change us-ing point cloud data. Procedia CIRP, 63 (Manufacturing Systems 4.0- Proceedings of the 50th CIRP Conference on Manufacturing Sys-tems), 336 - 341. Retrieved from http://proxy.lib.chalmers.se/login?url=http://search.ebscohost.com/login.aspx?direct=true&db=edselp&AN=S2212827117302354&lang=sv&site=eds-live&scope=site
Göttig, R., Newton, J., & Kaufmann, S. (2005). A comparison of 3d visualizationtechnologies and their user interfaces with data specific to architecture. InH. J. P. Van Leeuwen Jos P.and Timmermans (Ed.), Recent advances in designand decision support systems in architecture and urban planning (pp. 99–111).Dordrecht: Springer Netherlands.
HaptX Inc. (2019). Get early access. Retrieved from https://haptx.com/early-access/ (Accessed: 2019-03-08)
Harders, M. (2008). Surgical scene generation for virtual reality based train-ing in medicine. [electronic resource]. Springer. Retrieved from http://proxy.lib.chalmers.se/login?url=http://search.ebscohost.com/login.aspx?direct=true&db=cat06296a&AN=clc.b2023335&site=eds-live&scope=site
59

References
Hayden, S. (2017). Pimax completes $15m series a funding round. Retrievedfrom https://www.roadtovr.com/pimax-completes-15m-series-funding-round/ (Accessed: 2019-03-01)
Ho, N., Wong, P.-M., Chua, M., & Chui, C.-K. (2018). Virtual reality trainingfor assembly of hybrid medical devices. Multimedia Tools and Appli-cations(23), 30651. Retrieved from http://proxy.lib.chalmers.se/login?url=http://search.ebscohost.com/login.aspx?direct=true&db=edsgao&AN=edsgcl.557998471&site=eds-live&scope=site
Holubek, R., Delgado Sobrino Daynier, R., Košťál, P., Ružarovský, R., &Velíšek, K. (2017). Using virtual reality tools to support simulations ofmanufacturing instances in process simulate: The case of an icim 3000system. MATEC Web of Conferences, Vol 137, p 04004 (2017), 04004.Retrieved from http://proxy.lib.chalmers.se/login?url=http://search.ebscohost.com/login.aspx?direct=true&db=edsdoj&AN=edsdoj.2afc7e0901f64c19953a7336b95942c5&site=eds-live&scope=site
HTC. (2019a). Accessories. Retrieved from https://www.vive.com/eu/accessory/ (Accessed: 2019-06-12)
HTC. (2019b). Vive pro. Retrieved from https://www.vive.com/eu/product/vive-pro/ (Accessed: 2019-03-08)
HTC. (2019c). What are the system requirements? Retrievedfrom https://www.vive.com/eu/support/vive/category_howto/what-are-the-system-requirements.html (Accessed: 2019-06-12)
HTC. (2019d). What are the system requirements? Retrievedfrom https://www.vive.com/eu/support/vive-pro-hmd/category_howto/what-are-the-system-requirements.html (Accessed: 2019-06-12)
International Organization for Standardization. (2016). Ergonomics of human-system interaction – part 210: Human-centred design for interactive systems(Standard No. ISO 9241-110:2006). Geneva, CH: International Organizationfor Standardization. Retrieved from https://www.iso.org/standard/52075.html
IPS AB. (2019). Industrial path solutions. Retrieved from https://industrialpathsolutions.se/ (Accessed: 2019-06-12)
Jabil. (2019). Augmented and virtual reality. Retrieved from https://www.jabil.com/content/dam/images/hero-images/augmented-virtual-reality.jpg.transform/pageHero/image.augmented-virtual-reality.jpg (Ac-cessed: 2019-05-24)
Kim, H. G., Lim, H.-T., Lee, S., & Ro, Y. M. (2019). Vrsa net: Vr sickness assess-ment considering exceptional motion for 360° vr video. IEEE TransactionsOn Image Processing: A Publication Of The IEEE Signal Processing Society,28 (4), 1646 - 1660. Retrieved from http://proxy.lib.chalmers.se/login?url=http://search.ebscohost.com/login.aspx?direct=true&db=cmedm&AN=30418904&site=eds-live&scope=site
Kishino, P. M. Y. F., & Milgram, P. (1994). A taxonomy of mixed reality visualdisplays. Toronto, Canada.
Kramida, G. (2016). Resolving the vergence-accommodation conflict in head-mounted displays. IEEE Transactions On Visualization And Computer Graph-
60

References
ics, 22 (7), 1912 - 1931. Retrieved from http://proxy.lib.chalmers.se/login?url=http://search.ebscohost.com/login.aspx?direct=true&db=cmedm&AN=26336129&lang=sv&site=eds-live&scope=site
Lang, B. (2018a). 10 projects that have us excited about the next generation of vr& ar. Retrieved from https://www.roadtovr.com/10-projects-that-have-us-excited-about-the-next-gen-vr-ar/2/ (Accessed: 2019-03-08)
Lang, B. (2018b). Oculus reveals 140 degree vr headset prototype with varifo-cal displays. Retrieved from https://www.roadtovr.com/facebook-oculus-half-dome-prototype-vr-headset-140-degree-varifocal-f8/ (Ac-cessed: 2019-03-08)
Lawson, G., Salanitri, D., & Waterfield, B. (2016). Future directions forthe development of virtual reality within an automotive manufacturer.Applied Ergonomics, 53 (Part B), 323 - 330. Retrieved from http://proxy.lib.chalmers.se/login?url=http://search.ebscohost.com/login.aspx?direct=true&db=edselp&AN=S0003687015300260&lang=sv&site=eds-live&scope=site
Lee, E. A.-L., & Wong, K. W. (2014). Learning with desktop virtual reality:Low spatial ability learners are more positively affected. Computers &Education, 79 , 49 - 58. Retrieved from http://proxy.lib.chalmers.se/login?url=http://search.ebscohost.com.proxy.lib.chalmers.se/login.aspx?direct=true&db=edselp&AN=S0360131514001614&lang=sv&site=eds-live&scope=site
Liagkou, V., Salmas, D., & Stylios, C. (2019). Realizing virtual reality learningenvironment for industry 4.0. Procedia CIRP, 79 (12th CIRP Conference onIntelligent Computation in Manufacturing Engineering, 18-20 July 2018, Gulfof Naples, Italy), 712 - 717. Retrieved from http://proxy.lib.chalmers.se/login?url=http://search.ebscohost.com/login.aspx?direct=true&db=edselp&AN=S2212827119301398&site=eds-live&scope=site
Markmann, B. (2015). Visible light eye-tracking algorithm. Retrievedfrom https://upload.wikimedia.org/wikipedia/commons/a/ac/Visible_light_eye-tracking_algorithm.jpg (Accessed: 2019-05-24)
Mealy, P. (2018). Virtual & augmented reality for dummies. For Dummies.Retrieved from http://proxy.lib.chalmers.se/login?url=http://search.ebscohost.com/login.aspx?direct=true&db=edsebk&AN=1828564&site=eds-live&scope=site
Miles, M. B., Huberman, A. M., & Saldaña, J. (2014). Qualitative dataanalysis : a methods sourcebook. Los Angeles : Sage, cop. 2014.Retrieved from http://proxy.lib.chalmers.se/login?url=http://search.ebscohost.com/login.aspx?direct=true&db=cat06296a&AN=clc.b2263991&site=eds-live&scope=site
Minswho. (2015). Nullspace vr mk 2. Retrieved from https://upload.wikimedia.org/wikipedia/commons/2/27/NullSpace_VR_Mk_2.jpg (Accessed: 2019-05-24)
Nieuwenhuis, P., & Wells, P. E. (2015). The global automotive industry. [electronicresource]. Chichester, West Sussex, United Kingdom : Wiley, [2015]. Re-trieved from http://proxy.lib.chalmers.se/login?url=http://search
61

References
.ebscohost.com.proxy.lib.chalmers.se/login.aspx?direct=true&db=cat06296a&AN=clc.b2326633&lang=sv&site=eds-live&scope=site
Pape, P. (2001). Cave crayoland. Retrieved from https://upload.wikimedia.org/wikipedia/commons/6/6d/CAVE_Crayoland.jpg (Accessed: 2019-05-24)
Parker, L. (2017). Gamers keep virtual reality dreams alive. The New York Times,8. Retrieved from http://proxy.lib.chalmers.se/login?url=http://search.ebscohost.com/login.aspx?direct=true&db=edsgao&AN=edsgcl.496282798&lang=sv&site=eds-live&scope=site
Peddie, J. (2013). The history of visual magic in computers. [electronic re-source] how beautiful images are made in cad, 3d, vr and ar. London: Springer, c2013. Retrieved from http://proxy.lib.chalmers.se/login?url=http://search.ebscohost.com/login.aspx?direct=true&db=cat06296a&AN=clc.b1931722&site=eds-live&scope=site
Pimax. (2019). Pimax brought vr 2.0 to las vegas at ces 2019.Retrieved from https://pimaxvr.com/blogs/news/pimax-brought-vr-2-0-to-las-vegas-at-ces-2019 (Accessed: 2019-03-01)
Poole, A., & Ball, L. J. (2006). Eye tracking in hci and usability research. InEncyclopedia of human computer interaction (pp. 211–219). IGI Global.
Regan, M., & Pose, R. (1994). Priority rendering with a virtual reality addressrecalculation pipeline. SIGGRAPH: International Conference on ComputerGraphics & Interactive Techniques, 155. Retrieved from http://proxy.lib.chalmers.se/login?url=http://search.ebscohost.com/login.aspx?direct=true&db=edb&AN=73704039&site=eds-live&scope=site
Reski, N., & Alissandrakis, A. (2019). Open data exploration in virtual reality: acomparative study of input technology. Virtual Reality, 1–22.
Reza, Z., & Eloi, C. (2018). Virtual reality-integrated workflow in bim-enabled projects collaboration and design review: a case study. Vi-sualization in Engineering, Vol 6, Iss 1, Pp 1-15 (2018)(1), 1. Re-trieved from http://proxy.lib.chalmers.se/login?url=http://search.ebscohost.com/login.aspx?direct=true&db=edsdoj&AN=edsdoj.f7510a97c294f758f858dc67e7a7382&lang=sv&site=eds-live&scope=site
Rooch84. (2009). A user performing gesture interactions with a powerwall displayat the university of leeds. Retrieved from https://upload.wikimedia.org/wikipedia/commons/b/b4/A_user_performing_gesture_interactions_with_a_Powerwall_display_at_the_University_of_Leeds.jpg (Ac-cessed: 2019-05-24)
Ruppert, T., Jaskó, S., Holczinger, T., & Abonyi, J. (2018). Data on ap-plied sciences reported by researchers at university of pannonia (en-abling technologies for operator 4.0: A survey). Journal of Engineering.Retrieved from http://proxy.lib.chalmers.se/login?url=http://search.ebscohost.com/login.aspx?direct=true&db=edsgao&AN=edsgcl.560212784&lang=sv&site=eds-live&scope=site
Rückert, P., Wohlfromm, L., & Tracht, K. (2018). Implementation of virtualreality systems for simulation of human-robot collaboration. ProcediaManufacturing, 19 (Proceedings of the 6th International Conference in
62

References
Through-life Engineering Services, University of Bremen, 7th and 8th Novem-ber 2017), 164 - 170. Retrieved from http://proxy.lib.chalmers.se/login?url=http://search.ebscohost.com/login.aspx?direct=true&db=edselp&AN=S2351978918300234&lang=sv&site=eds-live&scope=site
Seth, A., Su, H.-J., & Vance, J. M. (2008). Development of a dual-handed haptic assembly system: Sharp. JOURNAL OF COMPUT-ING AND INFORMATION SCIENCE IN ENGINEERING, 8 (4).Retrieved from http://proxy.lib.chalmers.se/login?url=http://search.ebscohost.com/login.aspx?direct=true&db=edswsc&AN=000261210300012&site=eds-live&scope=site
Sherman, W. R., & Craig, A. B. (2003). Understanding virtual reality : interface,application and design. San Francisco, Calif. : Morgan Kaufmann, cop.2003. Retrieved from http://proxy.lib.chalmers.se/login?url=http://search.ebscohost.com/login.aspx?direct=true&db=cat06296a&AN=clc.b1034779&site=eds-live&scope=site
Siemens. (2017). Process simulate on teamcenter. Retrieved fromhttps://docs.plm.automation.siemens.com/tdoc/tecnomatix/13.1.2/PS_TC/#uid:index (Accessed: 2019-06-12)
Sra, M., & Schmandt, C. (2015). Metaspace ii: Object and full-body track-ing for interaction and navigation in social vr. Retrieved from http://proxy.lib.chalmers.se/login?url=http://search.ebscohost.com/login.aspx?direct=true&db=edsarx&AN=edsarx.1512.02922&lang=sv&site=eds-live&scope=site
Sreelakshmi, M., & Subash, T. (2017). Haptic technology: A comprehensive reviewon its applications and future prospects. Materials Today: Proceedings,4 (Part B), 4182 - 4187. Retrieved from http://proxy.lib.chalmers.se/login?url=http://search.ebscohost.com/login.aspx?direct=true&db=edselp&AN=S2214785317303188&site=eds-live&scope=site
Stark, R., Seliger, G., & Bonvoisin, J. (2017). Sustainable manufacturing.[electronic resource] : Challenges, solutions and implementation perspec-tives. Cham : Springer International Publishing : Imprint: Springer,2017. Retrieved from http://proxy.lib.chalmers.se/login?url=http://search.ebscohost.com/login.aspx?direct=true&db=cat06296a&AN=clc.b2387033&lang=sv&site=eds-live&scope=site
Statista. (2007). Hamburg : Statista, Inc., 2007-. Retrieved from http://proxy.lib.chalmers.se/login?url=http://search.ebscohost.com/login.aspx?direct=true&db=cat06296a&AN=clc.b2556815&site=eds-live&scope=site
Statista. (2019a). Consumer virtual reality software and hardware market size world-wide from 2016 to 2022 (in billion U.S. dollars). In Statista - The StatisticsPortal. Retrieved from https://www-statista-com.proxy.lib.chalmers.se/statistics/528779/virtual-reality-market-size-worldwide/
Statista. (2019b). Share of carbon dioxide emissions worldwide in 2014, by sec-tor. Retrieved from https://www-statista-com.proxy.lib.chalmers.se/statistics/731786/share-of-co2-emission-by-sector-globally/
Stoycheva, S., Marchese, D., Paul, C., Padoan, S., Juhmani, A.-s., & Linkov,
63

References
I. (2018). Multi-criteria decision analysis framework for sustainablemanufacturing in automotive industry. Journal of Cleaner Produc-tion, 187 , 257 - 272. Retrieved from http://proxy.lib.chalmers.se/login?url=http://search.ebscohost.com/login.aspx?direct=true&db=edselp&AN=S0959652618307947&lang=sv&site=eds-live&scope=site
Szabó, K. (2018). Ramp-up process improvement practices for time-to-market reduction. Periodica Polytechnica: Social & Management Sci-ences, 26 (1), 19 - 29. Retrieved from http://proxy.lib.chalmers.se/login?url=http://search.ebscohost.com/login.aspx?direct=true&db=buh&AN=128070004&lang=sv&site=eds-live&scope=site
Taupiac, J.-D., Rodriguez, N., & Strauss, O. (2018). Immercity: a cu-ration content application in virtual and augmented reality. Re-trieved from http://proxy.lib.chalmers.se/login?url=http://search.ebscohost.com/login.aspx?direct=true&db=edsarx&AN=edsarx.1810.10206&lang=sv&site=eds-live&scope=site
Tcha-Tokey, K., Christmann, O., Loup-Escande, E., Loup, G., & Richir,S. (2018). Towards a model of user experience in immersive vir-tual environments. Advances in Human-Computer Interaction, 1.Retrieved from http://proxy.lib.chalmers.se/login?url=http://search.ebscohost.com.proxy.lib.chalmers.se/login.aspx?direct=true&db=edb&AN=131726852&site=eds-live&scope=site
Teslasuit. (2019). Ultimate tech in smart clothing. Retrieved from https://teslasuit.io/ (Accessed: 2019-03-08)
Torrents, J. (2015). Water under 11 hz vibration. Retrieved fromhttps://upload.wikimedia.org/wikipedia/commons/d/d6/Water_under_11_Hz_vibration.jpg (Accessed: 2019-05-24)
Ultrahaptics Ltd. (2019). Reach into the future of virtual and augmented reality.Retrieved from https://www.leapmotion.com/ (Accessed: 2019-06-12)
Ungvarsky, J. (2017). Eye tracking. Salem Press Encyclopedia. Re-trieved from http://proxy.lib.chalmers.se/login?url=http://search.ebscohost.com/login.aspx?direct=true&db=ers&AN=125600217&site=eds-live&scope=site
Unity Technologies. (2019). Unity. Retrieved from https://unity.com/ (Accessed:2019-06-12)
Varjo. (2018). Varjo raises $31m series b from atomico to transform heavyindustry with world’s first human-eye resolution vr product. Retrieved fromhttps://varjo.com/press-release/varjo-raises-31m-series-b-from-atomico-to-transform-heavy-industry-with-worlds-first-human-eye-resolution-vr-product/ (Accessed: 2019-03-01)
Varjo. (2019). Varjo announces vr-1, world’s first human eye-resolution vr headsetfor industrial use. Retrieved from https://varjo.com/press-release/varjo-announces-vr-1-worlds-first-human-eye-resolution-vr-headset-for-industrial-use/ (Accessed: 2019-03-01)
Virtuix. (2013). Virtuix omni product view. Retrieved from https://upload.wikimedia.org/wikipedia/commons/d/d3/Virtuix_Omni_product_view%2C_profile.jpg (Accessed: 2019-05-24)
64

References
Virtuix. (2019). Move around in vr. Retrieved from https://www.virtuix.com/(Accessed: 2019-06-12)
Vosinakis, S., & Koutsabasis, P. (2018). Evaluation of visual feedback techniquesfor virtual grasping with bare hands using leap motion and oculus rift.Virtual Reality(1), 47. Retrieved from http://proxy.lib.chalmers.se/login?url=http://search.ebscohost.com.proxy.lib.chalmers.se/login.aspx?direct=true&db=edsgao&AN=edsgcl.528492536&site=eds-live&scope=site
Wang, Z., Kim, B., Kobayashi, H., Wu, G., & Barth, M. J. (2018).Agent-based modeling and simulation of connected and automated ve-hicles using game engine: A cooperative on-ramp merging study. Re-trieved from http://proxy.lib.chalmers.se/login?url=http://search.ebscohost.com/login.aspx?direct=true&db=edsarx&AN=edsarx.1810.09952&lang=sv&site=eds-live&scope=site
Winkes, P. A., & Aurich, J. C. (2015). Method for an enhanced assemblyplanning process with systematic virtual reality inclusion. Procedia CIRP,37 (CIRPe 2015 - Understanding the life cycle implications of manufac-turing), 152 - 157. Retrieved from http://proxy.lib.chalmers.se/login?url=http://search.ebscohost.com.proxy.lib.chalmers.se/login.aspx?direct=true&db=edselp&AN=S2212827115008446&lang=sv&site=eds-live&scope=site
Wu, C.-M., Hsu, C.-W., Lee, T.-K., & Smith, S. (2017). A virtual reality keyboardwith realistic haptic feedback in a fully immersive virtual environment.Virtual Reality(1), 19. Retrieved from http://proxy.lib.chalmers.se/login?url=http://search.ebscohost.com.proxy.lib.chalmers.se/login.aspx?direct=true&db=edsgao&AN=edsgcl.484032406&site=eds-live&scope=site
Yin, R. K. (2014). Case study research : design and methods. London : SAGE, cop.2014. Retrieved from http://proxy.lib.chalmers.se/login?url=http://search.ebscohost.com/login.aspx?direct=true&db=cat06296a&AN=clc.b1765662&site=eds-live&scope=site
Zzubnik. (2008). Computer monitor. Retrieved from https://upload.wikimedia.org/wikipedia/commons/a/a4/Computer_monitor.jpg (Accessed: 2019-05-24)
65

References
66

ACase Study Data
In this appendix the following sections can be found:
A.1 Overview of work tasksA.2 Overview of positions at departmentsA.3 IT toolsA.4 CommunicationA.5 ChallengesA.6 VR and applicationsA.7 Ideas for implementation
I
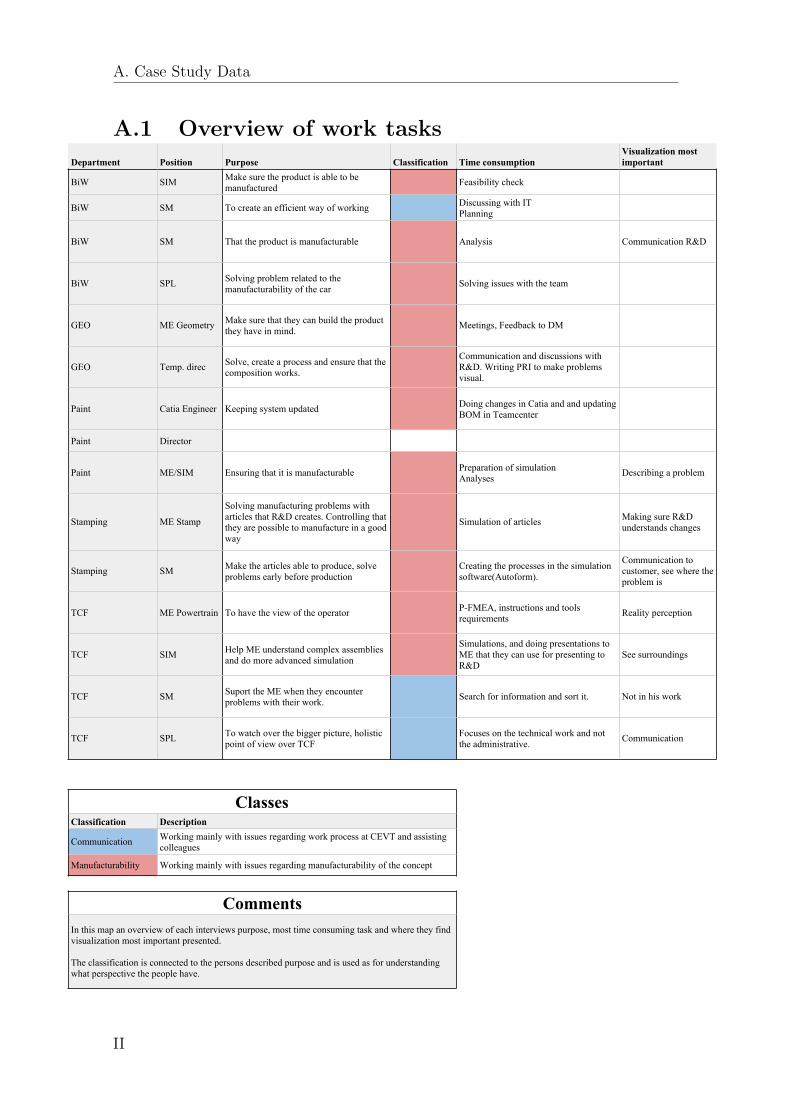
Department Position Purpose Classification Time consumption Visualization most important
BiW SIM Make sure the product is able to be manufactured Feasibility check
BiW SM To create an efficient way of working Discussing with IT Planning
BiW SM That the product is manufacturable Analysis Communication R&D
BiW SPL Solving problem related to the manufacturability of the car Solving issues with the team
GEO ME Geometry Make sure that they can build the product they have in mind. Meetings, Feedback to DM
GEO Temp. direc Solve, create a process and ensure that the composition works.
Communication and discussions with R&D. Writing PRI to make problems visual.
Paint Catia Engineer Keeping system updated Doing changes in Catia and and updating BOM in Teamcenter
Paint Director
Paint ME/SIM Ensuring that it is manufacturable Preparation of simulation Analyses Describing a problem
Stamping ME Stamp
Solving manufacturing problems with articles that R&D creates. Controlling that they are possible to manufacture in a good way
Simulation of articles Making sure R&D understands changes
Stamping SM Make the articles able to produce, solve problems early before production
Creating the processes in the simulation software(Autoform).
Communication to customer, see where the problem is
TCF ME Powertrain To have the view of the operator P-FMEA, instructions and tools requirements Reality perception
TCF SIM Help ME understand complex assemblies and do more advanced simulation
Simulations, and doing presentations to ME that they can use for presenting to R&D
See surroundings
TCF SM Suport the ME when they encounter problems with their work. Search for information and sort it. Not in his work
TCF SPL To watch over the bigger picture, holistic point of view over TCF
Focuses on the technical work and not the administrative. Communication
ClassesClassification Description
Communication Working mainly with issues regarding work process at CEVT and assisting colleagues
Manufacturability Working mainly with issues regarding manufacturability of the concept
CommentsIn this map an overview of each interviews purpose, most time consuming task and where they find visualization most important presented.
The classification is connected to the persons described purpose and is used as for understanding what perspective the people have.
A. Case Study Data
A.1 Overview of work tasks
II
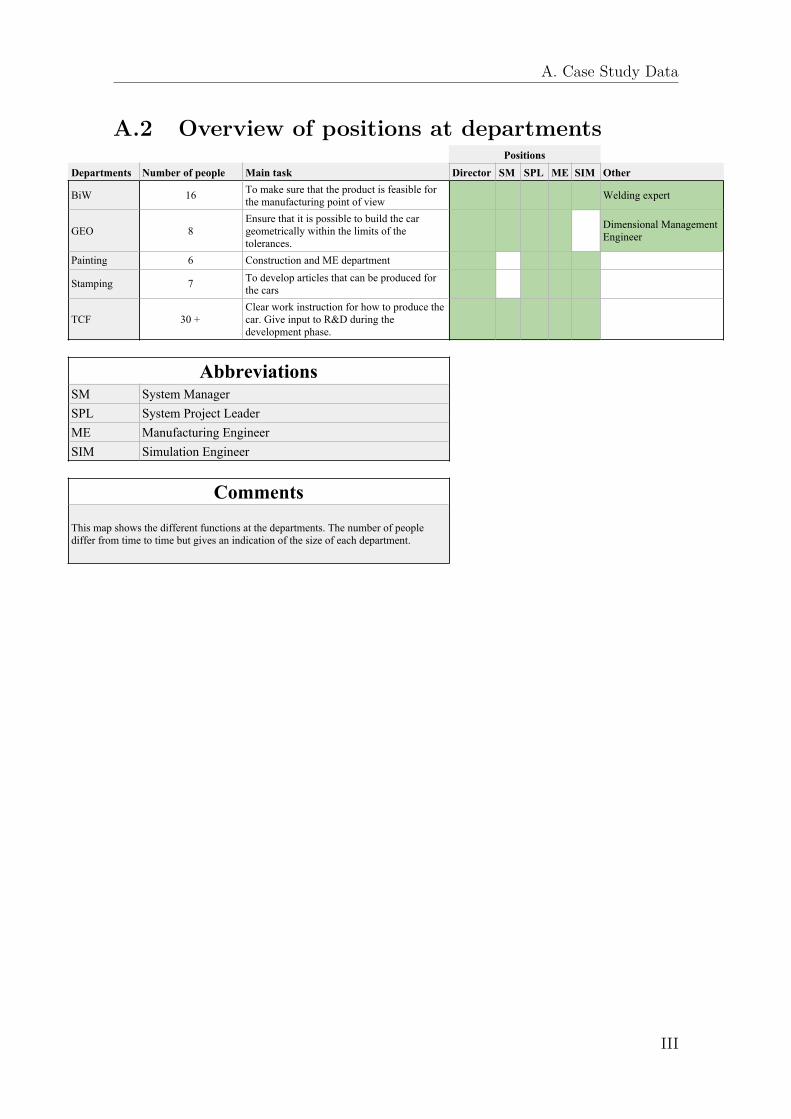
PositionsDepartments Number of people Main task Director SM SPL ME SIM Other
BiW 16 To make sure that the product is feasible for the manufacturing point of view Welding expert
GEO 8Ensure that it is possible to build the car geometrically within the limits of the tolerances.
Dimensional Management Engineer
Painting 6 Construction and ME department
Stamping 7 To develop articles that can be produced for the cars
TCF 30 +Clear work instruction for how to produce the car. Give input to R&D during the development phase.
AbbreviationsSM System ManagerSPL System Project LeaderME Manufacturing EngineerSIM Simulation Engineer
Comments
This map shows the different functions at the departments. The number of people differ from time to time but gives an indication of the size of each department.
A. Case Study Data
A.2 Overview of positions at departments
III

Department Position PS IPSAutoForm/PentStamp Catia Process designer CD4 (measure database)
BiW SM
BiW SPL
BiW SM Visualization
BiW SIM Simulation
GEO Temp. direc
GEO ME Geometry
Paint Director
Paint ME/SIM Geometry of station Simulation Centerlines
Paint Catia Engineer Simulation of operator Changes
Stamping SM Simulation
Stamping ME Stamp Simulation
TCF SM
TCF ME Powertrain Simulation
TCF SIM Simulation
TCF SPL
Comments
All departments uses: Team center (+ visual mock-up), Office packages, Skype, SharePoint
A. Case Study Data
A.3 IT tools
IV

Department Position Collaboration Presentation tools No. people Location
BiW SM
GEO Powerpoint
3-5 Meeting roomsR&D
Picture
Process Simulate
BiW SPL The team Powerpoint 6-10Meeting roomsSkype
BiW SMR&D
Powerpoint 2-10 Meeting roomsME colleagues ME
BiW SIM
Project leaders
ECR (Excel) 2-6
Meeting rooms
ME Desk
R&D Skype
Paint Director ScreenPowerpoint
Paint ME/SIMME colleagues Skype, Powerpoint
Approx. 3Office
Paint team Powerpoint Skype
Paint Catia EngineerR&D ME change requests
3-4Meeting rooms
BiW PCR Skype
GEO Temp. direc
BiW Pictures
1, meeting can be 10
Chats
Dimension Management Product Related Issue (PRI) with R&D Skype
R&D Meeting rooms
GEO ME GeometryTCF
Powerpoint 3-5 Meeting roomsPSS
Stamping SMME colleagues ECR
Alone, meetings 4-5, discussion 1-3
Skype and screen sharingProject leader
Simulation reportProcess plan
Stamping ME StampPeople in the department, Excel,
1 person, sometimes more at engineering meetings
Own computerProject leader Verbally (Body
language) R&DSimulations go direct to R&D
TCF SM
Colleagues at Exterior
SharePoint 5-8 Meeting rooms, SkypeSPL
R&D
TCF ME PowertrainR&D equivalent Outlook
1-2 Meeting roomsVolvo equivalent Skype
TCF SIM Helping colleagues with IT tools 1-10 Meeting rooms
TCF SPLVehicle Integration VR 4. Not more when using
VR. VR roomSM and UPL in ME Powerpoint
Conclusions from map Summary of the map
Collaboration R&D and Internal colleagues keeps coming up a lot.
Presentation tools Presenting with 2D imaging is most common
No of people Span from 1-10 people. Majority is under 5 people
Location Meeting rooms and Skype are most common locations
A. Case Study Data
A.4 Communication
V

Department Position Common challenges Classification of challenges Physical challengesClassification of challenges
BiW SM System errors ITSpringback Simulation LimitCar crash Certification
BiW SPL
Technical difficulties, something doesn't work in the car
ManufacturabilityHardware test in design phase, especially joining
Simulation Limit
IT issues IT
Ergonomic issues Ergonomics Communication skype IT
Communication language Communication
BiW SM Lack of prerequisites Information
BiW SIMDesign iterations Information
Tool retraction Analysis Decisions in R&D Information
GEO Temp. direc Making assessments of a solution Analysis
Complex and complicated solutions (want to look & feel)
Simulation Limit
GEO ME GeometryCommunication Communication Overslam Simulation LimitTimeplans Information Wrapping Simulation Limit
Paint Director
Construction problems Manufacturability
Coloring Simulation LimitIncrease soundproofing material
Manufacturability
Paint ME/SIM Computer power IT Fixturing for holding cars Analysis
Paint Catia Engineer Changes made by BiW Information
Operators position Ergonomics Reachability Analysis
Stamping SM Cracks/thinnings ManufacturabilitySurface finish Analysis Defects in shell parts Simulation Limit
Stamping ME Stamp
Simulated articles doesn't work Manufacturability
Surface finish Analysis Technical issues (licenses etc) IT
TCF SMCommunication Communication Old information Information Lack of decisions Communication
TCF ME Powertrain Demand of new work procedures Manufacturability Changes affecting
other changes Analysis
TCF SIM People forgetting knowledge Communication
Torque Simulation LimitLack of information from supplier Information
TCF SPL Trying to understand the actual problem
Communication Parts doesn't behave as in CAD, forces are a factor in reality
Simulation LimitInformation
A. Case Study Data
A.5 Challenges
VI
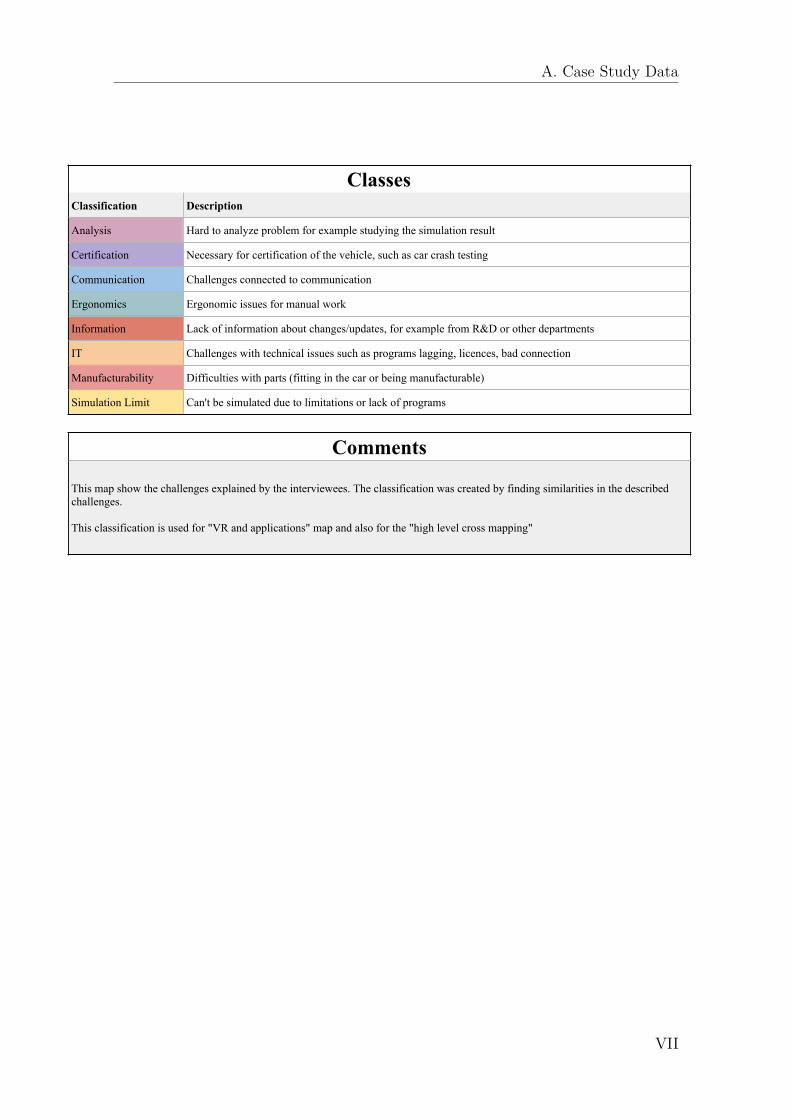
ClassesClassification Description
Analysis Hard to analyze problem for example studying the simulation result
Certification Necessary for certification of the vehicle, such as car crash testing
Communication Challenges connected to communication
Ergonomics Ergonomic issues for manual work
Information Lack of information about changes/updates, for example from R&D or other departments
IT Challenges with technical issues such as programs lagging, licences, bad connection
Manufacturability Difficulties with parts (fitting in the car or being manufacturable)
Simulation Limit Can't be simulated due to limitations or lack of programs
Comments
This map show the challenges explained by the interviewees. The classification was created by finding similarities in the described challenges.
This classification is used for "VR and applications" map and also for the "high level cross mapping"
A. Case Study Data
VII

Department Position Previous knowledge User experience Problem avoided Application wishes Other
BiW SM A lot Discussing and status reporting.
Seeing in scale 1:1
BiW SPL Have tried itPresentation Preparation time
may be too longVisualization
BiW SM Tested at TCF. Good experienceAnswer to conceptual questions
Get the line in a virtual environment
BiW will use VR for visualization.
BiW SIM Have tried it Good experience Tool fitting in the lines Ergonomic studies
Data output and input needs to be easy for him to use it
Paint Director Yes
Communicating with China
Visualizing
Reachability
Looking at seams
Paint ME/SIM Have tried it Realistic feeling
Communicating with China
Wishes to utilize point clouds.
Help with decision making
Experience different heights
See workplace layout.
Paint Catia Engineer Have tried it Felt dizzy afterwards
Visualization of getting in to the car
See the plant layout and go through processes to see possible errors
Most difficult part is to look into the interior parts
GEO Temp. direc None For new concepts Supporting what he claims
GEO ME Geometry Have tried it
Good Ergonomics Visualization for discussions
Would like to see rendering between lamp and color
Bad resolution and graphics
Assembly Possible to see qualityAdds immersion
and perspective
A. Case Study Data
A.6 VR and applications
VIII
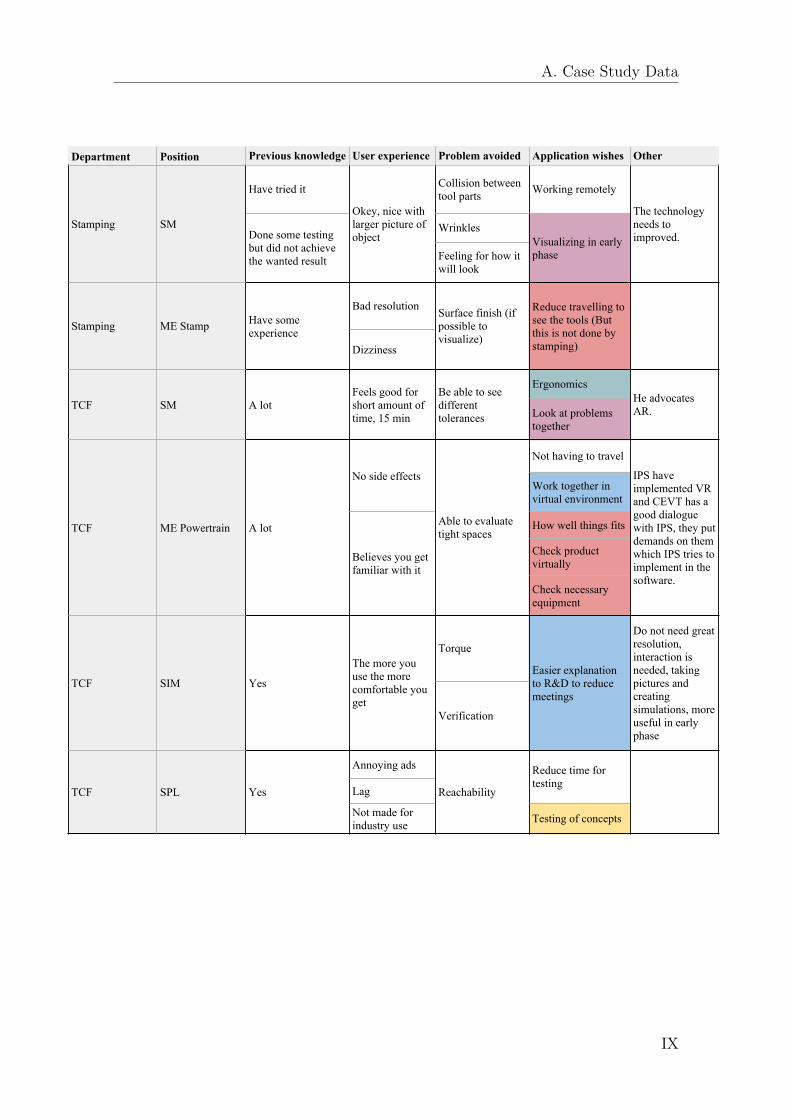
Department Position Previous knowledge User experience Problem avoided Application wishes Other
Stamping SM
Have tried it
Okey, nice with larger picture of object
Collision between tool parts Working remotely
The technology needs to improved.Done some testing
but did not achieve the wanted result
WrinklesVisualizing in early phaseFeeling for how it
will look
Stamping ME Stamp Have some experience
Bad resolution Surface finish (if possible to visualize)
Reduce travelling to see the tools (But this is not done by stamping)Dizziness
TCF SM A lotFeels good for short amount of time, 15 min
Be able to see different tolerances
ErgonomicsHe advocates AR.Look at problems
together
TCF ME Powertrain A lot
No side effects
Able to evaluate tight spaces
Not having to travel
IPS have implemented VR and CEVT has a good dialogue with IPS, they put demands on them which IPS tries to implement in the software.
Work together in virtual environment
Believes you get familiar with it
How well things fits
Check product virtually
Check necessary equipment
TCF SIM Yes
The more you use the more comfortable you get
Torque
Easier explanation to R&D to reduce meetings
Do not need great resolution, interaction is needed, taking pictures and creating simulations, more useful in early phase
Verification
TCF SPL Yes
Annoying ads
Reachability
Reduce time for testing
Lag
Not made for industry use Testing of concepts
A. Case Study Data
IX

ClassesClassification Description
Analysis Hard to analyze problem for example studying the simulation result
Certification Necessary for certification of the vehicle, such as car crash testing
Communication Challenges connected to communication
Ergonomics Ergonomic issues for manual work
Information Lack of information about changes/updates, for example from R&D or other departments
IT Challenges with technical issues such as programs lagging, licences, bad connection
Manufacturability Difficulties with parts (fitting in the car or being manufacturable)
Simulation Limit Can't be simulated due to limitations or lack of programs
No class No class suitable for the activity
Conclusions from map Summary of the map
Previous knowledge Almost everyone have some experience with VR
User experience Most feel good when using VR but some feels dizziness. Many also comments on the addition of immersion
Application wishes The wishes for applying VR is mostly to travel less, enable better communication with China and each other
Comments
This map presents the part of the interview surrounding VR, what previous knowledge and user experience the interviewee had. It also shows what problems they hope to avoid with the use of VR and which area they want it to be applied in. In the other columns other comments and ideas from the interviews are noted
The classification of the application wishes were made based on the classifications from the "Challenges" map and were used for inspiration for the "ideas for implementation" map.
A. Case Study Data
X

Idea Area of use Class BiW Paint Stamp GEO TCF Potential benefits Potential problems Potential user
Using VR to easier communicate and present changes in a Virtual Build Event meetings
Communication/ presentation x x x x x
Time savings and savings in communication error, the meetings usually take 2-3 hours which potentially could be speeded up when using VR because it will simplify explanation
People not comfortable with VR
Time consuming the first time
Technology messing, delaying the presentation
Director, System Manager
Using VR to be able to do a Line walkthrough Visualization x x
Doesn't need to travel there to understand the problem
Saves time and money
Go through the paint processes and see what could go wrong.
Set-up time vs. benefits SM, ME
Discussing with R&D/PQ/DM about changes etc.
Instead of sharing screen through skype
x x x Same as nr 2
Other person might not have VR
Need for good visualisation quality
SPL
Test for reachability Test feasibility of assembly x x x Less testing needed i real environment
Technology may not be available at CEVT now, hand tracking needed
ME, SIM
Point and explain what the problem is together in a VR environment
Communication, visualization x x x Less communication errors and no
need to travel VR multiplayer ME, SIM
Seeing how the robot clashes with objects Visualization x x x Easier to see a solution for the
clashing problem
Time consuming or inconvenient to take on and off glasses and moving to other location
SIM
Testing how people of different sizes will reach
Feasibility of ergonomics x x Less problems when testing in real
life, better ergonomicsMay need motion capture suit ME, SIM
A support tool to backup what he claims
Communication, visualization x x
Supporting tool for discussions with for example R&D to be able to strengthen the decisions based on experience
VR multiplayer ME, SIM, SM
Rendering Visualization x xBeing able to see interaction between two parts in a virtual environment from different angles
Long setup time ME
Discussions with China Communication x x x x x
Doesn't need to travel there to understand the problem
Saves time and money
Other person might not have VR, bad quality of internet connection
All
Get a feeling for how it will look Visualization x x x
Se collisions between tool parts, wrinkles and feel 1:1 scale of how big parts are
Long setup time SM, ME
Testing of concepts in early phase Visualization x x
Reduce time needed for the testing and detect problems early before it goes to concept
Long setup time SPL, SM
A. Case Study Data
A.7 Ideas for implementation
XI

ClassesClassification Description
Analysis When the area of use is mostly connected to analysing ergonomic issues and other
Communication When the area of use is mostly connected to enabling better communication
Visualization When the area of use if mostly connected to issues regarding visualization
Comments
In this map all ideas that have come up, during interviews or simply when talking to people, are presented. These ideas were classified and marked which department they were applicable for. The potential benefits, problems and user were noted after discussions.
A. Case Study Data
XII

BMapping
In this appendix the following sections can be found:
B.1 High level cross mappingB.2 Exploring activitiesB.3 Combination of Manufacturing Engineering activities and Virtual Reality
XIII

Areas of application for VRAreas of application for ME Communication Design Ergonomics Training Virtual assembly Visualization
Analysis x xxx x x x x 8Certification 0
Communication xxx x x x x x 8Ergonomics x xxx x 5Information xx x x 4
IT 0Manufacturability x xx xx x xx x 9Simulation Limit x xx x xxx 7
9 8 7 5 5 7
ClassesClassification Description Analysis Hard to analyze problem for example studying the simulation resultCertification Necessary for certification of the vehicle, such as car crash testing Communication Problems connected to communication Ergonomics Ergonomic issues for manual work Information Lack of information about changes/updates, for example from R&D or other departmentsIT Problems with technical issues such as programs lagging, licences, bad connection Manufacturability Difficulties with parts (fitting in the car or being manufacturable) Simulation Limit Can't be simulated due to limitations or lack of programs
Conclusions from mapVR not applicable if value = 0
Certifiation With certification issues there are more factors to consider (such as law regulations) which will need to be addressed before replacing/ adding activities with VR
IT IT problems mostly need support from the IT department and VR is not seen as a useful tool to solve these problems
Joining of Points CommentAnalysis + Ergonomics = Analysis in next map 13 Joining of these two categories were made since ergonomic issues is a part of analysing
problemsCommunication + Information = Communication in next map 12 Joining of these two categories were made since information is a part of communication
Manufacturability + Simulation limits = Visualization in next map 16 Joining of these two categories were made because both categories are related to visualization
problems
CommentsIn this high level cross mapping identified areas of application of VR are cross compared with areas of application at the case company.
The 6 areas of application for VR are identified through the theoretical research and explained in more detail in the report.
The 8 areas of application within the case company are identified from the summary of the interviews. The classification is explained below.
When doing the cross mapping weight has been put on activities where the two areas are more applicable or give greater benefits, for example design and visualisation will impact simulation limits more than the other identified VR areas.
B. Mapping
B.1 High-level cross mapping
XIV
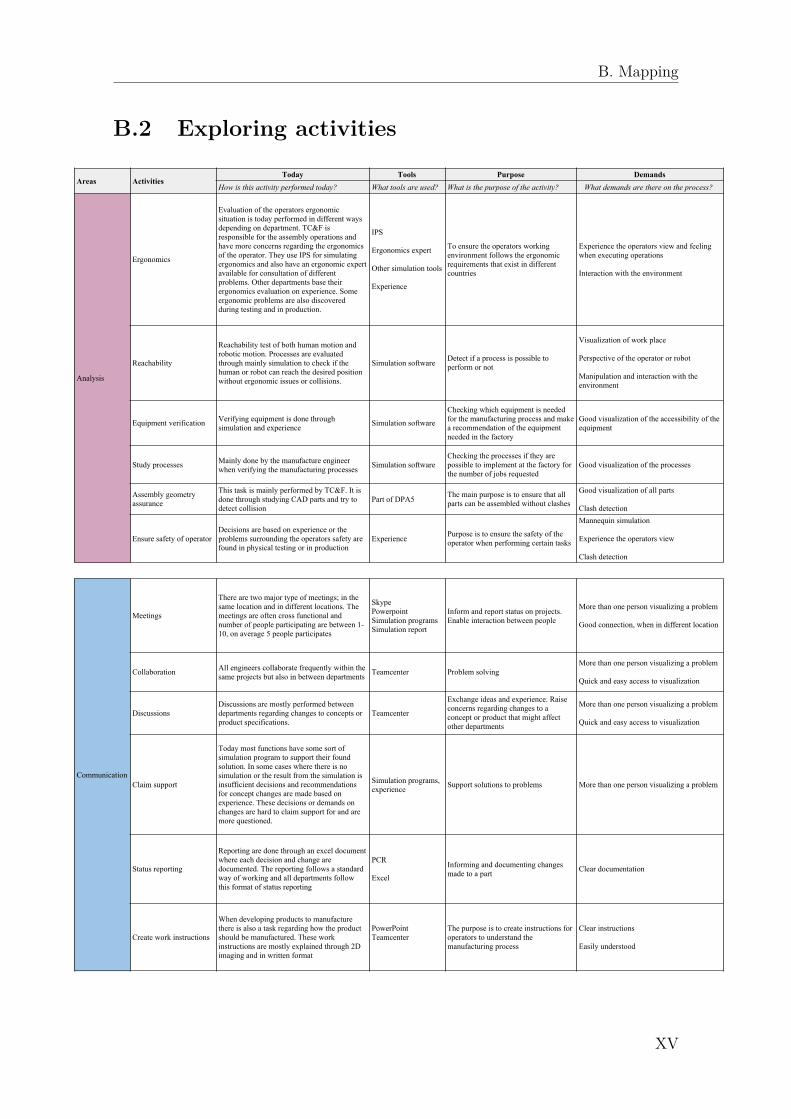
Areas ActivitiesToday Tools Purpose Demands
How is this activity performed today? What tools are used? What is the purpose of the activity? What demands are there on the process?
Analysis
Ergonomics
Evaluation of the operators ergonomic situation is today performed in different ways depending on department. TC&F is responsible for the assembly operations and have more concerns regarding the ergonomics of the operator. They use IPS for simulating ergonomics and also have an ergonomic expert available for consultation of different problems. Other departments base their ergonomics evaluation on experience. Some ergonomic problems are also discovered during testing and in production.
IPS
Ergonomics expert
Other simulation tools
Experience
To ensure the operators working environment follows the ergonomic requirements that exist in different countries
Experience the operators view and feeling when executing operations
Interaction with the environment
Reachability
Reachability test of both human motion and robotic motion. Processes are evaluated through mainly simulation to check if the human or robot can reach the desired position without ergonomic issues or collisions.
Simulation software Detect if a process is possible to perform or not
Visualization of work place
Perspective of the operator or robot
Manipulation and interaction with the environment
Equipment verification Verifying equipment is done through simulation and experience Simulation software
Checking which equipment is needed for the manufacturing process and make a recommendation of the equipment needed in the factory
Good visualization of the accessibility of the equipment
Study processes Mainly done by the manufacture engineer when verifying the manufacturing processes Simulation software
Checking the processes if they are possible to implement at the factory for the number of jobs requested
Good visualization of the processes
Assembly geometry assurance
This task is mainly performed by TC&F. It is done through studying CAD parts and try to detect collision
Part of DPA5 The main purpose is to ensure that all parts can be assembled without clashes
Good visualization of all parts
Clash detection
Ensure safety of operator Decisions are based on experience or the problems surrounding the operators safety are found in physical testing or in production
Experience Purpose is to ensure the safety of the operator when performing certain tasks
Mannequin simulation
Experience the operators view
Clash detection
Communication
Meetings
There are two major type of meetings; in the same location and in different locations. The meetings are often cross functional and number of people participating are between 1-10, on average 5 people participates
SkypePowerpointSimulation programsSimulation report
Inform and report status on projects. Enable interaction between people
More than one person visualizing a problem
Good connection, when in different location
Collaboration All engineers collaborate frequently within the same projects but also in between departments Teamcenter Problem solving
More than one person visualizing a problem
Quick and easy access to visualization
Discussions Discussions are mostly performed between departments regarding changes to concepts or product specifications.
Teamcenter
Exchange ideas and experience. Raise concerns regarding changes to a concept or product that might affect other departments
More than one person visualizing a problem
Quick and easy access to visualization
Claim support
Today most functions have some sort of simulation program to support their found solution. In some cases where there is no simulation or the result from the simulation is insufficient decisions and recommendations for concept changes are made based on experience. These decisions or demands on changes are hard to claim support for and are more questioned.
Simulation programs, experience Support solutions to problems More than one person visualizing a problem
Status reporting
Reporting are done through an excel document where each decision and change are documented. The reporting follows a standard way of working and all departments follow this format of status reporting
PCR
Excel
Informing and documenting changes made to a part Clear documentation
Create work instructions
When developing products to manufacture there is also a task regarding how the product should be manufactured. These work instructions are mostly explained through 2D imaging and in written format
PowerPointTeamcenter
The purpose is to create instructions for operators to understand the manufacturing process
Clear instructions
Easily understood
B. Mapping
B.2 Exploring activities
XV

Areas ActivitiesToday Tools Purpose Demands
How is this activity performed today? What tools are used? What is the purpose of the activity? What demands are there on the process?
Visualization
Perceived quality Analysing the perceived quality is a task mainly done through physical testing or based on experience
Experience
Physical testing
Try to detect bad perceived quality before production
Good resolution
Import of many files to see the whole product
Concept verification
When verifying the concept several different processes are checked and verified. These verifications are made in every department on different parts of the product to ensure that the car is manufacturable
DPA5Checking if the concept is possible to manufacture or what changes are necessary to do
Good communication between departments and R&D
Experience factory layout
When needing to understand the plant layout drawings and point cloud scanning are studied, if these are available. Otherwise visits to the factories are made
Point cloud
Drawings
Factory visit
Understanding the layout of the factory can be necessary to understand which changes are possible to make or how big impact a new line or process are going to have on the surroundings
Visualize the whole factory
Experience line layout
When trying to understand the line layout there are sometimes CAD files to study, or point cloud scanning. Otherwise visits to the factory are made.
Point cloud
Drawings
Factory visit
The purpose of understanding the line layout is to visualize possible changes and how these will affect the process. Also to make sure everything fit in the layout
Visualize the line
Possible to import the concept for verification
Getting a perspective of the size of components in the layout
Experience cell layout
For the cell layout there are CAD files of how the cell will look like which can be studied to understand the layout
CAD files
The purpose is to understand the cell layout to be able to check that everything fit and what changes are possible to make
Visualize the cell
Getting a perspective of how big or small parts are in comparison to the environment they are in
CommentsThis map is based on the identified activities during the case study which have a possibility to implement VR within the three different categories; Analysis, Communication and Visualization.
First how they are performed today, which tools are used and the purpose of the activity. The demands on the process is a connection between what the activity demands and what demands can be put on the VR application.
These activities are used in "Identification of combinations ME vs. VR" map where the demands are used as a basis for the requirements specification on VR.
B. Mapping
XVI

Areas Activities Output levelRequirement specification on VR What should be used? Time span
What VR technology to use? What type of VR is suitable for this activity?
When can it be used at CEVT?FOV Resolution Haptics Motion tracking Controller
Analysis
Ergonomics Minimum Normal Normal None None Two Normal HMD, controller
Additional Large Normal Body, hands Body, hands None Large FOV HMD, body
suit, gloves and haptics
Reachability
Minimum Normal Normal None Body, hands None Normal HMD, motion tracking (body, hands)
Additional Normal Normal Hands Body, hands NoneNormal HMD, motion tracking (body, hands), haptics (hands)
Equipment verification
Minimum Normal Normal None None One/two Normal HMD, controller
Additional Normal Normal Hands None One/twoNormal HMD, controller, haptics (hands)
Study processes Normal Normal None None One/two Normal HMD, controller
Assembly geometry assurance
Minimum Normal Normal None None One/two Normal HMD, controller
Additional Normal High Hands None One/two High res. HMD, haptics (hands), controller
Ensure safety of operator Large Normal None Body, hands None Large FOV HMD, body
suit and gloves
Communication
Meetings
Minimum Normal Normal None None One/two Normal HMD, controller
Additional Multiple normal Normal None Body One/two
Multiple normal HMDs, controller, motion tracking (Body)
Collaboration
Minimum Normal Normal None None One/two Normal HMD, controller
Additional Multiple normal Normal None Body One/two
Multiple normal HMDs, controller, motion tracking (Body)
Discussions
Minimum Normal Normal None None One/two Normal HMD, controller
Additional Multiple normal Normal None Body One/two
Multiple normal HMDs, controller, motion tracking (Body)
Claim support Normal Normal None None One/two Normal HMD, controllerStatus reporting Normal Normal None None One/two Normal HMD, controllerCreate work instructions Normal Normal None Body Two Normal HMD, body suit,
controllers
Visualization
Perceived quality Normal High None None One/two High res HMD, controller
Concept verification Normal Normal None None One/two Normal HMD, controller
Experience factory layout Large Normal None None One/two Large FOV HMD,
controllerExperience line layout Large Normal None None One/two Large FOV HMD,
controllerExperience cell layout Normal Normal None None One/two Normal HMD, controller
Evaluation levels Time spanVR criterias Evaluation level Direct, no major planning or budgeting is necessary, technology and
knowledge excist within the companyFOV
Large (around 180 degrees)Normal (around 110 degrees) Within 1 year, requires planning and some budget changes, investment
may be required and a broader knowledge within the company is neededResolution
High (above 1400 x 1600 per eye)Normal (around 1080×1200 per eye) Future, major reorganization and updating of work process description is
needed. Deeper understanding is required, as well as technical knowledge. Technology needs to be developed before investment can be made
HapticsBodyHandsNone
Motion tracking BodyHandsNone
ControllerOneTwoNone
B. Mapping
B.3 Identification of combinations
XVII

B. Mapping
XVIII
CPhysical testing survey
In this appendix the following sections can be found:
C.1 Preparation questionsC.2 Desktop vs Virtual RealityC.3 Estimated changesC.4 Evaluating importance of different factorsC.5 Use of VR in the work
XIX

C. Physical testing survey
C.1 Preparation questions
XX

C. Physical testing survey
XXI

C. Physical testing survey
C.2 Desktop vs. Virtual Reality
XXII

C. Physical testing survey
XXIII
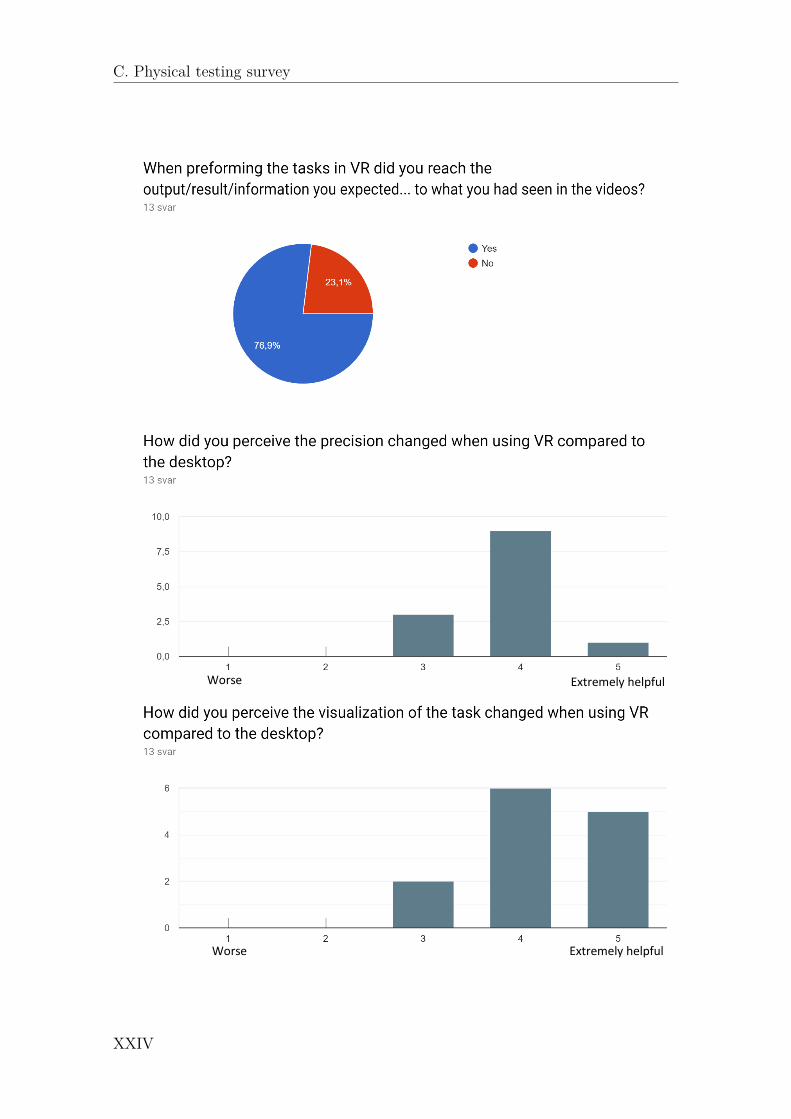
Extremely helpful Worse
Extremely helpful Worse
C. Physical testing survey
XXIV

Positive Negative
Stomach sick No sickness
C. Physical testing survey
XXV

C. Physical testing survey
C.3 Estimated changes
XXVI

C. Physical testing survey
XXVII

C. Physical testing survey
XXVIII
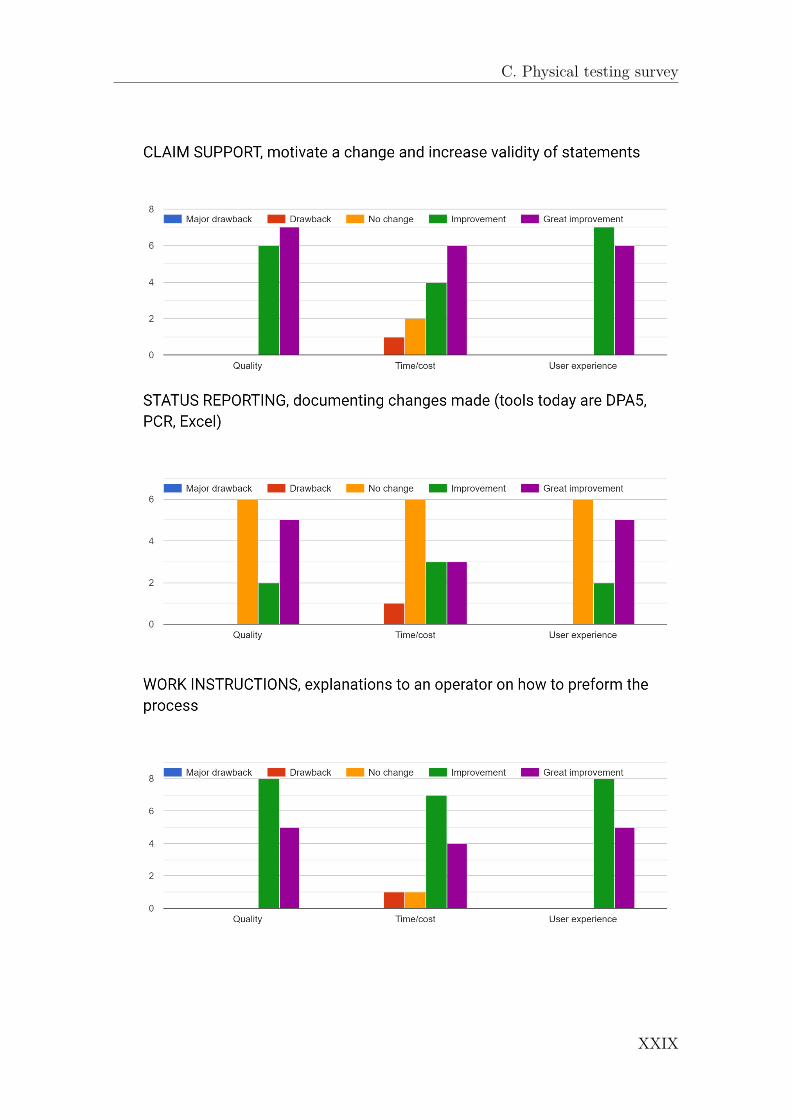
C. Physical testing survey
XXIX

C. Physical testing survey
XXX

C. Physical testing survey
XXXI

C. Physical testing survey
C.4 Evaluating importance of different factors
XXXII

C. Physical testing survey
XXXIII

C. Physical testing survey
C.5 Use of VR in work processes
XXXIV
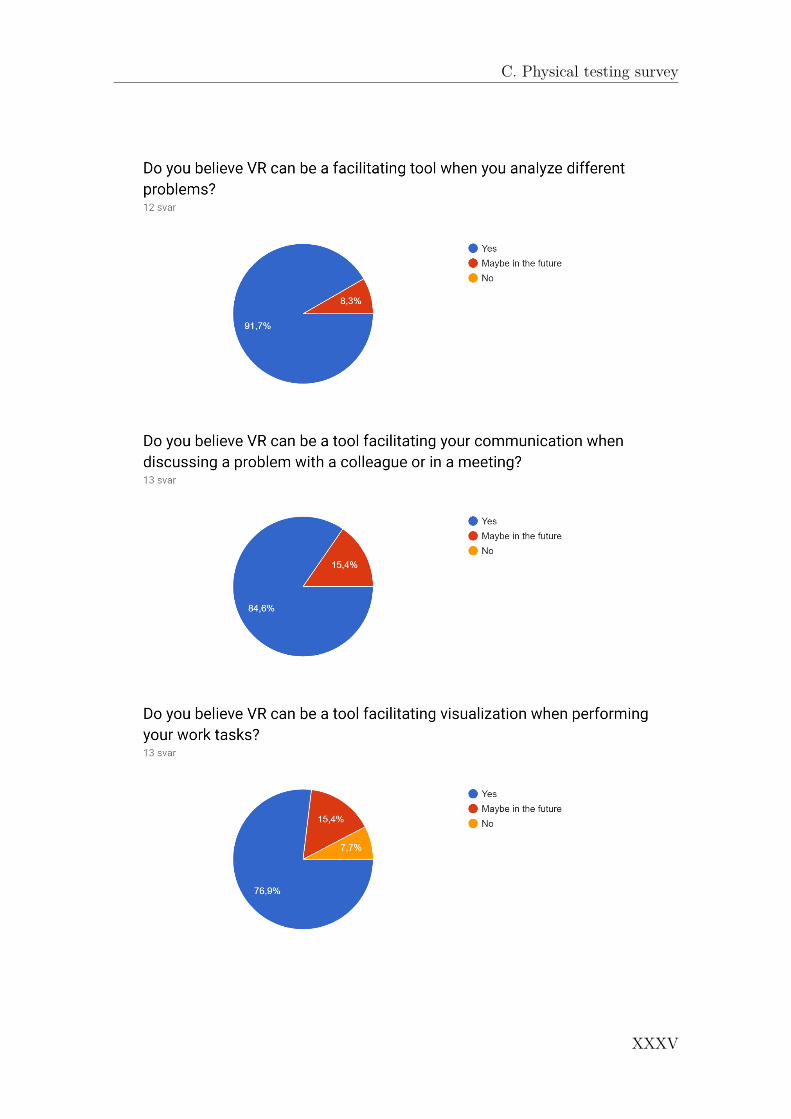
C. Physical testing survey
XXXV
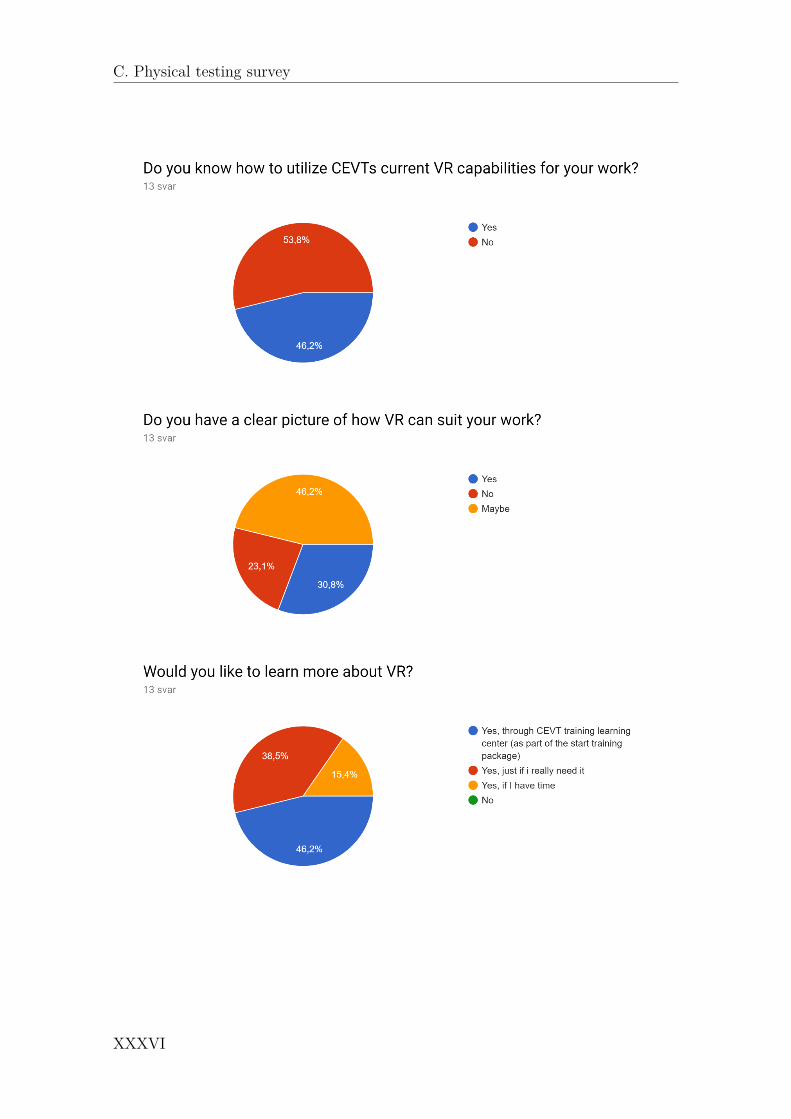
C. Physical testing survey
XXXVI

C. Physical testing survey
XXXVII

C. Physical testing survey
XXXVIII
DGuidelines and recommendations
to case company
D.1 Summarization of the result
Immersive technologies should be used in the work processes at ME CEVT. In gen-eral, it is important to understand that VR should NOT be used as a substitute tocurrent work processes but as an additional tool to create better or quicker results.The major reason for ME to use VR is to have a better tool for analysis, communi-cation and visualization, it is in these three areas the greatest potential lie.
The work processes, where the greatest potential have been found, are within col-laborative meetings and ergonomics. Using VR for collaborative meetings adds anadditional tool to visualize different parts of the product. Compared to current workprocesses, this can facilitate when trying to explain and discuss different problems.
Within ergonomics it is possible to experience the operators work position or toevaluate if it is a reachable position. The current VR setup can be a simple tool formost departments to use for a fast and easy evaluation instead of making a majorergonomic evaluation. The level of work within ergonomics varies a lot betweenthe different departments and therefore the requirements on the VR equipment alsovaries. In the future for deeper ergonomic evaluations, where for example path plan-ning, statistical analysis of the movements and greater anthropometric values can beanalyzed, other additional peripherals would be necessary and further developmentof IPS as well.
Examples of the tests and tasks we suggest VR should be used for within ergonomicsare:
• Path planning operators’ tasks: In the VR environment decide a pathwhich the operator should follow and then receive ergonomic statistics for thewhole manikin family if they were to follow the same path. Currently the pathneeds to be created manually at the desktop setup which takes a long time.This needs to be developed in collaboration with IPS.
• Experience operators work situation: In the VR environment it is possi-ble to experience the operators work position, which is necessary to evaluatewhen making recommendations of a weld process, a manual paint process or
XXXIX

D. Guidelines and recommendations to case company
an assembly. Currently when making decisions for example what weld gun touse, this is based on previously acquired knowledge. With VR the situationcan be visualized in scale 1:1 and the operators work situation can be experi-enced instead of estimated.
• Ensure safety of operator: Sometimes harmful situations can be discoveredin the actual production such as sharp edges that might damage hands whenin contact because of a narrow space. These might be hard to visualize andperceive the surrounding space on a desktop and in VR it might be possibleto discover these tight areas before they go into production.
Both communication and ergonomics are possible to apply in current work processestoday since the technology is ready for it and both processes also have potential todevelop into a tool for deeper analysis if other hardware or further developed soft-ware is used in the future.
The level of knowledge of VR in the ME department is in general quite low. How-ever, once the VR environment is set up most people tend to understand quicklyhow to use the tool. There are a couple of individuals with more knowledge of thetechnology which is a great strength for ME department. To lift the overall level ofknowledge, on how to use VR, a course or more information should be distributedto everyone. This could be done by more collaborations with the people with moreknowledge or having training sessions. If people have more knowledge on how theVR tools work, they will also see the possibilities for how it can be used to facilitatein their own work processes. It is important to make the people feel involved sothat they in the future will pick up the tool themselves because they need it andnot because they are forced to use it.
D.2 Potential benefits if implementing VRWith the use of VR there are several cases both within the company and otherinstances where VR have been shown to have benefits within time, cost, quality anduser experience.
D.2.1 Time/costWithin the time and cost area the benefits of using VR is to lower the time con-sumption of tasks and in that way reduce cost of activities. One example of thisis when using VR within a collaborative engineering meeting it was estimated thatthis saved between 4-6 additional meetings. VR have been shown to reduce theknowledge gap between people from different disciplines. The object in questioncan be seen from a common viewpoint and therefore it will be easier to discuss andunderstand. 4-6 engineering meetings with a duration of an hour and with 5-10engineers will mean a time save of 20-60 engineering hours for each time.
XL
D. Guidelines and recommendations to case company
Assembly steps can also be tested in a virtual environment which creates the pos-sibility to use an additional tool instead of only basing a decision on experienceor making a full simulation. Testing the assembly will likely be faster in VR thanperforming full simulations for each assembly and give better judgement than onlybasing the decision on experience. If problems are found when testing the assemblyin VR it may need further research. This will save time from doing multiple longsimulations. Another example is that it can save time by not having to do a phys-ical build. In some cases, there is no need for a physical build when the conceptcan be verified in a virtual environment instead. It may be enough to convince theaffected people that the concept will function properly instead of needing to buildit physically.
Another area connected to this is when using VR in an early phase of a concept.The earlier problems are detected the more time and money will be saved. Finally,VR can potentially decrease the number of travels to China since some tasks will bepossible to do through VR instead of being in the same physical location.
D.2.2 QualityWithin the quality area the benefits of using VR is connected to minimizing errorsand miscommunication. With VR it is possible for a clearer information exchangeduring for example meetings. When minimizing the miscommunication, it will re-duce errors in decisions or discussions. The quality will also be improved when usingVR in an early phase to find errors. To ensure that the quality will not be decreasedit important to make sure that the virtual environments are correctly built to repre-sent reality and that they include the necessary functions, such as collision detectionand visual feedback, to work properly.
D.2.3 User experienceWithin the user experience area, the benefits of using VR is an increased senseof immersion but also gives another type of interface compared to working witha screen. It gives the person the possibility to visualize product in scale 1:1 andinteract with the 3D virtual objects. For the user experience to be good it essentialthat the equipment being used works. The computer that the VR setup is connectedto should be powerful enough to handle the VR environments without problems sothat the user experience is not compromised.
D.3 Time planHere is a recommendation of the steps to take with the VR initiative based on thefindings we have made during our thesis.
• Step 1: Focus on the current VR technology you have now. This is a basicsetup that is easy to learn and get used to which allows for more people toeasily be able to start using it. This will also allow the people with more
XLI

D. Guidelines and recommendations to case company
knowledge to become experts. You should also still focus on the software thatyou are using, i.e. IPS and Process Simulate, since you already have experi-ence with it. For the departments that doesn’t use these programs it is stillrecommended to use them since there are support and help to be found withinthe ME department. The people with more knowledge should introduce othersto VR. Easier visualization tasks can be introduced and taught in IPS firstsince this do not require any advanced preparations or deeper knowledge ofthe software. Game engines should not be focused on since these will requirefurther knowledge and is not needed for the activities.
• Step 2: Start implementing VR in the activities that have been found to bebeneficial and that are ready to implement, i.e. the activities that are markedgreen in the thesis report. Implementation of VR for the activities should startat a small scale or level and increase over time.
• Step 3: A way to educate everyone on how to use VR should be created. Thepurpose of this education should be to teach how to use VR, what needs to beprepared in the software, how to set up the VR equipment in the VR room,how to interact in the VR environment. This would allow for people to createmore advanced VR environments. From the survey it could be seen that ashort preparation and setup time is wanted. More knowledge and experienceabout the technology would reduce the time needed to utilize the VR equip-ment.
• Step 4: Make the available VR resources more accessible. Make it so thatthe room can be booked online and that everyone can access the headset andcontrollers without having to ask for a key.
• Step 5: Investigate using more advanced equipment. Haptics, multiple usersin the same environment and motion tracking is example of technologies thatshould be implemented in the future. Haptics should have the highest prioriti-zation since it was voted as the function that would improve the VR experiencemost and give better quality and user experience. Assembly geometry assur-ance would especially benefit from the implementation of haptics. Multipleusers would increase the possibilities for collaborative meetings and improvethe communication even further. Motion tracking would be beneficial whenworking with ergonomics as data from the motion tracking could be gatheredand transferred to ergonomic manikins. In collaborative meetings a virtualbody could also be added by motion tracking.
• Step 6: Continue to follow the development of VR technology and additionalperipherals. VR moves quickly and it’s important to stay updated to makethe most out of the technology.
XLII

D. Guidelines and recommendations to case company
D.4 Virtual Reality organizationIf VR is going to become a resource that is being used more it should be given anorganization to support it. One vision for this is that each department, e.g. ME andVI, have their own knowledge about how to use VR at their departments and havegood knowledge on how VR can be used with the common software used at the de-partment. There should also be a central VR department that can support the otherdepartments with special cases that requires more advanced knowledge in VR andthe use of game engines. This department will keep updated with the advancementswithin VR technology and inform the other departments about what is available.Another function this department can provide is education. The education can in-clude information about the VR hardware, general software and requirements to useVR.
D.5 Virtual Reality setupFor the future setup of VR at ME a suggestion is to have one room that is designatedto use VR in. This room should be designed with some additional requirementsconnected to the use of VR, meaning that it should have a large area for the user/sto move around on without having to worry about walking into anything. Onesolution would be to place a different carpet on the floor within the VR zone sothat the user can feel when they step out of the zone while being immersed in theVR environment. The wires that are connected to the headset could be mountedin the ceiling so that they do not become an obstacle for the user. Wireless HMDsshould also be considered as an option. As much as possible of the setup shouldbe permanent so that the time needed to set everything up will be reduced. Agood network connection is important to ensure that VR meetings can be held withpeople in different locations. Large monitors should be installed so that others canobserve what the user is seeing. There should also be a meeting/conference table,outside the VR zone, so that it is possible to have collaborative meetings there.When the use of VR increases and if it is specified to be a part of a standard wayof working at ME one room will not be enough. One solution to this could be toinvest in standalone VR HMD when they have become good enough or create moreVR rooms with not as many features as the main VR room. Standalone HMD canalso help with the implementation since they will be easier to setup and bring tomeetings instead of needing to have meetings in the VR room. It is not believedthat everyone will have their own HMD. However, if the usage time of each HMDis increased it might be motivated to invest in additional HMDs.
D.6 Recommendation for continued research work(AE projects)
To continue the research within this field a suggested similar area to investigate isAugmented reality (AR). As stated in the report AR have not come as far as VR
XLIII

D. Guidelines and recommendations to case company
in its development but it should still be investigated since it is a technology thatis evolving and being improved quickly. Example of this is the HoloLens that isbeing developed by Microsoft which got a new updated release, HoloLens 2, in thespring of 2019. Compared to VR, AR provides the possibility to combine physicalobjects with virtual objects which can allow for other types of interaction. Worktask instructions for operators through AR is one area that could be explored forthe ME department.
XLIV