Evaluation of Modified PEG-Anilinoquinazoline Derivatives as Potential Agents for EGFR Imaging in...
10
B The Author(s), 2010 Published Online: 9 April 2010 DOI: 10.1007/s11307-010-0315-z Mol Imaging Biol (2010) 12:616Y625 RESEARCH ARTICLE Evaluation of Modified PEG-Anilinoquinazoline Derivatives as Potential Agents for EGFR Imaging in Cancer by Small Animal PET Maria A. Pantaleo, 1 Eyal Mishani, 2 Cristina Nanni, 3 Lorena Landuzzi, 4 Stefano Boschi, 5 Giordano Nicoletti, 4 Samar Dissoki, 2 Paola Paterini, 6 Pier Poalo Piccaluga, 1 Filippo Lodi, 5 Pier-Luigi Lollini, 1 Stefano Fanti, 3 Guido Biasco 1 1 Department of Hematology and Oncological Sciences “L.A.Serganoli”, Sant’Orsola-Malpighi Hospital, University of Bologna, Via Massarenti 9, 40138, Bologna, Italy 2 Cyclotron Unit, Department of Nuclear Medicine, Hadassah Hebrew University Hospital, Jerusalem, Israel 3 Nuclear Medicine Service, Sant’Orsola-Malpighi Hospital, University of Bologna, Bologna, Italy 4 Laboratory of Oncologic Research, Istituti Ortopedici Rizzoli, Bologna, Italy 5 PET Radiopharmacy-Nuclear Medicine Service, Sant’Orsola-Malpighi Hospital, Bologna, Italy 6 Interdepartmental Centre for Cancer Research “G. Prodi”, University of Bologna, Bologna, Italy Abstract Purpose: The in vivo evaluation of three modified polyethylene glycol (PEG)-anilinoquinazoline derivatives labeled with 124 I, 18 F, and 11 C as potential positron emission tomography (PET) bioprobes for visualizing epidermal growth factor receptor (EGFR) in cancer using small animal PET. Procedures: Xenograft mice with the human glioblastoma cell lines U138MG (lacking EGFR expression) and U87MG.wtEGFR (transfected with an overexpressing human wild-type EGFR gene) were used. Static and dynamic PET imaging was conducted for all three PEGylated compounds. Tumor necrosis, microvessel density, and EGFR levels were evaluated by histopathology and enzyme-linked immunosorbent assay. Results: Nineteen animal models were generated (two U138MG, three U87MG, 14 with both U138MG and U87MG bilateral masses). In static images, a slight increase in tracer uptake was observed in tumors, but in general, there was no retention of tracer uptake over time and no difference in uptake between U138MG and U87MG masses. In addition, no significant uptake was demonstrated in dynamic scans of the 18 F-PEG tracer. No necrosis was present except in four animals. MVD was 9.6 and 48 microvessels/×400 field in the U138GM and U87GM masses, respectively (p =0.00008). Similarly, the microvessel grades were generally higher in the U87GM group (p =0.002). Total EGFR amount was higher in U87MG than U138MG masses (p =0.001), but the ratio of activated (pY1068) to total EGFR did not differ (p =0.95). Conclusions: PEGylated tracers labeled with 11 C, 124 I, and 18 F showed no significant difference in uptake between U138MG and U87MG glioblastoma xenograft mice. The tracer binding with EGFR could be influenced by activation of the tyrosine kinase portion of the receptor which was similar in U138MG and U87MG. Despite these results, these tracers should be investigated in animal models with mutant EGFR genes to determine whether aberrant receptor function plays a role in tumor uptake. Key words: Epidermal growth factor receptor (EGFR), Small animal PET, Tyrosine kinase (TK) inhibitors Correspondence to: Maria A. Pantaleo; e-mail: [email protected]
Transcript of Evaluation of Modified PEG-Anilinoquinazoline Derivatives as Potential Agents for EGFR Imaging in...
B The Author(s), 2010Published Online: 9 April 2010 DOI: 10.1007/s11307-010-0315-z
Mol Imaging Biol (2010) 12:616Y625
RESEARCH ARTICLE
Evaluation of Modified PEG-AnilinoquinazolineDerivatives as Potential Agents for EGFRImaging in Cancer by Small Animal PETMaria A. Pantaleo,1 Eyal Mishani,2 Cristina Nanni,3 Lorena Landuzzi,4 Stefano Boschi,5
Giordano Nicoletti,4 Samar Dissoki,2 Paola Paterini,6 Pier Poalo Piccaluga,1
Filippo Lodi,5 Pier-Luigi Lollini,1 Stefano Fanti,3 Guido Biasco1
1Department of Hematology and Oncological Sciences “L.A.Serganoli”, Sant’Orsola-Malpighi Hospital, University of Bologna, ViaMassarenti 9, 40138, Bologna, Italy2Cyclotron Unit, Department of Nuclear Medicine, Hadassah Hebrew University Hospital, Jerusalem, Israel3Nuclear Medicine Service, Sant’Orsola-Malpighi Hospital, University of Bologna, Bologna, Italy4Laboratory of Oncologic Research, Istituti Ortopedici Rizzoli, Bologna, Italy5PET Radiopharmacy-Nuclear Medicine Service, Sant’Orsola-Malpighi Hospital, Bologna, Italy6Interdepartmental Centre for Cancer Research “G. Prodi”, University of Bologna, Bologna, Italy
AbstractPurpose: The in vivo evaluation of three modified polyethylene glycol (PEG)-anilinoquinazolinederivatives labeled with 124I, 18F, and 11C as potential positron emission tomography (PET)bioprobes for visualizing epidermal growth factor receptor (EGFR) in cancer using small animal PET.Procedures: Xenograft mice with the human glioblastoma cell lines U138MG (lacking EGFRexpression) and U87MG.wtEGFR (transfected with an overexpressing human wild-type EGFRgene) were used. Static and dynamic PET imaging was conducted for all three PEGylatedcompounds. Tumor necrosis, microvessel density, and EGFR levels were evaluated byhistopathology and enzyme-linked immunosorbent assay.Results: Nineteen animal models were generated (two U138MG, three U87MG, 14 with bothU138MG and U87MG bilateral masses). In static images, a slight increase in tracer uptake wasobserved in tumors, but in general, there was no retention of tracer uptake over time and nodifference in uptake between U138MG and U87MG masses. In addition, no significant uptakewas demonstrated in dynamic scans of the 18F-PEG tracer. No necrosis was present except infour animals. MVD was 9.6 and 48 microvessels/×400 field in the U138GM and U87GM masses,respectively (p=0.00008). Similarly, the microvessel grades were generally higher in the U87GMgroup (p=0.002). Total EGFR amount was higher in U87MG than U138MG masses (p=0.001),but the ratio of activated (pY1068) to total EGFR did not differ (p=0.95).Conclusions: PEGylated tracers labeled with 11C, 124I, and 18F showed no significant difference inuptake between U138MG and U87MG glioblastoma xenograft mice. The tracer binding with EGFRcould be influenced by activation of the tyrosine kinase portion of the receptor which was similar inU138MG and U87MG. Despite these results, these tracers should be investigated in animal modelswithmutant EGFRgenes to determinewhether aberrant receptor function plays a role in tumor uptake.
Key words: Epidermal growth factor receptor (EGFR), Small animal PET, Tyrosine kinase (TK)inhibitors
Correspondence to: Maria A. Pantaleo; e-mail: [email protected]
Introduction
The epidermal growth factor receptor tyrosine kinase(EGFR-TK) is currently considered one of the most
interesting molecular targets for cancer therapy [1]. EGFR isdifferentially dysregulated, overexpressed, mutated, oramplified in many types of cancer, and this may beassociated with more aggressive disease, therapy resistance,and shorter survival time [2–5]. Two major therapeuticstrategies have been developed to inhibit EGFR pathways incancer: monoclonal antibodies (Abs) that target the externalbinding domain (ligand binding domain) of the receptor orsmall molecular weight inhibitors that target the intracellularTK domain [6]. Some molecular markers for selectingpatients who may benefit from these drugs and predictresponse to EGFR-targeted therapy are under investigation.Thus, an attempt to quantify EGFR in tumors in vivo hasbecome one of the most pressing challenges in cancerresearch.
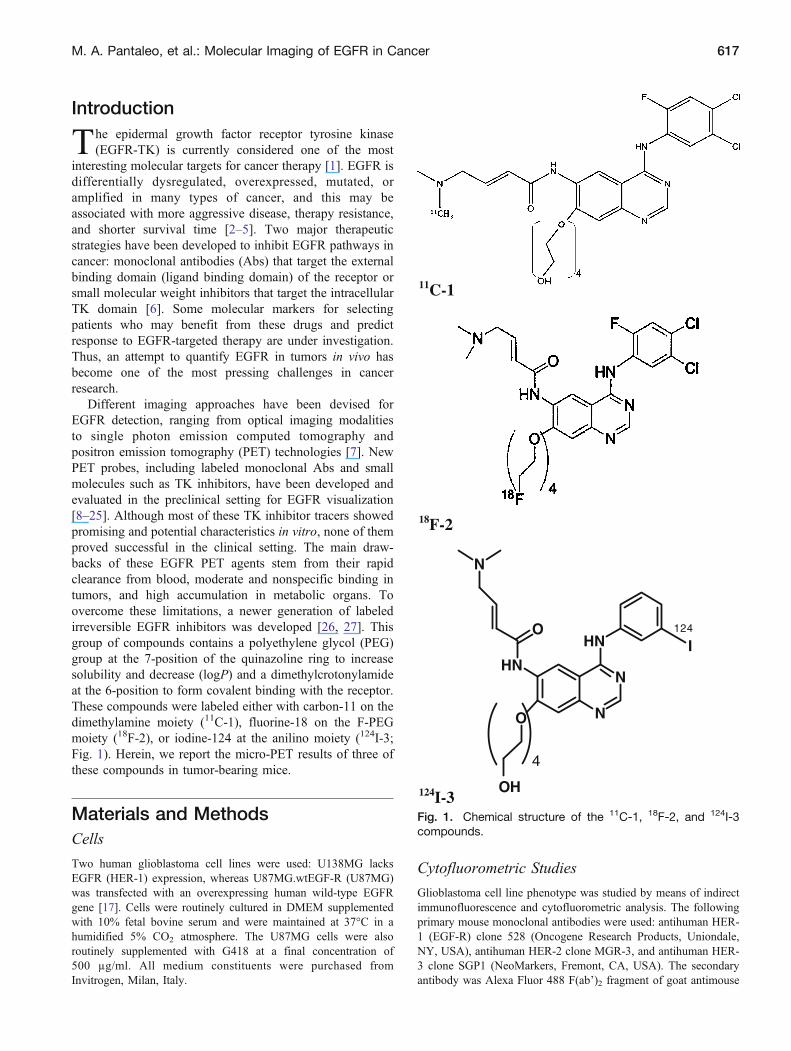
Different imaging approaches have been devised forEGFR detection, ranging from optical imaging modalitiesto single photon emission computed tomography andpositron emission tomography (PET) technologies [7]. NewPET probes, including labeled monoclonal Abs and smallmolecules such as TK inhibitors, have been developed andevaluated in the preclinical setting for EGFR visualization[8–25]. Although most of these TK inhibitor tracers showedpromising and potential characteristics in vitro, none of themproved successful in the clinical setting. The main draw-backs of these EGFR PET agents stem from their rapidclearance from blood, moderate and nonspecific binding intumors, and high accumulation in metabolic organs. Toovercome these limitations, a newer generation of labeledirreversible EGFR inhibitors was developed [26, 27]. Thisgroup of compounds contains a polyethylene glycol (PEG)group at the 7-position of the quinazoline ring to increasesolubility and decrease (logP) and a dimethylcrotonylamideat the 6-position to form covalent binding with the receptor.These compounds were labeled either with carbon-11 on thedimethylamine moiety (11C-1), fluorine-18 on the F-PEGmoiety (18F-2), or iodine-124 at the anilino moiety (124I-3;Fig. 1). Herein, we report the micro-PET results of three ofthese compounds in tumor-bearing mice.
Materials and MethodsCells
Two human glioblastoma cell lines were used: U138MG lacksEGFR (HER-1) expression, whereas U87MG.wtEGF-R (U87MG)was transfected with an overexpressing human wild-type EGFRgene [17]. Cells were routinely cultured in DMEM supplementedwith 10% fetal bovine serum and were maintained at 37°C in ahumidified 5% CO2 atmosphere. The U87MG cells were alsoroutinely supplemented with G418 at a final concentration of500 μg/ml. All medium constituents were purchased fromInvitrogen, Milan, Italy.
Cytofluorometric Studies
Glioblastoma cell line phenotype was studied by means of indirectimmunofluorescence and cytofluorometric analysis. The followingprimary mouse monoclonal antibodies were used: antihuman HER-1 (EGF-R) clone 528 (Oncogene Research Products, Uniondale,NY, USA), antihuman HER-2 clone MGR-3, and antihuman HER-3 clone SGP1 (NeoMarkers, Fremont, CA, USA). The secondaryantibody was Alexa Fluor 488 F(ab’)2 fragment of goat antimouse
18F-2
N
N
HN
O
OH
4
I124
HN
O
N
124I-3
11C-1
Fig. 1. Chemical structure of the 11C-1, 18F-2, and 124I-3compounds.
M. A. Pantaleo, et al.: Molecular Imaging of EGFR in Cancer 617
IgG (Invitrogen, Milan, Italy). After the final washings, cells wereresuspended in phosphate-buffered saline containing 1 μg/ml ofethidium bromide to gate out dead cells followed by cytofluoro-metric analysis with a FACScan (Becton Dickinson, St. Jose, CA,USA).
Mice
Athymic Crl:CD-1-Foxn1nu/nu mice (here referred to as nude mice)were purchased from Charles River Italy and kept under sterileconditions. Experiments were authorized by the institutional reviewboard of Bologna University and performed according to Italianand European guidelines.
U138MG and U87MG cells (3×10⁶ and 5×10⁶, respectively)were injected subcutaneously (s.c.) in the hind legs. Mice carryinga single tumor derived from a subcutaneous injection of each cellline or carrying both tumors (one on each side) were obtained.Tumor incidence and growth were evaluated weekly. Neoplasticmasses were measured with calipers; tumor volume was calcu-lated as π×[√(a×b)]3/6, where a = maximal tumor diameter andb = a tumor diameter perpendicular to a. Animals underwent PETimaging 5–6 or 10–15 days after cell injection. At sacrifice, tumorsamples were mechanically and enzymatically dissociated usingTrypsin–EDTA to obtain a single cell suspension for evaluationof EGFR expression by cytofluorometric analysis. Additionalsamples for histological determinations and biomolecular studieswere fixed in 10% phosphate-buffered formalin or frozen in liquidnitrogen.
Chemistry
The labeled compounds were prepared according to recentpublications [26, 27].
Imaging Protocol
The PET imaging procedure was as follows: Mice were anesthe-tized (Sevofluorane 3–5% and oxygen 1 lmin−1) and injected withvariable doses of tracers (ranging from 10 to 37 MBq according tothe isotope half-life) with an insulin syringe via the tail vein. Allanimals were evaluated in a static mode. This approach was chosensince the primary aim of this work was to evaluate tracer uptakerelated to the EGFR expression. Two animals injected with 18F-2underwent dynamic scans to evaluate whether an early traceruptake and a later washout were present.
For static acquisitions (repeated several times after injection tomonitor tracer distribution), animals were subsequently allowed toawaken and move freely for the uptake period. Finally, anesthesiawas induced a second time before the animal was placed prone onthe scanner bed of the small animal PET tomograph (GE, eXploreVista DR). Imaging lasted at least 15 min per bed position.
For dynamic acquisitions, the animal was anesthetized, placedprone on the scanner bed, centered in the field of view, and theninjected intravenously with the tracer. Simultaneously, the dynamiclist mode acquisition was started. Image acquisition lasted for30 min.
Since the axial field of view was only 4 cm, one bed positionwas not sufficient to cover the whole body. Therefore, a group ofanimals underwent at least one static whole body scan (two bedpositions) to verify the whole body distribution of the tracer. Forthe remaining animals, images were acquired on tumor areas only.Once the scan had been completed, gas anesthesia was interruptedand the animal was placed in a warm recovery box.
The images were reconstructed with iterative reconstruction 2DOSEM, matrix 175×175. Due to the small size of the animals, wedid not apply attenuation correction or scatter correction as they donot significantly influence semiquantitative PET analysis sincethe very high energy of the emitted photons (511 KeV) led to avery high rate of nonabsorbed photons. Using this system, the
Table 1. Image acquisition features for 124I-3
Cell line Uptake time FOV Static Dynamic Necrosis
1 Control, no tumor 60 min, 24 h, 48 h WB Yes No No2 U138MG 60 min, 4 h WB Yes No No3 U138MG 60 min, 5 h WB Yes No No4 U87MG 60 min, 24 h WB Yes No No5 U87MG 60 min, 5 h WB Yes No No6 U87MG 60 min, 4 h, 24 h, 48 h WB Yes No No7 U87MG + U138MG 20 min, 2 h, 5 h, 24 h, 48 h WB Yes No No8 U87MG + U138MG 60 min, 18 h, 39 h Segm Yes No No9 U87MG + U138MG 60 min, 18 h, 39 h Segm Yes No No10 U87MG + U138MG 24 h, 36 h Segm Yes No No11 U87MG + U138MG 60 min, 24 h, 36 h Segm Yes No No
U138MG (EGFR−) cell line, U87MG (EGFR+) cell line, WB whole body acquisition, Segm segmental acquisition
Table 2. Image acquisition features for 18F-2
Cell line Uptake time (min) FOV Static Dynamic Necrosis
1 U87MG + U138MG 5, 60, 150 Segm Yes No Yes2 U87MG + U138MG 5, 60, 150 Segm Yes No Yes3 U87MG + U138MG 5, 60, 150 Segm Yes No Yes4 U87MG + U138MG 5, 60, 150 Segm Yes No Yes5 U87MG + U138MG 60, 120 Segm Yes Yes (30 min) No6 U87MG + U138MG 60, 120 Segm Yes Yes (30 min) No
U138MG (EGFR−) cell line, U87MG (EGFR+) cell line, WB whole body acquisition, Segm segmental acquisition
618 M. A. Pantaleo, et al.: Molecular Imaging of EGFR in Cancer
best attainable spatial resolution was 1.4 mm as described byWang et al. in their performance evaluation [20]. According tothis procedure, the image quality was satisfactory for all of thescans. Although the image quality could have been slightlyimproved especially by increasing the acquisition time, as inevery nuclear medicine test, it was unnecessary since a prolongedacquisition time reduces the number of scanned animals per tracersynthesis.
For static acquisitions, a semiquantitative analysis was per-formed by calculating the tumor-to-background ratio (TBR) on thepelvic area of increased uptake. TBR was calculated as follows:
TBR ¼ Max Count in the Target Region of Interest ROIð Þ=Mean Count in the Background ROI
The background ROI was drawn on the subcutaneous tissues.For dynamic acquisitions, a ROI was drawn on the tumor and atime/activity curve was generated. No correction for decay wasapplied.
124I-3
Eleven animals underwent PET imaging with 10 to 30 MBq of theiodinated tracer. Three animals also underwent a small animal CTwhole body acquisition that was used for accurate localization of
activity uptake detected by the micro-PET. Table 1 shows theanimal population and the image acquisition features.
18F-2
Six animals underwent PET imaging with approximately 37 MBqof the fluorinated tracers. Table 2 shows the animal population andthe image acquisition features.
11C-1
Three animals underwent PET imaging with approximately37 MBq of the carbon-11 tracer. Table 3 shows the animalpopulation and the image acquisition features.
Molecular and Pathological Analyses
After sacrifice, tumor necrosis, microvessel density (MVD)analysis, and total and activated (pY1068) EGFR quantificationwere evaluated. Immunostains were adopted to evaluate endothelialcells. Anti-CD31 antibody (Santa Cruz, CA, USA) at a 1:20dilution was used. The sections underwent antigen retrieval inEDTA (pH=6.0) in a microwave at 750 W (four cycles lasting5 min each) and revealed by the alkaline phosphatase–anti-alkaline
Table 3. Image acquisition features for 11C-1
Cell line Uptake time (min) FOV Static Dynamic Necrosis
1 U87MG + U138MG 10 Segm Yes No No2 U87MG + U138MG 10 Segm Yes No No3 U87MG + U138MG 10 Segm Yes No No
U138MG (EGFR−) cell line, U87MG (EGFR+) cell line, WB whole body acquisition, Segm segmental acquisition
Table 4. Imaging results for all tested tracers
Cell line Tracer Uptake time TBR EGFr+ TBR EGFr−
1 Control 124I-3 60 min, 24 h, 48 h – –2 U138MG 124I-3 60 min, 4 h – G13 U138MG 124I-3 60 min, 5 h – G14 U87MG 124I-3 60 min, 24 h G1, G1 –5 U87MG 124I-3 60 min, 5 h G1, G1 –6 U87MG 124I-3 60 min, 4 h, 24 h, 48 h G1, G1, G1, G1 –7 U87MG + U138MG 124I-3 20 min, 2 h, 5 h, 24 h, 48 h G1, G1, G1, G1, G1 G1, G1, G1, G1, G18 U87MG + U138MG 124I-3 60 min, 18 h, 39 h G1, G1, G1 G1, G1, G19 U87MG + U138MG 124I-3 60 min, 18 h, 39 h G1, G1, G1 G1, G1, G110 U87MG + U138MG 124I-3 24 h, 36 h – 2.1, 411 U87MG + U138MG 124I-3 60 min, 24 h, 36 h –, 1.1, 4 –, 2.7, 5.112 U87MG + U138MG 18F-2 5 min, 60 min, 150 min G1, G1, 1.2 G1, G1, 113 U87MG + U138MG 18F-2 5 min, 60 min, 150 min G1, 1.5, 1.3 G1, 1.5, 1.114 U87MG + U138MG 18F-2 5 min, 60 min, 150 min 1.6, 1.6, G1 1.5, 1.5, G115 U87MG + U138MG 18F-2 5 min, 60 min, 150 min 1.2, 1.6, 1 G1, 1, 1.216 U87MG + U138MG 18F-2 60 min, 120 min 1.1, 2.6 1.8, 2.417 U87MG + U138MG 18F-2 60 min, 120 min 1.8, 1.4 2.8, 1.218 U87MG + U138MG 11C-1 10 min 1.7 1.719 U87MG + U138MG 11C-1 10 min 4.3 3.320 U87MG + U138MG 11C-1 10 min 1.6 1.6
Ten out of 20 animals presented a tumor-to-background ratio of ≤1 in U138MG and U87MG masses (the tracer uptake was very limited and did notsignificantly differ from subcutaneous tissues). The remaining ten masses presented a tumor-to-background ratio ≥1 (some animals had an increasing uptakewhile others had a decreasing trend over time)
M. A. Pantaleo, et al.: Molecular Imaging of EGFR in Cancer 619
phosphatase technique. Two separate methods were used toestimate MVD. In the first method, visual microvessel grading,the slides were visually scanned at ×100, ×200, and ×400magnification and semiquantitatively graded for the extent ofCD31 staining. To ensure the accuracy of the grading method,each sample was reviewed by two observers. Morphologic analysiswas performed carefully to ensure vessel specificity of the CD31-stained stroma considered for the analysis. Four different micro-vessel grades (MVG) were considered as previously described [28]:MVG 1, normal or slightly increased MVD; MVG 2, microvesselseasy to detect and definitely increased in respect to normal; MVG3, abundant microvessels; and MVG 4, strongly increased MVD.Nonneoplastic human nervous tissues were used as controlreference. The second method, visual count, involved countingmicrovessels according to previously described methods [28, 29].In performing this visual count, each of the slides was first scannedat ×100 magnification, and three areas with abundant microvesselswere chosen and defined as “hot spots”. The number of micro-vessels in each of these hot spots was then determined at ×400
magnification. The final MVD number was determined by takingthe average of the three separate visual counts. During counting,vessels in the tumor capsule were excluded. Areas of staining withno discrete breaks were counted as single vessels, and the presenceof a lumen was not required.
The two-tailed Student T test was used to compare U87GM andU138GM mice. Differences were considered significant for pvaluesG0.05. Pearson’s correlation was used to compare MVD andMVG methods.
Total and activated (pY1068) EGFR quantification was per-formed using an enzyme-linked immunosorbent assay (ELISA).For protein extraction, frozen tissues were homogenized using lysisbuffer (50 mM Tris, pH7.4, 150 mM NaCl, 2 mM MgCl2, 1%Triton X-100, 10% glycerol, 2 mM EGTA, 1 mM DTT) containingprotease inhibitors (10 mg ml−1 aprotinin and leupeptin, 5 mg ml−1
pepstatin, 1 mM phenylmethylsulfonyl fluoride) and phosphataseinhibitors (50 mM NaF, 10 mM Na4P2O7, 1 mM Na3VO4, 3 mMH2O2). Homogenates were centrifuged at 13,000×g for 15 min at4°C, and supernatants were stored at −80°C until analysis. Totaland activated EGFR concentrations were assessed using ELISA kitspurchased from Biosource International Inc. (Camarillo, CA, USA).Relative activated (pY1068) EGFR was defined as pY1068/totalEGFR.
ResultsAnimal Model Development
The human glioblastoma cell lines U138MG (lacking EGFRexpression) and U87MG (transfected with an overexpressinghuman wild-type EGFR gene) were used to establish asubcutaneous xenograft tumor model in nude mice for theassessment of EGFR labeling with innovative PET biop-robes. Indirect immunofluorescence and cytofluorometricanalyses were used to study the growth factor receptorexpression profile of EGFR (HER-1) and HER/erbB familyreceptors HER-2 and HER-3 in U138MG and U87MG cells.As indicated by the cytofluorometric profile, U87MG cellsin continuous culture showed EGFR overexpression on thecell surface, whereas U138MG cells were negative forEGFR membrane expression. Surface expression of HER-2
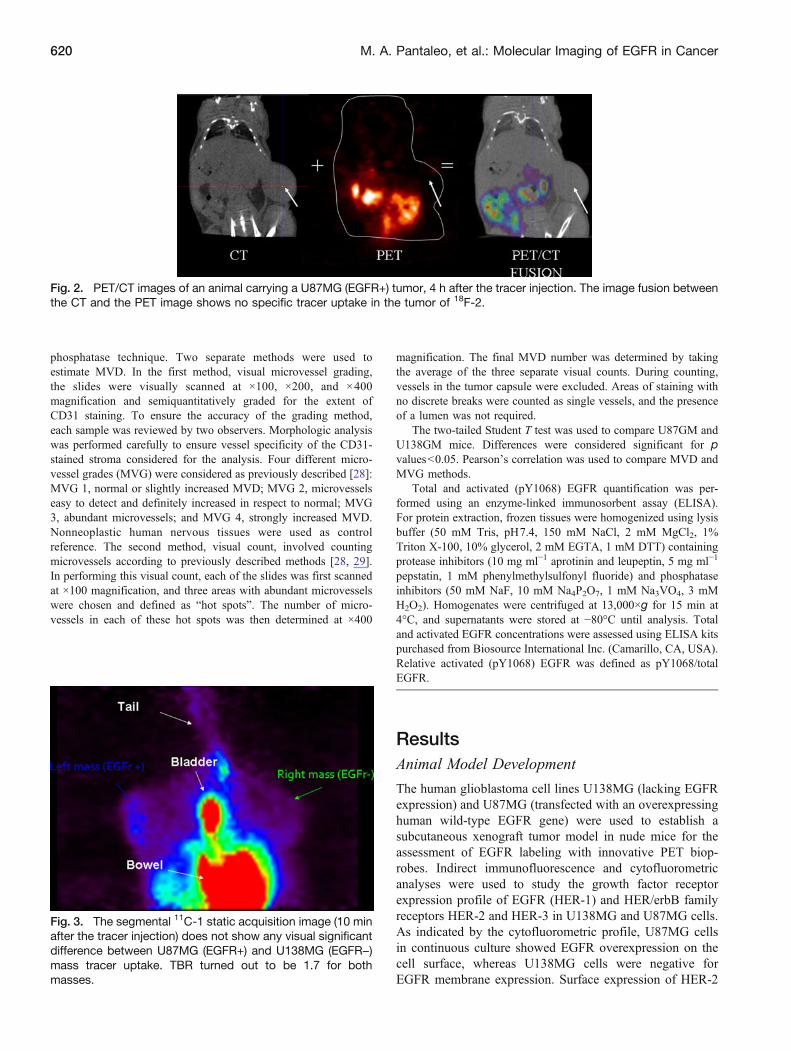
Fig. 2. PET/CT images of an animal carrying a U87MG (EGFR+) tumor, 4 h after the tracer injection. The image fusion betweenthe CT and the PET image shows no specific tracer uptake in the tumor of 18F-2.
Fig. 3. The segmental 11C-1 static acquisition image (10 minafter the tracer injection) does not show any visual significantdifference between U87MG (EGFR+) and U138MG (EGFR−)mass tracer uptake. TBR turned out to be 1.7 for bothmasses.
620 M. A. Pantaleo, et al.: Molecular Imaging of EGFR in Cancer
proteins was almost negative on both cell lines, while HER-3 was expressed only in the U138MG cell line. When thecell lines were grown as subcutaneous tumors in nude mice,the HER/erbB family receptor expression profile was similarto that seen when the cells were grown in continuous liquidculture. Most importantly, EGFR expression in U87MGxenografts remained very high, whereas U138MG xeno-grafts remained completely negative for EGFR expression.
The xenograft tumor model was established by s.c.injection of 3×10⁶ U138MG or 5×10⁶ U87MG cells intothe hind legs of nude mice. After subcutaneous injection,tumor growth became evident after a median latency timeof 4 days for both cell lines. U138MG tumor growth wasexponential whereas U87MG growth was very slow andsometimes indolent. However, no differences in tumorlatency, incidence, or growth were seen in mice carryingone subcutaneous tumor or both (one on each hind leg).Tumor-bearing animals underwent PET analysis 5 to6 days after cell injection when tumor dimensions were0.161±0.011 and 0.104±0.004 cm3 for U138MG andU87MG, respectively (dimensions from one experimentrepresentative of other similar experiments). PET analysiswas also performed 10–15 days after cell injection whentumor dimensions were 3.368±0.956 and 0.785±0.309 cm3, respectively (dimensions from one experiment14 days after cell injection representative of other similarexperiments).
Tumor Uptake
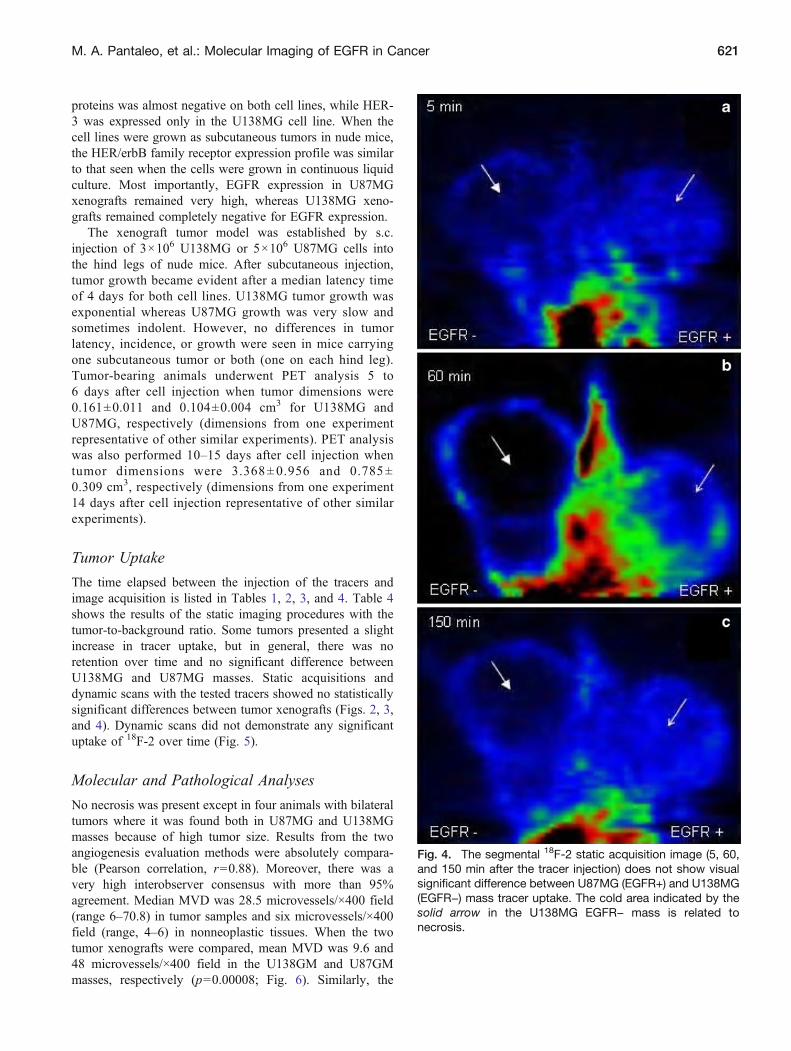
The time elapsed between the injection of the tracers andimage acquisition is listed in Tables 1, 2, 3, and 4. Table 4shows the results of the static imaging procedures with thetumor-to-background ratio. Some tumors presented a slightincrease in tracer uptake, but in general, there was noretention over time and no significant difference betweenU138MG and U87MG masses. Static acquisitions anddynamic scans with the tested tracers showed no statisticallysignificant differences between tumor xenografts (Figs. 2, 3,and 4). Dynamic scans did not demonstrate any significantuptake of 18F-2 over time (Fig. 5).
Molecular and Pathological Analyses
No necrosis was present except in four animals with bilateraltumors where it was found both in U87MG and U138MGmasses because of high tumor size. Results from the twoangiogenesis evaluation methods were absolutely compara-ble (Pearson correlation, r=0.88). Moreover, there was avery high interobserver consensus with more than 95%agreement. Median MVD was 28.5 microvessels/×400 field(range 6–70.8) in tumor samples and six microvessels/×400field (range, 4–6) in nonneoplastic tissues. When the twotumor xenografts were compared, mean MVD was 9.6 and48 microvessels/×400 field in the U138GM and U87GMmasses, respectively (p=0.00008; Fig. 6). Similarly, the
Fig. 4. The segmental 18F-2 static acquisition image (5, 60,and 150 min after the tracer injection) does not show visualsignificant difference between U87MG (EGFR+) and U138MG(EGFR−) mass tracer uptake. The cold area indicated by thesolid arrow in the U138MG EGFR− mass is related tonecrosis.
M. A. Pantaleo, et al.: Molecular Imaging of EGFR in Cancer 621

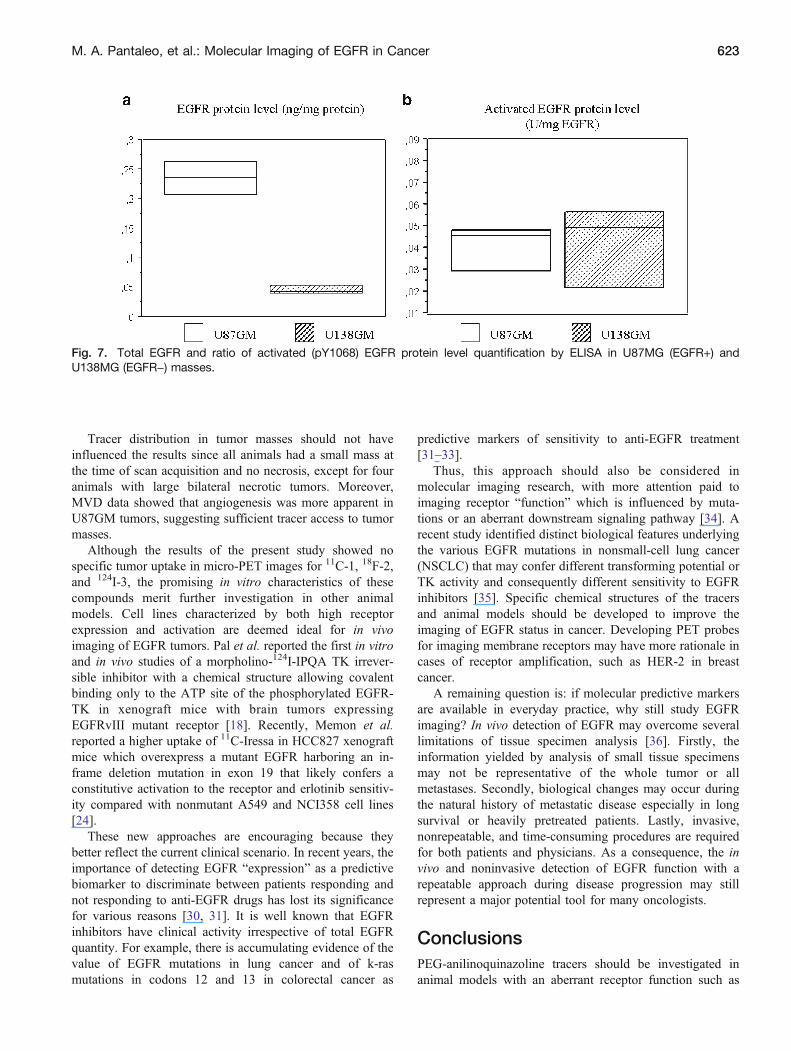
MVG scores were generally higher in the U87GM group(p=0.002). Total EGFR amount was higher in U87MG thanU138MG masses (p=0.001), but the ratio of activated(pY1068) to total EGFR did not differ (p=0.95; Fig. 7).
DiscussionThe present study reports on the development of PEG-anilinoquinazoline derivatives labeled with 11C, 124I, and 18Fas potential probes for in vivo imaging of EGFR in U138MGand U87MG glioblastoma xenograft mice using small
animal PET. The most important chemical features of thesePEGylated compounds were increased stability and solubil-ity and decreased lipophilicity which together may increasespecific tracer uptake in tumors. In vitro studies showed thatthese PEGylated derivative compounds had a high andirreversible potency to inhibit EGFR autophosphorylation[26, 27]. However, the in vivo imaging protocol of 11C-1,18F-2, and 124I-3 showed only a slight increase in uptake insome tumors and no significant difference betweenU138MG and U87MG glioblastoma xenograft mice. Thelack of specific tumor uptake of these tracers could be due tofactors such as the target status in vivo, nonselective binding,and their metabolism in vivo.
The molecular quantification of total EGFR by ELISAdiffered between U138MG and U87MG tumor mass, but nosignificant differences were found when the ratio ofactivated/total EGFR was measured. Thus, tracer bindingto EGFR could be influenced by the activation of thetyrosine kinase domain of the receptor which was similar inU138MG and U87MG.
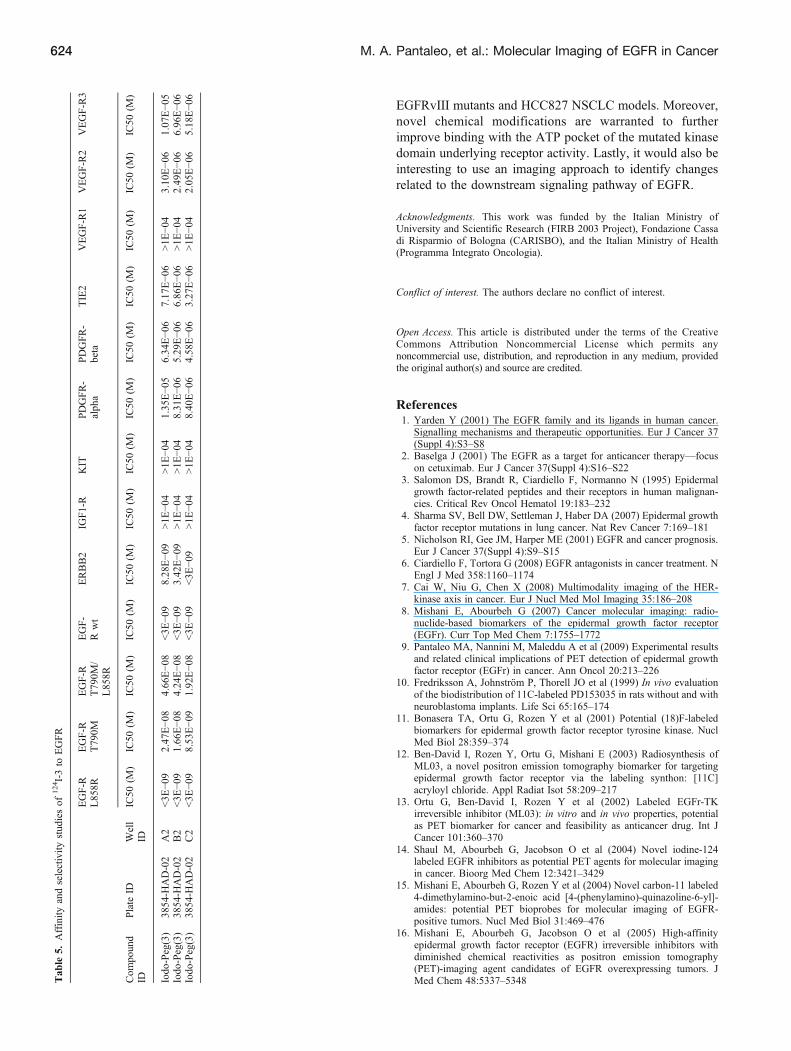
Though nonselective binding of tracers to other proteinscould reduce EGFR-specific uptake, this hypothesis isunlikely. A higher affinity and selectivity of 11C-1 and 18F-2 to EGFR compared to other tyrosine kinases (ERBB2,IGF1R, KIT, PDGFRA, PDFGRB, VEGFR1, VEGFR2,VEGFR3) has been described [26, 27]. The same resultswere obtained for 124I-3 (unpublished data; Table 5).However, these compounds may bind to targets other thantyrosine kinase receptors, thus influencing their uptake.Future genomic and proteomic studies of tumor massesand cell cultures could be designed to define the molecularbackground of these models. As U138MG and U87MG areknown to have different proliferation and growth rates inmice, different molecular pathways may be up- and down-regulated in vivo.
Fig. 5. The segmental 18F-2 static acquisition image (60 min after the tracer injection) does not show any visual significantdifference between U87MG (EGFR+) and U138MG (EGFR−) mass tracer uptake. TBR turned out to be G1 for both masses. Thetwo time-activity curves do not reveal any specific uptake.
Fig. 6. Micro vessel density evaluation in U87MG (EGFR+)and U138MG (EGFR−) masses.
622 M. A. Pantaleo, et al.: Molecular Imaging of EGFR in Cancer
Tracer distribution in tumor masses should not haveinfluenced the results since all animals had a small mass atthe time of scan acquisition and no necrosis, except for fouranimals with large bilateral necrotic tumors. Moreover,MVD data showed that angiogenesis was more apparent inU87GM tumors, suggesting sufficient tracer access to tumormasses.
Although the results of the present study showed nospecific tumor uptake in micro-PET images for 11C-1, 18F-2,and 124I-3, the promising in vitro characteristics of thesecompounds merit further investigation in other animalmodels. Cell lines characterized by both high receptorexpression and activation are deemed ideal for in vivoimaging of EGFR tumors. Pal et al. reported the first in vitroand in vivo studies of a morpholino-124I-IPQA TK irrever-sible inhibitor with a chemical structure allowing covalentbinding only to the ATP site of the phosphorylated EGFR-TK in xenograft mice with brain tumors expressingEGFRvIII mutant receptor [18]. Recently, Memon et al.reported a higher uptake of 11C-Iressa in HCC827 xenograftmice which overexpress a mutant EGFR harboring an in-frame deletion mutation in exon 19 that likely confers aconstitutive activation to the receptor and erlotinib sensitiv-ity compared with nonmutant A549 and NCI358 cell lines[24].
These new approaches are encouraging because theybetter reflect the current clinical scenario. In recent years, theimportance of detecting EGFR “expression” as a predictivebiomarker to discriminate between patients responding andnot responding to anti-EGFR drugs has lost its significancefor various reasons [30, 31]. It is well known that EGFRinhibitors have clinical activity irrespective of total EGFRquantity. For example, there is accumulating evidence of thevalue of EGFR mutations in lung cancer and of k-rasmutations in codons 12 and 13 in colorectal cancer as
predictive markers of sensitivity to anti-EGFR treatment[31–33].
Thus, this approach should also be considered inmolecular imaging research, with more attention paid toimaging receptor “function” which is influenced by muta-tions or an aberrant downstream signaling pathway [34]. Arecent study identified distinct biological features underlyingthe various EGFR mutations in nonsmall-cell lung cancer(NSCLC) that may confer different transforming potential orTK activity and consequently different sensitivity to EGFRinhibitors [35]. Specific chemical structures of the tracersand animal models should be developed to improve theimaging of EGFR status in cancer. Developing PET probesfor imaging membrane receptors may have more rationale incases of receptor amplification, such as HER-2 in breastcancer.
A remaining question is: if molecular predictive markersare available in everyday practice, why still study EGFRimaging? In vivo detection of EGFR may overcome severallimitations of tissue specimen analysis [36]. Firstly, theinformation yielded by analysis of small tissue specimensmay not be representative of the whole tumor or allmetastases. Secondly, biological changes may occur duringthe natural history of metastatic disease especially in longsurvival or heavily pretreated patients. Lastly, invasive,nonrepeatable, and time-consuming procedures are requiredfor both patients and physicians. As a consequence, the invivo and noninvasive detection of EGFR function with arepeatable approach during disease progression may stillrepresent a major potential tool for many oncologists.
ConclusionsPEG-anilinoquinazoline tracers should be investigated inanimal models with an aberrant receptor function such as
Fig. 7. Total EGFR and ratio of activated (pY1068) EGFR protein level quantification by ELISA in U87MG (EGFR+) andU138MG (EGFR−) masses.
M. A. Pantaleo, et al.: Molecular Imaging of EGFR in Cancer 623
EGFRvIII mutants and HCC827 NSCLC models. Moreover,novel chemical modifications are warranted to furtherimprove binding with the ATP pocket of the mutated kinasedomain underlying receptor activity. Lastly, it would also beinteresting to use an imaging approach to identify changesrelated to the downstream signaling pathway of EGFR.
Acknowledgments. This work was funded by the Italian Ministry ofUniversity and Scientific Research (FIRB 2003 Project), Fondazione Cassadi Risparmio of Bologna (CARISBO), and the Italian Ministry of Health(Programma Integrato Oncologia).
Conflict of interest. The authors declare no conflict of interest.
Open Access. This article is distributed under the terms of the CreativeCommons Attribution Noncommercial License which permits anynoncommercial use, distribution, and reproduction in any medium, providedthe original author(s) and source are credited.
References1. Yarden Y (2001) The EGFR family and its ligands in human cancer.
Signalling mechanisms and therapeutic opportunities. Eur J Cancer 37(Suppl 4):S3–S8
2. Baselga J (2001) The EGFR as a target for anticancer therapy—focuson cetuximab. Eur J Cancer 37(Suppl 4):S16–S22
3. Salomon DS, Brandt R, Ciardiello F, Normanno N (1995) Epidermalgrowth factor-related peptides and their receptors in human malignan-cies. Critical Rev Oncol Hematol 19:183–232
4. Sharma SV, Bell DW, Settleman J, Haber DA (2007) Epidermal growthfactor receptor mutations in lung cancer. Nat Rev Cancer 7:169–181
5. Nicholson RI, Gee JM, Harper ME (2001) EGFR and cancer prognosis.Eur J Cancer 37(Suppl 4):S9–S15
6. Ciardiello F, Tortora G (2008) EGFR antagonists in cancer treatment. NEngl J Med 358:1160–1174
7. Cai W, Niu G, Chen X (2008) Multimodality imaging of the HER-kinase axis in cancer. Eur J Nucl Med Mol Imaging 35:186–208
8. Mishani E, Abourbeh G (2007) Cancer molecular imaging: radio-nuclide-based biomarkers of the epidermal growth factor receptor(EGFr). Curr Top Med Chem 7:1755–1772
9. Pantaleo MA, Nannini M, Maleddu A et al (2009) Experimental resultsand related clinical implications of PET detection of epidermal growthfactor receptor (EGFr) in cancer. Ann Oncol 20:213–226
10. Fredriksson A, Johnström P, Thorell JO et al (1999) In vivo evaluationof the biodistribution of 11C-labeled PD153035 in rats without and withneuroblastoma implants. Life Sci 65:165–174
11. Bonasera TA, Ortu G, Rozen Y et al (2001) Potential (18)F-labeledbiomarkers for epidermal growth factor receptor tyrosine kinase. NuclMed Biol 28:359–374
12. Ben-David I, Rozen Y, Ortu G, Mishani E (2003) Radiosynthesis ofML03, a novel positron emission tomography biomarker for targetingepidermal growth factor receptor via the labeling synthon: [11C]acryloyl chloride. Appl Radiat Isot 58:209–217
13. Ortu G, Ben-David I, Rozen Y et al (2002) Labeled EGFr-TKirreversible inhibitor (ML03): in vitro and in vivo properties, potentialas PET biomarker for cancer and feasibility as anticancer drug. Int JCancer 101:360–370
14. Shaul M, Abourbeh G, Jacobson O et al (2004) Novel iodine-124labeled EGFR inhibitors as potential PET agents for molecular imagingin cancer. Bioorg Med Chem 12:3421–3429
15. Mishani E, Abourbeh G, Rozen Y et al (2004) Novel carbon-11 labeled4-dimethylamino-but-2-enoic acid [4-(phenylamino)-quinazoline-6-yl]-amides: potential PET bioprobes for molecular imaging of EGFR-positive tumors. Nucl Med Biol 31:469–476
16. Mishani E, Abourbeh G, Jacobson O et al (2005) High-affinityepidermal growth factor receptor (EGFR) irreversible inhibitors withdiminished chemical reactivities as positron emission tomography(PET)-imaging agent candidates of EGFR overexpressing tumors. JMed Chem 48:5337–5348T
able
5.Affinity
andselectivity
stud
iesof
124I-3to
EGFR
EGF-R
L85
8REGF-R
T79
0MEGF-R
T79
0M/
L85
8R
EGF-
Rwt
ERBB2
IGF1-R
KIT
PDGFR-
alph
aPDGFR-
beta
TIE2
VEGF-R1
VEGF-R2
VEGF-R3
Com
pound
IDPlate
IDWell
IDIC50
(M)
IC50
(M)
IC50
(M)
IC50
(M)
IC50
(M)
IC50
(M)
IC50
(M)
IC50
(M)
IC50
(M)
IC50
(M)
IC50
(M)
IC50
(M)
IC50
(M)
Iodo-Peg(3)
3854-H
AD-02
A2
G3E
−09
2.47
E−0
84.66E−0
8G3E
−09
8.28E−0
991E
−04
91E
−04
1.35
E−0
56.34E−0
67.17
E−0
691E
−04
3.10E−0
61.07E−0
5Iodo-Peg(3)
3854-H
AD-02
B2
G3E
−09
1.66
E−0
84.24E−0
8G3E
−09
3.42E−0
991E
−04
91E
−04
8.31
E−0
65.29E−0
66.86
E−0
691E
−04
2.49E−0
66.96E−0
6Iodo-Peg(3)
3854-H
AD-02
C2
G3E
−09
8.53
E−0
91.92E−0
8G3E
−09
G3E
−09
91E
−04
91E
−04
8.40
E−0
64.58E−0
63.27
E−0
691E
−04
2.05E−0
65.18E−0
6
624 M. A. Pantaleo, et al.: Molecular Imaging of EGFR in Cancer
17. Abourbeh G, Dissoki S, Jacobson O et al (2007) Evaluation ofradiolabeled ML04, a putative irreversible inhibitor of epidermal growthfactor receptor, as a bioprobe for PET imaging of EGFR-overexpressingtumors. Nucl Med Biol 34:55–70
18. Pal A, Glekas A, Doubrovin M et al (2006) Molecular imaging ofEGFR kinase activity in tumors with 124I-labeled small moleculartracer and positron emission tomography. Mol Imaging Biol 8:262–277
19. Wang JQ, Gao M, Miller KD, Sledge GW, Zheng QH (2006) Synthesisof 11C-Iressa as a new potential PET cancer imaging agent forepidermal growth factor receptor tyrosine kinase. Bioorg Med Chem4102–4106
20. Wang M, Gao M, Mock BH et al (2006) Synthesis of carbon-11 labeledfluorinated 2-arylbenzothiazoles as novel potential PET cancer imagingagents. Bioorg Med Chem 14:8599–8607
21. Wang H, Yu J, Yang G et al (2007) Assessment of 11C-labeled-4-N-(3-bromoanilino)-6,7-dimethoxyquinazoline as a positron emission tomog-raphy agent to monitor epidermal growth factor receptor expression.Cancer Sci 98:1413–1416
22. Wang H, Yu JM, Yang GR et al (2007) Further characterization of theepidermal growth factor receptor ligand 11C-PD153035. Chin Med J120:960–964
23. Su H, Seimbille Y, Ferl GZ et al (2008) Evaluation of [(18)F]gefitinibas a molecular imaging probe for the assessment of the epidermalgrowth factor receptor status in malignant tumors. Eur J Nucl Med MolImaging 35:1089–1099
24. Memon AA, Jakobsen S, Dagnaes-Hansen F, Sorensen BS, Keiding S,Nexo E (2009) Positron emission tomography (PET) imaging with 11C-labeled erlotinib: a micro-PET study on mice with lung tumorxenografts. Cancer Res 69:873–878
25. Liu N, Li M, Li X et al (2009) PET-based biodistribution and radiationdosimetry of epidermal growth factor receptor- selective tracer 11C-labeled PD153035 in humans. J Nucl Med 50:303–308
26. Dissoki S, Aviv Y, Laky D, Abourbeh G, Levitzki A, Mishani E (2007)The effect of the [18F]-PEG group on tracer qualification of [4-
(phenylamino)-quinazoline-6-YL]-amide moiety—an EGFR putativeirreversible inhibitor. Appl Radiat Isot 65:1140–1151
27. Dissoki S, Eshet R, Billauer H, Mishani E (2009) Modified PEG-anilinoquinazoline derivatives as potential EGFR PET agents. J LabelComp Radiopharmaceutical 52:41–52
28. Piccaluga PP, Visani G, Pileri SA et al (2002) Clinical efficacy andantiangiogenic activity of thalidomide in myelofibrosis with myeloidmetaplasia. A pilot study. Leukemia 16:1609–1614
29. Weidner N, Semple JP, Welch WR, Folkman J (1991) Tumor angio-genesis and metastasis—correlation in invasive breast carcinoma. NEngl J Med 324:1–8
30. Dei Tos AP (2007) The biology of epidermal growth factor receptor andits value as a prognostic/predictive factor. Int J Biol Biomarkers 22:S3–S9
31. Lynch TJ, Bell DW, Sordella R et al (2004) Activating mutations in theepidermal growth factor receptor underlying responsiveness of non-small-cell lung cancer to gefitinib. N Engl J Med 350:2129–2139
32. Paez JG, Jänne PA, Lee JC et al (2004) EGFR mutations in lung cancer:correlation with clinical response to gefitinib therapy. Science304:1497–1500
33. Allegra CJ, Jessup JM, Somerfield MR et al (2009) American Societyof Clinical Oncology provisional clinical opinion: testing for KRASgene mutations in patients with metastatic colorectal carcinoma topredict response to anti-epidermal growth factor receptor monoclonalantibody therapy. J Clin Oncol 27:2091–2096
34. Pantaleo MA, Nannini M, Fanti S, Boschi S, Lollini P, Biasco G (2009)Molecular imaging of EGFr: it’s time to go beyond the receptorexpression. J Nucl Med 50:1195–1196
35. Kancha RK, von Bubnoff N, Peschel C, Duyster J (2009) Functionalanalysis of epidermal growth factor receptor (EGFR) mutations andpotential implications for EGFR targeted therapy. Clin Cancer Res15:460–467
36. Pantaleo MA, Fanti S, Nannini M et al (2008) What oncologists needand require from nuclear medicine. Eur J Nucl Med Mol Imaging35:1761–1765
M. A. Pantaleo, et al.: Molecular Imaging of EGFR in Cancer 625