Evaluation of metal contamination in coastal sediments of the Bay of Bengal, India: geochemical and...
12
Evaluation of metal contamination in coastal sediments of the Bay of Bengal, India: geochemical and statistical approaches K. Selvaraj a,1 , V. Ram Mohan a , Piotr Szefer b, * a Department of Geology, School of Earth and Atmospheric Sciences, University of Madras, A.C. College Campus, Chennai 600 025, India b Department of Food Sciences, Medical University of Gdansk, al. Gen. J. Hallera 107, PL 80-416 Gdansk, Poland Abstract Surface sediment samples collected from the inner shelf region of the Bay of Bengal, were analysed for the major elements and total and acetic acid available trace elements (Al, Ca, Cd, Co, Cr, Cu, Fe, K, Mg, Mn, Na, Ni, P, Pb, Si, Zn) to evaluate geochemical processes influencing their distribution. Major elemental analysis showed that the sediments had high concentrations of Si and relatively low concentrations of Al and Fe. Both major elemental and trace metal concentrations indicated that the sediments represent weathered products of granite and charnockite. Normalization of metals to Al indicated relatively high enrichment factors for Pb, Cd, Zn and Cr. The higher proportions of nondetrital Pb (66%), Cd (41%) and Co (28%) reveal metal contamination due to anthropogenic inputs. Factor analysis (FA) identified six possible types of sedimentological and geochemical associations. The dominant factor accounting for 26.9% of the total variance identifies an anthropogenic input and accumulation of nondetrital Cd, Co, Cr, Ni and Pb. Association of these metals with CaCO 3 reveals that shell fragments in the surface sediments are likely act as a carrier phase for nondetrital metals. The results are discussed in the context of the sources and pathways of elements in the Bay of Bengal. Ó 2004 Elsevier Ltd. All rights reserved. Keywords: Geochemistry; Enrichment factors; Nondetrital metals; Metal contamination; Surface sediments; Bay of Bengal 1. Introduction Sediments are important carriers of trace metals in the hydrological cycle and because metals are parti- tioned with the surrounding waters, they reflecting the quality of an aquatic system. Coastal and estuarine re- gions are the important sinks for many persistent pol- lutants and they accumulate in organisms and bottom sediments (Szefer et al., 1995). Thus, geochemical characteristics of the sediments can be used to infer the weathering trends and the sources of pollution (e.g., F€ orstner and Salomons, 1980; Fedo et al., 1996; Nesbitt et al., 1996; Nath et al., 2000). Even though, the total chemical composition of surficial sediments is a valuable index of environmental contamination, they are a poor means of assessing the pathways by which the metals have accumulated in the bottom sediments. The detrital (residual) fraction of the total element forms the matrix of particles and the nondetrital (nonresidual) fraction is incorporated into the sediments from solution. There- fore, chemical availability of metals on sediments has been used to deduce the sources and pathways by which major and trace elements have entered the marine environment (Loring and Rantala, 1992). This paper reports the elemental concentrations of surface sediments from the inner shelf, off Kalpakkam, Bay of Bengal. The samples were subjected to total and available (acetic acid-HOAc) geochemical analyses to evaluate the geochemical processes controlling the ele- mental concentrations, including possible anthropogenic influences. The interpretation of the data was achieved by normalization of all trace elements to Al and the * Corresponding author. Tel.: +48-58-3493110; fax: +48-58- 3493110. E-mail addresses: [email protected] (K. Selvaraj), pszef@amg. gda.pl (P. Szefer). 1 Present address: Ocean Science and Technology Cell (Marine Geology and Geophysics), Mangalore University, Mangalagangothri 574 199, Karnataka, India. 0025-326X/$ - see front matter Ó 2004 Elsevier Ltd. All rights reserved. doi:10.1016/j.marpolbul.2004.02.006 www.elsevier.com/locate/marpolbul Marine Pollution Bulletin 49 (2004) 174–185
Transcript of Evaluation of metal contamination in coastal sediments of the Bay of Bengal, India: geochemical and...

www.elsevier.com/locate/marpolbul
Marine Pollution Bulletin 49 (2004) 174–185
Evaluation of metal contamination in coastal sediments of theBay of Bengal, India: geochemical and statistical approaches
K. Selvaraj a,1, V. Ram Mohan a, Piotr Szefer b,*
a Department of Geology, School of Earth and Atmospheric Sciences, University of Madras, A.C. College Campus,
Chennai 600 025, Indiab Department of Food Sciences, Medical University of Gdansk, al. Gen. J. Hallera 107, PL 80-416 Gdansk, Poland
Abstract
Surface sediment samples collected from the inner shelf region of the Bay of Bengal, were analysed for the major elements and
total and acetic acid available trace elements (Al, Ca, Cd, Co, Cr, Cu, Fe, K, Mg, Mn, Na, Ni, P, Pb, Si, Zn) to evaluate geochemical
processes influencing their distribution. Major elemental analysis showed that the sediments had high concentrations of Si and
relatively low concentrations of Al and Fe. Both major elemental and trace metal concentrations indicated that the sediments
represent weathered products of granite and charnockite. Normalization of metals to Al indicated relatively high enrichment factors
for Pb, Cd, Zn and Cr. The higher proportions of nondetrital Pb (66%), Cd (41%) and Co (28%) reveal metal contamination due to
anthropogenic inputs. Factor analysis (FA) identified six possible types of sedimentological and geochemical associations. The
dominant factor accounting for 26.9% of the total variance identifies an anthropogenic input and accumulation of nondetrital Cd,
Co, Cr, Ni and Pb. Association of these metals with CaCO3 reveals that shell fragments in the surface sediments are likely act as a
carrier phase for nondetrital metals. The results are discussed in the context of the sources and pathways of elements in the Bay of
Bengal.
� 2004 Elsevier Ltd. All rights reserved.
Keywords: Geochemistry; Enrichment factors; Nondetrital metals; Metal contamination; Surface sediments; Bay of Bengal
1. Introduction
Sediments are important carriers of trace metals in
the hydrological cycle and because metals are parti-tioned with the surrounding waters, they reflecting the
quality of an aquatic system. Coastal and estuarine re-
gions are the important sinks for many persistent pol-
lutants and they accumulate in organisms and bottom
sediments (Szefer et al., 1995). Thus, geochemical
characteristics of the sediments can be used to infer the
weathering trends and the sources of pollution (e.g.,
F€orstner and Salomons, 1980; Fedo et al., 1996; Nesbitt
* Corresponding author. Tel.: +48-58-3493110; fax: +48-58-
3493110.
E-mail addresses: [email protected] (K. Selvaraj), pszef@amg.
gda.pl (P. Szefer).1 Present address: Ocean Science and Technology Cell (Marine
Geology and Geophysics), Mangalore University, Mangalagangothri
574 199, Karnataka, India.
0025-326X/$ - see front matter � 2004 Elsevier Ltd. All rights reserved.doi:10.1016/j.marpolbul.2004.02.006
et al., 1996; Nath et al., 2000). Even though, the total
chemical composition of surficial sediments is a valuable
index of environmental contamination, they are a poor
means of assessing the pathways by which the metalshave accumulated in the bottom sediments. The detrital
(residual) fraction of the total element forms the matrix
of particles and the nondetrital (nonresidual) fraction is
incorporated into the sediments from solution. There-
fore, chemical availability of metals on sediments has
been used to deduce the sources and pathways by which
major and trace elements have entered the marine
environment (Loring and Rantala, 1992).This paper reports the elemental concentrations of
surface sediments from the inner shelf, off Kalpakkam,
Bay of Bengal. The samples were subjected to total and
available (acetic acid-HOAc) geochemical analyses to
evaluate the geochemical processes controlling the ele-
mental concentrations, including possible anthropogenic
influences. The interpretation of the data was achieved
by normalization of all trace elements to Al and the

K. Selvaraj et al. / Marine Pollution Bulletin 49 (2004) 174–185 175
geochemical associations, including the contents of
sand, mud, CaCO3 and organic matter, were subjected
to R-mode factor analysis.
1.1. Study area
During the last two decades, the coastal environment
of southeast India has experienced intense developments
in industry, urbanization and aquaculture. For example,
a power plant located in the study area, off Kalpakkam
(Fig. 1), utilises a large quantity (35 m3 s�1) of seawateras a coolant and other discharges include wastewater,low-level radioactive effluents, biocides used in the water
treatment and antifouling paints used in the control of
biofouling. The study area has a complex ecosystem,
which is partly influenced by inputs from River Palar
that transports effluents from minor urban settlements
and industries. In addition, the coastal marginal minor
inputs and the Buckingham canal, which runs parallel to
the coast carrying urban sewage, pesticides and fertili-zers derived from agricultural practices and the salt
panning industry.
The continental shelf of the study area is about 40 km
wide and the shelf break occurs at 135 m depth. The tidal
range is 1.2–1.5 m for spring tides and 0.3–0.6 m for neap
tides. Selvaraj and RamMohan (2003) indicated that the
inner shelf is carpeted with a mosaic of sand and silty
sand with minor amounts of clay (max. 4%). Sedimentsare poorly sorted and depositional environments are
influenced by mixed river/dune/beach conditions. A pa-
leo-shoreline was identified based on the higher sand
(>90%) and CaCO3 (>15%), and very low organic matter
contents (<0.4%) at a depth around 50–53 m.
Fig. 1. Study area and s
2. Materials and methods
2.1. Sampling of coastal sediments
Forty-two surface sediment samples were collected
using a Peterson grab along six traverses approximately
perpendicular to the coastline with an interval of 3 km
during April 1996 (Fig. 1). Special care was taken to
avoid leakage of fine-grained materials during retrie-
val. Sample locations were carefully fixed by digital
KODEN GPS Navigator (Model: KGP-913). All the
collected sediment samples were subjected to bulk (totaldigest) and partition (HOAc extraction) geochemical
investigations after pretreatment.
2.2. Geochemical analyses of sediments
Total digest methods. Major oxides (SiO2, Al2O3,
Fe2O3, P2O5, Na2O, K2O, CaO and MgO) were deter-
mined using the analytical methods described by Shap-iro (1975). The total digestion method of Loring and
Rantala (1992) was adopted for the estimation of total
metals. Briefly, an accurately weighed sediment sample
(�1 g) was placed in a Teflon bomb, 1 ml of aqua regia(AR grade HNO3:HCl; 1:3 v/v) was added, followed by
6 ml HF. The sealed bomb was submerged in boiling
water bath (2 h and 30 min). After the bomb was re-
moved from the water bath, the contents were added to5.6 g of boric acid crystals in a 100 ml polypropylene,
standard flask. The flask was made up to volume (100
ml) with high purity distilled water (HPDW). The
solutions were then analysed for selected trace elements
(Cd, Cr, Co, Cu, Mn, Ni, Pb and Zn) by Flame AAS
ampling stations.
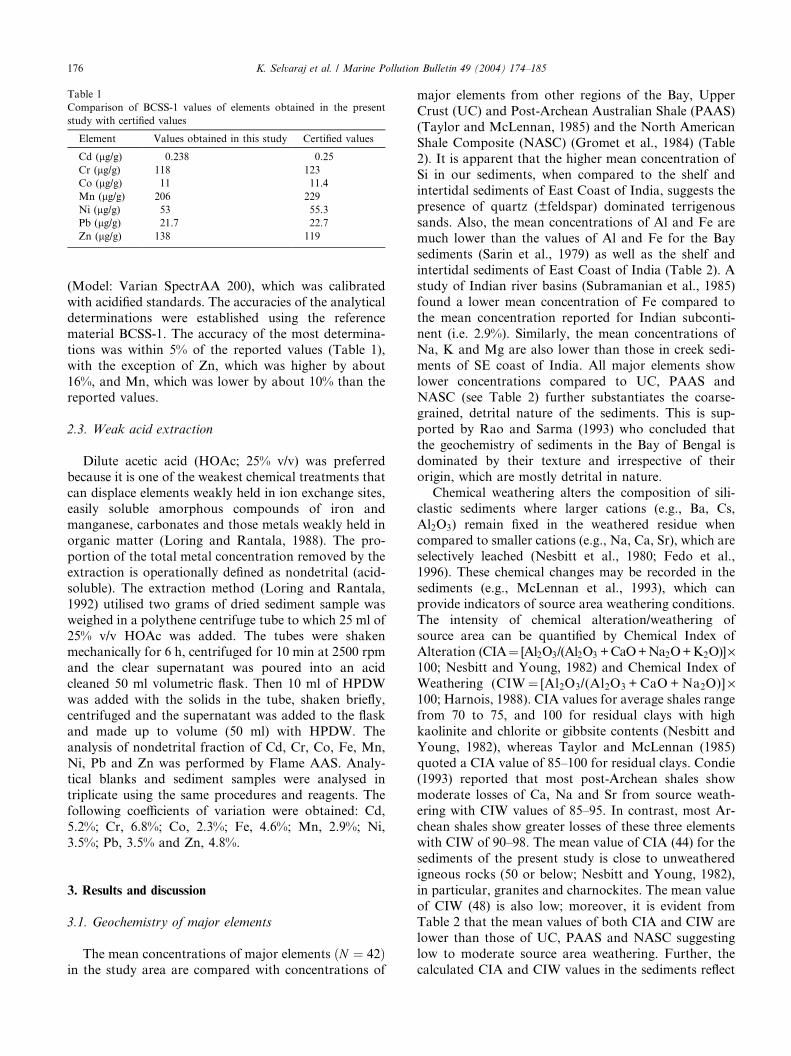
Table 1
Comparison of BCSS-1 values of elements obtained in the present
study with certified values
Element Values obtained in this study Certified values
Cd (lg/g) 0.238 0.25
Cr (lg/g) 118 123
Co (lg/g) 11 11.4
Mn (lg/g) 206 229
Ni (lg/g) 53 55.3
Pb (lg/g) 21.7 22.7
Zn (lg/g) 138 119
176 K. Selvaraj et al. / Marine Pollution Bulletin 49 (2004) 174–185
(Model: Varian SpectrAA 200), which was calibrated
with acidified standards. The accuracies of the analytical
determinations were established using the reference
material BCSS-1. The accuracy of the most determina-
tions was within 5% of the reported values (Table 1),
with the exception of Zn, which was higher by about
16%, and Mn, which was lower by about 10% than thereported values.
2.3. Weak acid extraction
Dilute acetic acid (HOAc; 25% v/v) was preferred
because it is one of the weakest chemical treatments that
can displace elements weakly held in ion exchange sites,
easily soluble amorphous compounds of iron andmanganese, carbonates and those metals weakly held in
organic matter (Loring and Rantala, 1988). The pro-
portion of the total metal concentration removed by the
extraction is operationally defined as nondetrital (acid-
soluble). The extraction method (Loring and Rantala,
1992) utilised two grams of dried sediment sample was
weighed in a polythene centrifuge tube to which 25 ml of
25% v/v HOAc was added. The tubes were shakenmechanically for 6 h, centrifuged for 10 min at 2500 rpm
and the clear supernatant was poured into an acid
cleaned 50 ml volumetric flask. Then 10 ml of HPDW
was added with the solids in the tube, shaken briefly,
centrifuged and the supernatant was added to the flask
and made up to volume (50 ml) with HPDW. The
analysis of nondetrital fraction of Cd, Cr, Co, Fe, Mn,
Ni, Pb and Zn was performed by Flame AAS. Analy-tical blanks and sediment samples were analysed in
triplicate using the same procedures and reagents. The
following coefficients of variation were obtained: Cd,
5.2%; Cr, 6.8%; Co, 2.3%; Fe, 4.6%; Mn, 2.9%; Ni,
3.5%; Pb, 3.5% and Zn, 4.8%.
3. Results and discussion
3.1. Geochemistry of major elements
The mean concentrations of major elements ðN ¼ 42Þin the study area are compared with concentrations of
major elements from other regions of the Bay, Upper
Crust (UC) and Post-Archean Australian Shale (PAAS)
(Taylor and McLennan, 1985) and the North American
Shale Composite (NASC) (Gromet et al., 1984) (Table2). It is apparent that the higher mean concentration of
Si in our sediments, when compared to the shelf and
intertidal sediments of East Coast of India, suggests the
presence of quartz (±feldspar) dominated terrigenous
sands. Also, the mean concentrations of Al and Fe are
much lower than the values of Al and Fe for the Bay
sediments (Sarin et al., 1979) as well as the shelf and
intertidal sediments of East Coast of India (Table 2). Astudy of Indian river basins (Subramanian et al., 1985)
found a lower mean concentration of Fe compared to
the mean concentration reported for Indian subconti-
nent (i.e. 2.9%). Similarly, the mean concentrations of
Na, K and Mg are also lower than those in creek sedi-
ments of SE coast of India. All major elements show
lower concentrations compared to UC, PAAS and
NASC (see Table 2) further substantiates the coarse-grained, detrital nature of the sediments. This is sup-
ported by Rao and Sarma (1993) who concluded that
the geochemistry of sediments in the Bay of Bengal is
dominated by their texture and irrespective of their
origin, which are mostly detrital in nature.
Chemical weathering alters the composition of sili-
clastic sediments where larger cations (e.g., Ba, Cs,
Al2O3) remain fixed in the weathered residue whencompared to smaller cations (e.g., Na, Ca, Sr), which are
selectively leached (Nesbitt et al., 1980; Fedo et al.,
1996). These chemical changes may be recorded in the
sediments (e.g., McLennan et al., 1993), which can
provide indicators of source area weathering conditions.
The intensity of chemical alteration/weathering of
source area can be quantified by Chemical Index of
Alteration (CIA¼ [Al2O3/(Al2O3 +CaO+Na2O+K2O)]·100; Nesbitt and Young, 1982) and Chemical Index of
Weathering (CIW¼ [Al2O3/(Al2O3 + CaO +Na2O)] ·100; Harnois, 1988). CIA values for average shales range
from 70 to 75, and 100 for residual clays with high
kaolinite and chlorite or gibbsite contents (Nesbitt and
Young, 1982), whereas Taylor and McLennan (1985)
quoted a CIA value of 85–100 for residual clays. Condie
(1993) reported that most post-Archean shales showmoderate losses of Ca, Na and Sr from source weath-
ering with CIW values of 85–95. In contrast, most Ar-
chean shales show greater losses of these three elements
with CIW of 90–98. The mean value of CIA (44) for the
sediments of the present study is close to unweathered
igneous rocks (50 or below; Nesbitt and Young, 1982),
in particular, granites and charnockites. The mean value
of CIW (48) is also low; moreover, it is evident fromTable 2 that the mean values of both CIA and CIW are
lower than those of UC, PAAS and NASC suggesting
low to moderate source area weathering. Further, the
calculated CIA and CIW values in the sediments reflect
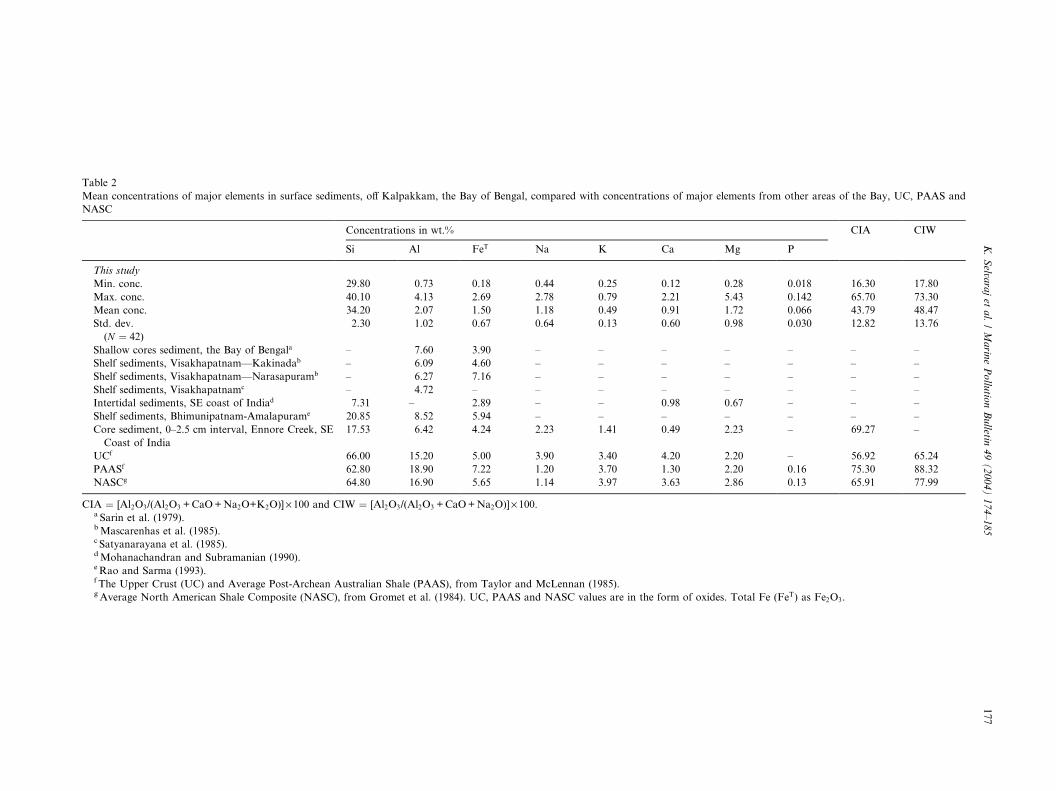
Table 2
Mean concentrations of major elements in surface sediments, off Kalpakkam, the Bay of Bengal, compared with concentrations of major elements from other areas of the Bay, UC, PAAS and
NASC
Concentrations in wt.% CIA CIW
Si Al FeT Na K Ca Mg P
This study
Min. conc. 29.80 0.73 0.18 0.44 0.25 0.12 0.28 0.018 16.30 17.80
Max. conc. 40.10 4.13 2.69 2.78 0.79 2.21 5.43 0.142 65.70 73.30
Mean conc. 34.20 2.07 1.50 1.18 0.49 0.91 1.72 0.066 43.79 48.47
Std. dev. 2.30 1.02 0.67 0.64 0.13 0.60 0.98 0.030 12.82 13.76
(N ¼ 42)Shallow cores sediment, the Bay of Bengala – 7.60 3.90 – – – – – – –
Shelf sediments, Visakhapatnam––Kakinadab – 6.09 4.60 – – – – – – –
Shelf sediments, Visakhapatnam––Narasapuramb – 6.27 7.16 – – – – – – –
Shelf sediments, Visakhapatnamc – 4.72 – – – – – – – –
Intertidal sediments, SE coast of Indiad 7.31 – 2.89 – – 0.98 0.67 – – –
Shelf sediments, Bhimunipatnam-Amalapurame 20.85 8.52 5.94 – – – – – – –
Core sediment, 0–2.5 cm interval, Ennore Creek, SE
Coast of India
17.53 6.42 4.24 2.23 1.41 0.49 2.23 – 69.27 –
UCf 66.00 15.20 5.00 3.90 3.40 4.20 2.20 – 56.92 65.24
PAASf 62.80 18.90 7.22 1.20 3.70 1.30 2.20 0.16 75.30 88.32
NASCg 64.80 16.90 5.65 1.14 3.97 3.63 2.86 0.13 65.91 77.99
CIA ¼ [Al2O3/(Al2O3 +CaO+Na2O+K2O)] · 100 and CIW ¼ [Al2O3/(Al2O3 +CaO+Na2O)]· 100.a Sarin et al. (1979).bMascarenhas et al. (1985).c Satyanarayana et al. (1985).dMohanachandran and Subramanian (1990).eRao and Sarma (1993).f The Upper Crust (UC) and Average Post-Archean Australian Shale (PAAS), from Taylor and McLennan (1985).gAverage North American Shale Composite (NASC), from Gromet et al. (1984). UC, PAAS and NASC values are in the form of oxides. Total Fe (FeT) as Fe2O3.
K.Selva
rajet
al./Marin
ePollu
tionBulletin
49(2004)174–185
177
178 K. Selvaraj et al. / Marine Pollution Bulletin 49 (2004) 174–185
the absence of clay minerals, which is highly correlated
with extremely low clay contents (max. 4%; Selvaraj and
Ram Mohan, 2003).
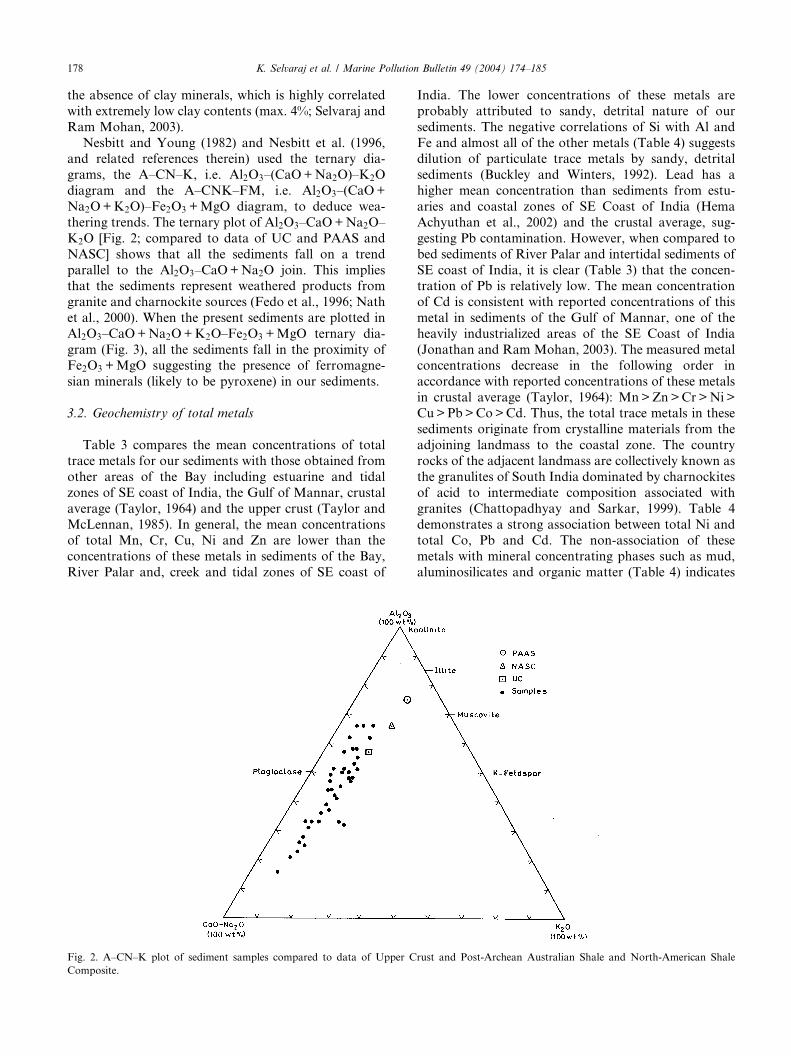
Nesbitt and Young (1982) and Nesbitt et al. (1996,and related references therein) used the ternary dia-
grams, the A–CN–K, i.e. Al2O3–(CaO+Na2O)–K2O
diagram and the A–CNK–FM, i.e. Al2O3–(CaO+
Na2O+K2O)–Fe2O3 +MgO diagram, to deduce wea-
thering trends. The ternary plot of Al2O3–CaO+Na2O–
K2O [Fig. 2; compared to data of UC and PAAS and
NASC] shows that all the sediments fall on a trend
parallel to the Al2O3–CaO+Na2O join. This impliesthat the sediments represent weathered products from
granite and charnockite sources (Fedo et al., 1996; Nath
et al., 2000). When the present sediments are plotted in
Al2O3–CaO+Na2O+K2O–Fe2O3 +MgO ternary dia-
gram (Fig. 3), all the sediments fall in the proximity of
Fe2O3 +MgO suggesting the presence of ferromagne-
sian minerals (likely to be pyroxene) in our sediments.
3.2. Geochemistry of total metals
Table 3 compares the mean concentrations of total
trace metals for our sediments with those obtained from
other areas of the Bay including estuarine and tidal
zones of SE coast of India, the Gulf of Mannar, crustal
average (Taylor, 1964) and the upper crust (Taylor and
McLennan, 1985). In general, the mean concentrationsof total Mn, Cr, Cu, Ni and Zn are lower than the
concentrations of these metals in sediments of the Bay,
River Palar and, creek and tidal zones of SE coast of
Fig. 2. A–CN–K plot of sediment samples compared to data of Upper C
Composite.
India. The lower concentrations of these metals are
probably attributed to sandy, detrital nature of our
sediments. The negative correlations of Si with Al and
Fe and almost all of the other metals (Table 4) suggestsdilution of particulate trace metals by sandy, detrital
sediments (Buckley and Winters, 1992). Lead has a
higher mean concentration than sediments from estu-
aries and coastal zones of SE Coast of India (Hema
Achyuthan et al., 2002) and the crustal average, sug-
gesting Pb contamination. However, when compared to
bed sediments of River Palar and intertidal sediments of
SE coast of India, it is clear (Table 3) that the concen-tration of Pb is relatively low. The mean concentration
of Cd is consistent with reported concentrations of this
metal in sediments of the Gulf of Mannar, one of the
heavily industrialized areas of the SE Coast of India
(Jonathan and Ram Mohan, 2003). The measured metal
concentrations decrease in the following order in
accordance with reported concentrations of these metals
in crustal average (Taylor, 1964): Mn>Zn>Cr>Ni>Cu>Pb>Co>Cd. Thus, the total trace metals in these
sediments originate from crystalline materials from the
adjoining landmass to the coastal zone. The country
rocks of the adjacent landmass are collectively known as
the granulites of South India dominated by charnockites
of acid to intermediate composition associated with
granites (Chattopadhyay and Sarkar, 1999). Table 4
demonstrates a strong association between total Ni andtotal Co, Pb and Cd. The non-association of these
metals with mineral concentrating phases such as mud,
aluminosilicates and organic matter (Table 4) indicates
rust and Post-Archean Australian Shale and North-American Shale

Fig. 3. Ternary A–CNK–FM plot of sediment samples in comparison with Upper Crust and Post-Archean Australian Shale and North-American
Shale Composite.
Table 3
Mean concentrations of total trace metals in surface sediments, off Kalpakkam, the Bay of Bengal, compared with concentrations of total metals
from other areas of SE Coast of India, the Gulf of Mannar, crustal average and the upper crust
Concentrations in lg/g
Mn Cr Cu Ni Co Pb Zn Cd
This study
Min. conc. 179 24 7 22 6 9 44 0.12
Max. conc. 638 111 44 44 14 28 163 0.31
Mean conc. 356 57 20 30 9 16 71 0.21
Std. dev. 117.8 21.91 7.36 5.80 1.92 4.75 21.39 0.04
(N ¼ 42)Shallow cores sediment, the Bay of Bengala 529 84 26 64 – – – –
Bed sediments, River Palarb 1131 338 64 – – 45 – –
Intertidal sediments, SE Coast of Indiac 51–2005 11–394 0–105 – – 5–130 13–144 –
Core sediments, 0–10.5 cm interval, 345 318 – 426 10 2 168 –
Adyar Estuary, SE Coast of Indiad
Core sediments, Tidal zones, SE Coast of Indiad
1. 0–5 interval, Muttukadu 409 48 – 49 8 1 68 –
2. 0–1 cm interval, Mamallapuram 777 87 – 53 9 13 106 –
3. 0–1 cm interval, Marakkanam 442 58 – 12 7 11 87 –
Surface sediments, the Gulf of Mannare 296 167 – 24 7 16 73 0.20
Core sediments, 0–2.5 cm interval, 391 643 – 49 11 17 105 0.108
Ennore Creek, SE Coast of India
Crustal averagef 950 100 55 75 25 12.5 70 0.20
Upper crustg 600 35 25 20 10 20 71 –
a Sarin et al. (1979).bMohanachandran, 1988.c Subramanian and Mohanachandran (1990).dHema Achyuthan et al. (2002).e Jonathan and Ram Mohan (2003).f Taylor (1964).g Taylor and McLennan (1985).
K. Selvaraj et al. / Marine Pollution Bulletin 49 (2004) 174–185 179
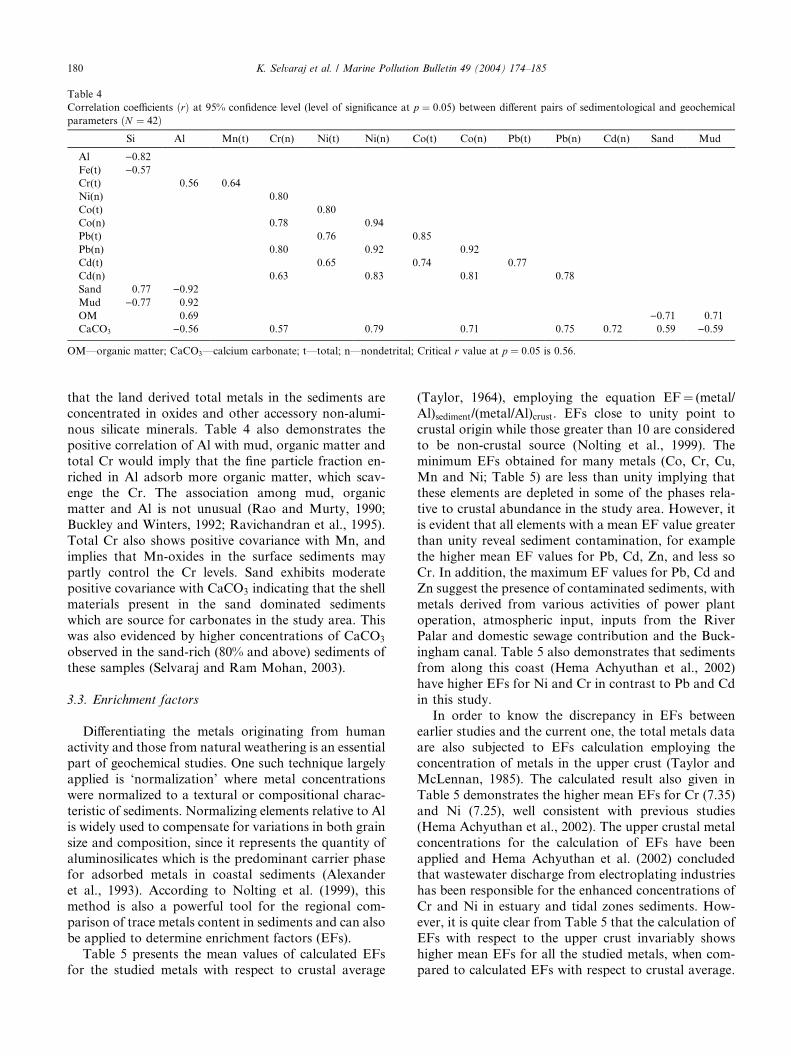
Table 4
Correlation coefficients ðrÞ at 95% confidence level (level of significance at p ¼ 0:05) between different pairs of sedimentological and geochemicalparameters ðN ¼ 42Þ
Si Al Mn(t) Cr(n) Ni(t) Ni(n) Co(t) Co(n) Pb(t) Pb(n) Cd(n) Sand Mud
Al )0.82Fe(t) )0.57Cr(t) 0.56 0.64
Ni(n) 0.80
Co(t) 0.80
Co(n) 0.78 0.94
Pb(t) 0.76 0.85
Pb(n) 0.80 0.92 0.92
Cd(t) 0.65 0.74 0.77
Cd(n) 0.63 0.83 0.81 0.78
Sand 0.77 )0.92Mud )0.77 0.92
OM 0.69 )0.71 0.71
CaCO3 )0.56 0.57 0.79 0.71 0.75 0.72 0.59 )0.59
OM––organic matter; CaCO3––calcium carbonate; t––total; n––nondetrital; Critical r value at p ¼ 0:05 is 0.56.
180 K. Selvaraj et al. / Marine Pollution Bulletin 49 (2004) 174–185
that the land derived total metals in the sediments are
concentrated in oxides and other accessory non-alumi-
nous silicate minerals. Table 4 also demonstrates the
positive correlation of Al with mud, organic matter and
total Cr would imply that the fine particle fraction en-
riched in Al adsorb more organic matter, which scav-enge the Cr. The association among mud, organic
matter and Al is not unusual (Rao and Murty, 1990;
Buckley and Winters, 1992; Ravichandran et al., 1995).
Total Cr also shows positive covariance with Mn, and
implies that Mn-oxides in the surface sediments may
partly control the Cr levels. Sand exhibits moderate
positive covariance with CaCO3 indicating that the shell
materials present in the sand dominated sedimentswhich are source for carbonates in the study area. This
was also evidenced by higher concentrations of CaCO3observed in the sand-rich (80% and above) sediments of
these samples (Selvaraj and Ram Mohan, 2003).
3.3. Enrichment factors
Differentiating the metals originating from humanactivity and those from natural weathering is an essential
part of geochemical studies. One such technique largely
applied is ‘normalization’ where metal concentrations
were normalized to a textural or compositional charac-
teristic of sediments. Normalizing elements relative to Al
is widely used to compensate for variations in both grain
size and composition, since it represents the quantity of
aluminosilicates which is the predominant carrier phasefor adsorbed metals in coastal sediments (Alexander
et al., 1993). According to Nolting et al. (1999), this
method is also a powerful tool for the regional com-
parison of trace metals content in sediments and can also
be applied to determine enrichment factors (EFs).
Table 5 presents the mean values of calculated EFs
for the studied metals with respect to crustal average
(Taylor, 1964), employing the equation EF¼ (metal/Al)sediment/(metal/Al)crust. EFs close to unity point to
crustal origin while those greater than 10 are considered
to be non-crustal source (Nolting et al., 1999). The
minimum EFs obtained for many metals (Co, Cr, Cu,
Mn and Ni; Table 5) are less than unity implying thatthese elements are depleted in some of the phases rela-
tive to crustal abundance in the study area. However, it
is evident that all elements with a mean EF value greater
than unity reveal sediment contamination, for example
the higher mean EF values for Pb, Cd, Zn, and less so
Cr. In addition, the maximum EF values for Pb, Cd and
Zn suggest the presence of contaminated sediments, with
metals derived from various activities of power plantoperation, atmospheric input, inputs from the River
Palar and domestic sewage contribution and the Buck-
ingham canal. Table 5 also demonstrates that sediments
from along this coast (Hema Achyuthan et al., 2002)
have higher EFs for Ni and Cr in contrast to Pb and Cd
in this study.
In order to know the discrepancy in EFs between
earlier studies and the current one, the total metals dataare also subjected to EFs calculation employing the
concentration of metals in the upper crust (Taylor and
McLennan, 1985). The calculated result also given in
Table 5 demonstrates the higher mean EFs for Cr (7.35)
and Ni (7.25), well consistent with previous studies
(Hema Achyuthan et al., 2002). The upper crustal metal
concentrations for the calculation of EFs have been
applied and Hema Achyuthan et al. (2002) concludedthat wastewater discharge from electroplating industries
has been responsible for the enhanced concentrations of
Cr and Ni in estuary and tidal zones sediments. How-
ever, it is quite clear from Table 5 that the calculation of
EFs with respect to the upper crust invariably shows
higher mean EFs for all the studied metals, when com-
pared to calculated EFs with respect to crustal average.

Table 5
Summary statistics of enrichment factors (EFs) with respect to crustal average and the upper crust in surface sediments, off Kalpakkam, the Bay of
Bengal, compared with EFs from other areas of SE Coast of India
Mn Cr Cu Ni Co Pb Zn Cd
This study––EFs with respect to crustal averagea
Min. value 0.68 0.80 0.27 0.72 0.69 1.93 1.69 1.86
Max. value 3.47 8.65 4.57 5.91 5.06 23.64 12.36 13.72
Mean value 1.75 2.63 1.91 1.98 1.84 6.70 4.94 5.34
Std. dev. 0.74 1.37 1.16 1.12 1.08 4.46 2.52 3.25
EFs with respect to the upper crustb
Min. value 1.06 2.22 0.59 2.62 1.68 1.17 1.63 –
Max. value 5.36 24.17 9.82 21.62 12.41 14.42 11.91 –
Mean value 2.71 7.35 4.10 7.25 4.51 4.09 4.76 –
Std. dev. 1.14 3.83 2.49 4.12 2.64 2.72 2.43 –
Core Sediments, 0–10.5 cm interval, 0.57 8.99 – 21.12 0.99 0.10 2.35 –
Adyar Estuary, SE Coast of Indiac
Core Sediments, Tidal zones, SE Coast of Indiac
1. 0–5 cm interval, Muttukadu 0.78 1.57 – 2.81 0.92 0.06 1.10 –
2. 0–1 cm interval, Mamallapuram 1.39 2.67 – 2.84 0.97 0.69 1.60 –
3. 0–1 cm interval, Marakkanam 0.75 1.69 – 0.61 0.61 0.56 1.25 –
Core sediments, Ennore Creek, SE Coast of India
0–2.5 cm interval
0.53 8.24 – 0.84 0.55 1.75 1.92 0.70
a Taylor (1964).b Taylor and McLennan (1985).cHema Achyuthan et al. (2002).
K. Selvaraj et al. / Marine Pollution Bulletin 49 (2004) 174–185 181
Moreover, the maximum EFs for Cr and Ni are elevated
and this anomalous condition, in general, does not exist
in normal coastal environment and would imply the
very low concentrations of metals such as Cr, Co, Cu,
Mn and Ni recommended for the upper crust. Espe-
cially, the concentrations of Cr and Ni in the upper crust
are too small, i.e. 65% and 73%, respectively than those
in crustal average (Table 3). Therefore it appears that tocalculate EFs for metals in sediments of SE coast of
India, crustal average (Taylor, 1964) is better material
for the purpose of normalization than the upper crust. It
is supported by the partition geochemical data of the
sediments studied here being in accordance with the
Table 6
Mean concentrations (lg/g) of nondetrital trace metals and their percent contother similar studies of SE Coast of India
Fe Mn
This study
Min. conc. 318 44.2
Max. conc. 1115 192
Mean conc. 702 86
Std. dev., N ¼ 42 188 34.92
Mean % contribution 6 25
Core sediments, 0–2.5 cm interval,
Ennore Creek, SE Coast of Indiaa1673 108
% contribution 4 28
Surface sediments, the Gulf of Mannarb 255 82
% contribution 2 28
a Selvaraj et al. (2003).b Jonathan and Ram Mohan (2003).
result of EFs related to crustal average. Moreover, the
higher EF values for Pb and Cd in the studied sediments
are consistent with the geoaccumulation index of inter-
tidal sediments of SE coast of India, indicating higher
index for Cd and Pb (Subramanian and Mohanachan-
dran, 1990).
3.4. Geochemistry of available metals
The mean concentrations of metals extracted by
HOAc and the mean proportion of the total metals
content are shown in Table 6 and are compared with
earlier studies of coastal and creek areas of SE coast of
ribution to the total metal content in surface sediments, compared with
Cr Ni Co Pb Zn Cd
1.4 1.2 1.9 4.3 4.5 0.05
4.0 4.1 5.3 14.5 9.5 0.16
2.60 2.49 3.46 9.96 5.92 0.08
0.61 0.68 0.74 2.03 0.95 0.02
5 9 28 66 9 41
54 3.1 3.0 6.3 16.6 0.108
8 6 28 37 16 36
4.25 5.91 5.04 3.06 3.60 0.15
3 25 72 19 5 75

182 K. Selvaraj et al. / Marine Pollution Bulletin 49 (2004) 174–185
India. It is apparent from Table 6 that the higher mean
concentrations of available Fe and Mn reflect the pres-
ence of Fe hydroxides and Mn oxides (Rao and Murty,
1990). Earlier studies (Lyle et al., 1984; Selvaraj et al.,2003) have demonstrated that the acetic acid leach not
only dissolves carbonates but also desorbs metals from
the surface of clays, organic matter and Fe–Mn oxy-
hydroxides.
Nondetrital metal concentrations (Table 6) show
lower mean proportions for Cr, Fe, Ni and Zn indicating
similarity in their inputs. The nondetrital fraction of Fe
shows positive correlation with nondetrital Cr (Table 4)suggesting the input of these metals from iron and steel
industries located in the coastal zone. According to Rao
et al. (1993), iron bacteria cause Fe precipitation in the
cooling waters of power plants and to control the
corrosion of iron and steel materials, chrome salts are
frequently added to cooling water systems. Also,
cupronickel has been widely used as an alloy in heat
exchangers of power plant (Ford andMitchell, 1990) andto avoid the general problem of biofouling (Rajagopal
et al., 1991; Rao et al., 1993), antifouling paints, which
contain considerable amounts of Zn oxides (Danielsson,
1980), are commonly used by many coastal industries.
Relatively high proportions of Pb, Cd and Co imply
(Table 6) that the sediments are contaminated by these
metals, as supported by the calculated EFs, especially Pb
and Cd. Similar proportions were obtained for Pb, Cdand Co in the sediments of Ennore Creek, SE coast of
India (Selvaraj et al., 2003). The higher proportions of
nondetrital Cd and Co in surface sediments of the Gulf
of Mannar (Table 6) support the above inference (Jon-
athan and Ram Mohan, 2003). These facts suggest that
these metals are sourced from anthropogenic inputs, in
particular, discharge of fly ash in the coastal zone as well
as atmospheric deposition of Pb and domestic effluentdischarge and the Buckingham canal (Cd and Co). A
previous study (Selvaraj et al., 2003) related to nonde-
trital metals indicated that fly ash (containing around 70
lg/g of Pb) produced by combustion of coal from powerplant is a prime source of Pb to the estuarine sediment of
SE coast of India. Likewise, Abu-Hilal and Badran
(1990) attributed unusually high levels of Cd in sedi-
ments of the Gulf of Aqaba to combined inputs fromsewage effluent and phosphate dust particles.
A striking feature is the presence of higher nonde-
trital concentrations of Cd, Co, Cr, Ni and Pb associ-
ated with sediments of higher carbonate values (>15%).
This inference was substantiated by the correlation
coefficients data (Table 4), which exhibit significant
positive relationships between CaCO3 and nondetrital
Cd, Co, Cr, Ni and Pb (0.70, except Cr). This authen-ticates the role of carbonates in the incorporation of
nondetrital trace metals present in the HOAc soluble
fraction of the sediments.
3.5. Factor analysis (FA)
Geochemical factor analyses aid the identification of
parameters controlling trace metal distributions (Lor-ing, 1991; Winters and Buckley, 1992). A varimax
rotated factor matrix showed that six common fac-
tors described 75.2% of the total data variability in 42
surface sediments (Table 7). Factor 1, accounted for
26.9% of the total variance, portrays the anthropogenic
input and accumulation of nondetrital Cd, Co, Cr, Ni
and Pb. A large portion of these metals has a strong
association with CaCO3 indicating incorporation ofHOAc extractable fractions of metals into carbonate
debris present in the sediments. Calcium carbonate-
metal associations have been previously reported in
sediments from northern Euboekos Bay, Greece, by
Voutsinou-Taliadouri and Varnavas (1993) and from
Miramichi Estuary, New Brunswick (Willey and Fitz-
gerald, 1980), suggesting that variable amounts of shell/
skeletal fragments act as scavengers for Cd, Co, Cr, Niand Pb.
Factor 2 accounting for 18.5% of the total vari-
ance, contains a high loading of Al, mud and organic
matter. The concentration of Si has a strong nega-
tive relationship with mud, which correlates with high
sand/quartz content. The geochemical and sedimen-
tological characteristics of this group are related to
composition of mud sized (fine-grained) and phyl-losilicate rich sediments. Generally, the fine texture
of the samples is associated with a relatively high
loading of adsorbed organic matter on the detrital
components of these sediments (Buckley and Winters,
1992).
Factor 3 accounted for 10.5% of total variance is
characterised by high loading of total trace metals Cd,
Co, Ni and Pb. This factor, without significant positiveemphasis on metal variables such as mud, organic
matter, Al, Fe or Mn, strongly suggests the common
source is natural materials from the adjoining landmass.
Sediments characterised by Factor 4, which accounts for
7.1% of the total variance, have high loading of total Cr,
Mn and Zn with nondetrital Fe. This association indi-
cates that metals such as Zn and Cr are associated with
Fe–Mn oxides, which also act as concentrators fornondetrital Fe.
Factor 5 explains 6.7% of the total variance and is
characterised by high loading of total Fe and moderate
loading of Na indicating that the association is likely
due to garnet minerals in the sediments. Factor 6 ac-
counted for only 5.5% of the total data variability, with
positive loading on total and nondetrital Mn, suggests
rare presence of Mn-oxides. This factor also showsstrong negative loading on Cu (less so, Ni and Zn)
indicating that Mn-oxides in the study area are not a
metal associate phase.
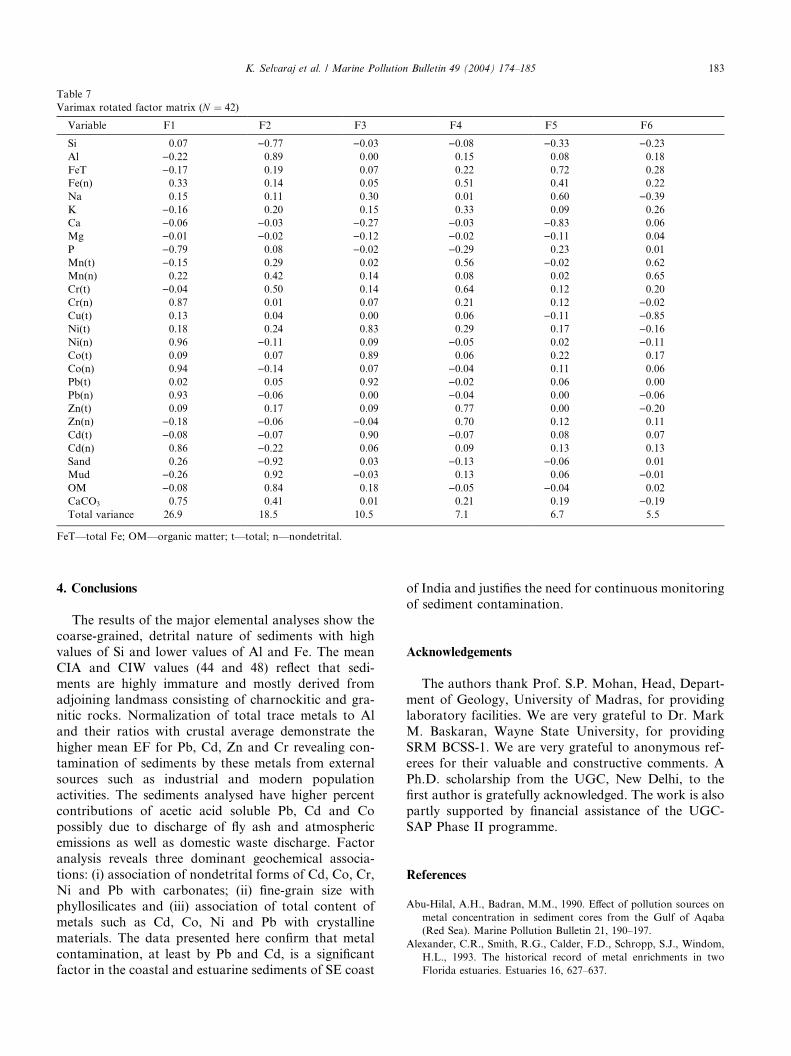
Table 7
Varimax rotated factor matrix (N ¼ 42)Variable F1 F2 F3 F4 F5 F6
Si 0.07 )0.77 )0.03 )0.08 )0.33 )0.23Al )0.22 0.89 0.00 0.15 0.08 0.18
FeT )0.17 0.19 0.07 0.22 0.72 0.28
Fe(n) 0.33 0.14 0.05 0.51 0.41 0.22
Na 0.15 0.11 0.30 0.01 0.60 )0.39K )0.16 0.20 0.15 0.33 0.09 0.26
Ca )0.06 )0.03 )0.27 )0.03 )0.83 0.06
Mg )0.01 )0.02 )0.12 )0.02 )0.11 0.04
P )0.79 0.08 )0.02 )0.29 0.23 0.01
Mn(t) )0.15 0.29 0.02 0.56 )0.02 0.62
Mn(n) 0.22 0.42 0.14 0.08 0.02 0.65
Cr(t) )0.04 0.50 0.14 0.64 0.12 0.20
Cr(n) 0.87 0.01 0.07 0.21 0.12 )0.02Cu(t) 0.13 0.04 0.00 0.06 )0.11 )0.85Ni(t) 0.18 0.24 0.83 0.29 0.17 )0.16Ni(n) 0.96 )0.11 0.09 )0.05 0.02 )0.11Co(t) 0.09 0.07 0.89 0.06 0.22 0.17
Co(n) 0.94 )0.14 0.07 )0.04 0.11 0.06
Pb(t) 0.02 0.05 0.92 )0.02 0.06 0.00
Pb(n) 0.93 )0.06 0.00 )0.04 0.00 )0.06Zn(t) 0.09 0.17 0.09 0.77 0.00 )0.20Zn(n) )0.18 )0.06 )0.04 0.70 0.12 0.11
Cd(t) )0.08 )0.07 0.90 )0.07 0.08 0.07
Cd(n) 0.86 )0.22 0.06 0.09 0.13 0.13
Sand 0.26 )0.92 0.03 )0.13 )0.06 0.01
Mud )0.26 0.92 )0.03 0.13 0.06 )0.01OM )0.08 0.84 0.18 )0.05 )0.04 0.02
CaCO3 0.75 0.41 0.01 0.21 0.19 )0.19Total variance 26.9 18.5 10.5 7.1 6.7 5.5
FeT––total Fe; OM––organic matter; t––total; n––nondetrital.
K. Selvaraj et al. / Marine Pollution Bulletin 49 (2004) 174–185 183
4. Conclusions
The results of the major elemental analyses show the
coarse-grained, detrital nature of sediments with high
values of Si and lower values of Al and Fe. The mean
CIA and CIW values (44 and 48) reflect that sedi-
ments are highly immature and mostly derived from
adjoining landmass consisting of charnockitic and gra-nitic rocks. Normalization of total trace metals to Al
and their ratios with crustal average demonstrate the
higher mean EF for Pb, Cd, Zn and Cr revealing con-
tamination of sediments by these metals from external
sources such as industrial and modern population
activities. The sediments analysed have higher percent
contributions of acetic acid soluble Pb, Cd and Co
possibly due to discharge of fly ash and atmosphericemissions as well as domestic waste discharge. Factor
analysis reveals three dominant geochemical associa-
tions: (i) association of nondetrital forms of Cd, Co, Cr,
Ni and Pb with carbonates; (ii) fine-grain size with
phyllosilicates and (iii) association of total content of
metals such as Cd, Co, Ni and Pb with crystalline
materials. The data presented here confirm that metal
contamination, at least by Pb and Cd, is a significantfactor in the coastal and estuarine sediments of SE coast
of India and justifies the need for continuous monitoring
of sediment contamination.
Acknowledgements
The authors thank Prof. S.P. Mohan, Head, Depart-
ment of Geology, University of Madras, for providinglaboratory facilities. We are very grateful to Dr. Mark
M. Baskaran, Wayne State University, for providing
SRM BCSS-1. We are very grateful to anonymous ref-
erees for their valuable and constructive comments. A
Ph.D. scholarship from the UGC, New Delhi, to the
first author is gratefully acknowledged. The work is also
partly supported by financial assistance of the UGC-
SAP Phase II programme.
References
Abu-Hilal, A.H., Badran, M.M., 1990. Effect of pollution sources on
metal concentration in sediment cores from the Gulf of Aqaba
(Red Sea). Marine Pollution Bulletin 21, 190–197.
Alexander, C.R., Smith, R.G., Calder, F.D., Schropp, S.J., Windom,
H.L., 1993. The historical record of metal enrichments in two
Florida estuaries. Estuaries 16, 627–637.

184 K. Selvaraj et al. / Marine Pollution Bulletin 49 (2004) 174–185
Buckley, D.E., Winters, G.V., 1992. Geochemical characteristics of
contaminated surficial sediments in Halifax Harbour: impact of
waste discharge. Canadian Journal of Earth Sciences 29, 2617–
2639.
Chattopadhyay, P.K., Sarkar, S.C., 1999. Sulfur isotope geothermom-
etry from the high-grade metamorphosed sulfide deposit at
Mamandur, Tamil Nadu. Journal of Geological Society of India
53, 705–710.
Condie, K.C., 1993. Chemical composition and evolution of the upper
continental crust: contrasting results from surface samples and
shales. Chemical Geology 104, 1–37.
Danielsson, L.-G., 1980. Cadmium, cobalt, iron, nickel and zinc in
Indian Ocean water. Marine Chemistry 8, 99–115.
Fedo, C.M., Eriksson, K., Krogstad, E.J., 1996. Geochemistry of
shales from the Archean Abitibi greenstone belt, Canada: Impli-
cations for provenance and source-area weathering. Geochimica et
Cosmochimica Acta 60, 1751–1763.
Ford, T., Mitchell, R., 1990. The ecology of microbial corrosion.
Advanced Microbial Ecology 10, 231.
F€orstner, U., Salomons, W., 1980. Trace metal analysis on polluted
sediments. Part I: Assessment of sources and intensities. Environ-
mental Technology Letters 1, 494–505.
Gromet, L.P., Dymek, R.F., Haskin, L.A., Korotev, R.L., 1984. The
‘‘North American Shale Composite’’: Its compilation, major and
trace element characteristics. Geochimica et Cosmochimica Acta
48, 2469–2482.
Harnois, L., 1988. The CIW index: a new chemical index of
weathering. Sedimentary Geology 55, 319–322.
Hema Achyuthan, Richardmohan, D., Srinivasalu, S., Selvaraj, K.,
2002. Trace metals in the sediment cores of estuary and tidal zones
from northern part of southeast coast of India. Indian Journal of
Marine Sciences 31, 141–149.
Jonathan, M.P., Ram Mohan, V., 2003. Heavy metals in sediments of
the inner shelf off the Gulf of Mannar, Southeast coast of India.
Marine Pollution Bulletin 46, 263–268.
Loring, D.H., 1991. Normalization of heavy-metal data from estuarine
and coastal sediments. ICES Journal of Marine Science 48, 101–
115.
Loring, D.H., Rantala, R.T.T., 1988. An intercalibration exercise
for trace metals in marine sediments. Marine Chemistry 24, 13–
28.
Loring, D.H., Rantala, R.T.T., 1992. Manual for geochemical analyses
of marine sediments and suspended particulate matter. Earth-
Science Reviews 32, 235–283.
Lyle, M., Ross Heath, G., Robbins, J.M., 1984. Transport and release
of transition elements during early diagenesis: Sequential leaching
of sediments from MANOP sites M and H. Part I. pH 5 acetic acid
leach. Geochimica et Cosmochimica Acta 48, 1705–1715.
Mascarenhas, A., Paropakari, K.L., Murty, P.S.N., 1985. Geochem-
istry of sediments of the eastern continental shelf. Mahasagar
Bulletin-National Institute of Oceanography 18, 1–25.
McLennan, S.M., Hemming, S., McDaniel, D.K., Hanson, G.N.,
1993. Geochemical approaches to sedimentation, provenance, and
tectonics. In: Johnsson, M.J., Basu, A. (Eds.), Processes Control-
ling the Composition of Clastic Sediments. Geological Society of
America Special Paper 284, pp. 21–40.
Mohanachandran, G., 1988. Heavy metal distribution in deltaic and
coastal sediments in between Palar and Cauvery Rivers. M.Phil.
Dissertation. Unpublished. Jawaharlal Nehru University, New
Delhi, India.
Mohanachandran, G., Subramanian, V., 1990. Texture, mineralogy
and elemental composition of sediments along the southeast coast
of India. Indian Journal of Marine Sciences 19, 128–132.
Nath, B.N., Kunzendorf, H., Pluger, W.L., 2000. Influence of
provenancer weathering, and sedimentary processes on the ele-
mental ratios of the fine-grained fraction of the bedload sediments
from the Vembanad Lake and the adjoining continental shelf,
southwest coast of India. Journal of Sedimentary Petrology 70,
1081–1094.
Nesbitt, H.W., Young, G.M., 1982. Early Proterozoic climates and
plate motions inferred from major element chemistry of lutites.
Nature 299, 715–717.
Nesbitt, H.W., Markovics, G., Price, R.C., 1980. Chemical processes
affecting alkalies and alkaline earths during continental weathering.
Geochimica et Cosmochimica Acta 44, 1659–1666.
Nesbitt, H.W., Young, G.M., McLennan, S.M., Keays, R.R., 1996.
Effects of chemical weathering and sorting on the petrogenesis of
siliclastic sediments, with implications for provenance studies.
Journal of Geology 104, 525–542.
Nolting, R.F., Ramkema, A., Everaats, J.M., 1999. The geochemistry
of Cu, Cd, Zn, Ni and Pb in sediment cores from the continental
slope of the Banc d’Arguin (Mauritania). Continental Shelf
Research 19, 665–691.
Rajagopal, S., Sasikumar, N., Azariah, J., Nair, K.V.K., 1991. Some
observations on biofouling in the cooling water conduits of a
coastal power plant. Biofouling 3, 325–338.
Rao, Ch.M., Murty, P.S.N., 1990. Geochemistry of the continental
margin sediments of the central west coast of India. Journal of
Geological Society of India 35, 19–37.
Rao, U.M., Sarma, S.N., 1993. Geochemistry of sediments along the
central east coast of India: Part 1––Major elements. Indian Journal
of Marine Sciences 22, 41–47.
Rao, T.S., Eswaran, M.S., Venugopalan, V.P., Nair, K.V.K., Mathur,
P.K., 1993. Fouling and corrosion in an open circulating cooling
system. Biofouling 6, 245–259.
Ravichandran, M., Baskaran, M., Santschi, P.H., Binachi, T.S., 1995.
History of trace metal pollution in Sabine-Neches estuary, Beau-
mont, Texas. Environmental Science and Technology 29, 1495–
1503.
Sarin, M.M., Borole, D.V., Krishnaswami, S., 1979. Geochemistry and
geochronology of sediments from the Bay of Bengal and the
equatorial Indian Ocean. Proceedings of the Indian Academy of
Sciences 88, 131–154.
Satyanarayana, D., Rao, I.M., Prasada Reddy, B.R., 1985. Chemical
oceanography of harbour and coastal environment of Visakhapat-
nam (Bay of Bengal) Part I––Trace metals in water and particulate
matter. Indian Journal of Marine Sciences 14, 139–146.
Selvaraj, K., Ram Mohan, V., 2003. Textural variation and deposi-
tional environments of innershelf sediments, off Kalpakkam,
southeast coast of India. Journal of Geological Society of India
61, 449–462.
Selvaraj, K., Ram Mohan, V., Jonathan, M.P., Siddartha, R.,
Srinivasalu, S., 2003. Distribution of nondetrital trace metals in
sediment cores from Ennore Creek, Southeast coast of India.
Journal of Geological Society of India 62, 191–204.
Shapiro, L., 1975. Rapid analysis of silicate, carbonate and phosphate
rocks––revised edition. U.S. Geological Survey Bulletin 1401, 1–76.
Subramanian, V., Mohanachandran, G., 1990. Heavy metals distri-
bution and enrichment in the sediments of southern east coast of
India. Marine Pollution Bulletin 21, 324–330.
Subramanian, V., Van, T., Dack, L., Van Greikan, R., 1985. Chemical
composition of river sediments from the Indian subcontinent.
Chemical Geology 48, 271–279.
Szefer, P., Glasby, G.P., Pempkowiak, J., Kaliszan, R., 1995.
Extraction studies of heavy-metal pollutants in surficial sediments
from the southern Baltic Sea off Poland. Chemical Geology 120,
111–126.
Taylor, S.R., 1964. Abundance of chemical elements in the continental
crust: a new table. Geochimica et Cosmochimica Acta 28, 1273–
1285.
Taylor, S.R., McLennan, S.M., 1985. The Continental Crust: Its
Composition and Evolution. Blackwell, London.
Voutsinou-Taliadouri, F., Varnavas, S.P., 1993. Geochemical study of
sediments from northern Euboekos Bay, Greece, with regard to the

K. Selvaraj et al. / Marine Pollution Bulletin 49 (2004) 174–185 185
presence of submarine mineral deposits. Marine Geology 110, 93–
114.
Willey, J.D., Fitzgerald, R.A., 1980. Trace metal geochemistry in
sediments from the Miramichi estuary, New Brunswick. Canadian
Journal of Earth Sciences 17, 254–265.
Winters, G.V., Buckley, D.E., 1992. Factor analysis as a method of
evaluation sediment environmental quality in Halifax Harbour,
Nova Scotia. In Current Research, Part D. Geological Survey of
Canada Paper 92-1D, pp. 165–171.