
The Children's Food & Beverage Advertising Initiative In Action

VOL. 114, NO. 4, 2008 329
Evaluation of Ideal Everyday Italian Food and Beer Pairings with Regular Consumers
and Food and Beverage Experts
Gianluca Donadini1,3, Giorgia Spigno2, Maria Daria Fumi2 and Roberto Pastori1
ABSTRACT
J. Inst. Brew. 114(4), 329–342, 2008
The aim of this study was to investigate the relationship between the sensory characteristics of beer and food that harmonically complement each other respectively from the consumer or the sommelier point of view. With this in view, the most desirable beer and everyday Italian food combinations were explored. Eighteen beer samples, easily available in the off-premise chain in Italy, and 9 dishes of Italian cuisine, were selected. The level of match of each beer and food combination was determined by a group of 51 consumers and by seven food experts using a 9-point Likert-like scale of suitability. Agreements and disagree-ments between food professionals and consumers were studied and discussed. Generally speaking, most of the dishes were poor complements to the beers selected for this study, for both regular consumers and experts. In particular, seafood salad, spaghetti with tomato sauce and creamed vegetable soup were inappropri-ate to nearly all of the beer samples overall. However, both consumers and experts found appropriate and interesting beer and food pairing choices, despite usually indicating different ideal beer samples and different levels of match for the same food. This confirmed that certain flavours of food and beer mix together better than others and indicates that consumers may have a different perception of the level of match between beer and food from experts. For regular consumers, the suitability to food was found to positively correlate with the sensory liking of beer. Furthermore the pairing suitability was not equivalent across consumer gender and age class, although these differ-ences had a moderate to weak effect on the level of the final match. Correlations between sensory properties of food and beer samples are reported and discussed.
Key words: beer, beer flavour, food, food pairing, pairing meth-ods, sommelier.
INTRODUCTION Despite a consolidated wine and mineral water tradi-
tion25, a growing interest in beer has been noticed in Italy in more recent times. From 1994 to 2006, the annual per capita consumption of beer grew30 a remarkable 15%, a
development due to standard beers which have alcohol in quantities between 3.0 and 5.5% Vol8.
The gained momentum of beer reflects the radical change in drinking patterns that has occurred in Italy. Young adults in their twenties and thirties in particular have been progressively shifting away from wine, which was the most common consumed alcoholic beverage in connection with family meals, in favour of drinking bev-erages with a more youthful image such as beer and white spirits at a pub, restaurant and pizzeria1,7,16,28,29. Italians are now more aware that beer is a versatile product that possesses the potential to fit different contexts and usages other than the classic ones2. The reasons that drive beer consumption vary and include the following: to quench one’s thirst, enjoyment, relaxation, socializing, and pair-ing with a specific food. One of the reasons that make beer a successful choice relative to wine is the more com-petitive price of sale in both the on-premise and off-premise chain, which encourages consumers to experi-ment and make extra purchases when it works well. Within usage contexts, food pairing is actually an emerg-ing consideration for brewers and consumers in Italy, as shown by the results of a national survey launched in 2007 by the Associazione degli Industriali della Birra e del Malto (Assobirra). According to the results of this na-tional survey, standard beers are considered able to relieve thirst and are very suitable for being consumed with pizza or with fast food meals such as sandwiches served at stands, kiosks, as well as at quick service or fast casual restaurants, especially when one has lunch with friends2. Beer is a valid alternative to wine, especially during and in between meals consumed out of the home2, while it still suffers a low preference during meals at home where min-eral water and wine are the preferred beverages1,25. A 47.5% segment of Italians would like to find a list of beers at restaurants, which would help them in their choice of the best pairings with food. With more information on the pairing of beer and everyday food, 27% of the interview-ees declared that they would consume beer at meals more often and 13.1% said that they would alternate it more fre-quently with wine. Italians seem to be particularly in-clined to experiment with possible pairing with fish dishes, among which were fried, baked or boiled fish, seafood salad, first course dishes with fish, shellfish, carpaccio and smoked fish.
A great deal of information about beer and beverage pairing can be found in tourism-related or culinary maga-zines, internet blogs, brewing companies and supermarket
1 A.I.D.A.S.A. - Institute of Entomology and Plant Pathology. 2 Institute of Oenology and Food Engineering, Agriculture Faculty,Università Cattolica del Sacro Cuore, via Emilia Parmense, 84,I29100 Piacenza, Italy.
3 Corresponding author. E-mail: [email protected].
Publication no. G-2009-0112-577 © 2008 The Institute of Brewing & Distilling

330 JOURNAL OF THE INSTITUTE OF BREWING
chain newsletters or websites in which personal opinions about food and beer pairings are provided by brewmas-ters, sommeliers, culinary and gastronomy experts and beer enthusiast writers and journalists. It is reported for example that fried chicken wings, hot dogs and nachos are excellent with light lagers32. India Pale Ales are consid-ered perfect pairings for spicy ethnic cuisine such as Thai, Mexican or Indian food27. Trappist Belgian beers are won-derful partners of cheeses, stouts and porters of blue cheese in general, while wheat beers pair with feta and goat cheeses. Stouts and oysters have been appreciated since the Victorian age, as well as mussels and Belgian gueuze. Kriek and Framboise are a good accompaniment to fruit filled pancakes, pastries and cakes. Barley wines or strong bottle conditioned ales marry with dark choco-late. As far as Italian cuisine is involved, it is suggested in the popular press to pair alcohol-free beers such as Moretti Zero with white meat, boiled red meat, fresh cheeses and pasta topped with fresh vegetables. Hefe Weissbier Helles such as Franziskaner has been proposed to complement egg herb omelettes, boiled fish, asparagus and boiled meat served cold. Hoppy lager beers have been suggested as a perfect pairing with chicken and turkey meat, risotto with saffron, mixed fried vegetables, as well as artichokes and asparagus. Medium up to full bodied all malt brands such as Leffe Blonde and Peroni Gran Riserva are best married to red meats, with a particular focus on lamb, to hard and semi-hard cheeses, and to pasta amatriciana. Vienna style and amber doppelbocks have good opportunities to harmonize with smoked fish, smoked cold Italian cured meat such as speck, almond cakes, goat cheeses and game3,13.
Other good examples of the attention paid to pairing beer to food are represented by the enterprise of the “I Venerdì della Birra” – “when beer meets fish” a route to discover the brewing styles to match with fish dishes in the 84 restaurants of the circuit Jeunes Restaurateurs d’Europe (Città di Castello, Italy). Specific beer lists were created to satisfy the consumer’s interest; by “Aspettando Identità Golose”, a trip based on beer and haute cuisine, a corollary to Identità Golose, 4th Italian Congress of the Cucina d’Autore (2008); by the recent signalling of restaurants with good beer lists by the gastronomic guides such as Gambero Rosso, or “I Ristoranti d’Italia” by l’Espresso; by the marketing of beer and food pairing handbooks.
Moreover, more than 130 microbreweries, brewpubs and dedicated beer bars have been established in the last decades. Most of them joined the Unionbirrai which pro-motes the diffusion and the culture of craft beers within the European Beer Consumer Union (EBCU). In particu-lar brewpubs offer venues where their in house manufac-tured beers can be proposed and suggest menus and food pairing options as well. Furthermore nearly 150 beer festi-vals, both national and local, were scheduled in 2005 from South to North, islands included.
Beer is indeed a horizontally widely differentiated bev-erage which presents a wider range of flavours than other fermented beverages including wine. The different types of beers available on the market can offer a range of body gradation, carbonation, alcohol content, colour, bitterness, fruity, floral, caramel-like, malt-like, smokey and phenolic
notes8,14,15 which provide opportunities for harmoniously matching nearly all of the styles of cuisine.
Different approaches can be used when it comes to pair a food to specific beverages. Traditional pairings consider that food and beverages evolved simultaneously as each food and each beverage express the territory of a region from which they originate. In this view local dishes are the perfect pairings for local fermented or distilled bev-erages such as wines, beers, whiskies, grappas, sakes or teas in the respect of a gastronomic identity which melds geography, climate and the territory of a given region with cultural and historic traditions of its inhabitants. Or, more in general, pairings can be the result of the interplay be-tween climatic conditions and food consumption as hap-pens in the case of seasonal pairings. In the hot season people eat less caloric food such as fresh vegetables and fruits, fish, seafood, cold salad with pasta or rice which require, as a rule, acidic sparkling and refreshing white or rosé wines. Whereas in the cold season, people tend to eat more caloric, structured and greasier dishes, which re-quire more structured, heavier bodied and matured bever-ages. In turn the valorisation pairing method aims to en-hance the flavour profile of a given beverage or food. When one is serving an extraordinary bottle, a simple food will allow the beverage to be the centre of attention and the beverage will not be upstaged by the food.
A method for food and beverage pairing was proposed in Italy by Pietro Mercadini. This method, initially used for matching food and wine is based on the concept that food and beverages have to be matched according to complementary or contrasting taste and olfactory sensa-tions with the purpose of creating a harmonic balance be-tween the two elements. The food and the beverage should complement each other so that neither the food nor the beverage dominate, and the two paired together are better than consumed individually in a synergistic way. Some pairings will be more dependent on the contrasting tastes while others on complementary flavours, demon-strating how opposites may attract in the pairing domain. In the first case, the organoleptic characteristics of the food must be the same as those found in the beverages. In the second case, the beverage chosen must have organo-leptic characteristics opposite those of the matching food, so that the sensory properties of the food balance those of the beverage and vice-versa. This method relies on the fact that specific characteristics of food and beverages interact with each other and taking advantage of these interactions ensures that the food and the beverage will balance harmoniously. Thus in the case of a particularly succulent food, the matching beverage must have a good alcoholic and tannic content so that it will be able to bal-ance the pronounced salivation produced by the food by means of the dehydrating properties of the alcohol and tannins. While in the case of a food characterized by a certain greasiness, the matching beverage must be charac-terized by good acidity and effervescence to sweep the layer of oil off the oral cavity. Again the aroma of the food must be as intense as the aroma of the beverage. All food and beverage combinations should involve both of these principles as long as the flavour profile of both is the sum of a wide range of sensations of different nature and intensity. Beer and wine share many of the same

VOL. 114, NO. 4, 2008 331
attributes and a similar method can be used for guidance for pairing purposes. Thus the basics of the Mercadini method apply to both beverages as the flavours of the beer may equate to those of wine. Put simply, ales, porters and barley wines relate to red wines such as Cabernet or Pinot Noir, while Pilsners relate more to a Sauvignon or a Char-donnay. Nevertheless beer is a bitter beverage. As a rule hoppiness in beer equals acidity in wine. Bitterness will cut through fat, oil and spices without compromising the flavour of the food5. Bitterness can sustain acidity in contrasting food fatness or alcoholicity and astringency in contrasting succulence, greasiness and spiciness. Thus the experts usually integrate these basics into Mercadini’s method for a better application of this method to the beer field.
Despite the many factors that contribute to variability in good beer and food matches, it is anecdotally reported and generally agreed that some beer and dish pairings are better than others. Conventionally, pairings are deter-mined by a few experts, such as sommeliers, who judge each pair on a personal taste basis. Group discussion may follow but it is not the rule. However, little research has been conducted under controlled conditions to evaluate if professionals can establish ideal pairings. Likewise, little research has been undertaken to determine if regular con-sumers are also able to do this. Unfortunately, apart from a few studies10,19,22 most of the literature written is subjec-tive in nature and lacks a systematic testing design. In this scenario it could be of interest for brewers and restau-rateurs to understand how regular beer consumers pair beer to food, as it can help brewing companies optimize marketing communication strategies and restaurateurs to provide beer lists that best match menus and consumer expectations. This preliminary study was designed to bridge this gap and the suitability of a set of beer and everyday Italian dishes was determined. Agreements and disagreements between experts and regular consumers were aired and discussed. Implications for brewers and restaurateurs are also reported.
MATERIALS AND METHODS
Beers
Eighteen beers from the Italian market were chosen for this study. They represented beer samples easily available to consumers in the off-premise chain. They covered a wide range of flavours encompassing different types and styles15. Commercial beers included in the study are listed in Table I. Sample abbreviations used in biplots, tables and text are also reported.
Consumers
For this study, 51 consumers (26 males and 25 fe-males) were selected. They comprised regular beer con-sumers. According to the average beer consumption in Italy, consumers could be divided into two groups: high consumers (some 0.66 L beer a week) and moderate con-sumers (some 0.66 L beer a month). Moreover consumers could be divided into two groups according to their age (>45 years old; and between 19 and 45 years of age) and gender. The participant’s ages ranged from 20 to 76. No
respondents reported temporary episodes of smell loss. No allergy sufferers or participants with arthritis, diabetes, hypertension or other afflictions took part in the survey.
Dishes
Nine dishes of the Italian cuisine were selected for this study. They were some of the most famous and popular dishes regularly eaten in Italy. Dishes are listed in Table II along with their recipes. All dishes studied were nearly equally appreciated as declared by the consumers in a pre-test screening interview.
Beer sensory profile
Descriptive sensory profiles of the beers selected for this study were determined using a trained panel (n = 7) in sensory evaluation of food and beverages and an estab-lished language for beverages4,33. The trained sensory panel had a minimum of four years and a maximum of 30 years of experience in food and beverage sensory tasting. They comprised professional sommeliers, judges that reg-ularly participate in international competitions and oeno-gastronomy specialist columnists. One of the participants was awarded best sommelier of the world. Beers were evaluated in duplicate, six beers per session, in a restau-rant-like room. The scoring of the perceived intensity of each sensory attribute was made on a nine point intensity scale, anchored at both extremes, where 1 meant “not per-ceived” and 9 “extremely intense”. The order of presenta-tion was randomized across assessors and replicates. Beers were bought in a supermarket in Varese, Italy. They had similar remaining shelf-lives. They were stored in a cold and dark place until they were served to assessors. Prior to service, beers were tempered to 8±2°C in a water bath except for sample MCF, BOC, JOP, RAU and CHI, which were served at 12±2°C. Thus 50 ml of each sample was poured in tulip-shaped glasses, covered with Petri dishes to preserve volatile compounds and presented with nearly the same level of foam. Panellists received mineral water (Uliveto, Terme di Uliveto Spa, Vicopisano, Pisa, Italy) for palate cleansing between samples and dry un-salted breadsticks (Panmonviso, Monviso Spa, Andezeno, Torino, Italy) to avoid cross-contamination among samples.
Table I. Beer sample abbreviations and information.
Sample abbreviation % ABV Beer type
1 TOU <0.5 Alcohol free 2 MRZ <0.05 Alcohol free 3 SPL 4.5 European style pilsner 4 FOS 5.0 American style pilsner 5 CAR 5.0 European style pilsner 6 URQ 4.4 Bohemian style pilsner 7 HOE 4.9 Blanche beer 8 FRA 5.0 Hefe weizen 9 MCF 5.6 Irish red style ale 10 BOC 6.5 Munich doppelbock 11 JOP 5.5 Stout 12 XXX 4.8 American style pilsner 13 RAU 5.1 Rauch bier 14 CHI 9.0 Trappist beer 15 CER 7.7 Strong ale 16 NAS 5.1 European style pilsner 17 JUL 5.6 Specialty 18 BKN 5.0 German style pilsner

332 JOURNAL OF THE INSTITUTE OF BREWING
Dish sensory profile
Descriptive sensory profiles of the dishes were deter-mined by the same trained panel described in the beer sensory profile. Food descriptors are reported in Table III. The scoring of the perceived intensity of each sensory attribute was made on a nine point intensity scale an-chored at both extremes where 1 meant “not perceived” and 9 “extremely intense” according to an established lan-guage4. Dishes were not scored on sweet and spicy, as no sugary or spicy food was selected for this study. Each dish was prepared according to the specific recipe displayed in Table II.
Suitability for pairing with food
A partially balanced incomplete block design was used at this stage of the survey to balance experimental error. Treatment combinations were arranged in a Latin square formation12. Thus beer samples were randomly assigned to three different blocks, six per session. Three dishes were tested per session. In this way each assessor tested all 9 dishes with the 18 beers of the study. A mixed approach was used26 in which beer and food were tasted
simultaneously. Both consumers and experts rated each beer and food combination using a 9-point Likert-like scale of appropriateness. The ideal pairs were defined as a food and beer combination in which neither the beer nor the food dominated, and the pair together was better than each individually. The scale was anchored at both ex-tremes. A 1 meant that a pairing was “ definitely not ap-propriate” while a 9 was “extremely harmonic and bal-anced”. The ideal pairs were scored at the right end of the scale, while the not ideal ones at the left end. Scores in the midpoints of the scale indicate that a pair was neither appropriate nor inappropriate.
The pairing task was conducted in a self service tavern-like environment. Consumers were informed about the ex-perimental task in a briefing that preceded the taste trial. They were invited to taste each beer sample and to con-sume it in accompaniment with each of the dishes pro-vided. First they were told to take a small amount of the food and to start chewing it for a few seconds. Then they were asked to sip the beer and rate the level of suitability of each pairing. Panellists received mineral water (Uli-veto, Terme di Uliveto Spa, Vicopisano, Pisa, Italy) and unsalted breadsticks (Panmonviso, Monviso Spa, Ande-
Table II. Dishes selected for the study, their ingredients and preparation method.
Recipe Ingredients Preparation
Risotto with dry mushrooms
300 g of Carnaroli rice, 100 g of dry mushrooms, onion, stock, salt, butter, grated Parmesan cheese, red wine.
In a saucepan brown the finely chopped onion in the butter. Pour in the rice and mix until it has absorbed the butter. Add a glass of red wine, the mushrooms which have previously been softened in lukewarm water and cut in big pieces and a dash of salt. Gradually add some stock, a little at a time until the risotto is cooked. A few min before cooking is completed, add a piece of butter and some grated Parmesan cheese and mix.
Stewed meat 1 kg of beef, some garlic cloves, cloves, butter, salt, cinnamon, red wine, water.
Cut the meat into big pieces and insert in each one garlic cloves and some cloves. Put the meat in a pan with oil and a piece of butter. Pour red wine over it and let the wine reduce almost completely then add as much water as needed to cover the meat. Put a lid on the pan and let simmer for a few hours. When it's half cooked add cinnamon and salt it only a few min before done. Turn off the heat and let cool. Refrigerate for a couple of days. Before serving, heat the meat for a few min.
Seafood salad 200 g of mussels, 150 g of small shrimp, 150 g of small baby octopus, 150 g of curled octopus (moscardini), lemon juice, 1 glass of extra-virgin olive oil, salt, pepper.
Bring some water to boil in a pan, put in the octopus, previously cleaned and cut in pieces. Add the shrimp and the curled octopus (moscardini) and let boil for 5 min. In a frying pan, over high heat, put the mussels and let them cook until they open, then continue cooking for other 5 min in their liquid. Put all the seafood in a soup-tureen and season with lemon juice, oil, salt and pepper.
Italian cold cured meats
“Coppa”(cured neck of pork) from Piacenza, “Felino" salami, Parma ham (prosciutto).
The cured meats are served cold and thinly sliced.
Spaghetti with tomato sauce
Spaghetti, pulped tomatoes, garlic, salt, extra-virgin olive oil, basil, grated Parmesan cheese.
In a saucepan pour some oil, add the garlic, press it and brown. Add the tomatoes, salt, basil and cook slowly. Cook the spaghetti in boiling salted water; drain and top them with the tomato sauce, a sprinkle of grated Parmesan cheese and some fresh basil leaves.
BBQ Pork sausages, pork chops, pork spareribs.
Cook all the meat on the grill without adding any sauce.
Vegetable cream soup
1 kg of fresh vegetables: carrots, potatoes, zucchini, celery, Swiss chards, spinach, beans, peas.
Put all the vegetables, cleaned, washed and diced in a pot. Add water to cover. Add salt and cook till done. Put the vegetables in a blender and purée them then place them again in the pot and bring to boil.
Roast chicken 1 chicken, 1 rosemary twig, 1 onion, 1 carrot, 1 stalk of celery, 4 tablespoons of olive oil, salt, pepper.
Season the inside of the chicken with salt and pepper. Using a thin cooking string tie it all around. Heat some oil in a pan, add the onion, carrot, celery and rosemary all chopped. When the mixture has browned put in the chicken and let it brown over a high flame for 15 min. Add salt, cover and cook for 40-50 min over low heat. If necessary, add little warm water.
Cheese and tomato pizza
For the dough: 500 g of flour, 25/30 g of yeast, 70 g of extra-virgin olive oil, salt, warm water as needed. For the topping: 300 g of drained peeled and diced tomatoes, 200 g of mozzarella, 2 tablespoons of extra-virgin olive oil, salt, oregano or basil.
Melt the yeast in little warm water. Put the flour on a board making a well in the centre. Pour in the yeast, salt, oil and enough water necessary to obtain a soft, smooth dough. Knead into a ball and flour it. Place it in a bowl, cover with a clean dish towel and let it leaven for 2 1/2 h in a warm place. Then spread the dough into an oiled pizza pan and put the tomatoes evenly on top. Put in a preheated oven at high temperature for 20 min, then add mozzarella, salt, oil and oregano or basil and let cook for 10 min more.

VOL. 114, NO. 4, 2008 333
zeno, Torino, Italy) to cleanse the palate and avoid cross-contamination among samples.
Seafood salad was prepared two days in advance to allow the lemon dressing to equilibrate. Seafood salad was stored at 4°C until service and pre-conditioned at room temperature for 20 min before the tasting session took place. Cold Italian cured meats (Prosciutto di Parma, Coppa Piacentina and Salame Felino) were bought in a grocery store in Varese, Italy. They were reduced in slices within 2 h before tasting, stored cold and pre-conditioned at room temperature 20 min before tasting sessions took place. Roast chicken, stewed meat, BBQ as well as creamed vegetable soup were precooked and kept heated during tasting sessions by means of portable flame gener-ators. The risotto with dry mushrooms and spaghetti with tomato sauce dishes were prepared “ex –novo” at every single session. They were kept hot through service by using a portable flame generator. Cheese and tomato pizza was precooked, stored cold and heated by means of a microwave oven (50 s at 750 W) 2 min before each trial. Cold dishes such as seafood salad and Italian cold cured meats were positioned at the beginning of the service lane, as they serve as appetizers in regular Italian meals, followed by first courses such as spaghetti, risotto, creamed vegetable soup, pizza and entrees such as roast chicken, stewed meat and BBQ.
Hedonic test
Consumer testing was conducted in a tavern like setting. Consumers evaluated the eighteen beer samples in two sessions across two days. The beers were presented individually in a balanced randomized order and were tested under blind conditions. Hedonic ratings were deter-mined using a 9 point Likert-like scale anchored at both extremes where 1 meant ” dislike extremely” and 9 “like extremely”. Samples were prepared and served as de-scribed in the beer sensory profile.
STATISTICAL ANALYSIS Univariate and multivariate statistical methods were
used. One-way and Factorial ANOVA with means separa-tion and Principal Component Analysis (PCA) were used
to analyze the descriptive sensory and consumer data. In factorial ANOVA, eta squared is the proportion of the total variance that is attributed to an effect. Correlation analysis was conducted on descriptive and consumer data to determine linear relationships (Pearson’s R). In particu-lar One-way Anova was applied to the consumer and expert suitability average scores to determine if there were significant differences in the appropriateness of the match between each dish with each beer. Factorial ANOVA assessed the simple and combined effect of variables such as gender, age, frequency of beer consumption and beer samples on beer liking and suitability to food scores. The Tukey HSD test was used to separate homogeneous means groups in order to determine if beer were signifi-cantly more or less appropriate to different dishes. T-tests were conducted to determine significant differences be-tween age and gender classes in beer sensory liking. Moreover, t-tests were conducted to determine if signifi-cant differences existed between the appropriateness of a given beer for the set of dishes between consumers and experts. Principal component analysis (PCA) with vari-max rotation21 on the correlation matrix from the sensory profile averages was applied to generate sensory maps of dishes and beers. Likewise PCA was used to represent the level of match between beer samples and dishes.
Chi-squared tests were used to compare demographic consumer data. Data were analyzed by means of the SPSS® statistical package version 13.5 (SPSS Inc., Chicago, IL, USA) and SYSTAT® 12 (Systat Software Inc., San Jose, CA, USA).
RESULTS
Descriptive sensory profile of dishes
Mean panellist ratings of sensory descriptors are listed in Table IV. One-way ANOVA results of descriptive ana-lysis showed significant differences (p<0.05) among the dishes studied for all the attributes considered except for bitter (F = 1.819; p = 0.080). This parameter was omitted from further analysis. F statistics showed that dishes can be highly significantly differentiated (p<0.001) on the basis of their fatness (F = 82.752; p = 0.000), acidity (F =
Table III. Sensory descriptors of food—Associazione Italiana Sommelier (AIS)4.
Descriptors Definition
Bitter tendency Bitter tendency is the sensation of food due to components intrinsic to food such as in the case of 99% chocolate, artichokes or radicchio. It can also depend on the heat treatment and on additions of herbs during cooking.
Sweet It is the intensity of sweet taste due to the presence of sugars typical of sugary food.
Sweet tendency It is the intensity of the sweet taste of food other than the sugary ones due to components intrinsic to food. For example pasta and Risotto are perceivable as sweet due to presence of starch as well as crustaceans. This distinction is functional to the different beverage pairing strategy that sommeliers use with particular regard to sugary food.
Acidity Acidic taste in food depends on both components intrinsic to food and on acid ingredients added during cooking (i.e., lemons, tomatoes, vinegar).
Aroma The intensity of the overall characteristics of food that can be olfactorily perceived.
Persistence Persistence is the duration of smell and taste sensation after swallowing.
Sapidity Food sapidity is determined by the presence of salt added during cooking or seasoning.
Fatness It is the tactile sensation in the oral cavity due to the presence of fats in food.
Greasiness-unctuosity It is the tactile sensation due to the presence of oil and fat melting derivates that veil the oral cavity.
Succulence The ability of a given food to cause salivation. Structure It depends on the variety, complexity and richness of the ingredients employed to cook a given dish. Spiciness Food spiciness is determined by the presence of such spices as cinnamon, nutmeg, coriander or cardamom.

334 JOURNAL OF THE INSTITUTE OF BREWING
70.241; p = 0.000), sapidity (F = 37.894; p = 0.000), structure (F = 33.833; p = 0.000), greasiness (F = 33.368; p = 0.000), flavour persistence (F = 20.990; p = 0.000), succulence (F = 18.552; p = 0.000), aroma (F = 16.799; p = 0.000), and sweet tendency (F = 7.598; p = 0.000). Prin-cipal Component Analysis suggested that a three dimen-sional solution can be retained for a cumulative explained variance of 90.311%. As displayed in Fig. 1, PC1 (54.123%) is loaded positively with the variables structure (0.967); persistence (0.892), succulence (0.890), fatness (0.885), sapidity (0.859), and aroma (0.695). PC2
(24.619%) is loaded positively with acidity (0.842) and negatively with sweet tendency ( 0.874). PC3 (11.569%) is loaded positively with greasiness (0.952) and negatively with aroma ( 0.642). Stewed meat, BBQ and cold Italian cured meats resulted in the most structured, persistent, sapid and fattest meals in the set of dishes of this study. They also resulted in the most aromatic and succulent samples. PC2 is defined by seafood salad and spaghetti. The former is acidic due to the lemon dressing, the latter due to the tomato sauce. Creamed vegetable soup is along the negative side of the PC1 as a result of its more
Fig. 1. Sensory space of the selected dishes and their positioning in the sensory space. Top: Loading plots PC1 vs. PC2 and PC1 vs.PC3. Bottom: Score plots PC1 vs. PC2 and PC1 vs. PC3.
Table IV. Mean panellist ratings of sensory attribute intensities of the dishes selected for the study.
Dish Greasy Sapid Bitter Acid Sweet Aromatic Succulent Fatty Persistent Structured
Seafood salad 5.93a 3.86de 1.93a 7.00a 5.00c 4.64cd 5.36de 2.07e 6.00bcd 4.07ef Cold Italian cured meat 2.36e 7.28a 1.64a 2.50d 6.28ab 6.93a 6.28bcd 7.43a 6.50bc 5.78bc Cheese and tomato pizza 5.93a 4.50cd 1.57a 3.93c 6.50ab 5.21cd 6.78abc 6.00bc 5.71cde 4.78de Creamed vegetable soup 2.28e 3.36e 1.64a 2.14d 6.78a 4.57d 4.57e 2.50e 4.21f 3.57f Spaghetti with tomato sauce 2.93cd 4.21de 2.14a 5.78b 5.64bc 6.50ab 6.71abc 2.93e 5.50e 5.07cd Risotto with dry mushrooms 5.07ab 4.00de 1.64a 2.00d 6.43ab 5.57bcd 5.93cd 4.43d 4.86ef 4.86de Roast chicken 2.64e 5.14bc 1.71a 2.07d 6.50ab 6.86a 6.36bc 5.28cd 5.21def 4.93cde BBQ 5.14a 5.86b 1.64a 2.14d 5.93abc 5.64bc 7.07ab 6.93ab 6.64ab 6.64ab Stewed meat 3.93bc 6.00b 2.07a 2.21d 4.93c 7.00a 7.50a 6.78ab 7.64a 7.14a
Means followed by the same superscript within each column are not significantly different according to the Tukey HSD test (P≥0.05).

VOL. 114, NO. 4, 2008 335
delicate, less invasive and sweet flavour profile. Most of the dishes, including pizza, roast chicken and risotto with dry mushrooms, tended to sweet as well. PC3 clearly sep-arated all dishes according to their different level of greas-iness into two main clusters. The upper one is character-ized by risotto with dry mushrooms, seafood salad, BBQ and pizza, here reported in ascending order of greasiness. The lower cluster is formed by spaghetti, roast chicken, cold Italian cured meats, creamed vegetable soup and stewed meat. These dishes were far less greasy and more aromatic than those positioned in the upper half of the biplot.
Descriptive sensory profiles of beers Mean panellist ratings of beer sensory descriptors are
listed in Table V. ANOVA results of descriptive analysis showed significant differences (p<0.05) among the beers selected for the study for all the attributes considered. F statistics showed that beers can be highly significantly differentiated (p<0.001) on the basis of their alcohol con-tent (F = 58.484; p = 0.000), aroma (F = 53.711; p = 0.000), bitterness (F = 49.383; p = 0.000), body (F = 42.036; p = 0.000), flavour persistence (F = 38.934; p = 0.000), astringency (F = 24.816; p = 0.000), sweetness (F = 20.299; p = 0.000), acidity (F = 13.536; p = 0.000), degree of carbonation (F = 11.021; p = 0.000), and soft-ness (F = 10.558; p = 0.000). Principal Component Analy-sis suggested a two dimensional solution (Fig. 2) for a cumulative explained variance of 76.866%. PC1 (52.231%) is positively loaded with flavour persistence (0.901); bitterness (0.844), body (0.836), alcohol content (0.798), astringency (0.797), degree of carbonation (0.771), aroma (0.769) and acidity (0.736). PC2 (24.635%) is positively loaded with softness (0.873) and sweetness (0.860). JOP, BOC, CHI, RAU and MCF scored high onto the PC1 and resulted in the most com-plex and the richest beers in sensory characteristics tested by the experts. Sample JOP was the most astringent, bitter and robust beer in this set. RAU was very aromatic, persistent and full bodied. Beer samples brewed from wheat were the most acid and carbonated. CER resulted in the softest and sweetest samples as opposed to MRZ, as
displayed in Fig. 2. Likewise FRA is very soft and sweet, but also highly aromatic. The strong ale from Denmark was the richest in alcohol sample. The remaining samples were in between the extremes.
Beer hedonic test
There is consensus among sensory experts that gender differences are important in the context of this investiga-tion, so we attempted to have equal numbers of males and females. This was achieved as shown by chi-square test (χ2 = 0.020; p = 0.889). Neither age composition (χ2 = 0.176; p = 0.674) or drinking frequency statistically varied (χ2 = 2.373; p = 0.123). According to the factorial ANOVA results a significant main effect was obtained for beer (F = 26.326; p = 0.000) and consumers (F = 4.930; p = 0.000). The main effect size is moderate in both cases (η2
beer = 0.361; η2consumers = 0.233). This indicates that there
is a general effect of beer samples and consumers on hedonic rating. Results of Tukey HSD test showed that some beer samples had significantly higher liking scores
Table V. Mean panellist ratings of sensory attribute intensities of the beers selected for the study according to the experts.
Beer Aromatic Sweet Soft Alcoholic Astringent Acid Bitter Carbonated Body Persistent
TOU 2.50k 4.21cde 4.71cdef 2.00k 2.43hij 5.36abc 3.43ef 3.50f 3.07h 3.50f MRZ 2.71jk 2.21h 3.86f 2.86hij 4.50abc 5.57abc 6.07b 5.36abcd 3.14h 4.21ef SPL 4.57fg 4.36bcde 4.14def 2.71ij 3.64cdef 4.93bc 4.21cde 4.93abcde 4.00efgh 4.78e FOS 3.57hij 4.43bcd 5.21bc 3.28fghi 1.86jk 3.71d 2.86g 4.57cde 3.86fgh 4.50e CAR 3.14jki 3.56efg 4.93bcd 4.00fgh 3.50cdefg 5.57abc 4.28cde 4.34e 4.14efg 4.71e URQ 4.00hj 2.57gh 4.93bcd 4.28e 2.93efgh 5.57abc 6.28ab 4.78bcde 4.64ef 5.07de HOE 5.78de 3.71def 4.00ef 3.28fghj 2.64fghi 6.21a 3.71def 5.50ab 4.71ef 5.07de FRA 7.00ab 4.78abc 5.64ab 4.64de 2.71fghi 6.21a 3.71def 5.71a 5.93bc 6.07bc MCF 5.70def 4.07cde 4.43cdef 4.64de 4.07bcd 5.64abc 6.14ab 5.00abcde 5.78cd 6.50b BOC 6.28bcd 4.07cde 4.43cdef 5.93bc 4.78ab 5.93ab 6.28ab 5.71a 6.50abc 6.86ab JOP 6.86abc 4.78abc 5.64ab 6.21abc 5.43a 5.71abc 7.07a 5.78a 6.93a 7.57a XXX 3.17jki 4.33cde 5.17bc 3.11ghi 1.61k 3.72d 2.83g 4.44e 3.50gh 4.22ef RAU 7.50a 2.71fgh 4.64cdef 5.43cd 3.86bcde 5.64abc 6.14ab 4.78bcde 5.78cd 7.57a CHI 5.21ef 5.36ab 4.78bcde 6.93a 3.21defgh 6.21a 6.57ab 5.71a 6.28abc 6.78ab CER 5.78de 5.64a 6.21a 6.71ab 3.43defgh 5.21abc 4.57cd 5.00abcde 6.86ab 6.36b NAS 3.36jki 4.00cde 4.86bcde 4.14fg 2.57ghij 4.78b 4.93c 5.28abcde 4.86de 5.14cde JUL 5.86cde 3.86cde 4.64cdef 5.86bc 3.50cdefg 5.36abc 4.86c 5.43abc 5.93bc 6.00bcd BKN 5.14ef 4.86abc 5.28bc 3.78efgh 3.07defgh 4.71cd 3.86de 4.50de 4.86de 5.00e
Means followed by the same superscript within each column are not significantly different according to the Tukey HSD test (P≥0.05).
Fig. 2. Biplot displaying the relationships between beer samples and sensory characteristics of beers. Sensory variables are in bold.
336 JOURNAL OF THE INSTITUTE OF BREWING
than others as reported in Table VI. The least preferred beers were MRZ, JOP, RAU, HOE, TOU, and CRL. Most of the beers were given an average hedonic score higher than 4.5 and that corresponded to the mid point of the scale. In particular, alcohol free beers, JOP and RAU scored under the “neither like nor dislike” threshold. Con-sumers seemed to dislike mainly those brands that had a very complex and unfamiliar sensory profile such as stout (see sample JOP), rauchbier (see sample RAU) and the brands that were characterized by a very simple and light bodied profile such as TOU. Also they seemed to dislike some acidic and phenolic samples such as white Belgian beers (i.e. HOE). Due to its unusual uneven sensory char-acters, MRZ was the most disliked sample in this set of beers. Moreover, the beer by gender interaction was signi-ficant (F = 2.162; p = 0.004) as well as the beer by age interaction (F = 2.366; p = 0.001). The effect size was weak for both the interactions studied. This indicated that hedonic rating scores for beer samples were not equiva-lent between genders and the age classes considered, al-though the effect size was weak for both the interactions studied (η2 = 0.046 and η2 = 0.053 respectively). Results of the t-test for significant differences across genders did not show significant differences for most of the samples, although females evaluated sample FOS higher than males (see Table VI). Conversely the female consumers evaluated MRZ, JOP and CAR lower than male counter-parts. Moreover consumers in the 20–45 years of age rated JOP, JUL, CHY and HOE lower than did their over 45 counterparts. Finally the three way beer by frequency of consumption by age interaction was also significant (F = 2.318; p = 0.002; η2 = 0.049) indicating that the beer hedonic rating was neither equivalent across frequency of beer consumption, nor equivalent across the consumer age class. Likewise the three way beer by frequency of con-sumption by gender interaction was significant (F = 2.516; p = 0.001; η2 = 0.053) indicating that the beer hedonic rating was neither equivalent across frequency of beer consumption nor equivalent across gender. Both three-way interaction effect sizes were weak.
A highly significant positive correlation was found between beer liking and the level of match with food for
each dish studied. Correlation varied from medium to low as reported in Table VII.
Beer appropriateness for food according to regular consumers
Mean panellist ratings of appropriateness for food are listed in Table VIII. One-way ANOVA results of descrip-tive analysis showed significant differences (p<0.05) among the beers selected for the study for all the dishes selected as accompaniments. Cheese and tomato pizza was the most discriminating accompaniment (F = 16.124; P = 0.000), followed in strictly descending order by BBQ (F = 9.756; p = 0.000), seafood salad (F = 8.888; p = 0.000), cold Italian cured meats (F = 8.734; p = 0.000), roast chicken (F = 8.652; p = 0.000), spaghetti with to-mato sauce (F = 7.441; p = 0.000), stewed meat (F = 7.069; p = 0.000), risotto with dry mushrooms (F = 4.781; p = 0.000), and creamed vegetable soup (F = 2.756; p = 0.000). Overall, creamed vegetable soup showed the smallest average suitability score (2.32) when paired with the set of beers of this study, followed by risotto with dry mushrooms (mean 3.21), spaghetti with tomato sauce (3.26); stewed meat (3.47), seafood salad (3.49), and roast chicken (3.83). These dishes appeared not to be very suit-able to pairing with beer, as they scored less than the mid 9s of the scoring scale on appropriateness. BBQ (4.25) and Italian cured meats (4.15) were rated nearly one scale-point higher. Thus they seem to be more appropriate to being paired with beer than the previously mentioned dishes, but were not particularly appreciated by the regu-lar consumers. Pizza (5.08) definitely resulted in the best pairing within the set of dishes selected for the study.
Factorial ANOVA revealed a significant main effect for beer for all of the dishes considered in this study with an effect size varying from weak (η2 = 0.056) for creamed vegetable soup to moderate (η2 = 0.220) for cheese and tomato pizza. A moderate to weak significant main effect for consumer gender was found for all the dishes, as well except for cold Italian cured meats and BBQ. A signifi-cant main effect for consumer age was only found for stewed meat (p = 0.001), cheese and tomato pizza (p = 0.000), risotto with dry mushrooms (p = 0.001) and spa-
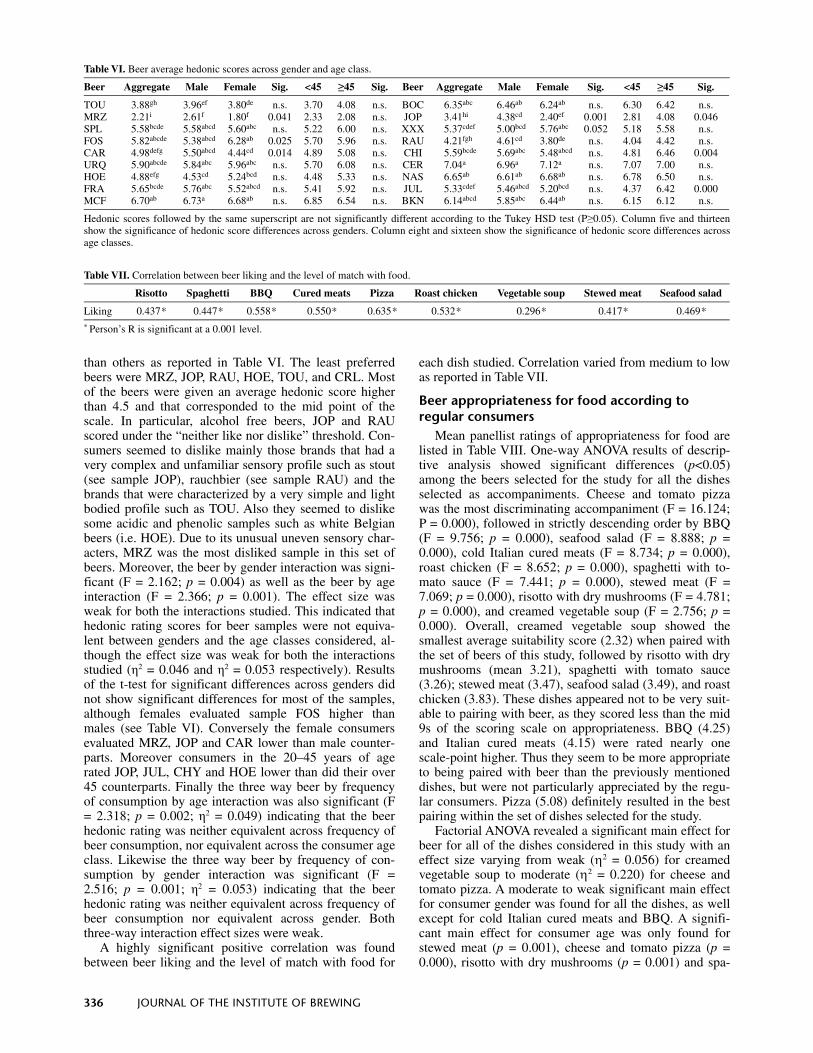
Table VI. Beer average hedonic scores across gender and age class.
Beer Aggregate Male Female Sig. <45 ≥45 Sig. Beer Aggregate Male Female Sig. <45 ≥45 Sig.
TOU 3.88gh 3.96ef 3.80de n.s. 3.70 4.08 n.s. BOC 6.35abc 6.46ab 6.24ab n.s. 6.30 6.42 n.s. MRZ 2.21i 2.61f 1.80f 0.041 2.33 2.08 n.s. JOP 3.41hi 4.38cd 2.40ef 0.001 2.81 4.08 0.046 SPL 5.58bcde 5.58abcd 5.60abc n.s. 5.22 6.00 n.s. XXX 5.37cdef 5.00bcd 5.76abc 0.052 5.18 5.58 n.s. FOS 5.82abcde 5.38abcd 6.28ab 0.025 5.70 5.96 n.s. RAU 4.21fgh 4.61cd 3.80de n.s. 4.04 4.42 n.s. CAR 4.98defg 5.50abcd 4.44cd 0.014 4.89 5.08 n.s. CHI 5.59bcde 5.69abc 5.48abcd n.s. 4.81 6.46 0.004 URQ 5.90abcde 5.84abc 5.96abc n.s. 5.70 6.08 n.s. CER 7.04a 6.96a 7.12a n.s. 7.07 7.00 n.s. HOE 4.88efg 4.53cd 5.24bcd n.s. 4.48 5.33 n.s. NAS 6.65ab 6.61ab 6.68ab n.s. 6.78 6.50 n.s. FRA 5.65bcde 5.76abc 5.52abcd n.s. 5.41 5.92 n.s. JUL 5.33cdef 5.46abcd 5.20bcd n.s. 4.37 6.42 0.000 MCF 6.70ab 6.73a 6.68ab n.s. 6.85 6.54 n.s. BKN 6.14abcd 5.85abc 6.44ab n.s. 6.15 6.12 n.s.
Hedonic scores followed by the same superscript are not significantly different according to the Tukey HSD test (P≥0.05). Column five and thirteen show the significance of hedonic score differences across genders. Column eight and sixteen show the significance of hedonic score differences acrossage classes.
Table VII. Correlation between beer liking and the level of match with food.
Risotto Spaghetti BBQ Cured meats Pizza Roast chicken Vegetable soup Stewed meat Seafood salad
Liking 0.437* 0.447* 0.558* 0.550* 0.635* 0.532* 0.296* 0.417* 0.469* * Person’s R is significant at a 0.001 level.

VOL. 114, NO. 4, 2008 337
ghetti with tomato sauce (p = 0.000). A significant beer × gender interaction (p = 0.005) was found for the creamed vegetable soup. Males considered most of the beers sig-nificantly more suitable than females for this dish. More-over a significant beer × age interaction (p = 0.044) was found for roast chicken. Principal component analysis efficiently structured how different beers matched the set of dishes (Fig. 3). A two dimensional space was obtained that represented the 91.000% of the explained variance. Most of the information is explained by the first com-ponent (53.898%) which is loaded positively with spa-ghetti with tomato sauce (0.955), seafood salad (0.884), cheese and tomato pizza (0.829), roast chicken (0.796), creamed vegetable soup (0.794) and risotto with dry mushrooms (0.780). Stewed meat (0.936), cold Italian cured meats (0.838) and BBQ (0.766) loaded positively onto PC2 which explained 37.102% of the total variance. BKN, SPL, CAR, NAS and FOS highly positively scored onto PC1 and best match dishes such as spaghetti, seafood salad, pizza, roast chicken and risotto. Beer samples that negatively scored onto PC1 (RAU, JOP, MRZ, CHI, JUL) were the least appropriate for these pairings. As far as stewed meat, Italian cured meats and BBQ are concerned, BOC, MCF, CER, RAU and CHI seemed to best match these dishes as opposed to alcohol free brands (MRZ and TOU), to some of the pilsner samples (BKN, SPL, CRL, XXX) to HOE (white beer) and JOP (Dutch stout). Cheese and tomato pizza was considered by regular con-sumers as a universal partner for beer. It worked well with a wide range of beer styles such as pilsners, amber doppelbocks, Irish style red, strong ales and liquorice flavoured specialty beers. Correlations between sensory characteristics of food and beer and the level to which beer and food complement one another are reported in Table VIII and IX. Particularly the matrix of correlation, calculated on the basis of the means of food sensory pa-rameters and the level of appropriateness of each beer
Table VIII. Average appropriateness scores across experts (Ex) and regular consumers (Cs).
Seafood salad BBQ Spaghetti Risotto Cured meats Pizza Chicken Soup Stewed meat
Beer Ex Cs Ex Cs Ex Cs Ex Cs Ex Cs Ex Cs Ex Cs Ex Cs Ex Cs
TOU 3.21bcd 2.96bcde 4.43bcd 3.25cde▼ 3.81ab 3.31a 3.86bcdefg 2.90abcd▼ 1.57g 3.35bcd▲ 5.07ab 4.62bcd 4.36bcd 3.23bcd▼ 3.00b 2.07abc▼ 2.28de 2.31ef MRZ 2.28defg 1.86e 3.78cd 1.98e▼ 3.07bcd 1.90c▼ 2.78hi 2.78hi 3.57bcde 2.09d▼ 4.14bc 2.54e▼ 3.43def 1.90e▼ 1.28e 1.66c 2.07de 1.86f SPL 2.71cde 4.39a▲ 2.28f 4.29abcd▲ 1.86efgh 3.98a▲ 2.71g 3.50ab 3.71bcde 4.29ab 4.93ab 5.33abc 3.50def 4.11abc 2.28bcde 2.94a▲ 4.78e 3.60abcde▼
FOS 2.57cde 4.03ab▲ 2.43ef 4.54abc▲ 2.93bcdef 3.70a▲ 4.00abcdef 3.82ab 3.14jdef 4.68ab▲ 3.64cd 5.78ab▲ 3.21ef 4.41ab▲ 2.36bcd 2.45abc 1.50de 3.74abcde▲
CAR 3.50abc 3.64abcd 4.71bc 4.09abcd▼ 3.28bcde 3.74a 4.28abcde 3.37abc▼ 3.43cdef 4.00abc 5.64a 5.09abcd▼ 4.36bcd 3.84abc 1.86cde 2.52abc▲ 2.50cde 3.00def URQ 2.57cde 4.01ab▲ 4.50bcd 4.92ab 3.00bcde 3.72a 3.57cdefg 3.78ab 5.36a 4.52ab 4.36bc 5.70abc 3.71cde 4.00abc 1.86cde 2.50abc▲ 2.64cde 3.70abcde▲
HOE 4.14ab 3.43abcd 3.50de 3.68bcd 3.28bcde 3.27ab 3.57cdefg 2.84abcd▼ 4.07bcd 3.70bc 4.86ab 4.35cd 3.50def 3.76abc 2.64bc 2.64bc 1.93de 3.19bcdef▲
FRA 4.57a 3.66abcd▼ 4.36bcd 4.45abc 2.64bcdefg 3.72a▲ 5.14a 3.21abc▼ 3.43cdef 4.52ab▲ 4.36bc 5.27abc▲ 4.71abc 4.17abc 2.71bc 2.25abc 6.07bc 4.03abcd▼
MCF 1.28gh 4.31a▲ 5.14b 5.29a 3.50bc 3.68a 4.78abc 4.03a 4.71ab 5.21a 3.64cd 6.16a▲ 4.43bcd 4.68a 2.28bcde 2.80ab 5.50b 4.50ab▼ BOC 1.14h 3.92abc▲ 5.43ab 5.25a 3.36bcd 3.41a 4.93ab 3.68ab▼ 4.57abc 5.11a 3.43cde 5.76abc▲ 5.64a 4.31ab▼ 2.64bc 2.74abc 5.57b 4.49abc▼ JOP 1.07h 2.03e▲ 4.36bcd 3.00de▼ 1.14h 1.96c▲ 2.78fg 2.21cd▼ 2.21fg 2.70cd 1.57g 2.66e▲ 4.86ab 2.37de▼ 1.57de 1.84bc 7.00a 2.96def▼ XXX 3.07bcd 3.56abcd 4.28bcd 3.68bcd 4.93a 3.29a▼ 3.21efg 3.31abc 1.78g 4.09ab▲ 3.71cd 5.03abcd▲ 2.93ef 3.84abc▲ 4.21a 2.27abc▼ 3.50c 3.01def RAU 1.28gh 2.50de▲ 5.43ab 4.11abcd▼ 1.14h 2.11bc▲ 3.00fg 2.60bcd 2.36efg 4.49ab▲ 1.36g 3.72de▲ 2.43g 2.98cde 1.28e 1.68c 6.21ab 3.58abcde▼
CHI 1.64efg 3.92abcd▲ 4.78bc 4.54abc 2.28cdefgh 2.94abc▲ 4.64abcd 3.43abc▼ 3.07def 4.23ab▲ 2.71de 4.68bcd▲ 5.28ab 3.74abc▼ 1.78cde 2.39abc 5.43b 4.49abc CER 2.43cdef 4.21ab▲ 5.28ab 5.07a 2.14defgh 3.60a▲ 3.57cdefg 3.64ab 4.78ab 5.11a 4.07bc 6.19a▲ 4.78abc 5.05a 1.71cde 2.72abc▲ 5.36b 4.66a NAS 4.21ab 4.15ab 3.43def 4.86ab▲ 1.78fgh 3.70a▲ 3.43defg 3.45abc 3.93bcd 4.43ab 5.07ab 6.00ab▲ 3.21ef 4.45ab▲ 2.00bcde 2.00bcde 1.64de 3.49abcde▲
JUL 1.78efg 2.72cde▲ 6.36a 4.86ab▼ 2.14defgh 3.15ab▲ 4.50abcd 2.82abcd▼ 4.14abcd 4.50ab 2.43ef 6.11a▲ 4.86ab 3.84abc▼ 2.07bcde 2.15abc 6.07ab 3.03cdef▼
BKN 1.71efg 4.00abc▲ 3.64cd 4.70ab 1.57gh 3.50a▲ 2.93fg 3.25abc 3.14def 3.66bc 4.14bc 6.35a▲ 3.50def 4.25abc▲ 2.57bcd 2.37abc 2.78c 2.68def BEER 2.51 3.49*▲ 4.34 4.25 2.65 3.26*▲ 3.76 3.21*▼ 3.50 4.15*▲ 3.84 5.08*▲ 4.09 3.83 2.23 2.32 3.70 3.47
Means with different superscripts within each column belong to significantly different homogeneous groups according to the Tukey HSD test. The labels ▲▼ display that ratings increase or decrease significantly (P<0.05) for each row within each column according to the t statistic. * displays significant differences (P<0.05) between experts and regular consumers for the category beer.
Fig. 3. Biplots showing the relationships between the ap-propriateness to food and beer samples according to regular consumers. Top: loading plot PC1 vs. PC2. Bottom: score plot PC1 vs. PC2.

338 JOURNAL OF THE INSTITUTE OF BREWING
with the dishes tasted (Table IX), pointed out a positive correlation between the level of match of JOP, RAU and CHI and the structure, sapidity and aromatic persistency of the food. Furthermore, the pairing suitability for CHI, JOP, and FRA was positively correlated with the succu-lence of the dishes. The fattier the food the more suitable were the following beers: JOP, RAU, CHI (Pearson’s R significant at a 0.01 level) and BOC, MCF, CER, FRA, JUL (Pearson’s R significant at a 0.05 level). Moreover it pointed out a positive correlation between the alcoholic content, body and aromatic persis-tency of a beer and the pairing with the stew (Table X). The more robust the body of a beer, the more it was appropriate for the pairing with the BBQ.
Beer appropriateness for food according to experts
Mean panellist ratings of beer appropriateness for food are listed in Table VIII. ANOVA results of descriptive analysis showed significant differences (p<0.05) among the beers selected for the study for all the dishes selected as accompaniments. Stewed meat was the most discrimi-nating accompaniment (F = 65.231; p = 0.000), followed in strictly descending order by cheese and tomato pizza (F = 29.010; p = 0.000), seafood salad (F = 20.525; p = 0.000), BBQ (F = 20.220; p = 0.000), spaghetti with to-mato sauce (F = 18.189; p = 0.000), cold Italian cured meats (F = 17.362; p = 0.000), roast chicken (F = 15.481; p = 0.000), creamed vegetable soup (F = 10.877; p =
0.000), and risotto with dry mushrooms (F = 10.038; p = 0.000).
According to the experts in the aggregate, most of the dishes i.e., creamed vegetable soup (2.23), seafood salad (2.51), spaghetti (2.65), cold Italian cured meats (3.50), stewed meat (3.70), risotto with dry mushrooms (3.76), and cheese and tomato pizza (3.84), poorly complemented the set of beers of this study. Conversely roast chicken and BBQ mixed better with beer than the above mentioned dishes. Nevertheless a few samples within each pairings were identified that were significantly (p<0.05) more satisfying and suitable pairings than others, i.e. FRA (4.57) to seafood salad, XXX (4.93) to spaghetti, FRA (5.14) to risotto with dry mushrooms, URQ (5.36) to cold Italian cured meats, CAR (5.64) to cheese and tomato pizza and JOP (7.00) to stewed meat.
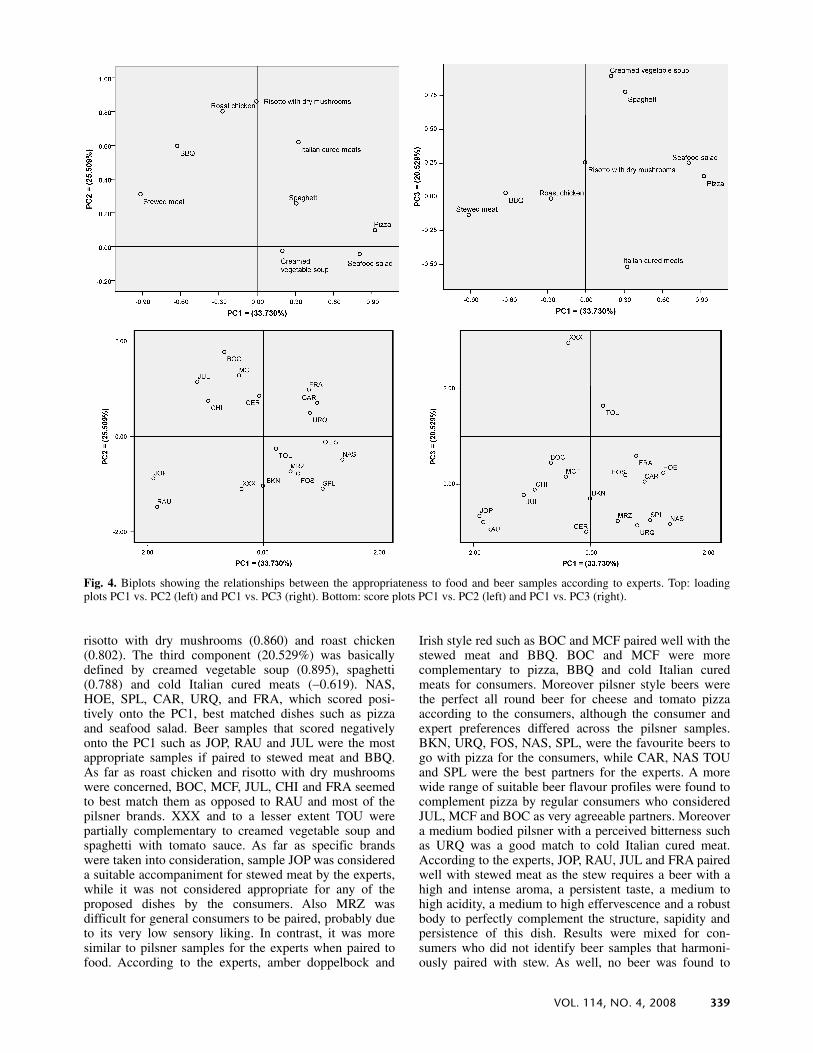
In the aggregate, experts rated the suitability of sea-food salad, spaghetti, cold Italian cured meats, and pizza, significantly lower than the rating by regular consumers. Risotto however was rated significantly higher by the experts. No significant differences were reported for the remaining dishes. Principal component analysis efficiently structured how different beers matched the set of dishes of this study (Fig. 4). A three dimensional space has been disclosed that represents 79.768% of the explained vari-ance. Pizza (0.923) and seafood salad (0.804) were heav-ily weighted onto the first component (33.730%) while stewed meat ( 0.913) and BBQ ( 0.625) were negatively loaded. The PC2 (25.509%) was positively loaded with
Table IX. Correlation between beer appropriateness to food and sensory characteristics of food.
Consumers Experts
Sapidity – JOP (0.800**) Fatness–JOP (0.938**) Greasiness – JUL ( 0.830**) Sapidity – FOS ( 0.699*) Sapidity – RAU (0.884**) Fatness – RAU (0.931**) Greasiness – BOC ( 0.841**) Bitterness – XXX ( 0.730*) Sapidity – CHI (0.708*) Fatness – CHI (0.873**) Greasiness – CHI ( 0.804) Bitterness – TOU ( 802**) Succulence – CHI (0.776*) Fatness – BOC (0.813*) Greasiness – MCF ( 0.780*) Sweet tendency – FOS (740*) Succulence – JOP (0.786*) Fatness – MCF (0.734*) Greasiness – CER ( 0.733*) Sweet tendency – TOU (0.675*) Succulence – FRA (0.730*) Fatness – CER (0.727*) Succulence – FOS ( 0.711*) Aroma – CER (0.772*) Persistence – CHI (0.753*) Fatness – FRA (0.699*) Succulence – FRA ( 857**) Aroma – JOP (0.753*) Persistence – RAU (0.722*) Fatness – JUL (0.671*) Persistence – FOS ( 0.944**) Aroma – JUL (0.726*) Persistence – JOP (0.801**) Persistence – HOE ( 0.715*) Aroma – BOC (0.705*) Structure – JOP (0.871**) Structure – FOS ( 0.812**) Aroma – RAU (0.648*) Structure – CHI (0.731*) Structure – HOE ( 0.713*) Structure – RAU (0.722*) Structure – FRA ( 0.625*) * Correlation is significant at the 0.05 level. ** Correlation is significant at the 0.001 level.
Table X. Correlation between food appropriateness to beer and the sensory characteristics of the beer.
Consumers Experts
BBQ – Body (0.485*) Seafood salad– Alcoholicity ( 0.506*) Pizza – Persistence ( 0.749**) Spaghetti – Astringency (-0.529*) Seafood salad– Bitterness ( 0.639**) Chicken – Alcoholicity (0.593**) Spaghetti – Bitterness (-0.525*) Seafood salad– Persistence ( 0.567*) Chicken – Acidity (0.541*) Chicken – Sweetness (0.439*) BBQ – Alcoholicity (0.654**) Chicken – Body (0.596**) Stewed meat – Alcoholicity (0.617**) BBQ – Body (0.567*) Chicken – Persistence (0.410*) Stewed meat – Body (0.658**) BBQ – Persistence (0.545*) Soup – Astringency ( 0.603**) Stewed meat – Persistence (0.585*) Spaghetti – Aroma ( 0.522*) Soup – Bitterness ( 0.676**) Spaghetti – Body ( 0.501*) Stewed meat – Aroma (0.686**) Spaghetti – Persistence ( 545*) Stewed meat – Alcoholicity (0.830**) Pizza – Aroma (0.633**) Stewed meat – Astringency (0.598**) Pizza – Alcoholicity ( 0.637**) Stewed meat – Bitterness (0.625**) Pizza – Bitterness (0.537*) Stewed meat – Body (0.799**) Pizza – Body ( 0.583*) Stewed meat – Persistence (0.854**) * Correlation is significant at the 0.05 level. ** Correlation is significant at the 0.001 level.
VOL. 114, NO. 4, 2008 339
risotto with dry mushrooms (0.860) and roast chicken (0.802). The third component (20.529%) was basically defined by creamed vegetable soup (0.895), spaghetti (0.788) and cold Italian cured meats ( 0.619). NAS, HOE, SPL, CAR, URQ, and FRA, which scored posi-tively onto the PC1, best matched dishes such as pizza and seafood salad. Beer samples that scored negatively onto the PC1 such as JOP, RAU and JUL were the most appropriate samples if paired to stewed meat and BBQ. As far as roast chicken and risotto with dry mushrooms were concerned, BOC, MCF, JUL, CHI and FRA seemed to best match them as opposed to RAU and most of the pilsner brands. XXX and to a lesser extent TOU were partially complementary to creamed vegetable soup and spaghetti with tomato sauce. As far as specific brands were taken into consideration, sample JOP was considered a suitable accompaniment for stewed meat by the experts, while it was not considered appropriate for any of the proposed dishes by the consumers. Also MRZ was difficult for general consumers to be paired, probably due to its very low sensory liking. In contrast, it was more similar to pilsner samples for the experts when paired to food. According to the experts, amber doppelbock and
Irish style red such as BOC and MCF paired well with the stewed meat and BBQ. BOC and MCF were more complementary to pizza, BBQ and cold Italian cured meats for consumers. Moreover pilsner style beers were the perfect all round beer for cheese and tomato pizza according to the consumers, although the consumer and expert preferences differed across the pilsner samples. BKN, URQ, FOS, NAS, SPL, were the favourite beers to go with pizza for the consumers, while CAR, NAS TOU and SPL were the best partners for the experts. A more wide range of suitable beer flavour profiles were found to complement pizza by regular consumers who considered JUL, MCF and BOC as very agreeable partners. Moreover a medium bodied pilsner with a perceived bitterness such as URQ was a good match to cold Italian cured meat. According to the experts, JOP, RAU, JUL and FRA paired well with stewed meat as the stew requires a beer with a high and intense aroma, a persistent taste, a medium to high acidity, a medium to high effervescence and a robust body to perfectly complement the structure, sapidity and persistence of this dish. Results were mixed for con-sumers who did not identify beer samples that harmoni-ously paired with stew. As well, no beer was found to
Fig. 4. Biplots showing the relationships between the appropriateness to food and beer samples according to experts. Top: loadingplots PC1 vs. PC2 (left) and PC1 vs. PC3 (right). Bottom: score plots PC1 vs. PC2 (left) and PC1 vs. PC3 (right).

340 JOURNAL OF THE INSTITUTE OF BREWING
perfectly match creamed vegetable soup. Spaghetti did not go with a number of beers except for XXX. Likewise seafood salad was hard to pair for both experts and con-sumers. However the former agreed to consider wheat beers the only style that could offer some pairing oppor-tunities to this dish. Risotto with dry mushroom had no perfect beer partner according to consumers, while ex-perts gave some chances to CHI, JUL, BOC and MCF. Some correlations were found between sensory characters of dishes and the level of match with beers (Table IX). In particular a significant positive correlation (p<0.05) was found between CER (0.772), JOP (0.753), JUL (0.726), BOC (0.705), RAU (0.648) and the aroma intensity of dishes. However, FOS and HOE were negatively corre-lated with the flavour persistence of a given dish. Like-wise a significant negative correlation was found between succulence and FRA ( 0.857) and FOS ( 0.711) showing that the more succulent a dish was, the less appropriate the FOS and FRA resulted. Likewise, the more structured a dish was the less appropriate was FOS ( 0.812), HOE ( 0.713) or FRA ( 0.625). Moreover a significant nega-tive correlation was found between greasiness and the level of match with JUL, CER, CHI, BOC and MCF. This result appeared to contrast the pairing rules of the method proposed by Mercadini as these beers presented an alco-holic content that could balance the greasiness of the food. According to this, the negative correlation that was found could be attributed to the fact that the greasiest dishes served in this experiment were also of medium structure, persistence and aroma. These characteristics re-quired less structured, persistent and aromatic beers than the ones negatively correlated to greasiness of food in this study. Positive correlations were found between sweet tendency of food and the pairing suitability with FOS and TOU.
DISCUSSION The level of match between everyday Italian dishes and
beers of the Italian market was evaluated for the first time in this study conducted in Italy in 2007. Consumers could establish ideal pairings between beers of the Italian mar-ket and everyday Italian dishes in a natural eating environ-ment, since they were able to identify significant different level of matches between beers and food. Pairing choice was found to depend on the personal preference for the flavour profile of a particular beer which had a significant influence on the judgement of the level of appropriateness for everyday Italian dishes. Moreover the flavour profile of different dishes can modify the level of match of a given beer. As reported in the literature, the product is able to control a consumer’s eating pattern, due to its characteristics, and beer acceptability partially seems to predict the appropriateness to different dishes19. Generally speaking, most of the dishes were poor complements to the beers selected for this study. In particular the seafood salad, spaghetti with tomato sauce and creamed vegetable soup were inappropriate to nearly all of the beer samples overall. Except for these dishes, both consumers and ex-perts found appropriate and interesting beer and food choices, despite that they usually indicated different ideal beer samples for the same food. This confirms that certain
flavours of food and beers mix better together than others and indicates that consumers may have a different percep-tion of the level of match between beer and food from the experts.
The results of this study confirm a greater ability to discriminate among samples for expert tasters. The ex-perts made a more consistent distribution of dishes across beers than did the consumers. This was in agreement with findings in the sensory literature that generally acknow-ledged that training and experience increase the ability to discriminate among samples6,11,20,23. The reasons for this skill difference are reported to be mixed. Some authors state that experts’ skills are cognitive and depend more on categorical variables, on short time memory and on the learnt ability of focusing on a stimuli rather than the perceptual abilities themselves20,31. However regular con-sumers do not randomly pair beer with food. Although less educated and thus less discriminating than the ex-perts, regular consumers seem to significantly recognize that more structured, flavour persistent, alcoholic and aro-matic beers require structured, sapid, aromatic and succu-lent dishes. Amber doppelbocks, Irish red style, trappist and strong ales of this study go well with robust dishes such as stewed meats, BBQ and cold Italian cured meats. Whereas softer, less structured, alcoholic and bitter beers are more suitable to be paired with more delicate, less persistent, aromatic, greasy and succulent dishes. Varia-tions may occur across beer samples with similar flavour profile, in a way that reflects the personal acceptance of the flavour of a given beer. Vertical differentiations exist within beer styles14,18, and the level of sensory acceptance of consumers may vary from sample to sample of a given beer style, as well as the consequent level of match with a specific food. For example, some of the pilsners were so light that rarely did they have the intensity of flavour or the body to complement or contrast a dish very well. Conversely, a few more generously hopped pilsners could complement more robust and richer in flavour dishes such as cold Italian cured meats.
The sommeliers also had to consider that the percep-tion of beer as an optimal pairing with food was mixed and weak if the level of match was compared to that of the wine15 and customers in Italy may lack the initiative to explore beyond beer and pizza pairings. Beer is indeed compatible with pizza, but it can complement a lot of other dishes that are usually not considered by regular consumers. The general dining public in Italy is aware of their inexperience in the beer field and is willing to be tutored by experts to experience the potential of food and beverage pairings at their best, as they are sometimes uncertain as to what they want, what the market can offer and where to start2.
Factorial ANOVA also revealed that consumer gender and age can affect the judgement of the level of match with a given dish. Males and females have different be-haviours when they have to choose the beer that perfectly marries a dish, as do young adults and seniors. Although the differences accounted for are relatively weak in size, recommended pairing choices for guests should be formu-lated accordingly.
In the light of these findings expert pairing recommen-dations can be helpful and successful in creating an unfor-

VOL. 114, NO. 4, 2008 341
gettable dining experience for guests if the beer experts are inclined to understand the customer perceptions and wants in terms of food and beverage pairing. The somme-liers have the technical skills and a broad experience in the mutual potential of food and beverages, when food and beverages are paired, and can suggest the most har-monic and appealing pairings to be served to guests. Nev-ertheless, their efforts will be useless if their suggestions do not match the customer’s preference for beer. A perfect beer and food pairing does not guarantee a satisfied cus-tomer, if guests do not care about the beer and the food that has been paired for them. Thus experts should more properly recommend a range of choices from which cus-tomers can choose. To upgrade the dining experience of their customers, it is undoubtedly important for somme-liers, food professionals and brewers to dialogue with their guests, to share their own knowledge and experience of the food and beverage domain, to make customers con-fident in making their own assessment and in experiment-ing with beer types such as stouts, ales or specialties, usually conspicuously absent from a consumer’s everyday dinner tables and most of the times perplexing the guests until they are served alongside a proper dish.
LIMITATIONS
The results of this study are to be considered prelimin-ary and are broad recommendations for possible food and beer pairings. A first limitation is due to the fact that this study considered only nine Italian dishes, although these dishes are very popular and widely eaten in Italy. The Ital-ian cuisine offers a wide range of dishes and varies greatly on a regional basis, depending on climate, environment and the political background before the unification of the country. So each region has its specialties and its own method of preparing the same dish and it is hard to iden-tify a standard national recipe for nearly all of the dishes of the Italian cuisine. Thus nearly infinite food and beer pairs can be generated and tasted. A second limitation is due to the limited number of consumers (n = 51) who took part in this study. A third limitation is the selection of a tavern-like specific environment in which beer and food pairs were evaluated. Meiselman et al.24 showed that situ-ational or contextual effects can control eating patterns and food acceptance and demonstrated that positive or negative expectations of the environments can effect prod-uct acceptability in a way that reflects the extent to which consumers expectations can be disconfirmed. As far as the traditional tavern-like location selected for this study, Cardello et al.9 found that consumers rank this location between the more positive environmental influencers of a consumer’s expected liking. Likewise Meiselman et al.24 and Edwards et al.17 found that restaurant-like locations had a very positive effect on food scoring. In our opinion, the results of this study should be replicated in different eating settings such as top class restaurants, fast food out-lets, or university/factory canteens to sort out contextual dependent variations in food and beer pairing likely to occur in different eating situations.
CONCLUSIONS Since more and more consumers are looking for new
experiences in beer, attention should be paid to the way this beverage is instinctively paired to food. Most beer consumers are novices in the world of beer and food pairing and a consumer’s ideal pairing could run counter to the expert’s guidelines and expectations. These prelim-inary findings can help food professionals, sommeliers and brewers understand how regular consumers pair beers to dishes commonly eaten in Italy. Our findings can help restaurateurs plan their menus, enhance customer satisfac-tion through the upgrading of the guest’s dining experi-ence and to increase commercial revenue. Moreover brewers can use this knowledge to look at different oppor-tunities for success for their brands if food and beer pairings are managed as a key aspect of a given brand mix market strategy.
ACKNOWLEDGEMENTS
The authors would like to thank Professor Simona Giosuè, lecturer in Statistics at the Agriculture Faculty of the Università Cattolica del Sacro Cuore, Piacenza, Italy for her technical guidance to the data analysis. The authors are also grateful to Anna Carabelli, Angela Sanvito and Giuseppina Vanoni for their support during the tasting trials of this study. The authors are also indebted to Claudia Moriondo, Giuseppe Vaccarini and to all of the acknowledged food and beverage experts who parti-cipated in this study. The Italian Association for Food Protection and Environmental Hygiene is also greatly acknowledged for partially funding this project.
REFERENCES
1. Allamani, A., Voller, F., Kubica, L., and Bloomfield, K., Drink-ing cultures and the position of women in nine European coun-tries. Substance Abuse, 2000, 21(4), 231-247.
2. Associazione degli Industriali della Birra e del Malto (Asso-birra). Gli Italiani e la Birra. 2007. www.assobirra.it (last ac-cessed Oct. 2008).
3. Associazione degli Industriali della Birra e del Malto (Asso-birra). Carta delle Birre. http://www.birrainforma.it/sito/ newsview.php?NewsID=97 (last accessed Oct. 2008).
4. Associazione Italiana Sommelier (AIS). Tecniche dell’abbina-mento cibo-vino. AIS Editore: Roma, 1998.
5. Beaumont, S., Bringing beer to the table. Flavour & The Menu, 2006, 134-137.
6. Bitnes, J., Rødbotten, M., Lea, P., Ueland, Ø. and Martens, M., Effect of product knowledge on profiling performance com-paring various sensory laboratories. J. Sens. Stud., 2007, 2(1), 66-80.
7. Bloomfield, K., Stockwell, T., Gmel, G. and Rehn, N., Interna-tional comparisons of alcohol consumption. Alcohol Res. Health., 2003, 1, 95-109. http://findarticles.com/p/articles/ mi_m0CXH/is_1_27/ai_112937519 (last accessed Oct. 2008).
8. Canadean. Annual Report–2006 Cycle Italy, 2007. Purchasable at www.canadean.com.
9. Cardello, A. V., Bell, R. and Kramer, F. M., Attitudes of con-sumers toward military and other institutional foods. Food Qual. Prefer., 1996, 7, 7-20.
10. Cerretani, L., Biasini, G., Bonoli-Carbognin, M. and Bendini, A., Harmony of virgin olive oil and food pairing: a methodo-logical proposal. J. Sens. Stud., 2005, 22, 403-416.
11. Clapperton, J. F. and Piggott, J. R., Differentiation of ale and lager flavours by principal component analysis of flavour char-acterization data. J. Inst. Brew., 1979, 85, 271-274.
342 JOURNAL OF THE INSTITUTE OF BREWING
12. Cochran, W. G. and Cox, G. M., Experimental Designs. John Wiley & Sons: New York, 1957.
13. Colli, G., A tavola con la birra. L’abbinamento della birra al cibo. Cristian Lucisano Editore: Milano, 2007, 159 p.
14. Donadini, G., Applicazioni di tecniche di analisi sensoriali al settore birrario. Master Thesis Università Cattolica del Sacro Cuore, Piacenza, 2006, p. 60.
15. Donadini, G., Spigno, G., Fumi, M.D. and Pastori, R., Food and beer pairing: Agreements and disagreements between experts and regular consumers. Does the theory match the practice? Oral presentation at the 2008 IBD Congress, Auckland, New Zealand.
16. Doxa-Osservatorio Permanente Giovani ed Alcool. Italians and Alcohol: Consumption, Trend and Attitudes in Italy and in the Regions. IV DOXA National Survey, 2001, p. 106 http:// ec.europa.eu/health/ph_determinants/life_style/alcohol/documents/ev_20050120_co021_en.pdf (last accessed Oct. 2008).
17. Edwards, J. S. A., Meiselman, H. L., Edwards, A. and Lesher, L., The influence of eating location on the acceptability of iden-tically prepared foods. Food Qual. Prefer., 2003, 14, 647-652.
18. Guinard, J-X., Yip, D., Cubero, E. and Mazzucchelli, R., Quality ratings by experts, and relation with descriptive analysis ratings: A case study with beer. Food Qual. Prefer., 1998, 10(1), 59-67.
19. Harrington, R. J., Miszczak, D. C. and Ottembacher, M. C., The impact of beer type, pizza spiciness and gender on match perceptions. PASOS. Revista de Turismo y Patrimonio Cultural, 2008, 6(2), 173-188.
20. Hughson, A. and Boakes, R. A., The knowing nose: the role of knowledge in wine expertise. Food Qual. Pref., 2002, 13, 463-472.
21. Kaiser, H. F., Computer program for varimax rotation in factor analysis. Educ. Psychol. Meas., 1959, 19, 413-420.
22. King, M., and Cliff, M., Evaluation of ideal wine and cheese pairs using a deviation-from-ideal scale with food and wine experts. J. Food Qual., 2005, 28, 245-256.
23. Labbe, D., Rytz, A. and Hugi, A., Training is a critical step to obtain reliable product profiles in a real food industry context. Food Qual. Prefer., 2004, 15(4), 341-348.
24. Meiselman, H. L., Johnson, H. L., Reeve, W. and Crouch, J. E., Demonstration of the influence of the eating environment on food acceptance. Appetite, 2000, 35, 231-237.
25. Mineracqua. Il mercato delle acque minerali naturali 2004. http://www.mineracqua.it/pdf/presskit.pdf (last accessed Oct. 2008).
26. Nygren, I. T., Gustafsson, I-B. and Johansson, L., Effects of tasting technique—sequential tasting vs. mixed tasting—on the perception of dry white wine and blue mixed cheese. Food Service Technology, 2003, 3, 61-69.
27. Oliver, G., The brewmaster’s table: Discovering the pleasures of real beer with real food, 2003, Ecco: New York, 372 p.
28. Ramstedt, M., Alcohol-related mortality in the EU Member States. http://www.ias.org.uk (last accessed Oct. 2008).
29. Rehm, J., Rehn, N., Monteiro, M., Gmel, G., Jernigan, D. and Frick, U., The global distribution of average volume of alcohol consumption and patterns of drinking. Eur. Addict. Res., 2003, 9, 147-156.
30. Scafato, E., Ghirini, S., Russo, R., Pizzi, E. and Di Pucchio, A., L’impatto sanitario e sociale dell’alcool. Personal communica-tion at the Alcohol Prevention Day, Rome, Italy. http:// progetti.iss.it/binary/ofad/cont/APD%202005%20SCAFATO.1114598039.pdf.
31. Schifferstein, H. N. J., Cognitive factors affecting taste intensity judgments. Food Qual. Prefer., 1996, 7, 167-175.
32. Stinchfield, M., Building a better beer list. Restaurant Hospitality, 2004, 88(5), 130-132
33. Vaccarini, G., Manuale del Sommelier. Come conoscere, ap-prezzare, valutare il vino e come gestire una cantina. Giunti Editore: Firenze, 2005, 287 p.
(Manuscript accepted for publication November 2008)
Copyright © 2022 FDOKUMEN