Evaluation of Formation Damage and Assessment of Well Productivity of Oredo Field, Edo State,...
10
American Journal of Engineering Research (AJER) 2015 www.ajer.org Page 1 American Journal of Engineering Research (AJER) e-ISSN : 2320-0847 p-ISSN : 2320-0936 Volume-4, Issue-3, pp-01-10 www.ajer.org Research Paper Open Access Evaluation of Formation Damage and Assessment of Well Productivity of Oredo Field, Edo State, Nigeria 1 Omotara O. Oluwagbenga* 2 Jeffrey O. Oseh; 3 Ifeanyi A. Oguamah; 4 Oluwaseun S. Ogungbemi; 5 Abel A. Adeyi. 1,2,3,4,5 C& PE, COE, Afe Babalola University, Ado – Ekiti (ABUAD), Ekiti State, Nigeria. ABSTRACT: -Formation damage canincurconsiderable cost for remediation and deferred production. Thorough understanding of the formation damage mechanisms, stringent measures for its control and prevention, and effective and efficient treatments are the keys for optimum production strategies for oil and gas fields. WELL 4X was investigated in this study to properly diagnosed and evaluate productivity in OREDO FIELD and Bottom Hole Pressure survey was used from Bottom Hole Pressure analysis in addition to the information of the well production history and reservoir data available to determine and assess the extent of the formation damage in the well. The WELL 4X was stimulated using Acid Foam Diversion Techniques to enhance reservoir productivity and increase economic operations. The stimulation job done on the well showed a peak increase of production from 850 bbl/day to 3200 b/d before it declined to 2150 bbl/day, and finally maintained an average stabilized rate of 2000 bbl/day. It has to be established that the treatment method on WELL 4X using Acid Foam Diversion Techniques and the Bottom Hole Pressure survey conducted on the WELL 4X in OREDO FIELD is found to be efficient in the determination and evaluation of formation damage. KEYWORDS: - (Bottom Hole Pressure, Formation Damage, Permeability, Stimulation, Well 4X) I. INTRODUCTION Producing formation damage is the impairment to reservoir (reduced productivity) caused by wellbore fluids used during drilling/completion and workover operations. It is a zone of reduced permeability within the vicinity of the wellbore (skin) as a result of alien-fluid invasion into the reservoir rock(Dake, 1978). This reduced production results in an indeterminate reduction of the efficient exploitation of hydrocarbon reservoirs. The situation is both undesirable economically and operationally, hence, it is considered as a difficult problem to the oil and gas industry(Leontaritis et al., 1994). As a result conducting an in-depth analysis of the producing formation to customize a fluid specific in OREDO FIELD that will help minimize formation damage and thus increase production rate is of paramount interest to the general economics of the field.As expressed by Amaefule et al., 1988, “Formation damage is an expensive headache to the oil and gas industry.” Bennion,1999 described formation damage as, “The impairment of the invisible, by the inevitable and uncontrollable, resulting in an indeterminate reduction of the unquantifiable!” Formation damage assessment, control, and remediation are among the most important issues to be resolved for efficient exploitation of hydrocarbon reservoirs (Civan, 2005).Formation damage does not occur naturally. It is caused by physio-chemical, chemical, biological, hydrodynamic and thermal interactions of porous formation, particles, and fluids and mechanical deformation of formation under stress and fluid shear. Fluids introduced into the formation during various operations carried out to bring a well on stream and also during the life of the well have the potential of reducing the well permeability and impairing productivity. Formation damage can occur due to any one of the following physical or chemical interaction between invading liquid phase and the reservoir rock constituents. This problem leads mainly to potential clay swelling, wettability alteration and potential water blocking.Formation damage indicators include permeability impairment, skin damage, and decrease of well performance. As stated by (Civan, 2000), “Formation damage is not necessarily reversible” and “What gets into porous media does not necessarily come out.” Beadie, 1995 called this phenomenon “the reverse funnel effect.” Therefore, it is better to avoid formation damage than to try to restore it.
-
Upload
independent -
Category
Documents
-
view
2 -
download
0
Transcript of Evaluation of Formation Damage and Assessment of Well Productivity of Oredo Field, Edo State,...

American Journal of Engineering Research (AJER) 2015
w w w . a j e r . o r g
Page 1
American Journal of Engineering Research (AJER)
e-ISSN : 2320-0847 p-ISSN : 2320-0936
Volume-4, Issue-3, pp-01-10
www.ajer.org
Research Paper Open Access
Evaluation of Formation Damage and Assessment of Well
Productivity of Oredo Field, Edo State, Nigeria
1Omotara O. Oluwagbenga*
2Jeffrey O. Oseh;
3Ifeanyi A. Oguamah;
4Oluwaseun
S. Ogungbemi;5Abel A. Adeyi.
1,2,3,4,5C& PE, COE, Afe Babalola University, Ado – Ekiti (ABUAD), Ekiti State, Nigeria.
ABSTRACT: -Formation damage canincurconsiderable cost for remediation and deferred production.
Thorough understanding of the formation damage mechanisms, stringent measures for its control and
prevention, and effective and efficient treatments are the keys for optimum production strategies for oil and gas
fields. WELL 4X was investigated in this study to properly diagnosed and evaluate productivity in OREDO
FIELD and Bottom Hole Pressure survey was used from Bottom Hole Pressure analysis in addition to the
information of the well production history and reservoir data available to determine and assess the extent of the
formation damage in the well. The WELL 4X was stimulated using Acid Foam Diversion Techniques to enhance
reservoir productivity and increase economic operations. The stimulation job done on the well showed a peak
increase of production from 850 bbl/day to 3200 b/d before it declined to 2150 bbl/day, and finally maintained
an average stabilized rate of 2000 bbl/day. It has to be established that the treatment method on WELL 4X
using Acid Foam Diversion Techniques and the Bottom Hole Pressure survey conducted on the WELL 4X in
OREDO FIELD is found to be efficient in the determination and evaluation of formation damage.
KEYWORDS: - (Bottom Hole Pressure, Formation Damage, Permeability, Stimulation, Well 4X)
I. INTRODUCTION Producing formation damage is the impairment to reservoir (reduced productivity) caused by wellbore
fluids used during drilling/completion and workover operations. It is a zone of reduced permeability within the
vicinity of the wellbore (skin) as a result of alien-fluid invasion into the reservoir rock(Dake, 1978). This
reduced production results in an indeterminate reduction of the efficient exploitation of hydrocarbon reservoirs.
The situation is both undesirable economically and operationally, hence, it is considered as a difficult problem
to the oil and gas industry(Leontaritis et al., 1994). As a result conducting an in-depth analysis of the
producing formation to customize a fluid specific in OREDO FIELD that will help minimize formation damage
and thus increase production rate is of paramount interest to the general economics of the field.As expressed by
Amaefule et al., 1988, “Formation damage is an expensive headache to the oil and gas industry.” Bennion,1999
described formation damage as, “The impairment of the invisible, by the inevitable and uncontrollable, resulting
in an indeterminate reduction of the unquantifiable!” Formation damage assessment, control, and remediation
are among the most important issues to be resolved for efficient exploitation of hydrocarbon reservoirs (Civan,
2005).Formation damage does not occur naturally.
It is caused by physio-chemical, chemical, biological, hydrodynamic and thermal interactions of porous
formation, particles, and fluids and mechanical deformation of formation under stress and fluid shear. Fluids
introduced into the formation during various operations carried out to bring a well on stream and also during the
life of the well have the potential of reducing the well permeability and impairing productivity. Formation
damage can occur due to any one of the following physical or chemical interaction between invading liquid
phase and the reservoir rock constituents. This problem leads mainly to potential clay swelling, wettability
alteration and potential water blocking.Formation damage indicators include permeability impairment, skin
damage, and decrease of well performance. As stated by (Civan, 2000), “Formation damage is not necessarily
reversible” and “What gets into porous media does not necessarily come out.” Beadie, 1995 called this
phenomenon “the reverse funnel effect.” Therefore, it is better to avoid formation damage than to try to restore
it.
American Journal of Engineering Research (AJER) 2015
w w w . a j e r . o r g
Page 2
A verified formation damage model and carefully planned laboratory and field tests can provide
scientific guidance and help develop strategies to avoid or minimize formation damage. Properly designed
experimental and analytical techniques, and the modeling and simulation approaches can help understanding
diagnosis, evaluation, prevention remediation, and controlling of formation damage in oil and gas
reservoirs.The consequences of formation damage are the reduction of the oil and gas productivity of reservoirs
and non-economic operation. Therefore, it is essential to develop experimental and analytical methods for
understanding and preventing and/or controlling formation damage in oil and gas-bearing formations (Gary and
Rex, 2005).The laboratory experiments are important steps in reaching an understanding of the physical
mechanisms of formation damage phenomena. “From this experimental basis, realistic models which allow
extrapolation outside the scale able range may be constructed” (Civan, 2000). These efforts are necessary to
develop and verify accurate mathematical models and computer simulators that can be used for predicting and
determining strategies to avoid and/or mitigate formation damage in petroleum reservoirs (Odeh, 1968).
Invasion of solids fluid and formation that can leads to particle plugging or fine migration is also another serious
concern of formation damage.The measure of formation damage is called “skin”(Jones and Watts, 1971). The
formation damage obviously reduces well deliverability, drainage efficiency and ultimate recovery. These
parameters are key factors to determine the reservoir performance and field development, production test,
pressure build-up test or drawdown test indicates formation damage(Matthews and Russels, 1967). Comparison
with offsets well and careful analysis of production history prior to completion, workover and remedial works
indicates formation damage. These indicators are useful tools employed in the investigation of the cause,
analysis, severity and location of the damage.
[1]. Over the last five decades, a great deal of attention has been paid to formation damage issues for two
primary reasons:
[2]. Ability to recover fluids from the reservoir is affected very strongly by the hydrocarbon permeability in the
near-wellbore region. Although we do not have the ability to control reservoir rock properties and fluid
properties, we have some degree of control over drilling, completion and production operations. Thus, we
can make operational changes, minimize the extent of formation damage induced in and around the
wellbore and have a substantial impact on hydrocarbon production.
[3]. Being aware of the formation damage implications of various drilling, completion and production
operations can help in substantially reducing formation damage and enhancing the ability of the well to
produce fluids(Marek, 1979).
Aims of the study : The fact that all wells are susceptible to damage is indisputable as such this study goals
were to carry out a stimulation program to minimize formation damage and improve well productivity while
maintaining the integrity of the formation and to assess and determine the damage level in the formation.
Scope of the study:The study mainly dwells on Bottom Hole Pressure (BHP) Survey, Production history and
Well Production Logging Data. Examinations of well performance before and after stimulation job were
studied. Adequate analyses on observations from collected field data from Nigerian Petroleum Development
Company(NPDC, 1997) OREDO FIELD were made.
II. COMMON FORMATION DAMAGE CAUSES, TREATMENTS AND PREVENTION Barkman and Davidson (2003),Piot and Lietard (2000),Amaefule et al., (1988),Bennion and Thomas,
(1991, 1993), and many others have described in detail the various problems encountered in the field, interfering
with the oil and gas productivity of the petroleum reservoirs. Amaefule et al., (1988) listed the conditions
affecting the formation damage in four groups:
-Type, morphology, and location of resident minerals; -In situ and extraneous fluids composition; -In situ
temperature and stress conditions and properties of porous formation; and -Well development and reservoir
exploitation practices.
Amaefule et al., (1988) classified the various factors affecting formation damage as the following: (1) Invasion
of foreign fluids, such as water and chemicals used for improved recovery, drilling mud invasion, and workover
fluids; (2) Invasion of foreign particles and mobilization of indigenous particles, such as sand, mud fines,
bacteria, and debris; (3) Operation conditions such as well flow rates and wellbore pressures and temperatures;
and (4) Properties of the formation fluids and porous matrix. Table 2.1 by Hower, (1977) delineates the
common formation damage mechanisms in the order of significance. Bishop, (1997) summarized the various
formation damage mechanisms described by Hower, (1977) and Bennion and Thomas (1993) as the following
(after Bishop, ©1997 SPE; reprinted by permission of the Society of Petroleum Engineers):

American Journal of Engineering Research (AJER) 2015
w w w . a j e r . o r g
Page 3
[1]. Fluid–fluid incompatibilities, for example emulsions generated between invading oil-based mud filtrate
and formation water.
[2]. Rock–fluid incompatibilities, for example contact of potentially swelling smectite clay or deflocculatabl
kaolinite clay by non-equilibrium water-based fluids with the potential to severely reduce near wellbore
permeability.
[3]. Solids invasion, for example the invasion of weighting agents or drilled solids.
[4]. Phase trapping/blocking, for example the invasion and entrapment of water-based fluids in the near
wellbore region of a gas well.
Table 2.1: Formation Damage Quick Reference Guide (Hower, W. F., 1977)
Damage Cause Treatment Prevention
Mechanize particle plugging Dirty drilling fluids and
invasion
4Cl acid of Hcl/Hf back flowing Use compatible fluid
Fines migration Excessive kotinite chlorides or
illites
Hcl/Hf acid over flush 5’ out Bring well on slowly with no
high PH fluids
HF precipitate Sodium, Calcium or Potassium
in formation for fluids
Insoluble None NH4CL over flush, HCl preflush
Iron precipitation Excessive Iron in formation or
fluid
HCl acid Sequestering agent acetic acid
preflush Fluid loss control residue Inefficient removal Gels/CaCO2/Salt HCl and sand.
Esters oil soluble resin-xylene
Prepack perforation before
placing. Do not use resin in
sand control situation Organic deposition Asphaltenes and paraffins cool
fluid in formation with strong
acid
Xylene or Toluene soak 25 GPF Xylene ahead of acid
treatment
Scale Minerals in produced water Carbonates HCl and hydride or
gypsum
Analyse produced fluid may
require routing treatment
Mechanism wettability changes Oil based fluid acid additives Mutual solvent soak Xylene in gas well Emulsions Incompatible fluids Lab. Recommendations Lab. Test before acid. Do not
use fluid carbon surfactants in
oil or condensate wells. Water block Excessive fluid losses, water
conning excessive illite clays
HCl + HF + Methanol Limit fluids in gas well. Include
methanol in acid in gas wells.
(a). Drilling Induced Formation Damage Wells have to be drilled as fast as possible for economic reasons. To increase the penetration rate, it is appealing
to reduce the fluid loss or control the drilling fluid. During drilling of 10, 000 ft. well approximately 600
reservoir barrels of fluid may be lost in a typical formation. High value of filtrate invasion may result from
deliberate choice of high penetration rates. The liquid phase of a drilling fluid contains many potentially-
damaging compounds because filtrate invasion can be very deep (Table 2.2). The plugging of the reservoir-rock
pore spaces can be caused by the fine solids in the mud filtrate or solids dislodged by the filtrate within the rock
matrix. To minimize this form of damage is to minimize the amount of fine solids in the mud system and fluid
loss Civan, (2000).
Table 2.2: Depth of Filtrate Invasion
Time (Days) Oil-Based Drilling Fluid
(Inch)
Low-Oil Based Drilling Fluid Water-Based Drilling Fluid
1 1.2 3.3 7.7
5 4.6 1.1 12
10 7.7 17 18 15 10 21 23
20 12 23 27
25 14 29 31 30 16 32 34
III. RESEARCH METHODOLOGY (a).History and Status of WELL 4X (OREDO FIELD): The OREDO FIELD considered was assigned
WELL 4X due to the sensitive nature of the data (NPDC 1997). The well was drilled to a depth of 1147 ft. and
completed as two string dual (TDS) on A8.2 Sands in April 1991. The WELL came on stream in February
1992. During a well re-entry in March 1993, both intervals were consolidated to arrest sand production. Interval
Gravel Pack (IGP) was installed across both intervals during a re-entry in 1994 to arrest high sand production
since Eposand consolidation was not effective to arrest the sand production.

American Journal of Engineering Research (AJER) 2015
w w w . a j e r . o r g
Page 4
A8.2 (9846.28ʺ - 9856.17ʺ): IGP: When the interval came on stream in February 1992, the production rate was
700 – 800 b/d. sand of about 2ppt and water cut of 22 % was noticed in December 1992. The water cut rose
steadily to about 51 % in April 1996 thus necessitating a water exclusion job in May 1996. After the water
exclusion job, the water cut subsided to 8.1 %. The well was observed to have experienced a drastic drop in
productivity index from 36.4 b/d/psi in March 1992 to 3.48 b/d/psi in February 1996 due to the encroachment of
water. This indicated impairment as such the well was re-entered to install IGP across this interval. The BHP
survey on WELL 4X A8.2 Interval Gravel Pack analyses is shown in Table 4.1.
(b). Stimulation Programmeof BHP Data of WELL 4X
The well is stimulated by investigating the following rock and fluid properties
Permeability K
K = 162.6𝑄𝑜𝜇𝑜𝛽𝑜
𝑚 (1)
Total skin
S = 1.151[𝑃1𝑟−𝑃𝑤𝑓
𝑚− 𝑙𝑜𝑔
𝐾
∅𝜇𝑜𝐶𝑡 𝑟𝑤 2 + 3.23] (2)
Damage skin due to formation damage
Sd= 𝑝
𝑡[𝑠 − 𝑠𝑝] (3)
S = Sd [𝑡
𝑝] + 𝑆𝑝 (4)
Where Sdis the skin due to formation damage
Sp = [𝑡
𝑝− 1] [𝑙𝑛
𝑡
𝑟𝑤
𝐾𝐻
𝐾𝑉 ↑−2] Assuming
𝐾𝐻
𝐾𝑉 = 1 (5)
Where Sp is the skin due to incomplete perforation
Pressure drop due to total skin
ΔPskin = 0.869ms (6)
Pressure drop due to damage skin
ΔPskin = 0.869ms × m. Sd (7)
Pressure drop due to incomplete perforation skin damage
ΔPskin = 0.869 × m.Sp (8)
Productivity Index (J)
J = 𝑄𝑂
𝑃𝑟−𝑃𝑤𝑓 (9)
Flow Efficiency
F.E = (𝑃∗−𝑃𝑤𝑓 −𝛥𝑃𝑠𝑘𝑖𝑛 )
𝑃∗−𝑃𝑤𝑓× 100 (10)
Damage Ratio
DR = 1
𝐹.𝐸 (11)
Estimated Damaged Ratio
EDR = (𝑃𝑚𝑡 −𝑃𝑓𝑓 )
𝑚 (𝑙𝑜𝑔𝑡𝑝 +2.65) (12)
R – Factor 𝛥𝑃𝑠𝑘𝑖𝑛
𝑃∗−𝑃𝑤𝑓 (13)
Hence, if r> 0.60, it means the well needs to be stimulated
Radius of Investigation
R1 = [𝐾𝛥𝑡
948∅𝜇𝐶𝑡]0.5 (14)
Transmissibility 𝐾
𝜇 (15)
Treatments of A8.2 Sand of WELL 4X:Subsequent to the configuration of the presence of formation damage,
treatment programme recommended was initiated in the well using the following:
Coiled Tubing Stimulation for WELL 4X
Perforation 9846.28ʺ - 9856.17ʺ
Tubing Size 2 2ʺ
3
Treatment Programme Requirement using Acid Foam Diversion Techniques:Stimulation of interval to
remove any near wellbore damage caused by the migration of formation sand or fines was done using “Acid
Foam Diversion Techniques” and the following treatment procedure were employed.
American Journal of Engineering Research (AJER) 2015
w w w . a j e r . o r g
Page 5
[1]. A drift was made to the well nipple to make sure that the tubing was free
[2]. The coiled tubing surface was run to tubing tail while circulating with diesel. The hole was circulated
clean.
[3]. Stimulation chemicals were pumped into the perforation as per treatment recipe.
[4]. The well was opened up and produced clean
[5]. The well was produced to potential bean up steps of 16
64ʺ to a maximum bean of
36
64ʺ while monitoring for
sand, GOR and water.
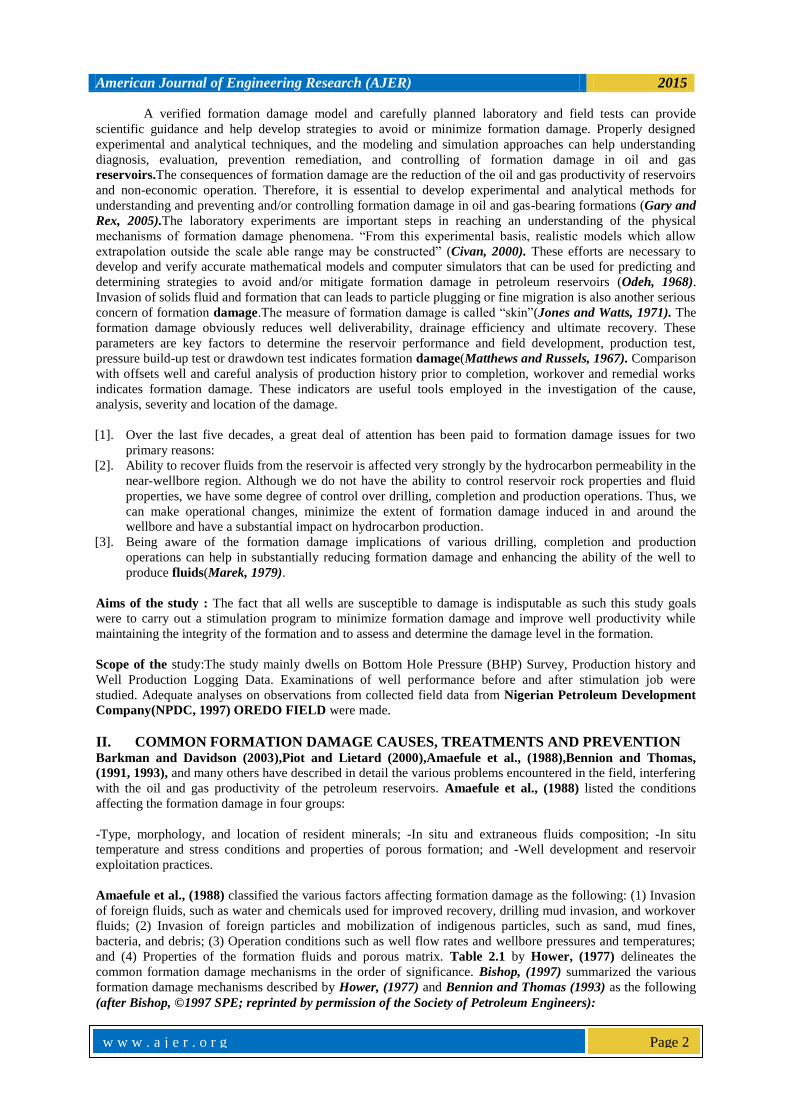
IV. RESULTS AND DISCUSSION Results
Table 4.1: Reservoir Data for WELL 4X
Description Unit Value
h Ft. 37.784
rw Ft. 0.362
K Md 1698
Ø % 18.7
Pd Psia 3587
Sand/reservoir name A8.2
T oF 185
J bbl/d/psi 0.854
GLR scf/bbl 139.2
Cf Psi-1 8.91 × 10⁻⁵
Sg 0.705
µO Cp 0.238
Sgw 1.100
Water salinity ppm 94712
A Acre-ft. 2010.4
Pr Psig 4377
Bo bbl/stb 1.805
Table 4.2: Completion Data for WELL 4X
Description Unit Value
Productivity casing size Inches 9 5/8
Casing weight lbs./ft. 58
Casing grade Types N-80
Casing depth Ft. 11347
Tubing size Inches 3 ½
Tubing weight lbs./ft. 9 1/2
Performance diameter Inches 1.12
Top packer size/type Inches 9 5/8 A5D Packer
Top packer depth Ft. 9588.40
Sand exclusion Types IGP
Flow at surface Types Tubular
Performance shot density SPF 12
Gravel pack length Ft. 30
Table 4.3: Production Report Data for WELL 4X before Stimulation
Date Size (Inch) THP (Psig) Gross
Production
(B/D)
BS & W (%) GOR (scf/bbl) Sand (ppt)
02/92 20 460 780 1 200 2
02/93 22 460 950 1 200 2
12/93 24 500 1300 2 250 4
03/94 36 360 2500 9 150 7
08/94 40 310 3200 16 150 9
02/95 44 280 3170 18 150 9
11/95 42 280 3080 22 180 8
04/96 42 290 3000 52 200 7
12/96 24 250 1750 23 300 4
05/97 36 150 850 10 175 2
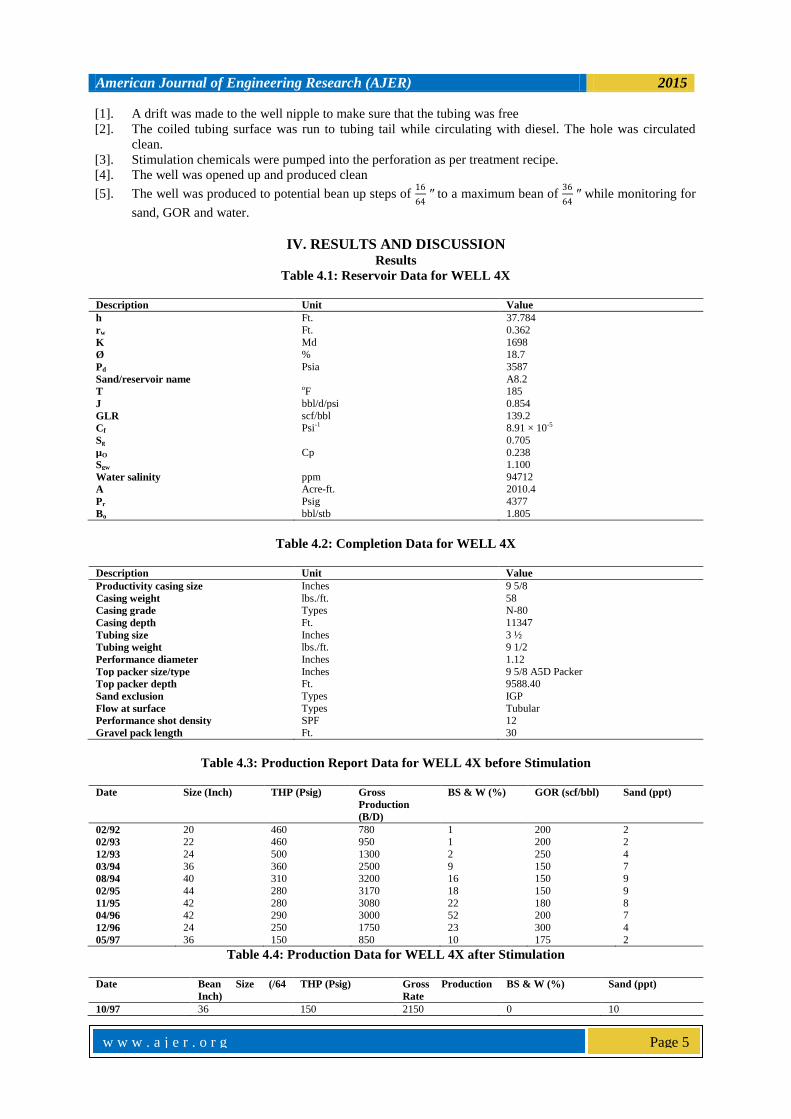
Table 4.4: Production Data for WELL 4X after Stimulation
Date Bean Size (/64
Inch)
THP (Psig) Gross Production
Rate
BS & W (%) Sand (ppt)
10/97 36 150 2150 0 10
American Journal of Engineering Research (AJER) 2015
w w w . a j e r . o r g
Page 6
02/98 40 180 2050 1 14
09/98 16 310 1900 2 12
02/99 20 280 1000 0 8
11/99 22 250 1000 1 10
04/00 28 200 920 0 16
12/00 32 200 900 0 12
04/01 36 190 800 0 10
11/01 36 160 700 2 14
03/20 36 170 600 1 18
11/02 36 150 550 1 22
Table 4.5: Production performance of offset wells completed on the same sand/formation
Wells Size (/64) THP (Psig) Gross
production rate
BS & W GOR (scf/stb) Sand (ppt)
9X 40 500 980 20 105 12
7X 22 100 1800 2 170 0
2X 48 200 3420 5 300 6
4X 36 180 650 5 280 4
Table 4.6: Pressure versus Time Readings for WELL 4X
Δt (hrs.) Pws (Psia) (tp + Δt)/Δt
0 2685 0
1 2763 721
2 2805 361
4 2819 181
5 2825 145
7 2828 104
9 2830 81
12 2831 61
20 2831 37
60 2837 13
120 2840 7
300 2842 3.4
420 2842 2.7
550 2842 2.3
620 2843 2.2
720 2843 2.0
Table 4.7: Stimulated BHP Data for WELL 4X
Data Unit Value
K Md 774
S 14.65
Sd 3.36
ΔPskin Psi 101.8
ΔPskin damage Psi 23.4
J Stb/d/psi 6.203
F.E % 37.2
DR 3
EDR 3.6
Transmissibility Md ft./cp 26093.2
ΔPskin perforation Psi 35.58
R – Factor 0.628
American Journal of Engineering Research (AJER) 2015
w w w . a j e r . o r g
Page 7
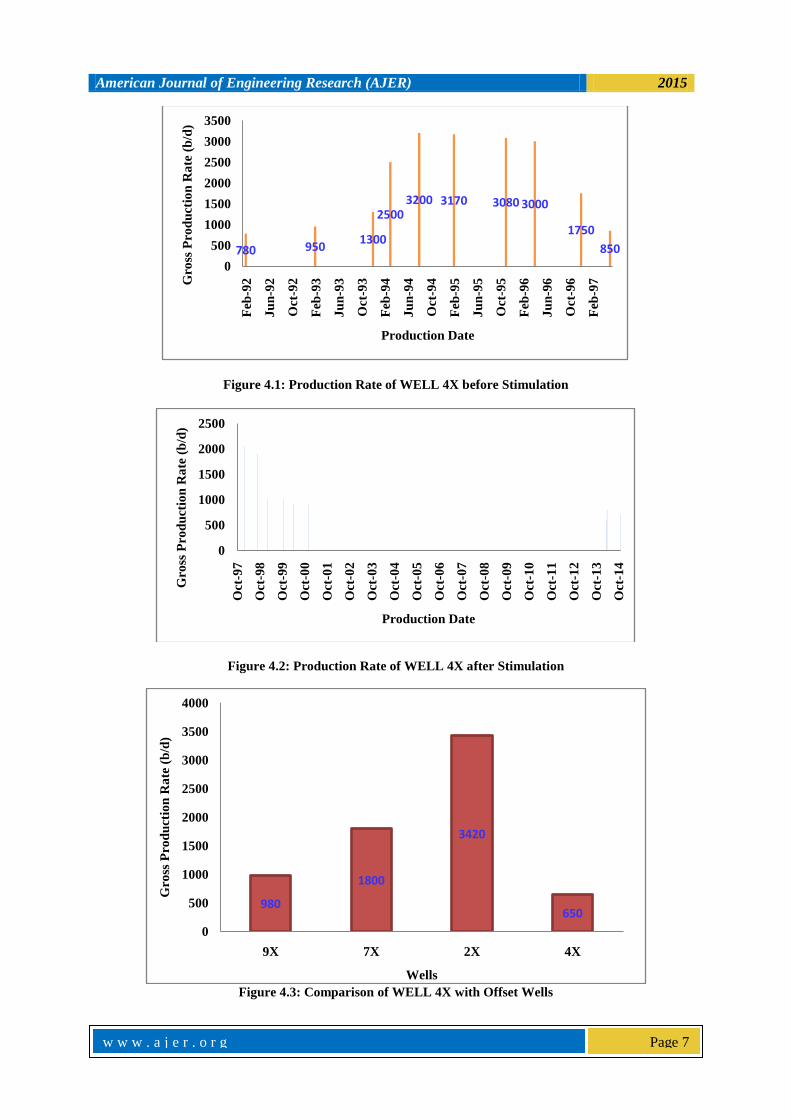
Figure 4.1: Production Rate of WELL 4X before Stimulation
Figure 4.2: Production Rate of WELL 4X after Stimulation
Figure 4.3: Comparison of WELL 4X with Offset Wells
780 9501300
25003200 3170 3080 3000
1750
850
0
500
1000
1500
2000
2500
3000
3500
Feb
-92
Ju
n-9
2
Oct
-92
Feb
-93
Ju
n-9
3
Oct
-93
Feb
-94
Ju
n-9
4
Oct
-94
Feb
-95
Ju
n-9
5
Oct
-95
Feb
-96
Ju
n-9
6
Oct
-96
Feb
-97G
ross
Pro
du
ctio
n R
ate
(b
/d)
Production Date
0
500
1000
1500
2000
2500
Oct
-97
Oct
-98
Oct
-99
Oct
-00
Oct
-01
Oct
-02
Oct
-03
Oct
-04
Oct
-05
Oct
-06
Oct
-07
Oct
-08
Oct
-09
Oct
-10
Oct
-11
Oct
-12
Oct
-13
Oct
-14
Gro
ss P
rod
uct
ion
Ra
te (
b/d
)
Production Date
980
1800
3420
650
0
500
1000
1500
2000
2500
3000
3500
4000
9X 7X 2X 4X
Gro
ss P
rod
uct
ion
Ra
te (
b/d
)
Wells
American Journal of Engineering Research (AJER) 2015
w w w . a j e r . o r g
Page 8
III. DISCUSSION OF RESULTS Analyses of Production Data of WELL 4X:Before stimulation (Table 4.3), the production rate was lower to
the production rate obtained after stimulation (Table 4.4) as were shown in Figures 3.1 and 3.2 respectively.
The appreciable increase in the production after the well has been treated shows that the treatment techniques
were very effective and efficient. The decline in production rate observed in the well was due to the increase in
water encroachment into the well and the reduction of tubing head pressure over the period.
Analyses based on comparison with offsets wells completed on the same sand/formation: Table 4.5 and
Figure 3.3 shows the recent production tests conducted on wells of the same block. It is observed that all the
wells are producing reasonably except WELL9X that seems to be declining. This does not in any way suggest
impairment as such decline may be as a result of reservoir sand permeability, completion configuration,
reservoir pressure or position of the well in the reservoir.
Pressures versus Time Evaluations of WELL 4X:The available data (Table 4.6) of the well BHP survey
taken in 1997 as presented in the well history and corresponding drop in pressure rates suggest that the well
interval is significantly impaired. The stimulation job in 1997 has little significance on the production rate.
Analyses of the BHP Data of WELL 4X:From Table 4.7, the high permeability shows the measure with which
the fluid can flow through the formation except that the interval around the wellbore has been significantly
damaged. The total skin of 14.65 indicates flow restriction, hence the presence of damage and reason for
stimulation programme to be initiated. The flow efficiency of about 40% indicates the flow capacity of the well.
The low rate of flow capacity shows that the well is producing far below its potential and the need for efficient
stimulation to be introduced. The damaged and estimated damaged ratio of average 3 shows that the well
deliverability should have been thrice its present production rate. The radius of investigation of 2441 ft. show
the radial distance from the well where the pressures have been significantly affected by the active well. The
high well transmissibility shows the well potentials and the measure of the reservoir rock to produce fluid.
Analyses of the Well Performance after Survey : The total skin value of 14.65 estimated from the BHP
survey show that the well is damaged with considerable percentage of pressure drop due to total skin of about
102 Psi (Table 4.7). After the stimulation job done by “Acid Foam Diversion Techniques”, the well produces
reasonably from 650 b/d with a choke performance of ʺ42/64ʺ and skin due to damage of 3.27 to 2150 b/d with
a bean size of ʺ42/64ʺ at a significant amount of THP and BS & W. The sudden and gradual decline of the
production rate in December 2002 to about 550 b/d was due to mechanical action on the well like production
logging tools and sand injection which causes formation damage. However, it is concluded that the treatment
method introduced in the well was very active and efficient.
IV. CONCLUSION AND RECOMMENDATIONS Conclusion :To make decision on the presence and/or degree of permeability alteration of a well, formation
damage valuation on wells are required to generate the necessary sets of information. Based on the analyses of
data conducted on WELL 4X, the following conclusion could be made:
(1). The improvement in the production rate suggests that the stimulation job initiated in the well was effective
and successful.
(2). The sharp decline of the production rate suggests mechanical action in the well which may be from
production logging tools.
(3). The gradual decline of the amount of production in the well suggests the need to carry out sand control
programme.
Recommendations :The following recommendations become vital based on the conclusion deduced from
WELL 4X. (1). Investigation on the sharp decline in production rate as a result of mechanical problem should be further
carried out to ascertain the cause and also to checkmate it.
(2). Reservoir conditions are prone to alterations and as such continuous production data update before
carrying out any treatment job should be done to avoid any likely failure.
(3). Intensive efforts should be consciously directed to formation damage preventive measures from drilling to
production, well completion to workover activities. It is important that mandatory tests be run with all the
chemicals and mixtures that are to be used on the job and the WELL 4X sand should be reconsolidated.
American Journal of Engineering Research (AJER) 2015
w w w . a j e r . o r g
Page 9
NOMENCLATURE
∅ Porosity
A Cross sectional area
BHP Bottom Hole Pressure
Bo Oil formation volume factor
BOPD Barrel Oil per day
BS & W Base Sediment and Water
Ct Total compressibility factor
DR Damage ratio
F.E Flow efficiency
GOR Gas-Oil Ratio
ɣw Wellbore radius
h total reservoir thickness
hp height of perforation
ht Height of interval
IGP Internal Gravel Packing
J Productivity index
K Permeability
Ka Average permeability
Kh Horizontal permeability
Kv Vertical permeability
m Horner’s plot slope
P*
Reservoir pressure
P1hr Extrapolated pressure
ppt Part per thousand
Pwf Flowing well pressure
Pws Static well pressure
Qo Oil production rate
ra Effective wellbore radius
re damage radius
S Skin factor
Sd Skin due to formation damage
Sg Gas saturation
So Oil saturation
Sp Skin due to incomplete perforation
Sw Water saturation
tp Flow period before BHP Tests
ΔP Pressure change
ΔPskin damage Pressure drop due to damage skin
ΔPskin Pressure drop due to skin
Δt Change in tine
𝜇o Oil viscosity
EDR Estimated damage ratio
R – Factor Radius of investigation
ΔPskin perforation Pressure drop due to incomplete perforation skin damage
NPDC Nigerian Petroleum Development Company
REFERENCES [1]. Amaefule J. O., Kersey, D. G., Norman, D. K. and Shannon, P. M. (1988). “Advances in Formation Damage Assessment and
Control Strategies” Petroleum Society of Canadian Institute of Mining, Metallurgy and Petroleum, pp. 23-32 [2]. Barkman, T. A., and Davidson, O. T. (2003). 30 years of Predicting Injectivity after Barkman and Davidson: Where are we
today? SPE European Formation Damage Conference, 13th-14th May, 2003, The Hague, Netherlands. SPE-82231-MS.
http://dx.doi.org/10.2118/82231-MS. [3]. Beadie, G. (1995). “Well Productivity Awareness School (WPAS)” Paper SPE-30131, Presented at the SPE European Formation
Damage Conference, The Hague, Netherlands, May 15th-16th, 1995.
[4]. Bennion, D. B., and Thomas, F. B. (1991). Mechanism of Induced Formation Damage. Petroleum. Hycal Energy, Vol. 3, pp. 113-135
[5]. Bennion, D. B., and Thomas, F. B. (1993). Formation Damage in Horizontal Wells during Overbalanced and Underbalanced
Drilling. Canadian Institute of Mining, Metallurgy, and Petroleum. Vol. 6, pp. 34-37 [6]. Bennion, D. B., and Thomas, F. B. (1999). Classification and Order of Common Formation Damage Mechanisms (Modified after
Bennion, © 1999; reprinted by permission of the Canadian Institute of Mining, Metallurgy, and Petroleum. Vol. 9, pp. 121-126.

American Journal of Engineering Research (AJER) 2015
w w w . a j e r . o r g
Page 10
[7]. Bishop, A. H. (1997). The Influence of Individual Clay Minerals on Formation Damage of Reservoir Sandstones. The
Mineralogical Society, Geoscience World, Vol. 10, pp.39-44 [8]. Civan, F. (2000). “Reservoir Formation Damage: Fundamentals, Modeling, Assessment and Mitigation. 2nd Ed., Gulf Publishing
Company, Houston, Texas.
[9]. Civan, F. (2005). “Formation Damage Control and Remediation: Conventional Techniques and Remediation Treatments for Common Problems. 3rd Ed., Gulf Publishing Company, Houston, Texas.
[10]. Dake, L. P. (1978). Fundamentals of Reservoir Engineering, New York City: Elsevier Scientific Publishing Company, pp. 112 –
145. [11]. Gray, D. H., and Rex, R. W. (2005). Evaluation of Formation Damage in Sandstones caused by Clay Dispersion and Mitigation.
Journal of Clay Mineral Society, Vol. 4, pp. 56-61
[12]. Hower, W. F. (1977). “Prevention and Control of Formation Damage”. Halliburton Services Conference, Oklahoma City, SPE24317, pp. 65 -69.
[13]. Jones, L. G., and Watts, J. W. (1971). Estimating Skin Effect in a Partially Completed Damaged Well. Journal of Petroleum
Technology, 23(2): 249-252. SPE-2616-PA. http://dx.doi.org/10.2118/2616-PA. [14]. Leontaritis, K. J., Amaefule, J. O., and Charles, R.E. (1994). “Systematic Approach for the Prevention and Treatment of
Formation Damage” SPE Production and Facilities Conference, 8th – 10th, August 1994, SPE 32144, pp. 89 – 93.
[15]. Marek, B. F. (1979). Permeability Loss in Depletion of Reservoirs, Presented at the SPE Annual Technical Conference and Exhibition, Las Vegas, Nevada, 23rd – 26th September, 1979. SPE-8433-MS. http://dx.doi.org/10.2118/8433-MS.
[16]. Matthews, C. S., and Russel, D. G. (1976). Pressure Build up and Flow Tests in Wells, 1, 110 Richardson, Texas: Monograph
Series, SPE766645, pp. 45 -52. [17]. NPDC, (1997).Data of WELL 4X in OREDO FIELD were collected from Nigerian Petroleum Development Company.
[18]. Odeh, A. S. (1968). “Steady State Flow Capacity of Wells with limited entry to flow”. Journal of Petroleum Technology 8(1): 43–
51. SP– 179 –PA. http://dx.doi.org/10.2118/1797-PA. [19]. Piot, B. M., and Lietard, D. M. (2000). “Formation Damage Origin, Diagnosis and Treatment Strategy”. Reservoir Stimulation
Book, 3rd. Ed., Chapter 14, John Wiley & Sons, Ltd.


![Il libro a stampa, le istituzioni e la cultura editoriale in epoca Edo (1600-1868) [Printed books, institutions and publishing in the Edo period (1600-1868)]](https://static.fdokumen.com/doc/165x107/6321e51464690856e108e8fd/il-libro-a-stampa-le-istituzioni-e-la-cultura-editoriale-in-epoca-edo-1600-1868.jpg)
![Sangakus. Àlgebra i Geometria al Japó de l'època EDO [1600-1868]](https://static.fdokumen.com/doc/165x107/631386da3ed465f0570ab787/sangakus-algebra-i-geometria-al-japo-de-lepoca-edo-1600-1868.jpg)

![Die soziale Konstruktion des japanischen Reisemarktes in der Edo-Zeit [The Social Construction of the Japanese Travel Market during the Edo-Period]](https://static.fdokumen.com/doc/165x107/6315890585333559270d2c75/die-soziale-konstruktion-des-japanischen-reisemarktes-in-der-edo-zeit-the-social.jpg)