Evaluation of different marker sets for motion artifact reduction in breast dynamic infrared imaging
14
1 Authors’ version. Published in: IEEE TRANSACTIONS ON BIOMEDICAL ENGINEERING, VOL. 56, NO. 3, MARCH 2009 Digital Object Identifier : 10.1109/TBME.2008.2005584 Valentina Agostini 1 , Marco Knaflitz 1 , Member, IEEE, Filippo Molinari 1 , Member, IEEE 1 Dip. Elettronica, Politecnico di Torino, Corso Duca degli Abruzzi 24, 10129 Torino, Italy Motion artifact reduction in breast dynamic infrared imaging Abstract — Dynamic infrared imaging is a promising technique in breast oncology. In this study a QWIP infrared camera is used to acquire a sequence of consecutive thermal images of the patient’s breast for 10 s. Information on the local blood perfusion is obtained from the spectral analysis of the time series at each image pixel. Due to respiratory and motion artifacts, the direct comparison of the temperature values that a pixel assumes along the sequence becomes difficult. In fact, the small temperature changes due to blood perfusion, of the order of 10-50 mK, which constitute the signal of interest in the time domain, are superimposed onto large temperature fluctuations due to the subject’s motion, which represent noise. To improve the time series signal-to-noise ratio, and, as a consequence, enhance the specificity and sensitivity of the dynamic infrared examination, it is important to realign the thermal images of the acquisition sequence thus reducing motion artifacts. In a previous study we demonstrated that a registration algorithm based on fiducial points is suitable to both clinical applications and research, when associated with a proper set of skin markers. In this paper, we quantitatively evaluate the performance of different marker sets by means of a model that allows for estimating the signal-to-noise ratio increment due to registration, and we conclude that a
Transcript of Evaluation of different marker sets for motion artifact reduction in breast dynamic infrared imaging

1
Authors’ version.
Published in:
IEEE TRANSACTIONS ON BIOMEDICAL ENGINEERING, VOL. 56, NO. 3, MARCH 2009
Digital Object Identifier : 10.1109/TBME.2008.2005584
Valentina Agostini1, Marco Knaflitz1, Member, IEEE, Filippo Molinari1, Member, IEEE
1Dip. Elettronica, Politecnico di Torino, Corso Duca degli Abruzzi 24, 10129 Torino, Italy
Motion artifact reduction in breast dynamic infrared imaging
Abstract — Dynamic infrared imaging is a promising technique in breast oncology. In this study a
QWIP infrared camera is used to acquire a sequence of consecutive thermal images of the patient’s breast
for 10 s. Information on the local blood perfusion is obtained from the spectral analysis of the time series
at each image pixel. Due to respiratory and motion artifacts, the direct comparison of the temperature
values that a pixel assumes along the sequence becomes difficult. In fact, the small temperature changes
due to blood perfusion, of the order of 10-50 mK, which constitute the signal of interest in the time
domain, are superimposed onto large temperature fluctuations due to the subject’s motion, which
represent noise. To improve the time series signal-to-noise ratio, and, as a consequence, enhance the
specificity and sensitivity of the dynamic infrared examination, it is important to realign the thermal
images of the acquisition sequence thus reducing motion artifacts. In a previous study we demonstrated
that a registration algorithm based on fiducial points is suitable to both clinical applications and research,
when associated with a proper set of skin markers.
In this paper, we quantitatively evaluate the performance of different marker sets by means of a model
that allows for estimating the signal-to-noise ratio increment due to registration, and we conclude that a

2
12-marker set is a good compromise between motion artifact reduction and the time required to prepare
the patient.
Index Terms— Breast cancer detection, dynamic infrared imaging, image registration, signal-to-noise
ratio estimation, skin markers, thermal image sequence.
I. INTRODUCTION
Dynamic Area Telethermometry (DAT) has been proposed as a new imaging modality for improving
breast cancer diagnosis [1-3] and for assessing the response to systemic therapy [4]. DAT is harmless,
noninvasive, and does not expose the subject to ionizing radiations. It allows observing skin temperature
fluctuations in the range of a few tens of millikelvin, which reportedly are influenced by spatial and
temporal abnormalities in blood perfusion of the observed tissues. These abnormalities are due to
presence of cancer-associated extra-vascular nitric oxide [1-2], to the specific characteristics of the
vasculature supplying blood to the tumor and to the altered metabolism of cancerous tissue. Thermal
image sequences are generally acquired by using last generation high resolution infrared thermographs
[5].
DAT examination requires the acquisition of a sequence of consecutive thermal images with a rate
ranging from 50 frames/s up to 200 frames/s, during an observation window lasting a few tens of seconds.
Clinical information is obtained by analyzing in the frequency domain the small temperature fluctuations
taking place in numerous breast areas constituted by a few pixels, rather than considering the classical
static, color-coded bitmap of the skin temperature, namely the thermogram, which is often difficult to
interpret [6].
During the acquisition of the infrared sequence, the patient’s breast moves non-rigidly due to
physiological (breathing, heart activity, …) and random movements. These movements, associated with

3
the thermal gradients of the observed skin surface, generate artifactual fluctuations of the local
temperature that, in turn, act as noise superimposed onto the temperature fluctuations to be studied.
Therefore, before proceeding with the harmonic analysis, it is fundamental to geometrically realign
all the thermograms constituting the sequence with respect to a reference one. This registration procedure
allows attenuating the motion artifacts by reducing local movements to fractions of a pixel, and,
consequently, it allows improving the signal-to-noise ratio of the signals to be processed [7].
Registration procedures may be classified either as marker-based or marker-less [8].
Marker-less procedures require that images have sharp features, which can allow for segmentation
and landmark identification. Unfortunately, marker-less procedures are challenging tasks in human
thermograms [9-10], due to the absence of sharp and well-contrasted natural features and to the presence
of intensity changes between images belonging to the dynamic sequence.
Previous experience showed that marker-based registration procedures are preferable in this
application for the specific characteristics of breast infrared images. The number of markers, the ease of
positioning, and the positioning repeatability are crucial characteristics of a marker set suitable for clinical
use. Moreover, the marker set must warrantee a sufficient attenuation of motion artifacts after registration
and, correspondingly, a sufficient increment of the signal-to-noise ratio.
This paper shows that a set consisting of 12 markers gives results similar to those obtained by using
18 markers, while by reducing the number of markers to 7 or less the effectiveness of the registration
procedure is significantly compromised in terms of increment of the signal-to-noise ratio.
II. MATERIALS AND METHODS
A. Data acquisition
The infrared image sequences were acquired with an AIM256Q camera (Long Wave Quantum Well
Infrared Photodetector, produced by AEG Infrarot-Module GmbH) having a NETD equal to 17.3 mK at
300 K, with an integration time equal to 20 ms. The acquisition time was equal to 10 s and the frame rate

4
was 50 frames/s. Hence, each sequence consisted of 500 thermal images with a dynamic range of 14 bit.
The field-of-view was 38 cm × 38 cm, with a matrix of 256×256 pixels and hence a pixel size of
approximately 1.5 mm. A two-point calibration of the infrared camera was performed before each
acquisition.
Twenty healthy women, with age ranging from 22 to 72 years and breast size ranging from cup A to
cup DD, were enrolled in this study. The preparation of the patient and the exam were carried out
following the indications of the protocol approved by the ethical committee of Ospedale Molinette di
Torino (Italy). Patients were asked to lie down onto an examination table with a backrest inclination of 40
degrees with respect to the horizontal plane. They were also asked to raise their arms with the hands
resting over their head.
We acquired a frontal view of the subjects comprehending both breasts. The optical axis of the infrared
camera was perpendicular to the backrest of the examination table. The distance between the infrared
camera and the sternum of the patients was approximately 2.2 m, while the relative height of the infrared
camera with respect to the sternum of the patients was approximately 1.7 m.
B. Marker sets
Before image sequence acquisition, we glued on the skin of the patients, by means of biocompatible
gel, a set of wooden spherical markers (5 mm in diameter) consisting of: a) 18 light-colored markers, used
to obtain “fiducial points”, i.e., contrasted features for registration; b) 9 dark markers, used as “test
points” that do not belong to the registration set, to evaluate the goodness of the registration itself. An
example of marker positioning is reported in figure 1a.
Registration was performed using five different sets of fiducial markers, consisting of 18, 12, 9, 7, 5
markers respectively. The test marker set did not change in the five trials considered.
Figure 1 shows the marker sets. The steps followed for positioning the 9-marker set (Fig. 1c) are
described below:

5
I. identify the jugular notch and the infrasternal angle. On the line connecting them, locate point A
at 1/3 and point B at 2/3 from the jugular notch, respectively. Apply a marker in B (marker 1);
II. apply a marker on each breast, at the intersection between the medioclavicular line and the
transverse axis passing through A (markers 2 and 3);
III. apply a marker on each breast in a lateral position, along the transverse axis passing trough B
(marker 4 and 5);
IV. apply a marker at the inferior border of each breast (marker 6 and 7) along the medioclavicular
line;
V. apply a marker on each breast in a central position (markers 8 and 9), at the intersection between
lines connecting markers 1-4 and 2-6 on the right breast and lines connecting markers 1-5 and 3-7
on the left breast.
Test (dark) markers are added midway between the central and the outer markers. An additional test
marker is placed on the sternum on point A.
The sets with 12 markers and 18 markers are obtained from the 9-marker set by adding a marker on the
sternum, midway between A and B, and adjunctive markers on the breast contour, as shown in Fig. 1b
and Fig. 1a respectively.
The set with 7 markers is obtained again from the 9-marker set, by removing the central markers (see
Fig. 1d). Finally, the lateral markers are removed to obtain the 5 marker-set (see Fig. 1e).
C. Realignment of thermograms: the registration algorithm
To compensate movement artifacts we realign the thermograms of the infrared sequences with respect
to the first frame, chosen as reference. The first step in any feature-based registration algorithm [8] is the
correct detection of the fiducial points used to compute the geometrical mapping and, if needed, of test
points used for the evaluation of the registration procedure.
We implemented an algorithm for the localization of the fiducial and test points which segments the

6
markers in each frame, calculates the centroid of each marker and labels it. After fiducial point
localization, the second step is the choice of a suitable transformation for the geometrical matching of the
thermograms of the sequence. We chose a piece-wise linear transformation based on the Delaunay
triangulation [11] of the selected fiducial points, as it is reported to give good results when small
geometric differences between the images to be registered are expected [12], as in this case. Figure 2
shows an example of the triangulation used.
D. Registration evaluation: estimation of the signal-to-noise ratio improvement
After the thermograms of the sequence have been realigned by means of the described algorithm, it is
important to evaluate the performance of the algorithm itself. Usually, in the literature describing marker-
based image registration approaches, this evaluation is provided estimating the alignment error [8], i.e. the
test points residual mismatch among the reference frame and the realigned frames [13].
However, in the analysis of biomedical infrared image sequences, the simple consideration of this
alignment error is not satisfactory. In fact, it does not provide quantitative information on the quality of
the temperature variations vs. time signals related to a certain skin portion. To overcome this problem, we
introduced a model [7] that allows a quantitative estimation of the signal-to-noise ratio increase after the
thermal images of the sequence have been realigned. Considering a small portion of skin and indicating
by T(x,y,t) the temperature that the infrared sensor measures in the point (x,y) at a given time instant t,
temperature variations in time captured by the infrared camera are a combination of the physiological
variations of the skin temperature (the signal of interest) and of apparent temperature changes actually
due to patient’s movements (noise).
The total derivative of temperature with respect to time, dT/dt, is:
,)( TvtT
ty
yT
tx
xT
tT
dtdT
∇⋅+∂∂
=∂∂
∂∂
+∂∂
∂∂
+∂∂
=
(1)

7
where v =(vx, vy ) is the 2-dimensional velocity of the skin portion and T∇ is the spatial temperature
gradient. Equation 2 reports the expression of the noise ),,( tyxN introduced by motion artifacts.
'),,(),,(),,(0
'' dttyxTtyxvtyxNt
∫ ∇⋅≈
(2)
The signal-to-noise ratio of the process - at each point (x,y) - is defined as
1),(/),(/ 22 −≡ yxyxNS NT σσ , where 2Tσ (x,y) is the variance of the measured temperature time series
T(x,y,t) (signal plus noise) and ),(2 yxNσ is the variance of the noise, as given by Eq. (1). Similarly, we
define the signal-to-noise ratio after registration as 1),(/),()/( 22 −≡ yxyxNSRR NTR σσ , where
),(2 yxRTσ is the variance of the measured temperature time series TR(x,y,t) obtained after sequence
realignment and ),(2 yxRNσ is the variance of the term ')',,()',,(
0
dttyxTtyxvt
RR∫ ∇⋅
, being
),,( tyxvR
the residual velocity, not compensated by the registration algorithm.
E. Data processing
For each subject we realigned the thermal images of the sequence using the five markers sets described
above. We calculated the instantaneous velocity of test points before and after registration. We obtained
the instantaneous velocity at each pixel using a nearest neighbor interpolation scheme [7]. Using Eq. 1,
we estimated the signal-to-noise ratio increment due to registration for each of the five different sets of
fiducial markers, at each image pixel. Finally, we calculated the mean of the signal-to-noise ratio
increment over the entire breast (markers excluded), for each trial. We demonstrated that the signal-to-
noise ratio is estimated with an uncertainty of 0.25 dB [7].

8
III. RESULTS AND DISCUSSION
The time required to prepare the patients varies approximately from 5 minutes for the 5-marker set to
15 minutes for the 18-marker set. Since our objective was to compare the performance of the different
marker sets, in the following we report the increment of the signal-to-noise ratio after the registration, (i.e.
the signal-to-noise ratio of the registered sequence minus the signal-to-noise ratio of the raw sequence).
To have a measure of the quality of the realigned sequence, only its signal-to-noise ratio is to be
considered.
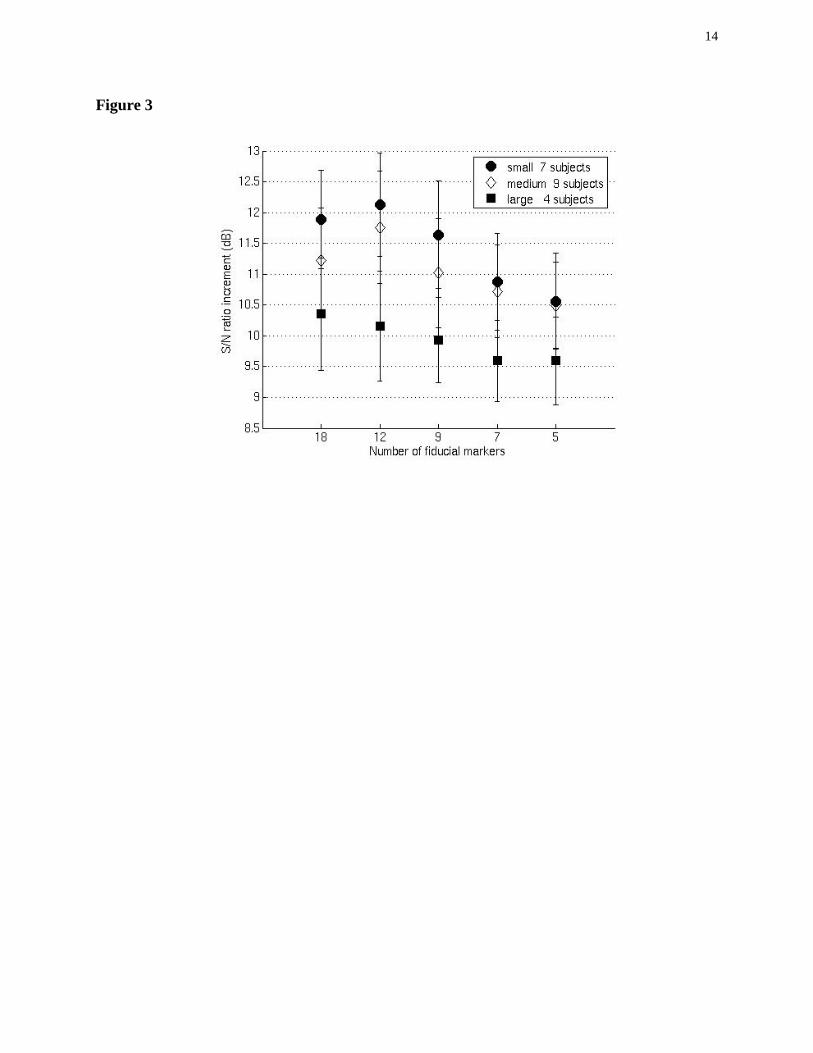
Figure 3 shows the signal-to-noise ratio increment after registration with the 18, 12, 9, 7 and 5 marker
sets. The twenty-subject sample population was divided among small, medium, and large breast size
subjects, basing the classification on the chest measure and cup size.
In all cases there is a decrease of the performance of the registration algorithm using a smaller number
of fiducial markers (2dB in the worst case). The small and medium breast size samples show similar
trends: the S/N improvement after registration increases using more markers, up to the 12-marker set.
Then, there is no further improvement using the 18-marker set. The large breast size sample shows a
slightly different trend and lower S/N increments for all marker sets.
These results demonstrate that 18, 12 or 9 marker sets give a very similar increment of the signal-to-
noise ratio, while 5- and 7-marker sets are clearly less effective.
This is confirmed by pair-wise, one-tail, Student’s t-test applied to the twenty-subject sample: the 12-
marker set does not give results statistically different from those obtained by the 18-marker set (p-value >
0.15). Performances of the 9-marker set are slightly worse than those of the 12-marker set (p = 0.002),
while the 7-marker and 5-marker sets performances are significantly different from those of the 12-
marker set (p < 0.0001).
IV. CONCLUSION
We compared the performance of five different marker sets used to obtain motion artifact reduction and

9
signal-to-noise ratio improvement of infrared thermal sequences to be used in early breast cancer
detection and follow-up. We demonstrated that a set consisting of 12 markers gives results that are
statistically equivalent to those given by the 18-marker set. Further reducing the number of markers to 7
or 5 causes a statistically significant reduction of the signal-to-noise ratio improvement.
In conclusion, we believe that the 9-marker and 12-marker sets herein described are a good
compromise between simplicity and the need for an effective motion artifact reduction in the clinical
practice as well as in research.
ACKNOWLEDGMENT
This work was supported by the Fondazione CRT (Torino, Italy) in the research framework of the
Clinical Industrial Research Park Foundation (Torino, Italy).
REFERENCES
[1] M. Anbar, L. Milescu, A. Naumov, C. Brown, T. Button, C. Carty and K. AlDulaimi, “Detection of
Cancerous Breasts by Dynamic Area Telethermometry”, IEEE Eng. Med. Biol., vol. 20, pp. 80–91,
Sept./Oct. 2001.
[2] M. Anbar, C. Brown, L. Milescu, L. Babalola and L. Gentner, “The potential of dynamic area
telethermometry in assessing breast cancer”, IEEE Eng. Med. Biol., vol. 19, pp. 58–62, Mar./Apr.
2000.
[3] T. M. Button, H.. Li, P. Fisher, R. Rosenblatt, K. Dulaimy, S. Li, B. O’Hea, M. Salvitti, V. Geronimo,
C. Geronimo, S. Jambawalikar, P. Carvelli and R. Weiss, “Dynamic infrared imaging for the
detection of malignancy”, Phys. Med. Biol., vol. 49, pp. 3105–3116, Jul. 2004.
[4] S. R. Fanning, S. Short, K. Coleman, S. Andresen, G. T. Budd, H. Moore, A. Rim, J. Crowe and D. E.
Weng, “Correlation of dynamic infrared imaging with radiologic and pathologic response for patients

10
treated with primary systemic therapy for locally advanced breast cancer”, Journal of Clinical
Oncology, 2006 ASCO Ann. Meeting Proc. (Post-Meeting Edition), vol 24, no. 18S.
[5] M. A. Fauci, R. Breiter, W. Cabanski, W. Fick, R. Koch, J. Ziegler, and S. D. Gunapala, “Medical
Infrared Imaging – differentiating facts from fiction, and the impact of high precision quantum well
infrared photodetector camera systems, and other factors, in its re-emergence”, Infrared Phys. And
Tech., vol. 42, pp. 337–344, Jun. 2001.
[6] K. R. Foster, “Thermographic detection of breast cancer”, IEEE Eng. Med. Biol., vol. 17, pp. 10–14,
Nov./Dec. 1998.
[7] V. Agostini, S. Delsanto, F. Molinari, M. Knaflitz, “Noise estimation in infrared image sequences: a
tool for the quantitative evaluation of the effectiveness of registration algorithms”, IEEE Trans.
Biomed. Eng., to be published.
[8] B. Zitova and J. Flusser, “Image Registration Methods: a Survey”, Image and Vision Computing, vol.
21, pp. 977–1000, Oct. 2003.
[9] C. L. Herry, “Segmentation and Landmark Identification in Infrared Images of the Human Body”, in
Proc. 28th IEEE EMBS Ann. Int. Conf., New York, USA, 2006, pp. 957–960.
[10] N. Scales, C. Herry, M. Frize, “Automated Image Segmentation for Breast Analysis Using
Infrared Images”, in Proc. 26th IEEE EMBS Ann. Int. Conf., San Francisco, CA, USA, 2004, pp.
17371740.
[11] A. Goshtasby, “Piecewise linear mapping functions for image registration”, Pattern Recognition,
vol. 19, pp. 459–466, 1986.
[12] L. Zagorchev, and A. Goshtashby, “A Comparative Study of Transformation Functions for
Nonrigid Image Registration”, IEEE Trans. Image Proc., vol. 15, no. 3, pp. 529–538, 2006.
[13] V. Agostini, S. Delsanto, F. Molinari, M. Knaflitz, “Evaluation of feature-based registration in
dynamic infrared imaging for breast cancer diagnosis”, in Proc. 28th IEEE EMBS Ann. Int. Conf.,
New York, USA, 2006, pp. 953–956.

11
Figure captions
Figure 1.
The five different skin marker sets used for registration. From top to bottom: (a) 18-marker set; (b)12-
marker set; (c) 9-marker set and its construction; (d) 7-marker set; (e) 5-marker set. Light-colored markers
are fiducial markers, while dark-colored ones are test markers.
Figure 2.
Single thermal frame extracted from the infrared sequence of the subject shown in Figure 1: Delaunay
triangulation is shown superimposed for the 9-marker set.
Figure 3.
Increment of the signal-to-noise ratio due to registration respectively with 18, 12, 9, 7 and 5 markers
(mean ± 1 standard error).

12
Figure 1

13
Figure 2
25 26 27 28 29 30 31 32 33 34°C
14
Figure 3